Crow Agency, MT Map & Demographics
Crow Agency Map
Crow Agency Overview
$9,914
PER CAPITA INCOME
$37,981
AVG FAMILY INCOME
$32,721
AVG HOUSEHOLD INCOME
8.1%
WAGE / INCOME GAP [ % ]
91.9¢/ $1
WAGE / INCOME GAP [ $ ]
$15,428
FAMILY INCOME DEFICIT
0.42
INEQUALITY / GINI INDEX
1,965
TOTAL POPULATION
976
MALE POPULATION
989
FEMALE POPULATION
98.69
MALES / 100 FEMALES
101.33
FEMALES / 100 MALES
25.6
MEDIAN AGE
5.7
AVG FAMILY SIZE
4.6
AVG HOUSEHOLD SIZE
602
LABOR FORCE [ PEOPLE ]
46.7%
PERCENT IN LABOR FORCE
41.8%
UNEMPLOYMENT RATE
Crow Agency Zip Codes
Crow Agency Area Codes
Income in Crow Agency
Income Overview in Crow Agency
Per Capita Income in Crow Agency is $9,914, while median incomes of families and households are $37,981 and $32,721 respectively.
| Characteristic | Number | Measure |
| Per Capita Income | 1,965 | $9,914 |
| Median Family Income | 308 | $37,981 |
| Mean Family Income | 308 | $41,995 |
| Median Household Income | 423 | $32,721 |
| Mean Household Income | 423 | $39,838 |
| Income Deficit | 308 | $15,428 |
| Wage / Income Gap (%) | 1,965 | 8.11% |
| Wage / Income Gap ($) | 1,965 | 91.89¢ per $1 |
| Gini / Inequality Index | 1,965 | 0.42 |
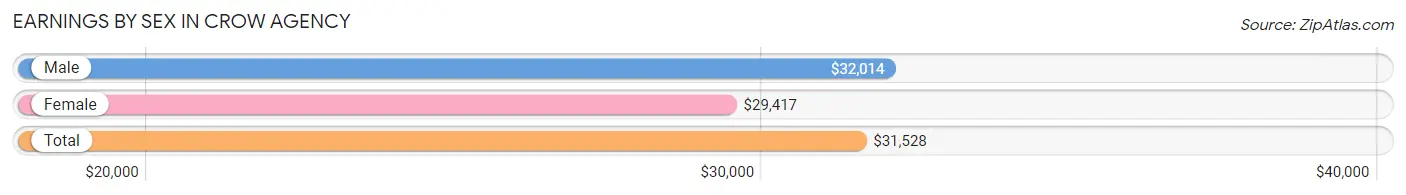
Earnings by Sex in Crow Agency
Average Earnings in Crow Agency are $31,528, $32,014 for men and $29,417 for women, a difference of 8.1%.
| Sex | Number | Average Earnings |
| Male | 239 (65.3%) | $32,014 |
| Female | 127 (34.7%) | $29,417 |
| Total | 366 (100.0%) | $31,528 |
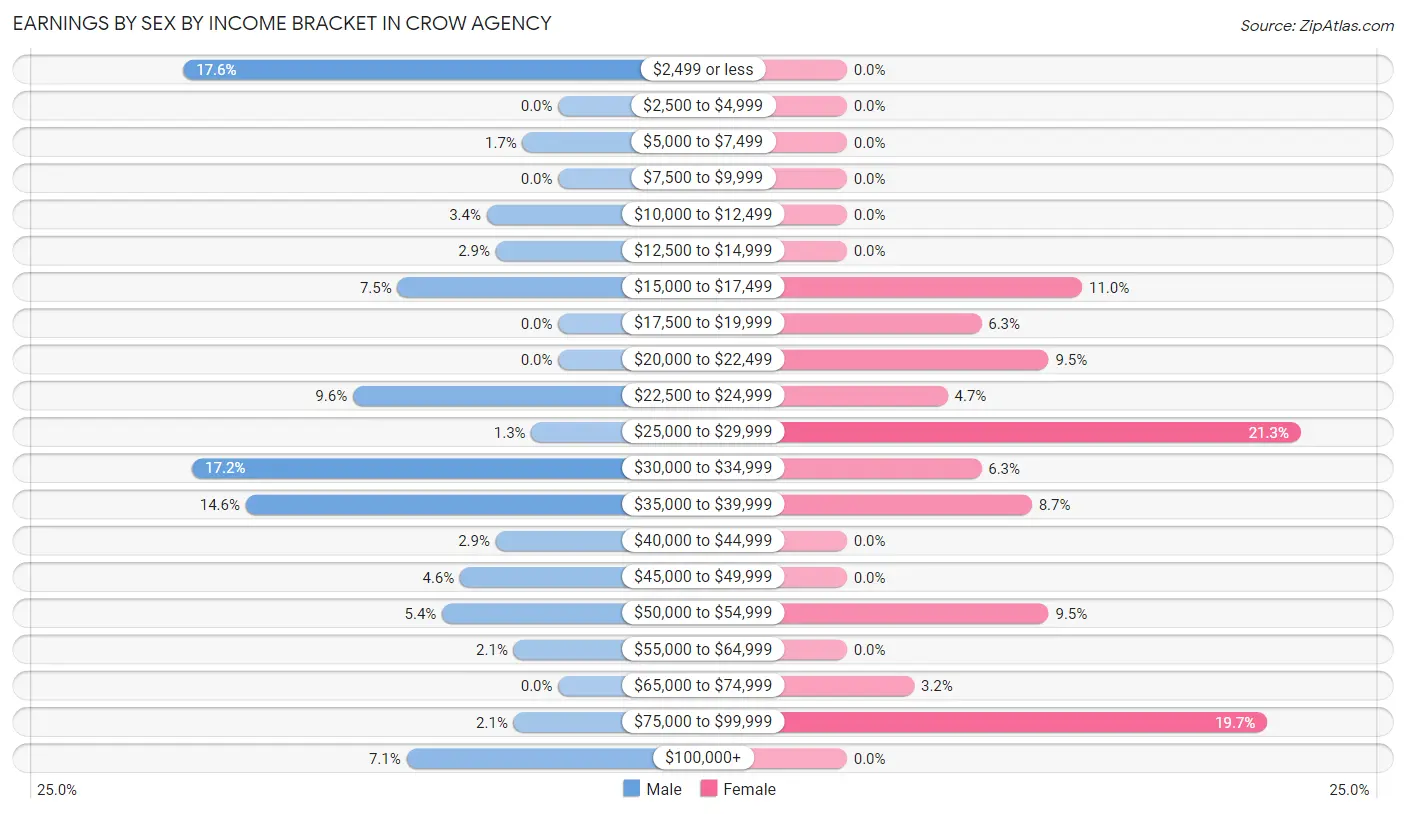
Earnings by Sex by Income Bracket in Crow Agency
The most common earnings brackets in Crow Agency are $2,499 or less for men (42 | 17.6%) and $25,000 to $29,999 for women (27 | 21.3%).
| Income | Male | Female |
| $2,499 or less | 42 (17.6%) | 0 (0.0%) |
| $2,500 to $4,999 | 0 (0.0%) | 0 (0.0%) |
| $5,000 to $7,499 | 4 (1.7%) | 0 (0.0%) |
| $7,500 to $9,999 | 0 (0.0%) | 0 (0.0%) |
| $10,000 to $12,499 | 8 (3.4%) | 0 (0.0%) |
| $12,500 to $14,999 | 7 (2.9%) | 0 (0.0%) |
| $15,000 to $17,499 | 18 (7.5%) | 14 (11.0%) |
| $17,500 to $19,999 | 0 (0.0%) | 8 (6.3%) |
| $20,000 to $22,499 | 0 (0.0%) | 12 (9.5%) |
| $22,500 to $24,999 | 23 (9.6%) | 6 (4.7%) |
| $25,000 to $29,999 | 3 (1.3%) | 27 (21.3%) |
| $30,000 to $34,999 | 41 (17.2%) | 8 (6.3%) |
| $35,000 to $39,999 | 35 (14.6%) | 11 (8.7%) |
| $40,000 to $44,999 | 7 (2.9%) | 0 (0.0%) |
| $45,000 to $49,999 | 11 (4.6%) | 0 (0.0%) |
| $50,000 to $54,999 | 13 (5.4%) | 12 (9.5%) |
| $55,000 to $64,999 | 5 (2.1%) | 0 (0.0%) |
| $65,000 to $74,999 | 0 (0.0%) | 4 (3.2%) |
| $75,000 to $99,999 | 5 (2.1%) | 25 (19.7%) |
| $100,000+ | 17 (7.1%) | 0 (0.0%) |
| Total | 239 (100.0%) | 127 (100.0%) |
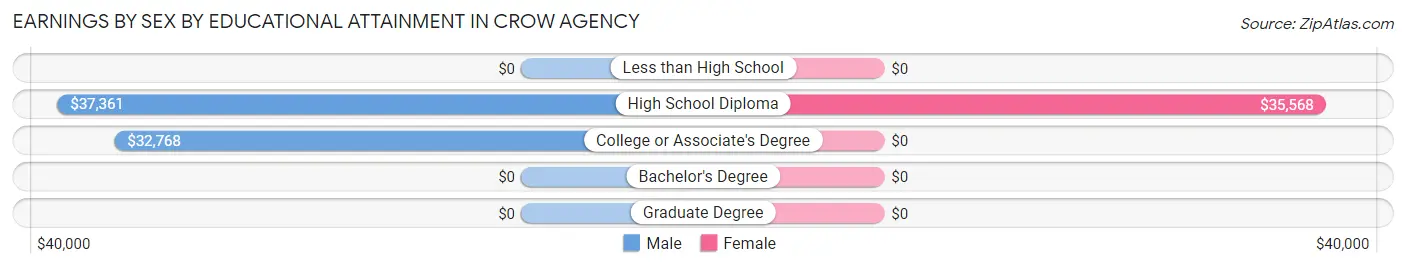
Earnings by Sex by Educational Attainment in Crow Agency
Average earnings in Crow Agency are $33,696 for men and $34,844 for women, a difference of 3.3%. Men with an educational attainment of high school diploma enjoy the highest average annual earnings of $37,361, while those with college or associate's degree education earn the least with $32,768. Women with an educational attainment of high school diploma earn the most with the average annual earnings of $35,568, while those with high school diploma education have the smallest earnings of $35,568.
| Educational Attainment | Male Income | Female Income |
| Less than High School | - | - |
| High School Diploma | $37,361 | $35,568 |
| College or Associate's Degree | $32,768 | $0 |
| Bachelor's Degree | - | - |
| Graduate Degree | - | - |
| Total | $33,696 | $34,844 |
Family Income in Crow Agency
Family Income Brackets in Crow Agency
According to the Crow Agency family income data, there are 72 families falling into the $50,000 to $74,999 income range, which is the most common income bracket and makes up 23.4% of all families.
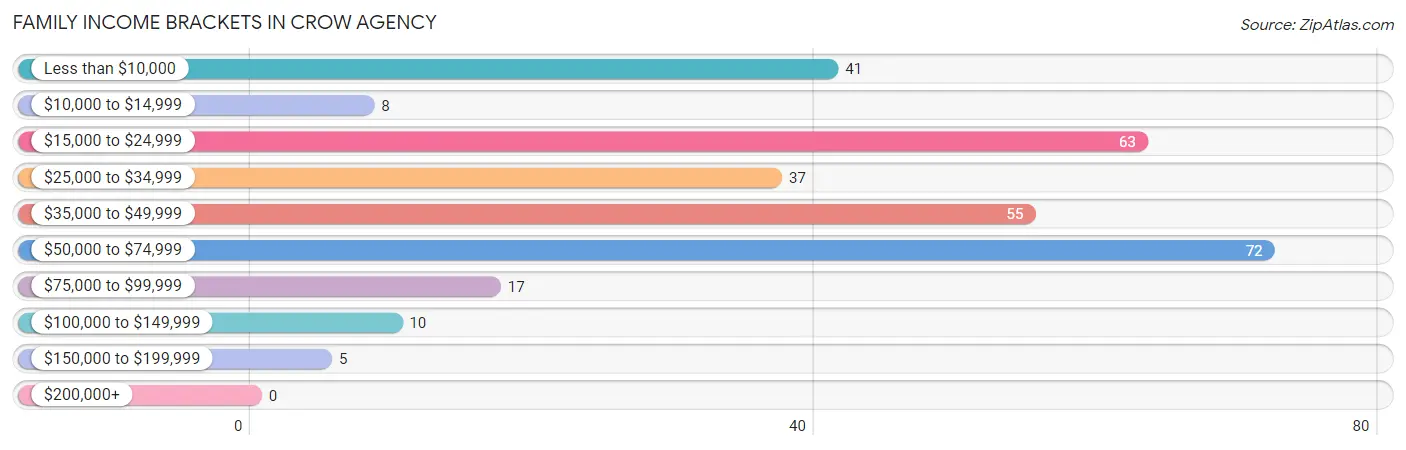
| Income Bracket | # Families | % Families |
| Less than $10,000 | 41 | 13.3% |
| $10,000 to $14,999 | 8 | 2.6% |
| $15,000 to $24,999 | 63 | 20.5% |
| $25,000 to $34,999 | 37 | 12.0% |
| $35,000 to $49,999 | 55 | 17.9% |
| $50,000 to $74,999 | 72 | 23.4% |
| $75,000 to $99,999 | 17 | 5.5% |
| $100,000 to $149,999 | 10 | 3.2% |
| $150,000 to $199,999 | 5 | 1.6% |
| $200,000+ | 0 | 0.0% |
Family Income by Famaliy Size in Crow Agency
6-person families (51 | 16.6%) account for the highest median family income in Crow Agency with $40,125 per family, while 2-person families (67 | 21.7%) have the highest median income of $18,840 per family member.
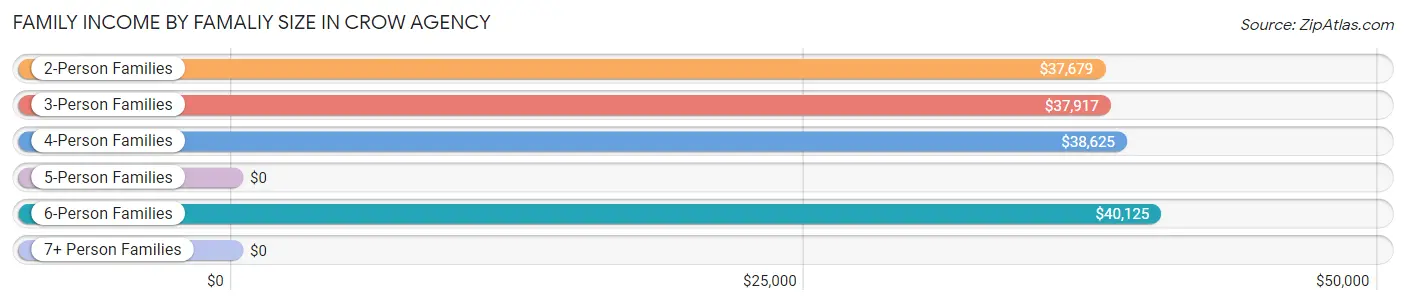
| Income Bracket | # Families | Median Income |
| 2-Person Families | 67 (21.7%) | $37,679 |
| 3-Person Families | 99 (32.1%) | $37,917 |
| 4-Person Families | 51 (16.6%) | $38,625 |
| 5-Person Families | 20 (6.5%) | $0 |
| 6-Person Families | 51 (16.6%) | $40,125 |
| 7+ Person Families | 20 (6.5%) | $0 |
| Total | 308 (100.0%) | $37,981 |
Family Income by Number of Earners in Crow Agency
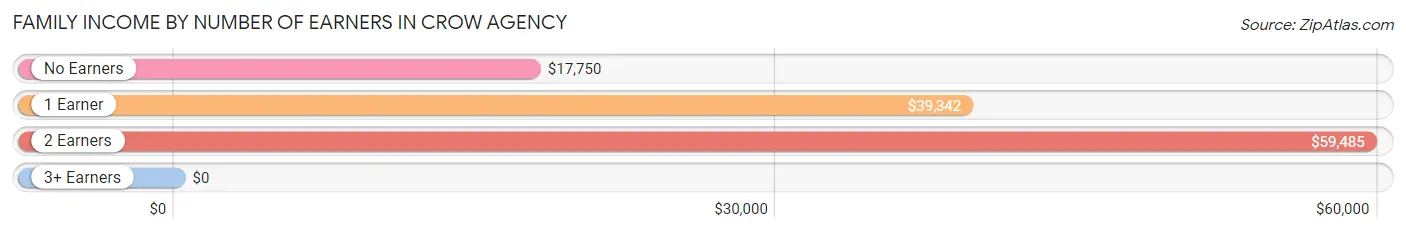
| Number of Earners | # Families | Median Income |
| No Earners | 117 (38.0%) | $17,750 |
| 1 Earner | 134 (43.5%) | $39,342 |
| 2 Earners | 57 (18.5%) | $59,485 |
| 3+ Earners | 0 (0.0%) | $0 |
| Total | 308 (100.0%) | $37,981 |
Household Income in Crow Agency
Household Income Brackets in Crow Agency
With 92 households falling in the category, the $50,000 to $74,999 income range is the most frequent in Crow Agency, accounting for 21.7% of all households.
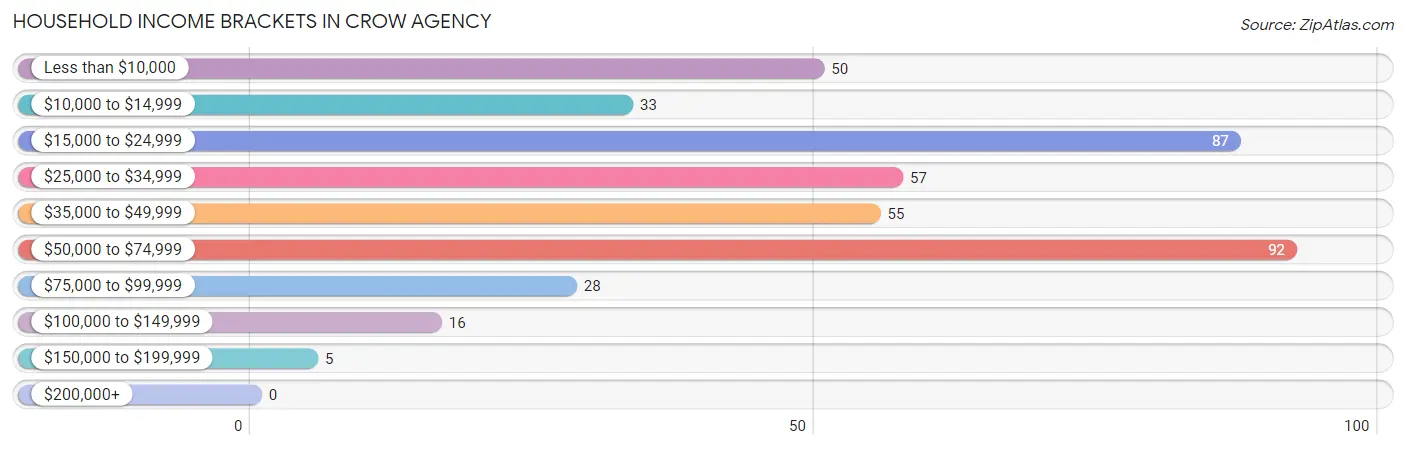
| Income Bracket | # Households | % Households |
| Less than $10,000 | 50 | 11.8% |
| $10,000 to $14,999 | 33 | 7.8% |
| $15,000 to $24,999 | 87 | 20.6% |
| $25,000 to $34,999 | 57 | 13.5% |
| $35,000 to $49,999 | 55 | 13.0% |
| $50,000 to $74,999 | 92 | 21.7% |
| $75,000 to $99,999 | 28 | 6.6% |
| $100,000 to $149,999 | 16 | 3.8% |
| $150,000 to $199,999 | 5 | 1.2% |
| $200,000+ | 0 | 0.0% |
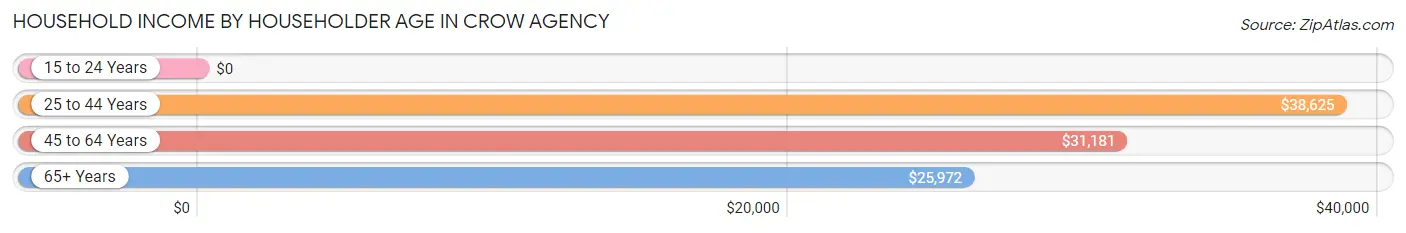
Household Income by Householder Age in Crow Agency
The median household income in Crow Agency is $32,721, with the highest median household income of $38,625 found in the 25 to 44 years age bracket for the primary householder. A total of 91 households (21.5%) fall into this category. Meanwhile, the 15 to 24 years age bracket for the primary householder has the lowest median household income of $0, with 26 households (6.1%) in this group.
| Income Bracket | # Households | Median Income |
| 15 to 24 Years | 26 (6.1%) | $0 |
| 25 to 44 Years | 91 (21.5%) | $38,625 |
| 45 to 64 Years | 163 (38.5%) | $31,181 |
| 65+ Years | 143 (33.8%) | $25,972 |
| Total | 423 (100.0%) | $32,721 |
Poverty in Crow Agency
Income Below Poverty by Sex and Age in Crow Agency
With 42.3% poverty level for males and 49.9% for females among the residents of Crow Agency, 35 to 44 year old males and under 5 year old females are the most vulnerable to poverty, with 87 males (82.9%) and 111 females (69.8%) in their respective age groups living below the poverty level.
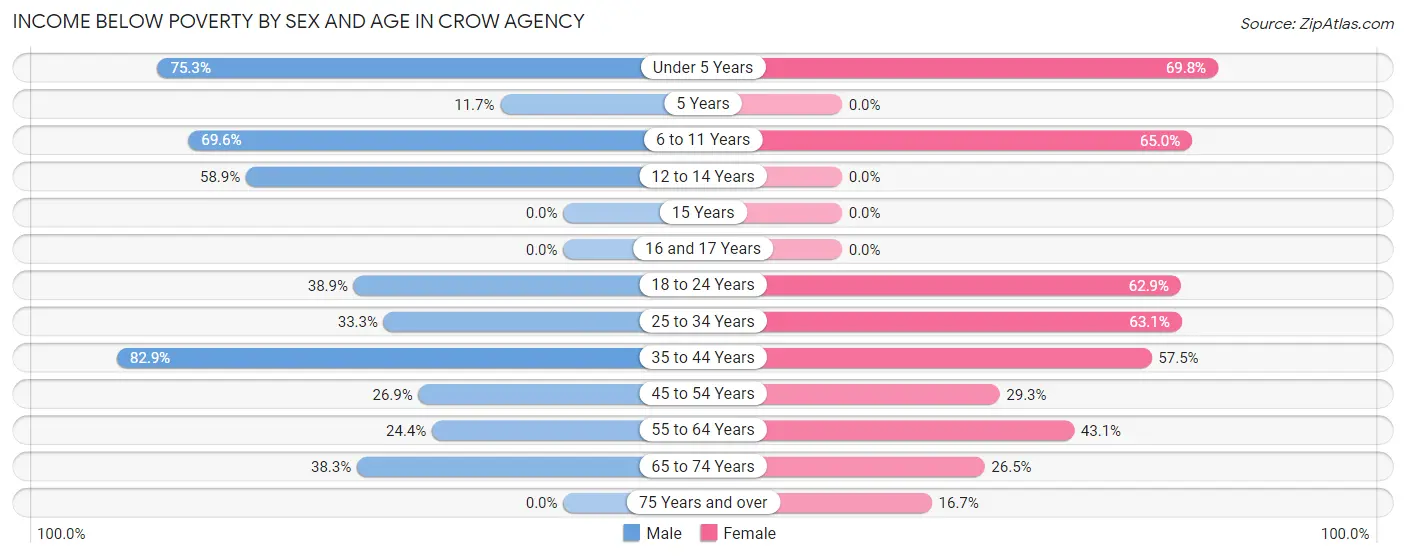
| Age Bracket | Male | Female |
| Under 5 Years | 58 (75.3%) | 111 (69.8%) |
| 5 Years | 11 (11.7%) | 0 (0.0%) |
| 6 to 11 Years | 71 (69.6%) | 65 (65.0%) |
| 12 to 14 Years | 43 (58.9%) | 0 (0.0%) |
| 15 Years | 0 (0.0%) | 0 (0.0%) |
| 16 and 17 Years | 0 (0.0%) | 0 (0.0%) |
| 18 to 24 Years | 28 (38.9%) | 73 (62.9%) |
| 25 to 34 Years | 41 (33.3%) | 99 (63.1%) |
| 35 to 44 Years | 87 (82.9%) | 50 (57.5%) |
| 45 to 54 Years | 25 (26.9%) | 31 (29.2%) |
| 55 to 64 Years | 19 (24.4%) | 28 (43.1%) |
| 65 to 74 Years | 18 (38.3%) | 18 (26.5%) |
| 75 Years and over | 0 (0.0%) | 8 (16.7%) |
| Total | 401 (42.3%) | 483 (49.9%) |
Income Above Poverty by Sex and Age in Crow Agency
According to the poverty statistics in Crow Agency, males aged 15 years and females aged 12 to 14 years are the age groups that are most secure financially, with 100.0% of males and 100.0% of females in these age groups living above the poverty line.
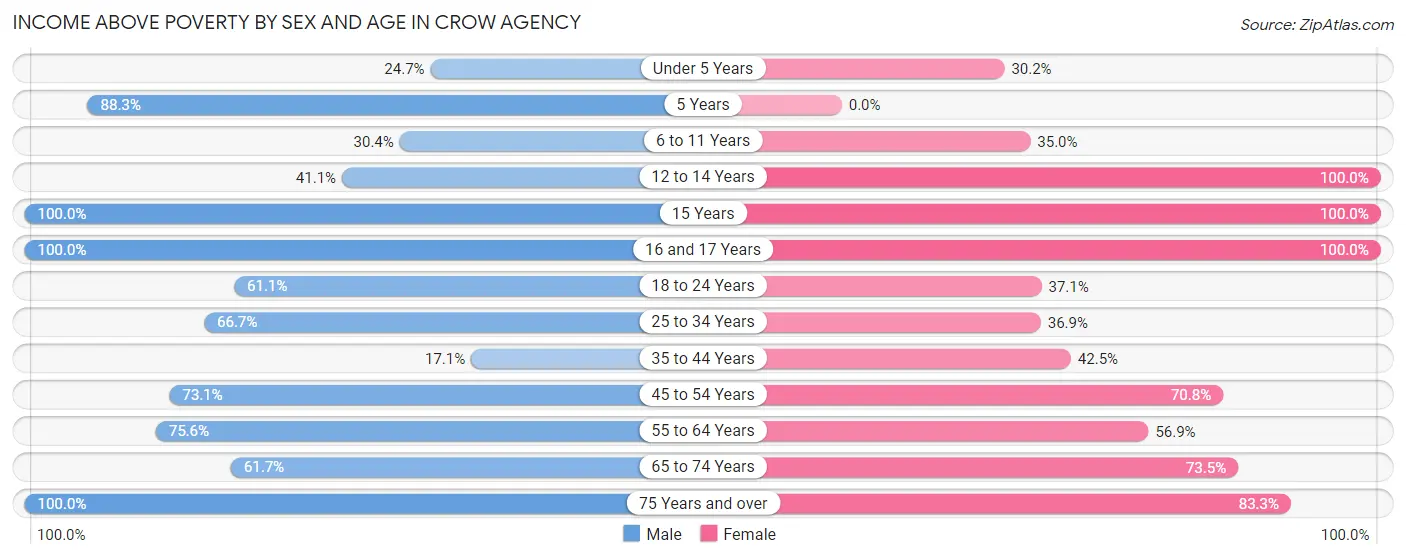
| Age Bracket | Male | Female |
| Under 5 Years | 19 (24.7%) | 48 (30.2%) |
| 5 Years | 83 (88.3%) | 0 (0.0%) |
| 6 to 11 Years | 31 (30.4%) | 35 (35.0%) |
| 12 to 14 Years | 30 (41.1%) | 21 (100.0%) |
| 15 Years | 10 (100.0%) | 10 (100.0%) |
| 16 and 17 Years | 57 (100.0%) | 31 (100.0%) |
| 18 to 24 Years | 44 (61.1%) | 43 (37.1%) |
| 25 to 34 Years | 82 (66.7%) | 58 (36.9%) |
| 35 to 44 Years | 18 (17.1%) | 37 (42.5%) |
| 45 to 54 Years | 68 (73.1%) | 75 (70.8%) |
| 55 to 64 Years | 59 (75.6%) | 37 (56.9%) |
| 65 to 74 Years | 29 (61.7%) | 50 (73.5%) |
| 75 Years and over | 16 (100.0%) | 40 (83.3%) |
| Total | 546 (57.7%) | 485 (50.1%) |
Income Below Poverty Among Married-Couple Families in Crow Agency
The poverty statistics for married-couple families in Crow Agency show that 25.8% or 25 of the total 97 families live below the poverty line. Families with 5 or more children have the highest poverty rate of 100.0%, comprising of 3 families. On the other hand, families with 3 or 4 children have the lowest poverty rate of 0.0%, which includes 0 families.
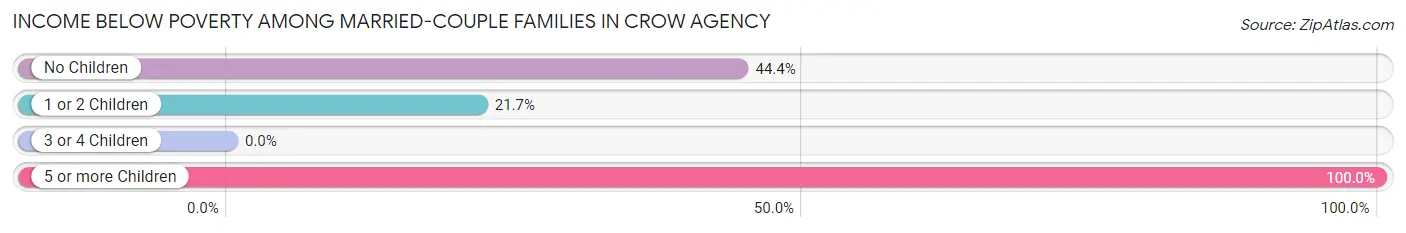
| Children | Above Poverty | Below Poverty |
| No Children | 15 (55.6%) | 12 (44.4%) |
| 1 or 2 Children | 36 (78.3%) | 10 (21.7%) |
| 3 or 4 Children | 21 (100.0%) | 0 (0.0%) |
| 5 or more Children | 0 (0.0%) | 3 (100.0%) |
| Total | 72 (74.2%) | 25 (25.8%) |
Income Below Poverty Among Single-Parent Households in Crow Agency
According to the poverty data in Crow Agency, 44.8% or 30 single-father households and 43.8% or 63 single-mother households are living below the poverty line. Among single-father households, those with 1 or 2 children have the highest poverty rate, with 30 households (75.0%) experiencing poverty. Likewise, among single-mother households, those with 3 or 4 children have the highest poverty rate, with 33 households (100.0%) falling below the poverty line.
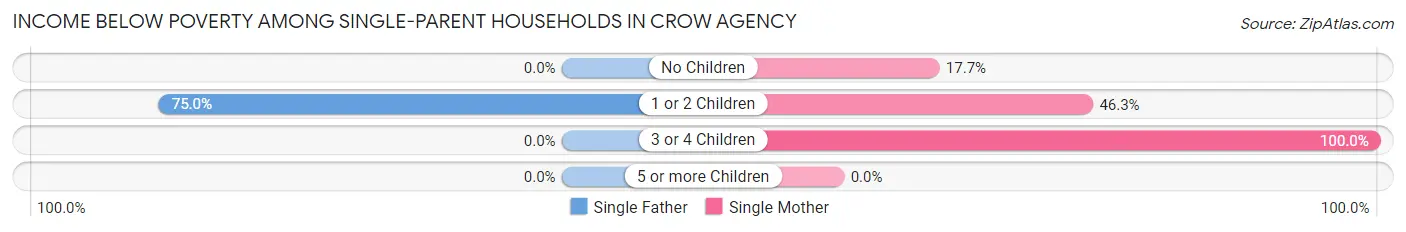
| Children | Single Father | Single Mother |
| No Children | 0 (0.0%) | 11 (17.7%) |
| 1 or 2 Children | 30 (75.0%) | 19 (46.3%) |
| 3 or 4 Children | 0 (0.0%) | 33 (100.0%) |
| 5 or more Children | 0 (0.0%) | 0 (0.0%) |
| Total | 30 (44.8%) | 63 (43.8%) |
Income Below Poverty Among Married-Couple vs Single-Parent Households in Crow Agency
The poverty data for Crow Agency shows that 25 of the married-couple family households (25.8%) and 93 of the single-parent households (44.1%) are living below the poverty level. Within the married-couple family households, those with 5 or more children have the highest poverty rate, with 3 households (100.0%) falling below the poverty line. Among the single-parent households, those with 3 or 4 children have the highest poverty rate, with 33 household (86.8%) living below poverty.
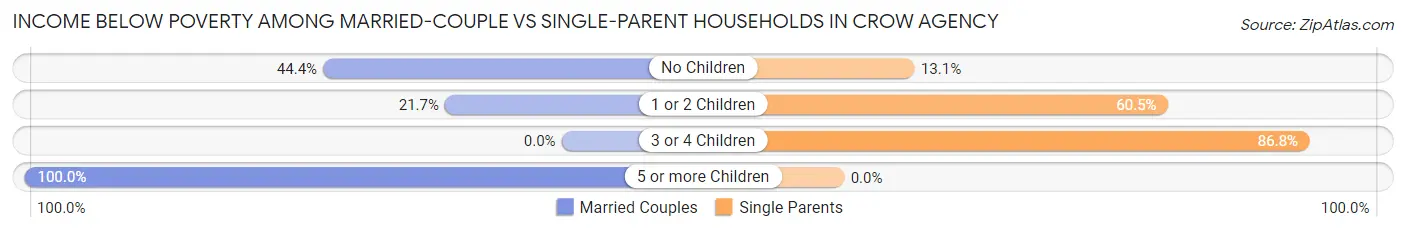
| Children | Married-Couple Families | Single-Parent Households |
| No Children | 12 (44.4%) | 11 (13.1%) |
| 1 or 2 Children | 10 (21.7%) | 49 (60.5%) |
| 3 or 4 Children | 0 (0.0%) | 33 (86.8%) |
| 5 or more Children | 3 (100.0%) | 0 (0.0%) |
| Total | 25 (25.8%) | 93 (44.1%) |
Race in Crow Agency
The most populous races in Crow Agency are Native / Alaskan (1,881 | 95.7%), White / Caucasian (68 | 3.5%), and Two or more Races (16 | 0.8%).
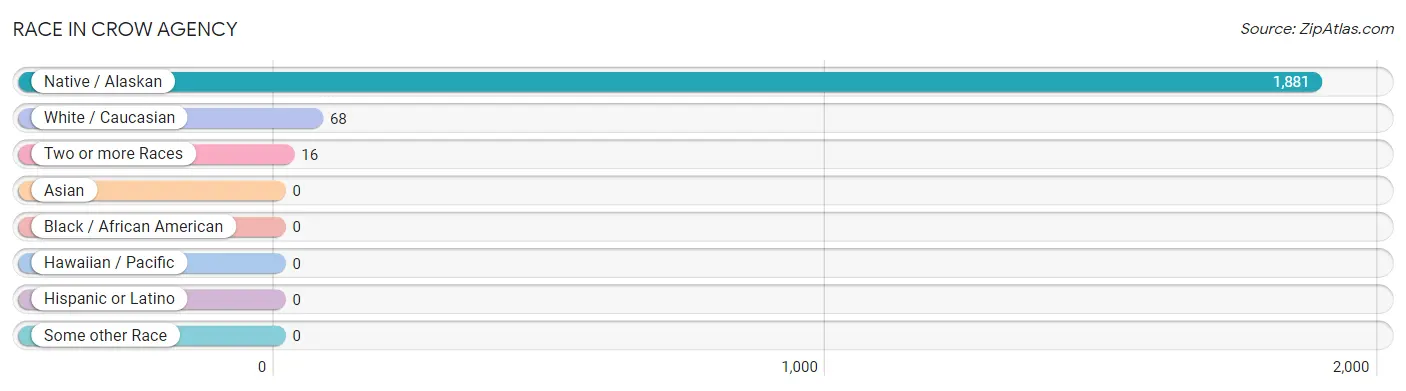
| Race | # Population | % Population |
| Asian | 0 | 0.0% |
| Black / African American | 0 | 0.0% |
| Hawaiian / Pacific | 0 | 0.0% |
| Hispanic or Latino | 0 | 0.0% |
| Native / Alaskan | 1,881 | 95.7% |
| White / Caucasian | 68 | 3.5% |
| Two or more Races | 16 | 0.8% |
| Some other Race | 0 | 0.0% |
| Total | 1,965 | 100.0% |
Ancestry in Crow Agency
The most populous ancestries reported in Crow Agency are Crow (1,801 | 91.6%), Cheyenne (68 | 3.5%), Irish (59 | 3.0%), Scottish (56 | 2.9%), and Sioux (16 | 0.8%), together accounting for 101.8% of all Crow Agency residents.
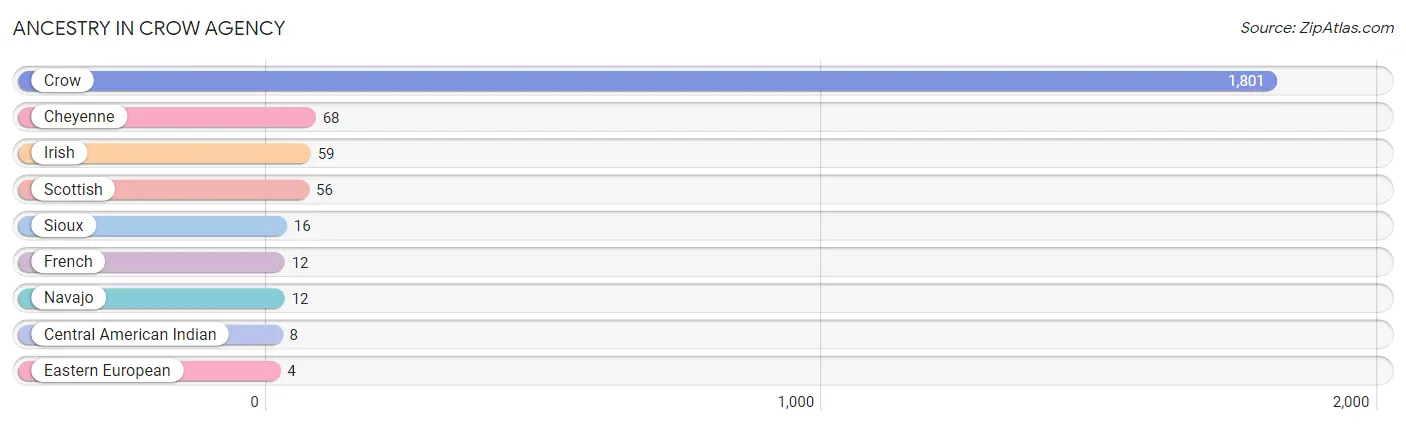
| Ancestry | # Population | % Population |
| Central American Indian | 8 | 0.4% |
| Cheyenne | 68 | 3.5% |
| Crow | 1,801 | 91.6% |
| Eastern European | 4 | 0.2% |
| French | 12 | 0.6% |
| Irish | 59 | 3.0% |
| Navajo | 12 | 0.6% |
| Scottish | 56 | 2.9% |
| Sioux | 16 | 0.8% | View All 9 Rows |
Immigrants in Crow Agency

| Immigration Origin | # Population | % Population | View All 0 Rows |
Sex and Age in Crow Agency
Sex and Age in Crow Agency
The most populous age groups in Crow Agency are 5 to 9 Years (185 | 19.0%) for men and Under 5 Years (170 | 17.2%) for women.
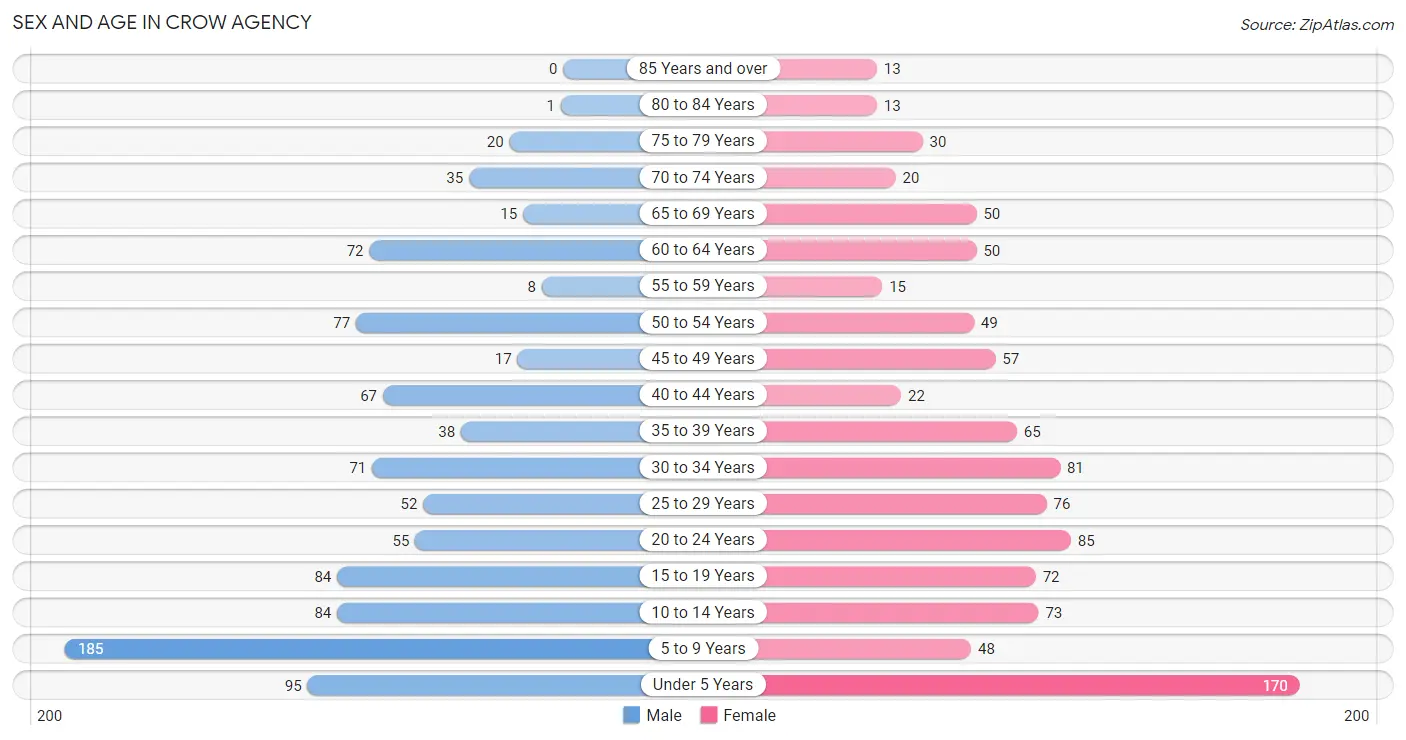
| Age Bracket | Male | Female |
| Under 5 Years | 95 (9.7%) | 170 (17.2%) |
| 5 to 9 Years | 185 (19.0%) | 48 (4.9%) |
| 10 to 14 Years | 84 (8.6%) | 73 (7.4%) |
| 15 to 19 Years | 84 (8.6%) | 72 (7.3%) |
| 20 to 24 Years | 55 (5.6%) | 85 (8.6%) |
| 25 to 29 Years | 52 (5.3%) | 76 (7.7%) |
| 30 to 34 Years | 71 (7.3%) | 81 (8.2%) |
| 35 to 39 Years | 38 (3.9%) | 65 (6.6%) |
| 40 to 44 Years | 67 (6.9%) | 22 (2.2%) |
| 45 to 49 Years | 17 (1.7%) | 57 (5.8%) |
| 50 to 54 Years | 77 (7.9%) | 49 (5.0%) |
| 55 to 59 Years | 8 (0.8%) | 15 (1.5%) |
| 60 to 64 Years | 72 (7.4%) | 50 (5.1%) |
| 65 to 69 Years | 15 (1.5%) | 50 (5.1%) |
| 70 to 74 Years | 35 (3.6%) | 20 (2.0%) |
| 75 to 79 Years | 20 (2.1%) | 30 (3.0%) |
| 80 to 84 Years | 1 (0.1%) | 13 (1.3%) |
| 85 Years and over | 0 (0.0%) | 13 (1.3%) |
| Total | 976 (100.0%) | 989 (100.0%) |
Families and Households in Crow Agency
Median Family Size in Crow Agency
The median family size in Crow Agency is 5.72 persons per family, with married-couple families (97 | 31.5%) accounting for the largest median family size of 6.04 persons per family. On the other hand, single male/father families (67 | 21.7%) represent the smallest median family size with 5.40 persons per family.
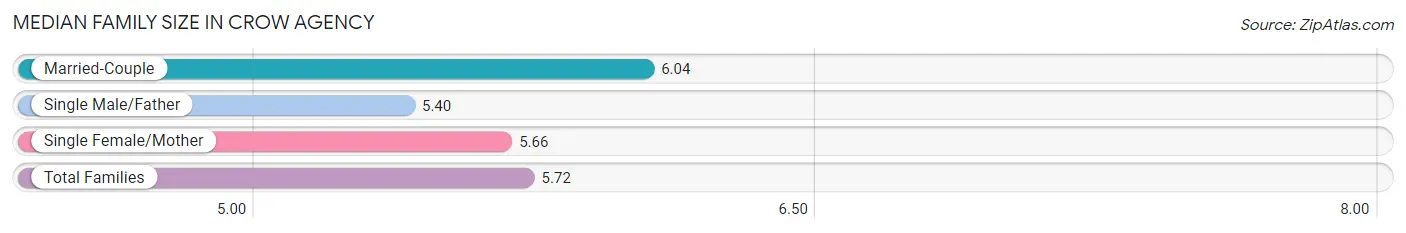
| Family Type | # Families | Family Size |
| Married-Couple | 97 (31.5%) | 6.04 |
| Single Male/Father | 67 (21.7%) | 5.40 |
| Single Female/Mother | 144 (46.8%) | 5.66 |
| Total Families | 308 (100.0%) | 5.72 |
Median Household Size in Crow Agency
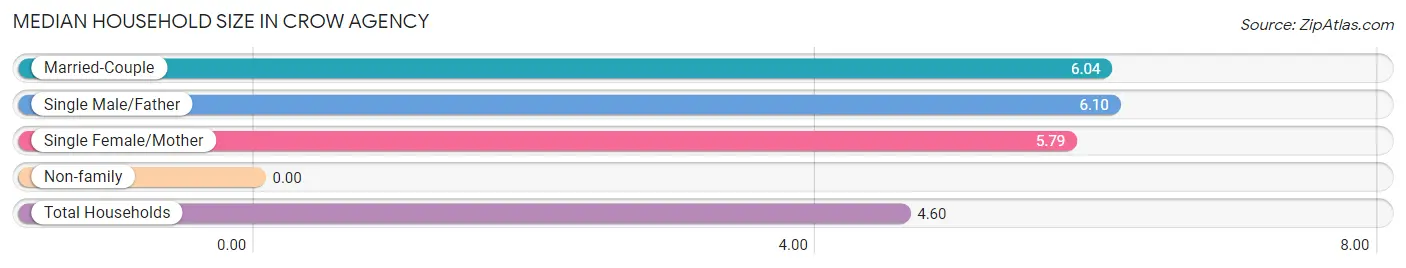
| Household Type | # Households | Household Size |
| Married-Couple | 97 (22.9%) | 6.04 |
| Single Male/Father | 67 (15.8%) | 6.10 |
| Single Female/Mother | 144 (34.0%) | 5.79 |
| Non-family | 115 (27.2%) | - |
| Total Households | 423 (100.0%) | 4.60 |
Household Size by Marriage Status in Crow Agency
Out of a total of 423 households in Crow Agency, 308 (72.8%) are family households, while 115 (27.2%) are nonfamily households. The most numerous type of family households are 3-person households, comprising 91, and the most common type of nonfamily households are 1-person households, comprising 115.
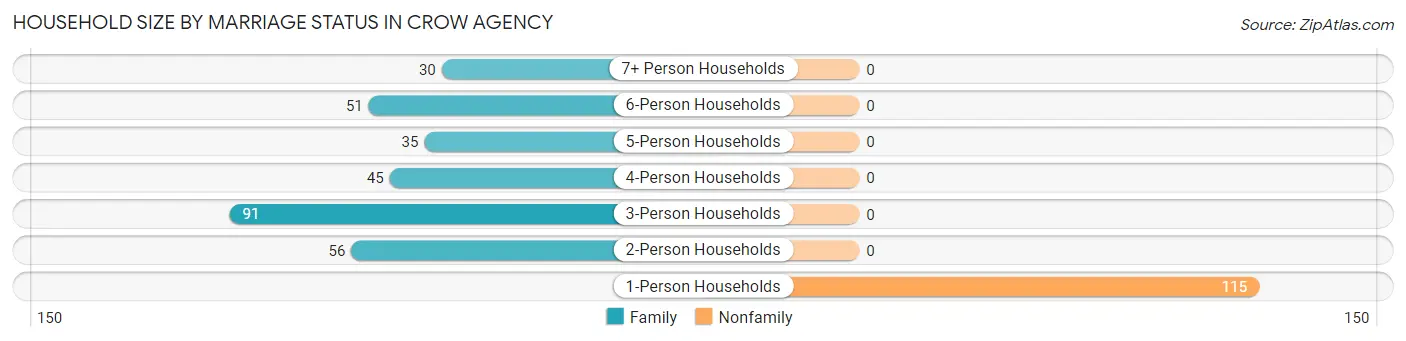
| Household Size | Family Households | Nonfamily Households |
| 1-Person Households | - | 115 (27.2%) |
| 2-Person Households | 56 (13.2%) | 0 (0.0%) |
| 3-Person Households | 91 (21.5%) | 0 (0.0%) |
| 4-Person Households | 45 (10.6%) | 0 (0.0%) |
| 5-Person Households | 35 (8.3%) | 0 (0.0%) |
| 6-Person Households | 51 (12.1%) | 0 (0.0%) |
| 7+ Person Households | 30 (7.1%) | 0 (0.0%) |
| Total | 308 (72.8%) | 115 (27.2%) |
Female Fertility in Crow Agency
Fertility by Age in Crow Agency
Average fertility rate in Crow Agency is 87.0 births per 1,000 women. Women in the age bracket of 20 to 34 years have the highest fertility rate with 107.0 births per 1,000 women. Women in the age bracket of 20 to 34 years acount for 65.0% of all women with births.
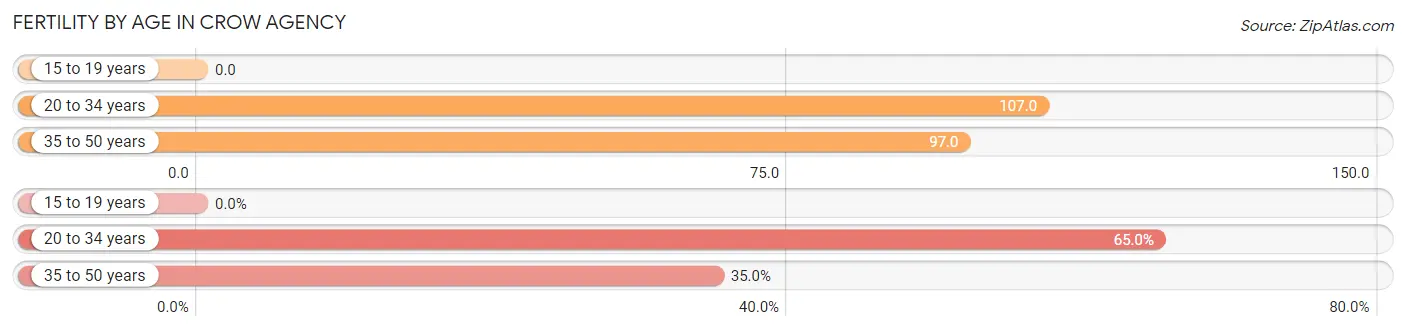
| Age Bracket | Women with Births | Births / 1,000 Women |
| 15 to 19 years | 0 (0.0%) | 0.0 |
| 20 to 34 years | 26 (65.0%) | 107.0 |
| 35 to 50 years | 14 (35.0%) | 97.0 |
| Total | 40 (100.0%) | 87.0 |
Fertility by Age by Marriage Status in Crow Agency
55.0% of women with births (40) in Crow Agency are married. The highest percentage of unmarried women with births falls into 20 to 34 years age bracket with 69.2% of them unmarried at the time of birth, while the lowest percentage of unmarried women with births belong to 35 to 50 years age bracket with 0.0% of them unmarried.
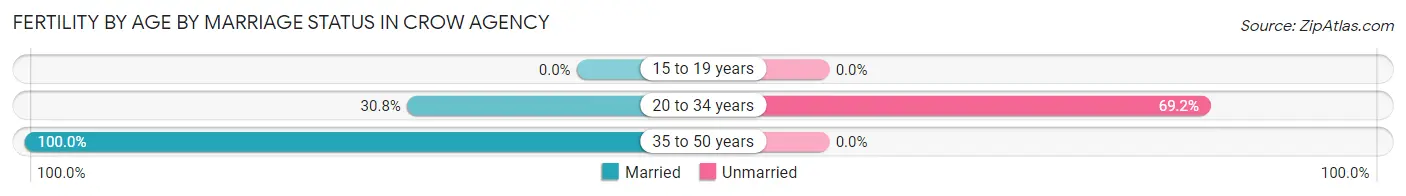
| Age Bracket | Married | Unmarried |
| 15 to 19 years | 0 (0.0%) | 0 (0.0%) |
| 20 to 34 years | 8 (30.8%) | 18 (69.2%) |
| 35 to 50 years | 14 (100.0%) | 0 (0.0%) |
| Total | 22 (55.0%) | 18 (45.0%) |
Fertility by Education in Crow Agency
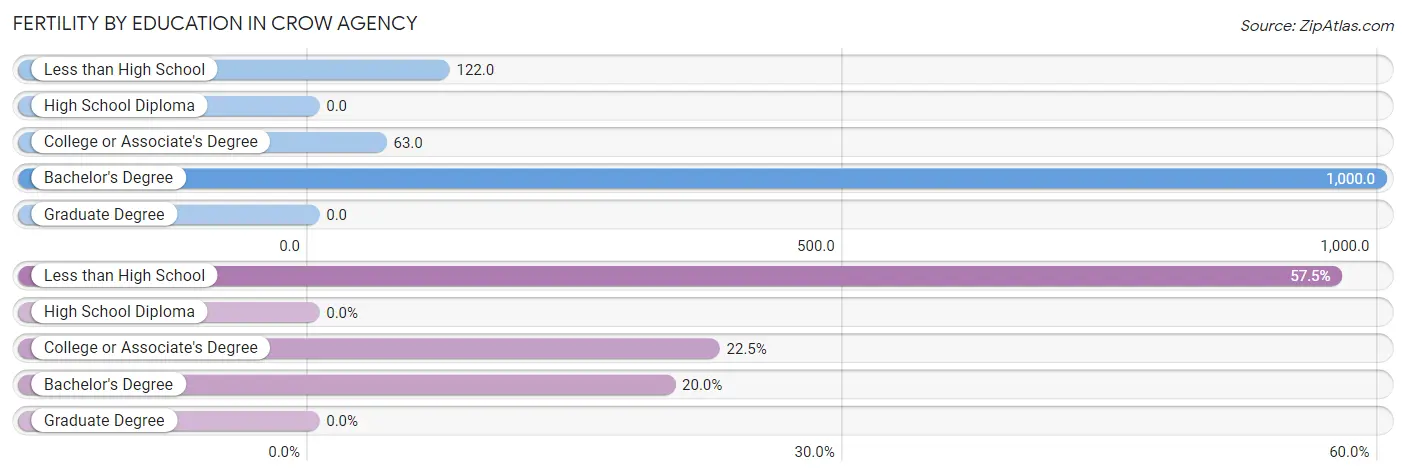
| Educational Attainment | Women with Births | Births / 1,000 Women |
| Less than High School | 23 (57.5%) | 122.0 |
| High School Diploma | 0 (0.0%) | 0.0 |
| College or Associate's Degree | 9 (22.5%) | 63.0 |
| Bachelor's Degree | 8 (20.0%) | 1,000.0 |
| Graduate Degree | 0 (0.0%) | 0.0 |
| Total | 40 (100.0%) | 87.0 |
Fertility by Education by Marriage Status in Crow Agency
45.0% of women with births in Crow Agency are unmarried. Women with the educational attainment of bachelor's degree are most likely to be married with 100.0% of them married at childbirth, while women with the educational attainment of college or associate's degree are least likely to be married with 100.0% of them unmarried at childbirth.
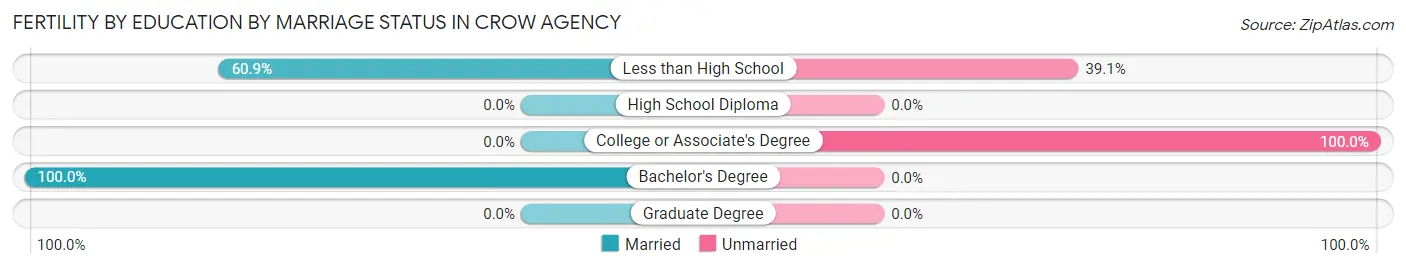
| Educational Attainment | Married | Unmarried |
| Less than High School | 14 (60.9%) | 9 (39.1%) |
| High School Diploma | 0 (0.0%) | 0 (0.0%) |
| College or Associate's Degree | 0 (0.0%) | 9 (100.0%) |
| Bachelor's Degree | 8 (100.0%) | 0 (0.0%) |
| Graduate Degree | 0 (0.0%) | 0 (0.0%) |
| Total | 22 (55.0%) | 18 (45.0%) |
Employment Characteristics in Crow Agency
Employment by Class of Employer in Crow Agency
Among the 351 employed individuals in Crow Agency, local government employees (120 | 34.2%), private company employees (111 | 31.6%), and federal government employees (65 | 18.5%) make up the most common classes of employment.
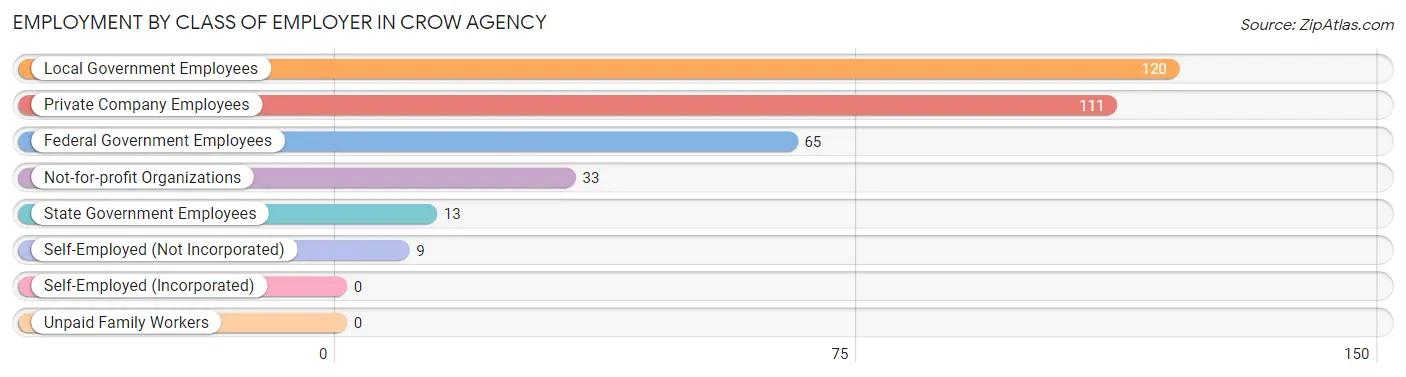
| Employer Class | # Employees | % Employees |
| Private Company Employees | 111 | 31.6% |
| Self-Employed (Incorporated) | 0 | 0.0% |
| Self-Employed (Not Incorporated) | 9 | 2.6% |
| Not-for-profit Organizations | 33 | 9.4% |
| Local Government Employees | 120 | 34.2% |
| State Government Employees | 13 | 3.7% |
| Federal Government Employees | 65 | 18.5% |
| Unpaid Family Workers | 0 | 0.0% |
| Total | 351 | 100.0% |
Employment Status by Age in Crow Agency
According to the labor force statistics for Crow Agency, out of the total population over 16 years of age (1,290), 46.7% or 602 individuals are in the labor force, with 41.8% or 252 of them unemployed. The age group with the highest labor force participation rate is 20 to 24 years, with 87.1% or 122 individuals in the labor force. Within the labor force, the 65 to 74 years age range has the highest percentage of unemployed individuals, with 71.4% or 10 of them being unemployed.
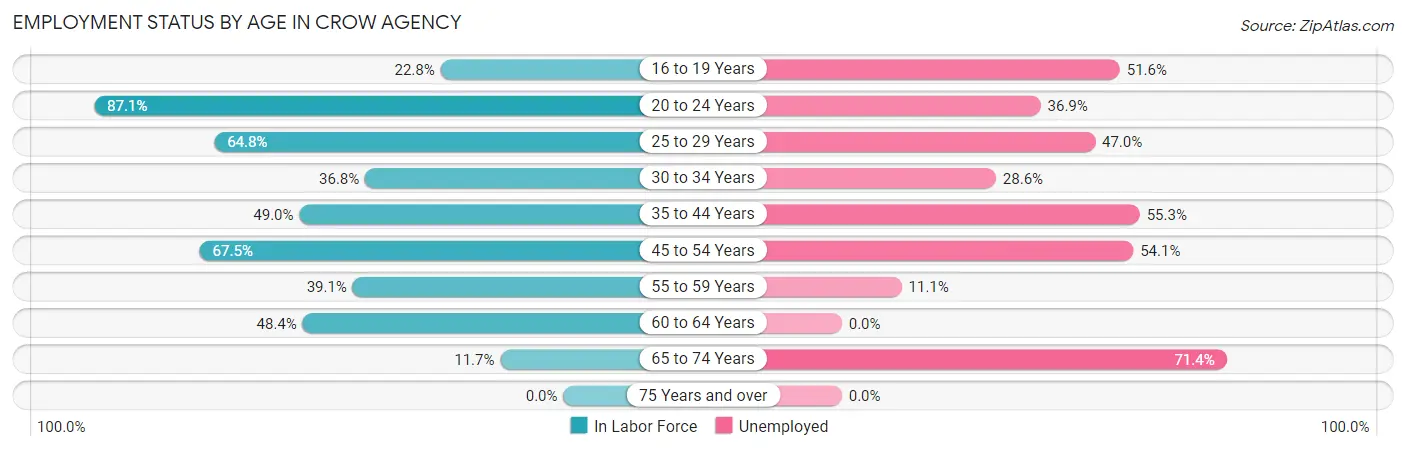
| Age Bracket | In Labor Force | Unemployed |
| 16 to 19 Years | 31 (22.8%) | 16 (51.6%) |
| 20 to 24 Years | 122 (87.1%) | 45 (36.9%) |
| 25 to 29 Years | 83 (64.8%) | 39 (47.0%) |
| 30 to 34 Years | 56 (36.8%) | 16 (28.6%) |
| 35 to 44 Years | 94 (49.0%) | 52 (55.3%) |
| 45 to 54 Years | 135 (67.5%) | 73 (54.1%) |
| 55 to 59 Years | 9 (39.1%) | 1 (11.1%) |
| 60 to 64 Years | 59 (48.4%) | 0 (0.0%) |
| 65 to 74 Years | 14 (11.7%) | 10 (71.4%) |
| 75 Years and over | 0 (0.0%) | 0 (0.0%) |
| Total | 602 (46.7%) | 252 (41.8%) |
Employment Status by Educational Attainment in Crow Agency
According to labor force statistics for Crow Agency, 53.4% of individuals (436) out of the total population between 25 and 64 years of age (817) are in the labor force, with 41.5% or 181 of them being unemployed. The group with the highest labor force participation rate are those with the educational attainment of college / associate degree, with 63.4% or 243 individuals in the labor force. Within the labor force, individuals with less than high school education have the highest percentage of unemployment, with 66.7% or 34 of them being unemployed.
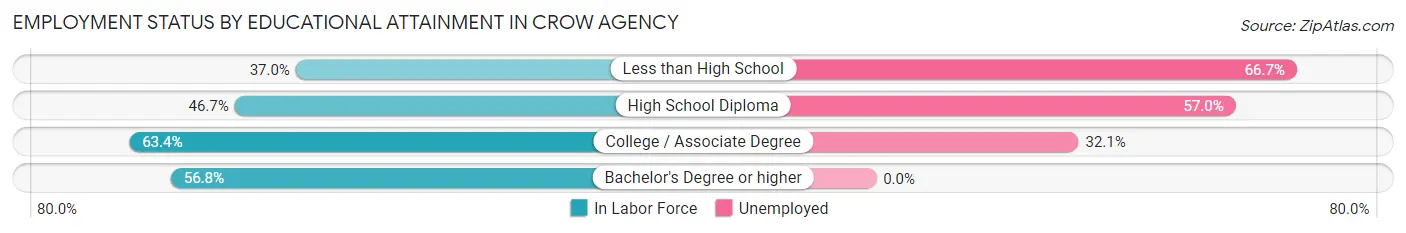
| Educational Attainment | In Labor Force | Unemployed |
| Less than High School | 51 (37.0%) | 92 (66.7%) |
| High School Diploma | 121 (46.7%) | 148 (57.0%) |
| College / Associate Degree | 243 (63.4%) | 123 (32.1%) |
| Bachelor's Degree or higher | 21 (56.8%) | 0 (0.0%) |
| Total | 436 (53.4%) | 339 (41.5%) |
Employment Occupations by Sex in Crow Agency
Management, Business, Science and Arts Occupations
The most common Management, Business, Science and Arts occupations in Crow Agency are Management (17 | 4.8%), Business & Financial (5 | 1.4%), Computers, Engineering & Science (5 | 1.4%), Architecture & Engineering (5 | 1.4%), and Community & Social Service (4 | 1.1%).
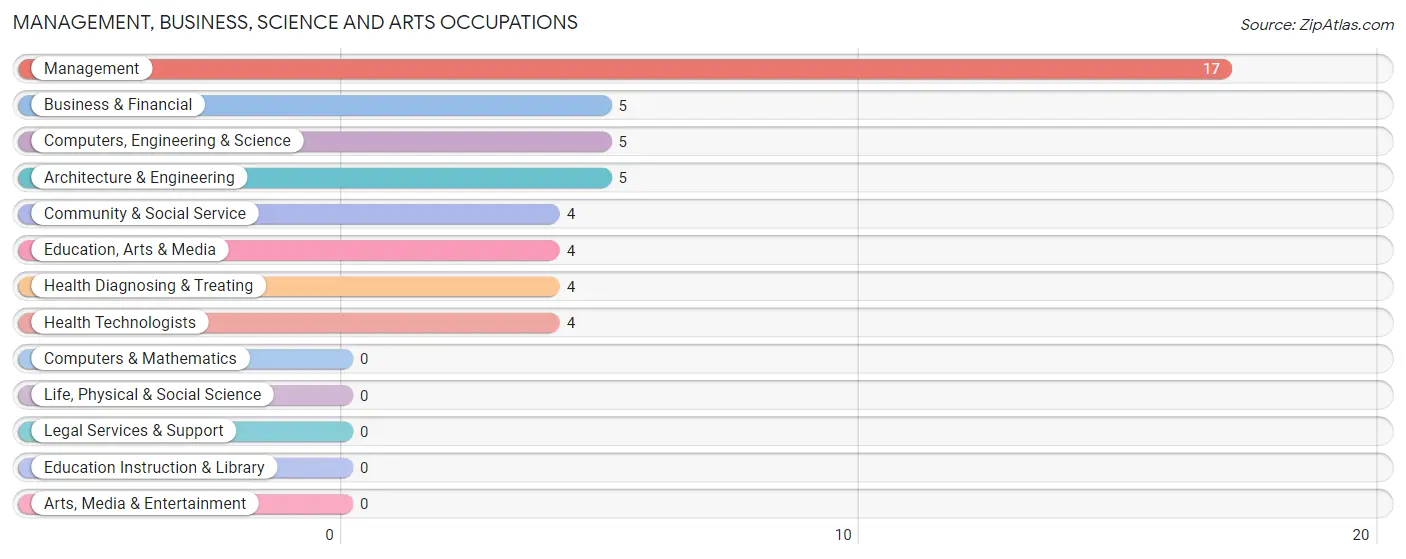
Management, Business, Science and Arts Occupations by Sex
Within the Management, Business, Science and Arts occupations in Crow Agency, the most male-oriented occupations are Business & Financial (100.0%), Computers, Engineering & Science (100.0%), and Architecture & Engineering (100.0%), while the most female-oriented occupations are Health Diagnosing & Treating (100.0%), Health Technologists (100.0%), and Management (47.1%).
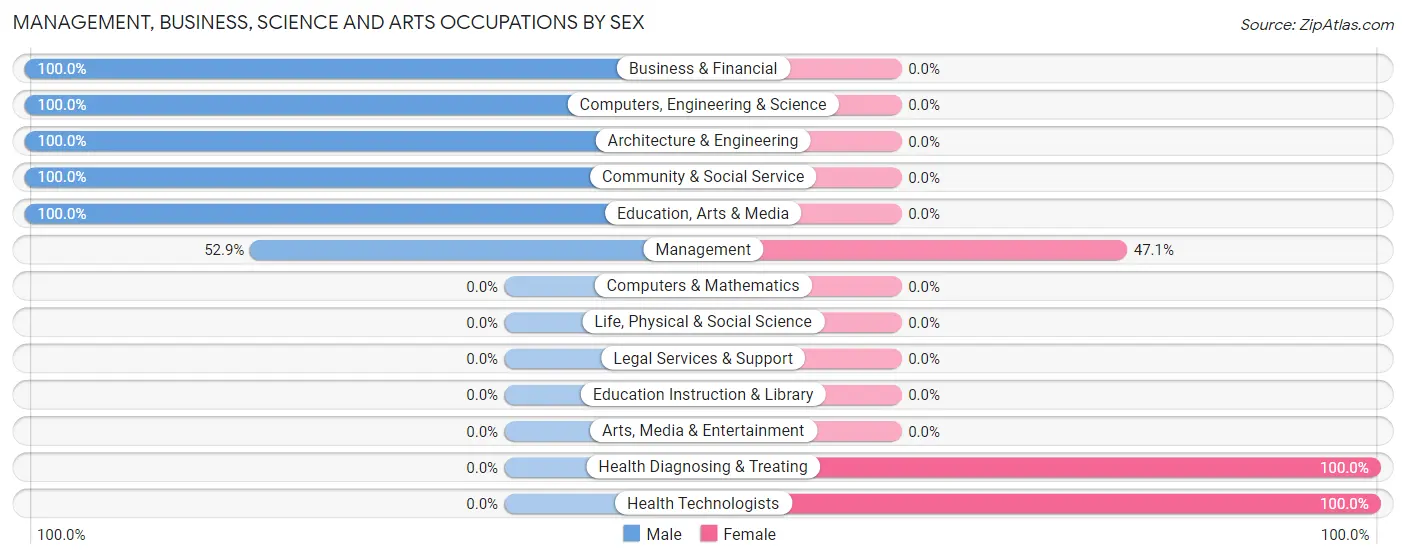
| Occupation | Male | Female |
| Management | 9 (52.9%) | 8 (47.1%) |
| Business & Financial | 5 (100.0%) | 0 (0.0%) |
| Computers, Engineering & Science | 5 (100.0%) | 0 (0.0%) |
| Computers & Mathematics | 0 (0.0%) | 0 (0.0%) |
| Architecture & Engineering | 5 (100.0%) | 0 (0.0%) |
| Life, Physical & Social Science | 0 (0.0%) | 0 (0.0%) |
| Community & Social Service | 4 (100.0%) | 0 (0.0%) |
| Education, Arts & Media | 4 (100.0%) | 0 (0.0%) |
| Legal Services & Support | 0 (0.0%) | 0 (0.0%) |
| Education Instruction & Library | 0 (0.0%) | 0 (0.0%) |
| Arts, Media & Entertainment | 0 (0.0%) | 0 (0.0%) |
| Health Diagnosing & Treating | 0 (0.0%) | 4 (100.0%) |
| Health Technologists | 0 (0.0%) | 4 (100.0%) |
| Total (Category) | 23 (65.7%) | 12 (34.3%) |
| Total (Overall) | 224 (63.8%) | 127 (36.2%) |
Services Occupations
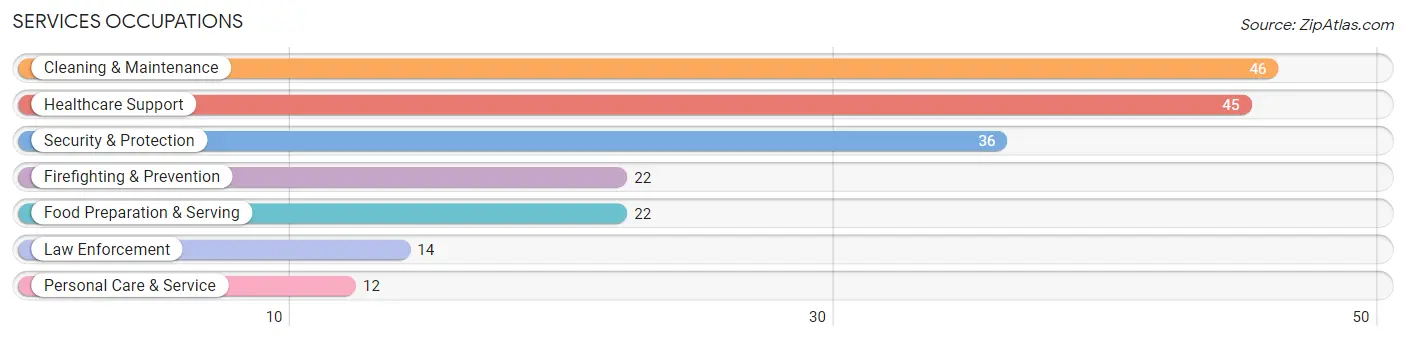
The most common Services occupations in Crow Agency are Cleaning & Maintenance (46 | 13.1%), Healthcare Support (45 | 12.8%), Security & Protection (36 | 10.3%), Firefighting & Prevention (22 | 6.3%), and Food Preparation & Serving (22 | 6.3%).
Services Occupations by Sex
Within the Services occupations in Crow Agency, the most male-oriented occupations are Security & Protection (100.0%), Firefighting & Prevention (100.0%), and Law Enforcement (100.0%), while the most female-oriented occupations are Personal Care & Service (100.0%), and Healthcare Support (57.8%).
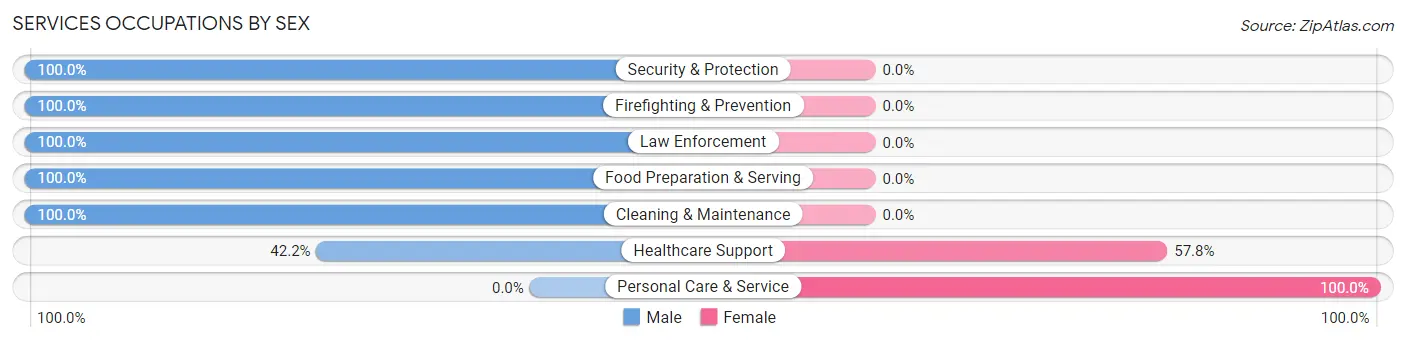
| Occupation | Male | Female |
| Healthcare Support | 19 (42.2%) | 26 (57.8%) |
| Security & Protection | 36 (100.0%) | 0 (0.0%) |
| Firefighting & Prevention | 22 (100.0%) | 0 (0.0%) |
| Law Enforcement | 14 (100.0%) | 0 (0.0%) |
| Food Preparation & Serving | 22 (100.0%) | 0 (0.0%) |
| Cleaning & Maintenance | 46 (100.0%) | 0 (0.0%) |
| Personal Care & Service | 0 (0.0%) | 12 (100.0%) |
| Total (Category) | 123 (76.4%) | 38 (23.6%) |
| Total (Overall) | 224 (63.8%) | 127 (36.2%) |
Sales and Office Occupations
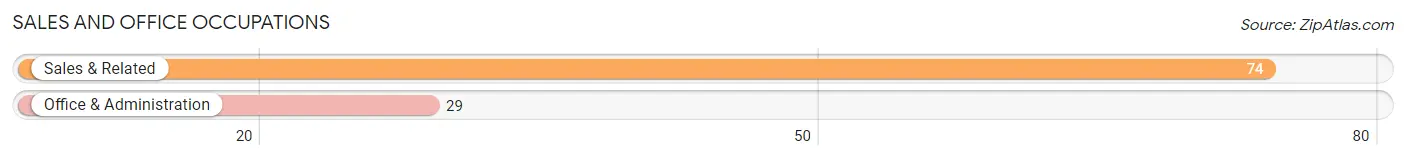
The most common Sales and Office occupations in Crow Agency are Sales & Related (74 | 21.1%), and Office & Administration (29 | 8.3%).
Sales and Office Occupations by Sex
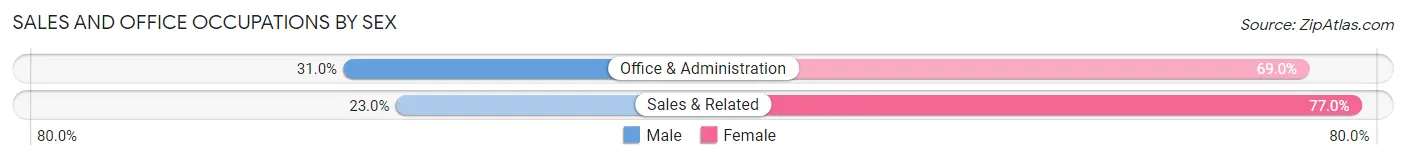
| Occupation | Male | Female |
| Sales & Related | 17 (23.0%) | 57 (77.0%) |
| Office & Administration | 9 (31.0%) | 20 (69.0%) |
| Total (Category) | 26 (25.2%) | 77 (74.8%) |
| Total (Overall) | 224 (63.8%) | 127 (36.2%) |
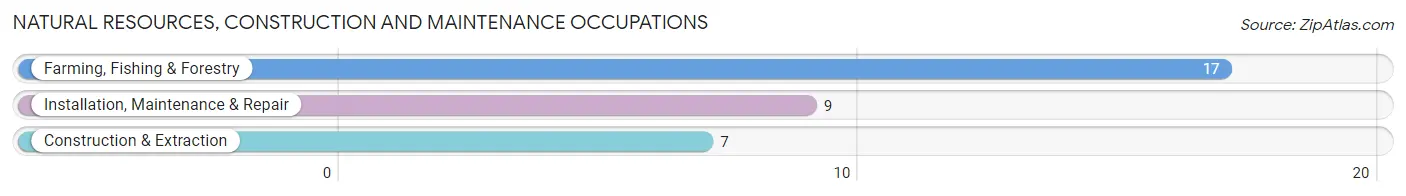
Natural Resources, Construction and Maintenance Occupations
The most common Natural Resources, Construction and Maintenance occupations in Crow Agency are Farming, Fishing & Forestry (17 | 4.8%), Installation, Maintenance & Repair (9 | 2.6%), and Construction & Extraction (7 | 2.0%).
Natural Resources, Construction and Maintenance Occupations by Sex
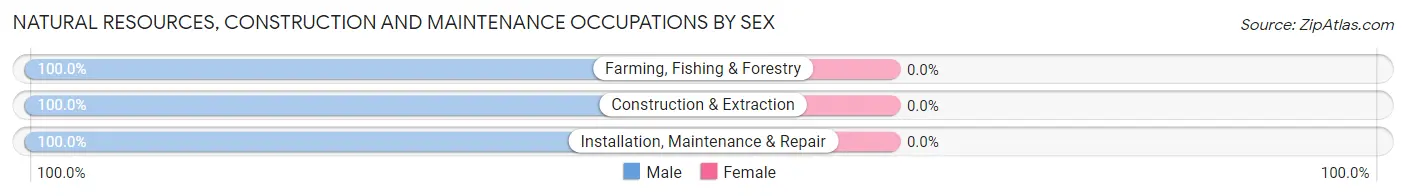
| Occupation | Male | Female |
| Farming, Fishing & Forestry | 17 (100.0%) | 0 (0.0%) |
| Construction & Extraction | 7 (100.0%) | 0 (0.0%) |
| Installation, Maintenance & Repair | 9 (100.0%) | 0 (0.0%) |
| Total (Category) | 33 (100.0%) | 0 (0.0%) |
| Total (Overall) | 224 (63.8%) | 127 (36.2%) |
Production, Transportation and Moving Occupations
The most common Production, Transportation and Moving occupations in Crow Agency are , and Transportation (19 | 5.4%).
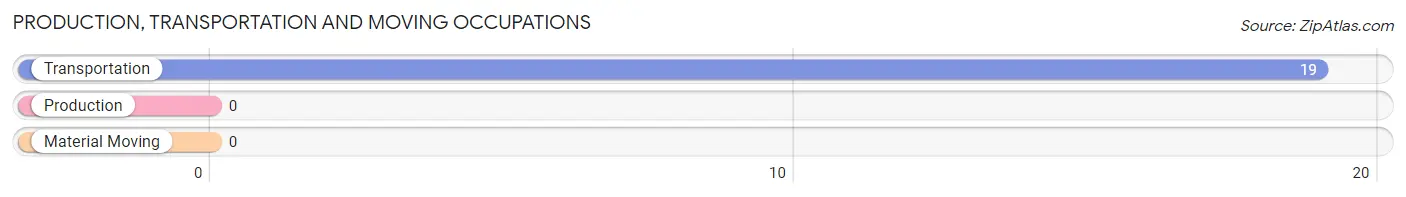
Production, Transportation and Moving Occupations by Sex
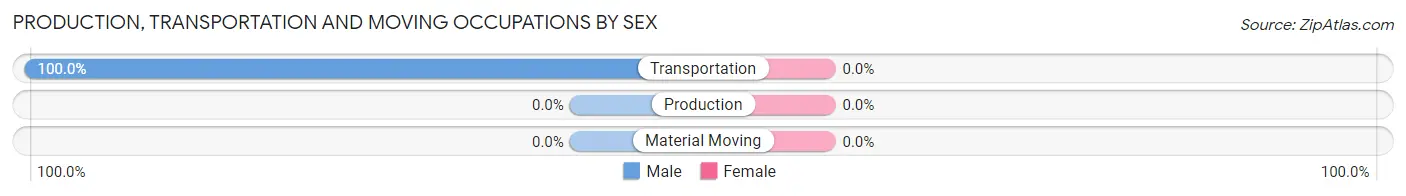
| Occupation | Male | Female |
| Production | 0 (0.0%) | 0 (0.0%) |
| Transportation | 19 (100.0%) | 0 (0.0%) |
| Material Moving | 0 (0.0%) | 0 (0.0%) |
| Total (Category) | 19 (100.0%) | 0 (0.0%) |
| Total (Overall) | 224 (63.8%) | 127 (36.2%) |
Employment Industries by Sex in Crow Agency
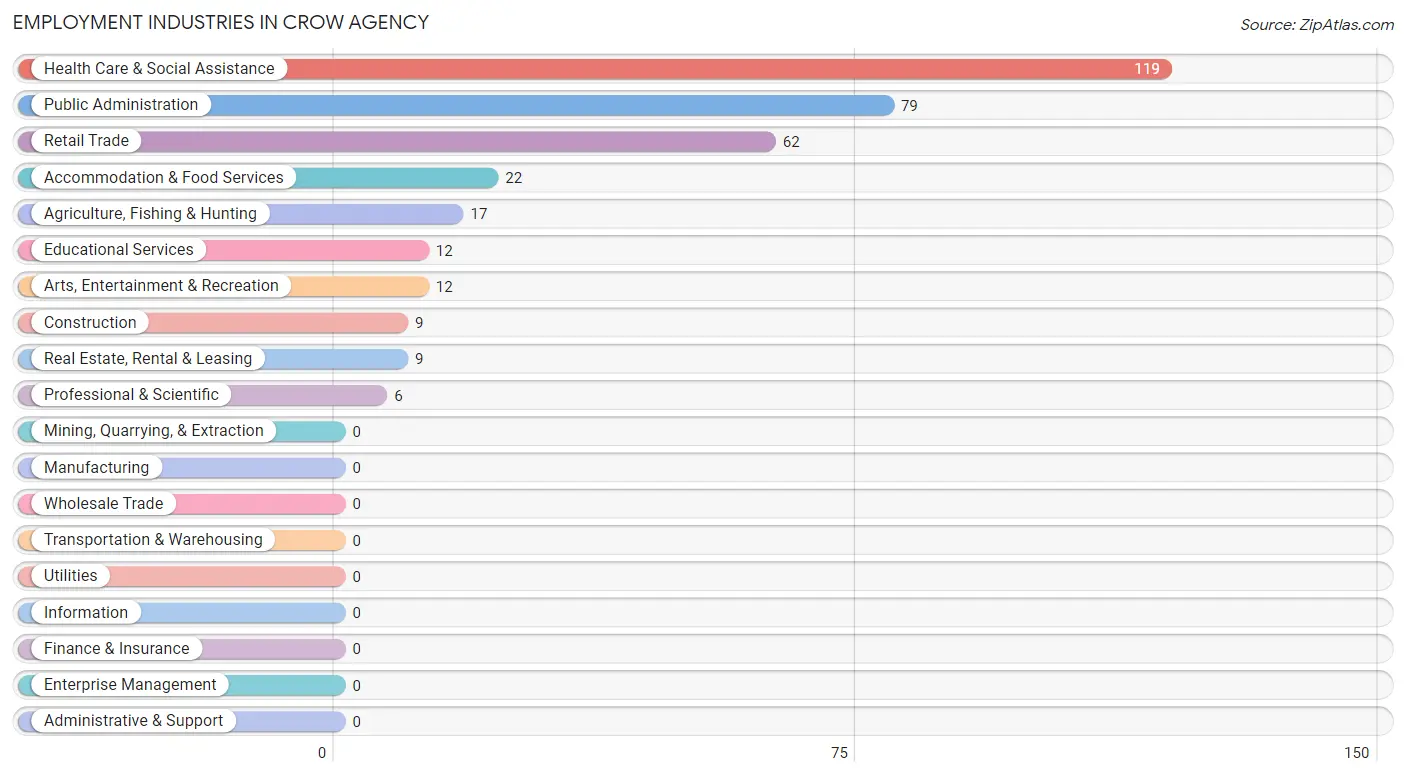
Employment Industries in Crow Agency
The major employment industries in Crow Agency include Health Care & Social Assistance (119 | 33.9%), Public Administration (79 | 22.5%), Retail Trade (62 | 17.7%), Accommodation & Food Services (22 | 6.3%), and Agriculture, Fishing & Hunting (17 | 4.8%).
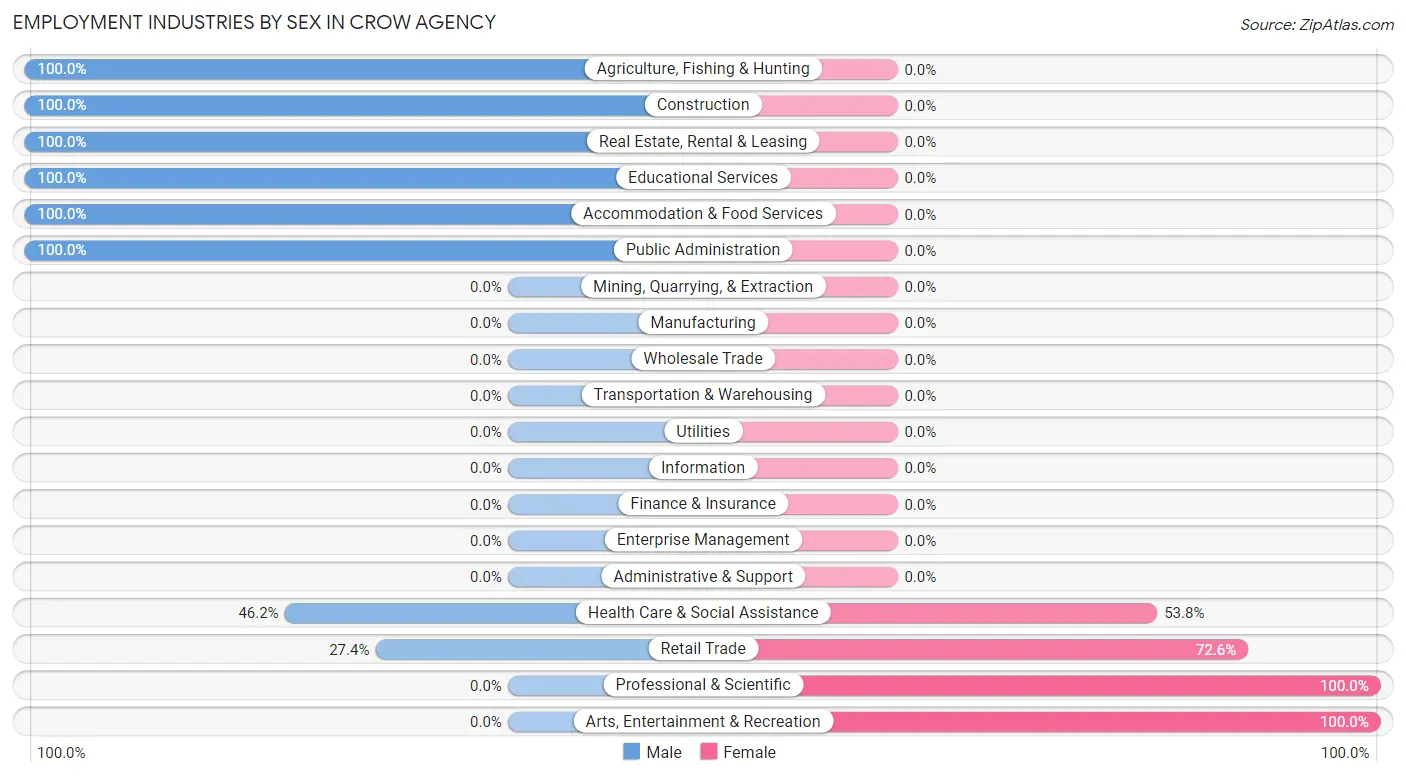
Employment Industries by Sex in Crow Agency
The Crow Agency industries that see more men than women are Agriculture, Fishing & Hunting (100.0%), Construction (100.0%), and Real Estate, Rental & Leasing (100.0%), whereas the industries that tend to have a higher number of women are Professional & Scientific (100.0%), Arts, Entertainment & Recreation (100.0%), and Retail Trade (72.6%).
| Industry | Male | Female |
| Agriculture, Fishing & Hunting | 17 (100.0%) | 0 (0.0%) |
| Mining, Quarrying, & Extraction | 0 (0.0%) | 0 (0.0%) |
| Construction | 9 (100.0%) | 0 (0.0%) |
| Manufacturing | 0 (0.0%) | 0 (0.0%) |
| Wholesale Trade | 0 (0.0%) | 0 (0.0%) |
| Retail Trade | 17 (27.4%) | 45 (72.6%) |
| Transportation & Warehousing | 0 (0.0%) | 0 (0.0%) |
| Utilities | 0 (0.0%) | 0 (0.0%) |
| Information | 0 (0.0%) | 0 (0.0%) |
| Finance & Insurance | 0 (0.0%) | 0 (0.0%) |
| Real Estate, Rental & Leasing | 9 (100.0%) | 0 (0.0%) |
| Professional & Scientific | 0 (0.0%) | 6 (100.0%) |
| Enterprise Management | 0 (0.0%) | 0 (0.0%) |
| Administrative & Support | 0 (0.0%) | 0 (0.0%) |
| Educational Services | 12 (100.0%) | 0 (0.0%) |
| Health Care & Social Assistance | 55 (46.2%) | 64 (53.8%) |
| Arts, Entertainment & Recreation | 0 (0.0%) | 12 (100.0%) |
| Accommodation & Food Services | 22 (100.0%) | 0 (0.0%) |
| Public Administration | 79 (100.0%) | 0 (0.0%) |
| Total | 224 (63.8%) | 127 (36.2%) |
Education in Crow Agency
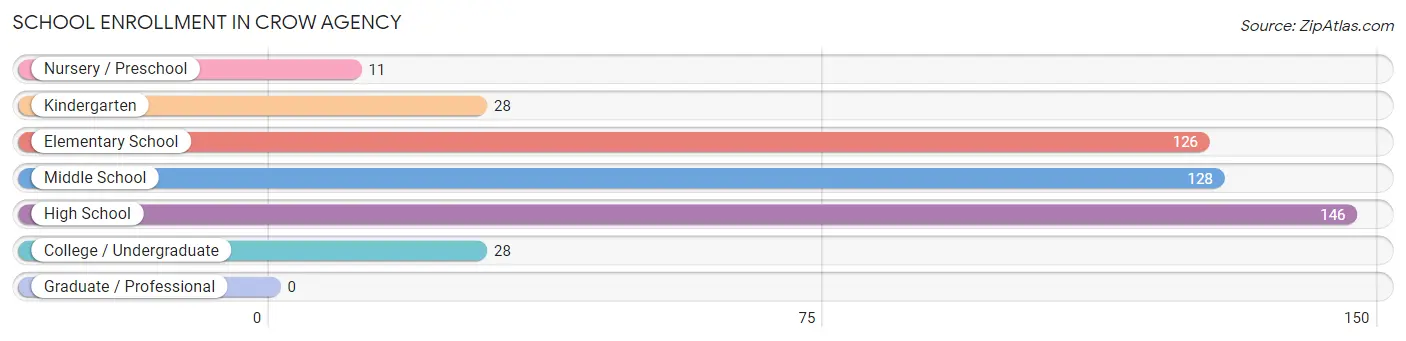
School Enrollment in Crow Agency
The most common levels of schooling among the 467 students in Crow Agency are high school (146 | 31.3%), middle school (128 | 27.4%), and elementary school (126 | 27.0%).
| School Level | # Students | % Students |
| Nursery / Preschool | 11 | 2.4% |
| Kindergarten | 28 | 6.0% |
| Elementary School | 126 | 27.0% |
| Middle School | 128 | 27.4% |
| High School | 146 | 31.3% |
| College / Undergraduate | 28 | 6.0% |
| Graduate / Professional | 0 | 0.0% |
| Total | 467 | 100.0% |
School Enrollment by Age by Funding Source in Crow Agency
Out of a total of 467 students who are enrolled in schools in Crow Agency, 73 (15.6%) attend a private institution, while the remaining 394 (84.4%) are enrolled in public schools. The age group of 5 to 9 year old has the highest likelihood of being enrolled in private schools, with 49 (34.7% in the age bracket) enrolled. Conversely, the age group of 15 to 17 year olds has the lowest likelihood of being enrolled in a private school, with 105 (100.0% in the age bracket) attending a public institution.
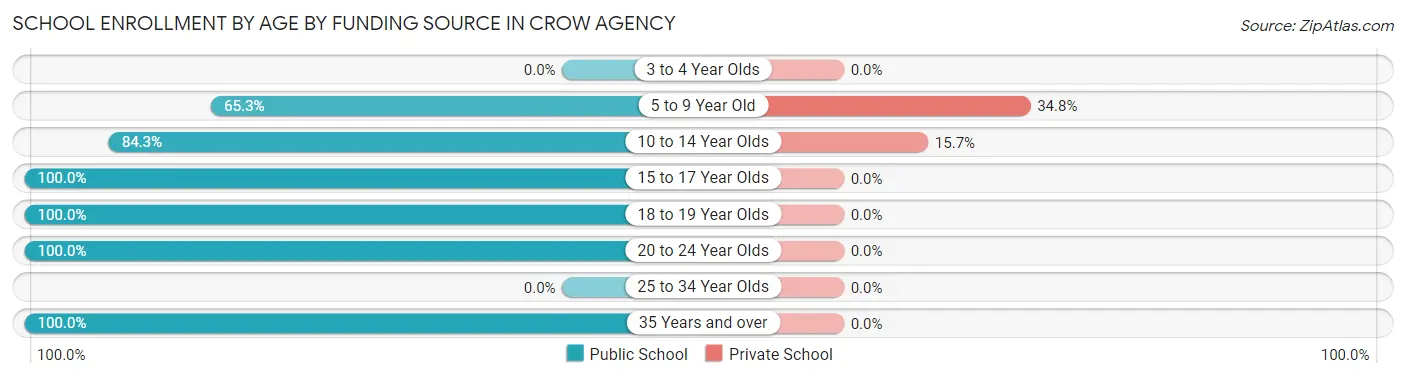
| Age Bracket | Public School | Private School |
| 3 to 4 Year Olds | 0 (0.0%) | 0 (0.0%) |
| 5 to 9 Year Old | 92 (65.2%) | 49 (34.7%) |
| 10 to 14 Year Olds | 129 (84.3%) | 24 (15.7%) |
| 15 to 17 Year Olds | 105 (100.0%) | 0 (0.0%) |
| 18 to 19 Year Olds | 40 (100.0%) | 0 (0.0%) |
| 20 to 24 Year Olds | 20 (100.0%) | 0 (0.0%) |
| 25 to 34 Year Olds | 0 (0.0%) | 0 (0.0%) |
| 35 Years and over | 8 (100.0%) | 0 (0.0%) |
| Total | 394 (84.4%) | 73 (15.6%) |
Educational Attainment by Field of Study in Crow Agency
Business (31 | 33.0%), bio, nature & agricultural (17 | 18.1%), visual & performing arts (16 | 17.0%), social sciences (9 | 9.6%), and education (8 | 8.5%) are the most common fields of study among 94 individuals in Crow Agency who have obtained a bachelor's degree or higher.
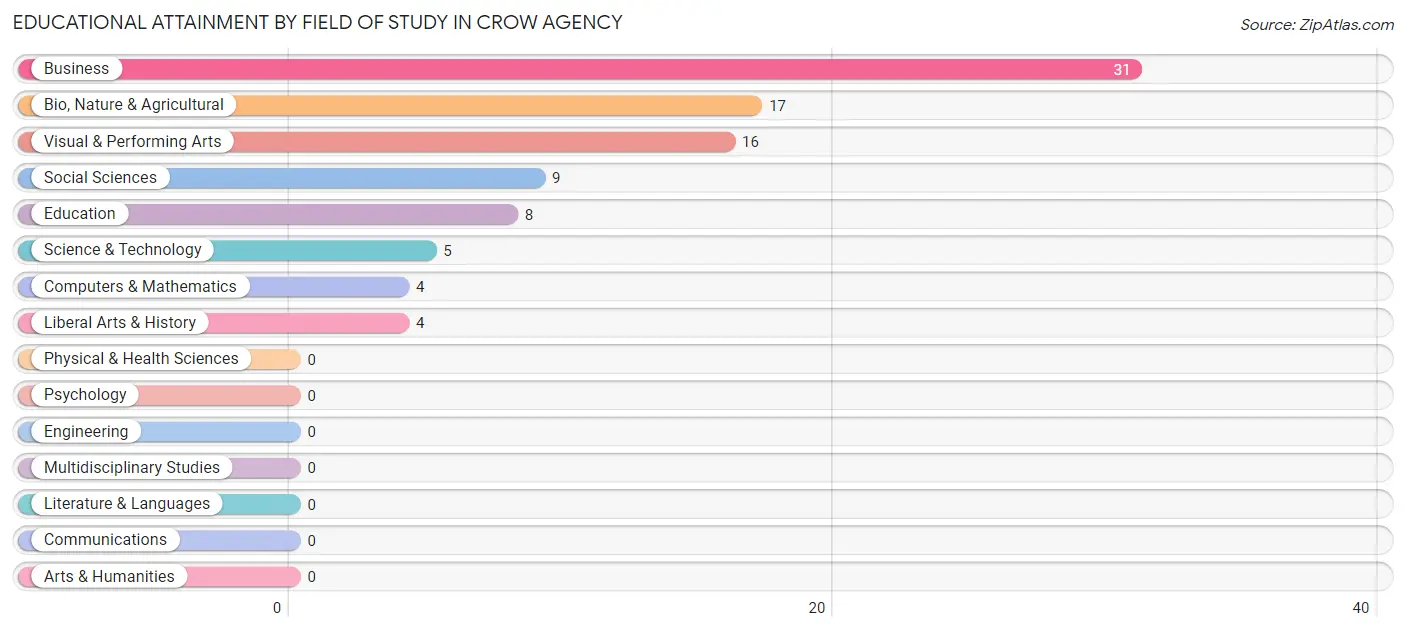
| Field of Study | # Graduates | % Graduates |
| Computers & Mathematics | 4 | 4.3% |
| Bio, Nature & Agricultural | 17 | 18.1% |
| Physical & Health Sciences | 0 | 0.0% |
| Psychology | 0 | 0.0% |
| Social Sciences | 9 | 9.6% |
| Engineering | 0 | 0.0% |
| Multidisciplinary Studies | 0 | 0.0% |
| Science & Technology | 5 | 5.3% |
| Business | 31 | 33.0% |
| Education | 8 | 8.5% |
| Literature & Languages | 0 | 0.0% |
| Liberal Arts & History | 4 | 4.3% |
| Visual & Performing Arts | 16 | 17.0% |
| Communications | 0 | 0.0% |
| Arts & Humanities | 0 | 0.0% |
| Total | 94 | 100.0% |
Transportation & Commute in Crow Agency
Vehicle Availability by Sex in Crow Agency
The most prevalent vehicle ownership categories in Crow Agency are males with 2 vehicles (89, accounting for 39.7%) and females with 2 vehicles (46, making up 70.1%).
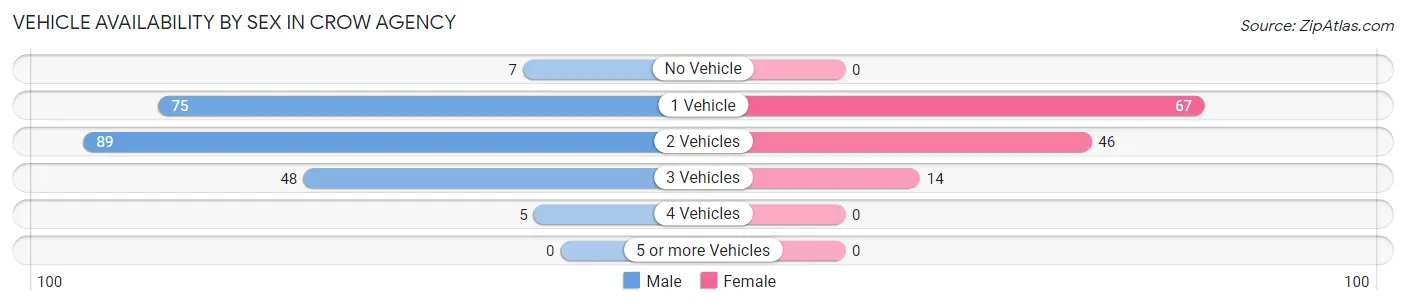
| Vehicles Available | Male | Female |
| No Vehicle | 7 (3.1%) | 0 (0.0%) |
| 1 Vehicle | 75 (33.5%) | 67 (52.8%) |
| 2 Vehicles | 89 (39.7%) | 46 (36.2%) |
| 3 Vehicles | 48 (21.4%) | 14 (11.0%) |
| 4 Vehicles | 5 (2.2%) | 0 (0.0%) |
| 5 or more Vehicles | 0 (0.0%) | 0 (0.0%) |
| Total | 224 (100.0%) | 127 (100.0%) |
Commute Time in Crow Agency
The most frequently occuring commute durations in Crow Agency are 10 to 14 minutes (92 commuters, 26.5%), less than 5 minutes (79 commuters, 22.8%), and 5 to 9 minutes (61 commuters, 17.6%).
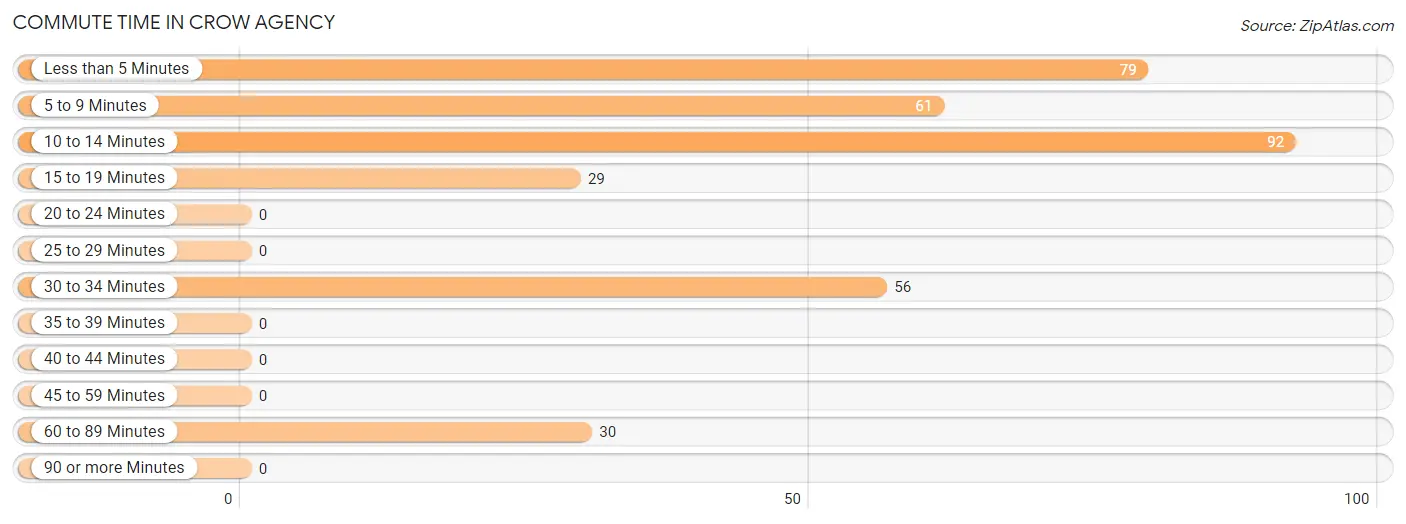
| Commute Time | # Commuters | % Commuters |
| Less than 5 Minutes | 79 | 22.8% |
| 5 to 9 Minutes | 61 | 17.6% |
| 10 to 14 Minutes | 92 | 26.5% |
| 15 to 19 Minutes | 29 | 8.4% |
| 20 to 24 Minutes | 0 | 0.0% |
| 25 to 29 Minutes | 0 | 0.0% |
| 30 to 34 Minutes | 56 | 16.1% |
| 35 to 39 Minutes | 0 | 0.0% |
| 40 to 44 Minutes | 0 | 0.0% |
| 45 to 59 Minutes | 0 | 0.0% |
| 60 to 89 Minutes | 30 | 8.6% |
| 90 or more Minutes | 0 | 0.0% |
Commute Time by Sex in Crow Agency
The most common commute times in Crow Agency are less than 5 minutes (79 commuters, 35.9%) for males and 5 to 9 minutes (41 commuters, 32.3%) for females.
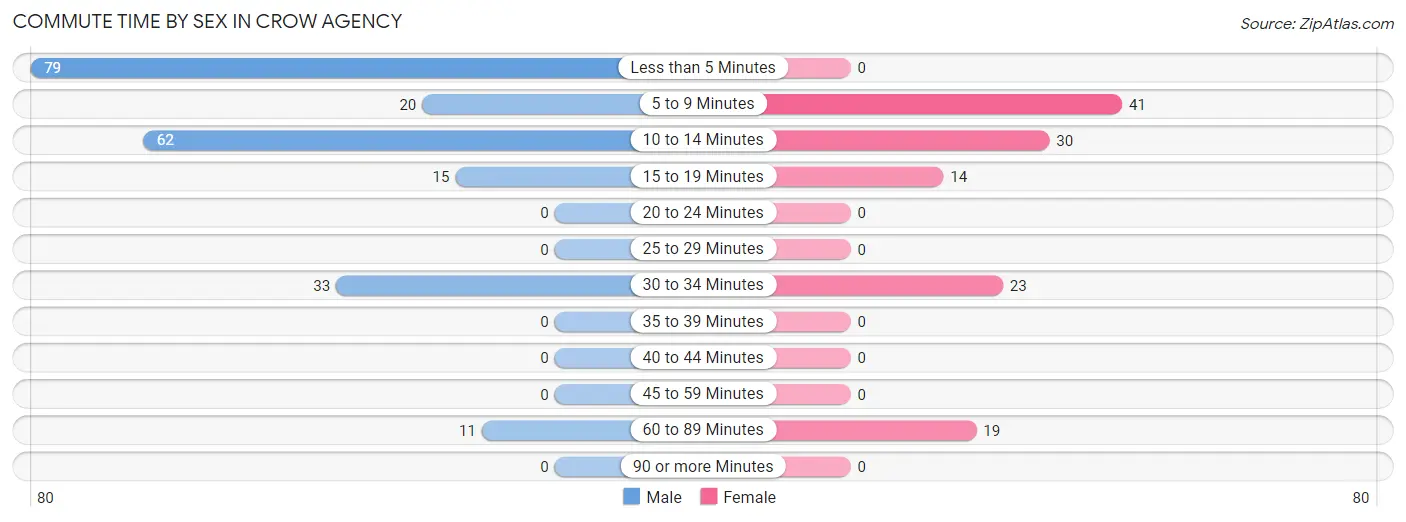
| Commute Time | Male | Female |
| Less than 5 Minutes | 79 (35.9%) | 0 (0.0%) |
| 5 to 9 Minutes | 20 (9.1%) | 41 (32.3%) |
| 10 to 14 Minutes | 62 (28.2%) | 30 (23.6%) |
| 15 to 19 Minutes | 15 (6.8%) | 14 (11.0%) |
| 20 to 24 Minutes | 0 (0.0%) | 0 (0.0%) |
| 25 to 29 Minutes | 0 (0.0%) | 0 (0.0%) |
| 30 to 34 Minutes | 33 (15.0%) | 23 (18.1%) |
| 35 to 39 Minutes | 0 (0.0%) | 0 (0.0%) |
| 40 to 44 Minutes | 0 (0.0%) | 0 (0.0%) |
| 45 to 59 Minutes | 0 (0.0%) | 0 (0.0%) |
| 60 to 89 Minutes | 11 (5.0%) | 19 (15.0%) |
| 90 or more Minutes | 0 (0.0%) | 0 (0.0%) |
Time of Departure to Work by Sex in Crow Agency
The most frequent times of departure to work in Crow Agency are 7:30 AM to 7:59 AM (59, 26.8%) for males and 8:00 AM to 8:29 AM (31, 24.4%) for females.
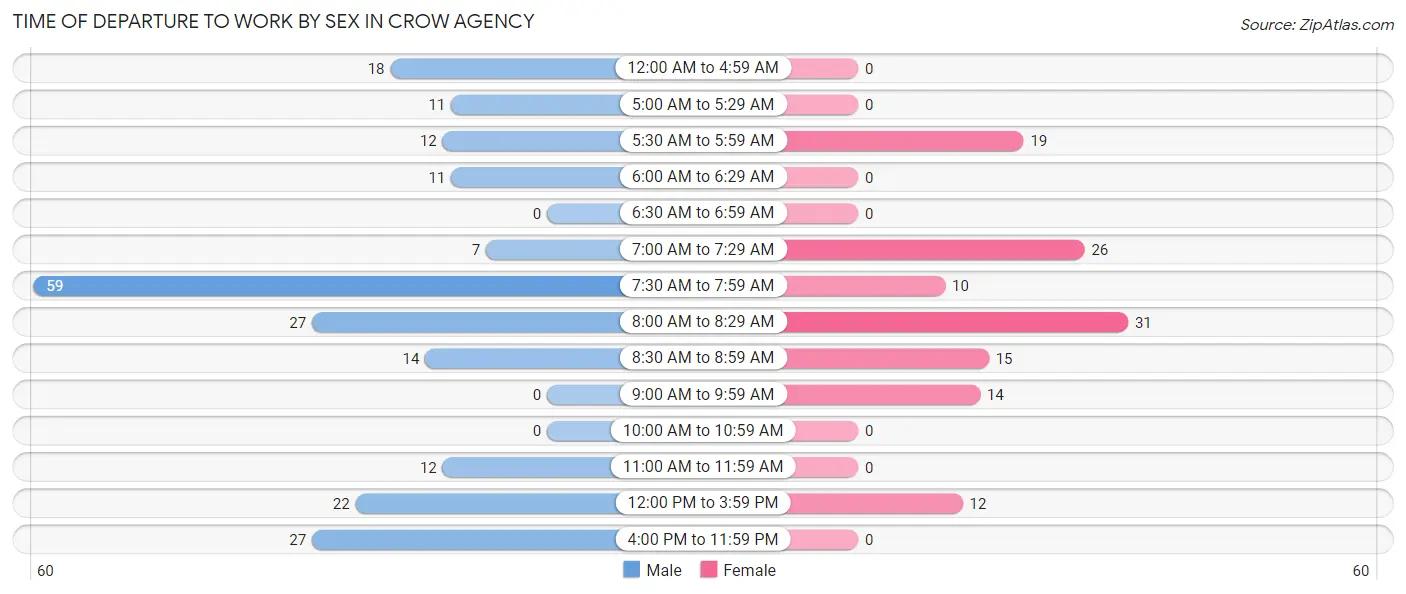
| Time of Departure | Male | Female |
| 12:00 AM to 4:59 AM | 18 (8.2%) | 0 (0.0%) |
| 5:00 AM to 5:29 AM | 11 (5.0%) | 0 (0.0%) |
| 5:30 AM to 5:59 AM | 12 (5.4%) | 19 (15.0%) |
| 6:00 AM to 6:29 AM | 11 (5.0%) | 0 (0.0%) |
| 6:30 AM to 6:59 AM | 0 (0.0%) | 0 (0.0%) |
| 7:00 AM to 7:29 AM | 7 (3.2%) | 26 (20.5%) |
| 7:30 AM to 7:59 AM | 59 (26.8%) | 10 (7.9%) |
| 8:00 AM to 8:29 AM | 27 (12.3%) | 31 (24.4%) |
| 8:30 AM to 8:59 AM | 14 (6.4%) | 15 (11.8%) |
| 9:00 AM to 9:59 AM | 0 (0.0%) | 14 (11.0%) |
| 10:00 AM to 10:59 AM | 0 (0.0%) | 0 (0.0%) |
| 11:00 AM to 11:59 AM | 12 (5.4%) | 0 (0.0%) |
| 12:00 PM to 3:59 PM | 22 (10.0%) | 12 (9.5%) |
| 4:00 PM to 11:59 PM | 27 (12.3%) | 0 (0.0%) |
| Total | 220 (100.0%) | 127 (100.0%) |
Housing Occupancy in Crow Agency
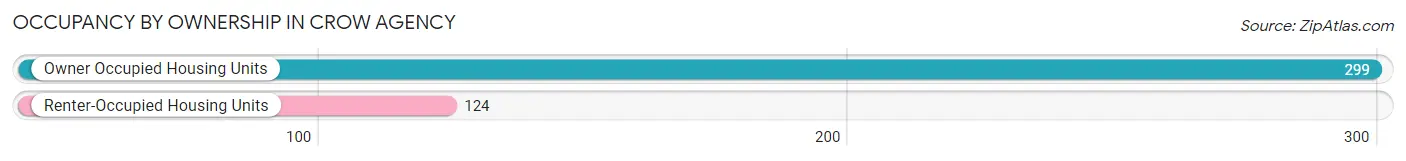
Occupancy by Ownership in Crow Agency
Of the total 423 dwellings in Crow Agency, owner-occupied units account for 299 (70.7%), while renter-occupied units make up 124 (29.3%).
| Occupancy | # Housing Units | % Housing Units |
| Owner Occupied Housing Units | 299 | 70.7% |
| Renter-Occupied Housing Units | 124 | 29.3% |
| Total Occupied Housing Units | 423 | 100.0% |
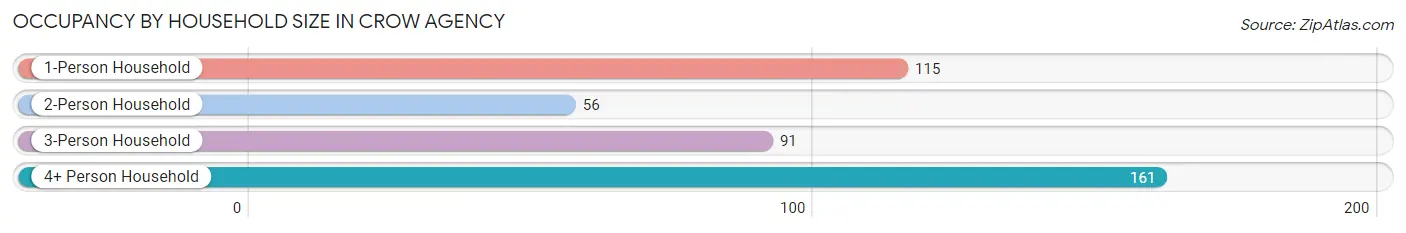
Occupancy by Household Size in Crow Agency
| Household Size | # Housing Units | % Housing Units |
| 1-Person Household | 115 | 27.2% |
| 2-Person Household | 56 | 13.2% |
| 3-Person Household | 91 | 21.5% |
| 4+ Person Household | 161 | 38.1% |
| Total Housing Units | 423 | 100.0% |
Occupancy by Ownership by Household Size in Crow Agency
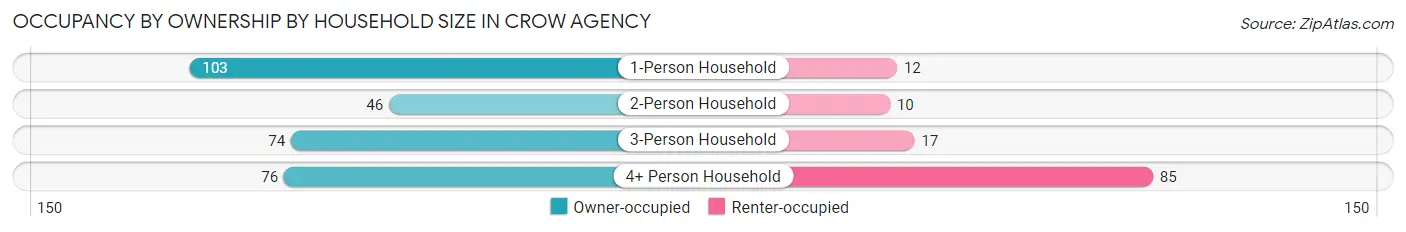
| Household Size | Owner-occupied | Renter-occupied |
| 1-Person Household | 103 (89.6%) | 12 (10.4%) |
| 2-Person Household | 46 (82.1%) | 10 (17.9%) |
| 3-Person Household | 74 (81.3%) | 17 (18.7%) |
| 4+ Person Household | 76 (47.2%) | 85 (52.8%) |
| Total Housing Units | 299 (70.7%) | 124 (29.3%) |
Occupancy by Educational Attainment in Crow Agency
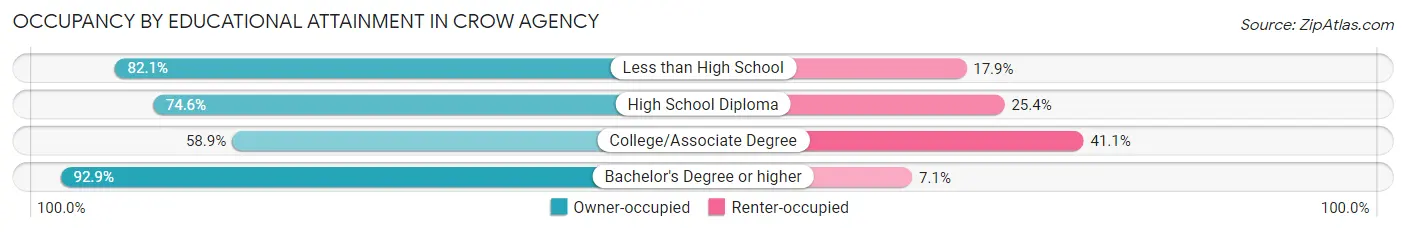
| Household Size | Owner-occupied | Renter-occupied |
| Less than High School | 46 (82.1%) | 10 (17.9%) |
| High School Diploma | 85 (74.6%) | 29 (25.4%) |
| College/Associate Degree | 116 (58.9%) | 81 (41.1%) |
| Bachelor's Degree or higher | 52 (92.9%) | 4 (7.1%) |
Occupancy by Age of Householder in Crow Agency
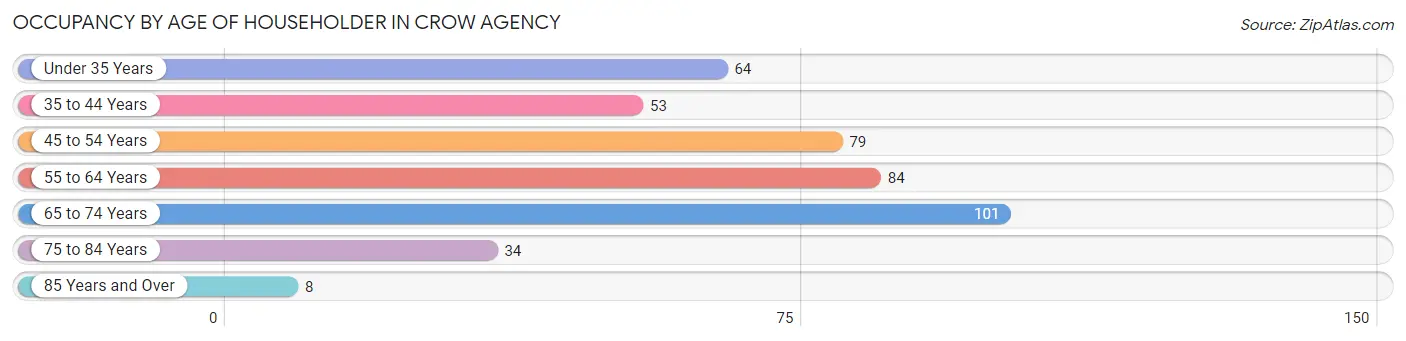
| Age Bracket | # Households | % Households |
| Under 35 Years | 64 | 15.1% |
| 35 to 44 Years | 53 | 12.5% |
| 45 to 54 Years | 79 | 18.7% |
| 55 to 64 Years | 84 | 19.9% |
| 65 to 74 Years | 101 | 23.9% |
| 75 to 84 Years | 34 | 8.0% |
| 85 Years and Over | 8 | 1.9% |
| Total | 423 | 100.0% |
Housing Finances in Crow Agency
Median Income by Occupancy in Crow Agency
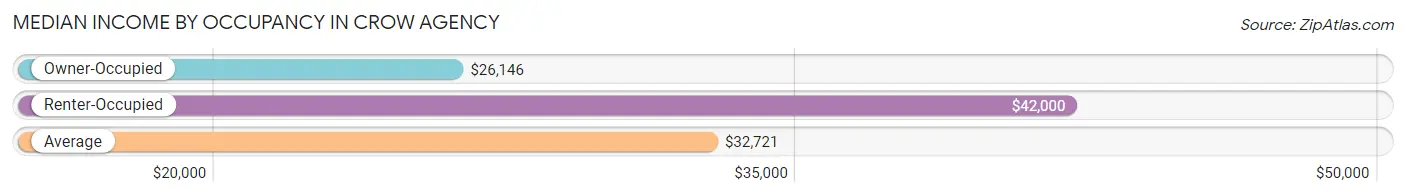
| Occupancy Type | # Households | Median Income |
| Owner-Occupied | 299 (70.7%) | $26,146 |
| Renter-Occupied | 124 (29.3%) | $42,000 |
| Average | 423 (100.0%) | $32,721 |
Occupancy by Householder Income Bracket in Crow Agency
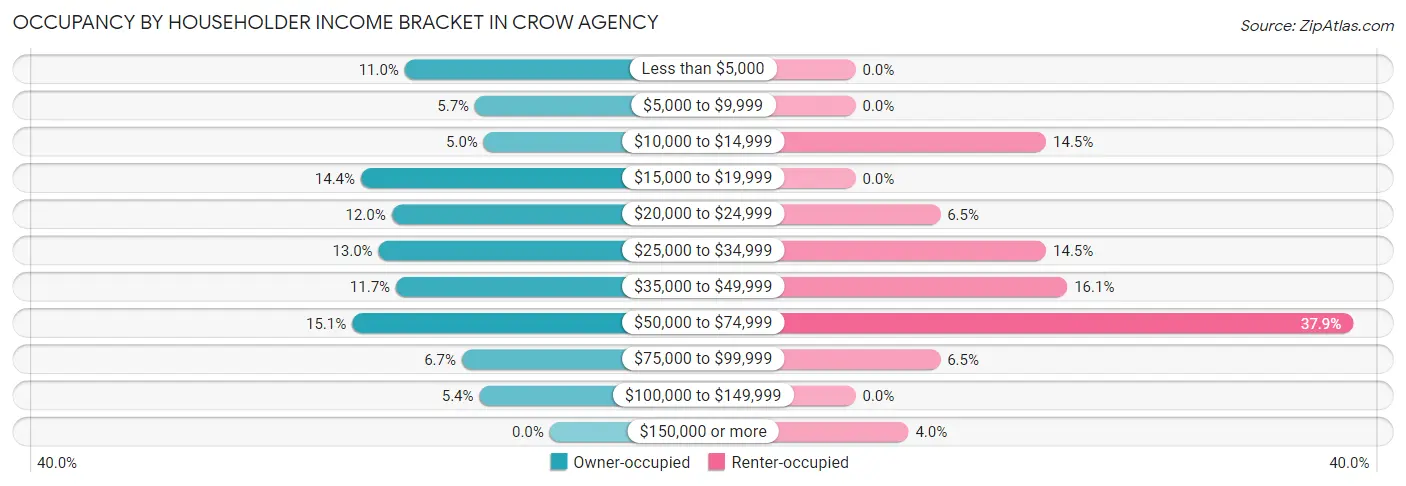
| Income Bracket | Owner-occupied | Renter-occupied |
| Less than $5,000 | 33 (11.0%) | 0 (0.0%) |
| $5,000 to $9,999 | 17 (5.7%) | 0 (0.0%) |
| $10,000 to $14,999 | 15 (5.0%) | 18 (14.5%) |
| $15,000 to $19,999 | 43 (14.4%) | 0 (0.0%) |
| $20,000 to $24,999 | 36 (12.0%) | 8 (6.5%) |
| $25,000 to $34,999 | 39 (13.0%) | 18 (14.5%) |
| $35,000 to $49,999 | 35 (11.7%) | 20 (16.1%) |
| $50,000 to $74,999 | 45 (15.0%) | 47 (37.9%) |
| $75,000 to $99,999 | 20 (6.7%) | 8 (6.5%) |
| $100,000 to $149,999 | 16 (5.3%) | 0 (0.0%) |
| $150,000 or more | 0 (0.0%) | 5 (4.0%) |
| Total | 299 (100.0%) | 124 (100.0%) |
Monthly Housing Cost Tiers in Crow Agency
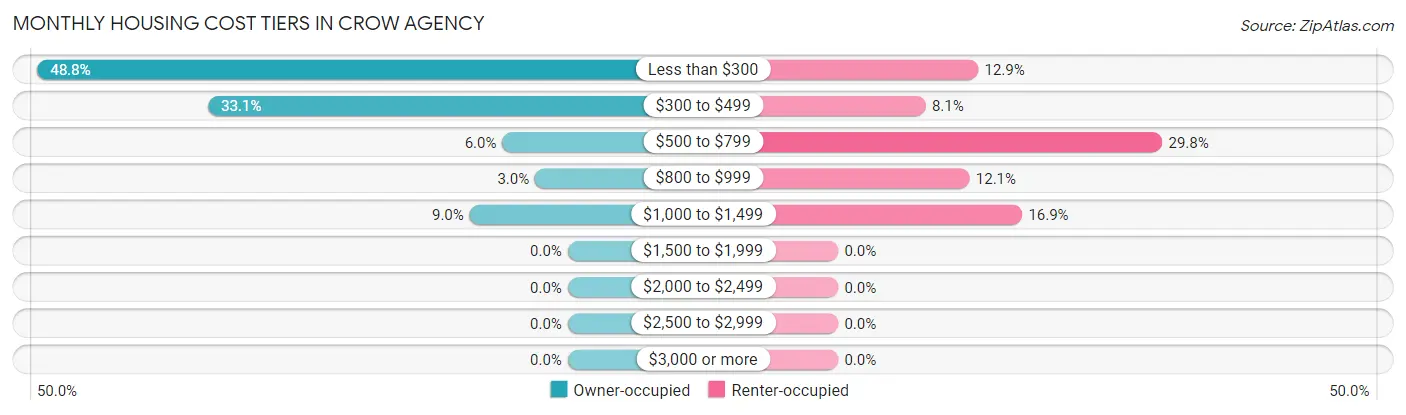
| Monthly Cost | Owner-occupied | Renter-occupied |
| Less than $300 | 146 (48.8%) | 16 (12.9%) |
| $300 to $499 | 99 (33.1%) | 10 (8.1%) |
| $500 to $799 | 18 (6.0%) | 37 (29.8%) |
| $800 to $999 | 9 (3.0%) | 15 (12.1%) |
| $1,000 to $1,499 | 27 (9.0%) | 21 (16.9%) |
| $1,500 to $1,999 | 0 (0.0%) | 0 (0.0%) |
| $2,000 to $2,499 | 0 (0.0%) | 0 (0.0%) |
| $2,500 to $2,999 | 0 (0.0%) | 0 (0.0%) |
| $3,000 or more | 0 (0.0%) | 0 (0.0%) |
| Total | 299 (100.0%) | 124 (100.0%) |
Physical Housing Characteristics in Crow Agency
Housing Structures in Crow Agency
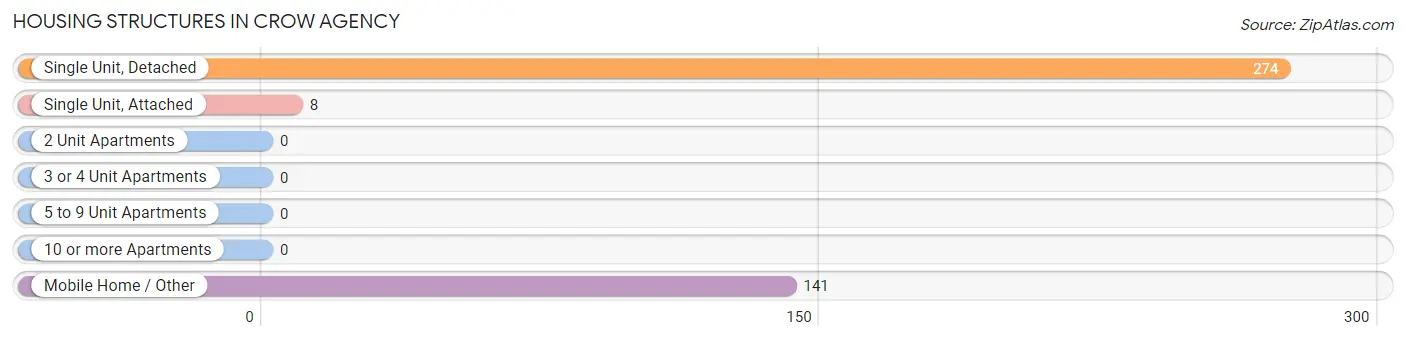
| Structure Type | # Housing Units | % Housing Units |
| Single Unit, Detached | 274 | 64.8% |
| Single Unit, Attached | 8 | 1.9% |
| 2 Unit Apartments | 0 | 0.0% |
| 3 or 4 Unit Apartments | 0 | 0.0% |
| 5 to 9 Unit Apartments | 0 | 0.0% |
| 10 or more Apartments | 0 | 0.0% |
| Mobile Home / Other | 141 | 33.3% |
| Total | 423 | 100.0% |
Housing Structures by Occupancy in Crow Agency
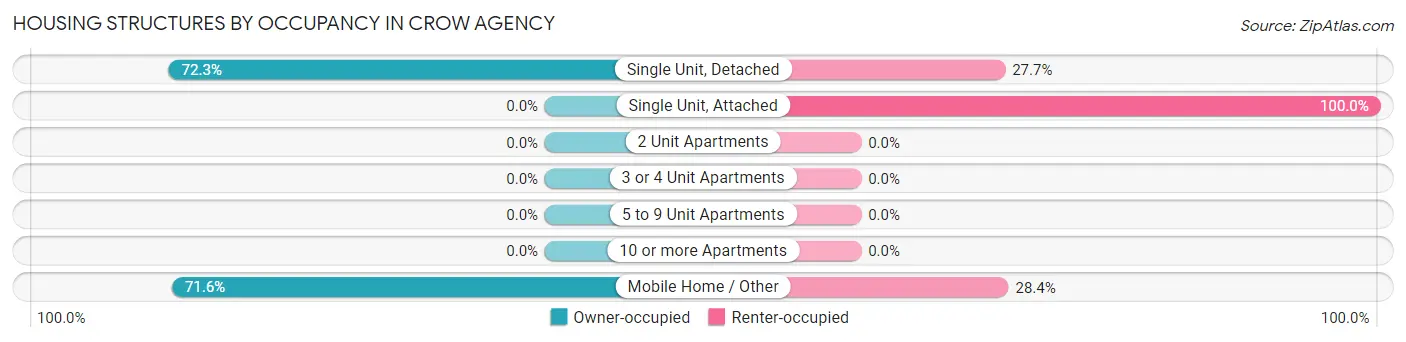
| Structure Type | Owner-occupied | Renter-occupied |
| Single Unit, Detached | 198 (72.3%) | 76 (27.7%) |
| Single Unit, Attached | 0 (0.0%) | 8 (100.0%) |
| 2 Unit Apartments | 0 (0.0%) | 0 (0.0%) |
| 3 or 4 Unit Apartments | 0 (0.0%) | 0 (0.0%) |
| 5 to 9 Unit Apartments | 0 (0.0%) | 0 (0.0%) |
| 10 or more Apartments | 0 (0.0%) | 0 (0.0%) |
| Mobile Home / Other | 101 (71.6%) | 40 (28.4%) |
| Total | 299 (70.7%) | 124 (29.3%) |
Housing Structures by Number of Rooms in Crow Agency
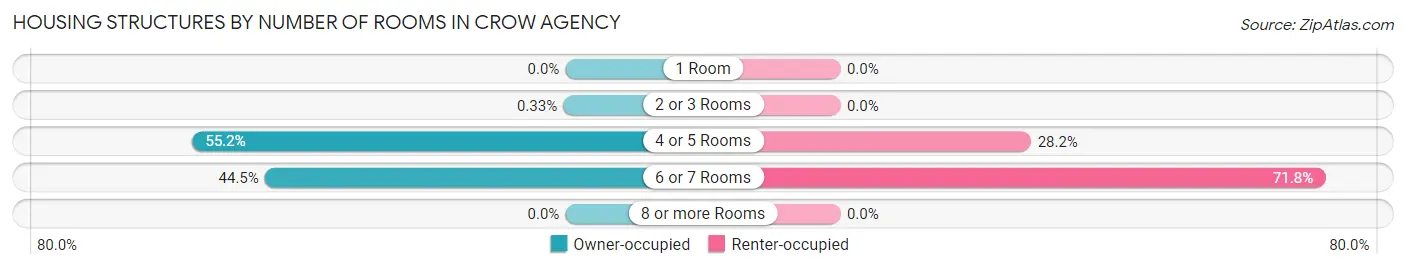
| Number of Rooms | Owner-occupied | Renter-occupied |
| 1 Room | 0 (0.0%) | 0 (0.0%) |
| 2 or 3 Rooms | 1 (0.3%) | 0 (0.0%) |
| 4 or 5 Rooms | 165 (55.2%) | 35 (28.2%) |
| 6 or 7 Rooms | 133 (44.5%) | 89 (71.8%) |
| 8 or more Rooms | 0 (0.0%) | 0 (0.0%) |
| Total | 299 (100.0%) | 124 (100.0%) |
Housing Structure by Heating Type in Crow Agency
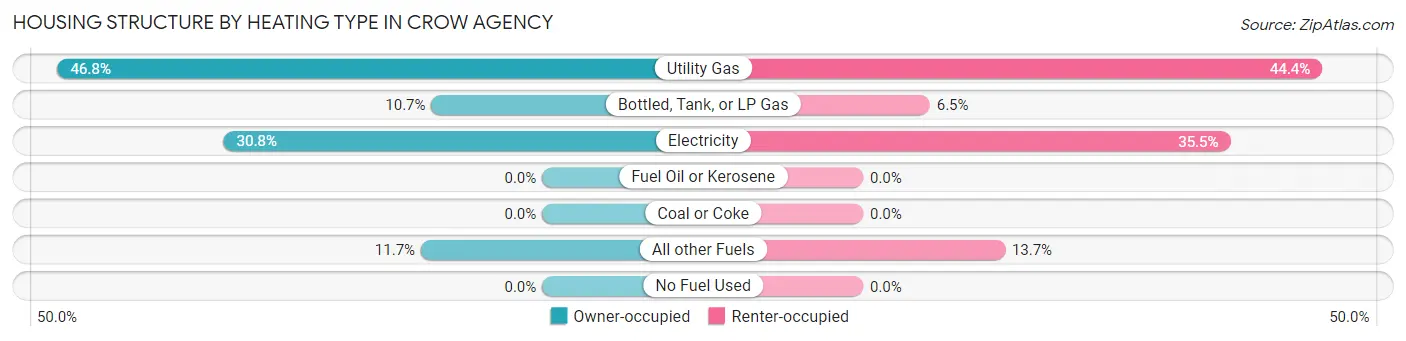
| Heating Type | Owner-occupied | Renter-occupied |
| Utility Gas | 140 (46.8%) | 55 (44.4%) |
| Bottled, Tank, or LP Gas | 32 (10.7%) | 8 (6.5%) |
| Electricity | 92 (30.8%) | 44 (35.5%) |
| Fuel Oil or Kerosene | 0 (0.0%) | 0 (0.0%) |
| Coal or Coke | 0 (0.0%) | 0 (0.0%) |
| All other Fuels | 35 (11.7%) | 17 (13.7%) |
| No Fuel Used | 0 (0.0%) | 0 (0.0%) |
| Total | 299 (100.0%) | 124 (100.0%) |
Household Vehicle Usage in Crow Agency
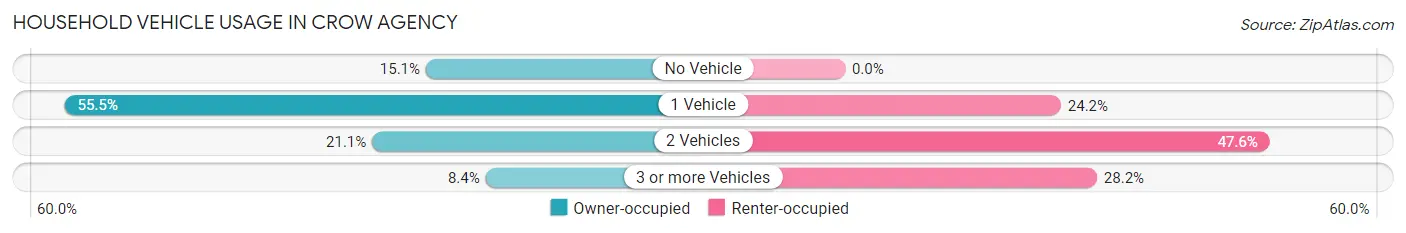
| Vehicles per Household | Owner-occupied | Renter-occupied |
| No Vehicle | 45 (15.0%) | 0 (0.0%) |
| 1 Vehicle | 166 (55.5%) | 30 (24.2%) |
| 2 Vehicles | 63 (21.1%) | 59 (47.6%) |
| 3 or more Vehicles | 25 (8.4%) | 35 (28.2%) |
| Total | 299 (100.0%) | 124 (100.0%) |
Real Estate & Mortgages in Crow Agency
Real Estate and Mortgage Overview in Crow Agency
| Characteristic | Without Mortgage | With Mortgage |
| Housing Units | 258 | 41 |
| Median Property Value | $83,800 | $158,600 |
| Median Household Income | $30,833 | $0 |
| Monthly Housing Costs | $284 | $0 |
| Real Estate Taxes | $199 | $14 |
Property Value by Mortgage Status in Crow Agency
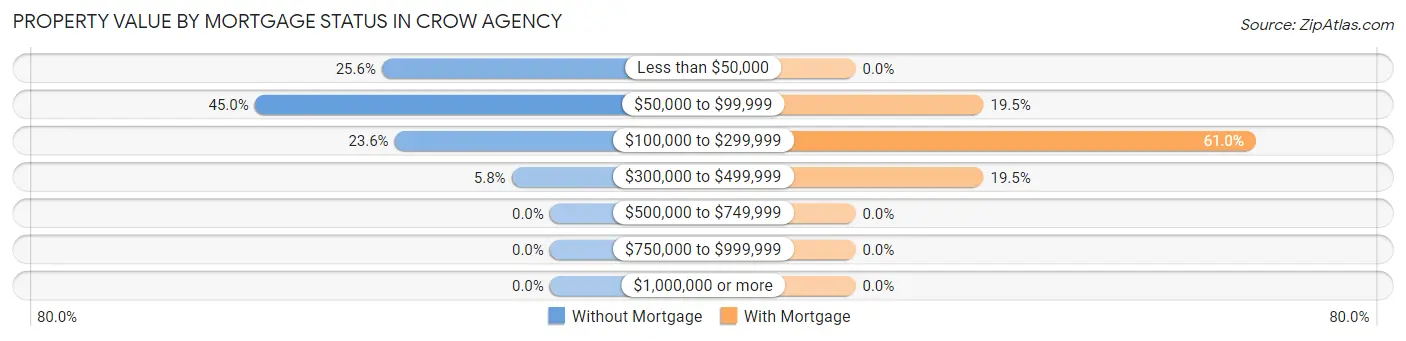
| Property Value | Without Mortgage | With Mortgage |
| Less than $50,000 | 66 (25.6%) | 0 (0.0%) |
| $50,000 to $99,999 | 116 (45.0%) | 8 (19.5%) |
| $100,000 to $299,999 | 61 (23.6%) | 25 (61.0%) |
| $300,000 to $499,999 | 15 (5.8%) | 8 (19.5%) |
| $500,000 to $749,999 | 0 (0.0%) | 0 (0.0%) |
| $750,000 to $999,999 | 0 (0.0%) | 0 (0.0%) |
| $1,000,000 or more | 0 (0.0%) | 0 (0.0%) |
| Total | 258 (100.0%) | 41 (100.0%) |
Household Income by Mortgage Status in Crow Agency
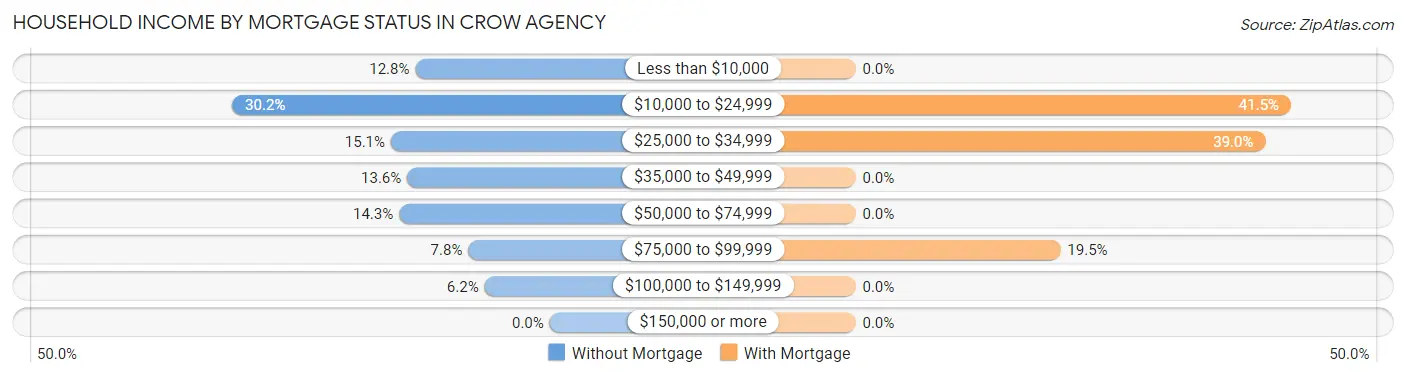
| Household Income | Without Mortgage | With Mortgage |
| Less than $10,000 | 33 (12.8%) | 0 (0.0%) |
| $10,000 to $24,999 | 78 (30.2%) | 17 (41.5%) |
| $25,000 to $34,999 | 39 (15.1%) | 16 (39.0%) |
| $35,000 to $49,999 | 35 (13.6%) | 0 (0.0%) |
| $50,000 to $74,999 | 37 (14.3%) | 0 (0.0%) |
| $75,000 to $99,999 | 20 (7.7%) | 8 (19.5%) |
| $100,000 to $149,999 | 16 (6.2%) | 0 (0.0%) |
| $150,000 or more | 0 (0.0%) | 0 (0.0%) |
| Total | 258 (100.0%) | 41 (100.0%) |
Property Value to Household Income Ratio in Crow Agency
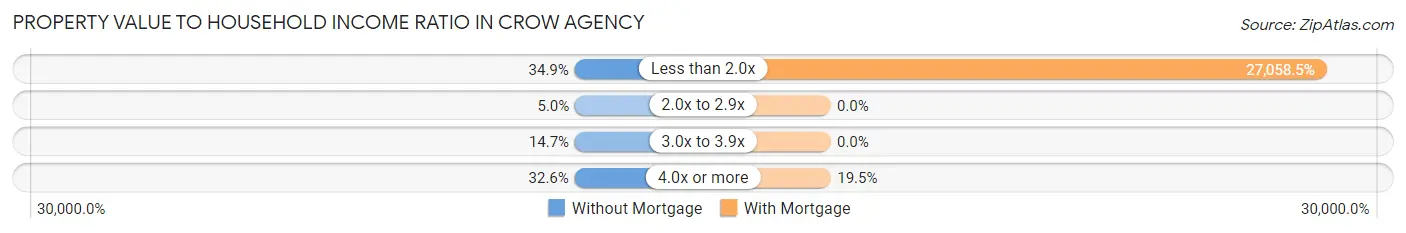
| Value-to-Income Ratio | Without Mortgage | With Mortgage |
| Less than 2.0x | 90 (34.9%) | 11,094 (27,058.5%) |
| 2.0x to 2.9x | 13 (5.0%) | 0 (0.0%) |
| 3.0x to 3.9x | 38 (14.7%) | 0 (0.0%) |
| 4.0x or more | 84 (32.6%) | 8 (19.5%) |
| Total | 258 (100.0%) | 41 (100.0%) |
Real Estate Taxes by Mortgage Status in Crow Agency
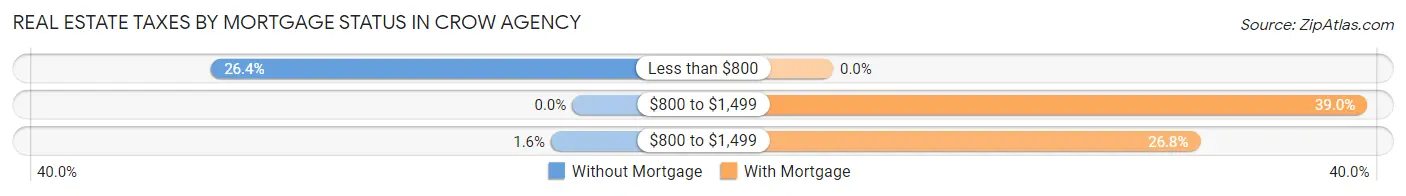
| Property Taxes | Without Mortgage | With Mortgage |
| Less than $800 | 68 (26.4%) | 0 (0.0%) |
| $800 to $1,499 | 0 (0.0%) | 16 (39.0%) |
| $800 to $1,499 | 4 (1.5%) | 11 (26.8%) |
| Total | 258 (100.0%) | 41 (100.0%) |
Health & Disability in Crow Agency
Health Insurance Coverage by Age in Crow Agency
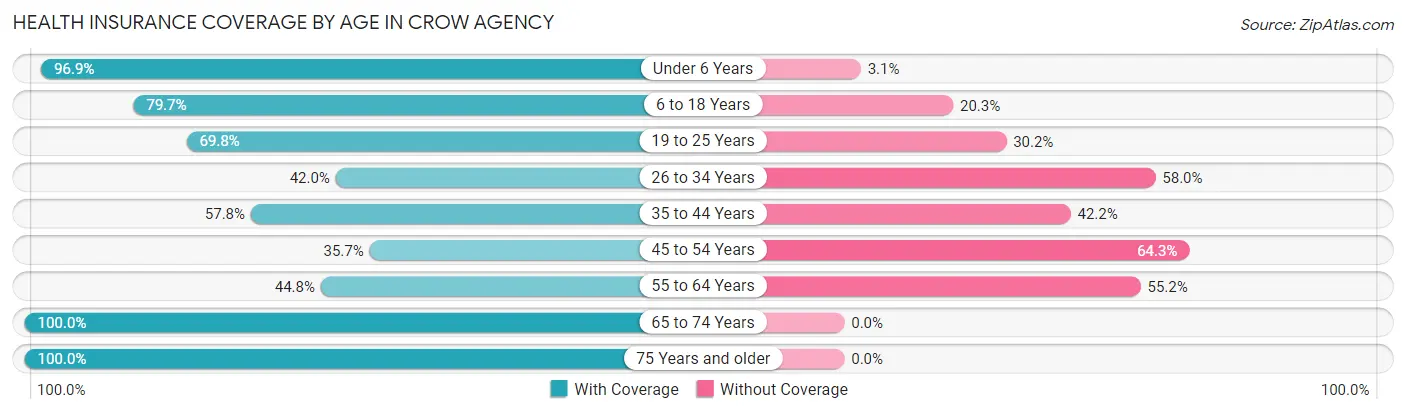
| Age Bracket | With Coverage | Without Coverage |
| Under 6 Years | 348 (96.9%) | 11 (3.1%) |
| 6 to 18 Years | 342 (79.7%) | 87 (20.3%) |
| 19 to 25 Years | 148 (69.8%) | 64 (30.2%) |
| 26 to 34 Years | 97 (42.0%) | 134 (58.0%) |
| 35 to 44 Years | 111 (57.8%) | 81 (42.2%) |
| 45 to 54 Years | 71 (35.7%) | 128 (64.3%) |
| 55 to 64 Years | 64 (44.8%) | 79 (55.2%) |
| 65 to 74 Years | 115 (100.0%) | 0 (0.0%) |
| 75 Years and older | 64 (100.0%) | 0 (0.0%) |
| Total | 1,360 (70.0%) | 584 (30.0%) |
Health Insurance Coverage by Citizenship Status in Crow Agency
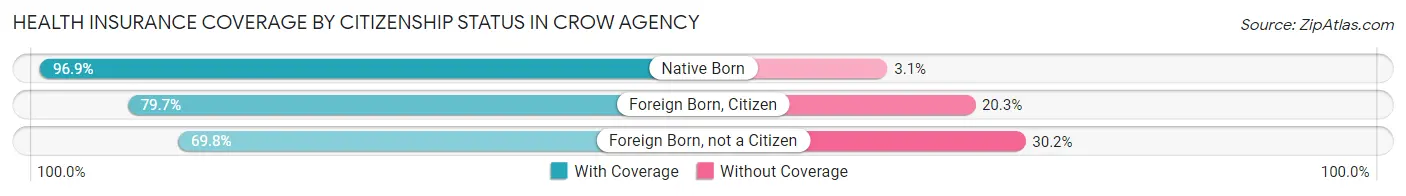
| Citizenship Status | With Coverage | Without Coverage |
| Native Born | 348 (96.9%) | 11 (3.1%) |
| Foreign Born, Citizen | 342 (79.7%) | 87 (20.3%) |
| Foreign Born, not a Citizen | 148 (69.8%) | 64 (30.2%) |
Health Insurance Coverage by Household Income in Crow Agency
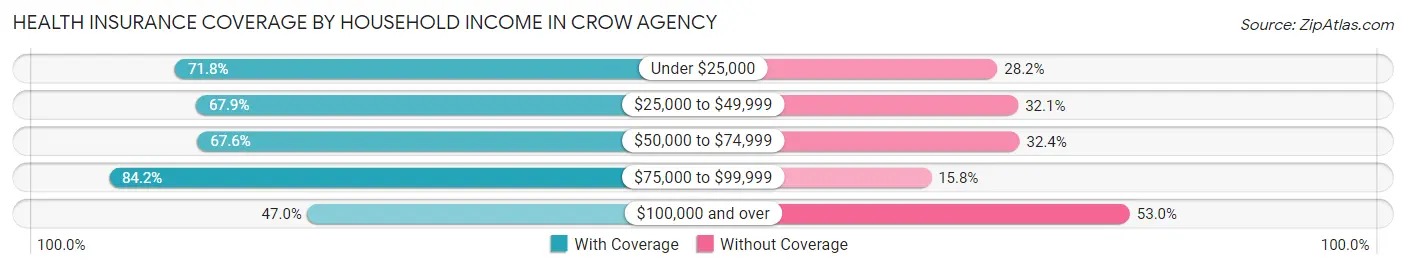
| Household Income | With Coverage | Without Coverage |
| Under $25,000 | 504 (71.8%) | 198 (28.2%) |
| $25,000 to $49,999 | 391 (67.9%) | 185 (32.1%) |
| $50,000 to $74,999 | 190 (67.6%) | 91 (32.4%) |
| $75,000 to $99,999 | 213 (84.2%) | 40 (15.8%) |
| $100,000 and over | 62 (47.0%) | 70 (53.0%) |
Public vs Private Health Insurance Coverage by Age in Crow Agency
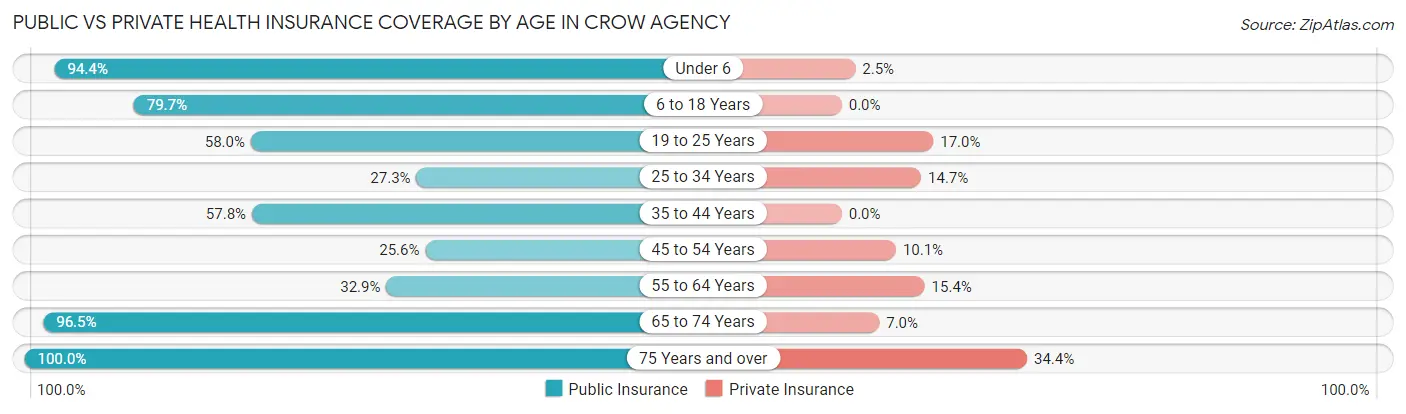
| Age Bracket | Public Insurance | Private Insurance |
| Under 6 | 339 (94.4%) | 9 (2.5%) |
| 6 to 18 Years | 342 (79.7%) | 0 (0.0%) |
| 19 to 25 Years | 123 (58.0%) | 36 (17.0%) |
| 25 to 34 Years | 63 (27.3%) | 34 (14.7%) |
| 35 to 44 Years | 111 (57.8%) | 0 (0.0%) |
| 45 to 54 Years | 51 (25.6%) | 20 (10.1%) |
| 55 to 64 Years | 47 (32.9%) | 22 (15.4%) |
| 65 to 74 Years | 111 (96.5%) | 8 (7.0%) |
| 75 Years and over | 64 (100.0%) | 22 (34.4%) |
| Total | 1,251 (64.3%) | 151 (7.8%) |
Disability Status by Sex by Age in Crow Agency
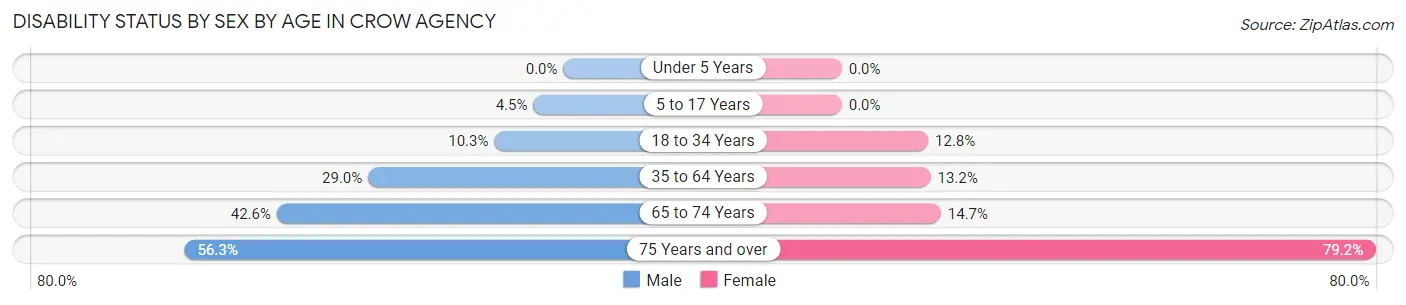
| Age Bracket | Male | Female |
| Under 5 Years | 0 (0.0%) | 0 (0.0%) |
| 5 to 17 Years | 15 (4.5%) | 0 (0.0%) |
| 18 to 34 Years | 20 (10.3%) | 35 (12.8%) |
| 35 to 64 Years | 80 (29.0%) | 34 (13.2%) |
| 65 to 74 Years | 20 (42.5%) | 10 (14.7%) |
| 75 Years and over | 9 (56.2%) | 38 (79.2%) |
Disability Class by Sex by Age in Crow Agency
Disability Class: Hearing Difficulty
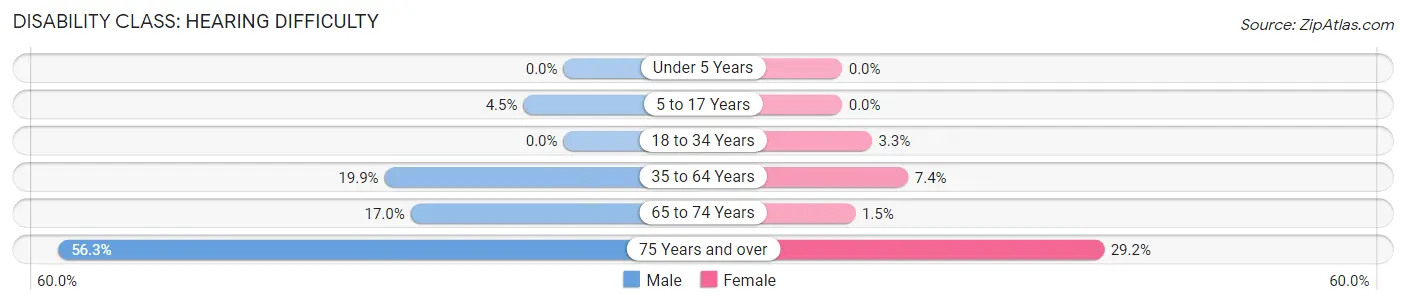
| Age Bracket | Male | Female |
| Under 5 Years | 0 (0.0%) | 0 (0.0%) |
| 5 to 17 Years | 15 (4.5%) | 0 (0.0%) |
| 18 to 34 Years | 0 (0.0%) | 9 (3.3%) |
| 35 to 64 Years | 55 (19.9%) | 19 (7.4%) |
| 65 to 74 Years | 8 (17.0%) | 1 (1.5%) |
| 75 Years and over | 9 (56.2%) | 14 (29.2%) |
Disability Class: Vision Difficulty
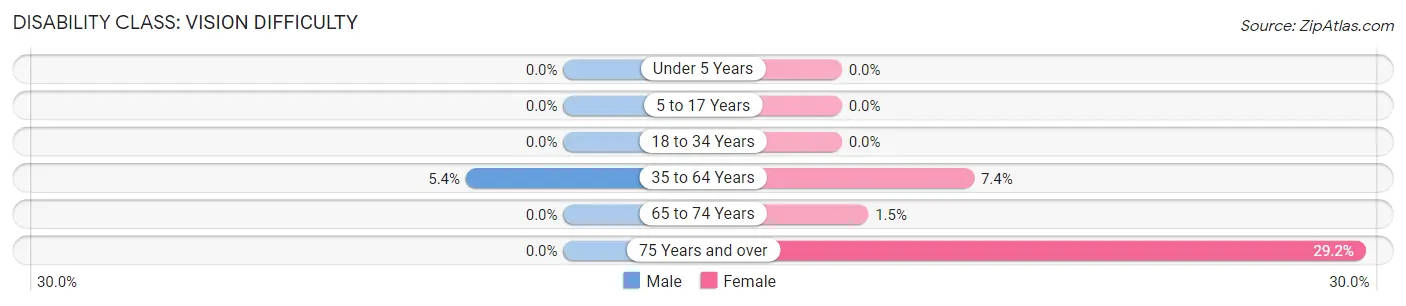
| Age Bracket | Male | Female |
| Under 5 Years | 0 (0.0%) | 0 (0.0%) |
| 5 to 17 Years | 0 (0.0%) | 0 (0.0%) |
| 18 to 34 Years | 0 (0.0%) | 0 (0.0%) |
| 35 to 64 Years | 15 (5.4%) | 19 (7.4%) |
| 65 to 74 Years | 0 (0.0%) | 1 (1.5%) |
| 75 Years and over | 0 (0.0%) | 14 (29.2%) |
Disability Class: Cognitive Difficulty
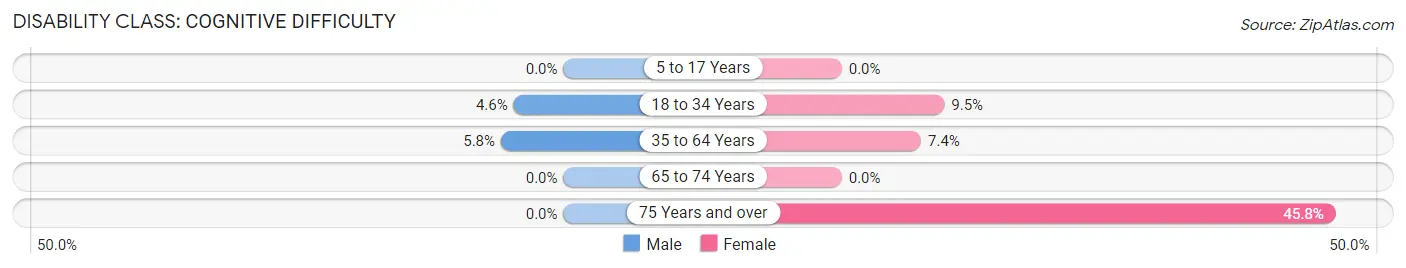
| Age Bracket | Male | Female |
| 5 to 17 Years | 0 (0.0%) | 0 (0.0%) |
| 18 to 34 Years | 9 (4.6%) | 26 (9.5%) |
| 35 to 64 Years | 16 (5.8%) | 19 (7.4%) |
| 65 to 74 Years | 0 (0.0%) | 0 (0.0%) |
| 75 Years and over | 0 (0.0%) | 22 (45.8%) |
Disability Class: Ambulatory Difficulty
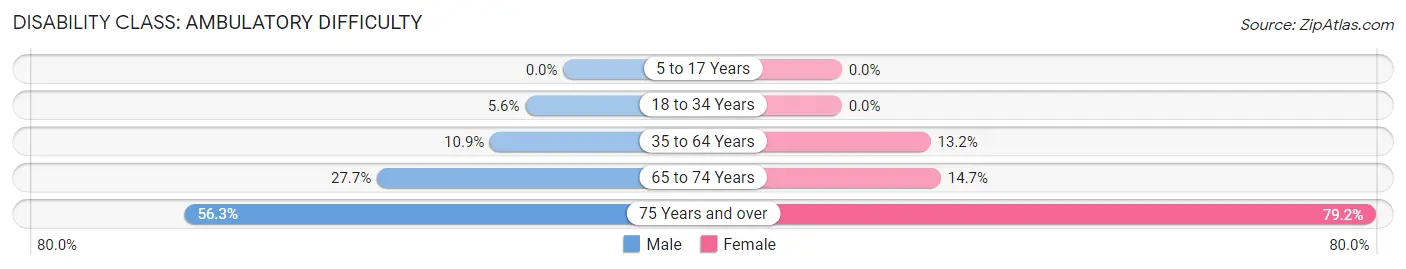
| Age Bracket | Male | Female |
| 5 to 17 Years | 0 (0.0%) | 0 (0.0%) |
| 18 to 34 Years | 11 (5.6%) | 0 (0.0%) |
| 35 to 64 Years | 30 (10.9%) | 34 (13.2%) |
| 65 to 74 Years | 13 (27.7%) | 10 (14.7%) |
| 75 Years and over | 9 (56.2%) | 38 (79.2%) |
Disability Class: Self-Care Difficulty
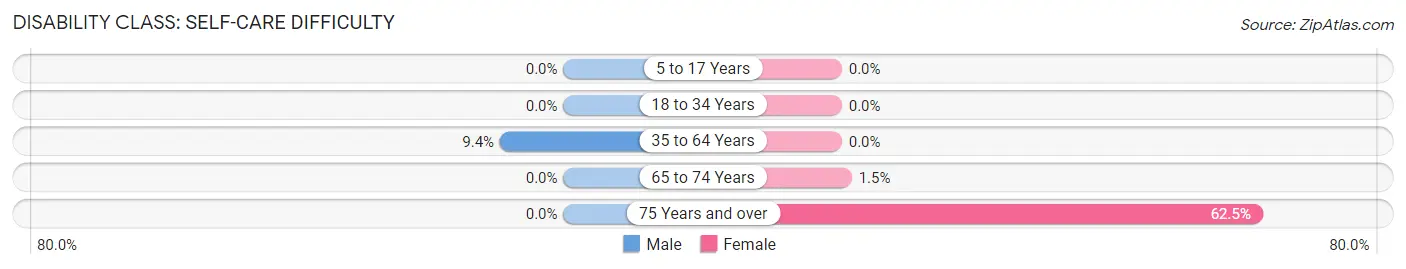
| Age Bracket | Male | Female |
| 5 to 17 Years | 0 (0.0%) | 0 (0.0%) |
| 18 to 34 Years | 0 (0.0%) | 0 (0.0%) |
| 35 to 64 Years | 26 (9.4%) | 0 (0.0%) |
| 65 to 74 Years | 0 (0.0%) | 1 (1.5%) |
| 75 Years and over | 0 (0.0%) | 30 (62.5%) |
Technology Access in Crow Agency
Computing Device Access in Crow Agency
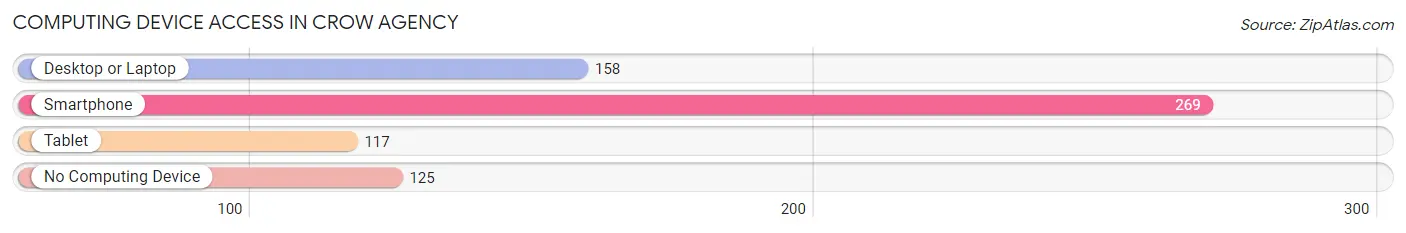
| Device Type | # Households | % Households |
| Desktop or Laptop | 158 | 37.3% |
| Smartphone | 269 | 63.6% |
| Tablet | 117 | 27.7% |
| No Computing Device | 125 | 29.5% |
| Total | 423 | 100.0% |
Internet Access in Crow Agency
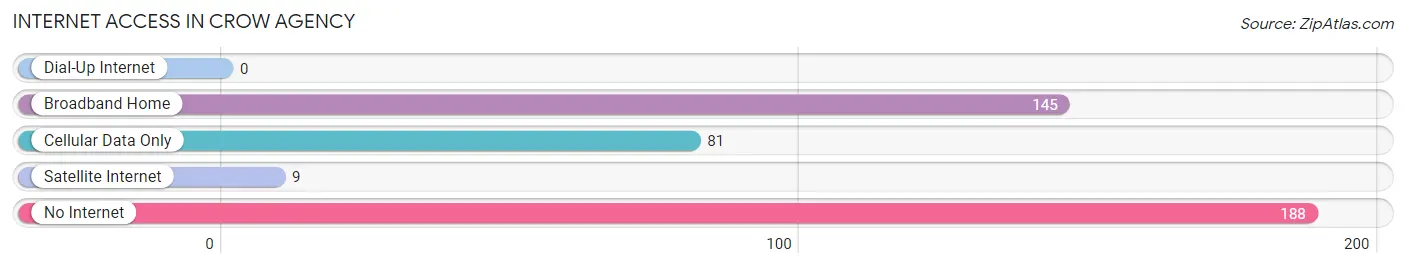
| Internet Type | # Households | % Households |
| Dial-Up Internet | 0 | 0.0% |
| Broadband Home | 145 | 34.3% |
| Cellular Data Only | 81 | 19.2% |
| Satellite Internet | 9 | 2.1% |
| No Internet | 188 | 44.4% |
| Total | 423 | 100.0% |
Crow Agency Summary
Crow Agency, Montana is a small town located in Big Horn County, Montana. It is situated on the Crow Indian Reservation, which is home to the Crow Tribe of Indians. The town is located on the banks of the Little Bighorn River, and is the administrative center of the Crow Tribe. The population of Crow Agency was 1,741 at the 2010 census.
History
The Crow Tribe of Indians has lived in the area for centuries, and the town of Crow Agency was established in 1868. The town was originally known as the Crow Agency of the Upper Missouri, and was established as a trading post for the Crow Tribe. The town was later renamed to Crow Agency in 1875.
In 1876, the Battle of the Little Bighorn took place near Crow Agency. The battle was a major victory for the Lakota and Cheyenne tribes, and a devastating defeat for the United States Army.
Geography
Crow Agency is located in Big Horn County, Montana, and is situated on the Crow Indian Reservation. The town is located on the banks of the Little Bighorn River, and is surrounded by rolling hills and prairies. The town is located approximately 25 miles south of Billings, Montana, and is accessible via Interstate 90.
Economy
The economy of Crow Agency is largely based on agriculture and tourism. The town is home to several small businesses, including a grocery store, a gas station, and a few restaurants. The town is also home to the Little Bighorn Battlefield National Monument, which is a popular tourist destination.
The Crow Tribe of Indians is the largest employer in the town, and provides jobs in the fields of education, health care, and government. The tribe also operates several businesses, including a casino, a hotel, and a golf course.
Demographics
As of the 2010 census, the population of Crow Agency was 1,741. The racial makeup of the town was 94.3% Native American, 4.2% White, 0.2% African American, 0.2% Asian, and 0.1% from other races. The median household income was $25,972, and the median family income was $30,972.
Conclusion
Crow Agency, Montana is a small town located in Big Horn County, Montana. It is situated on the Crow Indian Reservation, and is the administrative center of the Crow Tribe. The town is home to the Little Bighorn Battlefield National Monument, and is a popular tourist destination. The economy of Crow Agency is largely based on agriculture and tourism, and the Crow Tribe of Indians is the largest employer in the town. The population of Crow Agency was 1,741 at the 2010 census, and the racial makeup of the town was 94.3% Native American, 4.2% White, 0.2% African American, 0.2% Asian, and 0.1% from other races.
Common Questions
What is Per Capita Income in Crow Agency?
Per Capita income in Crow Agency is $9,914.
What is the Median Family Income in Crow Agency?
Median Family Income in Crow Agency is $37,981.
What is the Median Household income in Crow Agency?
Median Household Income in Crow Agency is $32,721.
What is Income or Wage Gap in Crow Agency?
Income or Wage Gap in Crow Agency is 8.1%.
Women in Crow Agency earn 91.9 cents for every dollar earned by a man.
What is Family Income Deficit in Crow Agency?
Family Income Deficit in Crow Agency is $15,428.
Families that are below poverty line in Crow Agency earn $15,428 less on average than the poverty threshold level.
What is Inequality or Gini Index in Crow Agency?
Inequality or Gini Index in Crow Agency is 0.42.
What is the Total Population of Crow Agency?
Total Population of Crow Agency is 1,965.
What is the Total Male Population of Crow Agency?
Total Male Population of Crow Agency is 976.
What is the Total Female Population of Crow Agency?
Total Female Population of Crow Agency is 989.
What is the Ratio of Males per 100 Females in Crow Agency?
There are 98.69 Males per 100 Females in Crow Agency.
What is the Ratio of Females per 100 Males in Crow Agency?
There are 101.33 Females per 100 Males in Crow Agency.
What is the Median Population Age in Crow Agency?
Median Population Age in Crow Agency is 25.6 Years.
What is the Average Family Size in Crow Agency
Average Family Size in Crow Agency is 5.7 People.
What is the Average Household Size in Crow Agency
Average Household Size in Crow Agency is 4.6 People.
How Large is the Labor Force in Crow Agency?
There are 602 People in the Labor Forcein in Crow Agency.
What is the Percentage of People in the Labor Force in Crow Agency?
46.7% of People are in the Labor Force in Crow Agency.
What is the Unemployment Rate in Crow Agency?
Unemployment Rate in Crow Agency is 41.8%.