Sangrey, MT Map & Demographics
Sangrey Map
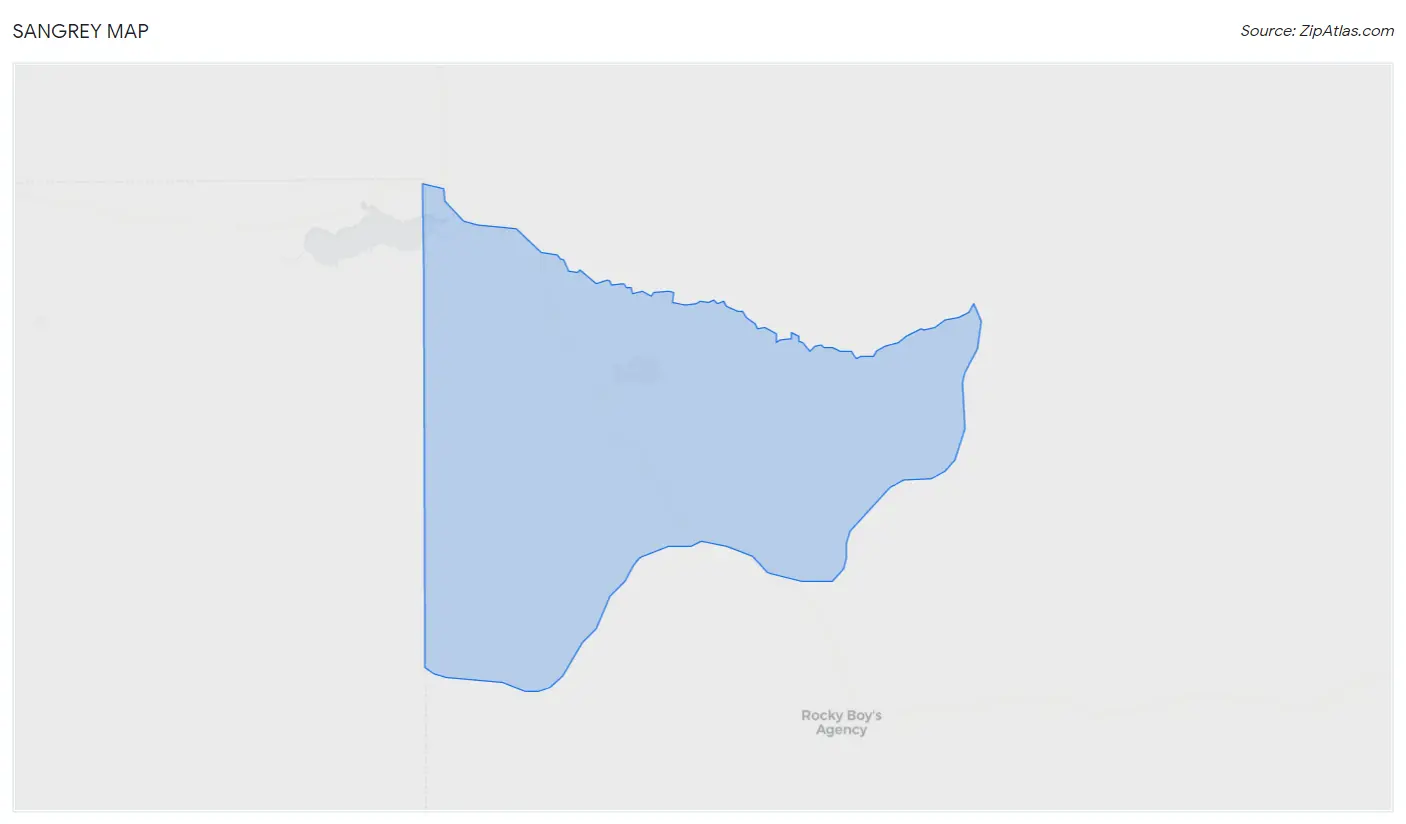
Sangrey Overview
$12,081
PER CAPITA INCOME
$50,536
AVG FAMILY INCOME
$50,536
AVG HOUSEHOLD INCOME
$10,304
FAMILY INCOME DEFICIT
0.38
INEQUALITY / GINI INDEX
501
TOTAL POPULATION
316
MALE POPULATION
185
FEMALE POPULATION
170.81
MALES / 100 FEMALES
58.54
FEMALES / 100 MALES
20.5
MEDIAN AGE
5.5
AVG FAMILY SIZE
5.6
AVG HOUSEHOLD SIZE
122
LABOR FORCE [ PEOPLE ]
37.5%
PERCENT IN LABOR FORCE
18.9%
UNEMPLOYMENT RATE
Income in Sangrey
Income Overview in Sangrey
Per Capita Income in Sangrey is $12,081, while median incomes of families and households are $50,536 and $50,536 respectively.
| Characteristic | Number | Measure |
| Per Capita Income | 501 | $12,081 |
| Median Family Income | 90 | $50,536 |
| Mean Family Income | 90 | $59,076 |
| Median Household Income | 90 | $50,536 |
| Mean Household Income | 90 | $59,373 |
| Income Deficit | 90 | $10,304 |
| Wage / Income Gap (%) | 501 | 0.00% |
| Wage / Income Gap ($) | 501 | 100.00¢ per $1 |
| Gini / Inequality Index | 501 | 0.38 |
Earnings by Sex in Sangrey
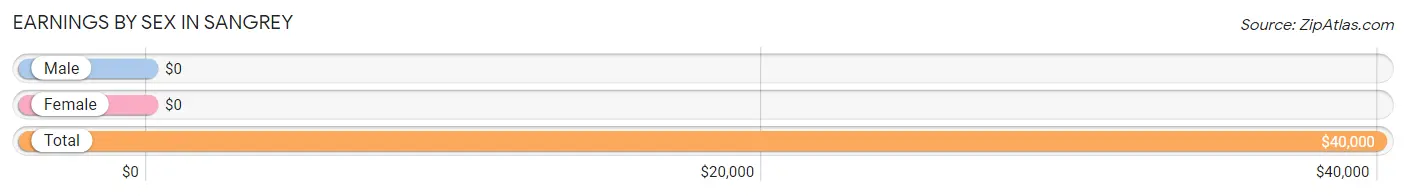
| Sex | Number | Average Earnings |
| Male | 56 (50.0%) | $0 |
| Female | 56 (50.0%) | $0 |
| Total | 112 (100.0%) | $40,000 |
Earnings by Sex by Income Bracket in Sangrey
The most common earnings brackets in Sangrey are $75,000 to $99,999 for men (24 | 42.9%) and $65,000 to $74,999 for women (15 | 26.8%).
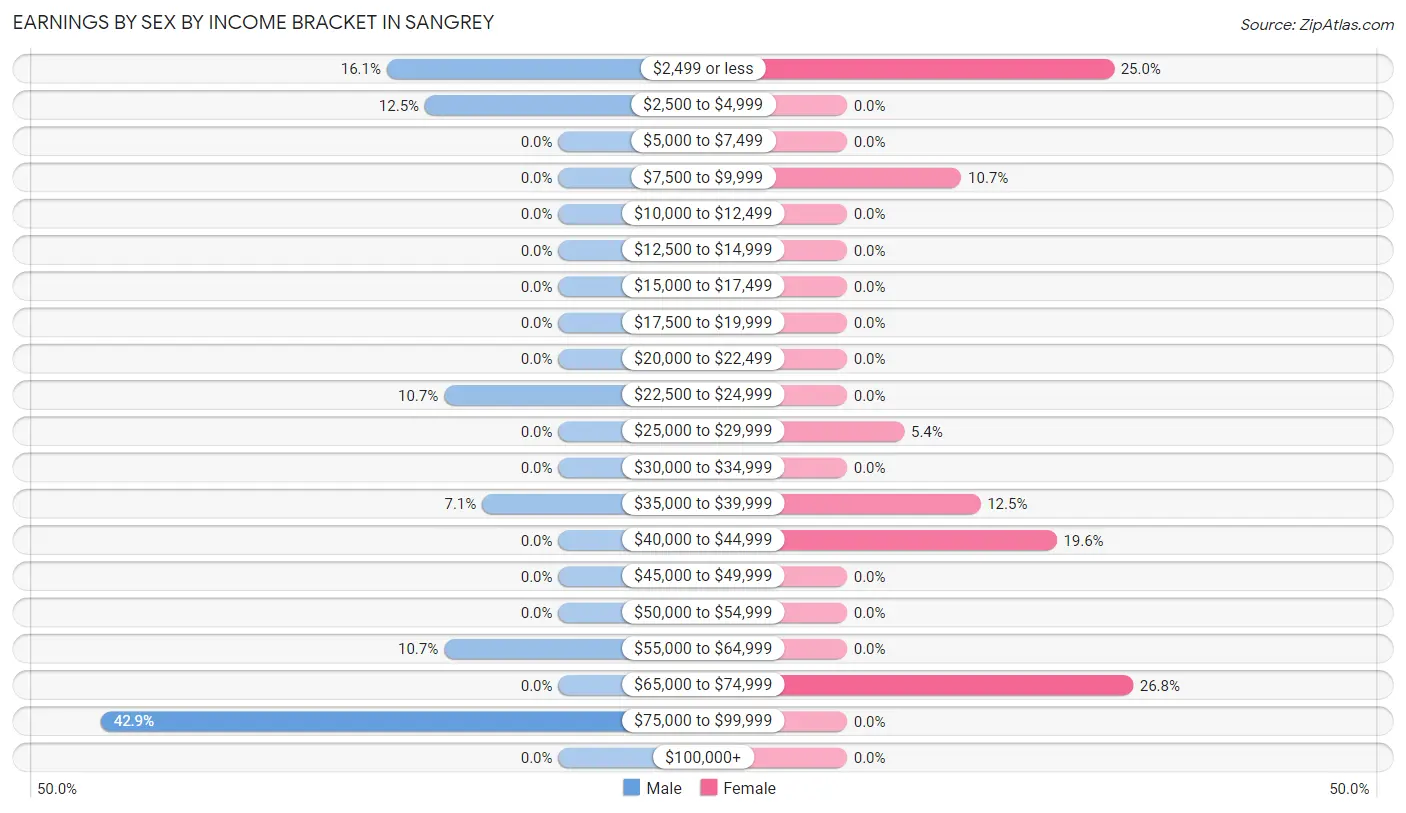
| Income | Male | Female |
| $2,499 or less | 9 (16.1%) | 14 (25.0%) |
| $2,500 to $4,999 | 7 (12.5%) | 0 (0.0%) |
| $5,000 to $7,499 | 0 (0.0%) | 0 (0.0%) |
| $7,500 to $9,999 | 0 (0.0%) | 6 (10.7%) |
| $10,000 to $12,499 | 0 (0.0%) | 0 (0.0%) |
| $12,500 to $14,999 | 0 (0.0%) | 0 (0.0%) |
| $15,000 to $17,499 | 0 (0.0%) | 0 (0.0%) |
| $17,500 to $19,999 | 0 (0.0%) | 0 (0.0%) |
| $20,000 to $22,499 | 0 (0.0%) | 0 (0.0%) |
| $22,500 to $24,999 | 6 (10.7%) | 0 (0.0%) |
| $25,000 to $29,999 | 0 (0.0%) | 3 (5.4%) |
| $30,000 to $34,999 | 0 (0.0%) | 0 (0.0%) |
| $35,000 to $39,999 | 4 (7.1%) | 7 (12.5%) |
| $40,000 to $44,999 | 0 (0.0%) | 11 (19.6%) |
| $45,000 to $49,999 | 0 (0.0%) | 0 (0.0%) |
| $50,000 to $54,999 | 0 (0.0%) | 0 (0.0%) |
| $55,000 to $64,999 | 6 (10.7%) | 0 (0.0%) |
| $65,000 to $74,999 | 0 (0.0%) | 15 (26.8%) |
| $75,000 to $99,999 | 24 (42.9%) | 0 (0.0%) |
| $100,000+ | 0 (0.0%) | 0 (0.0%) |
| Total | 56 (100.0%) | 56 (100.0%) |
Earnings by Sex by Educational Attainment in Sangrey
| Educational Attainment | Male Income | Female Income |
| Less than High School | - | - |
| High School Diploma | - | - |
| College or Associate's Degree | - | - |
| Bachelor's Degree | - | - |
| Graduate Degree | - | - |
| Total | - | - |
Family Income in Sangrey
Family Income Brackets in Sangrey
According to the Sangrey family income data, there are 20 families falling into the $50,000 to $74,999 income range, which is the most common income bracket and makes up 22.2% of all families.
| Income Bracket | # Families | % Families |
| Less than $10,000 | 0 | 0.0% |
| $10,000 to $14,999 | 7 | 7.8% |
| $15,000 to $24,999 | 17 | 18.9% |
| $25,000 to $34,999 | 4 | 4.4% |
| $35,000 to $49,999 | 14 | 15.6% |
| $50,000 to $74,999 | 20 | 22.2% |
| $75,000 to $99,999 | 18 | 20.0% |
| $100,000 to $149,999 | 4 | 4.4% |
| $150,000 to $199,999 | 6 | 6.7% |
| $200,000+ | 0 | 0.0% |
Family Income by Famaliy Size in Sangrey
7+ person families (26 | 28.9%) account for the highest median family income in Sangrey with $52,321 per family, while 7+ person families (26 | 28.9%) have the highest median income of $7,474 per family member.
| Income Bracket | # Families | Median Income |
| 2-Person Families | 8 (8.9%) | $0 |
| 3-Person Families | 28 (31.1%) | $0 |
| 4-Person Families | 28 (31.1%) | $0 |
| 5-Person Families | 0 (0.0%) | $0 |
| 6-Person Families | 0 (0.0%) | $0 |
| 7+ Person Families | 26 (28.9%) | $52,321 |
| Total | 90 (100.0%) | $50,536 |
Family Income by Number of Earners in Sangrey
| Number of Earners | # Families | Median Income |
| No Earners | 12 (13.3%) | $0 |
| 1 Earner | 62 (68.9%) | $50,179 |
| 2 Earners | 10 (11.1%) | $0 |
| 3+ Earners | 6 (6.7%) | $0 |
| Total | 90 (100.0%) | $50,536 |
Household Income in Sangrey
Household Income Brackets in Sangrey
With 20 households falling in the category, the $50,000 to $74,999 income range is the most frequent in Sangrey, accounting for 22.2% of all households.
| Income Bracket | # Households | % Households |
| Less than $10,000 | 0 | 0.0% |
| $10,000 to $14,999 | 7 | 7.8% |
| $15,000 to $24,999 | 17 | 18.9% |
| $25,000 to $34,999 | 4 | 4.4% |
| $35,000 to $49,999 | 14 | 15.6% |
| $50,000 to $74,999 | 20 | 22.2% |
| $75,000 to $99,999 | 18 | 20.0% |
| $100,000 to $149,999 | 4 | 4.4% |
| $150,000 to $199,999 | 6 | 6.7% |
| $200,000+ | 0 | 0.0% |
Household Income by Householder Age in Sangrey
The median household income in Sangrey is $50,536, with the highest median household income of $93,194 found in the 45 to 64 years age bracket for the primary householder. A total of 34 households (37.8%) fall into this category.
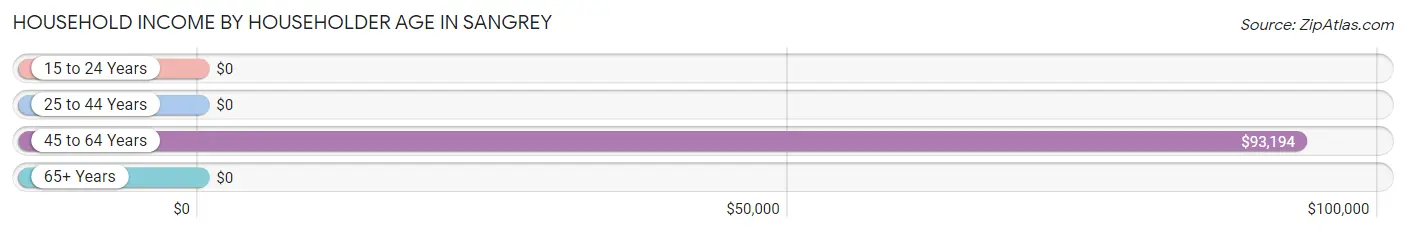
| Income Bracket | # Households | Median Income |
| 15 to 24 Years | 0 (0.0%) | $0 |
| 25 to 44 Years | 35 (38.9%) | $0 |
| 45 to 64 Years | 34 (37.8%) | $93,194 |
| 65+ Years | 21 (23.3%) | $0 |
| Total | 90 (100.0%) | $50,536 |
Poverty in Sangrey
Income Below Poverty by Sex and Age in Sangrey
With 31.0% poverty level for males and 20.0% for females among the residents of Sangrey, 6 to 11 year old males and 5 year old females are the most vulnerable to poverty, with 26 males (66.7%) and 8 females (100.0%) in their respective age groups living below the poverty level.
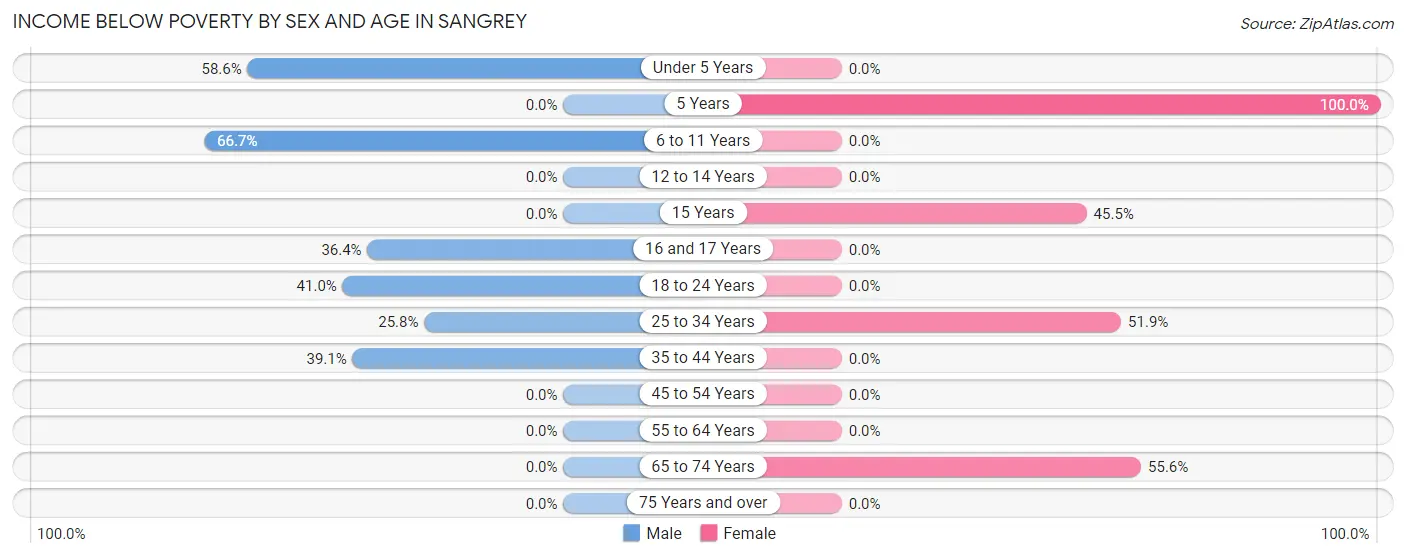
| Age Bracket | Male | Female |
| Under 5 Years | 17 (58.6%) | 0 (0.0%) |
| 5 Years | 0 (0.0%) | 8 (100.0%) |
| 6 to 11 Years | 26 (66.7%) | 0 (0.0%) |
| 12 to 14 Years | 0 (0.0%) | 0 (0.0%) |
| 15 Years | 0 (0.0%) | 5 (45.5%) |
| 16 and 17 Years | 4 (36.4%) | 0 (0.0%) |
| 18 to 24 Years | 34 (41.0%) | 0 (0.0%) |
| 25 to 34 Years | 8 (25.8%) | 14 (51.8%) |
| 35 to 44 Years | 9 (39.1%) | 0 (0.0%) |
| 45 to 54 Years | 0 (0.0%) | 0 (0.0%) |
| 55 to 64 Years | 0 (0.0%) | 0 (0.0%) |
| 65 to 74 Years | 0 (0.0%) | 10 (55.6%) |
| 75 Years and over | 0 (0.0%) | 0 (0.0%) |
| Total | 98 (31.0%) | 37 (20.0%) |
Income Above Poverty by Sex and Age in Sangrey
According to the poverty statistics in Sangrey, males aged 12 to 14 years and females aged under 5 years are the age groups that are most secure financially, with 100.0% of males and 100.0% of females in these age groups living above the poverty line.
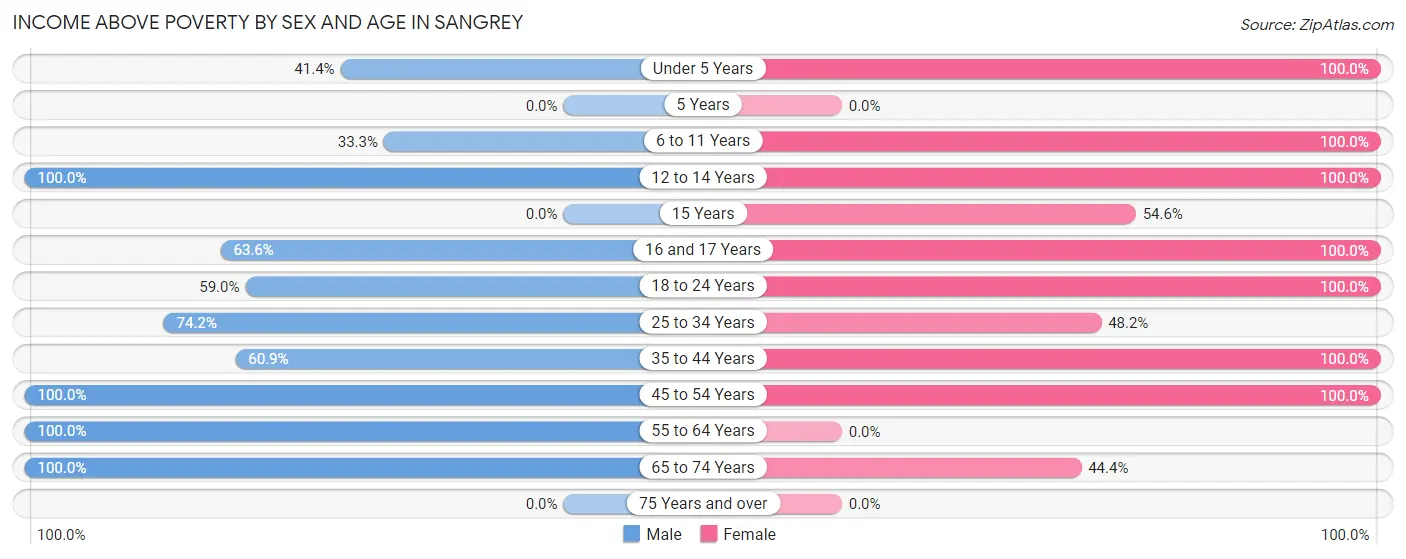
| Age Bracket | Male | Female |
| Under 5 Years | 12 (41.4%) | 19 (100.0%) |
| 5 Years | 0 (0.0%) | 0 (0.0%) |
| 6 to 11 Years | 13 (33.3%) | 14 (100.0%) |
| 12 to 14 Years | 38 (100.0%) | 18 (100.0%) |
| 15 Years | 0 (0.0%) | 6 (54.5%) |
| 16 and 17 Years | 7 (63.6%) | 10 (100.0%) |
| 18 to 24 Years | 49 (59.0%) | 10 (100.0%) |
| 25 to 34 Years | 23 (74.2%) | 13 (48.1%) |
| 35 to 44 Years | 14 (60.9%) | 18 (100.0%) |
| 45 to 54 Years | 36 (100.0%) | 32 (100.0%) |
| 55 to 64 Years | 12 (100.0%) | 0 (0.0%) |
| 65 to 74 Years | 14 (100.0%) | 8 (44.4%) |
| 75 Years and over | 0 (0.0%) | 0 (0.0%) |
| Total | 218 (69.0%) | 148 (80.0%) |
Income Below Poverty Among Married-Couple Families in Sangrey
| Children | Above Poverty | Below Poverty |
| No Children | 4 (100.0%) | 0 (0.0%) |
| 1 or 2 Children | 32 (100.0%) | 0 (0.0%) |
| 3 or 4 Children | 6 (100.0%) | 0 (0.0%) |
| 5 or more Children | 6 (100.0%) | 0 (0.0%) |
| Total | 48 (100.0%) | 0 (0.0%) |
Income Below Poverty Among Single-Parent Households in Sangrey
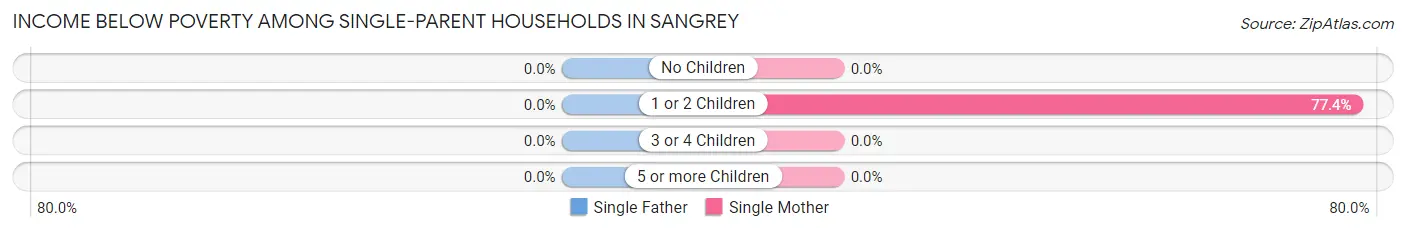
| Children | Single Father | Single Mother |
| No Children | 0 (0.0%) | 0 (0.0%) |
| 1 or 2 Children | 0 (0.0%) | 24 (77.4%) |
| 3 or 4 Children | 0 (0.0%) | 0 (0.0%) |
| 5 or more Children | 0 (0.0%) | 0 (0.0%) |
| Total | 0 (0.0%) | 24 (66.7%) |
Income Below Poverty Among Married-Couple vs Single-Parent Households in Sangrey
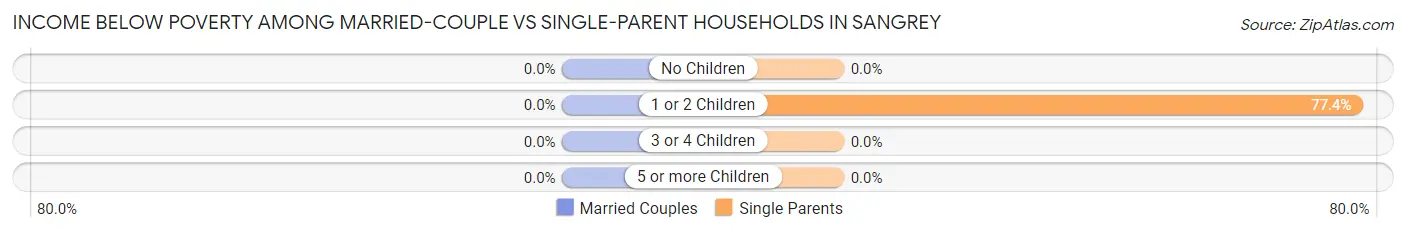
| Children | Married-Couple Families | Single-Parent Households |
| No Children | 0 (0.0%) | 0 (0.0%) |
| 1 or 2 Children | 0 (0.0%) | 24 (77.4%) |
| 3 or 4 Children | 0 (0.0%) | 0 (0.0%) |
| 5 or more Children | 0 (0.0%) | 0 (0.0%) |
| Total | 0 (0.0%) | 24 (57.1%) |
Race in Sangrey
The most populous races in Sangrey are Native / Alaskan (501 | 100.0%), and Hispanic or Latino (110 | 22.0%).
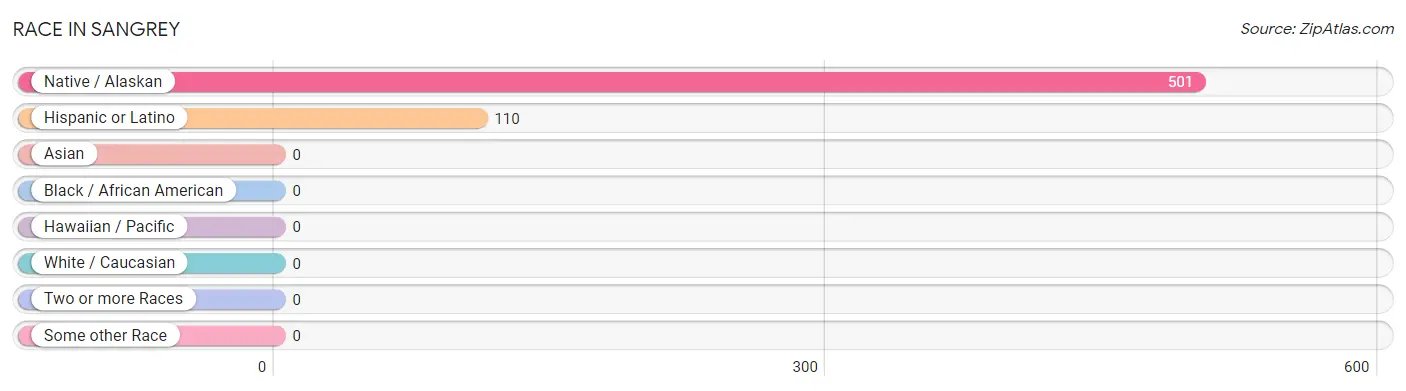
| Race | # Population | % Population |
| Asian | 0 | 0.0% |
| Black / African American | 0 | 0.0% |
| Hawaiian / Pacific | 0 | 0.0% |
| Hispanic or Latino | 110 | 22.0% |
| Native / Alaskan | 501 | 100.0% |
| White / Caucasian | 0 | 0.0% |
| Two or more Races | 0 | 0.0% |
| Some other Race | 0 | 0.0% |
| Total | 501 | 100.0% |
Ancestry in Sangrey
The most populous ancestries reported in Sangrey are Mexican (110 | 22.0%), and Chippewa (67 | 13.4%), together accounting for 35.3% of all Sangrey residents.
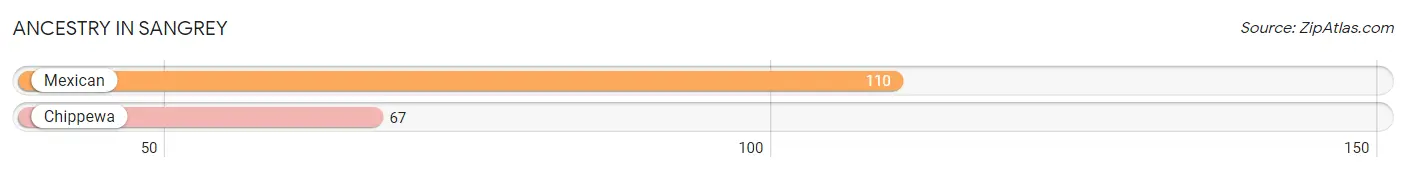
| Ancestry | # Population | % Population |
| Chippewa | 67 | 13.4% |
| Mexican | 110 | 22.0% | View All 2 Rows |
Immigrants in Sangrey

| Immigration Origin | # Population | % Population | View All 0 Rows |
Sex and Age in Sangrey
Sex and Age in Sangrey
The most populous age groups in Sangrey are 20 to 24 Years (56 | 17.7%) for men and 15 to 19 Years (31 | 16.8%) for women.
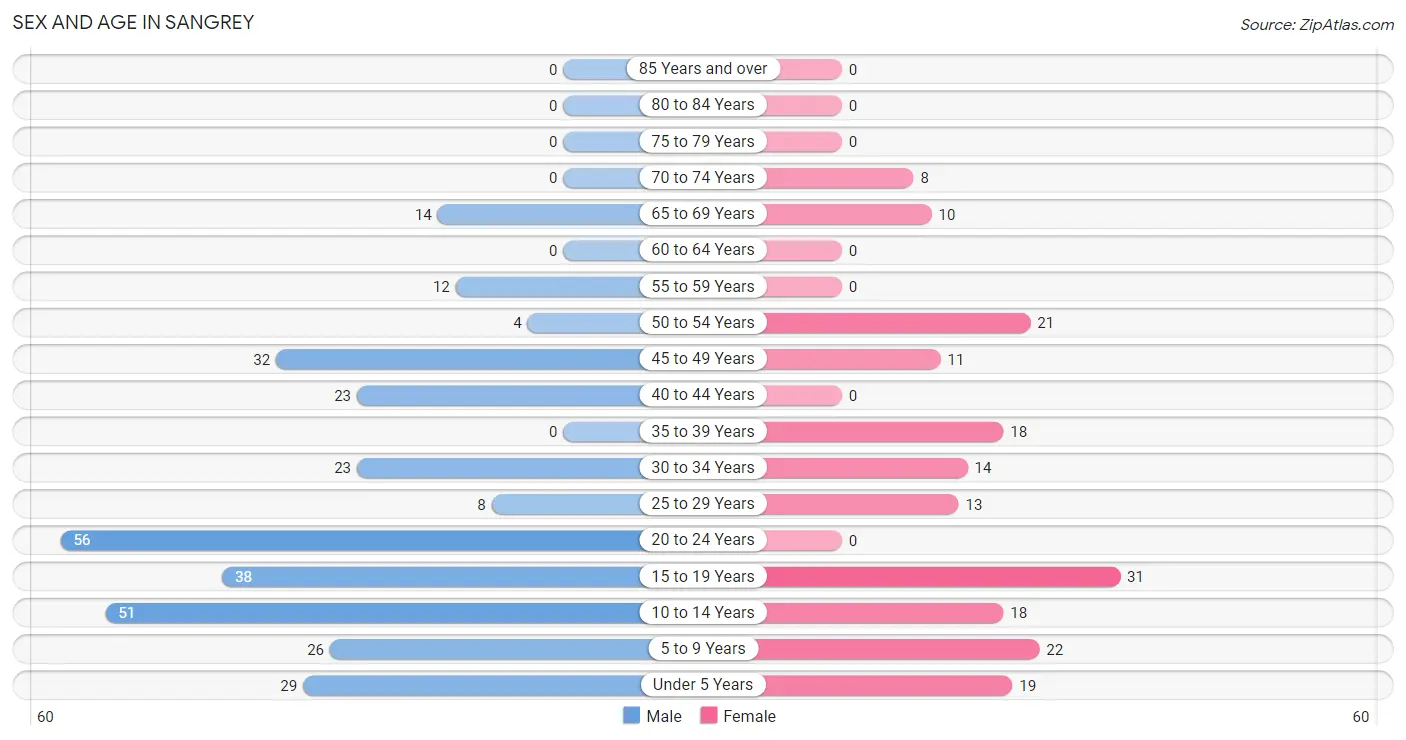
| Age Bracket | Male | Female |
| Under 5 Years | 29 (9.2%) | 19 (10.3%) |
| 5 to 9 Years | 26 (8.2%) | 22 (11.9%) |
| 10 to 14 Years | 51 (16.1%) | 18 (9.7%) |
| 15 to 19 Years | 38 (12.0%) | 31 (16.8%) |
| 20 to 24 Years | 56 (17.7%) | 0 (0.0%) |
| 25 to 29 Years | 8 (2.5%) | 13 (7.0%) |
| 30 to 34 Years | 23 (7.3%) | 14 (7.6%) |
| 35 to 39 Years | 0 (0.0%) | 18 (9.7%) |
| 40 to 44 Years | 23 (7.3%) | 0 (0.0%) |
| 45 to 49 Years | 32 (10.1%) | 11 (5.9%) |
| 50 to 54 Years | 4 (1.3%) | 21 (11.4%) |
| 55 to 59 Years | 12 (3.8%) | 0 (0.0%) |
| 60 to 64 Years | 0 (0.0%) | 0 (0.0%) |
| 65 to 69 Years | 14 (4.4%) | 10 (5.4%) |
| 70 to 74 Years | 0 (0.0%) | 8 (4.3%) |
| 75 to 79 Years | 0 (0.0%) | 0 (0.0%) |
| 80 to 84 Years | 0 (0.0%) | 0 (0.0%) |
| 85 Years and over | 0 (0.0%) | 0 (0.0%) |
| Total | 316 (100.0%) | 185 (100.0%) |
Families and Households in Sangrey
Median Family Size in Sangrey
The median family size in Sangrey is 5.47 persons per family, with married-couple families (48 | 53.3%) accounting for the largest median family size of 5.94 persons per family. On the other hand, single male/father families (6 | 6.7%) represent the smallest median family size with 4.00 persons per family.
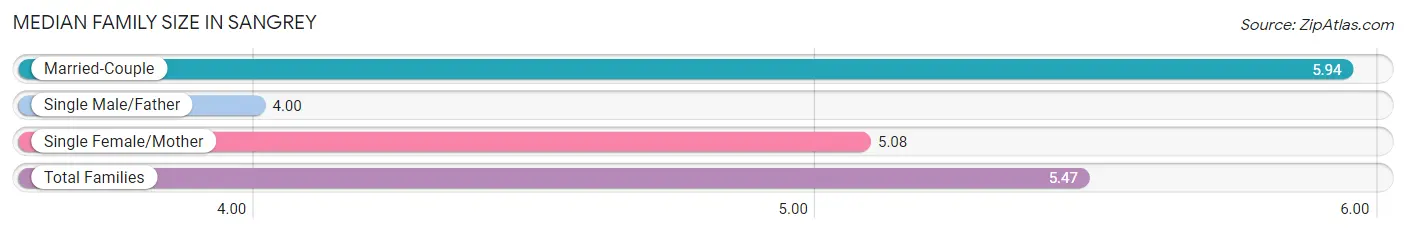
| Family Type | # Families | Family Size |
| Married-Couple | 48 (53.3%) | 5.94 |
| Single Male/Father | 6 (6.7%) | 4.00 |
| Single Female/Mother | 36 (40.0%) | 5.08 |
| Total Families | 90 (100.0%) | 5.47 |
Median Household Size in Sangrey
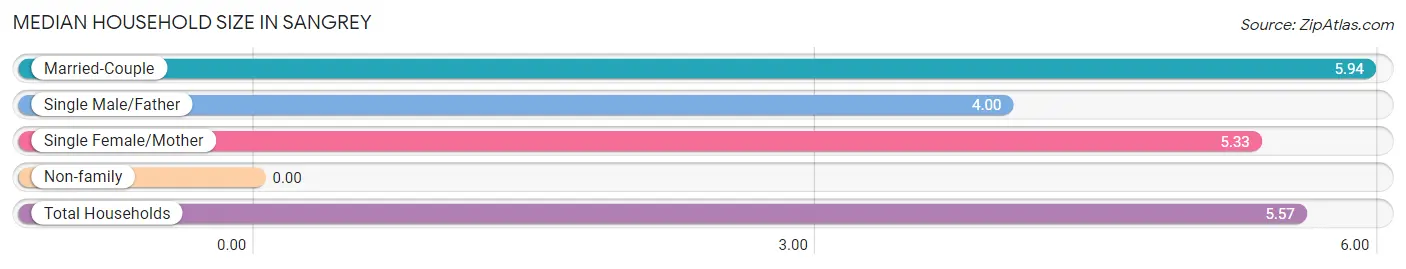
| Household Type | # Households | Household Size |
| Married-Couple | 48 (53.3%) | 5.94 |
| Single Male/Father | 6 (6.7%) | 4.00 |
| Single Female/Mother | 36 (40.0%) | 5.33 |
| Non-family | 0 (0.0%) | - |
| Total Households | 90 (100.0%) | 5.57 |
Household Size by Marriage Status in Sangrey

| Household Size | Family Households | Nonfamily Households |
| 1-Person Households | - | 0 (0.0%) |
| 2-Person Households | 8 (8.9%) | 0 (0.0%) |
| 3-Person Households | 21 (23.3%) | 0 (0.0%) |
| 4-Person Households | 35 (38.9%) | 0 (0.0%) |
| 5-Person Households | 0 (0.0%) | 0 (0.0%) |
| 6-Person Households | 0 (0.0%) | 0 (0.0%) |
| 7+ Person Households | 26 (28.9%) | 0 (0.0%) |
| Total | 90 (100.0%) | 0 (0.0%) |
Female Fertility in Sangrey
Fertility by Age in Sangrey
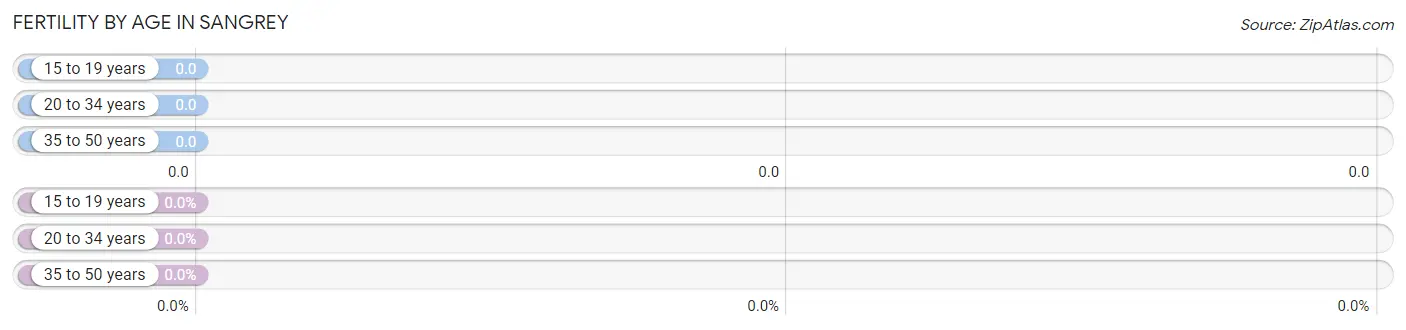
| Age Bracket | Women with Births | Births / 1,000 Women |
| 15 to 19 years | 0 (0.0%) | 0.0 |
| 20 to 34 years | 0 (0.0%) | 0.0 |
| 35 to 50 years | 0 (0.0%) | 0.0 |
| Total | 0 (0.0%) | 0.0 |
Fertility by Age by Marriage Status in Sangrey
| Age Bracket | Married | Unmarried |
| 15 to 19 years | 0 (0.0%) | 0 (0.0%) |
| 20 to 34 years | 0 (0.0%) | 0 (0.0%) |
| 35 to 50 years | 0 (0.0%) | 0 (0.0%) |
| Total | 0 (0.0%) | 0 (0.0%) |
Fertility by Education in Sangrey
| Educational Attainment | Women with Births | Births / 1,000 Women |
| Less than High School | 0 (0.0%) | 0.0 |
| High School Diploma | 0 (0.0%) | 0.0 |
| College or Associate's Degree | 0 (0.0%) | 0.0 |
| Bachelor's Degree | 0 (0.0%) | 0.0 |
| Graduate Degree | 0 (0.0%) | 0.0 |
| Total | 0 (0.0%) | 0.0 |
Fertility by Education by Marriage Status in Sangrey
| Educational Attainment | Married | Unmarried |
| Less than High School | 0 (0.0%) | 0 (0.0%) |
| High School Diploma | 0 (0.0%) | 0 (0.0%) |
| College or Associate's Degree | 0 (0.0%) | 0 (0.0%) |
| Bachelor's Degree | 0 (0.0%) | 0 (0.0%) |
| Graduate Degree | 0 (0.0%) | 0 (0.0%) |
| Total | 0 (0.0%) | 0 (0.0%) |
Employment Characteristics in Sangrey
Employment by Class of Employer in Sangrey
Among the 99 employed individuals in Sangrey, local government employees (41 | 41.4%), federal government employees (21 | 21.2%), and private company employees (18 | 18.2%) make up the most common classes of employment.
| Employer Class | # Employees | % Employees |
| Private Company Employees | 18 | 18.2% |
| Self-Employed (Incorporated) | 0 | 0.0% |
| Self-Employed (Not Incorporated) | 4 | 4.0% |
| Not-for-profit Organizations | 6 | 6.1% |
| Local Government Employees | 41 | 41.4% |
| State Government Employees | 2 | 2.0% |
| Federal Government Employees | 21 | 21.2% |
| Unpaid Family Workers | 7 | 7.1% |
| Total | 99 | 100.0% |
Employment Status by Age in Sangrey
According to the labor force statistics for Sangrey, out of the total population over 16 years of age (325), 37.5% or 122 individuals are in the labor force, with 18.9% or 23 of them unemployed. The age group with the highest labor force participation rate is 55 to 59 years, with 100.0% or 12 individuals in the labor force. Within the labor force, the 35 to 44 years age range has the highest percentage of unemployed individuals, with 100.0% or 9 of them being unemployed.
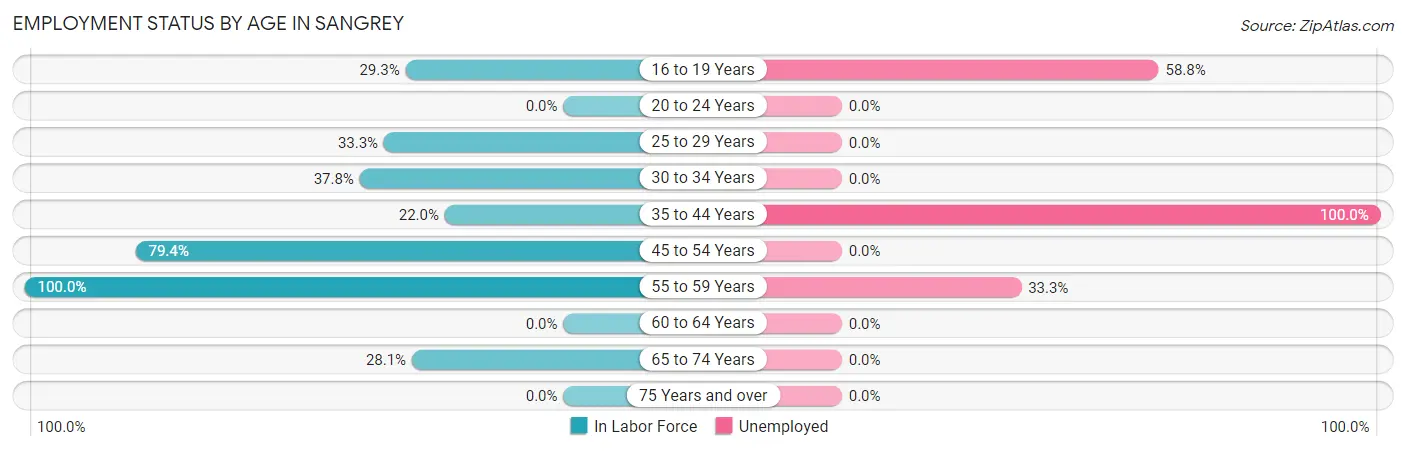
| Age Bracket | In Labor Force | Unemployed |
| 16 to 19 Years | 17 (29.3%) | 10 (58.8%) |
| 20 to 24 Years | 0 (0.0%) | 0 (0.0%) |
| 25 to 29 Years | 7 (33.3%) | 0 (0.0%) |
| 30 to 34 Years | 14 (37.8%) | 0 (0.0%) |
| 35 to 44 Years | 9 (22.0%) | 9 (100.0%) |
| 45 to 54 Years | 54 (79.4%) | 0 (0.0%) |
| 55 to 59 Years | 12 (100.0%) | 4 (33.3%) |
| 60 to 64 Years | 0 (0.0%) | 0 (0.0%) |
| 65 to 74 Years | 9 (28.1%) | 0 (0.0%) |
| 75 Years and over | 0 (0.0%) | 0 (0.0%) |
| Total | 122 (37.5%) | 23 (18.9%) |
Employment Status by Educational Attainment in Sangrey
According to labor force statistics for Sangrey, 53.6% of individuals (96) out of the total population between 25 and 64 years of age (179) are in the labor force, with 13.5% or 13 of them being unemployed. The group with the highest labor force participation rate are those with the educational attainment of less than high school, with 100.0% or 9 individuals in the labor force. Within the labor force, individuals with less than high school education have the highest percentage of unemployment, with 100.0% or 9 of them being unemployed.
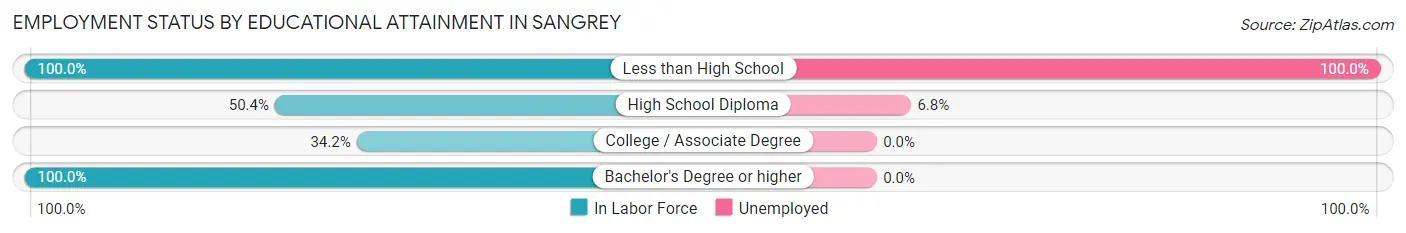
| Educational Attainment | In Labor Force | Unemployed |
| Less than High School | 9 (100.0%) | 9 (100.0%) |
| High School Diploma | 59 (50.4%) | 8 (6.8%) |
| College / Associate Degree | 13 (34.2%) | 0 (0.0%) |
| Bachelor's Degree or higher | 15 (100.0%) | 0 (0.0%) |
| Total | 96 (53.6%) | 24 (13.5%) |
Employment Occupations by Sex in Sangrey
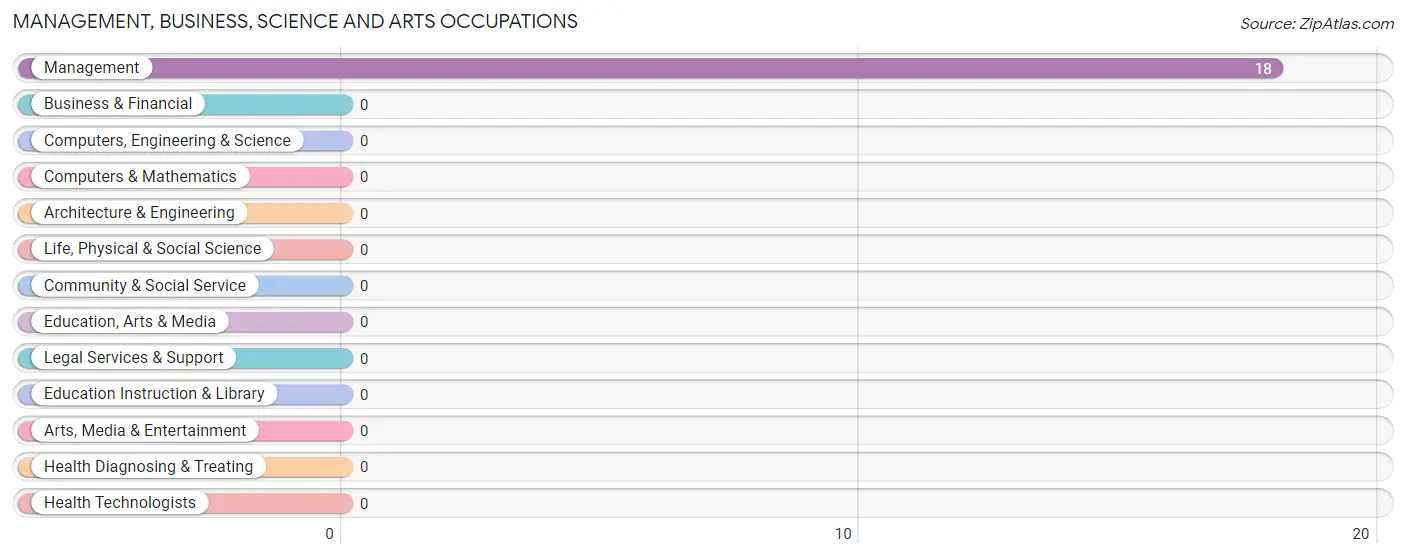
Management, Business, Science and Arts Occupations
The most common Management, Business, Science and Arts occupations in Sangrey are , and Management (18 | 18.2%).
Management, Business, Science and Arts Occupations by Sex
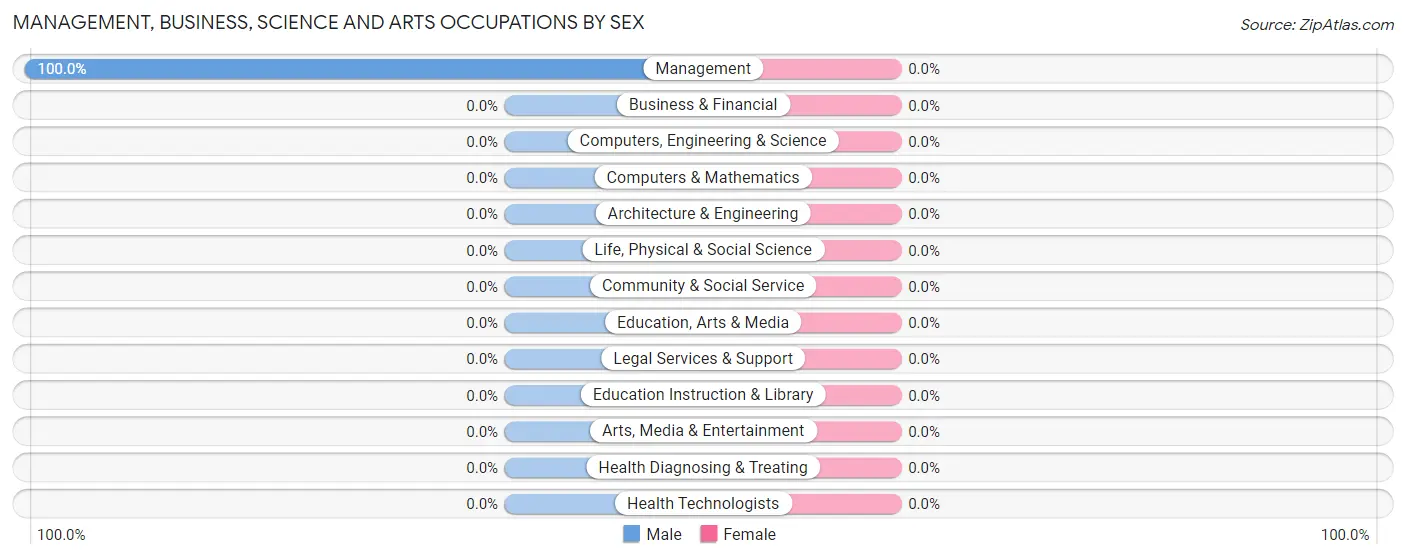
| Occupation | Male | Female |
| Management | 18 (100.0%) | 0 (0.0%) |
| Business & Financial | 0 (0.0%) | 0 (0.0%) |
| Computers, Engineering & Science | 0 (0.0%) | 0 (0.0%) |
| Computers & Mathematics | 0 (0.0%) | 0 (0.0%) |
| Architecture & Engineering | 0 (0.0%) | 0 (0.0%) |
| Life, Physical & Social Science | 0 (0.0%) | 0 (0.0%) |
| Community & Social Service | 0 (0.0%) | 0 (0.0%) |
| Education, Arts & Media | 0 (0.0%) | 0 (0.0%) |
| Legal Services & Support | 0 (0.0%) | 0 (0.0%) |
| Education Instruction & Library | 0 (0.0%) | 0 (0.0%) |
| Arts, Media & Entertainment | 0 (0.0%) | 0 (0.0%) |
| Health Diagnosing & Treating | 0 (0.0%) | 0 (0.0%) |
| Health Technologists | 0 (0.0%) | 0 (0.0%) |
| Total (Category) | 18 (100.0%) | 0 (0.0%) |
| Total (Overall) | 43 (43.4%) | 56 (56.6%) |
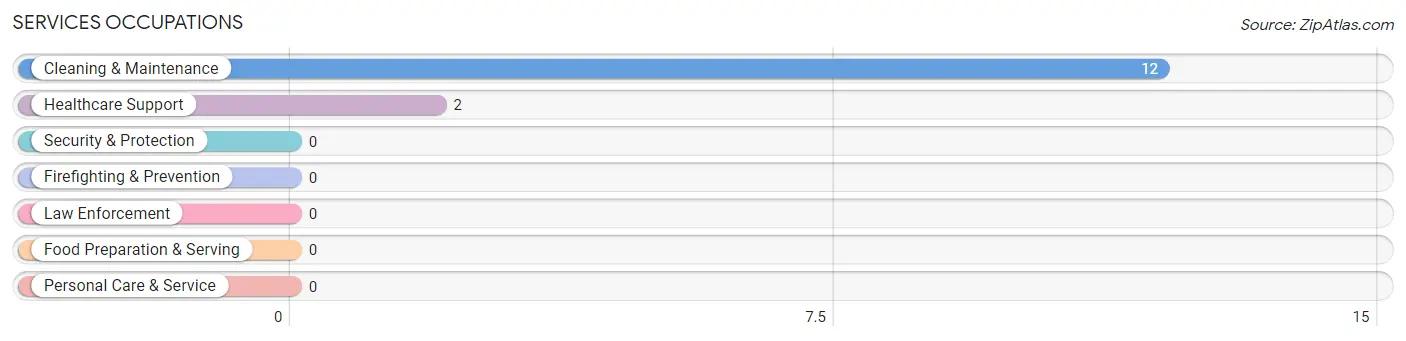
Services Occupations
The most common Services occupations in Sangrey are Cleaning & Maintenance (12 | 12.1%), and Healthcare Support (2 | 2.0%).
Services Occupations by Sex
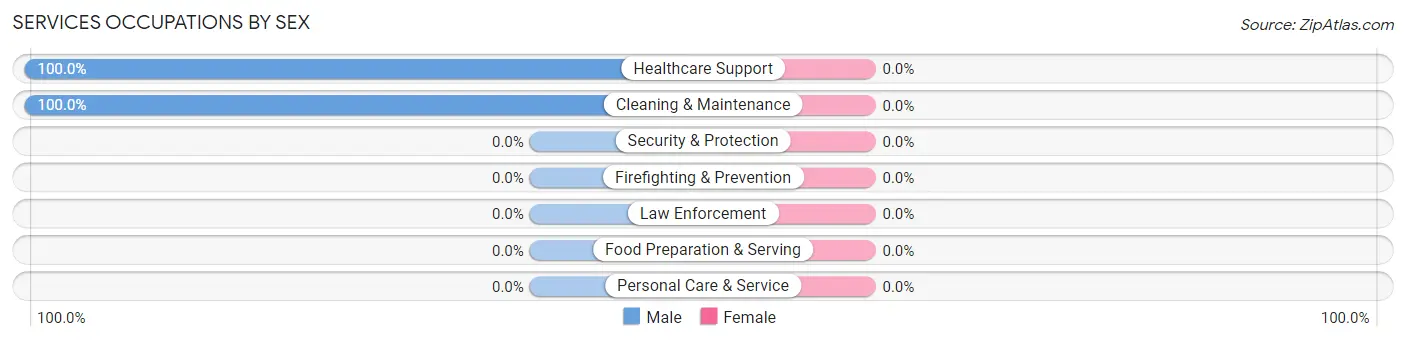
| Occupation | Male | Female |
| Healthcare Support | 2 (100.0%) | 0 (0.0%) |
| Security & Protection | 0 (0.0%) | 0 (0.0%) |
| Firefighting & Prevention | 0 (0.0%) | 0 (0.0%) |
| Law Enforcement | 0 (0.0%) | 0 (0.0%) |
| Food Preparation & Serving | 0 (0.0%) | 0 (0.0%) |
| Cleaning & Maintenance | 12 (100.0%) | 0 (0.0%) |
| Personal Care & Service | 0 (0.0%) | 0 (0.0%) |
| Total (Category) | 14 (100.0%) | 0 (0.0%) |
| Total (Overall) | 43 (43.4%) | 56 (56.6%) |
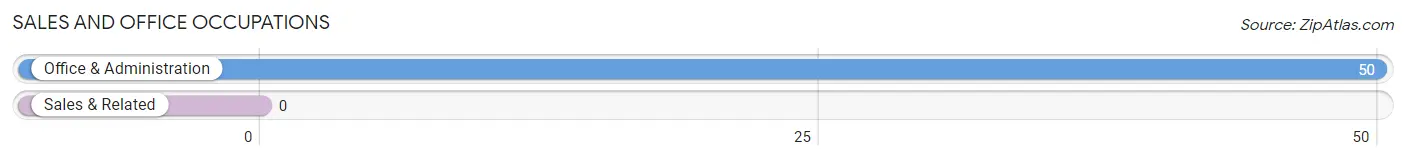
Sales and Office Occupations
The most common Sales and Office occupations in Sangrey are , and Office & Administration (50 | 50.5%).
Sales and Office Occupations by Sex
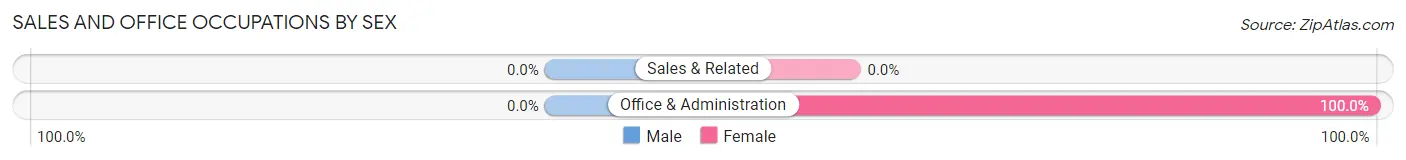
| Occupation | Male | Female |
| Sales & Related | 0 (0.0%) | 0 (0.0%) |
| Office & Administration | 0 (0.0%) | 50 (100.0%) |
| Total (Category) | 0 (0.0%) | 50 (100.0%) |
| Total (Overall) | 43 (43.4%) | 56 (56.6%) |
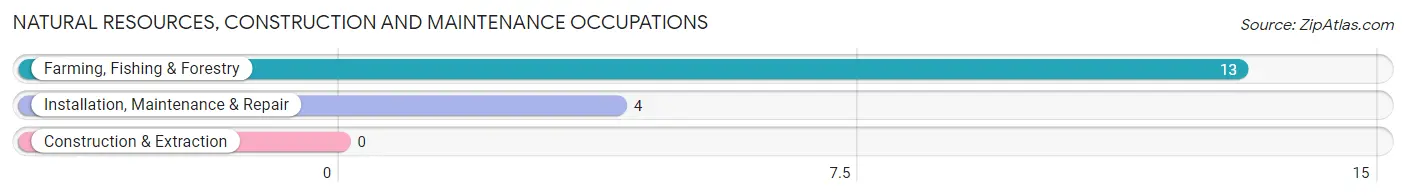
Natural Resources, Construction and Maintenance Occupations
The most common Natural Resources, Construction and Maintenance occupations in Sangrey are Farming, Fishing & Forestry (13 | 13.1%), and Installation, Maintenance & Repair (4 | 4.0%).
Natural Resources, Construction and Maintenance Occupations by Sex
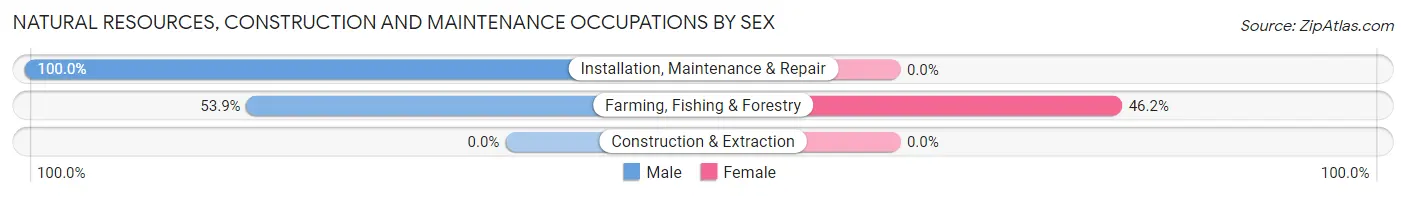
| Occupation | Male | Female |
| Farming, Fishing & Forestry | 7 (53.8%) | 6 (46.2%) |
| Construction & Extraction | 0 (0.0%) | 0 (0.0%) |
| Installation, Maintenance & Repair | 4 (100.0%) | 0 (0.0%) |
| Total (Category) | 11 (64.7%) | 6 (35.3%) |
| Total (Overall) | 43 (43.4%) | 56 (56.6%) |
Production, Transportation and Moving Occupations
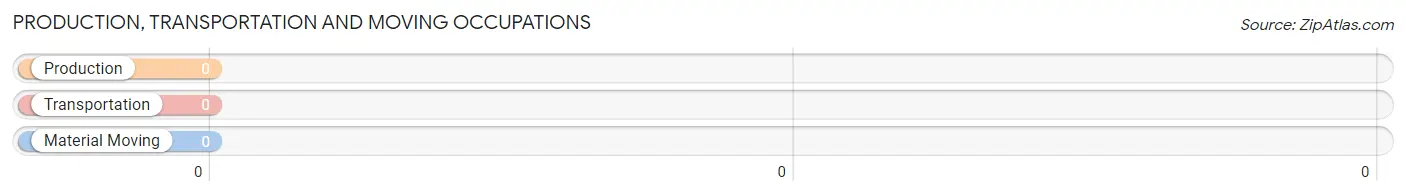
Production, Transportation and Moving Occupations by Sex
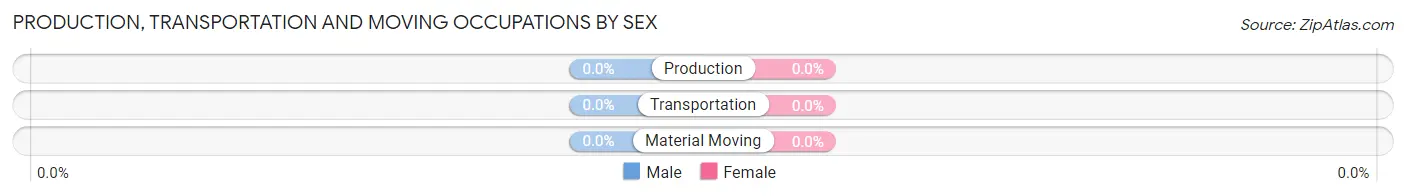
| Occupation | Male | Female |
| Production | 0 (0.0%) | 0 (0.0%) |
| Transportation | 0 (0.0%) | 0 (0.0%) |
| Material Moving | 0 (0.0%) | 0 (0.0%) |
| Total (Category) | 0 (0.0%) | 0 (0.0%) |
| Total (Overall) | 43 (43.4%) | 56 (56.6%) |
Employment Industries by Sex in Sangrey
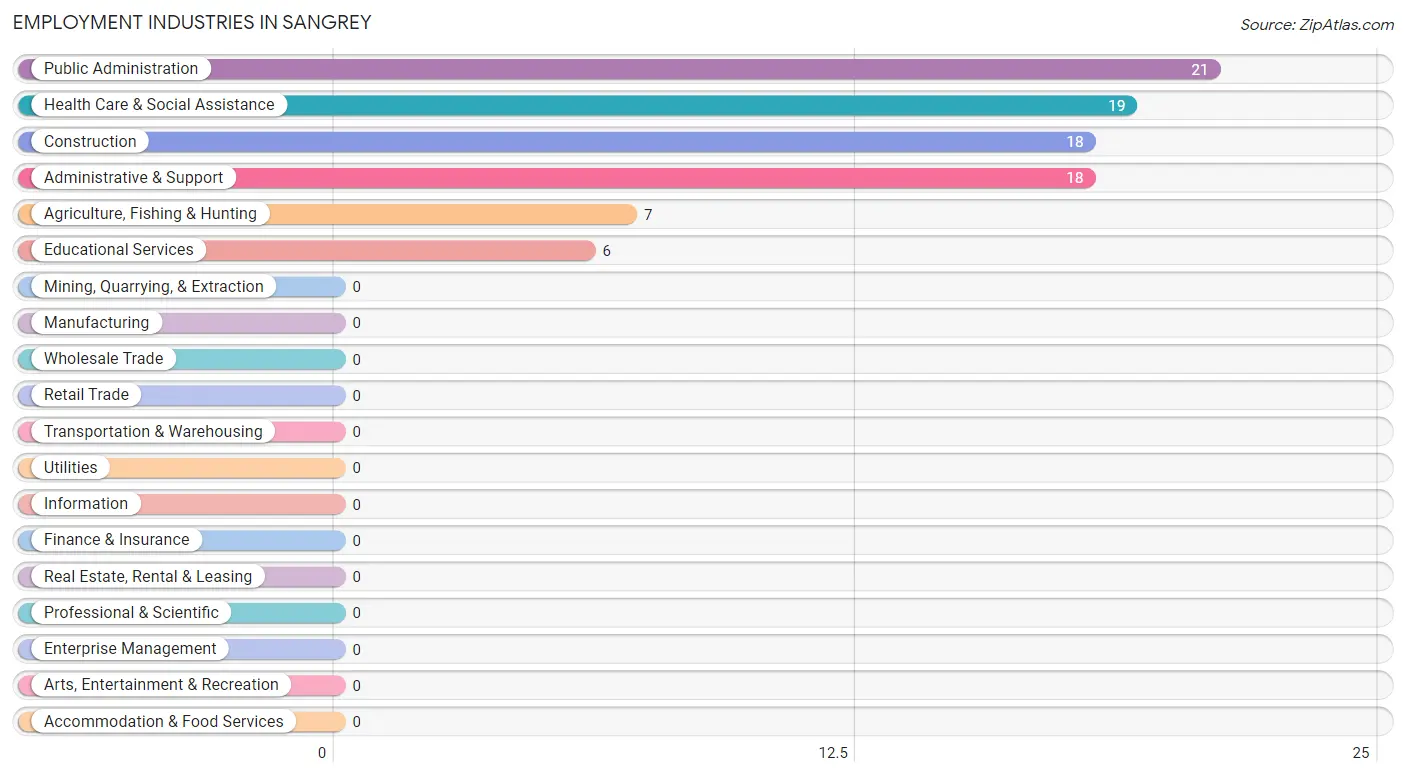
Employment Industries in Sangrey
The major employment industries in Sangrey include Public Administration (21 | 21.2%), Health Care & Social Assistance (19 | 19.2%), Construction (18 | 18.2%), Administrative & Support (18 | 18.2%), and Agriculture, Fishing & Hunting (7 | 7.1%).
Employment Industries by Sex in Sangrey
The Sangrey industries that see more men than women are Agriculture, Fishing & Hunting (100.0%), Construction (100.0%), and Educational Services (100.0%), whereas the industries that tend to have a higher number of women are Administrative & Support (100.0%), Health Care & Social Assistance (89.5%), and Public Administration (71.4%).
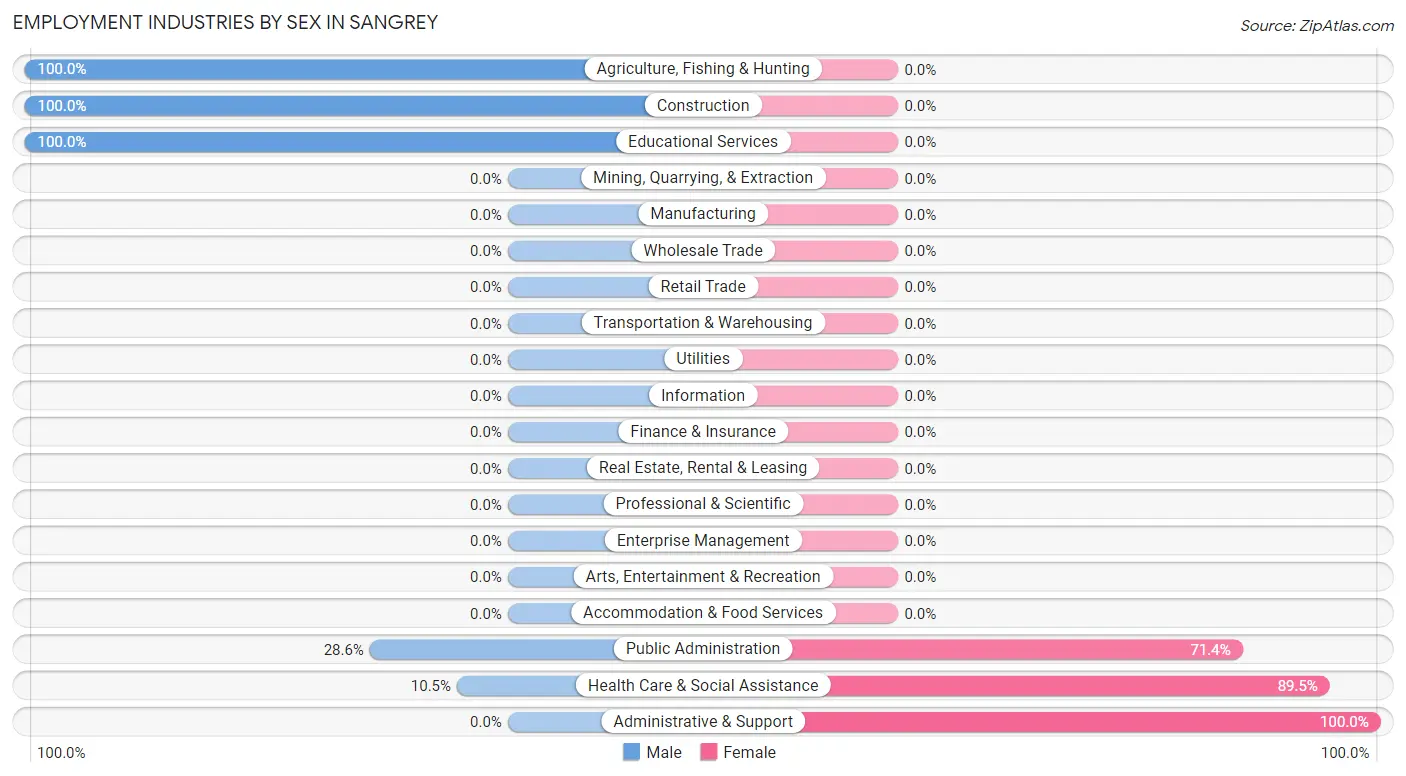
| Industry | Male | Female |
| Agriculture, Fishing & Hunting | 7 (100.0%) | 0 (0.0%) |
| Mining, Quarrying, & Extraction | 0 (0.0%) | 0 (0.0%) |
| Construction | 18 (100.0%) | 0 (0.0%) |
| Manufacturing | 0 (0.0%) | 0 (0.0%) |
| Wholesale Trade | 0 (0.0%) | 0 (0.0%) |
| Retail Trade | 0 (0.0%) | 0 (0.0%) |
| Transportation & Warehousing | 0 (0.0%) | 0 (0.0%) |
| Utilities | 0 (0.0%) | 0 (0.0%) |
| Information | 0 (0.0%) | 0 (0.0%) |
| Finance & Insurance | 0 (0.0%) | 0 (0.0%) |
| Real Estate, Rental & Leasing | 0 (0.0%) | 0 (0.0%) |
| Professional & Scientific | 0 (0.0%) | 0 (0.0%) |
| Enterprise Management | 0 (0.0%) | 0 (0.0%) |
| Administrative & Support | 0 (0.0%) | 18 (100.0%) |
| Educational Services | 6 (100.0%) | 0 (0.0%) |
| Health Care & Social Assistance | 2 (10.5%) | 17 (89.5%) |
| Arts, Entertainment & Recreation | 0 (0.0%) | 0 (0.0%) |
| Accommodation & Food Services | 0 (0.0%) | 0 (0.0%) |
| Public Administration | 6 (28.6%) | 15 (71.4%) |
| Total | 43 (43.4%) | 56 (56.6%) |
Education in Sangrey
School Enrollment in Sangrey
The most common levels of schooling among the 235 students in Sangrey are high school (82 | 34.9%), middle school (46 | 19.6%), and college / undergraduate (31 | 13.2%).
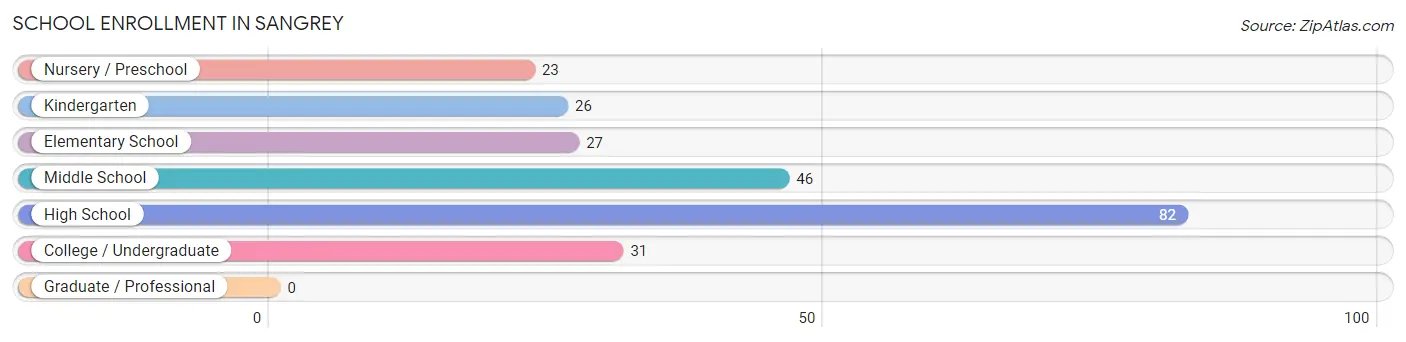
| School Level | # Students | % Students |
| Nursery / Preschool | 23 | 9.8% |
| Kindergarten | 26 | 11.1% |
| Elementary School | 27 | 11.5% |
| Middle School | 46 | 19.6% |
| High School | 82 | 34.9% |
| College / Undergraduate | 31 | 13.2% |
| Graduate / Professional | 0 | 0.0% |
| Total | 235 | 100.0% |
School Enrollment by Age by Funding Source in Sangrey
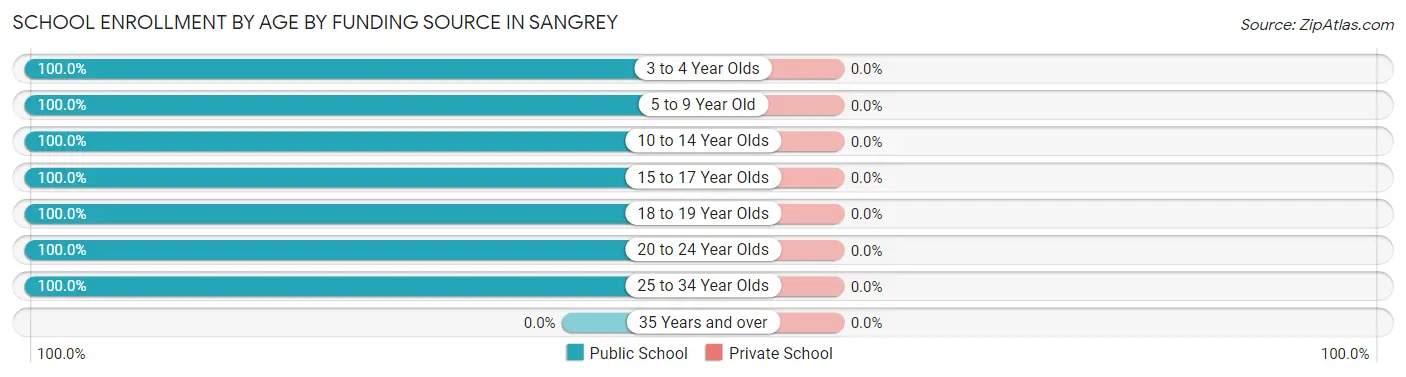
| Age Bracket | Public School | Private School |
| 3 to 4 Year Olds | 23 (100.0%) | 0 (0.0%) |
| 5 to 9 Year Old | 40 (100.0%) | 0 (0.0%) |
| 10 to 14 Year Olds | 69 (100.0%) | 0 (0.0%) |
| 15 to 17 Year Olds | 32 (100.0%) | 0 (0.0%) |
| 18 to 19 Year Olds | 18 (100.0%) | 0 (0.0%) |
| 20 to 24 Year Olds | 47 (100.0%) | 0 (0.0%) |
| 25 to 34 Year Olds | 6 (100.0%) | 0 (0.0%) |
| 35 Years and over | 0 (0.0%) | 0 (0.0%) |
| Total | 235 (100.0%) | 0 (0.0%) |
Educational Attainment by Field of Study in Sangrey
Social sciences (15 | 68.2%), and science & technology (7 | 31.8%) are the most common fields of study among 22 individuals in Sangrey who have obtained a bachelor's degree or higher.
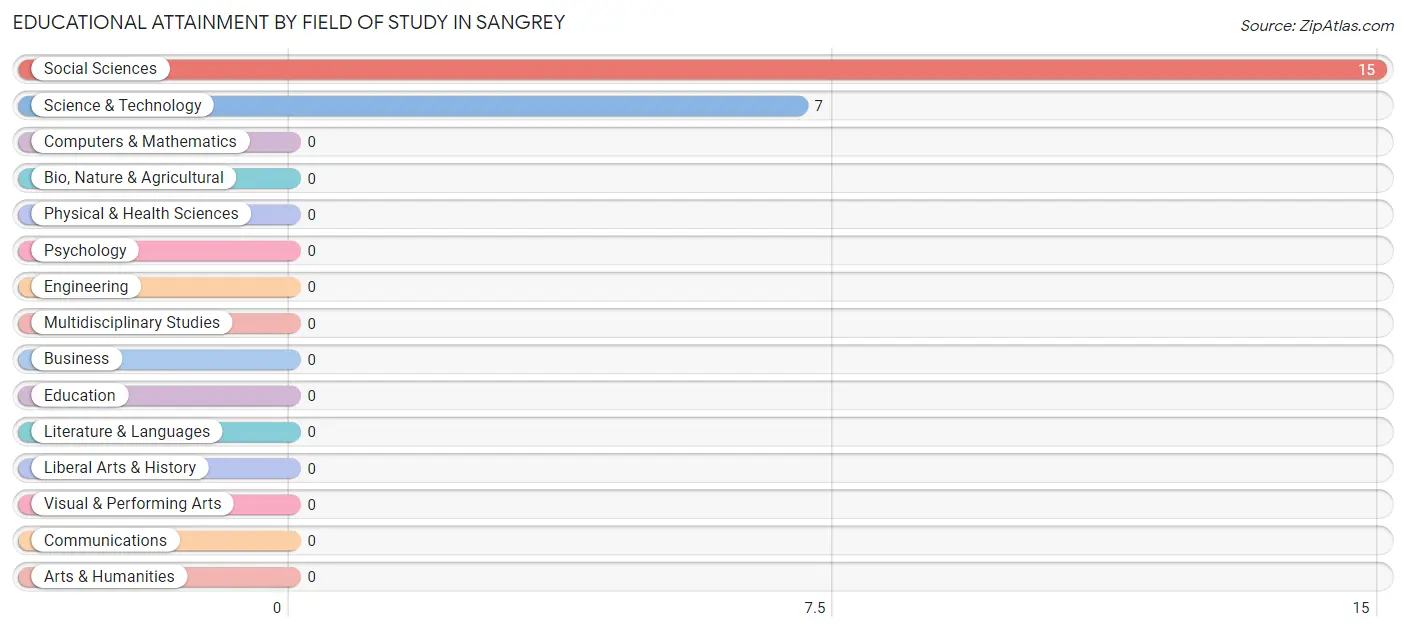
| Field of Study | # Graduates | % Graduates |
| Computers & Mathematics | 0 | 0.0% |
| Bio, Nature & Agricultural | 0 | 0.0% |
| Physical & Health Sciences | 0 | 0.0% |
| Psychology | 0 | 0.0% |
| Social Sciences | 15 | 68.2% |
| Engineering | 0 | 0.0% |
| Multidisciplinary Studies | 0 | 0.0% |
| Science & Technology | 7 | 31.8% |
| Business | 0 | 0.0% |
| Education | 0 | 0.0% |
| Literature & Languages | 0 | 0.0% |
| Liberal Arts & History | 0 | 0.0% |
| Visual & Performing Arts | 0 | 0.0% |
| Communications | 0 | 0.0% |
| Arts & Humanities | 0 | 0.0% |
| Total | 22 | 100.0% |
Transportation & Commute in Sangrey
Vehicle Availability by Sex in Sangrey
The most prevalent vehicle ownership categories in Sangrey are males with 3 vehicles (24, accounting for 55.8%) and females with 3 vehicles (29, making up 42.9%).
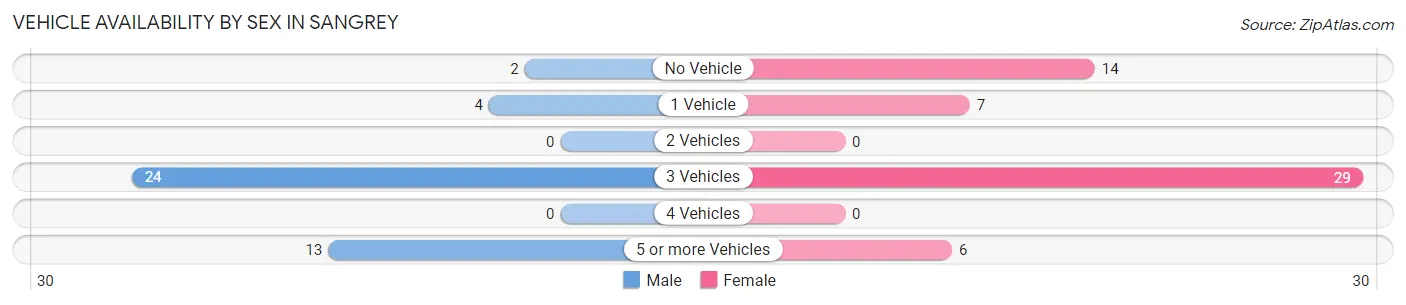
| Vehicles Available | Male | Female |
| No Vehicle | 2 (4.6%) | 14 (25.0%) |
| 1 Vehicle | 4 (9.3%) | 7 (12.5%) |
| 2 Vehicles | 0 (0.0%) | 0 (0.0%) |
| 3 Vehicles | 24 (55.8%) | 29 (51.8%) |
| 4 Vehicles | 0 (0.0%) | 0 (0.0%) |
| 5 or more Vehicles | 13 (30.2%) | 6 (10.7%) |
| Total | 43 (100.0%) | 56 (100.0%) |
Commute Time in Sangrey
The most frequently occuring commute durations in Sangrey are 15 to 19 minutes (21 commuters, 26.9%), 35 to 39 minutes (18 commuters, 23.1%), and 20 to 24 minutes (15 commuters, 19.2%).
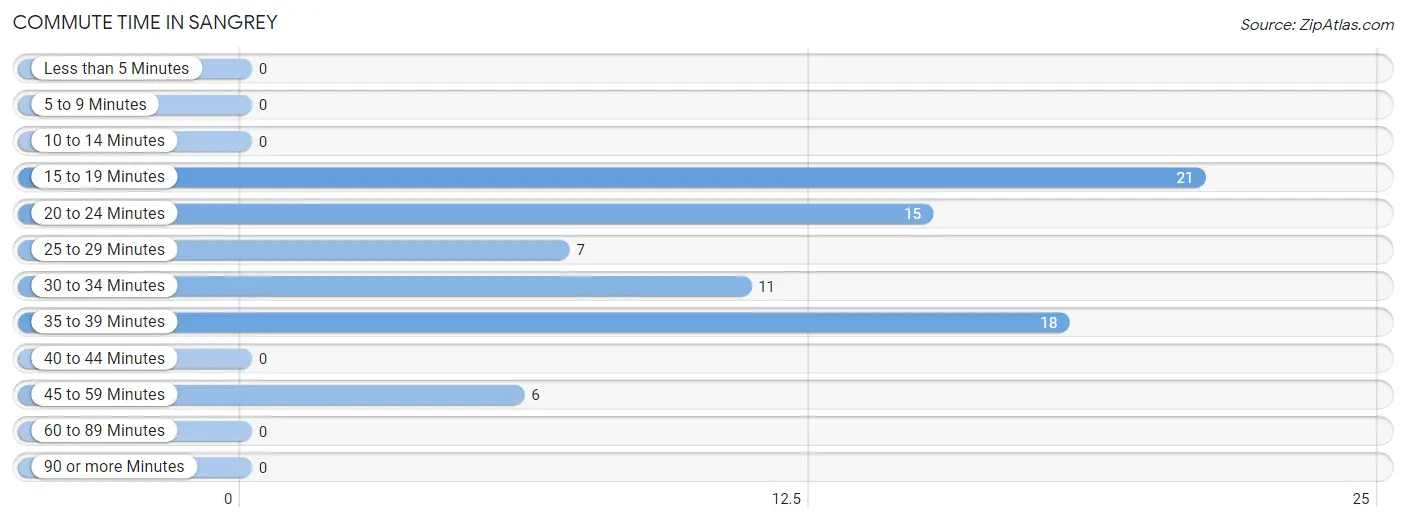
| Commute Time | # Commuters | % Commuters |
| Less than 5 Minutes | 0 | 0.0% |
| 5 to 9 Minutes | 0 | 0.0% |
| 10 to 14 Minutes | 0 | 0.0% |
| 15 to 19 Minutes | 21 | 26.9% |
| 20 to 24 Minutes | 15 | 19.2% |
| 25 to 29 Minutes | 7 | 9.0% |
| 30 to 34 Minutes | 11 | 14.1% |
| 35 to 39 Minutes | 18 | 23.1% |
| 40 to 44 Minutes | 0 | 0.0% |
| 45 to 59 Minutes | 6 | 7.7% |
| 60 to 89 Minutes | 0 | 0.0% |
| 90 or more Minutes | 0 | 0.0% |
Commute Time by Sex in Sangrey
The most common commute times in Sangrey are 35 to 39 minutes (18 commuters, 48.6%) for males and 15 to 19 minutes (21 commuters, 51.2%) for females.
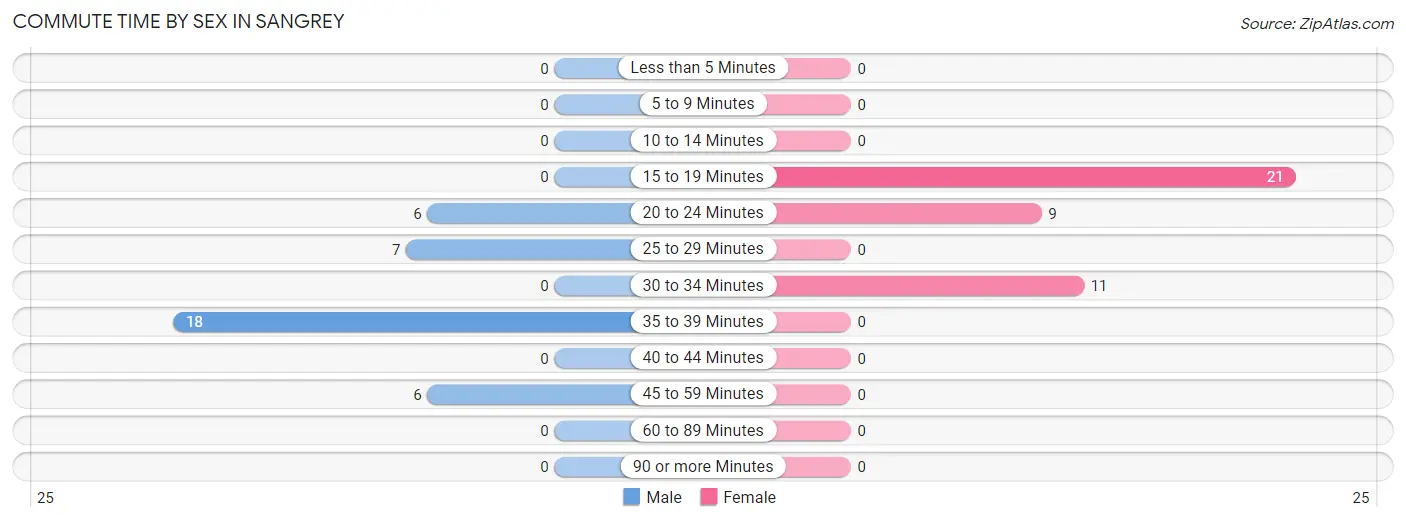
| Commute Time | Male | Female |
| Less than 5 Minutes | 0 (0.0%) | 0 (0.0%) |
| 5 to 9 Minutes | 0 (0.0%) | 0 (0.0%) |
| 10 to 14 Minutes | 0 (0.0%) | 0 (0.0%) |
| 15 to 19 Minutes | 0 (0.0%) | 21 (51.2%) |
| 20 to 24 Minutes | 6 (16.2%) | 9 (22.0%) |
| 25 to 29 Minutes | 7 (18.9%) | 0 (0.0%) |
| 30 to 34 Minutes | 0 (0.0%) | 11 (26.8%) |
| 35 to 39 Minutes | 18 (48.6%) | 0 (0.0%) |
| 40 to 44 Minutes | 0 (0.0%) | 0 (0.0%) |
| 45 to 59 Minutes | 6 (16.2%) | 0 (0.0%) |
| 60 to 89 Minutes | 0 (0.0%) | 0 (0.0%) |
| 90 or more Minutes | 0 (0.0%) | 0 (0.0%) |
Time of Departure to Work by Sex in Sangrey
The most frequent times of departure to work in Sangrey are 8:00 AM to 8:29 AM (18, 48.6%) for males and 7:30 AM to 7:59 AM (20, 48.8%) for females.
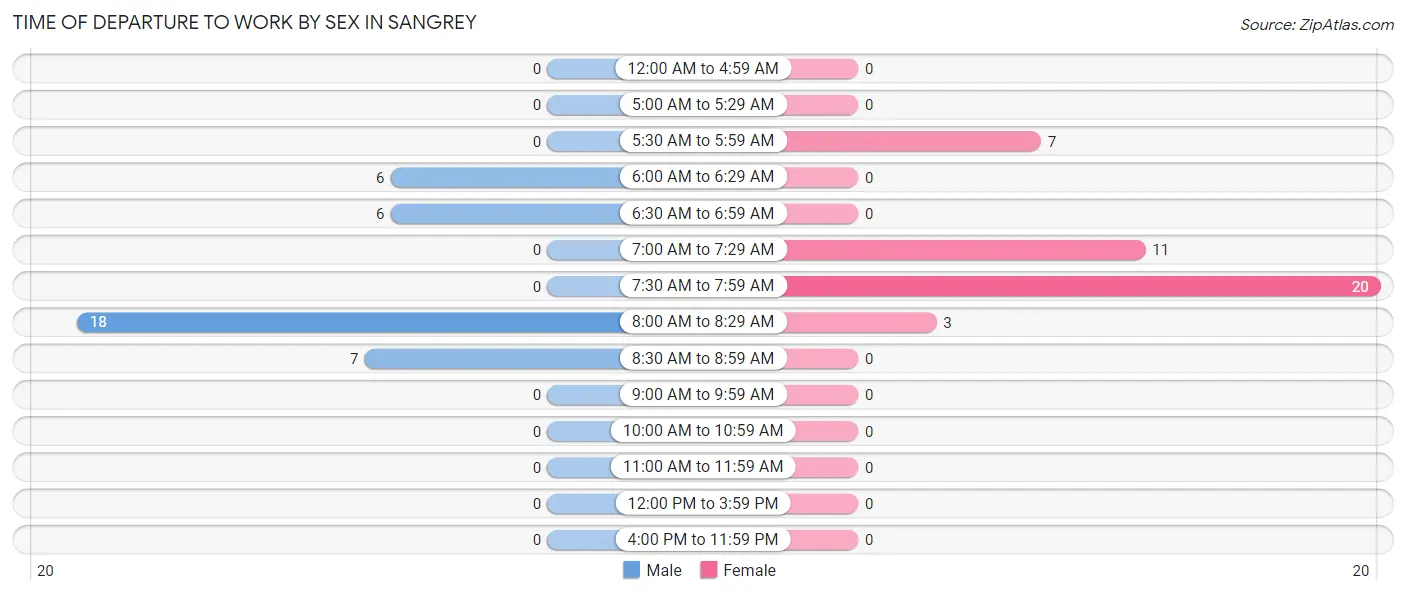
| Time of Departure | Male | Female |
| 12:00 AM to 4:59 AM | 0 (0.0%) | 0 (0.0%) |
| 5:00 AM to 5:29 AM | 0 (0.0%) | 0 (0.0%) |
| 5:30 AM to 5:59 AM | 0 (0.0%) | 7 (17.1%) |
| 6:00 AM to 6:29 AM | 6 (16.2%) | 0 (0.0%) |
| 6:30 AM to 6:59 AM | 6 (16.2%) | 0 (0.0%) |
| 7:00 AM to 7:29 AM | 0 (0.0%) | 11 (26.8%) |
| 7:30 AM to 7:59 AM | 0 (0.0%) | 20 (48.8%) |
| 8:00 AM to 8:29 AM | 18 (48.6%) | 3 (7.3%) |
| 8:30 AM to 8:59 AM | 7 (18.9%) | 0 (0.0%) |
| 9:00 AM to 9:59 AM | 0 (0.0%) | 0 (0.0%) |
| 10:00 AM to 10:59 AM | 0 (0.0%) | 0 (0.0%) |
| 11:00 AM to 11:59 AM | 0 (0.0%) | 0 (0.0%) |
| 12:00 PM to 3:59 PM | 0 (0.0%) | 0 (0.0%) |
| 4:00 PM to 11:59 PM | 0 (0.0%) | 0 (0.0%) |
| Total | 37 (100.0%) | 41 (100.0%) |
Housing Occupancy in Sangrey
Occupancy by Ownership in Sangrey
Of the total 90 dwellings in Sangrey, owner-occupied units account for 35 (38.9%), while renter-occupied units make up 55 (61.1%).
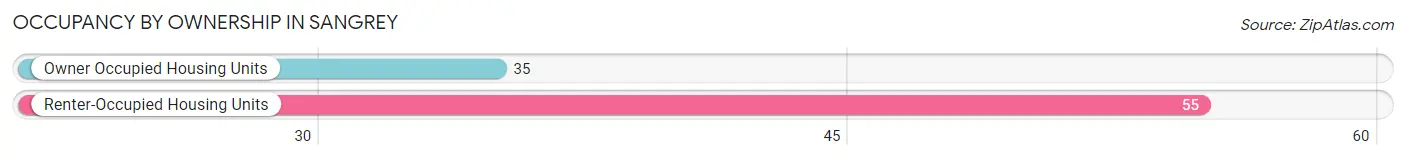
| Occupancy | # Housing Units | % Housing Units |
| Owner Occupied Housing Units | 35 | 38.9% |
| Renter-Occupied Housing Units | 55 | 61.1% |
| Total Occupied Housing Units | 90 | 100.0% |
Occupancy by Household Size in Sangrey
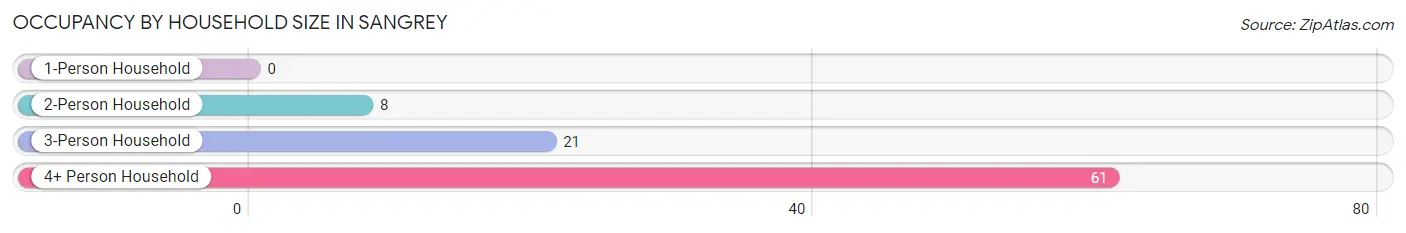
| Household Size | # Housing Units | % Housing Units |
| 1-Person Household | 0 | 0.0% |
| 2-Person Household | 8 | 8.9% |
| 3-Person Household | 21 | 23.3% |
| 4+ Person Household | 61 | 67.8% |
| Total Housing Units | 90 | 100.0% |
Occupancy by Ownership by Household Size in Sangrey
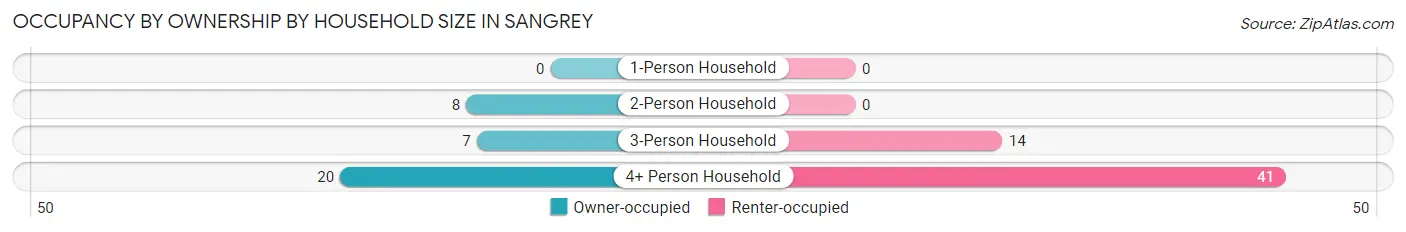
| Household Size | Owner-occupied | Renter-occupied |
| 1-Person Household | 0 (0.0%) | 0 (0.0%) |
| 2-Person Household | 8 (100.0%) | 0 (0.0%) |
| 3-Person Household | 7 (33.3%) | 14 (66.7%) |
| 4+ Person Household | 20 (32.8%) | 41 (67.2%) |
| Total Housing Units | 35 (38.9%) | 55 (61.1%) |
Occupancy by Educational Attainment in Sangrey
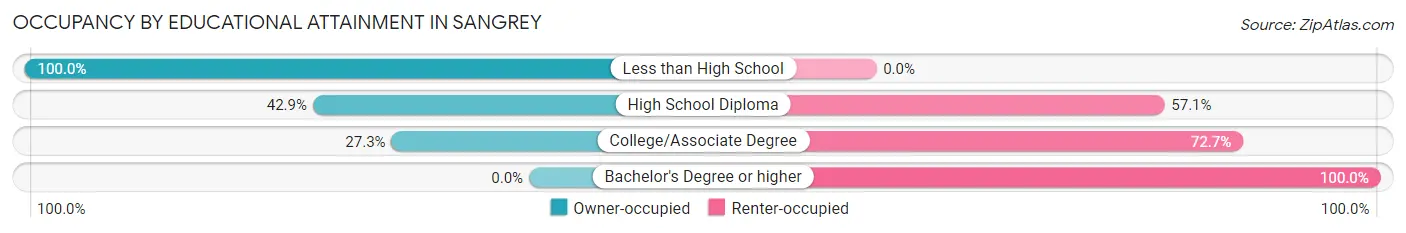
| Household Size | Owner-occupied | Renter-occupied |
| Less than High School | 5 (100.0%) | 0 (0.0%) |
| High School Diploma | 24 (42.9%) | 32 (57.1%) |
| College/Associate Degree | 6 (27.3%) | 16 (72.7%) |
| Bachelor's Degree or higher | 0 (0.0%) | 7 (100.0%) |
Occupancy by Age of Householder in Sangrey
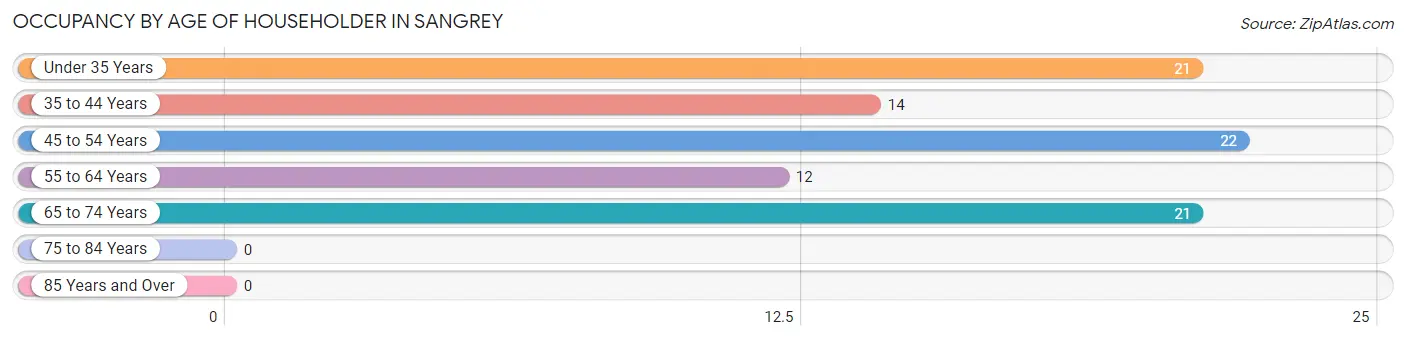
| Age Bracket | # Households | % Households |
| Under 35 Years | 21 | 23.3% |
| 35 to 44 Years | 14 | 15.6% |
| 45 to 54 Years | 22 | 24.4% |
| 55 to 64 Years | 12 | 13.3% |
| 65 to 74 Years | 21 | 23.3% |
| 75 to 84 Years | 0 | 0.0% |
| 85 Years and Over | 0 | 0.0% |
| Total | 90 | 100.0% |
Housing Finances in Sangrey
Median Income by Occupancy in Sangrey
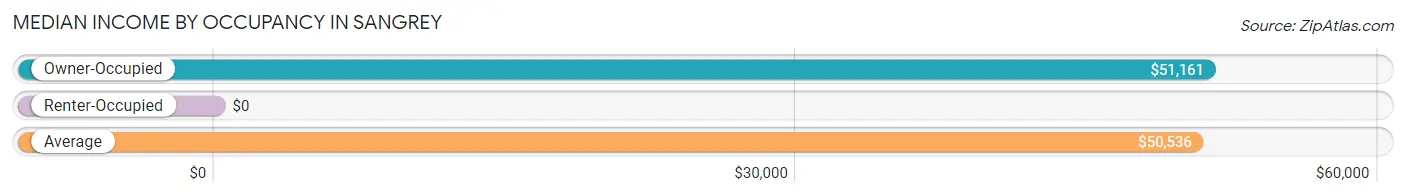
| Occupancy Type | # Households | Median Income |
| Owner-Occupied | 35 (38.9%) | $51,161 |
| Renter-Occupied | 55 (61.1%) | $0 |
| Average | 90 (100.0%) | $50,536 |
Occupancy by Householder Income Bracket in Sangrey
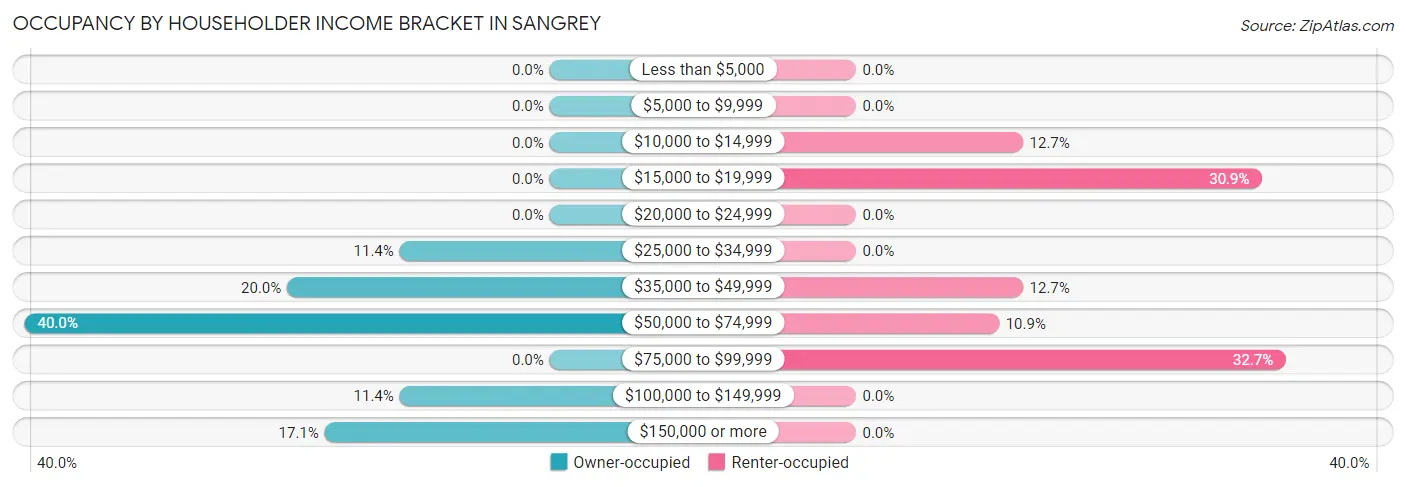
| Income Bracket | Owner-occupied | Renter-occupied |
| Less than $5,000 | 0 (0.0%) | 0 (0.0%) |
| $5,000 to $9,999 | 0 (0.0%) | 0 (0.0%) |
| $10,000 to $14,999 | 0 (0.0%) | 7 (12.7%) |
| $15,000 to $19,999 | 0 (0.0%) | 17 (30.9%) |
| $20,000 to $24,999 | 0 (0.0%) | 0 (0.0%) |
| $25,000 to $34,999 | 4 (11.4%) | 0 (0.0%) |
| $35,000 to $49,999 | 7 (20.0%) | 7 (12.7%) |
| $50,000 to $74,999 | 14 (40.0%) | 6 (10.9%) |
| $75,000 to $99,999 | 0 (0.0%) | 18 (32.7%) |
| $100,000 to $149,999 | 4 (11.4%) | 0 (0.0%) |
| $150,000 or more | 6 (17.1%) | 0 (0.0%) |
| Total | 35 (100.0%) | 55 (100.0%) |
Monthly Housing Cost Tiers in Sangrey
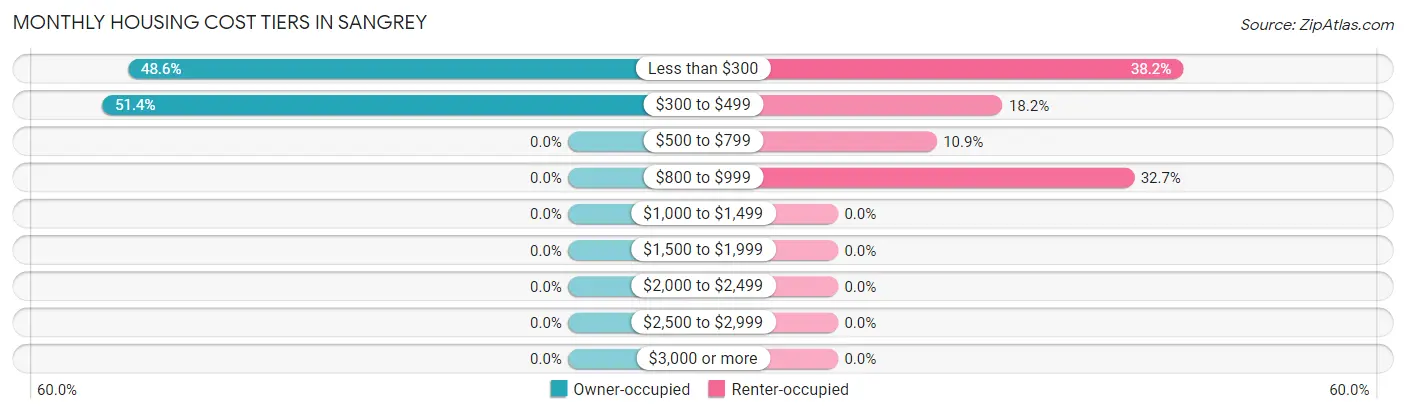
| Monthly Cost | Owner-occupied | Renter-occupied |
| Less than $300 | 17 (48.6%) | 21 (38.2%) |
| $300 to $499 | 18 (51.4%) | 10 (18.2%) |
| $500 to $799 | 0 (0.0%) | 6 (10.9%) |
| $800 to $999 | 0 (0.0%) | 18 (32.7%) |
| $1,000 to $1,499 | 0 (0.0%) | 0 (0.0%) |
| $1,500 to $1,999 | 0 (0.0%) | 0 (0.0%) |
| $2,000 to $2,499 | 0 (0.0%) | 0 (0.0%) |
| $2,500 to $2,999 | 0 (0.0%) | 0 (0.0%) |
| $3,000 or more | 0 (0.0%) | 0 (0.0%) |
| Total | 35 (100.0%) | 55 (100.0%) |
Physical Housing Characteristics in Sangrey
Housing Structures in Sangrey
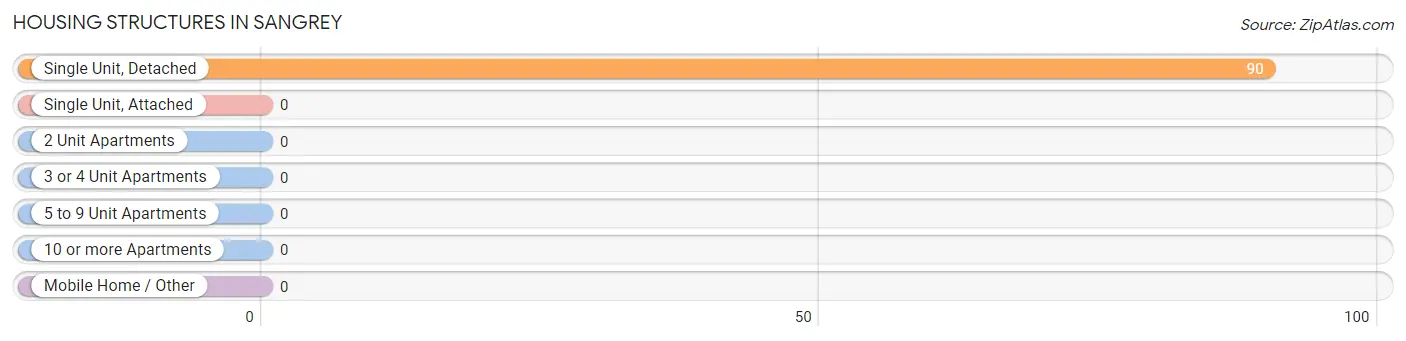
| Structure Type | # Housing Units | % Housing Units |
| Single Unit, Detached | 90 | 100.0% |
| Single Unit, Attached | 0 | 0.0% |
| 2 Unit Apartments | 0 | 0.0% |
| 3 or 4 Unit Apartments | 0 | 0.0% |
| 5 to 9 Unit Apartments | 0 | 0.0% |
| 10 or more Apartments | 0 | 0.0% |
| Mobile Home / Other | 0 | 0.0% |
| Total | 90 | 100.0% |
Housing Structures by Occupancy in Sangrey
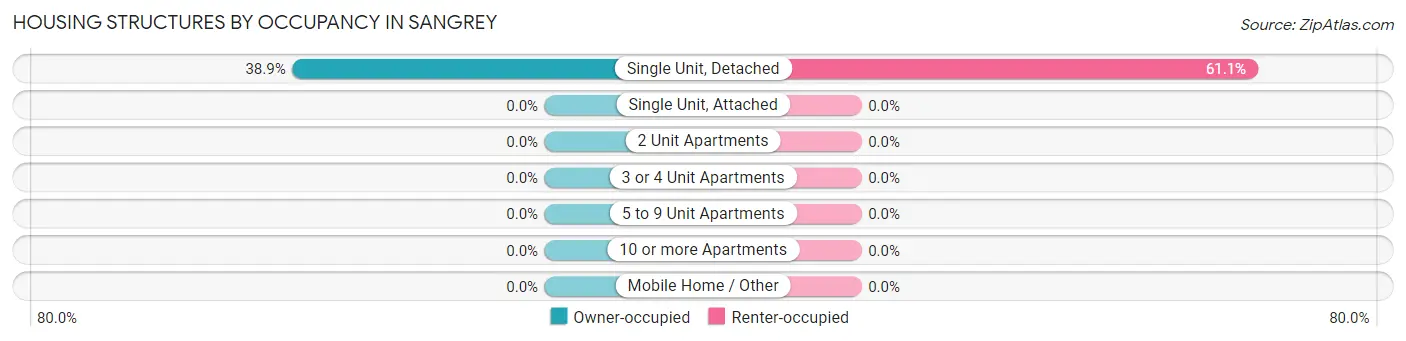
| Structure Type | Owner-occupied | Renter-occupied |
| Single Unit, Detached | 35 (38.9%) | 55 (61.1%) |
| Single Unit, Attached | 0 (0.0%) | 0 (0.0%) |
| 2 Unit Apartments | 0 (0.0%) | 0 (0.0%) |
| 3 or 4 Unit Apartments | 0 (0.0%) | 0 (0.0%) |
| 5 to 9 Unit Apartments | 0 (0.0%) | 0 (0.0%) |
| 10 or more Apartments | 0 (0.0%) | 0 (0.0%) |
| Mobile Home / Other | 0 (0.0%) | 0 (0.0%) |
| Total | 35 (38.9%) | 55 (61.1%) |
Housing Structures by Number of Rooms in Sangrey
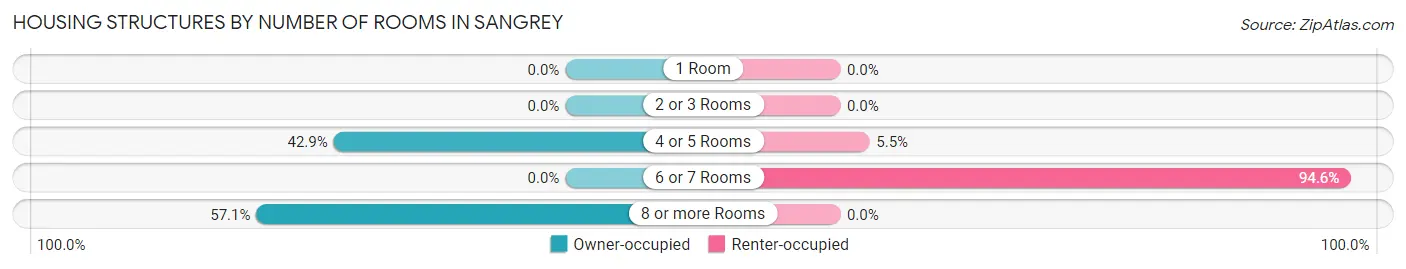
| Number of Rooms | Owner-occupied | Renter-occupied |
| 1 Room | 0 (0.0%) | 0 (0.0%) |
| 2 or 3 Rooms | 0 (0.0%) | 0 (0.0%) |
| 4 or 5 Rooms | 15 (42.9%) | 3 (5.4%) |
| 6 or 7 Rooms | 0 (0.0%) | 52 (94.6%) |
| 8 or more Rooms | 20 (57.1%) | 0 (0.0%) |
| Total | 35 (100.0%) | 55 (100.0%) |
Housing Structure by Heating Type in Sangrey
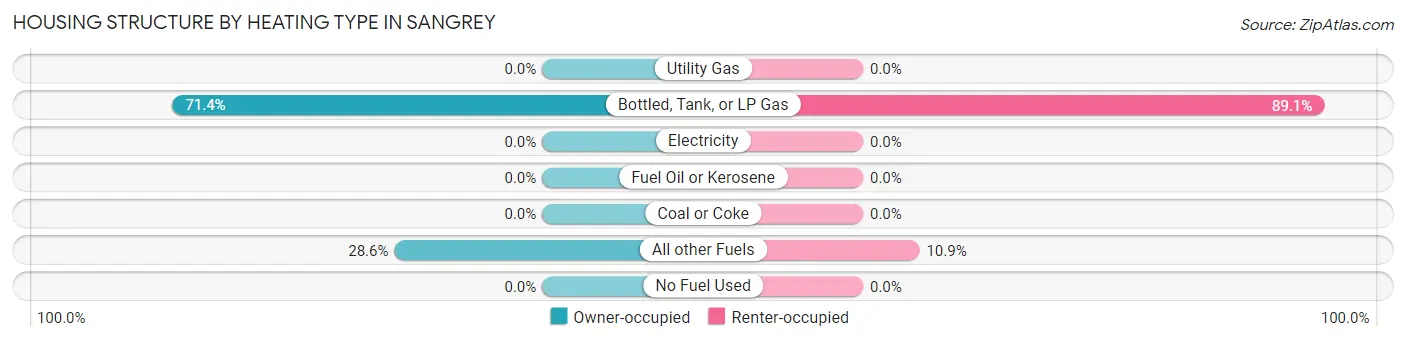
| Heating Type | Owner-occupied | Renter-occupied |
| Utility Gas | 0 (0.0%) | 0 (0.0%) |
| Bottled, Tank, or LP Gas | 25 (71.4%) | 49 (89.1%) |
| Electricity | 0 (0.0%) | 0 (0.0%) |
| Fuel Oil or Kerosene | 0 (0.0%) | 0 (0.0%) |
| Coal or Coke | 0 (0.0%) | 0 (0.0%) |
| All other Fuels | 10 (28.6%) | 6 (10.9%) |
| No Fuel Used | 0 (0.0%) | 0 (0.0%) |
| Total | 35 (100.0%) | 55 (100.0%) |
Household Vehicle Usage in Sangrey
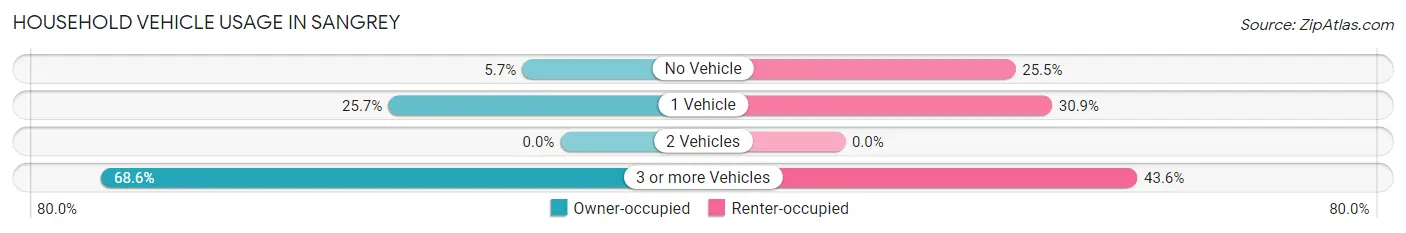
| Vehicles per Household | Owner-occupied | Renter-occupied |
| No Vehicle | 2 (5.7%) | 14 (25.5%) |
| 1 Vehicle | 9 (25.7%) | 17 (30.9%) |
| 2 Vehicles | 0 (0.0%) | 0 (0.0%) |
| 3 or more Vehicles | 24 (68.6%) | 24 (43.6%) |
| Total | 35 (100.0%) | 55 (100.0%) |
Real Estate & Mortgages in Sangrey
Real Estate and Mortgage Overview in Sangrey
| Characteristic | Without Mortgage | With Mortgage |
| Housing Units | 35 | 0 |
| Median Property Value | $108,100 | $0 |
| Median Household Income | $51,161 | $0 |
| Monthly Housing Costs | $351 | $0 |
| Real Estate Taxes | - | - |
Property Value by Mortgage Status in Sangrey
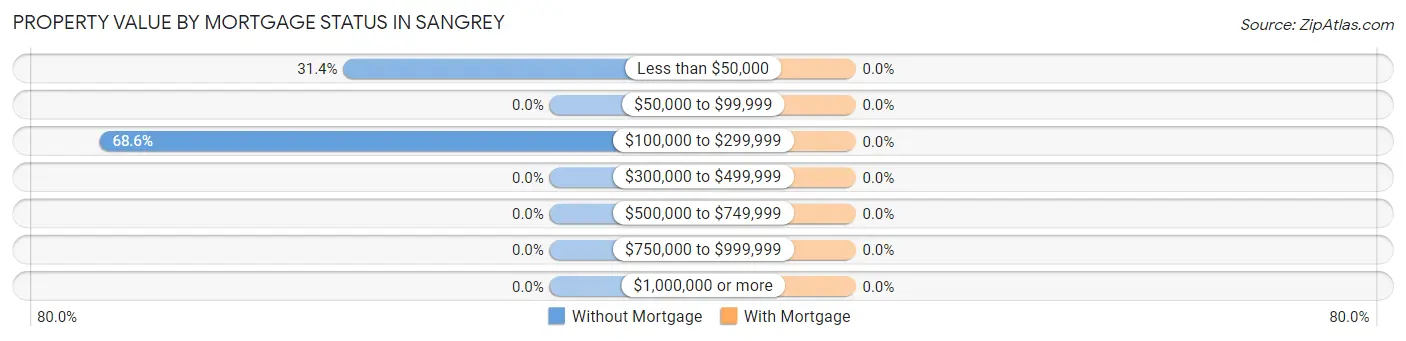
| Property Value | Without Mortgage | With Mortgage |
| Less than $50,000 | 11 (31.4%) | 0 (0.0%) |
| $50,000 to $99,999 | 0 (0.0%) | 0 (0.0%) |
| $100,000 to $299,999 | 24 (68.6%) | 0 (0.0%) |
| $300,000 to $499,999 | 0 (0.0%) | 0 (0.0%) |
| $500,000 to $749,999 | 0 (0.0%) | 0 (0.0%) |
| $750,000 to $999,999 | 0 (0.0%) | 0 (0.0%) |
| $1,000,000 or more | 0 (0.0%) | 0 (0.0%) |
| Total | 35 (100.0%) | 0 (0.0%) |
Household Income by Mortgage Status in Sangrey
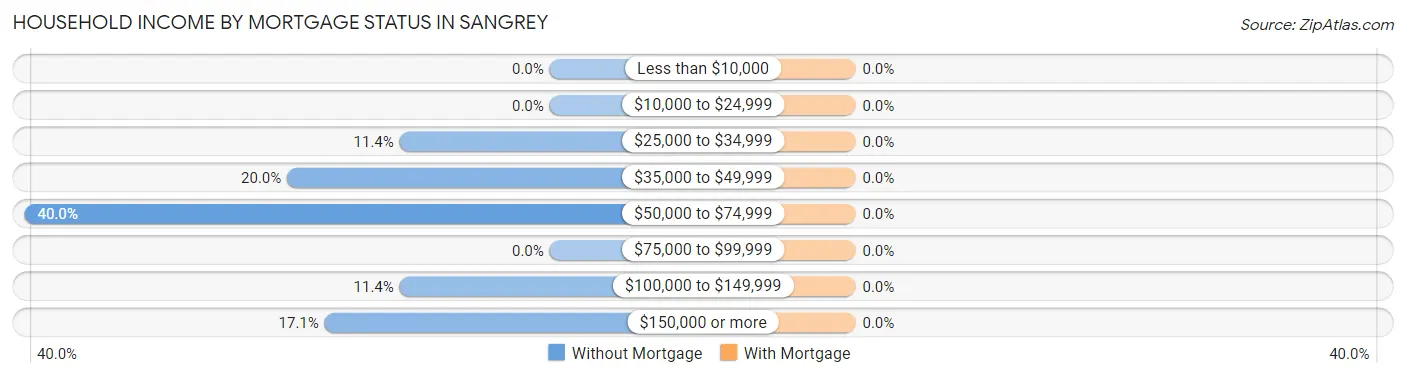
| Household Income | Without Mortgage | With Mortgage |
| Less than $10,000 | 0 (0.0%) | 0 (0.0%) |
| $10,000 to $24,999 | 0 (0.0%) | 0 (0.0%) |
| $25,000 to $34,999 | 4 (11.4%) | 0 (0.0%) |
| $35,000 to $49,999 | 7 (20.0%) | 0 (0.0%) |
| $50,000 to $74,999 | 14 (40.0%) | 0 (0.0%) |
| $75,000 to $99,999 | 0 (0.0%) | 0 (0.0%) |
| $100,000 to $149,999 | 4 (11.4%) | 0 (0.0%) |
| $150,000 or more | 6 (17.1%) | 0 (0.0%) |
| Total | 35 (100.0%) | 0 (0.0%) |
Property Value to Household Income Ratio in Sangrey
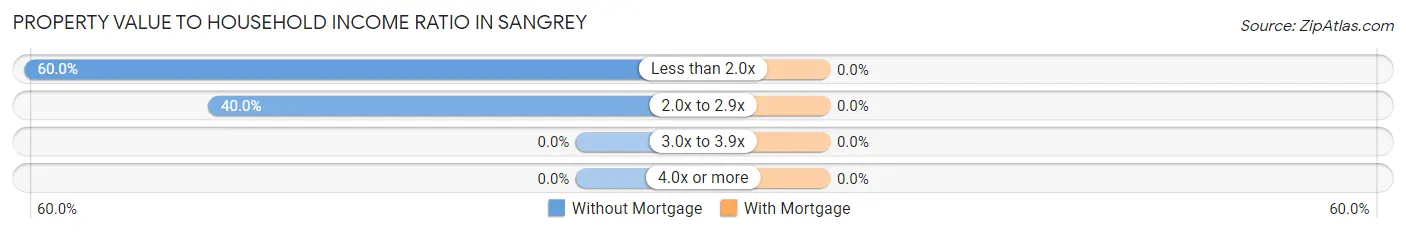
| Value-to-Income Ratio | Without Mortgage | With Mortgage |
| Less than 2.0x | 21 (60.0%) | 0 (0.0%) |
| 2.0x to 2.9x | 14 (40.0%) | 0 (0.0%) |
| 3.0x to 3.9x | 0 (0.0%) | 0 (0.0%) |
| 4.0x or more | 0 (0.0%) | 0 (0.0%) |
| Total | 35 (100.0%) | 0 (0.0%) |
Real Estate Taxes by Mortgage Status in Sangrey
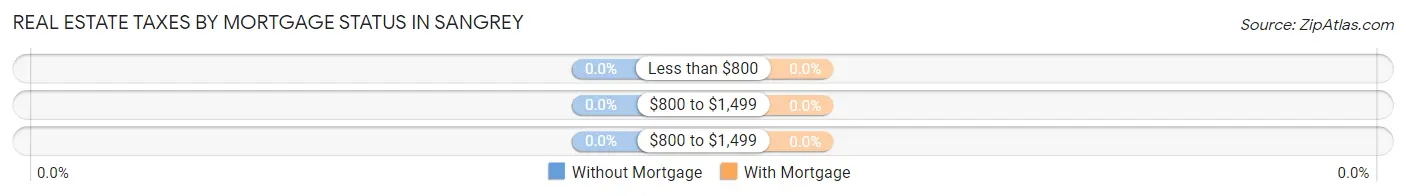
| Property Taxes | Without Mortgage | With Mortgage |
| Less than $800 | 0 (0.0%) | 0 (0.0%) |
| $800 to $1,499 | 0 (0.0%) | 0 (0.0%) |
| $800 to $1,499 | 0 (0.0%) | 0 (0.0%) |
| Total | 35 (100.0%) | 0 (0.0%) |
Health & Disability in Sangrey
Health Insurance Coverage by Age in Sangrey
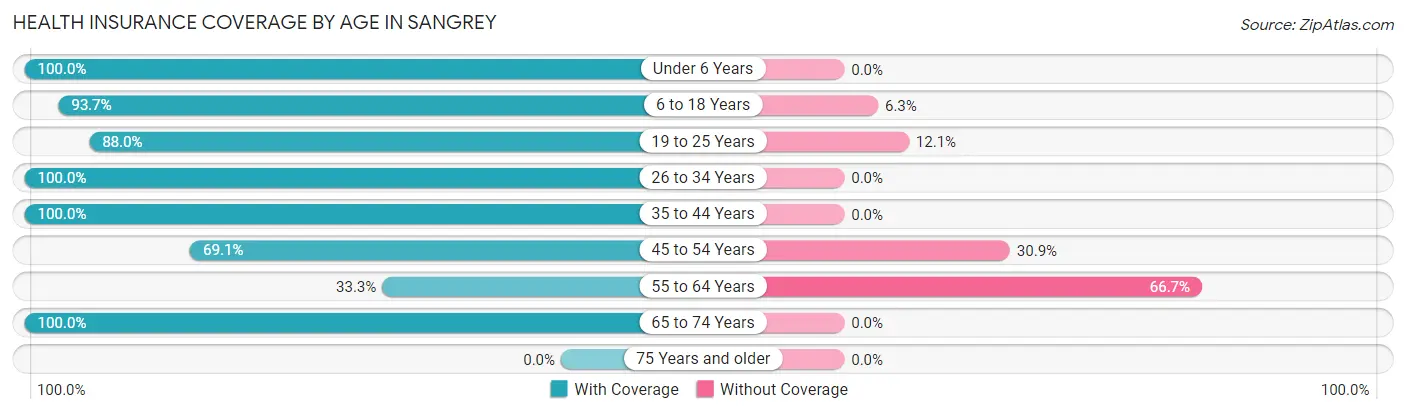
| Age Bracket | With Coverage | Without Coverage |
| Under 6 Years | 56 (100.0%) | 0 (0.0%) |
| 6 to 18 Years | 149 (93.7%) | 10 (6.3%) |
| 19 to 25 Years | 73 (87.9%) | 10 (12.0%) |
| 26 to 34 Years | 50 (100.0%) | 0 (0.0%) |
| 35 to 44 Years | 41 (100.0%) | 0 (0.0%) |
| 45 to 54 Years | 47 (69.1%) | 21 (30.9%) |
| 55 to 64 Years | 4 (33.3%) | 8 (66.7%) |
| 65 to 74 Years | 32 (100.0%) | 0 (0.0%) |
| 75 Years and older | 0 (0.0%) | 0 (0.0%) |
| Total | 452 (90.2%) | 49 (9.8%) |
Health Insurance Coverage by Citizenship Status in Sangrey
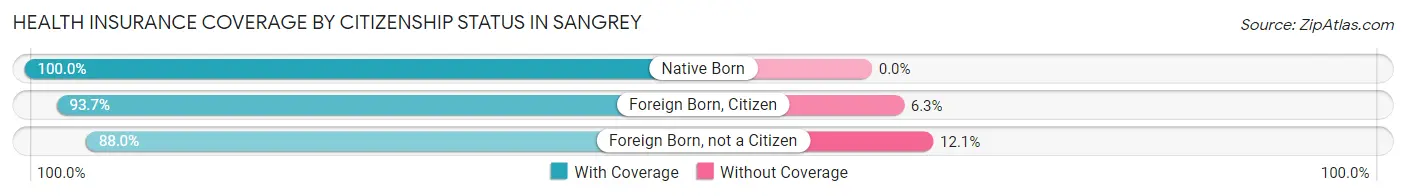
| Citizenship Status | With Coverage | Without Coverage |
| Native Born | 56 (100.0%) | 0 (0.0%) |
| Foreign Born, Citizen | 149 (93.7%) | 10 (6.3%) |
| Foreign Born, not a Citizen | 73 (87.9%) | 10 (12.0%) |
Health Insurance Coverage by Household Income in Sangrey
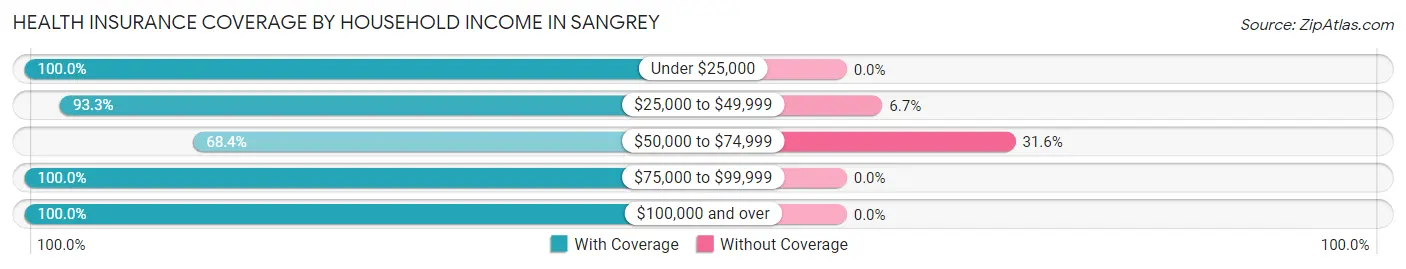
| Household Income | With Coverage | Without Coverage |
| Under $25,000 | 126 (100.0%) | 0 (0.0%) |
| $25,000 to $49,999 | 84 (93.3%) | 6 (6.7%) |
| $50,000 to $74,999 | 93 (68.4%) | 43 (31.6%) |
| $75,000 to $99,999 | 61 (100.0%) | 0 (0.0%) |
| $100,000 and over | 88 (100.0%) | 0 (0.0%) |
Public vs Private Health Insurance Coverage by Age in Sangrey
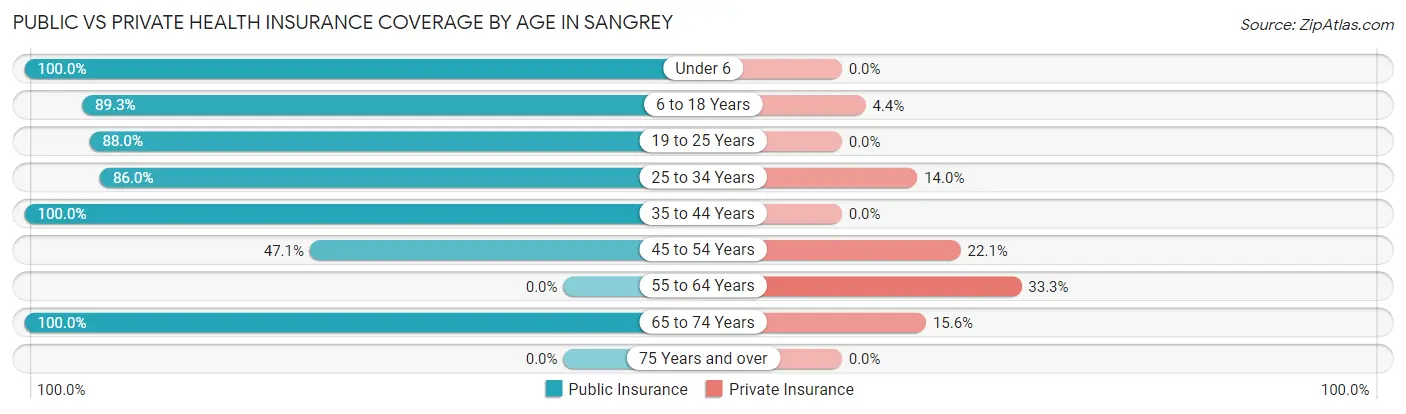
| Age Bracket | Public Insurance | Private Insurance |
| Under 6 | 56 (100.0%) | 0 (0.0%) |
| 6 to 18 Years | 142 (89.3%) | 7 (4.4%) |
| 19 to 25 Years | 73 (87.9%) | 0 (0.0%) |
| 25 to 34 Years | 43 (86.0%) | 7 (14.0%) |
| 35 to 44 Years | 41 (100.0%) | 0 (0.0%) |
| 45 to 54 Years | 32 (47.1%) | 15 (22.1%) |
| 55 to 64 Years | 0 (0.0%) | 4 (33.3%) |
| 65 to 74 Years | 32 (100.0%) | 5 (15.6%) |
| 75 Years and over | 0 (0.0%) | 0 (0.0%) |
| Total | 419 (83.6%) | 38 (7.6%) |
Disability Status by Sex by Age in Sangrey
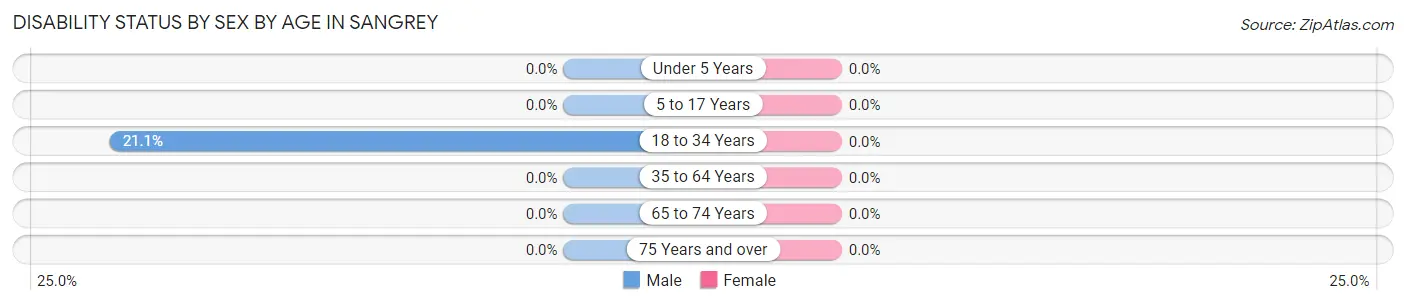
| Age Bracket | Male | Female |
| Under 5 Years | 0 (0.0%) | 0 (0.0%) |
| 5 to 17 Years | 0 (0.0%) | 0 (0.0%) |
| 18 to 34 Years | 24 (21.0%) | 0 (0.0%) |
| 35 to 64 Years | 0 (0.0%) | 0 (0.0%) |
| 65 to 74 Years | 0 (0.0%) | 0 (0.0%) |
| 75 Years and over | 0 (0.0%) | 0 (0.0%) |
Disability Class by Sex by Age in Sangrey
Disability Class: Hearing Difficulty
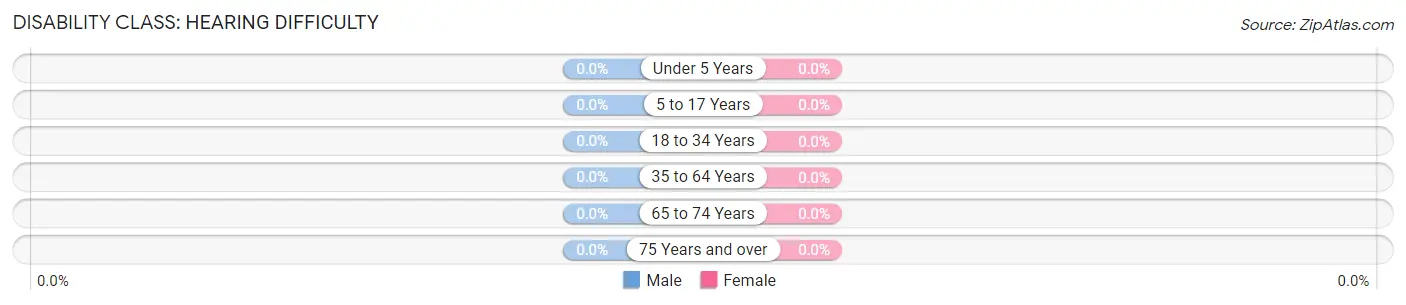
| Age Bracket | Male | Female |
| Under 5 Years | 0 (0.0%) | 0 (0.0%) |
| 5 to 17 Years | 0 (0.0%) | 0 (0.0%) |
| 18 to 34 Years | 0 (0.0%) | 0 (0.0%) |
| 35 to 64 Years | 0 (0.0%) | 0 (0.0%) |
| 65 to 74 Years | 0 (0.0%) | 0 (0.0%) |
| 75 Years and over | 0 (0.0%) | 0 (0.0%) |
Disability Class: Vision Difficulty
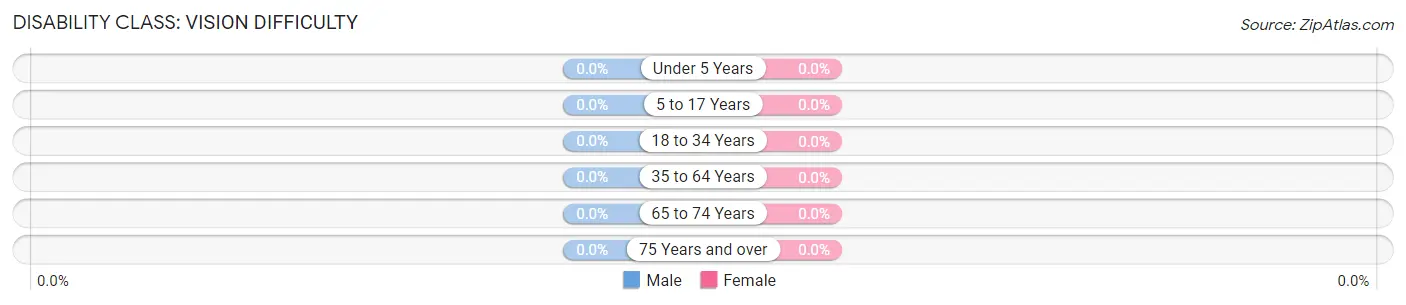
| Age Bracket | Male | Female |
| Under 5 Years | 0 (0.0%) | 0 (0.0%) |
| 5 to 17 Years | 0 (0.0%) | 0 (0.0%) |
| 18 to 34 Years | 0 (0.0%) | 0 (0.0%) |
| 35 to 64 Years | 0 (0.0%) | 0 (0.0%) |
| 65 to 74 Years | 0 (0.0%) | 0 (0.0%) |
| 75 Years and over | 0 (0.0%) | 0 (0.0%) |
Disability Class: Cognitive Difficulty
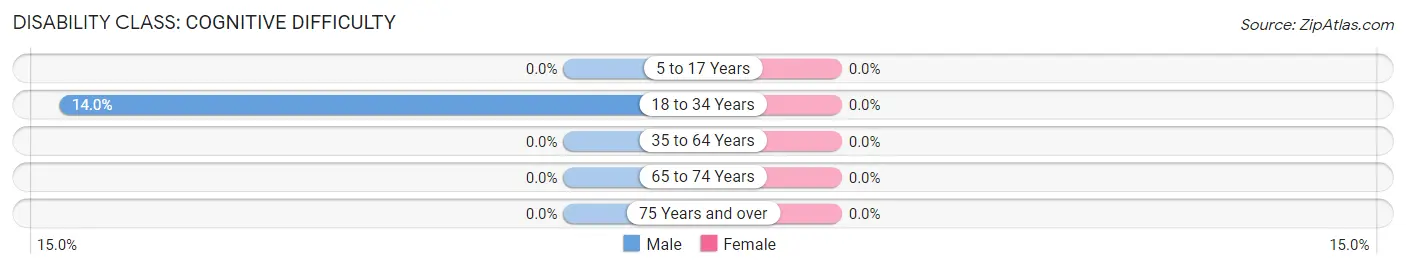
| Age Bracket | Male | Female |
| 5 to 17 Years | 0 (0.0%) | 0 (0.0%) |
| 18 to 34 Years | 16 (14.0%) | 0 (0.0%) |
| 35 to 64 Years | 0 (0.0%) | 0 (0.0%) |
| 65 to 74 Years | 0 (0.0%) | 0 (0.0%) |
| 75 Years and over | 0 (0.0%) | 0 (0.0%) |
Disability Class: Ambulatory Difficulty
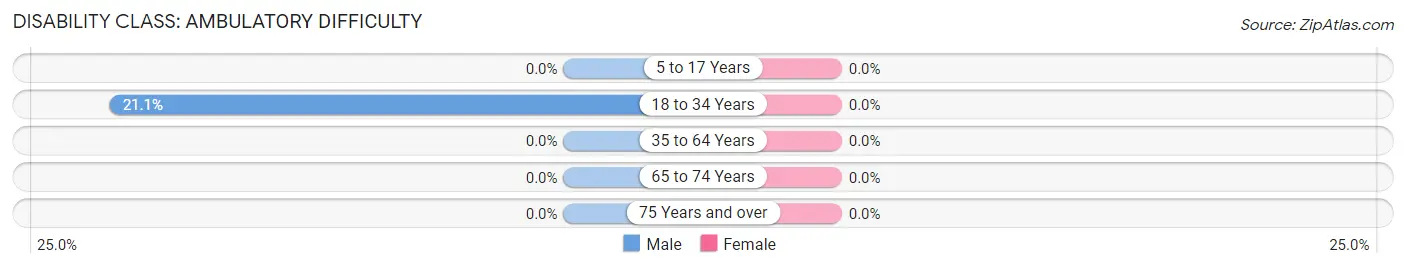
| Age Bracket | Male | Female |
| 5 to 17 Years | 0 (0.0%) | 0 (0.0%) |
| 18 to 34 Years | 24 (21.0%) | 0 (0.0%) |
| 35 to 64 Years | 0 (0.0%) | 0 (0.0%) |
| 65 to 74 Years | 0 (0.0%) | 0 (0.0%) |
| 75 Years and over | 0 (0.0%) | 0 (0.0%) |
Disability Class: Self-Care Difficulty
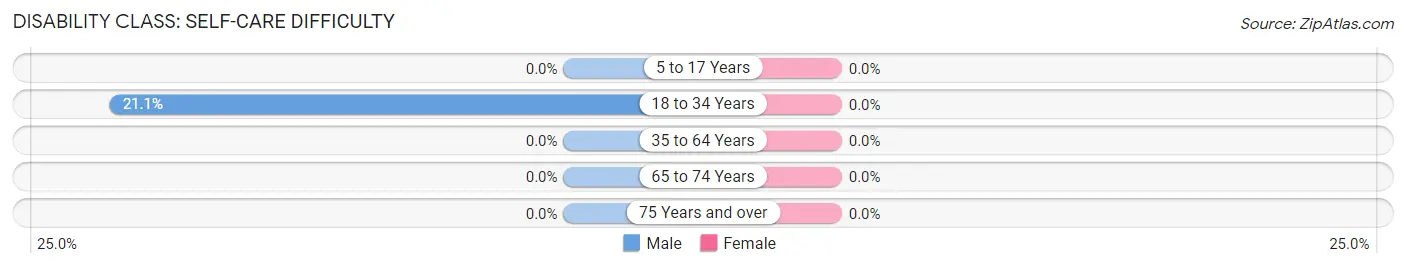
| Age Bracket | Male | Female |
| 5 to 17 Years | 0 (0.0%) | 0 (0.0%) |
| 18 to 34 Years | 24 (21.0%) | 0 (0.0%) |
| 35 to 64 Years | 0 (0.0%) | 0 (0.0%) |
| 65 to 74 Years | 0 (0.0%) | 0 (0.0%) |
| 75 Years and over | 0 (0.0%) | 0 (0.0%) |
Technology Access in Sangrey
Computing Device Access in Sangrey
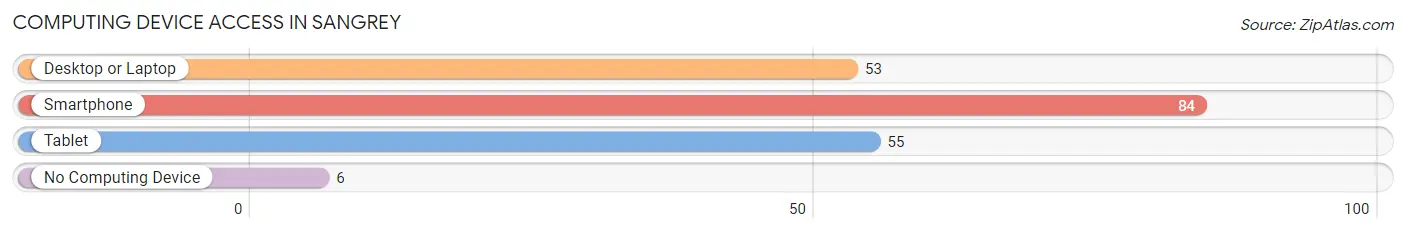
| Device Type | # Households | % Households |
| Desktop or Laptop | 53 | 58.9% |
| Smartphone | 84 | 93.3% |
| Tablet | 55 | 61.1% |
| No Computing Device | 6 | 6.7% |
| Total | 90 | 100.0% |
Internet Access in Sangrey
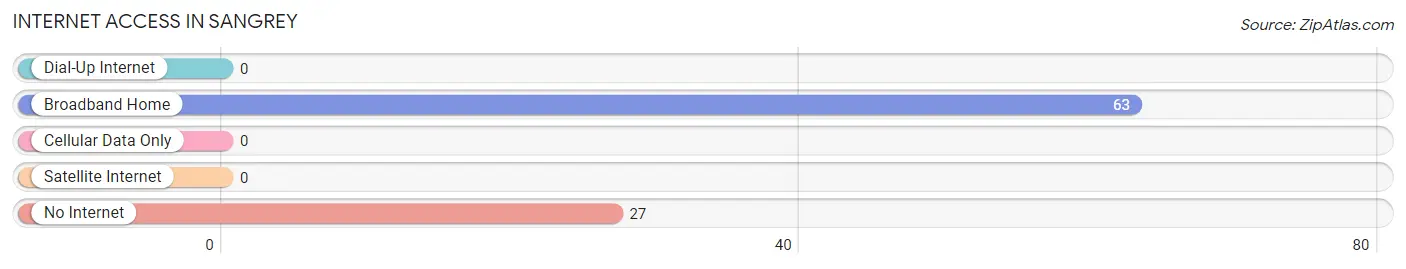
| Internet Type | # Households | % Households |
| Dial-Up Internet | 0 | 0.0% |
| Broadband Home | 63 | 70.0% |
| Cellular Data Only | 0 | 0.0% |
| Satellite Internet | 0 | 0.0% |
| No Internet | 27 | 30.0% |
| Total | 90 | 100.0% |
Sangrey Summary
Sangrey is a small unincorporated community located in the northern part of Montana, in the United States. It is situated in the Lewis and Clark County, and is located about 20 miles north of Helena, the state capital. The population of Sangrey was estimated to be around 200 people in the year 2000.
History
Sangrey was first settled in the late 1800s by a group of homesteaders who were looking for a place to call home. The area was originally known as “Sangrey’s Ranch”, and was named after the first settler, John Sangrey. The area was mostly used for cattle ranching and farming, and the first post office was established in 1891.
In the early 1900s, the area began to grow and develop, and the first school was built in 1910. The town was officially incorporated in 1912, and the population grew to around 500 people by the 1920s.
Geography
Sangrey is located in the northern part of Montana, in the Lewis and Clark County. It is situated about 20 miles north of Helena, the state capital. The area is mostly rural, with rolling hills and open fields. The climate is semi-arid, with hot summers and cold winters.
Economy
The economy of Sangrey is mostly based on agriculture and ranching. The area is known for its cattle ranching, and the local farmers grow a variety of crops, including wheat, barley, oats, and hay. The area also has some small businesses, such as a general store, a gas station, and a few restaurants.
Demographics
As of the year 2000, the population of Sangrey was estimated to be around 200 people. The racial makeup of the town was mostly white, with a small percentage of Native Americans. The median household income was around $30,000, and the median age was around 40 years old.
Conclusion
Sangrey is a small unincorporated community located in the northern part of Montana. It has a long history of cattle ranching and farming, and the population was estimated to be around 200 people in the year 2000. The economy is mostly based on agriculture and ranching, and the racial makeup of the town is mostly white, with a small percentage of Native Americans.
Common Questions
What is Per Capita Income in Sangrey?
Per Capita income in Sangrey is $12,081.
What is the Median Family Income in Sangrey?
Median Family Income in Sangrey is $50,536.
What is the Median Household income in Sangrey?
Median Household Income in Sangrey is $50,536.
What is Family Income Deficit in Sangrey?
Family Income Deficit in Sangrey is $10,304.
Families that are below poverty line in Sangrey earn $10,304 less on average than the poverty threshold level.
What is Inequality or Gini Index in Sangrey?
Inequality or Gini Index in Sangrey is 0.38.
What is the Total Population of Sangrey?
Total Population of Sangrey is 501.
What is the Total Male Population of Sangrey?
Total Male Population of Sangrey is 316.
What is the Total Female Population of Sangrey?
Total Female Population of Sangrey is 185.
What is the Ratio of Males per 100 Females in Sangrey?
There are 170.81 Males per 100 Females in Sangrey.
What is the Ratio of Females per 100 Males in Sangrey?
There are 58.54 Females per 100 Males in Sangrey.
What is the Median Population Age in Sangrey?
Median Population Age in Sangrey is 20.5 Years.
What is the Average Family Size in Sangrey
Average Family Size in Sangrey is 5.5 People.
What is the Average Household Size in Sangrey
Average Household Size in Sangrey is 5.6 People.
How Large is the Labor Force in Sangrey?
There are 122 People in the Labor Forcein in Sangrey.
What is the Percentage of People in the Labor Force in Sangrey?
37.5% of People are in the Labor Force in Sangrey.
What is the Unemployment Rate in Sangrey?
Unemployment Rate in Sangrey is 18.9%.