Bear Dance, MT Map & Demographics
Bear Dance Map
Bear Dance Overview
$35,061
PER CAPITA INCOME
$61,250
AVG FAMILY INCOME
$52,250
AVG HOUSEHOLD INCOME
0.42
INEQUALITY / GINI INDEX
241
TOTAL POPULATION
117
MALE POPULATION
124
FEMALE POPULATION
94.35
MALES / 100 FEMALES
105.98
FEMALES / 100 MALES
60.2
MEDIAN AGE
2.4
AVG FAMILY SIZE
2.2
AVG HOUSEHOLD SIZE
96
LABOR FORCE [ PEOPLE ]
39.8%
PERCENT IN LABOR FORCE
15.6%
UNEMPLOYMENT RATE
Income in Bear Dance
Income Overview in Bear Dance
Per Capita Income in Bear Dance is $35,061, while median incomes of families and households are $61,250 and $52,250 respectively.
| Characteristic | Number | Measure |
| Per Capita Income | 241 | $35,061 |
| Median Family Income | 80 | $61,250 |
| Mean Family Income | 80 | $82,231 |
| Median Household Income | 107 | $52,250 |
| Mean Household Income | 107 | $70,979 |
| Income Deficit | 80 | $0 |
| Wage / Income Gap (%) | 241 | 0.00% |
| Wage / Income Gap ($) | 241 | 100.00¢ per $1 |
| Gini / Inequality Index | 241 | 0.42 |
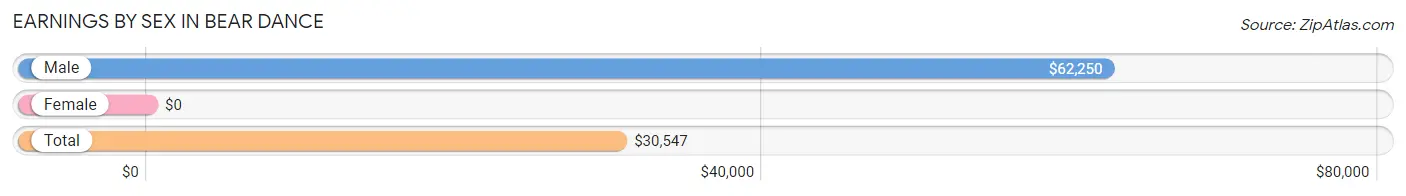
Earnings by Sex in Bear Dance
| Sex | Number | Average Earnings |
| Male | 59 (48.0%) | $62,250 |
| Female | 64 (52.0%) | $0 |
| Total | 123 (100.0%) | $30,547 |
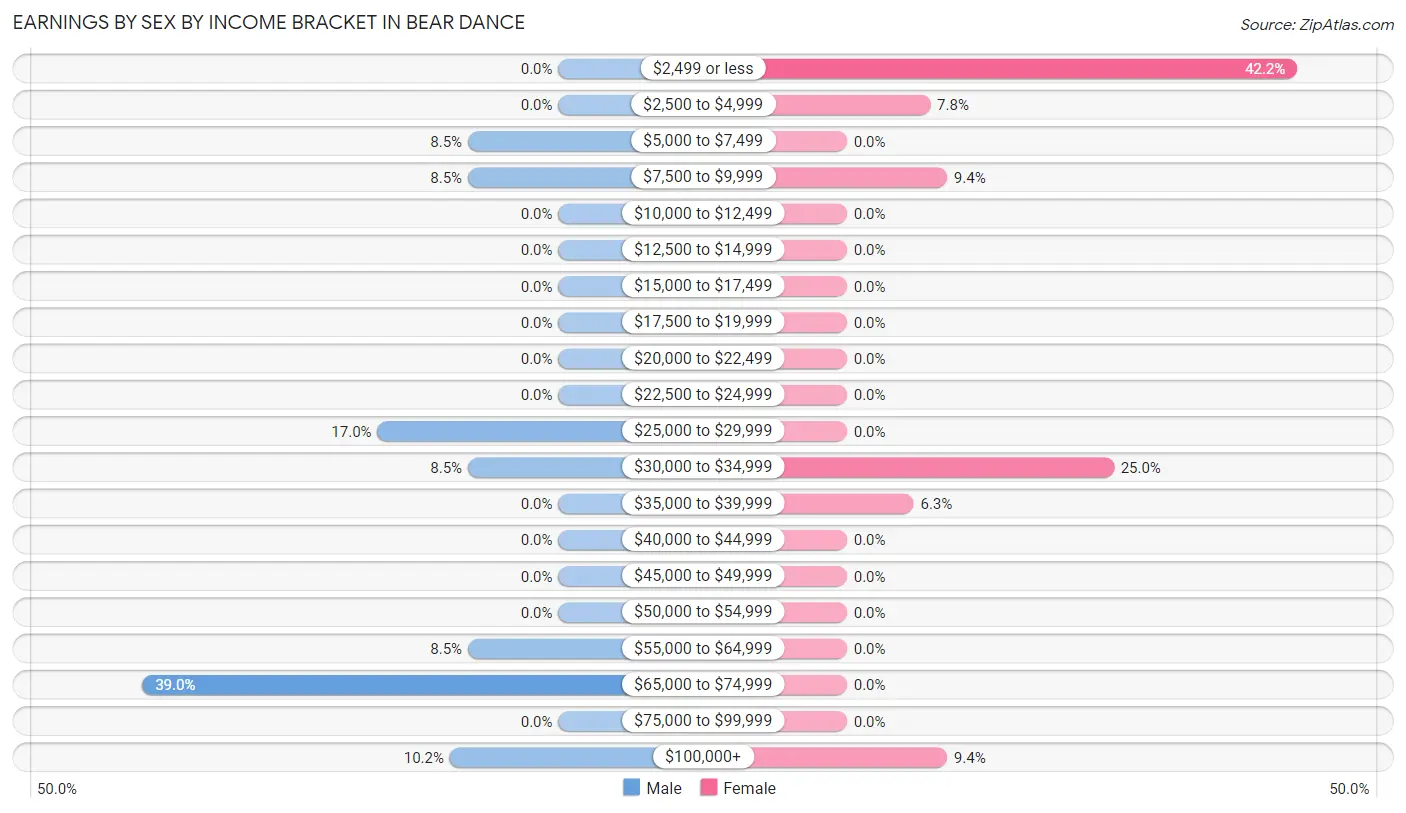
Earnings by Sex by Income Bracket in Bear Dance
The most common earnings brackets in Bear Dance are $65,000 to $74,999 for men (23 | 39.0%) and $2,499 or less for women (27 | 42.2%).
| Income | Male | Female |
| $2,499 or less | 0 (0.0%) | 27 (42.2%) |
| $2,500 to $4,999 | 0 (0.0%) | 5 (7.8%) |
| $5,000 to $7,499 | 5 (8.5%) | 0 (0.0%) |
| $7,500 to $9,999 | 5 (8.5%) | 6 (9.4%) |
| $10,000 to $12,499 | 0 (0.0%) | 0 (0.0%) |
| $12,500 to $14,999 | 0 (0.0%) | 0 (0.0%) |
| $15,000 to $17,499 | 0 (0.0%) | 0 (0.0%) |
| $17,500 to $19,999 | 0 (0.0%) | 0 (0.0%) |
| $20,000 to $22,499 | 0 (0.0%) | 0 (0.0%) |
| $22,500 to $24,999 | 0 (0.0%) | 0 (0.0%) |
| $25,000 to $29,999 | 10 (17.0%) | 0 (0.0%) |
| $30,000 to $34,999 | 5 (8.5%) | 16 (25.0%) |
| $35,000 to $39,999 | 0 (0.0%) | 4 (6.2%) |
| $40,000 to $44,999 | 0 (0.0%) | 0 (0.0%) |
| $45,000 to $49,999 | 0 (0.0%) | 0 (0.0%) |
| $50,000 to $54,999 | 0 (0.0%) | 0 (0.0%) |
| $55,000 to $64,999 | 5 (8.5%) | 0 (0.0%) |
| $65,000 to $74,999 | 23 (39.0%) | 0 (0.0%) |
| $75,000 to $99,999 | 0 (0.0%) | 0 (0.0%) |
| $100,000+ | 6 (10.2%) | 6 (9.4%) |
| Total | 59 (100.0%) | 64 (100.0%) |
Earnings by Sex by Educational Attainment in Bear Dance
| Educational Attainment | Male Income | Female Income |
| Less than High School | - | - |
| High School Diploma | - | - |
| College or Associate's Degree | - | - |
| Bachelor's Degree | - | - |
| Graduate Degree | - | - |
| Total | $62,250 | $0 |
Family Income in Bear Dance
Family Income Brackets in Bear Dance
According to the Bear Dance family income data, there are 27 families falling into the $50,000 to $74,999 income range, which is the most common income bracket and makes up 33.8% of all families.
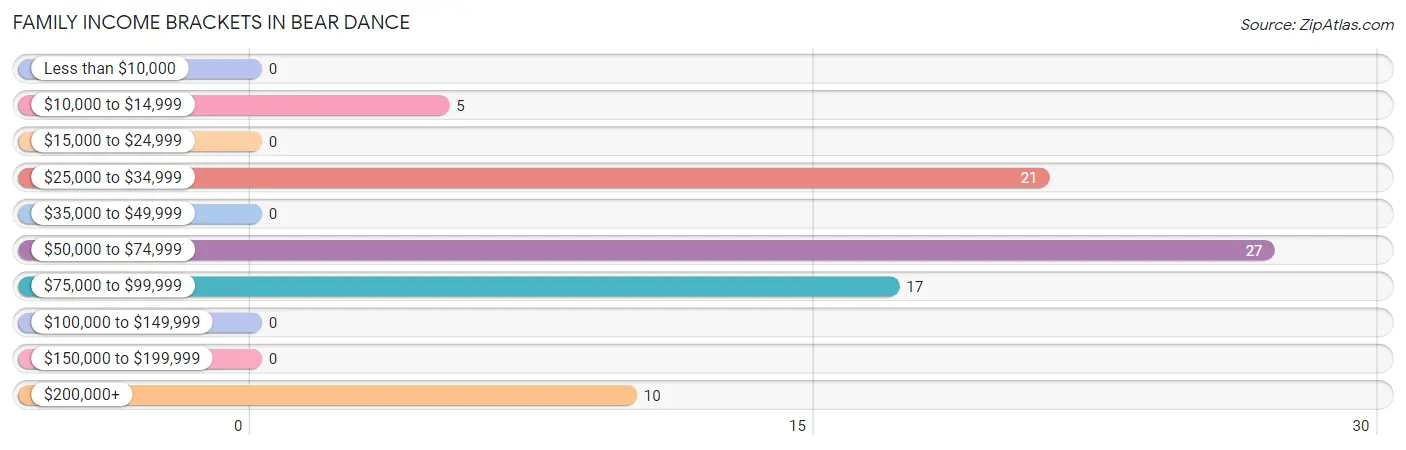
| Income Bracket | # Families | % Families |
| Less than $10,000 | 0 | 0.0% |
| $10,000 to $14,999 | 5 | 6.3% |
| $15,000 to $24,999 | 0 | 0.0% |
| $25,000 to $34,999 | 21 | 26.3% |
| $35,000 to $49,999 | 0 | 0.0% |
| $50,000 to $74,999 | 27 | 33.8% |
| $75,000 to $99,999 | 17 | 21.3% |
| $100,000 to $149,999 | 0 | 0.0% |
| $150,000 to $199,999 | 0 | 0.0% |
| $200,000+ | 10 | 12.5% |
Family Income by Famaliy Size in Bear Dance
2-person families (75 | 93.8%) account for the highest median family income in Bear Dance with $61,597 per family, while 2-person families (75 | 93.8%) have the highest median income of $30,798 per family member.
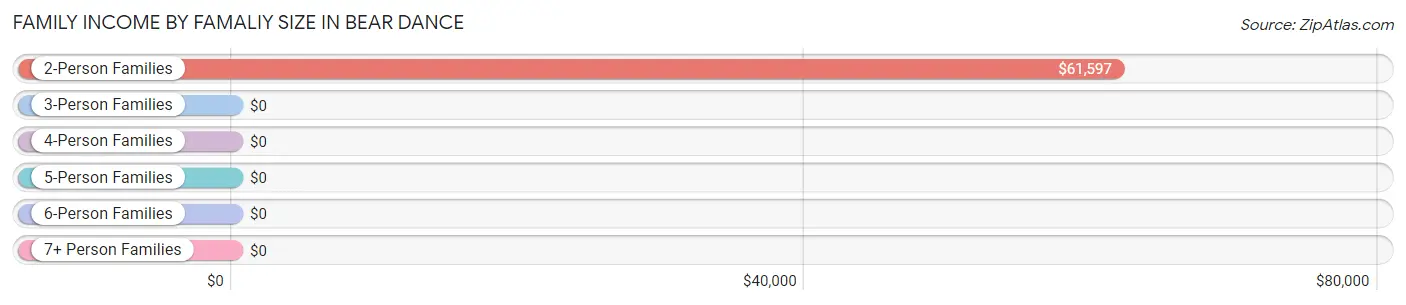
| Income Bracket | # Families | Median Income |
| 2-Person Families | 75 (93.8%) | $61,597 |
| 3-Person Families | 0 (0.0%) | $0 |
| 4-Person Families | 5 (6.2%) | $0 |
| 5-Person Families | 0 (0.0%) | $0 |
| 6-Person Families | 0 (0.0%) | $0 |
| 7+ Person Families | 0 (0.0%) | $0 |
| Total | 80 (100.0%) | $61,250 |
Family Income by Number of Earners in Bear Dance
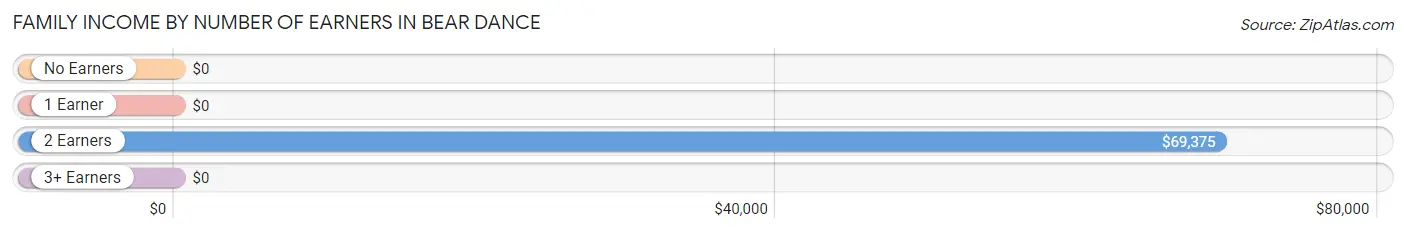
| Number of Earners | # Families | Median Income |
| No Earners | 18 (22.5%) | $0 |
| 1 Earner | 14 (17.5%) | $0 |
| 2 Earners | 48 (60.0%) | $69,375 |
| 3+ Earners | 0 (0.0%) | $0 |
| Total | 80 (100.0%) | $61,250 |
Household Income in Bear Dance
Household Income Brackets in Bear Dance
With 31 households falling in the category, the $50,000 to $74,999 income range is the most frequent in Bear Dance, accounting for 29.0% of all households.
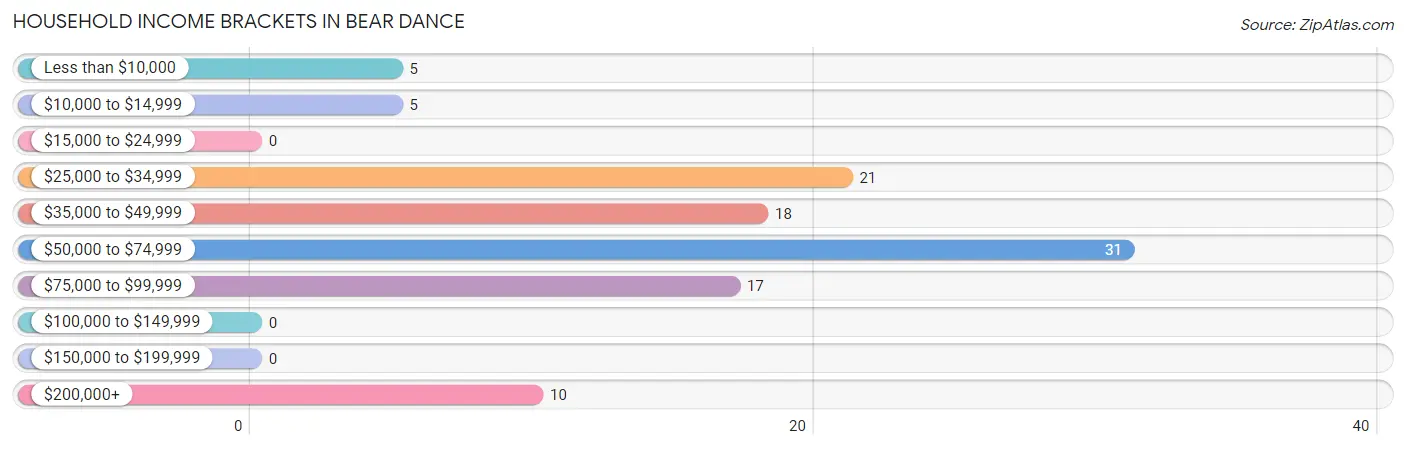
| Income Bracket | # Households | % Households |
| Less than $10,000 | 5 | 4.7% |
| $10,000 to $14,999 | 5 | 4.7% |
| $15,000 to $24,999 | 0 | 0.0% |
| $25,000 to $34,999 | 21 | 19.6% |
| $35,000 to $49,999 | 18 | 16.8% |
| $50,000 to $74,999 | 31 | 29.0% |
| $75,000 to $99,999 | 17 | 15.9% |
| $100,000 to $149,999 | 0 | 0.0% |
| $150,000 to $199,999 | 0 | 0.0% |
| $200,000+ | 10 | 9.3% |
Household Income by Householder Age in Bear Dance
The median household income in Bear Dance is $52,250, with the highest median household income of $80,521 found in the 45 to 64 years age bracket for the primary householder. A total of 41 households (38.3%) fall into this category.
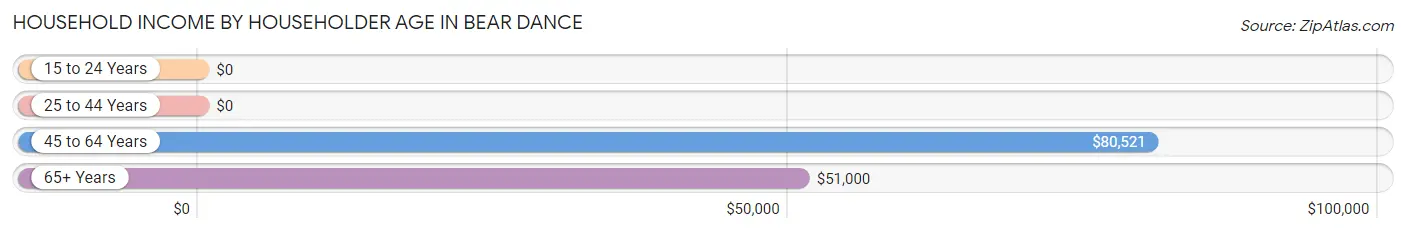
| Income Bracket | # Households | Median Income |
| 15 to 24 Years | 0 (0.0%) | $0 |
| 25 to 44 Years | 16 (14.9%) | $0 |
| 45 to 64 Years | 41 (38.3%) | $80,521 |
| 65+ Years | 50 (46.7%) | $51,000 |
| Total | 107 (100.0%) | $52,250 |
Poverty in Bear Dance
Income Below Poverty by Sex and Age in Bear Dance
With 4.3% poverty level for males and 8.9% for females among the residents of Bear Dance, 65 to 74 year old males and 55 to 64 year old females are the most vulnerable to poverty, with 5 males (9.6%) and 5 females (33.3%) in their respective age groups living below the poverty level.
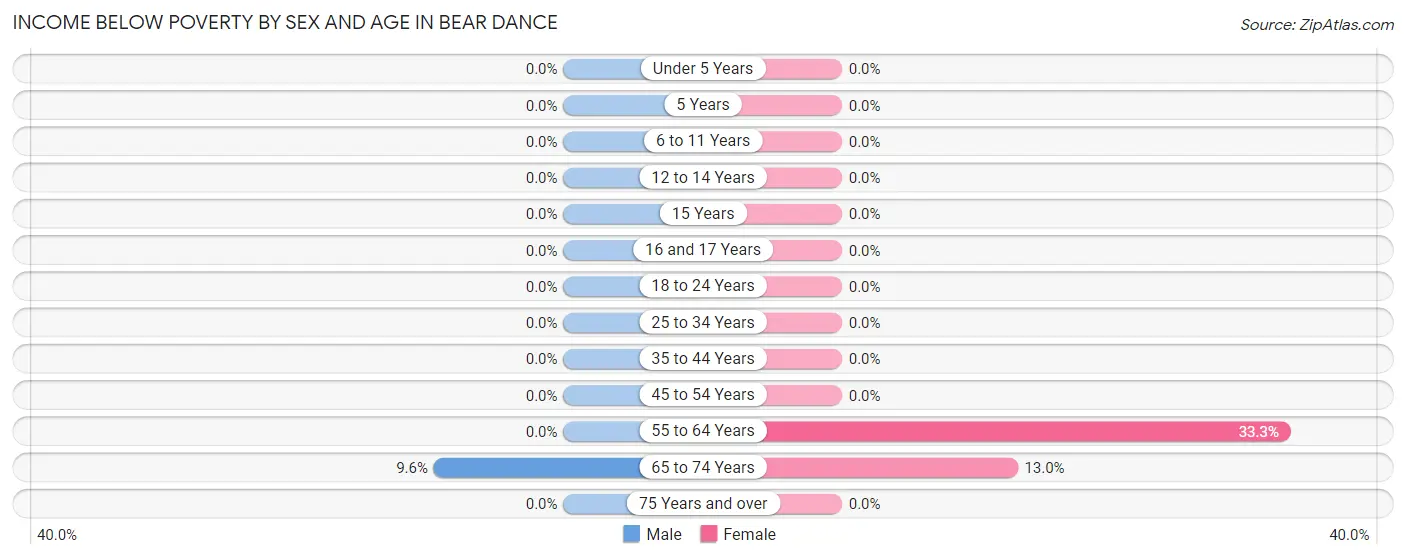
| Age Bracket | Male | Female |
| Under 5 Years | 0 (0.0%) | 0 (0.0%) |
| 5 Years | 0 (0.0%) | 0 (0.0%) |
| 6 to 11 Years | 0 (0.0%) | 0 (0.0%) |
| 12 to 14 Years | 0 (0.0%) | 0 (0.0%) |
| 15 Years | 0 (0.0%) | 0 (0.0%) |
| 16 and 17 Years | 0 (0.0%) | 0 (0.0%) |
| 18 to 24 Years | 0 (0.0%) | 0 (0.0%) |
| 25 to 34 Years | 0 (0.0%) | 0 (0.0%) |
| 35 to 44 Years | 0 (0.0%) | 0 (0.0%) |
| 45 to 54 Years | 0 (0.0%) | 0 (0.0%) |
| 55 to 64 Years | 0 (0.0%) | 5 (33.3%) |
| 65 to 74 Years | 5 (9.6%) | 6 (13.0%) |
| 75 Years and over | 0 (0.0%) | 0 (0.0%) |
| Total | 5 (4.3%) | 11 (8.9%) |
Income Above Poverty by Sex and Age in Bear Dance
According to the poverty statistics in Bear Dance, males aged 45 to 54 years and females aged 16 and 17 years are the age groups that are most secure financially, with 100.0% of males and 100.0% of females in these age groups living above the poverty line.
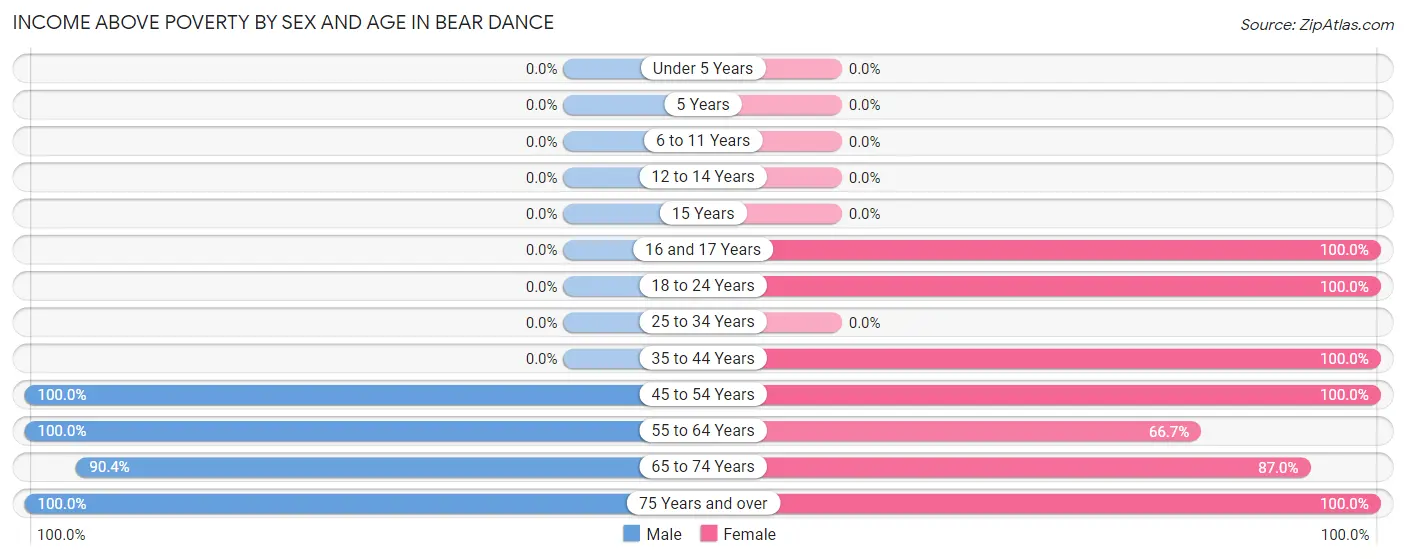
| Age Bracket | Male | Female |
| Under 5 Years | 0 (0.0%) | 0 (0.0%) |
| 5 Years | 0 (0.0%) | 0 (0.0%) |
| 6 to 11 Years | 0 (0.0%) | 0 (0.0%) |
| 12 to 14 Years | 0 (0.0%) | 0 (0.0%) |
| 15 Years | 0 (0.0%) | 0 (0.0%) |
| 16 and 17 Years | 0 (0.0%) | 5 (100.0%) |
| 18 to 24 Years | 0 (0.0%) | 15 (100.0%) |
| 25 to 34 Years | 0 (0.0%) | 0 (0.0%) |
| 35 to 44 Years | 0 (0.0%) | 16 (100.0%) |
| 45 to 54 Years | 45 (100.0%) | 22 (100.0%) |
| 55 to 64 Years | 13 (100.0%) | 10 (66.7%) |
| 65 to 74 Years | 47 (90.4%) | 40 (87.0%) |
| 75 Years and over | 7 (100.0%) | 5 (100.0%) |
| Total | 112 (95.7%) | 113 (91.1%) |
Income Below Poverty Among Married-Couple Families in Bear Dance
The poverty statistics for married-couple families in Bear Dance show that 8.5% or 5 of the total 59 families live below the poverty line. Families with no children have the highest poverty rate of 8.5%, comprising of 5 families. On the other hand, families with no children have the lowest poverty rate of 8.5%, which includes 5 families.
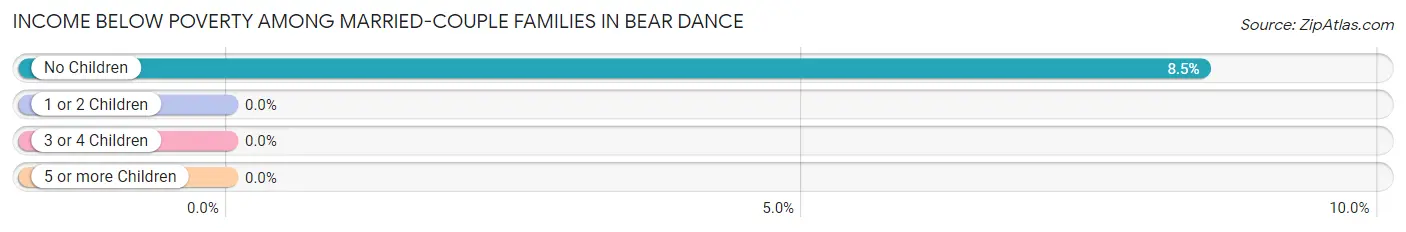
| Children | Above Poverty | Below Poverty |
| No Children | 54 (91.5%) | 5 (8.5%) |
| 1 or 2 Children | 0 (0.0%) | 0 (0.0%) |
| 3 or 4 Children | 0 (0.0%) | 0 (0.0%) |
| 5 or more Children | 0 (0.0%) | 0 (0.0%) |
| Total | 54 (91.5%) | 5 (8.5%) |
Income Below Poverty Among Single-Parent Households in Bear Dance
| Children | Single Father | Single Mother |
| No Children | 0 (0.0%) | 0 (0.0%) |
| 1 or 2 Children | 0 (0.0%) | 0 (0.0%) |
| 3 or 4 Children | 0 (0.0%) | 0 (0.0%) |
| 5 or more Children | 0 (0.0%) | 0 (0.0%) |
| Total | 0 (0.0%) | 0 (0.0%) |
Income Below Poverty Among Married-Couple vs Single-Parent Households in Bear Dance
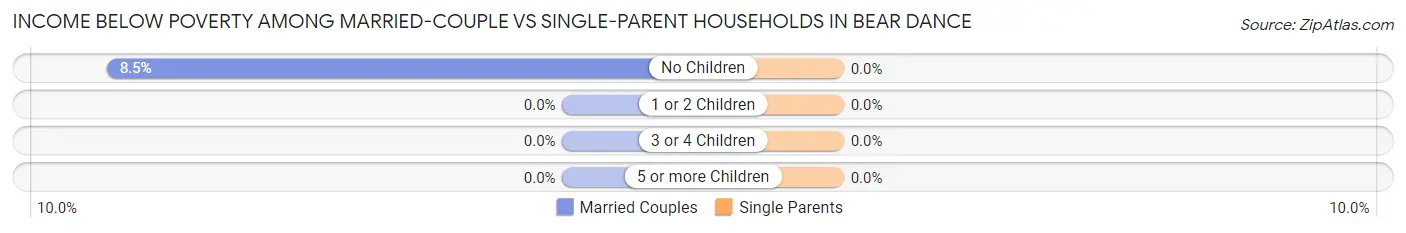
| Children | Married-Couple Families | Single-Parent Households |
| No Children | 5 (8.5%) | 0 (0.0%) |
| 1 or 2 Children | 0 (0.0%) | 0 (0.0%) |
| 3 or 4 Children | 0 (0.0%) | 0 (0.0%) |
| 5 or more Children | 0 (0.0%) | 0 (0.0%) |
| Total | 5 (8.5%) | 0 (0.0%) |
Race in Bear Dance
The most populous races in Bear Dance are White / Caucasian (179 | 74.3%), Native / Alaskan (31 | 12.9%), and Two or more Races (31 | 12.9%).
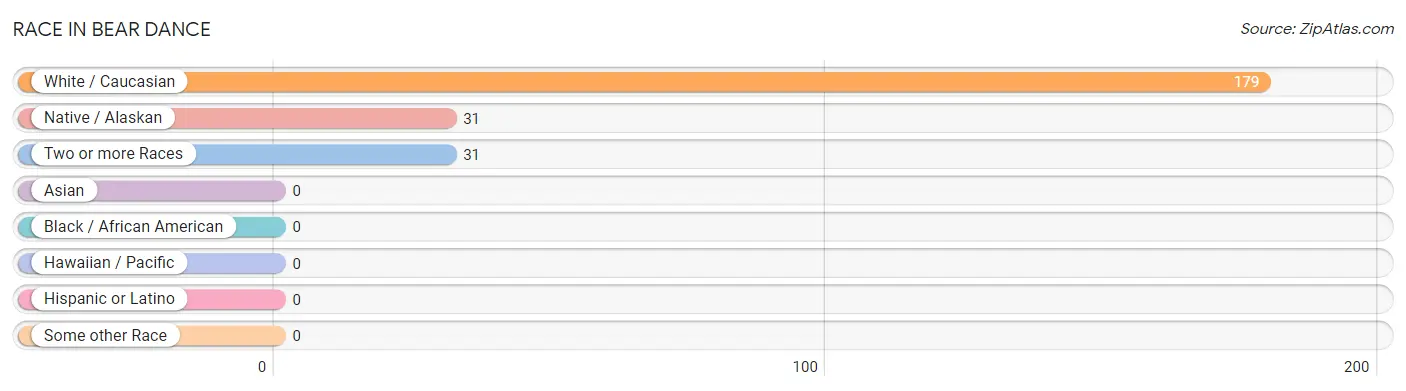
| Race | # Population | % Population |
| Asian | 0 | 0.0% |
| Black / African American | 0 | 0.0% |
| Hawaiian / Pacific | 0 | 0.0% |
| Hispanic or Latino | 0 | 0.0% |
| Native / Alaskan | 31 | 12.9% |
| White / Caucasian | 179 | 74.3% |
| Two or more Races | 31 | 12.9% |
| Some other Race | 0 | 0.0% |
| Total | 241 | 100.0% |
Ancestry in Bear Dance
The most populous ancestries reported in Bear Dance are German (44 | 18.3%), Norwegian (40 | 16.6%), English (36 | 14.9%), Irish (19 | 7.9%), and Russian (19 | 7.9%), together accounting for 65.6% of all Bear Dance residents.
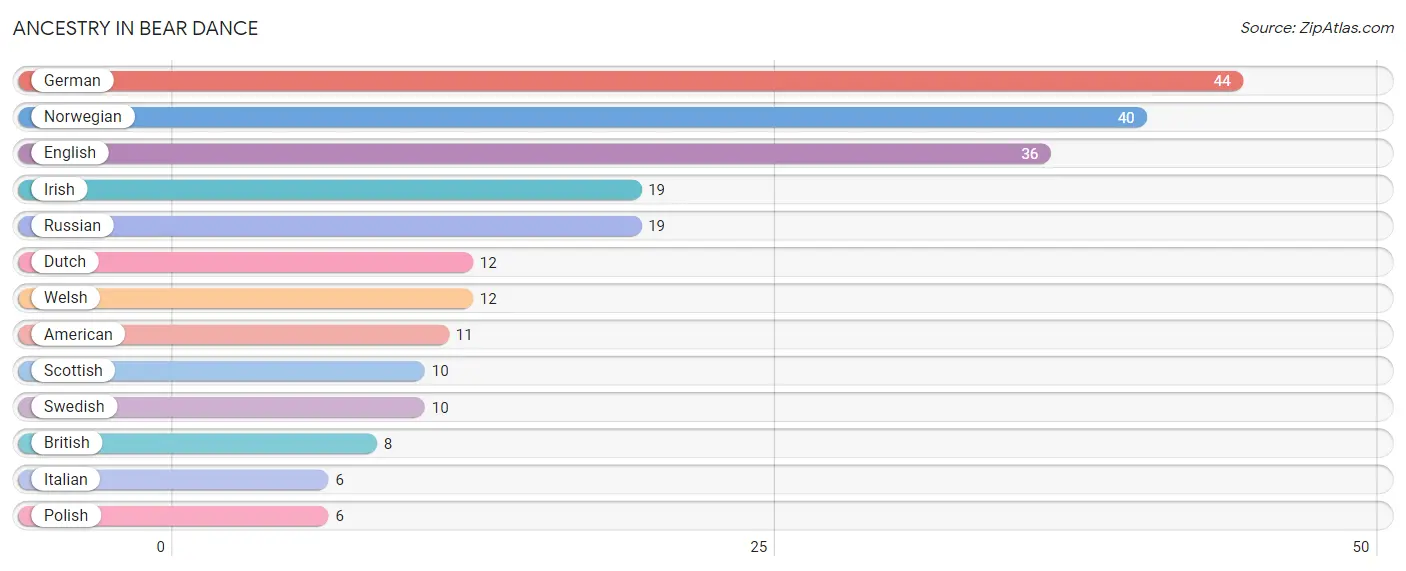
| Ancestry | # Population | % Population |
| American | 11 | 4.6% |
| British | 8 | 3.3% |
| Dutch | 12 | 5.0% |
| English | 36 | 14.9% |
| German | 44 | 18.3% |
| Irish | 19 | 7.9% |
| Italian | 6 | 2.5% |
| Norwegian | 40 | 16.6% |
| Polish | 6 | 2.5% |
| Russian | 19 | 7.9% |
| Scottish | 10 | 4.2% |
| Swedish | 10 | 4.2% |
| Welsh | 12 | 5.0% | View All 13 Rows |
Immigrants in Bear Dance
The most numerous immigrant groups reported in Bear Dance came from , and Canada (25 | 10.4%), together accounting for 10.4% of all Bear Dance residents.

| Immigration Origin | # Population | % Population |
| Canada | 25 | 10.4% | View All 1 Rows |
Sex and Age in Bear Dance
Sex and Age in Bear Dance
The most populous age groups in Bear Dance are 65 to 69 Years (30 | 25.6%) for men and 70 to 74 Years (40 | 32.3%) for women.
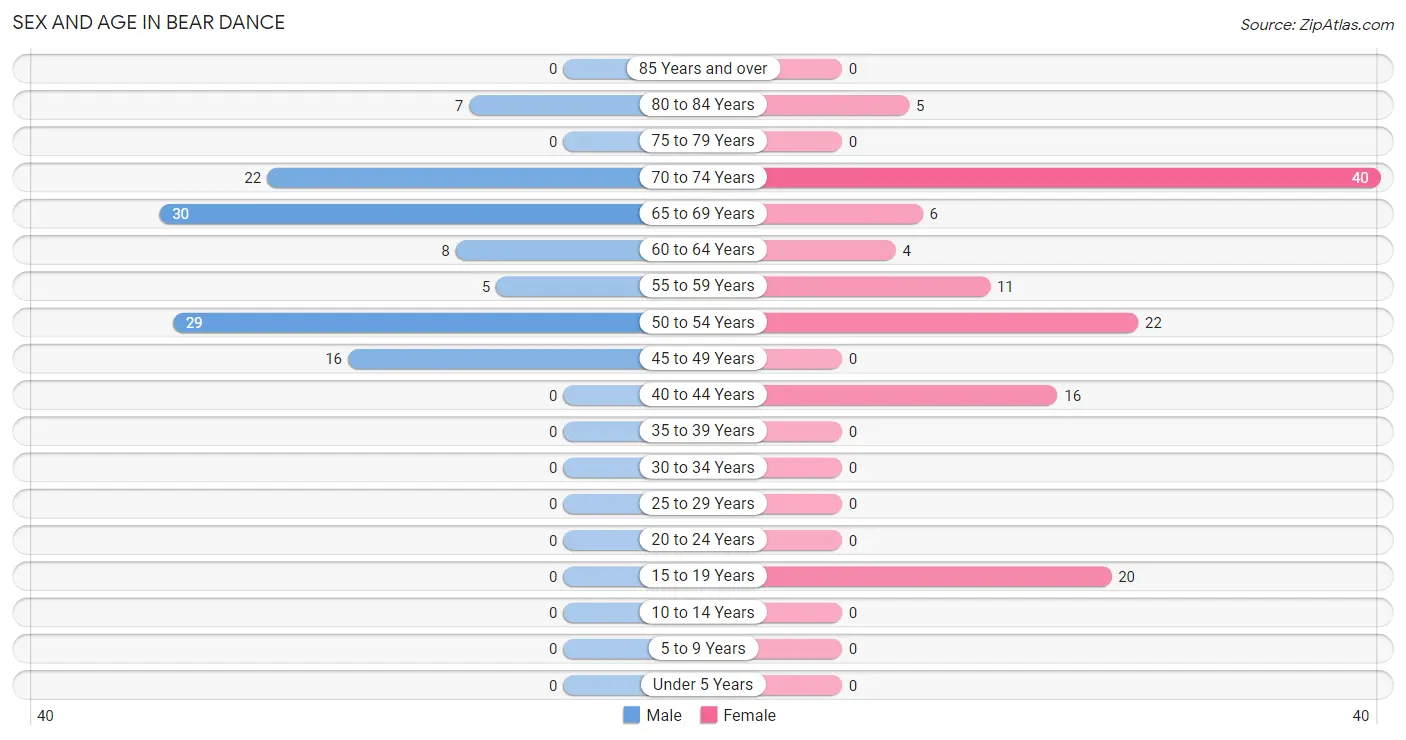
| Age Bracket | Male | Female |
| Under 5 Years | 0 (0.0%) | 0 (0.0%) |
| 5 to 9 Years | 0 (0.0%) | 0 (0.0%) |
| 10 to 14 Years | 0 (0.0%) | 0 (0.0%) |
| 15 to 19 Years | 0 (0.0%) | 20 (16.1%) |
| 20 to 24 Years | 0 (0.0%) | 0 (0.0%) |
| 25 to 29 Years | 0 (0.0%) | 0 (0.0%) |
| 30 to 34 Years | 0 (0.0%) | 0 (0.0%) |
| 35 to 39 Years | 0 (0.0%) | 0 (0.0%) |
| 40 to 44 Years | 0 (0.0%) | 16 (12.9%) |
| 45 to 49 Years | 16 (13.7%) | 0 (0.0%) |
| 50 to 54 Years | 29 (24.8%) | 22 (17.7%) |
| 55 to 59 Years | 5 (4.3%) | 11 (8.9%) |
| 60 to 64 Years | 8 (6.8%) | 4 (3.2%) |
| 65 to 69 Years | 30 (25.6%) | 6 (4.8%) |
| 70 to 74 Years | 22 (18.8%) | 40 (32.3%) |
| 75 to 79 Years | 0 (0.0%) | 0 (0.0%) |
| 80 to 84 Years | 7 (6.0%) | 5 (4.0%) |
| 85 Years and over | 0 (0.0%) | 0 (0.0%) |
| Total | 117 (100.0%) | 124 (100.0%) |
Families and Households in Bear Dance
Median Family Size in Bear Dance
The median family size in Bear Dance is 2.36 persons per family, with married-couple families (59 | 73.8%) accounting for the largest median family size of 2.51 persons per family. On the other hand, single female/mother families (16 | 20.0%) represent the smallest median family size with 1.94 persons per family.
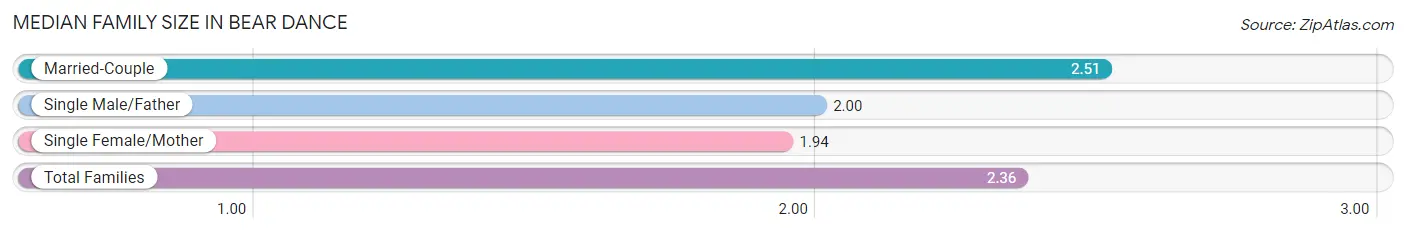
| Family Type | # Families | Family Size |
| Married-Couple | 59 (73.8%) | 2.51 |
| Single Male/Father | 5 (6.2%) | 2.00 |
| Single Female/Mother | 16 (20.0%) | 1.94 |
| Total Families | 80 (100.0%) | 2.36 |
Median Household Size in Bear Dance
The median household size in Bear Dance is 2.25 persons per household, with married-couple households (59 | 55.1%) accounting for the largest median household size of 2.51 persons per household. non-family households (27 | 25.2%) represent the smallest median household size with 1.93 persons per household.
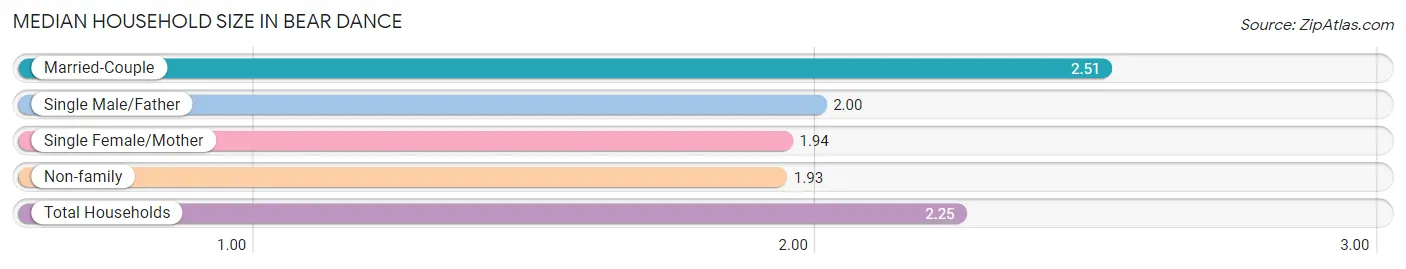
| Household Type | # Households | Household Size |
| Married-Couple | 59 (55.1%) | 2.51 |
| Single Male/Father | 5 (4.7%) | 2.00 |
| Single Female/Mother | 16 (14.9%) | 1.94 |
| Non-family | 27 (25.2%) | 1.93 |
| Total Households | 107 (100.0%) | 2.25 |
Household Size by Marriage Status in Bear Dance
Out of a total of 107 households in Bear Dance, 80 (74.8%) are family households, while 27 (25.2%) are nonfamily households. The most numerous type of family households are 2-person households, comprising 75, and the most common type of nonfamily households are 2-person households, comprising 18.
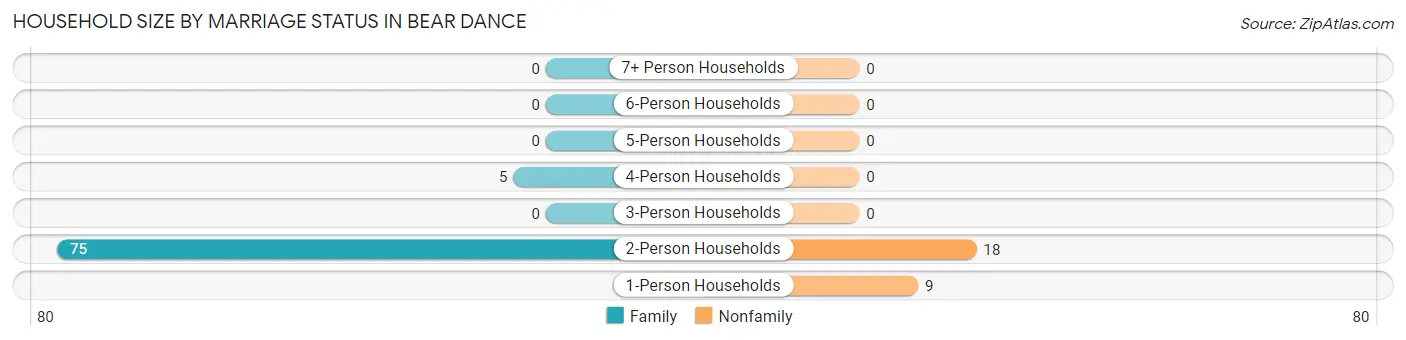
| Household Size | Family Households | Nonfamily Households |
| 1-Person Households | - | 9 (8.4%) |
| 2-Person Households | 75 (70.1%) | 18 (16.8%) |
| 3-Person Households | 0 (0.0%) | 0 (0.0%) |
| 4-Person Households | 5 (4.7%) | 0 (0.0%) |
| 5-Person Households | 0 (0.0%) | 0 (0.0%) |
| 6-Person Households | 0 (0.0%) | 0 (0.0%) |
| 7+ Person Households | 0 (0.0%) | 0 (0.0%) |
| Total | 80 (74.8%) | 27 (25.2%) |
Female Fertility in Bear Dance
Fertility by Age in Bear Dance
| Age Bracket | Women with Births | Births / 1,000 Women |
| 15 to 19 years | 0 (0.0%) | 0.0 |
| 20 to 34 years | 0 (0.0%) | 0.0 |
| 35 to 50 years | 0 (0.0%) | 0.0 |
| Total | 0 (0.0%) | 0.0 |
Fertility by Age by Marriage Status in Bear Dance
| Age Bracket | Married | Unmarried |
| 15 to 19 years | 0 (0.0%) | 0 (0.0%) |
| 20 to 34 years | 0 (0.0%) | 0 (0.0%) |
| 35 to 50 years | 0 (0.0%) | 0 (0.0%) |
| Total | 0 (0.0%) | 0 (0.0%) |
Fertility by Education in Bear Dance
| Educational Attainment | Women with Births | Births / 1,000 Women |
| Less than High School | 0 (0.0%) | 0.0 |
| High School Diploma | 0 (0.0%) | 0.0 |
| College or Associate's Degree | 0 (0.0%) | 0.0 |
| Bachelor's Degree | 0 (0.0%) | 0.0 |
| Graduate Degree | 0 (0.0%) | 0.0 |
| Total | 0 (0.0%) | 0.0 |
Fertility by Education by Marriage Status in Bear Dance
| Educational Attainment | Married | Unmarried |
| Less than High School | 0 (0.0%) | 0 (0.0%) |
| High School Diploma | 0 (0.0%) | 0 (0.0%) |
| College or Associate's Degree | 0 (0.0%) | 0 (0.0%) |
| Bachelor's Degree | 0 (0.0%) | 0 (0.0%) |
| Graduate Degree | 0 (0.0%) | 0 (0.0%) |
| Total | 0 (0.0%) | 0 (0.0%) |
Employment Characteristics in Bear Dance
Employment by Class of Employer in Bear Dance
Among the 62 employed individuals in Bear Dance, private company employees (34 | 54.8%), federal government employees (12 | 19.4%), and self-employed (not incorporated) (11 | 17.7%) make up the most common classes of employment.
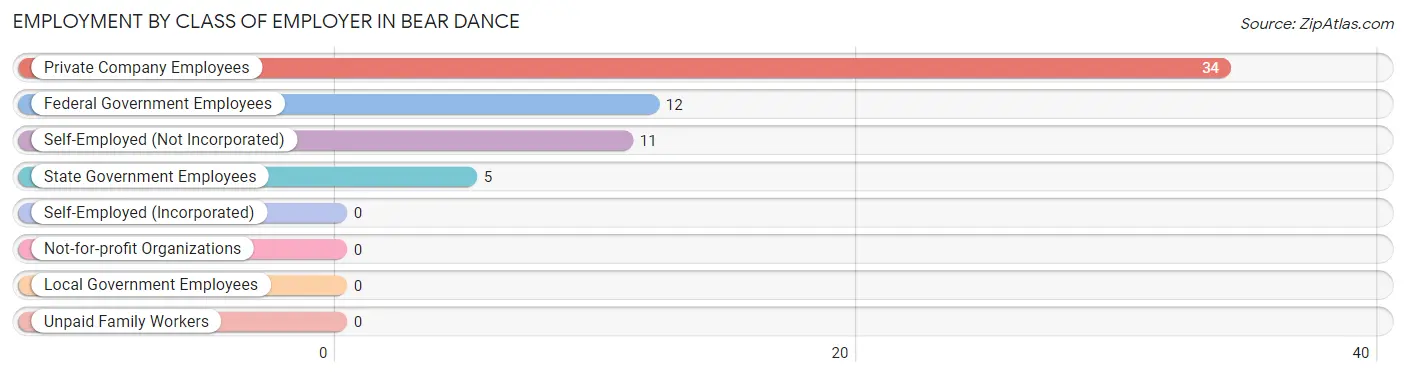
| Employer Class | # Employees | % Employees |
| Private Company Employees | 34 | 54.8% |
| Self-Employed (Incorporated) | 0 | 0.0% |
| Self-Employed (Not Incorporated) | 11 | 17.7% |
| Not-for-profit Organizations | 0 | 0.0% |
| Local Government Employees | 0 | 0.0% |
| State Government Employees | 5 | 8.1% |
| Federal Government Employees | 12 | 19.4% |
| Unpaid Family Workers | 0 | 0.0% |
| Total | 62 | 100.0% |
Employment Status by Age in Bear Dance
According to the labor force statistics for Bear Dance, out of the total population over 16 years of age (241), 39.8% or 96 individuals are in the labor force, with 15.6% or 15 of them unemployed. The age group with the highest labor force participation rate is 35 to 44 years, with 100.0% or 16 individuals in the labor force. Within the labor force, the 16 to 19 years age range has the highest percentage of unemployed individuals, with 100.0% or 15 of them being unemployed.
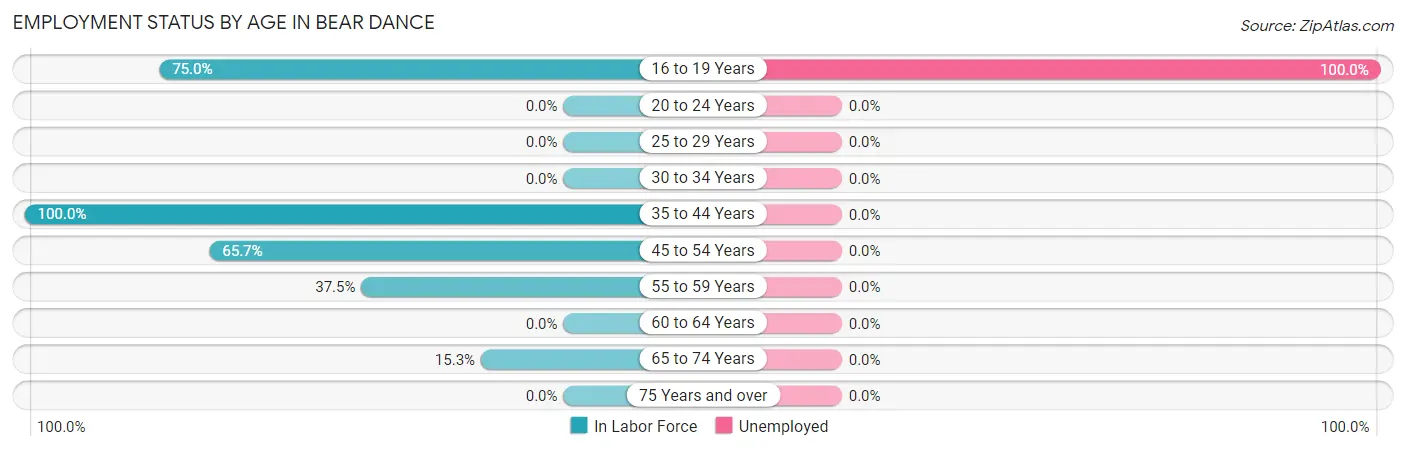
| Age Bracket | In Labor Force | Unemployed |
| 16 to 19 Years | 15 (75.0%) | 15 (100.0%) |
| 20 to 24 Years | 0 (0.0%) | 0 (0.0%) |
| 25 to 29 Years | 0 (0.0%) | 0 (0.0%) |
| 30 to 34 Years | 0 (0.0%) | 0 (0.0%) |
| 35 to 44 Years | 16 (100.0%) | 0 (0.0%) |
| 45 to 54 Years | 44 (65.7%) | 0 (0.0%) |
| 55 to 59 Years | 6 (37.5%) | 0 (0.0%) |
| 60 to 64 Years | 0 (0.0%) | 0 (0.0%) |
| 65 to 74 Years | 15 (15.3%) | 0 (0.0%) |
| 75 Years and over | 0 (0.0%) | 0 (0.0%) |
| Total | 96 (39.8%) | 15 (15.6%) |
Employment Status by Educational Attainment in Bear Dance
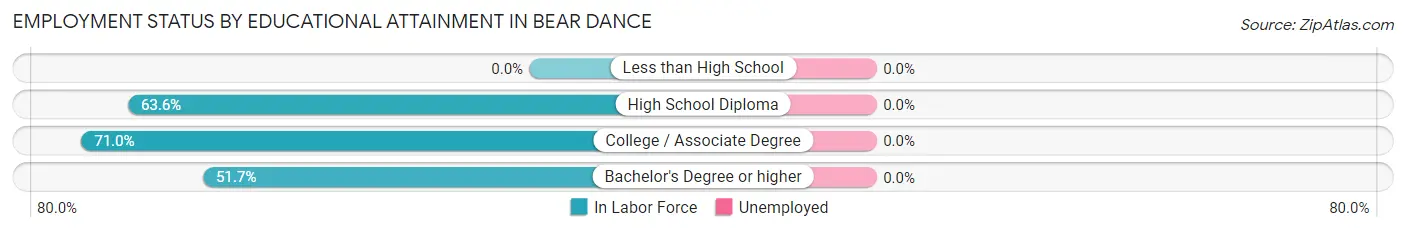
| Educational Attainment | In Labor Force | Unemployed |
| Less than High School | 0 (0.0%) | 0 (0.0%) |
| High School Diploma | 14 (63.6%) | 0 (0.0%) |
| College / Associate Degree | 22 (71.0%) | 0 (0.0%) |
| Bachelor's Degree or higher | 30 (51.7%) | 0 (0.0%) |
| Total | 66 (59.5%) | 0 (0.0%) |
Employment Occupations by Sex in Bear Dance
Management, Business, Science and Arts Occupations
The most common Management, Business, Science and Arts occupations in Bear Dance are Community & Social Service (23 | 28.4%), Education Instruction & Library (19 | 23.5%), Management (5 | 6.2%), and Arts, Media & Entertainment (4 | 4.9%).
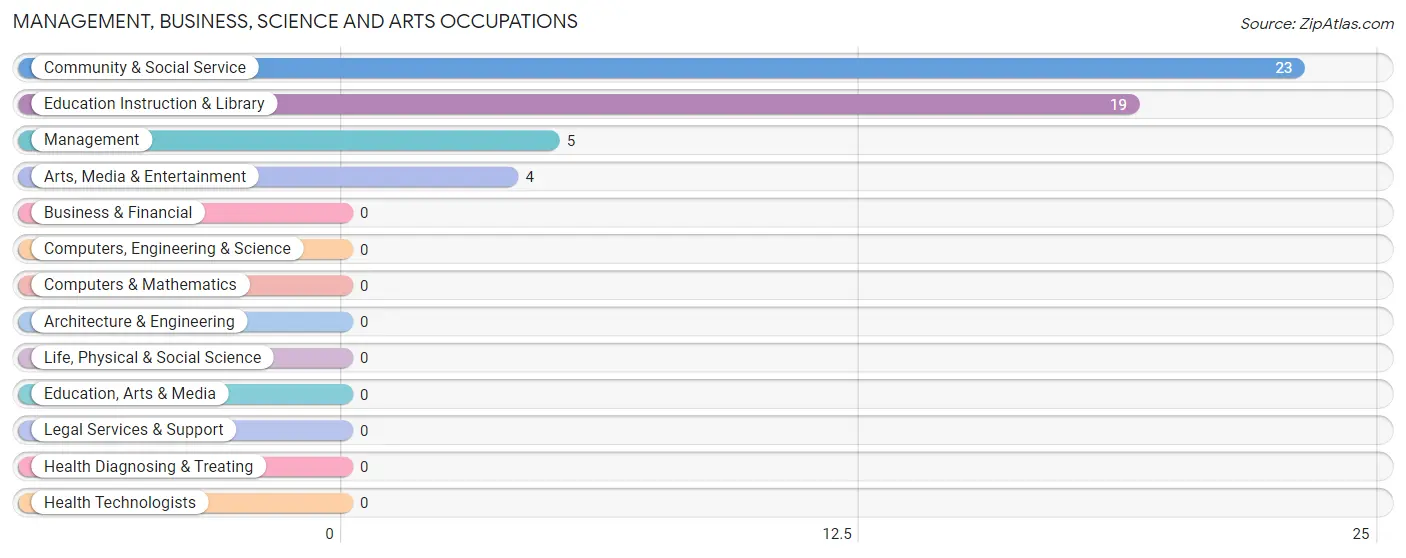
Management, Business, Science and Arts Occupations by Sex
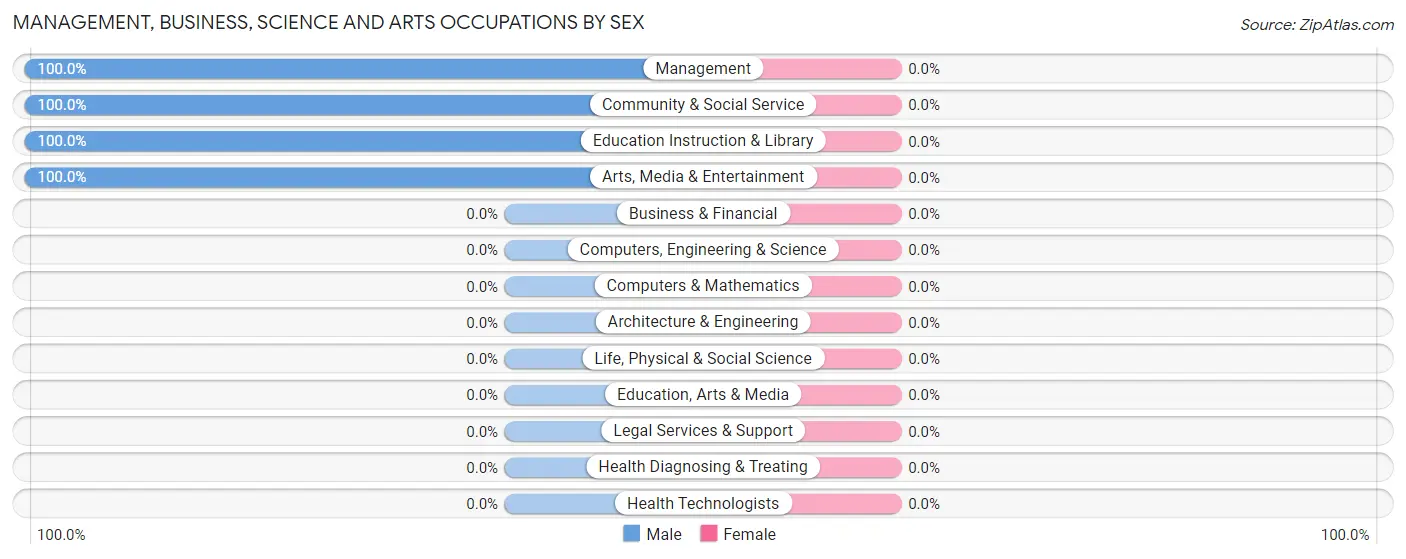
| Occupation | Male | Female |
| Management | 5 (100.0%) | 0 (0.0%) |
| Business & Financial | 0 (0.0%) | 0 (0.0%) |
| Computers, Engineering & Science | 0 (0.0%) | 0 (0.0%) |
| Computers & Mathematics | 0 (0.0%) | 0 (0.0%) |
| Architecture & Engineering | 0 (0.0%) | 0 (0.0%) |
| Life, Physical & Social Science | 0 (0.0%) | 0 (0.0%) |
| Community & Social Service | 23 (100.0%) | 0 (0.0%) |
| Education, Arts & Media | 0 (0.0%) | 0 (0.0%) |
| Legal Services & Support | 0 (0.0%) | 0 (0.0%) |
| Education Instruction & Library | 19 (100.0%) | 0 (0.0%) |
| Arts, Media & Entertainment | 4 (100.0%) | 0 (0.0%) |
| Health Diagnosing & Treating | 0 (0.0%) | 0 (0.0%) |
| Health Technologists | 0 (0.0%) | 0 (0.0%) |
| Total (Category) | 28 (100.0%) | 0 (0.0%) |
| Total (Overall) | 49 (60.5%) | 32 (39.5%) |
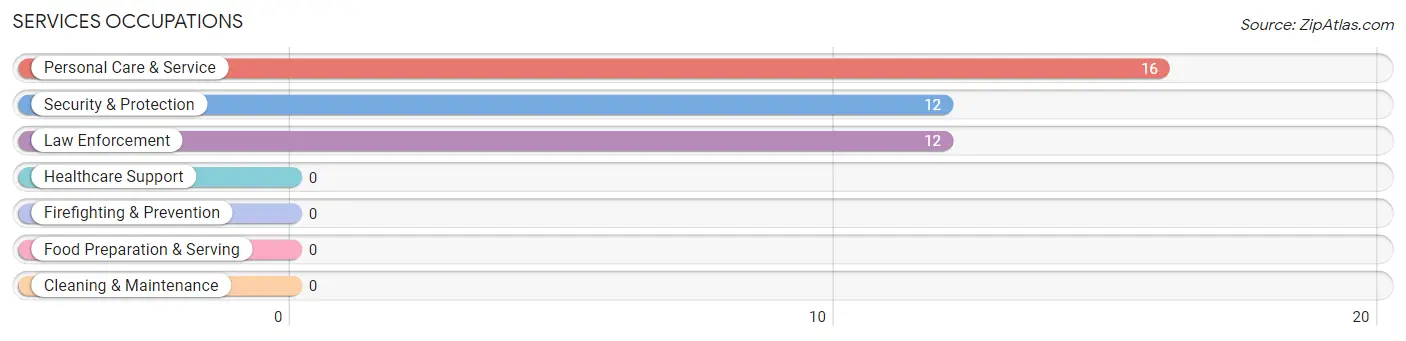
Services Occupations
The most common Services occupations in Bear Dance are Personal Care & Service (16 | 19.8%), Security & Protection (12 | 14.8%), and Law Enforcement (12 | 14.8%).
Services Occupations by Sex
Within the Services occupations in Bear Dance, the most male-oriented occupations are Security & Protection (50.0%), and Law Enforcement (50.0%), while the most female-oriented occupations are Personal Care & Service (100.0%), Security & Protection (50.0%), and Law Enforcement (50.0%).
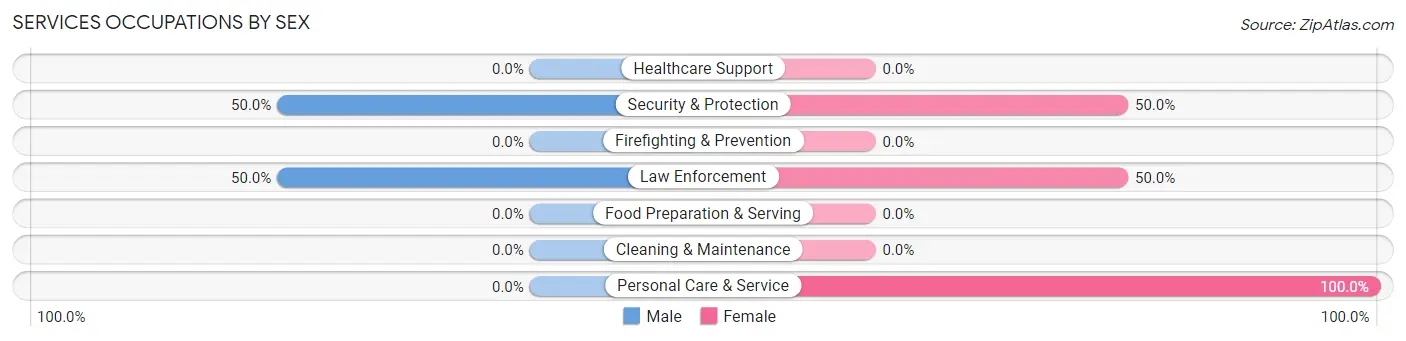
| Occupation | Male | Female |
| Healthcare Support | 0 (0.0%) | 0 (0.0%) |
| Security & Protection | 6 (50.0%) | 6 (50.0%) |
| Firefighting & Prevention | 0 (0.0%) | 0 (0.0%) |
| Law Enforcement | 6 (50.0%) | 6 (50.0%) |
| Food Preparation & Serving | 0 (0.0%) | 0 (0.0%) |
| Cleaning & Maintenance | 0 (0.0%) | 0 (0.0%) |
| Personal Care & Service | 0 (0.0%) | 16 (100.0%) |
| Total (Category) | 6 (21.4%) | 22 (78.6%) |
| Total (Overall) | 49 (60.5%) | 32 (39.5%) |
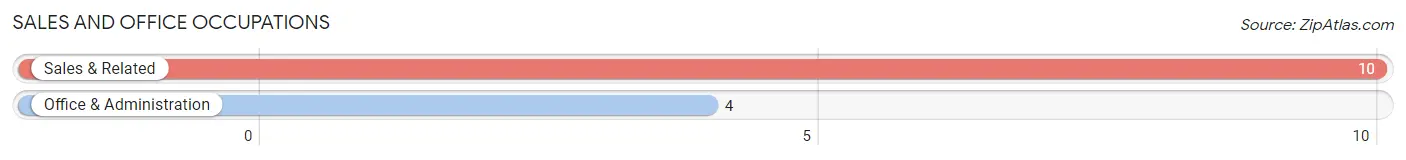
Sales and Office Occupations
The most common Sales and Office occupations in Bear Dance are Sales & Related (10 | 12.3%), and Office & Administration (4 | 4.9%).
Sales and Office Occupations by Sex
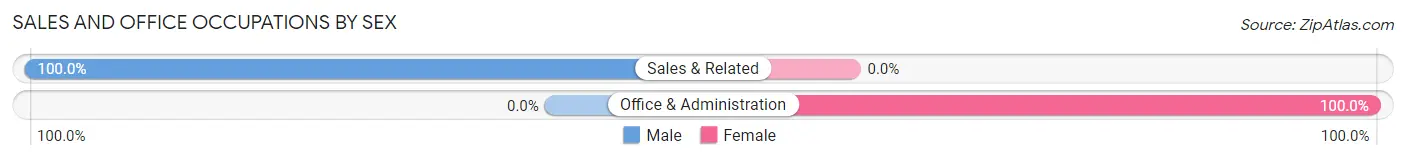
| Occupation | Male | Female |
| Sales & Related | 10 (100.0%) | 0 (0.0%) |
| Office & Administration | 0 (0.0%) | 4 (100.0%) |
| Total (Category) | 10 (71.4%) | 4 (28.6%) |
| Total (Overall) | 49 (60.5%) | 32 (39.5%) |
Natural Resources, Construction and Maintenance Occupations
The most common Natural Resources, Construction and Maintenance occupations in Bear Dance are , and Construction & Extraction (11 | 13.6%).
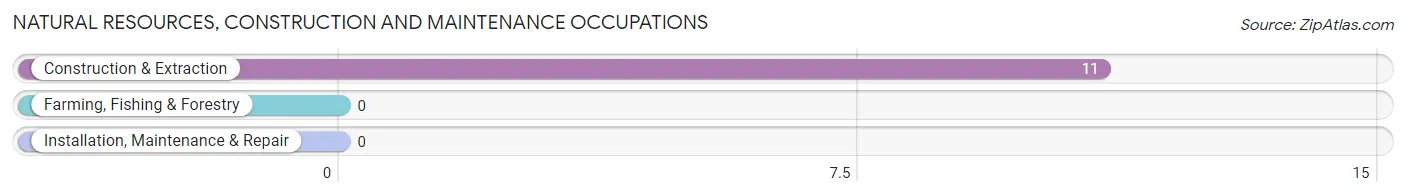
Natural Resources, Construction and Maintenance Occupations by Sex
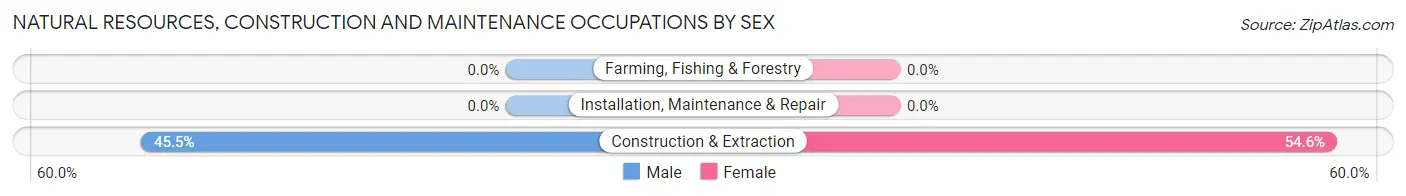
| Occupation | Male | Female |
| Farming, Fishing & Forestry | 0 (0.0%) | 0 (0.0%) |
| Construction & Extraction | 5 (45.5%) | 6 (54.5%) |
| Installation, Maintenance & Repair | 0 (0.0%) | 0 (0.0%) |
| Total (Category) | 5 (45.5%) | 6 (54.5%) |
| Total (Overall) | 49 (60.5%) | 32 (39.5%) |
Production, Transportation and Moving Occupations
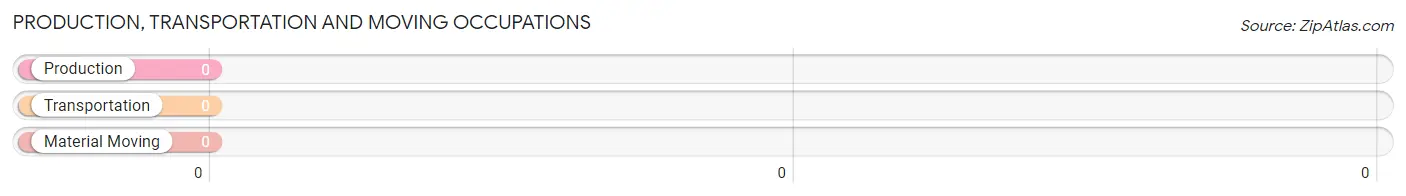
Production, Transportation and Moving Occupations by Sex
| Occupation | Male | Female |
| Production | 0 (0.0%) | 0 (0.0%) |
| Transportation | 0 (0.0%) | 0 (0.0%) |
| Material Moving | 0 (0.0%) | 0 (0.0%) |
| Total (Category) | 0 (0.0%) | 0 (0.0%) |
| Total (Overall) | 49 (60.5%) | 32 (39.5%) |
Employment Industries by Sex in Bear Dance
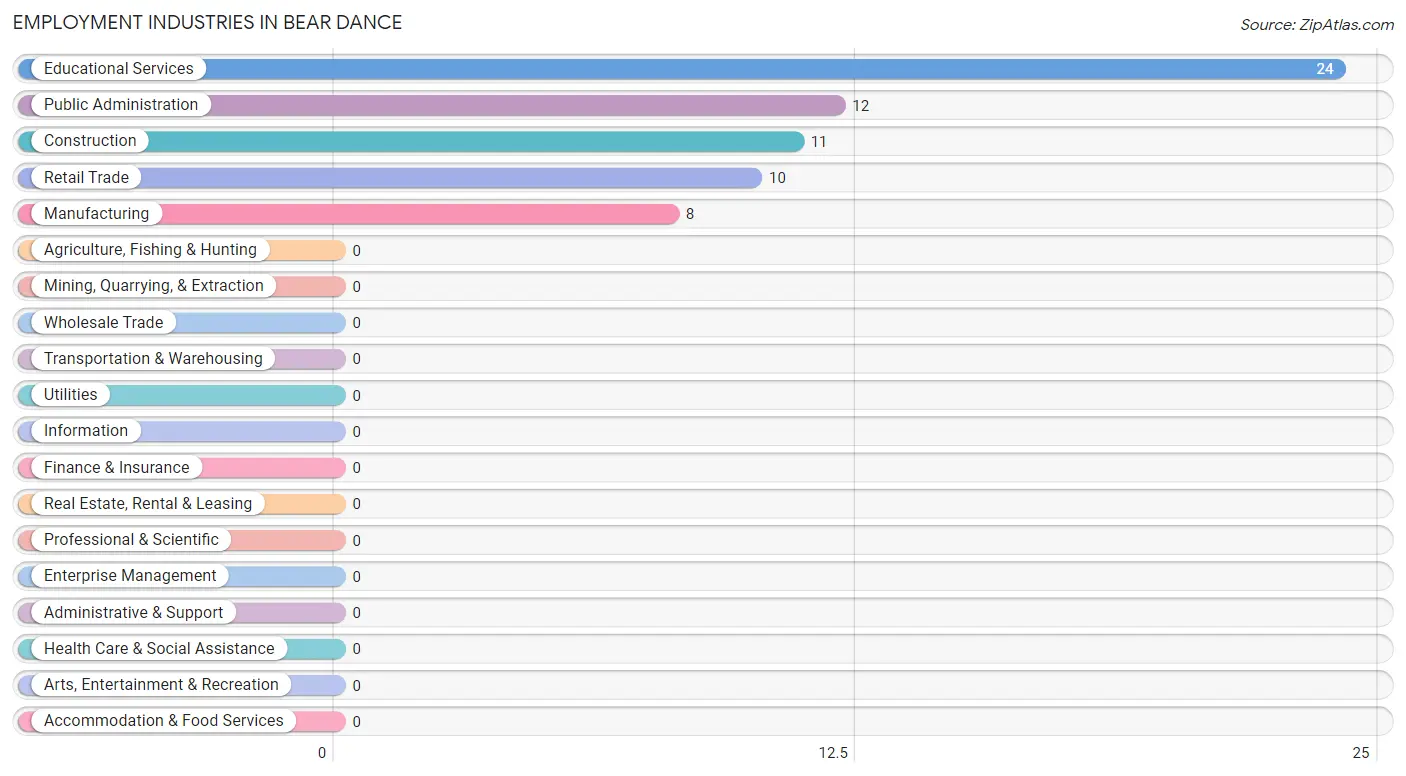
Employment Industries in Bear Dance
The major employment industries in Bear Dance include Educational Services (24 | 29.6%), Public Administration (12 | 14.8%), Construction (11 | 13.6%), Retail Trade (10 | 12.3%), and Manufacturing (8 | 9.9%).
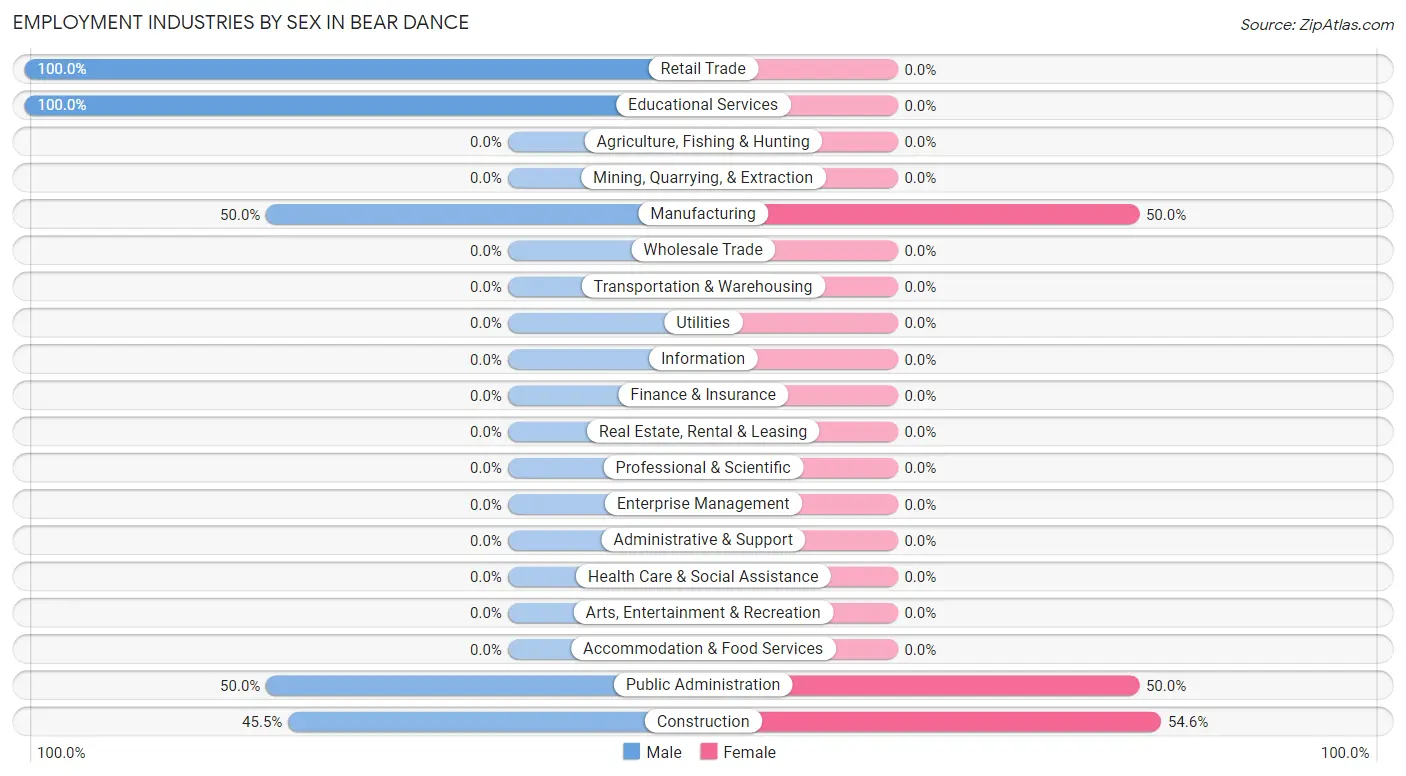
Employment Industries by Sex in Bear Dance
The Bear Dance industries that see more men than women are Retail Trade (100.0%), Educational Services (100.0%), and Manufacturing (50.0%), whereas the industries that tend to have a higher number of women are Construction (54.5%), Manufacturing (50.0%), and Public Administration (50.0%).
| Industry | Male | Female |
| Agriculture, Fishing & Hunting | 0 (0.0%) | 0 (0.0%) |
| Mining, Quarrying, & Extraction | 0 (0.0%) | 0 (0.0%) |
| Construction | 5 (45.5%) | 6 (54.5%) |
| Manufacturing | 4 (50.0%) | 4 (50.0%) |
| Wholesale Trade | 0 (0.0%) | 0 (0.0%) |
| Retail Trade | 10 (100.0%) | 0 (0.0%) |
| Transportation & Warehousing | 0 (0.0%) | 0 (0.0%) |
| Utilities | 0 (0.0%) | 0 (0.0%) |
| Information | 0 (0.0%) | 0 (0.0%) |
| Finance & Insurance | 0 (0.0%) | 0 (0.0%) |
| Real Estate, Rental & Leasing | 0 (0.0%) | 0 (0.0%) |
| Professional & Scientific | 0 (0.0%) | 0 (0.0%) |
| Enterprise Management | 0 (0.0%) | 0 (0.0%) |
| Administrative & Support | 0 (0.0%) | 0 (0.0%) |
| Educational Services | 24 (100.0%) | 0 (0.0%) |
| Health Care & Social Assistance | 0 (0.0%) | 0 (0.0%) |
| Arts, Entertainment & Recreation | 0 (0.0%) | 0 (0.0%) |
| Accommodation & Food Services | 0 (0.0%) | 0 (0.0%) |
| Public Administration | 6 (50.0%) | 6 (50.0%) |
| Total | 49 (60.5%) | 32 (39.5%) |
Education in Bear Dance
School Enrollment in Bear Dance
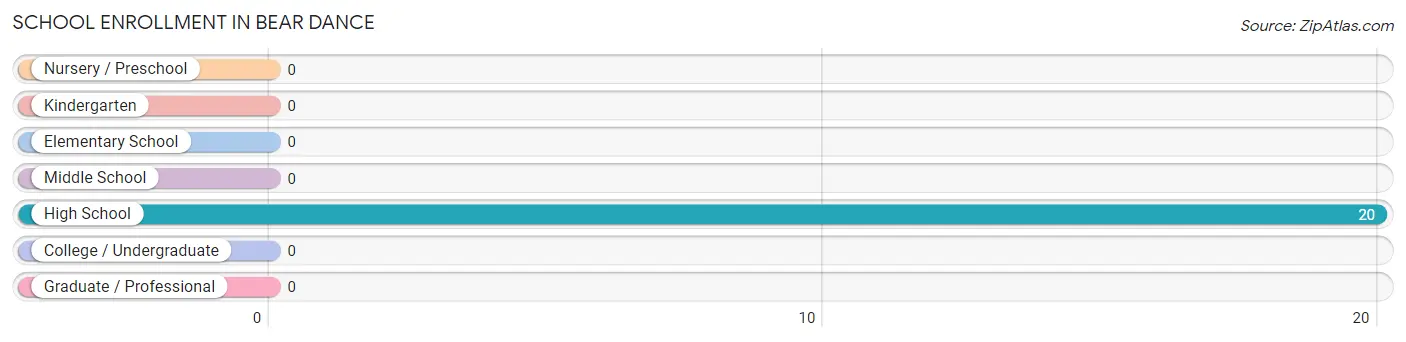
| School Level | # Students | % Students |
| Nursery / Preschool | 0 | 0.0% |
| Kindergarten | 0 | 0.0% |
| Elementary School | 0 | 0.0% |
| Middle School | 0 | 0.0% |
| High School | 20 | 100.0% |
| College / Undergraduate | 0 | 0.0% |
| Graduate / Professional | 0 | 0.0% |
| Total | 20 | 100.0% |
School Enrollment by Age by Funding Source in Bear Dance
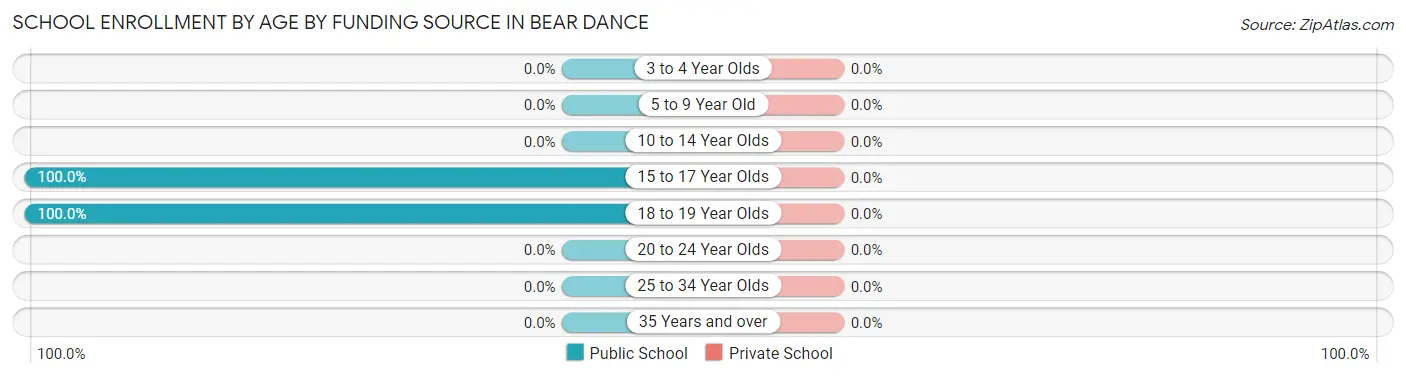
| Age Bracket | Public School | Private School |
| 3 to 4 Year Olds | 0 (0.0%) | 0 (0.0%) |
| 5 to 9 Year Old | 0 (0.0%) | 0 (0.0%) |
| 10 to 14 Year Olds | 0 (0.0%) | 0 (0.0%) |
| 15 to 17 Year Olds | 5 (100.0%) | 0 (0.0%) |
| 18 to 19 Year Olds | 15 (100.0%) | 0 (0.0%) |
| 20 to 24 Year Olds | 0 (0.0%) | 0 (0.0%) |
| 25 to 34 Year Olds | 0 (0.0%) | 0 (0.0%) |
| 35 Years and over | 0 (0.0%) | 0 (0.0%) |
| Total | 20 (100.0%) | 0 (0.0%) |
Educational Attainment by Field of Study in Bear Dance
Education (28 | 17.5%), physical & health sciences (24 | 15.0%), science & technology (18 | 11.3%), business (18 | 11.3%), and communications (18 | 11.3%) are the most common fields of study among 160 individuals in Bear Dance who have obtained a bachelor's degree or higher.
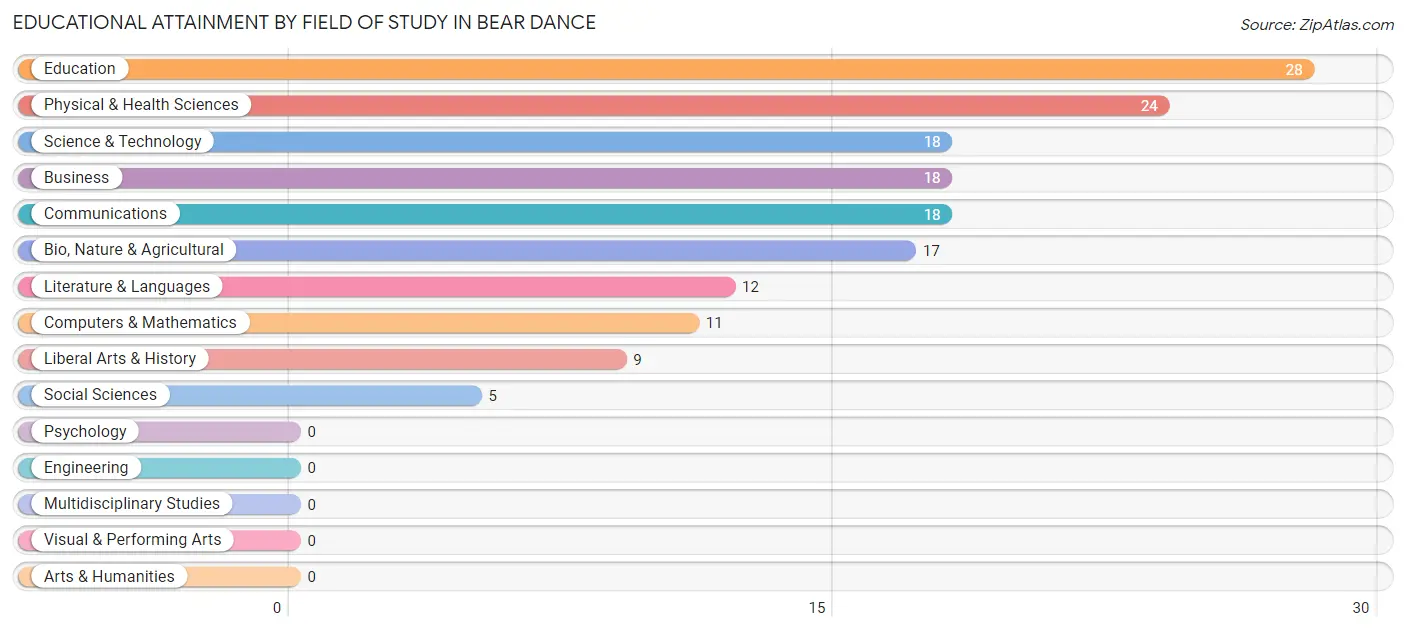
| Field of Study | # Graduates | % Graduates |
| Computers & Mathematics | 11 | 6.9% |
| Bio, Nature & Agricultural | 17 | 10.6% |
| Physical & Health Sciences | 24 | 15.0% |
| Psychology | 0 | 0.0% |
| Social Sciences | 5 | 3.1% |
| Engineering | 0 | 0.0% |
| Multidisciplinary Studies | 0 | 0.0% |
| Science & Technology | 18 | 11.3% |
| Business | 18 | 11.3% |
| Education | 28 | 17.5% |
| Literature & Languages | 12 | 7.5% |
| Liberal Arts & History | 9 | 5.6% |
| Visual & Performing Arts | 0 | 0.0% |
| Communications | 18 | 11.3% |
| Arts & Humanities | 0 | 0.0% |
| Total | 160 | 100.0% |
Transportation & Commute in Bear Dance
Vehicle Availability by Sex in Bear Dance
The most prevalent vehicle ownership categories in Bear Dance are males with 2 vehicles (20, accounting for 66.7%) and females with 2 vehicles (32, making up 62.5%).
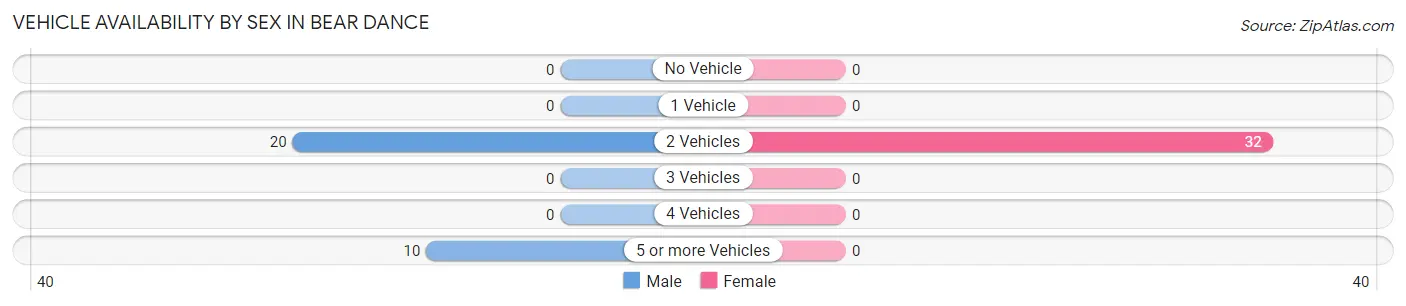
| Vehicles Available | Male | Female |
| No Vehicle | 0 (0.0%) | 0 (0.0%) |
| 1 Vehicle | 0 (0.0%) | 0 (0.0%) |
| 2 Vehicles | 20 (66.7%) | 32 (100.0%) |
| 3 Vehicles | 0 (0.0%) | 0 (0.0%) |
| 4 Vehicles | 0 (0.0%) | 0 (0.0%) |
| 5 or more Vehicles | 10 (33.3%) | 0 (0.0%) |
| Total | 30 (100.0%) | 32 (100.0%) |
Commute Time in Bear Dance
The most frequently occuring commute durations in Bear Dance are 25 to 29 minutes (16 commuters, 34.0%), 45 to 59 minutes (16 commuters, 34.0%), and 10 to 14 minutes (10 commuters, 21.3%).
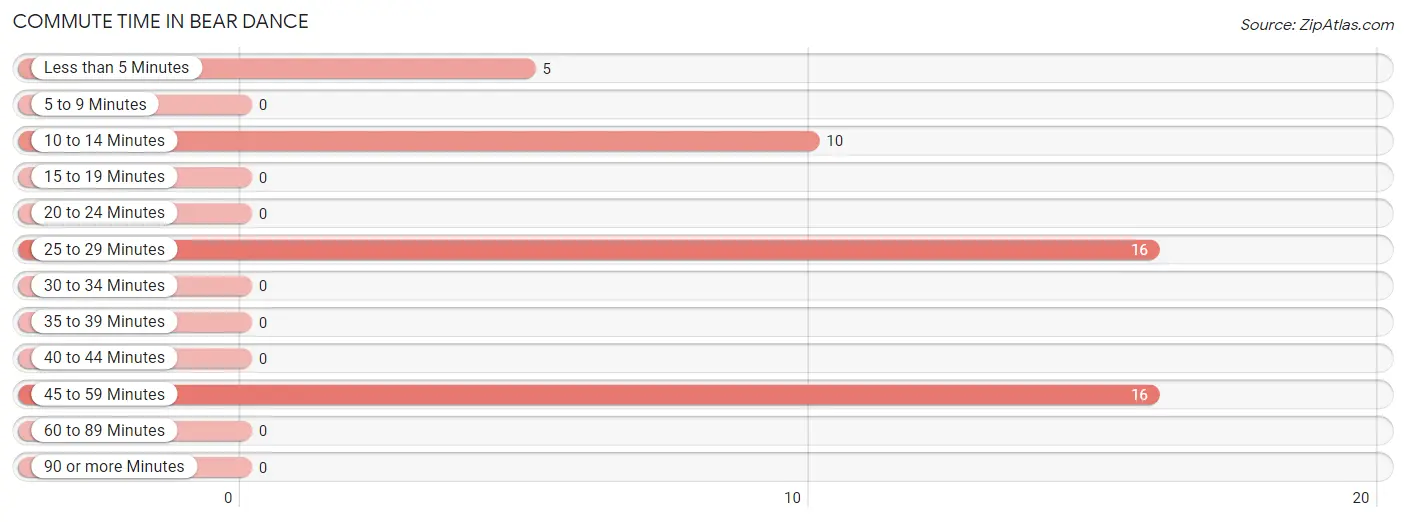
| Commute Time | # Commuters | % Commuters |
| Less than 5 Minutes | 5 | 10.6% |
| 5 to 9 Minutes | 0 | 0.0% |
| 10 to 14 Minutes | 10 | 21.3% |
| 15 to 19 Minutes | 0 | 0.0% |
| 20 to 24 Minutes | 0 | 0.0% |
| 25 to 29 Minutes | 16 | 34.0% |
| 30 to 34 Minutes | 0 | 0.0% |
| 35 to 39 Minutes | 0 | 0.0% |
| 40 to 44 Minutes | 0 | 0.0% |
| 45 to 59 Minutes | 16 | 34.0% |
| 60 to 89 Minutes | 0 | 0.0% |
| 90 or more Minutes | 0 | 0.0% |
Commute Time by Sex in Bear Dance
The most common commute times in Bear Dance are 25 to 29 minutes (16 commuters, 76.2%) for males and 45 to 59 minutes (16 commuters, 61.5%) for females.
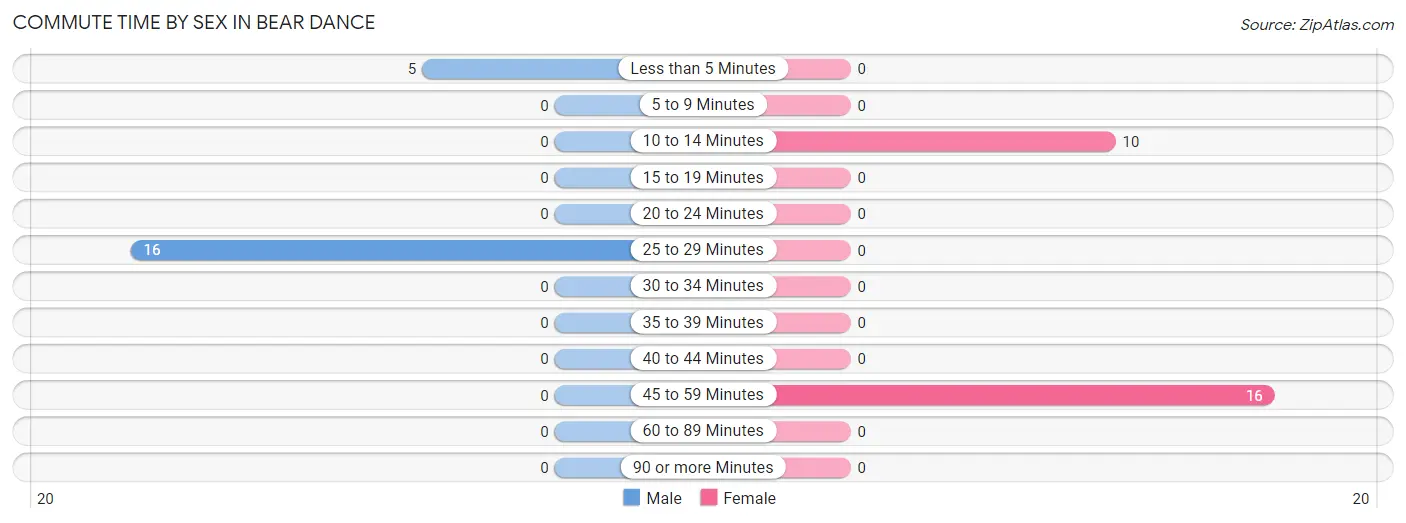
| Commute Time | Male | Female |
| Less than 5 Minutes | 5 (23.8%) | 0 (0.0%) |
| 5 to 9 Minutes | 0 (0.0%) | 0 (0.0%) |
| 10 to 14 Minutes | 0 (0.0%) | 10 (38.5%) |
| 15 to 19 Minutes | 0 (0.0%) | 0 (0.0%) |
| 20 to 24 Minutes | 0 (0.0%) | 0 (0.0%) |
| 25 to 29 Minutes | 16 (76.2%) | 0 (0.0%) |
| 30 to 34 Minutes | 0 (0.0%) | 0 (0.0%) |
| 35 to 39 Minutes | 0 (0.0%) | 0 (0.0%) |
| 40 to 44 Minutes | 0 (0.0%) | 0 (0.0%) |
| 45 to 59 Minutes | 0 (0.0%) | 16 (61.5%) |
| 60 to 89 Minutes | 0 (0.0%) | 0 (0.0%) |
| 90 or more Minutes | 0 (0.0%) | 0 (0.0%) |
Time of Departure to Work by Sex in Bear Dance
The most frequent times of departure to work in Bear Dance are 12:00 AM to 4:59 AM (16, 76.2%) for males and 6:00 AM to 6:29 AM (16, 61.5%) for females.
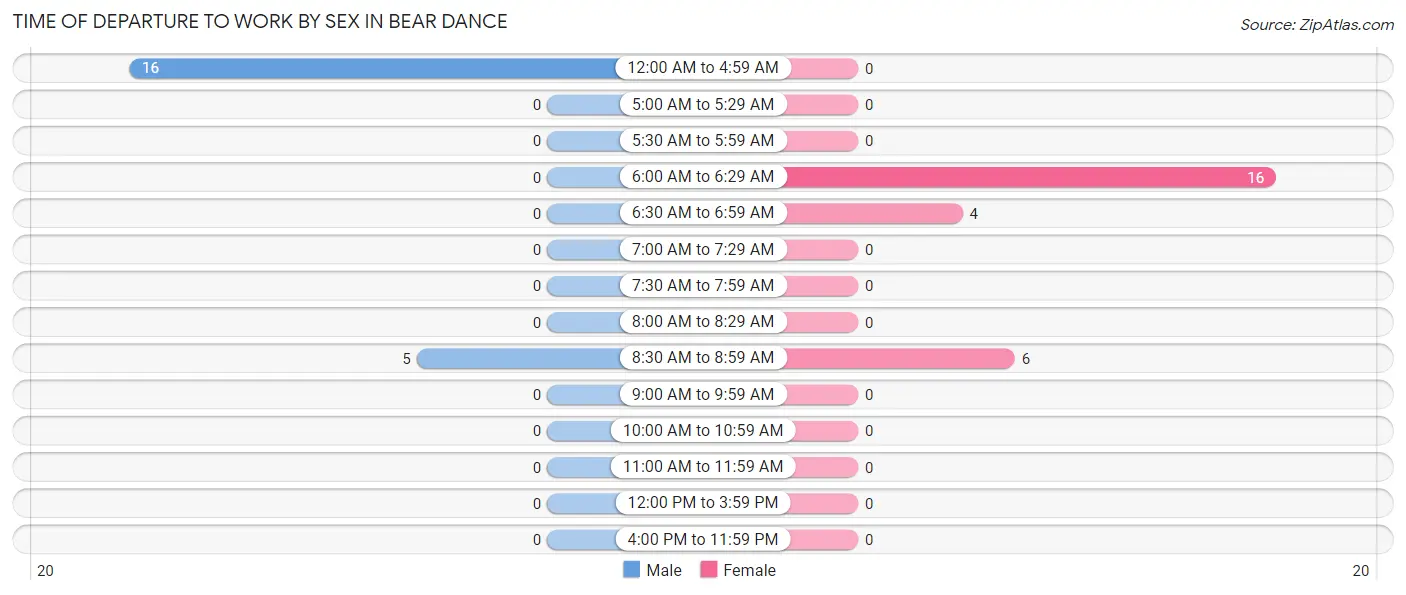
| Time of Departure | Male | Female |
| 12:00 AM to 4:59 AM | 16 (76.2%) | 0 (0.0%) |
| 5:00 AM to 5:29 AM | 0 (0.0%) | 0 (0.0%) |
| 5:30 AM to 5:59 AM | 0 (0.0%) | 0 (0.0%) |
| 6:00 AM to 6:29 AM | 0 (0.0%) | 16 (61.5%) |
| 6:30 AM to 6:59 AM | 0 (0.0%) | 4 (15.4%) |
| 7:00 AM to 7:29 AM | 0 (0.0%) | 0 (0.0%) |
| 7:30 AM to 7:59 AM | 0 (0.0%) | 0 (0.0%) |
| 8:00 AM to 8:29 AM | 0 (0.0%) | 0 (0.0%) |
| 8:30 AM to 8:59 AM | 5 (23.8%) | 6 (23.1%) |
| 9:00 AM to 9:59 AM | 0 (0.0%) | 0 (0.0%) |
| 10:00 AM to 10:59 AM | 0 (0.0%) | 0 (0.0%) |
| 11:00 AM to 11:59 AM | 0 (0.0%) | 0 (0.0%) |
| 12:00 PM to 3:59 PM | 0 (0.0%) | 0 (0.0%) |
| 4:00 PM to 11:59 PM | 0 (0.0%) | 0 (0.0%) |
| Total | 21 (100.0%) | 26 (100.0%) |
Housing Occupancy in Bear Dance
Occupancy by Ownership in Bear Dance
Of the total 107 dwellings in Bear Dance, owner-occupied units account for 80 (74.8%), while renter-occupied units make up 27 (25.2%).
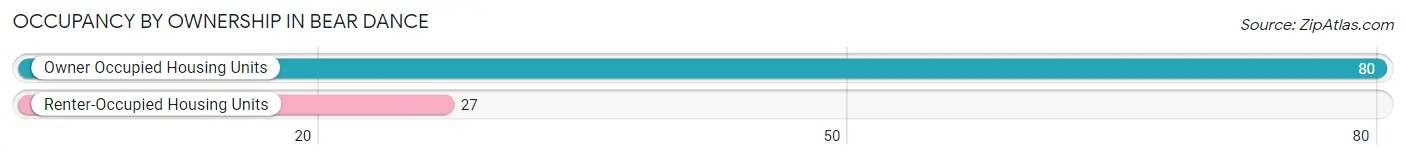
| Occupancy | # Housing Units | % Housing Units |
| Owner Occupied Housing Units | 80 | 74.8% |
| Renter-Occupied Housing Units | 27 | 25.2% |
| Total Occupied Housing Units | 107 | 100.0% |
Occupancy by Household Size in Bear Dance
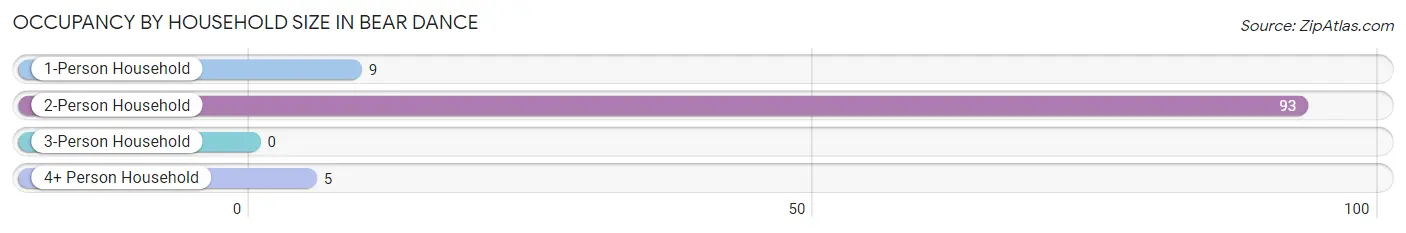
| Household Size | # Housing Units | % Housing Units |
| 1-Person Household | 9 | 8.4% |
| 2-Person Household | 93 | 86.9% |
| 3-Person Household | 0 | 0.0% |
| 4+ Person Household | 5 | 4.7% |
| Total Housing Units | 107 | 100.0% |
Occupancy by Ownership by Household Size in Bear Dance
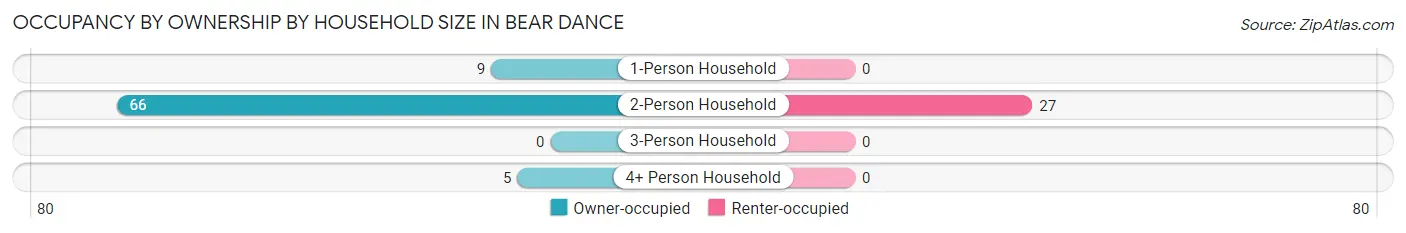
| Household Size | Owner-occupied | Renter-occupied |
| 1-Person Household | 9 (100.0%) | 0 (0.0%) |
| 2-Person Household | 66 (71.0%) | 27 (29.0%) |
| 3-Person Household | 0 (0.0%) | 0 (0.0%) |
| 4+ Person Household | 5 (100.0%) | 0 (0.0%) |
| Total Housing Units | 80 (74.8%) | 27 (25.2%) |
Occupancy by Educational Attainment in Bear Dance
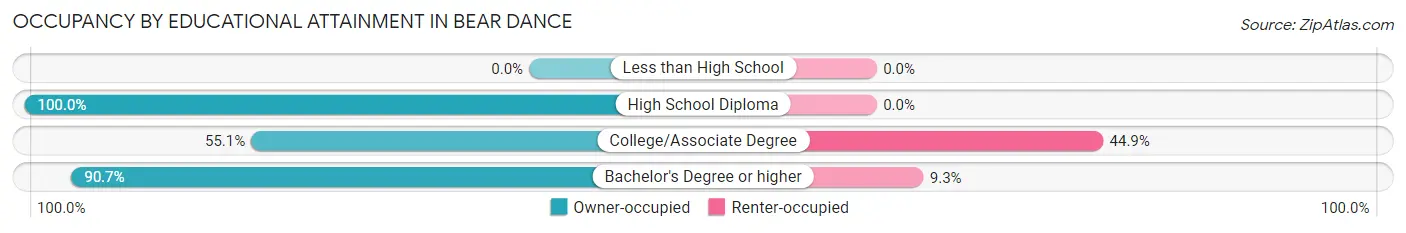
| Household Size | Owner-occupied | Renter-occupied |
| Less than High School | 0 (0.0%) | 0 (0.0%) |
| High School Diploma | 4 (100.0%) | 0 (0.0%) |
| College/Associate Degree | 27 (55.1%) | 22 (44.9%) |
| Bachelor's Degree or higher | 49 (90.7%) | 5 (9.3%) |
Occupancy by Age of Householder in Bear Dance
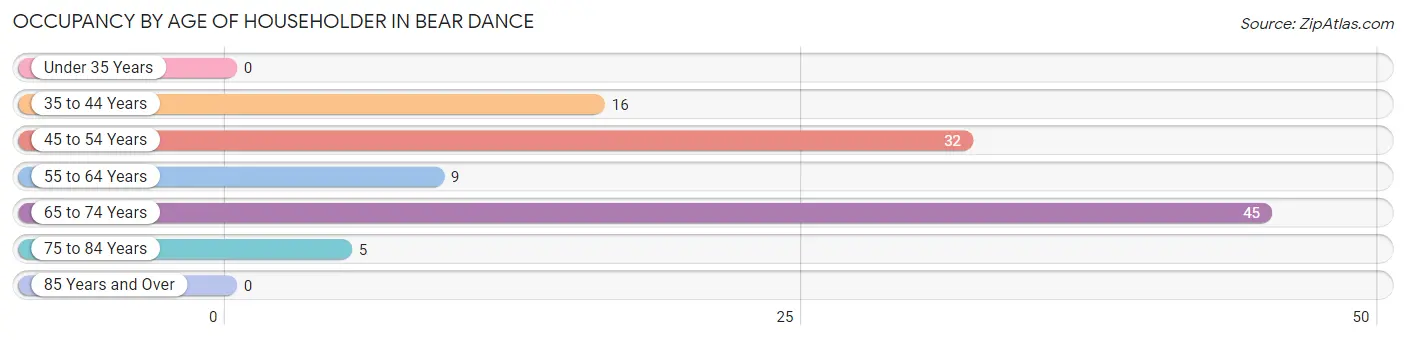
| Age Bracket | # Households | % Households |
| Under 35 Years | 0 | 0.0% |
| 35 to 44 Years | 16 | 14.9% |
| 45 to 54 Years | 32 | 29.9% |
| 55 to 64 Years | 9 | 8.4% |
| 65 to 74 Years | 45 | 42.1% |
| 75 to 84 Years | 5 | 4.7% |
| 85 Years and Over | 0 | 0.0% |
| Total | 107 | 100.0% |
Housing Finances in Bear Dance
Median Income by Occupancy in Bear Dance
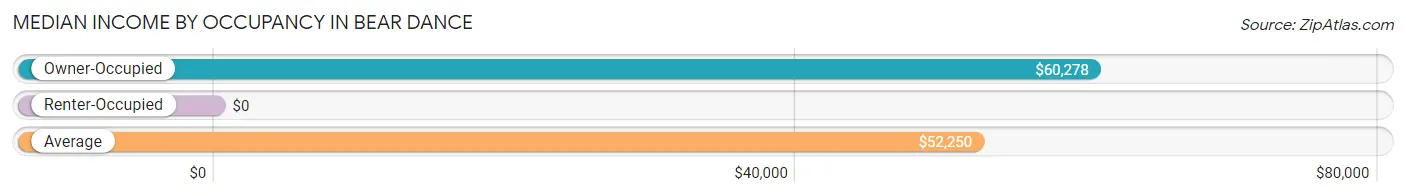
| Occupancy Type | # Households | Median Income |
| Owner-Occupied | 80 (74.8%) | $60,278 |
| Renter-Occupied | 27 (25.2%) | $0 |
| Average | 107 (100.0%) | $52,250 |
Occupancy by Householder Income Bracket in Bear Dance
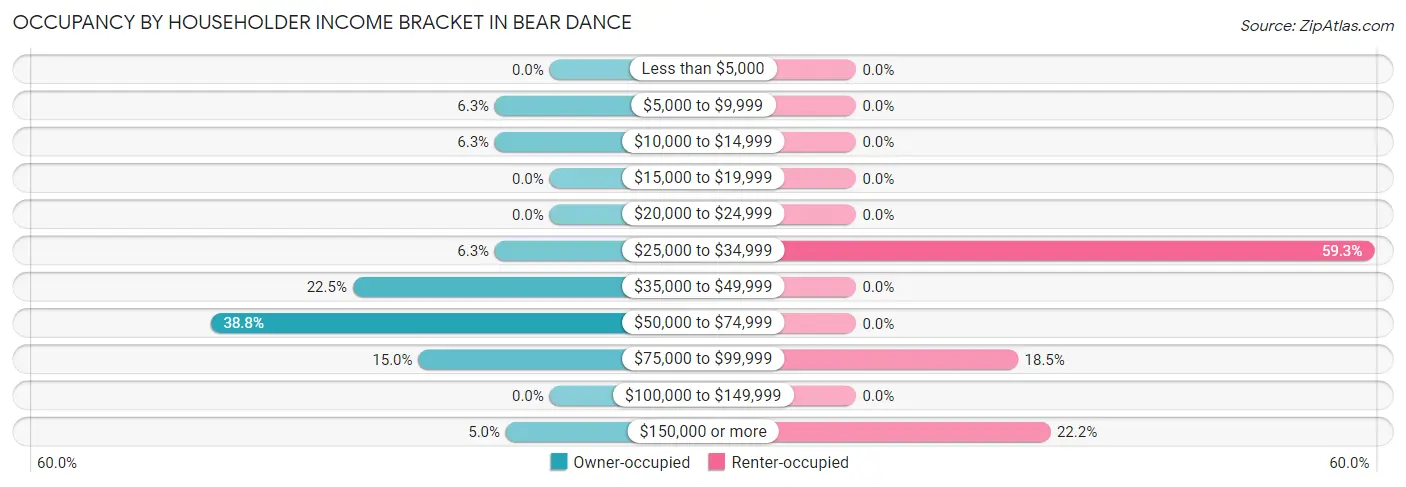
| Income Bracket | Owner-occupied | Renter-occupied |
| Less than $5,000 | 0 (0.0%) | 0 (0.0%) |
| $5,000 to $9,999 | 5 (6.2%) | 0 (0.0%) |
| $10,000 to $14,999 | 5 (6.2%) | 0 (0.0%) |
| $15,000 to $19,999 | 0 (0.0%) | 0 (0.0%) |
| $20,000 to $24,999 | 0 (0.0%) | 0 (0.0%) |
| $25,000 to $34,999 | 5 (6.2%) | 16 (59.3%) |
| $35,000 to $49,999 | 18 (22.5%) | 0 (0.0%) |
| $50,000 to $74,999 | 31 (38.8%) | 0 (0.0%) |
| $75,000 to $99,999 | 12 (15.0%) | 5 (18.5%) |
| $100,000 to $149,999 | 0 (0.0%) | 0 (0.0%) |
| $150,000 or more | 4 (5.0%) | 6 (22.2%) |
| Total | 80 (100.0%) | 27 (100.0%) |
Monthly Housing Cost Tiers in Bear Dance
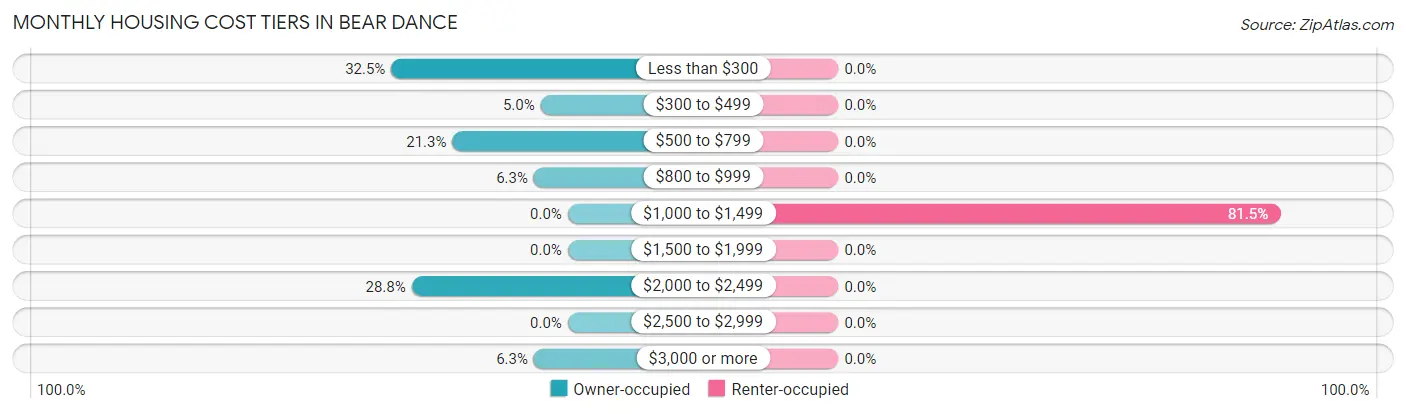
| Monthly Cost | Owner-occupied | Renter-occupied |
| Less than $300 | 26 (32.5%) | 0 (0.0%) |
| $300 to $499 | 4 (5.0%) | 0 (0.0%) |
| $500 to $799 | 17 (21.2%) | 0 (0.0%) |
| $800 to $999 | 5 (6.2%) | 0 (0.0%) |
| $1,000 to $1,499 | 0 (0.0%) | 22 (81.5%) |
| $1,500 to $1,999 | 0 (0.0%) | 0 (0.0%) |
| $2,000 to $2,499 | 23 (28.7%) | 0 (0.0%) |
| $2,500 to $2,999 | 0 (0.0%) | 0 (0.0%) |
| $3,000 or more | 5 (6.2%) | 0 (0.0%) |
| Total | 80 (100.0%) | 27 (100.0%) |
Physical Housing Characteristics in Bear Dance
Housing Structures in Bear Dance
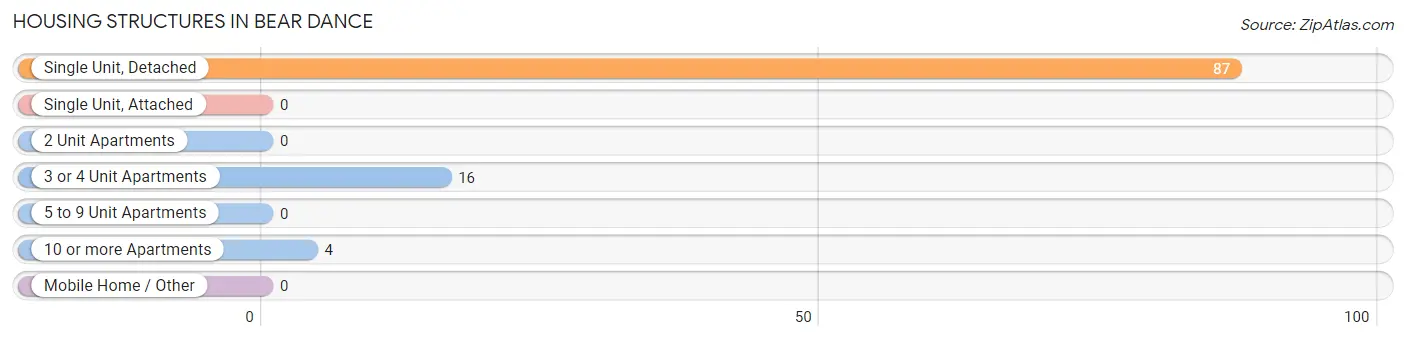
| Structure Type | # Housing Units | % Housing Units |
| Single Unit, Detached | 87 | 81.3% |
| Single Unit, Attached | 0 | 0.0% |
| 2 Unit Apartments | 0 | 0.0% |
| 3 or 4 Unit Apartments | 16 | 14.9% |
| 5 to 9 Unit Apartments | 0 | 0.0% |
| 10 or more Apartments | 4 | 3.7% |
| Mobile Home / Other | 0 | 0.0% |
| Total | 107 | 100.0% |
Housing Structures by Occupancy in Bear Dance
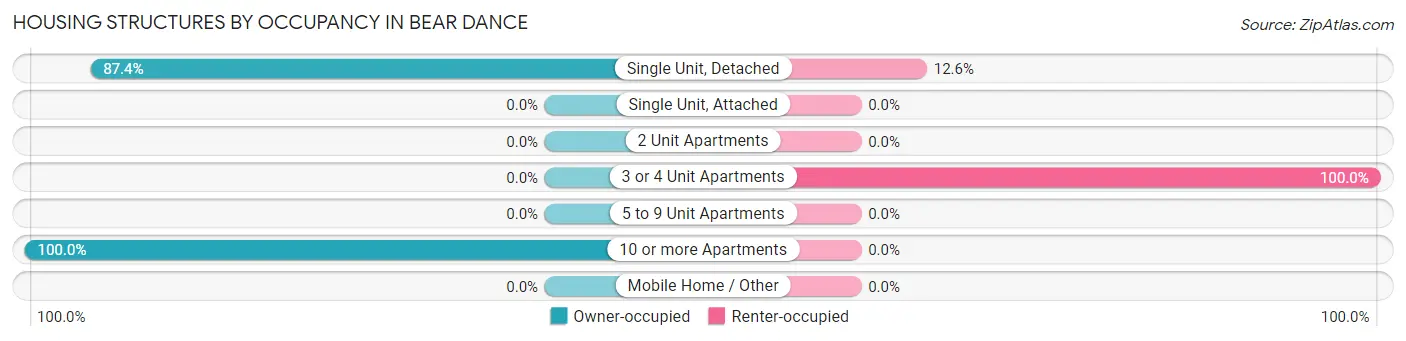
| Structure Type | Owner-occupied | Renter-occupied |
| Single Unit, Detached | 76 (87.4%) | 11 (12.6%) |
| Single Unit, Attached | 0 (0.0%) | 0 (0.0%) |
| 2 Unit Apartments | 0 (0.0%) | 0 (0.0%) |
| 3 or 4 Unit Apartments | 0 (0.0%) | 16 (100.0%) |
| 5 to 9 Unit Apartments | 0 (0.0%) | 0 (0.0%) |
| 10 or more Apartments | 4 (100.0%) | 0 (0.0%) |
| Mobile Home / Other | 0 (0.0%) | 0 (0.0%) |
| Total | 80 (74.8%) | 27 (25.2%) |
Housing Structures by Number of Rooms in Bear Dance
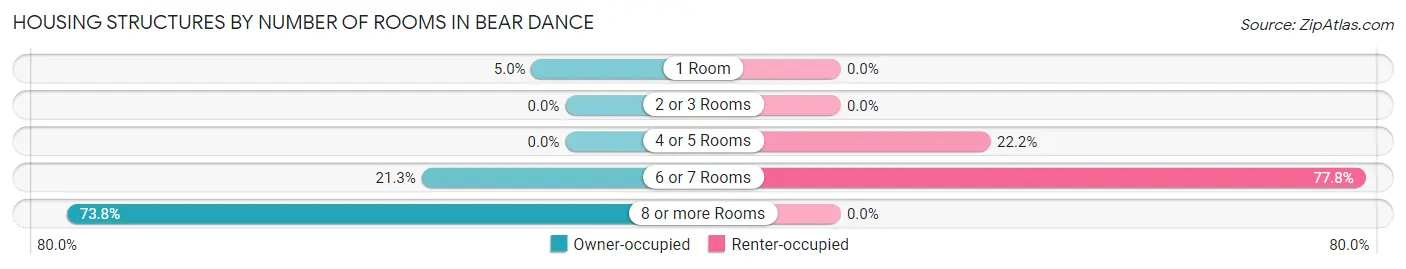
| Number of Rooms | Owner-occupied | Renter-occupied |
| 1 Room | 4 (5.0%) | 0 (0.0%) |
| 2 or 3 Rooms | 0 (0.0%) | 0 (0.0%) |
| 4 or 5 Rooms | 0 (0.0%) | 6 (22.2%) |
| 6 or 7 Rooms | 17 (21.2%) | 21 (77.8%) |
| 8 or more Rooms | 59 (73.8%) | 0 (0.0%) |
| Total | 80 (100.0%) | 27 (100.0%) |
Housing Structure by Heating Type in Bear Dance
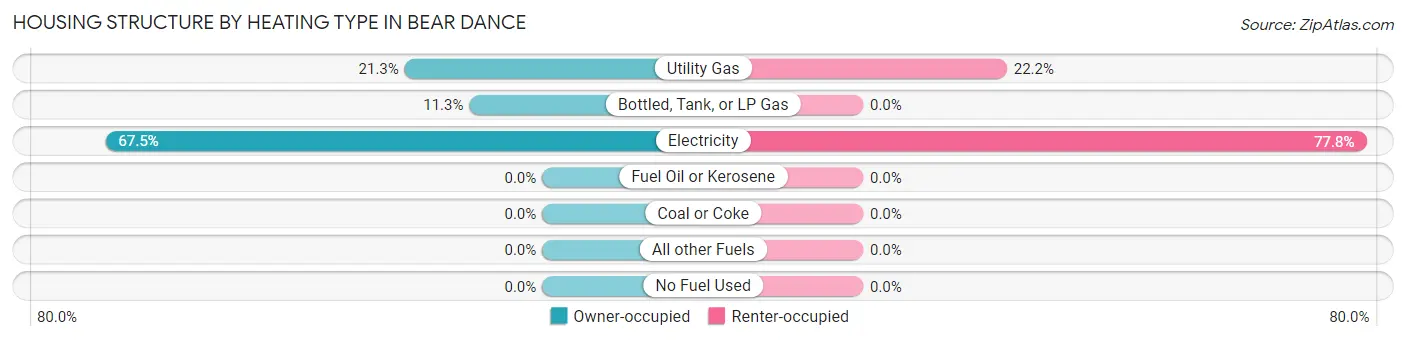
| Heating Type | Owner-occupied | Renter-occupied |
| Utility Gas | 17 (21.2%) | 6 (22.2%) |
| Bottled, Tank, or LP Gas | 9 (11.3%) | 0 (0.0%) |
| Electricity | 54 (67.5%) | 21 (77.8%) |
| Fuel Oil or Kerosene | 0 (0.0%) | 0 (0.0%) |
| Coal or Coke | 0 (0.0%) | 0 (0.0%) |
| All other Fuels | 0 (0.0%) | 0 (0.0%) |
| No Fuel Used | 0 (0.0%) | 0 (0.0%) |
| Total | 80 (100.0%) | 27 (100.0%) |
Household Vehicle Usage in Bear Dance
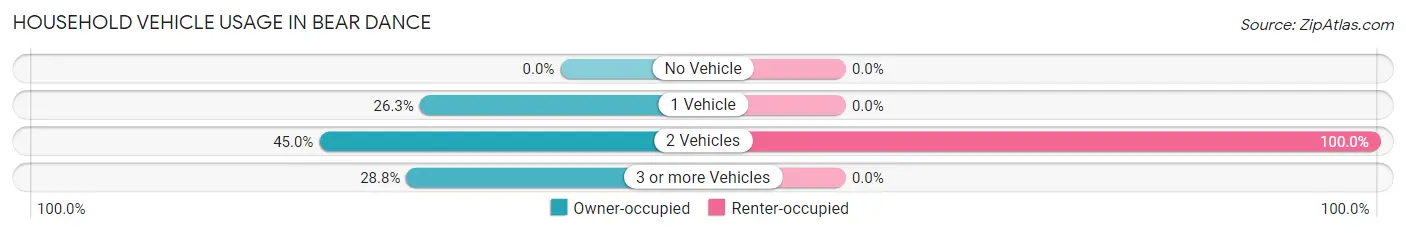
| Vehicles per Household | Owner-occupied | Renter-occupied |
| No Vehicle | 0 (0.0%) | 0 (0.0%) |
| 1 Vehicle | 21 (26.3%) | 0 (0.0%) |
| 2 Vehicles | 36 (45.0%) | 27 (100.0%) |
| 3 or more Vehicles | 23 (28.7%) | 0 (0.0%) |
| Total | 80 (100.0%) | 27 (100.0%) |
Real Estate & Mortgages in Bear Dance
Real Estate and Mortgage Overview in Bear Dance
| Characteristic | Without Mortgage | With Mortgage |
| Housing Units | 70 | 10 |
| Median Property Value | $573,500 | $0 |
| Median Household Income | $60,972 | $0 |
| Monthly Housing Costs | $642 | $5 |
| Real Estate Taxes | - | - |
Property Value by Mortgage Status in Bear Dance
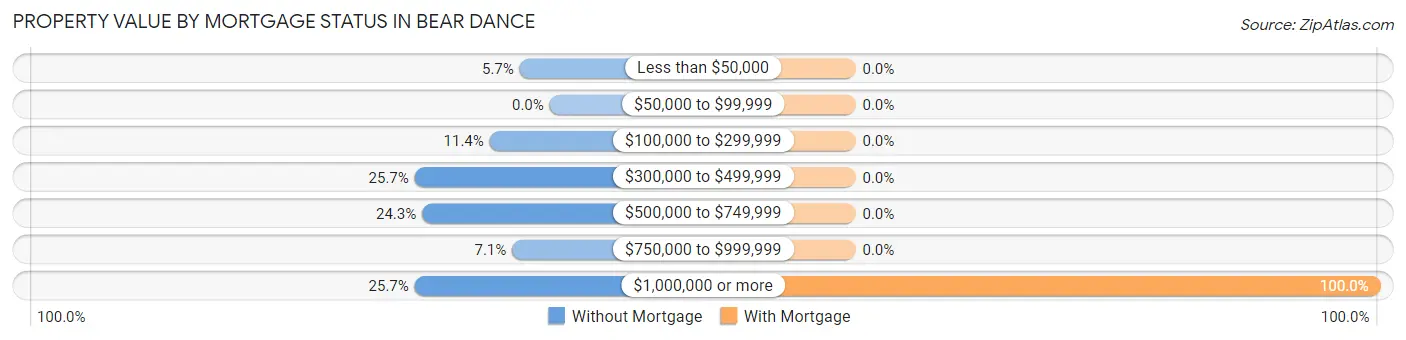
| Property Value | Without Mortgage | With Mortgage |
| Less than $50,000 | 4 (5.7%) | 0 (0.0%) |
| $50,000 to $99,999 | 0 (0.0%) | 0 (0.0%) |
| $100,000 to $299,999 | 8 (11.4%) | 0 (0.0%) |
| $300,000 to $499,999 | 18 (25.7%) | 0 (0.0%) |
| $500,000 to $749,999 | 17 (24.3%) | 0 (0.0%) |
| $750,000 to $999,999 | 5 (7.1%) | 0 (0.0%) |
| $1,000,000 or more | 18 (25.7%) | 10 (100.0%) |
| Total | 70 (100.0%) | 10 (100.0%) |
Household Income by Mortgage Status in Bear Dance
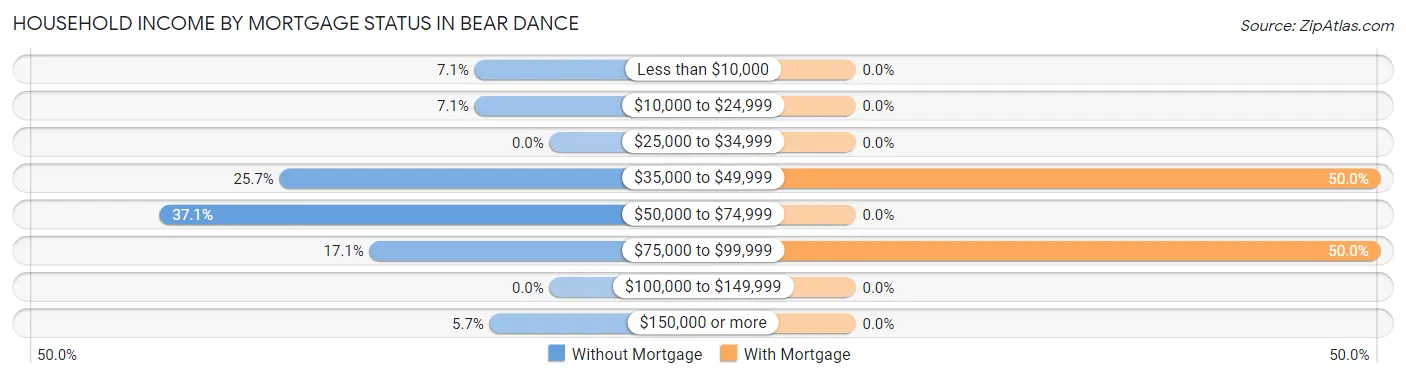
| Household Income | Without Mortgage | With Mortgage |
| Less than $10,000 | 5 (7.1%) | 0 (0.0%) |
| $10,000 to $24,999 | 5 (7.1%) | 0 (0.0%) |
| $25,000 to $34,999 | 0 (0.0%) | 0 (0.0%) |
| $35,000 to $49,999 | 18 (25.7%) | 5 (50.0%) |
| $50,000 to $74,999 | 26 (37.1%) | 0 (0.0%) |
| $75,000 to $99,999 | 12 (17.1%) | 5 (50.0%) |
| $100,000 to $149,999 | 0 (0.0%) | 0 (0.0%) |
| $150,000 or more | 4 (5.7%) | 0 (0.0%) |
| Total | 70 (100.0%) | 10 (100.0%) |
Property Value to Household Income Ratio in Bear Dance
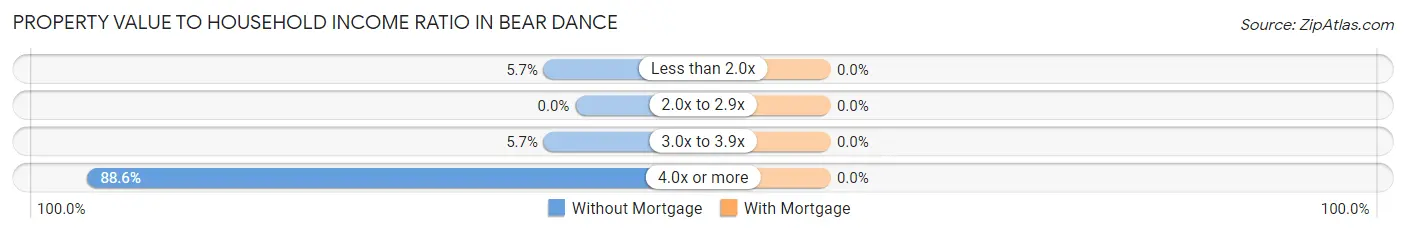
| Value-to-Income Ratio | Without Mortgage | With Mortgage |
| Less than 2.0x | 4 (5.7%) | 0 (0.0%) |
| 2.0x to 2.9x | 0 (0.0%) | 0 (0.0%) |
| 3.0x to 3.9x | 4 (5.7%) | 0 (0.0%) |
| 4.0x or more | 62 (88.6%) | 0 (0.0%) |
| Total | 70 (100.0%) | 10 (100.0%) |
Real Estate Taxes by Mortgage Status in Bear Dance
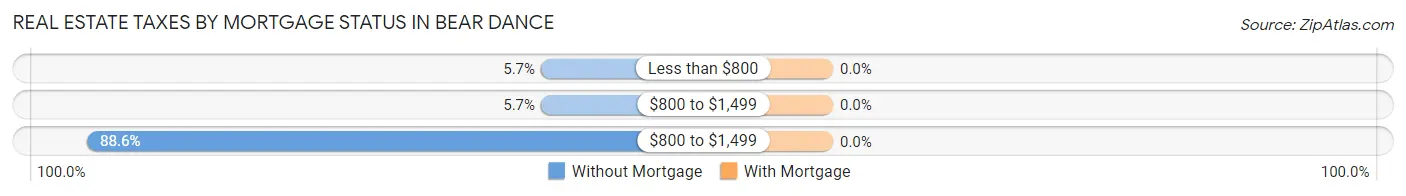
| Property Taxes | Without Mortgage | With Mortgage |
| Less than $800 | 4 (5.7%) | 0 (0.0%) |
| $800 to $1,499 | 4 (5.7%) | 0 (0.0%) |
| $800 to $1,499 | 62 (88.6%) | 0 (0.0%) |
| Total | 70 (100.0%) | 10 (100.0%) |
Health & Disability in Bear Dance
Health Insurance Coverage by Age in Bear Dance
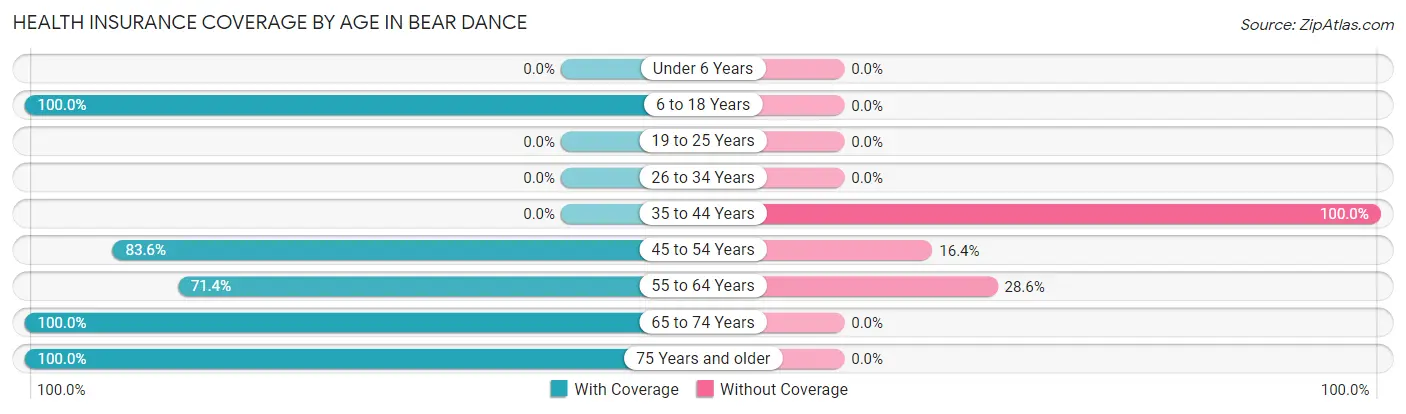
| Age Bracket | With Coverage | Without Coverage |
| Under 6 Years | 0 (0.0%) | 0 (0.0%) |
| 6 to 18 Years | 20 (100.0%) | 0 (0.0%) |
| 19 to 25 Years | 0 (0.0%) | 0 (0.0%) |
| 26 to 34 Years | 0 (0.0%) | 0 (0.0%) |
| 35 to 44 Years | 0 (0.0%) | 16 (100.0%) |
| 45 to 54 Years | 56 (83.6%) | 11 (16.4%) |
| 55 to 64 Years | 20 (71.4%) | 8 (28.6%) |
| 65 to 74 Years | 98 (100.0%) | 0 (0.0%) |
| 75 Years and older | 12 (100.0%) | 0 (0.0%) |
| Total | 206 (85.5%) | 35 (14.5%) |
Health Insurance Coverage by Citizenship Status in Bear Dance
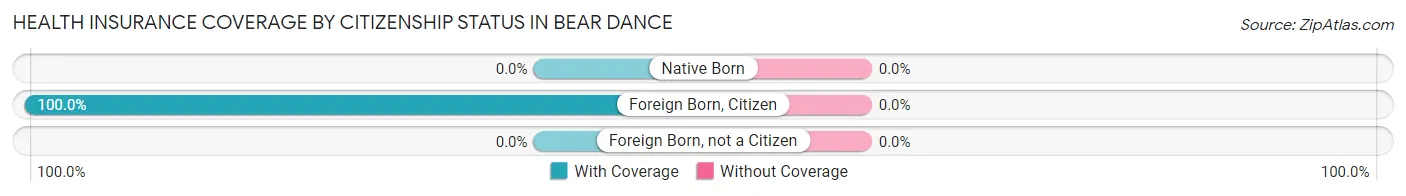
| Citizenship Status | With Coverage | Without Coverage |
| Native Born | 0 (0.0%) | 0 (0.0%) |
| Foreign Born, Citizen | 20 (100.0%) | 0 (0.0%) |
| Foreign Born, not a Citizen | 0 (0.0%) | 0 (0.0%) |
Health Insurance Coverage by Household Income in Bear Dance
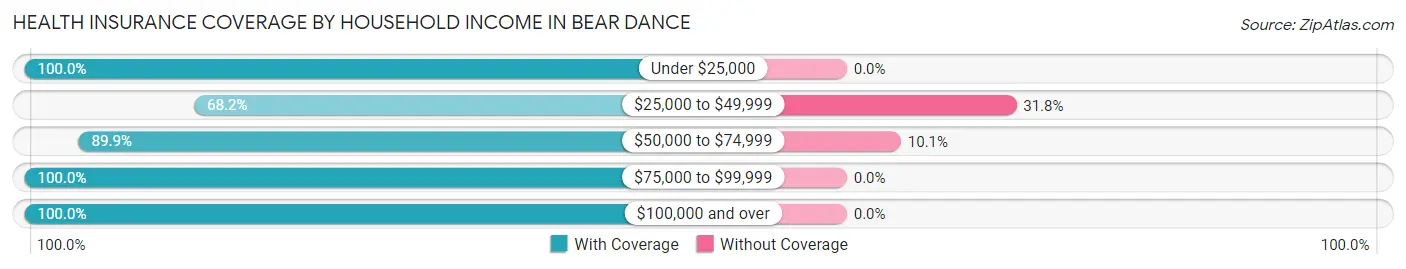
| Household Income | With Coverage | Without Coverage |
| Under $25,000 | 16 (100.0%) | 0 (0.0%) |
| $25,000 to $49,999 | 58 (68.2%) | 27 (31.8%) |
| $50,000 to $74,999 | 71 (89.9%) | 8 (10.1%) |
| $75,000 to $99,999 | 41 (100.0%) | 0 (0.0%) |
| $100,000 and over | 20 (100.0%) | 0 (0.0%) |
Public vs Private Health Insurance Coverage by Age in Bear Dance
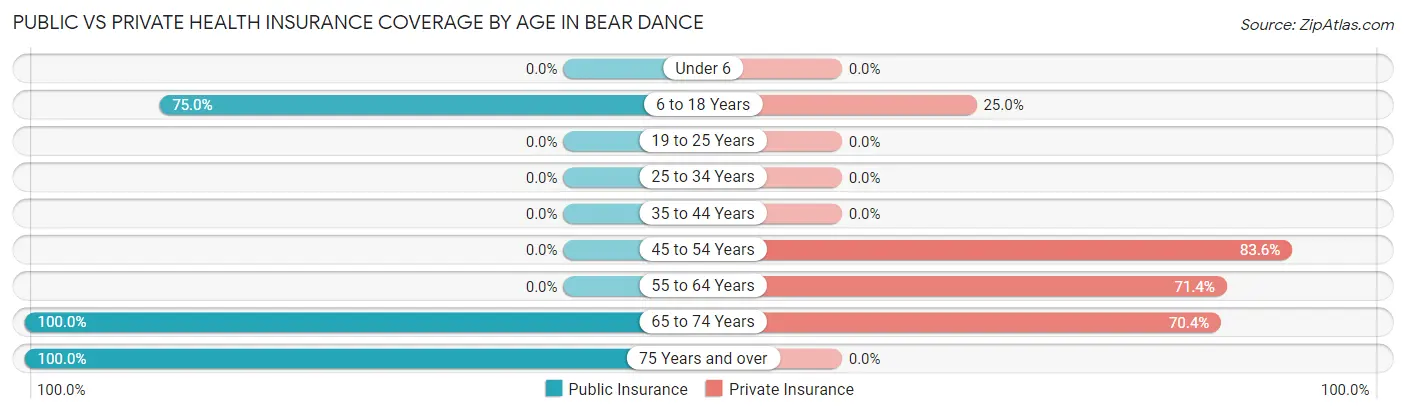
| Age Bracket | Public Insurance | Private Insurance |
| Under 6 | 0 (0.0%) | 0 (0.0%) |
| 6 to 18 Years | 15 (75.0%) | 5 (25.0%) |
| 19 to 25 Years | 0 (0.0%) | 0 (0.0%) |
| 25 to 34 Years | 0 (0.0%) | 0 (0.0%) |
| 35 to 44 Years | 0 (0.0%) | 0 (0.0%) |
| 45 to 54 Years | 0 (0.0%) | 56 (83.6%) |
| 55 to 64 Years | 0 (0.0%) | 20 (71.4%) |
| 65 to 74 Years | 98 (100.0%) | 69 (70.4%) |
| 75 Years and over | 12 (100.0%) | 0 (0.0%) |
| Total | 125 (51.9%) | 150 (62.2%) |
Disability Status by Sex by Age in Bear Dance
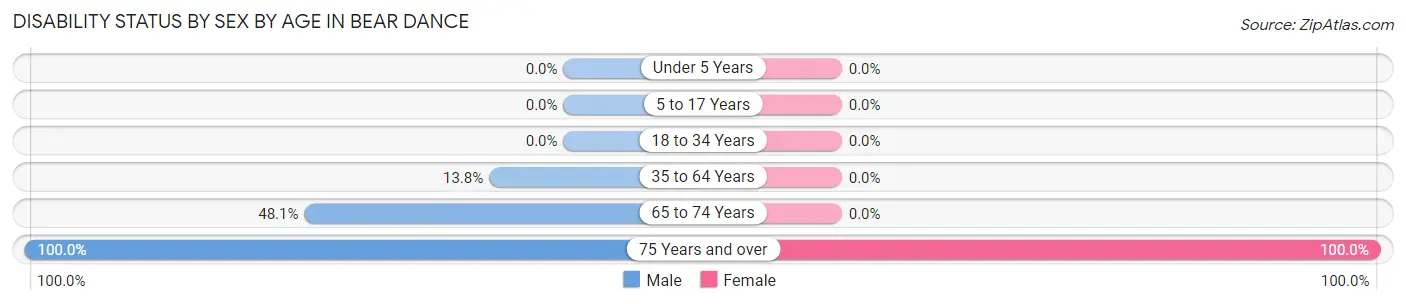
| Age Bracket | Male | Female |
| Under 5 Years | 0 (0.0%) | 0 (0.0%) |
| 5 to 17 Years | 0 (0.0%) | 0 (0.0%) |
| 18 to 34 Years | 0 (0.0%) | 0 (0.0%) |
| 35 to 64 Years | 8 (13.8%) | 0 (0.0%) |
| 65 to 74 Years | 25 (48.1%) | 0 (0.0%) |
| 75 Years and over | 7 (100.0%) | 5 (100.0%) |
Disability Class by Sex by Age in Bear Dance
Disability Class: Hearing Difficulty
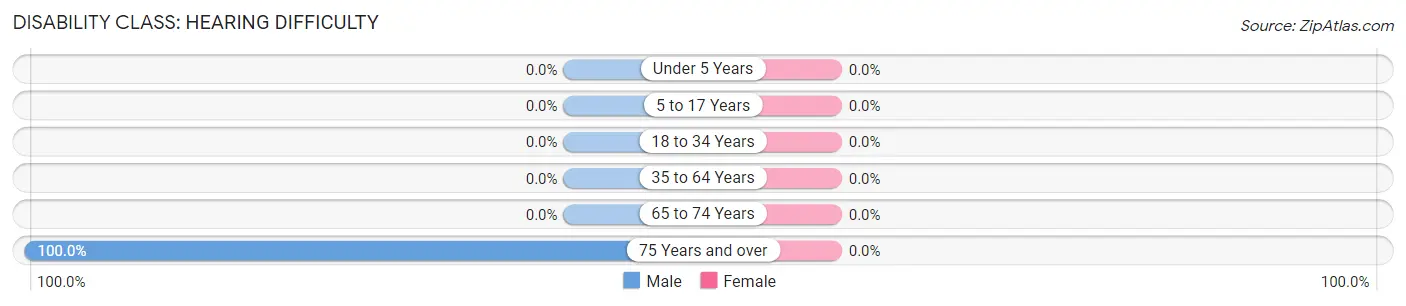
| Age Bracket | Male | Female |
| Under 5 Years | 0 (0.0%) | 0 (0.0%) |
| 5 to 17 Years | 0 (0.0%) | 0 (0.0%) |
| 18 to 34 Years | 0 (0.0%) | 0 (0.0%) |
| 35 to 64 Years | 0 (0.0%) | 0 (0.0%) |
| 65 to 74 Years | 0 (0.0%) | 0 (0.0%) |
| 75 Years and over | 7 (100.0%) | 0 (0.0%) |
Disability Class: Vision Difficulty
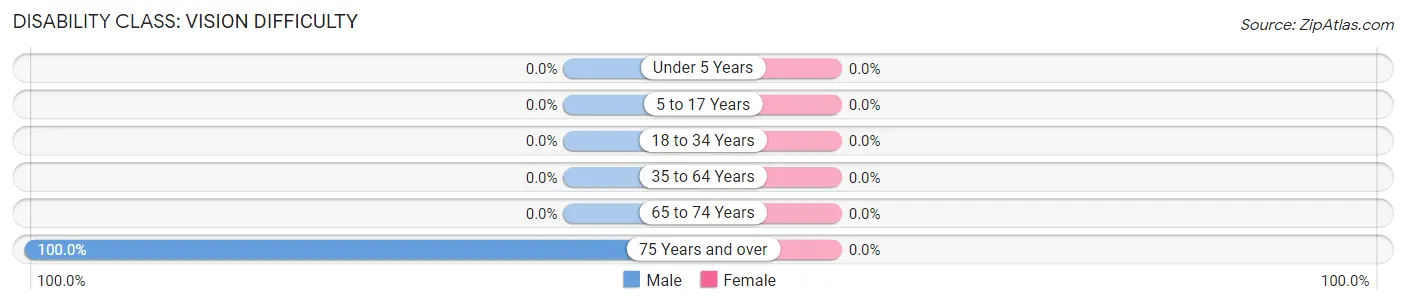
| Age Bracket | Male | Female |
| Under 5 Years | 0 (0.0%) | 0 (0.0%) |
| 5 to 17 Years | 0 (0.0%) | 0 (0.0%) |
| 18 to 34 Years | 0 (0.0%) | 0 (0.0%) |
| 35 to 64 Years | 0 (0.0%) | 0 (0.0%) |
| 65 to 74 Years | 0 (0.0%) | 0 (0.0%) |
| 75 Years and over | 7 (100.0%) | 0 (0.0%) |
Disability Class: Cognitive Difficulty
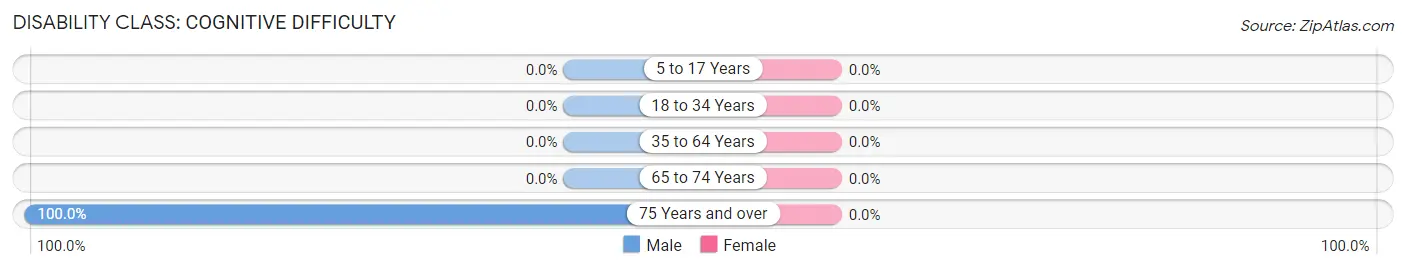
| Age Bracket | Male | Female |
| 5 to 17 Years | 0 (0.0%) | 0 (0.0%) |
| 18 to 34 Years | 0 (0.0%) | 0 (0.0%) |
| 35 to 64 Years | 0 (0.0%) | 0 (0.0%) |
| 65 to 74 Years | 0 (0.0%) | 0 (0.0%) |
| 75 Years and over | 7 (100.0%) | 0 (0.0%) |
Disability Class: Ambulatory Difficulty
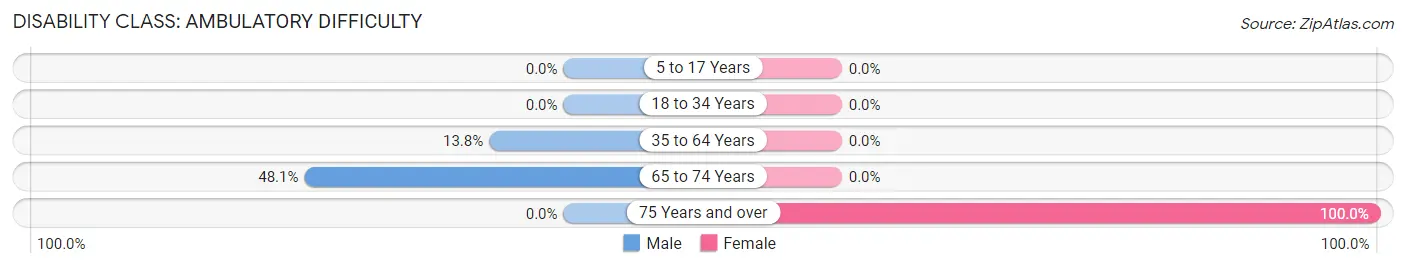
| Age Bracket | Male | Female |
| 5 to 17 Years | 0 (0.0%) | 0 (0.0%) |
| 18 to 34 Years | 0 (0.0%) | 0 (0.0%) |
| 35 to 64 Years | 8 (13.8%) | 0 (0.0%) |
| 65 to 74 Years | 25 (48.1%) | 0 (0.0%) |
| 75 Years and over | 0 (0.0%) | 5 (100.0%) |
Disability Class: Self-Care Difficulty
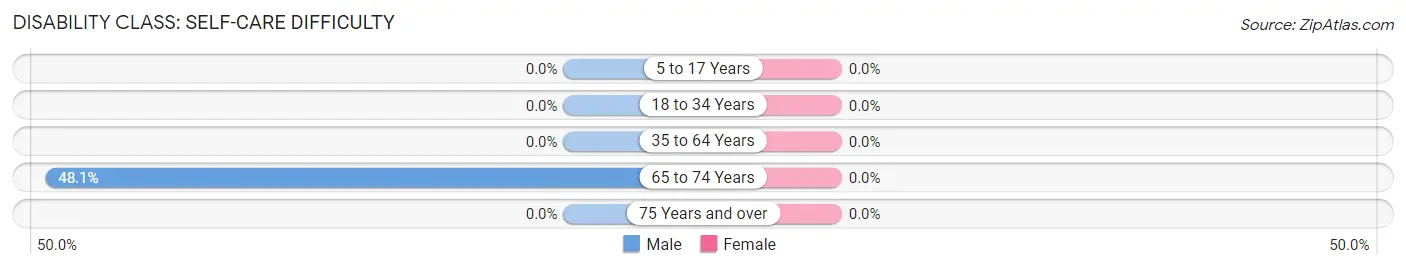
| Age Bracket | Male | Female |
| 5 to 17 Years | 0 (0.0%) | 0 (0.0%) |
| 18 to 34 Years | 0 (0.0%) | 0 (0.0%) |
| 35 to 64 Years | 0 (0.0%) | 0 (0.0%) |
| 65 to 74 Years | 25 (48.1%) | 0 (0.0%) |
| 75 Years and over | 0 (0.0%) | 0 (0.0%) |
Technology Access in Bear Dance
Computing Device Access in Bear Dance
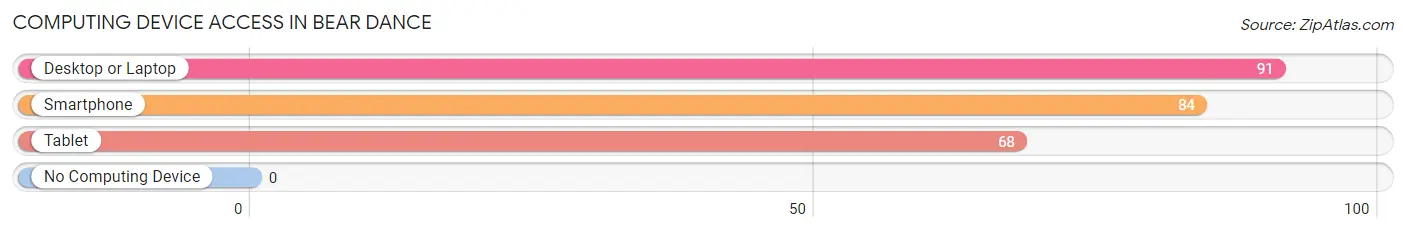
| Device Type | # Households | % Households |
| Desktop or Laptop | 91 | 85.1% |
| Smartphone | 84 | 78.5% |
| Tablet | 68 | 63.5% |
| No Computing Device | 0 | 0.0% |
| Total | 107 | 100.0% |
Internet Access in Bear Dance
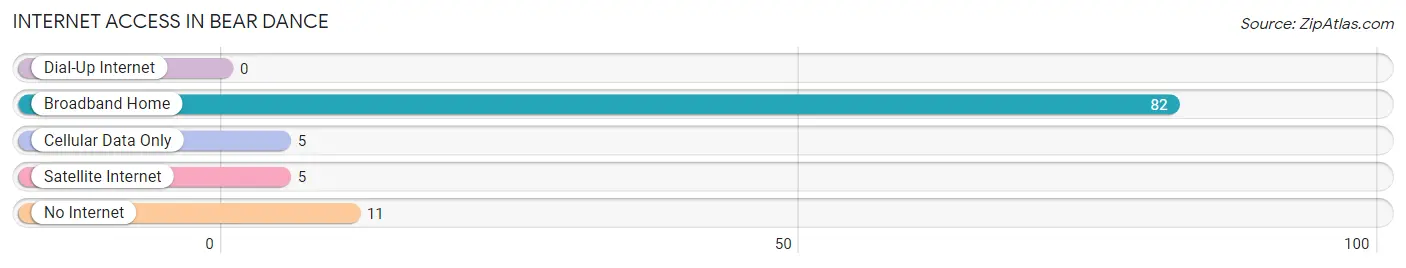
| Internet Type | # Households | % Households |
| Dial-Up Internet | 0 | 0.0% |
| Broadband Home | 82 | 76.6% |
| Cellular Data Only | 5 | 4.7% |
| Satellite Internet | 5 | 4.7% |
| No Internet | 11 | 10.3% |
| Total | 107 | 100.0% |
Bear Dance Summary
The small town of Bear Dance, Montana is located in the western part of the state, in the foothills of the Rocky Mountains. It is a rural community with a population of just over 1,000 people, and is known for its small-town charm and friendly atmosphere. The town is situated on the banks of the Clark Fork River, and is surrounded by rolling hills and lush forests.
Geography
Bear Dance is located in the western part of Montana, in the foothills of the Rocky Mountains. The town is situated on the banks of the Clark Fork River, and is surrounded by rolling hills and lush forests. The town is located at an elevation of 4,000 feet, and the surrounding area is characterized by a semi-arid climate. The average annual temperature is around 50 degrees Fahrenheit, and the average annual precipitation is around 15 inches.
Economy
The economy of Bear Dance is largely based on agriculture and tourism. The town is home to several small farms, which produce a variety of crops, including wheat, barley, and hay. The town also has a thriving tourism industry, with many visitors coming to the area to enjoy the natural beauty of the area. The town is also home to several small businesses, including restaurants, shops, and lodging.
Demographics
As of the 2010 census, the population of Bear Dance was 1,072. The population is predominantly white, with a small percentage of African Americans, Native Americans, and other ethnicities. The median age of the population is 44.7 years, and the median household income is $41,944. The town has a high rate of homeownership, with over 80% of the population owning their own homes.
History
The area around Bear Dance has been inhabited for thousands of years, with evidence of human habitation dating back to the Paleo-Indian period. The town was founded in the late 19th century, and was originally known as Bear Dance Creek. The town was named after a Native American ceremony that was held in the area. The town grew steadily throughout the 20th century, and today it is a thriving rural community.
Conclusion
Bear Dance, Montana is a small rural town located in the western part of the state. The town is situated on the banks of the Clark Fork River, and is surrounded by rolling hills and lush forests. The economy of the town is largely based on agriculture and tourism, and the population is predominantly white. The town has a long history, and is known for its small-town charm and friendly atmosphere.
Common Questions
What is Per Capita Income in Bear Dance?
Per Capita income in Bear Dance is $35,061.
What is the Median Family Income in Bear Dance?
Median Family Income in Bear Dance is $61,250.
What is the Median Household income in Bear Dance?
Median Household Income in Bear Dance is $52,250.
What is Inequality or Gini Index in Bear Dance?
Inequality or Gini Index in Bear Dance is 0.42.
What is the Total Population of Bear Dance?
Total Population of Bear Dance is 241.
What is the Total Male Population of Bear Dance?
Total Male Population of Bear Dance is 117.
What is the Total Female Population of Bear Dance?
Total Female Population of Bear Dance is 124.
What is the Ratio of Males per 100 Females in Bear Dance?
There are 94.35 Males per 100 Females in Bear Dance.
What is the Ratio of Females per 100 Males in Bear Dance?
There are 105.98 Females per 100 Males in Bear Dance.
What is the Median Population Age in Bear Dance?
Median Population Age in Bear Dance is 60.2 Years.
What is the Average Family Size in Bear Dance
Average Family Size in Bear Dance is 2.4 People.
What is the Average Household Size in Bear Dance
Average Household Size in Bear Dance is 2.2 People.
How Large is the Labor Force in Bear Dance?
There are 96 People in the Labor Forcein in Bear Dance.
What is the Percentage of People in the Labor Force in Bear Dance?
39.8% of People are in the Labor Force in Bear Dance.
What is the Unemployment Rate in Bear Dance?
Unemployment Rate in Bear Dance is 15.6%.