Batavia, MT Map & Demographics
Batavia Map
Batavia Overview
$20,769
PER CAPITA INCOME
$41,462
AVG FAMILY INCOME
$41,722
AVG HOUSEHOLD INCOME
13.3%
WAGE / INCOME GAP [ % ]
86.7¢/ $1
WAGE / INCOME GAP [ $ ]
0.34
INEQUALITY / GINI INDEX
687
TOTAL POPULATION
325
MALE POPULATION
362
FEMALE POPULATION
89.78
MALES / 100 FEMALES
111.38
FEMALES / 100 MALES
38.9
MEDIAN AGE
3.0
AVG FAMILY SIZE
2.8
AVG HOUSEHOLD SIZE
393
LABOR FORCE [ PEOPLE ]
68.6%
PERCENT IN LABOR FORCE
9.7%
UNEMPLOYMENT RATE
Income in Batavia
Income Overview in Batavia
Per Capita Income in Batavia is $20,769, while median incomes of families and households are $41,462 and $41,722 respectively.
| Characteristic | Number | Measure |
| Per Capita Income | 687 | $20,769 |
| Median Family Income | 156 | $41,462 |
| Mean Family Income | 156 | $56,635 |
| Median Household Income | 243 | $41,722 |
| Mean Household Income | 243 | $57,250 |
| Income Deficit | 156 | $0 |
| Wage / Income Gap (%) | 687 | 13.28% |
| Wage / Income Gap ($) | 687 | 86.72¢ per $1 |
| Gini / Inequality Index | 687 | 0.34 |
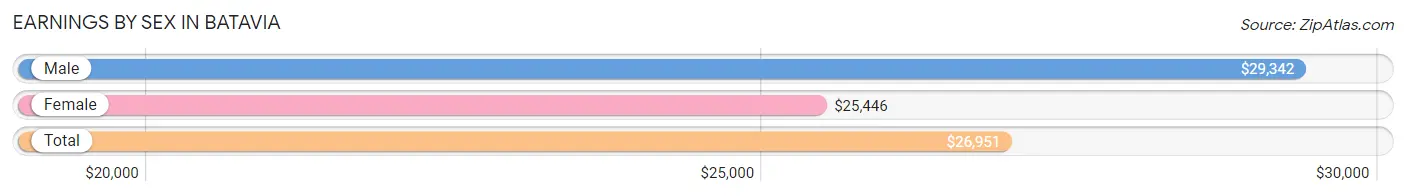
Earnings by Sex in Batavia
Average Earnings in Batavia are $26,951, $29,342 for men and $25,446 for women, a difference of 13.3%.
| Sex | Number | Average Earnings |
| Male | 214 (57.5%) | $29,342 |
| Female | 158 (42.5%) | $25,446 |
| Total | 372 (100.0%) | $26,951 |
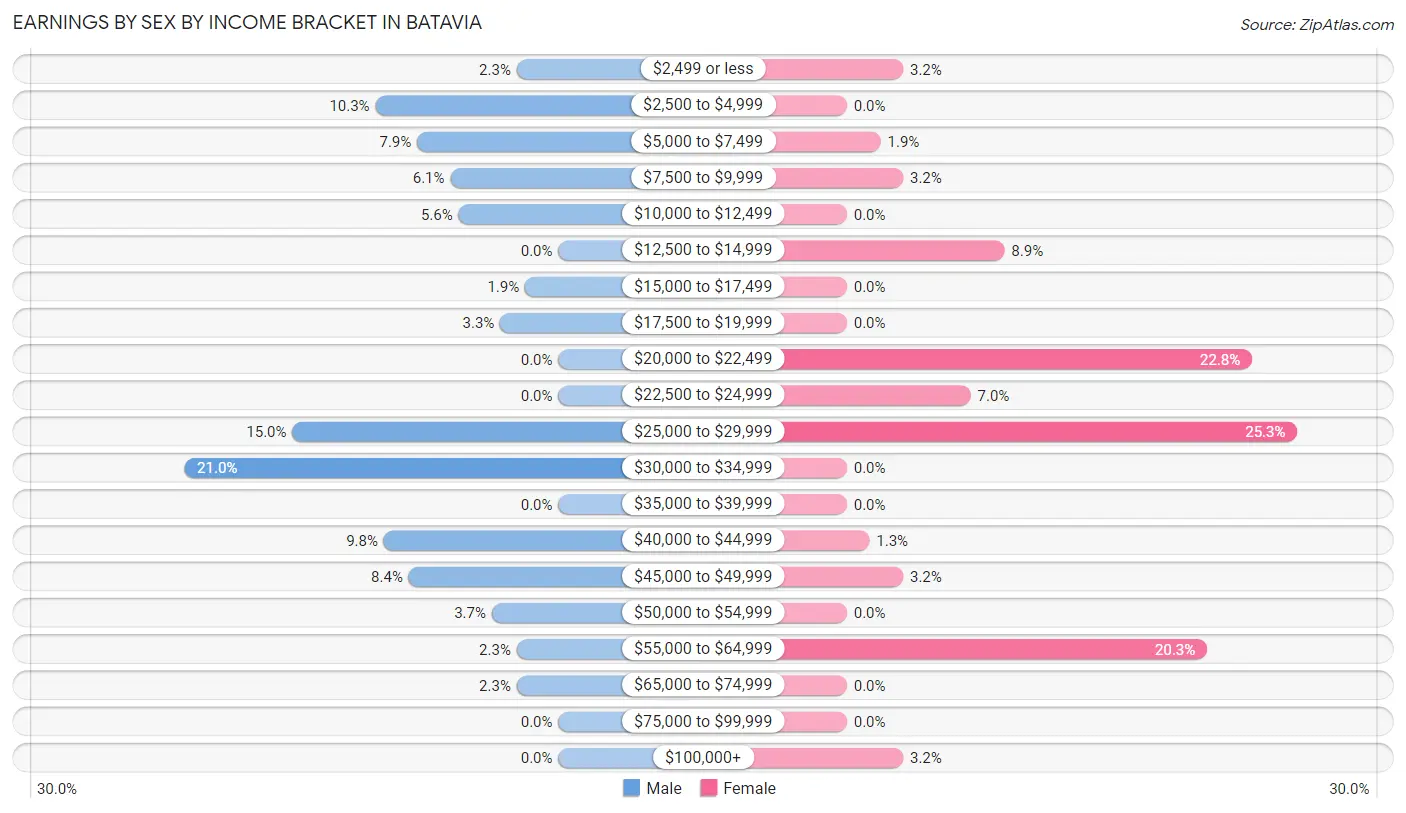
Earnings by Sex by Income Bracket in Batavia
The most common earnings brackets in Batavia are $30,000 to $34,999 for men (45 | 21.0%) and $25,000 to $29,999 for women (40 | 25.3%).
| Income | Male | Female |
| $2,499 or less | 5 (2.3%) | 5 (3.2%) |
| $2,500 to $4,999 | 22 (10.3%) | 0 (0.0%) |
| $5,000 to $7,499 | 17 (7.9%) | 3 (1.9%) |
| $7,500 to $9,999 | 13 (6.1%) | 5 (3.2%) |
| $10,000 to $12,499 | 12 (5.6%) | 0 (0.0%) |
| $12,500 to $14,999 | 0 (0.0%) | 14 (8.9%) |
| $15,000 to $17,499 | 4 (1.9%) | 0 (0.0%) |
| $17,500 to $19,999 | 7 (3.3%) | 0 (0.0%) |
| $20,000 to $22,499 | 0 (0.0%) | 36 (22.8%) |
| $22,500 to $24,999 | 0 (0.0%) | 11 (7.0%) |
| $25,000 to $29,999 | 32 (14.9%) | 40 (25.3%) |
| $30,000 to $34,999 | 45 (21.0%) | 0 (0.0%) |
| $35,000 to $39,999 | 0 (0.0%) | 0 (0.0%) |
| $40,000 to $44,999 | 21 (9.8%) | 2 (1.3%) |
| $45,000 to $49,999 | 18 (8.4%) | 5 (3.2%) |
| $50,000 to $54,999 | 8 (3.7%) | 0 (0.0%) |
| $55,000 to $64,999 | 5 (2.3%) | 32 (20.3%) |
| $65,000 to $74,999 | 5 (2.3%) | 0 (0.0%) |
| $75,000 to $99,999 | 0 (0.0%) | 0 (0.0%) |
| $100,000+ | 0 (0.0%) | 5 (3.2%) |
| Total | 214 (100.0%) | 158 (100.0%) |
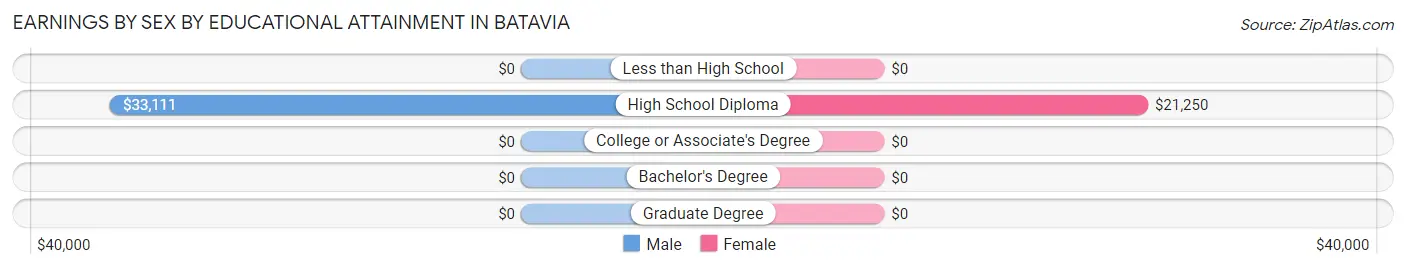
Earnings by Sex by Educational Attainment in Batavia
Average earnings in Batavia are $33,111 for men and $25,670 for women, a difference of 22.5%. Men with an educational attainment of high school diploma enjoy the highest average annual earnings of $33,111, while those with high school diploma education earn the least with $33,111. Women with an educational attainment of high school diploma earn the most with the average annual earnings of $21,250, while those with high school diploma education have the smallest earnings of $21,250.
| Educational Attainment | Male Income | Female Income |
| Less than High School | - | - |
| High School Diploma | $33,111 | $21,250 |
| College or Associate's Degree | - | - |
| Bachelor's Degree | - | - |
| Graduate Degree | - | - |
| Total | $33,111 | $25,670 |
Family Income in Batavia
Family Income Brackets in Batavia
According to the Batavia family income data, there are 65 families falling into the $35,000 to $49,999 income range, which is the most common income bracket and makes up 41.7% of all families.
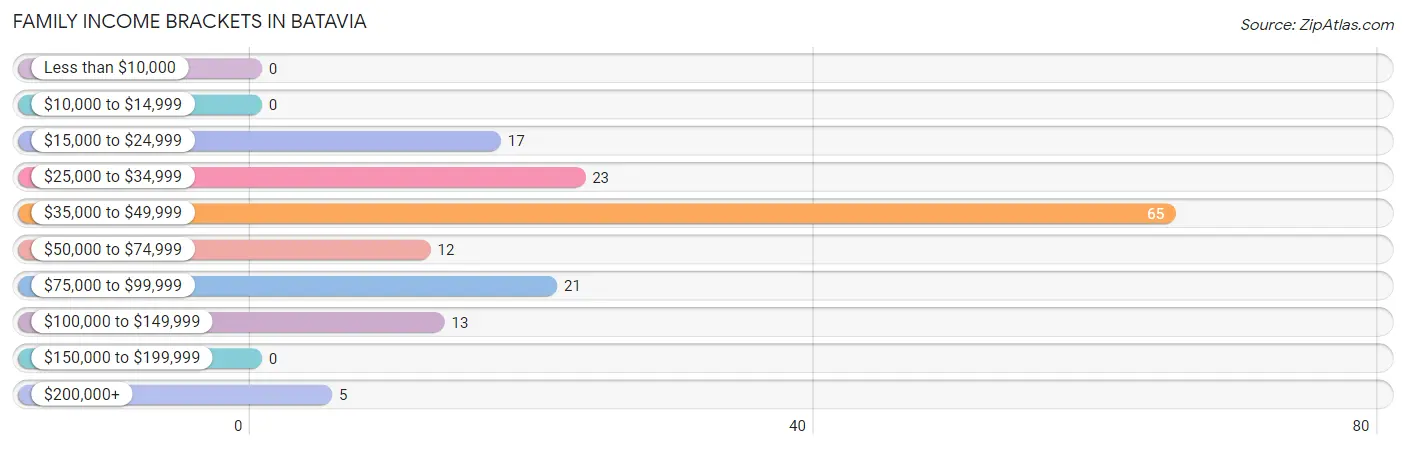
| Income Bracket | # Families | % Families |
| Less than $10,000 | 0 | 0.0% |
| $10,000 to $14,999 | 0 | 0.0% |
| $15,000 to $24,999 | 17 | 10.9% |
| $25,000 to $34,999 | 23 | 14.7% |
| $35,000 to $49,999 | 65 | 41.7% |
| $50,000 to $74,999 | 12 | 7.7% |
| $75,000 to $99,999 | 21 | 13.5% |
| $100,000 to $149,999 | 13 | 8.3% |
| $150,000 to $199,999 | 0 | 0.0% |
| $200,000+ | 5 | 3.2% |
Family Income by Famaliy Size in Batavia
2-person families (88 | 56.4%) account for the highest median family income in Batavia with $41,509 per family, while 2-person families (88 | 56.4%) have the highest median income of $20,754 per family member.
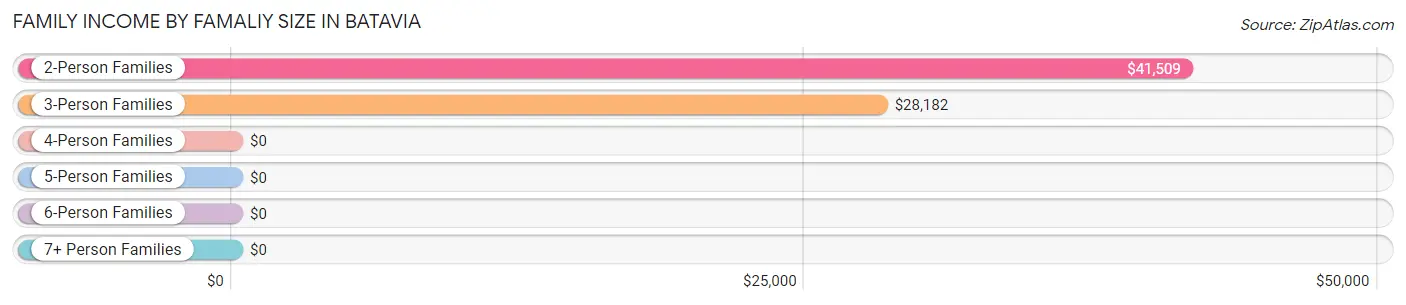
| Income Bracket | # Families | Median Income |
| 2-Person Families | 88 (56.4%) | $41,509 |
| 3-Person Families | 40 (25.6%) | $28,182 |
| 4-Person Families | 8 (5.1%) | $0 |
| 5-Person Families | 13 (8.3%) | $0 |
| 6-Person Families | 7 (4.5%) | $0 |
| 7+ Person Families | 0 (0.0%) | $0 |
| Total | 156 (100.0%) | $41,462 |
Family Income by Number of Earners in Batavia
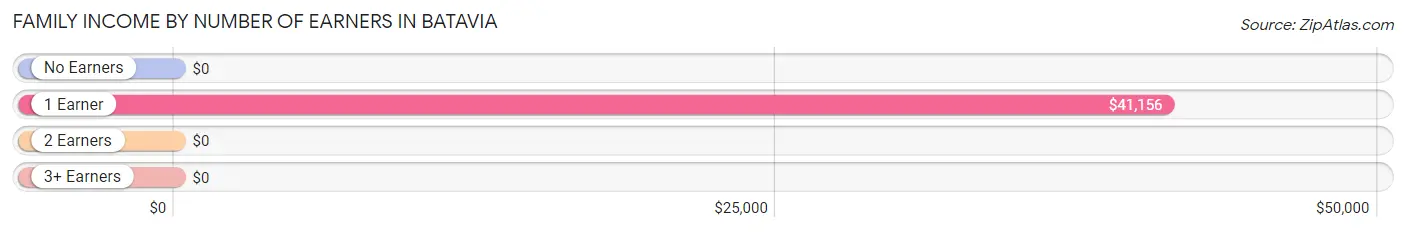
| Number of Earners | # Families | Median Income |
| No Earners | 0 (0.0%) | $0 |
| 1 Earner | 77 (49.4%) | $41,156 |
| 2 Earners | 74 (47.4%) | $0 |
| 3+ Earners | 5 (3.2%) | $0 |
| Total | 156 (100.0%) | $41,462 |
Household Income in Batavia
Household Income Brackets in Batavia
With 57 households falling in the category, the $35,000 to $49,999 income range is the most frequent in Batavia, accounting for 23.5% of all households.
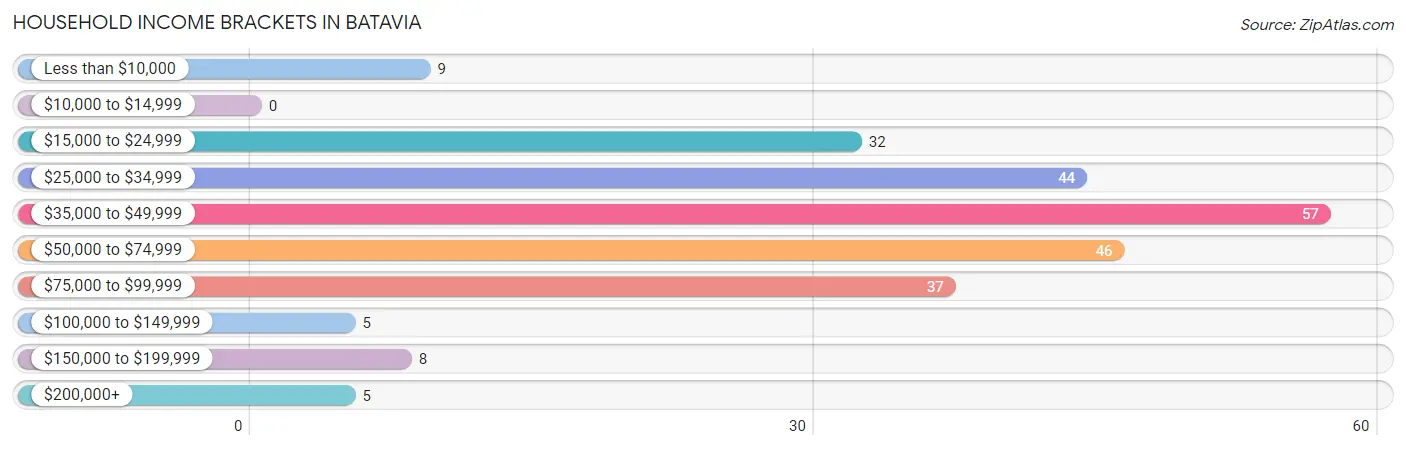
| Income Bracket | # Households | % Households |
| Less than $10,000 | 9 | 3.7% |
| $10,000 to $14,999 | 0 | 0.0% |
| $15,000 to $24,999 | 32 | 13.2% |
| $25,000 to $34,999 | 44 | 18.1% |
| $35,000 to $49,999 | 57 | 23.5% |
| $50,000 to $74,999 | 46 | 18.9% |
| $75,000 to $99,999 | 37 | 15.2% |
| $100,000 to $149,999 | 5 | 2.1% |
| $150,000 to $199,999 | 8 | 3.3% |
| $200,000+ | 5 | 2.1% |
Household Income by Householder Age in Batavia
The median household income in Batavia is $41,722, with the highest median household income of $64,375 found in the 25 to 44 years age bracket for the primary householder. A total of 103 households (42.4%) fall into this category.
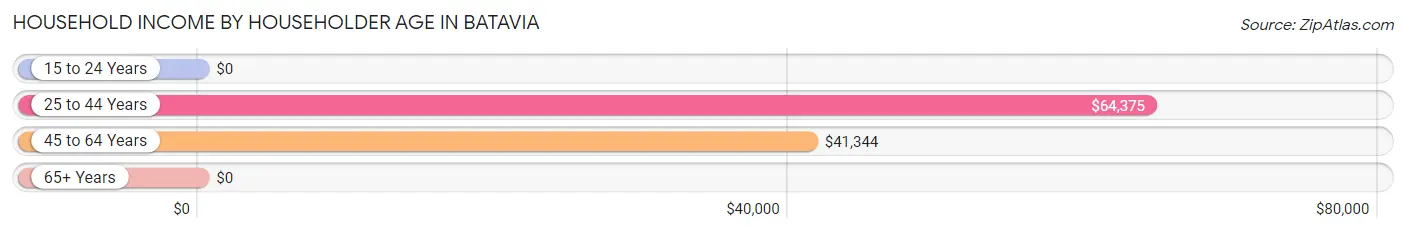
| Income Bracket | # Households | Median Income |
| 15 to 24 Years | 0 (0.0%) | $0 |
| 25 to 44 Years | 103 (42.4%) | $64,375 |
| 45 to 64 Years | 91 (37.4%) | $41,344 |
| 65+ Years | 49 (20.2%) | $0 |
| Total | 243 (100.0%) | $41,722 |
Poverty in Batavia
Income Below Poverty by Sex and Age in Batavia
With 20.3% poverty level for males and 25.7% for females among the residents of Batavia, 55 to 64 year old males and 12 to 14 year old females are the most vulnerable to poverty, with 17 males (46.0%) and 13 females (59.1%) in their respective age groups living below the poverty level.
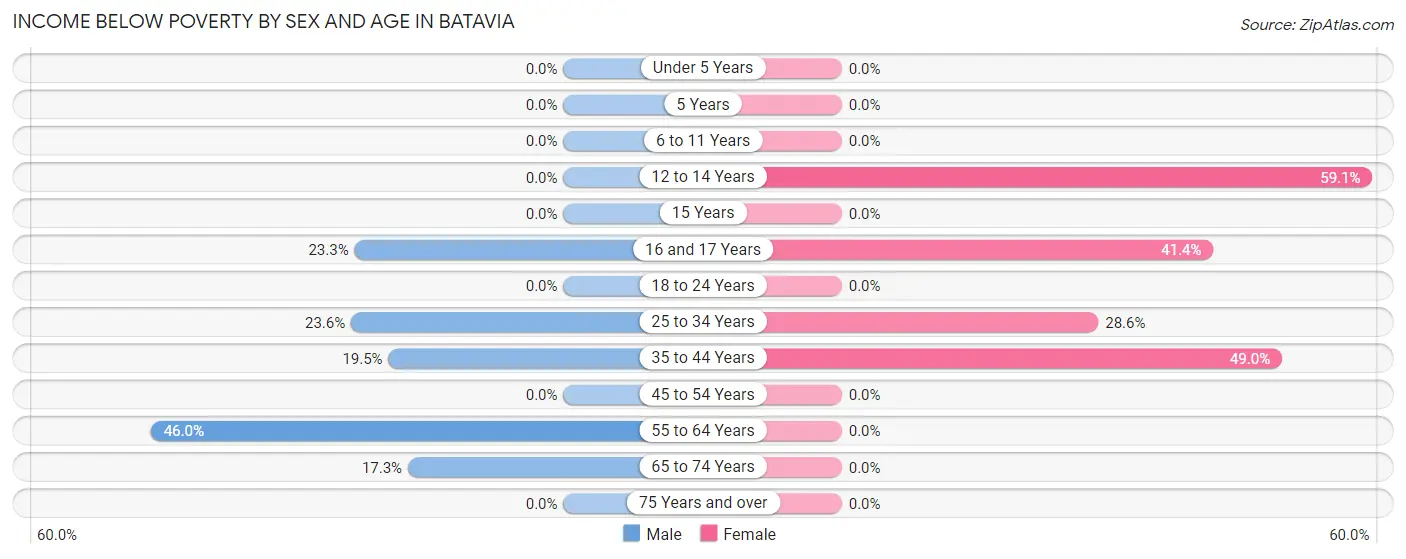
| Age Bracket | Male | Female |
| Under 5 Years | 0 (0.0%) | 0 (0.0%) |
| 5 Years | 0 (0.0%) | 0 (0.0%) |
| 6 to 11 Years | 0 (0.0%) | 0 (0.0%) |
| 12 to 14 Years | 0 (0.0%) | 13 (59.1%) |
| 15 Years | 0 (0.0%) | 0 (0.0%) |
| 16 and 17 Years | 10 (23.3%) | 12 (41.4%) |
| 18 to 24 Years | 0 (0.0%) | 0 (0.0%) |
| 25 to 34 Years | 13 (23.6%) | 12 (28.6%) |
| 35 to 44 Years | 15 (19.5%) | 50 (49.0%) |
| 45 to 54 Years | 0 (0.0%) | 0 (0.0%) |
| 55 to 64 Years | 17 (46.0%) | 0 (0.0%) |
| 65 to 74 Years | 9 (17.3%) | 0 (0.0%) |
| 75 Years and over | 0 (0.0%) | 0 (0.0%) |
| Total | 64 (20.3%) | 87 (25.7%) |
Income Above Poverty by Sex and Age in Batavia
According to the poverty statistics in Batavia, males aged under 5 years and females aged under 5 years are the age groups that are most secure financially, with 100.0% of males and 100.0% of females in these age groups living above the poverty line.
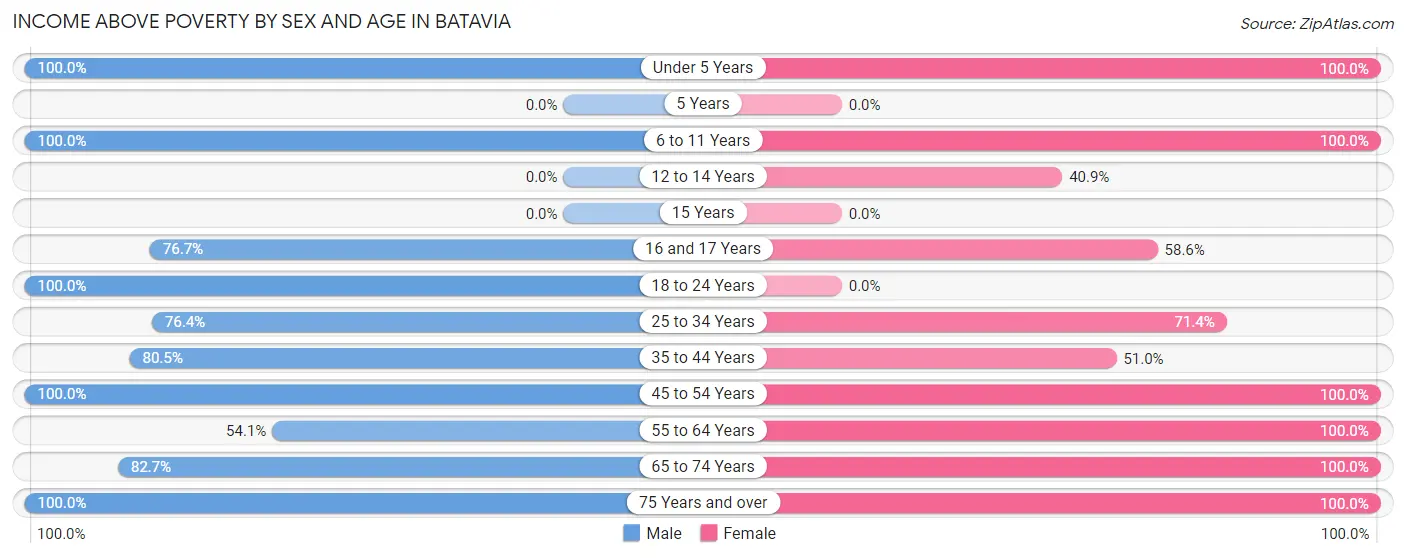
| Age Bracket | Male | Female |
| Under 5 Years | 7 (100.0%) | 26 (100.0%) |
| 5 Years | 0 (0.0%) | 0 (0.0%) |
| 6 to 11 Years | 8 (100.0%) | 18 (100.0%) |
| 12 to 14 Years | 0 (0.0%) | 9 (40.9%) |
| 15 Years | 0 (0.0%) | 0 (0.0%) |
| 16 and 17 Years | 33 (76.7%) | 17 (58.6%) |
| 18 to 24 Years | 13 (100.0%) | 0 (0.0%) |
| 25 to 34 Years | 42 (76.4%) | 30 (71.4%) |
| 35 to 44 Years | 62 (80.5%) | 52 (51.0%) |
| 45 to 54 Years | 5 (100.0%) | 5 (100.0%) |
| 55 to 64 Years | 20 (54.0%) | 70 (100.0%) |
| 65 to 74 Years | 43 (82.7%) | 20 (100.0%) |
| 75 Years and over | 18 (100.0%) | 5 (100.0%) |
| Total | 251 (79.7%) | 252 (74.3%) |
Income Below Poverty Among Married-Couple Families in Batavia
The poverty statistics for married-couple families in Batavia show that 13.6% or 17 of the total 125 families live below the poverty line. Families with 1 or 2 children have the highest poverty rate of 77.3%, comprising of 17 families. On the other hand, families with no children have the lowest poverty rate of 0.0%, which includes 0 families.
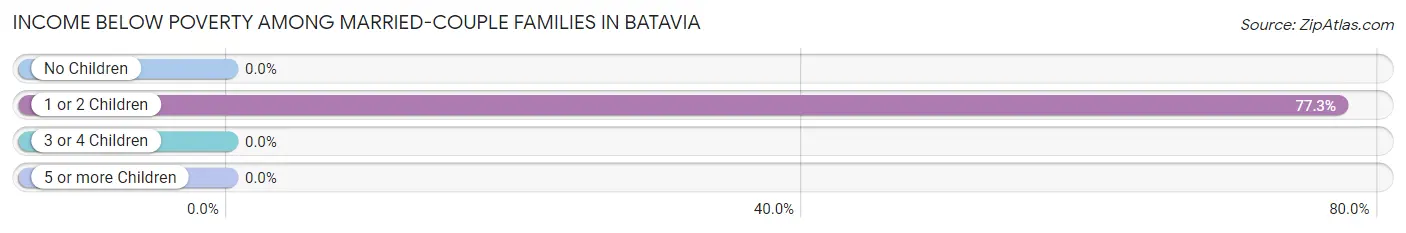
| Children | Above Poverty | Below Poverty |
| No Children | 88 (100.0%) | 0 (0.0%) |
| 1 or 2 Children | 5 (22.7%) | 17 (77.3%) |
| 3 or 4 Children | 15 (100.0%) | 0 (0.0%) |
| 5 or more Children | 0 (0.0%) | 0 (0.0%) |
| Total | 108 (86.4%) | 17 (13.6%) |
Income Below Poverty Among Single-Parent Households in Batavia
| Children | Single Father | Single Mother |
| No Children | 0 (0.0%) | 0 (0.0%) |
| 1 or 2 Children | 0 (0.0%) | 0 (0.0%) |
| 3 or 4 Children | 0 (0.0%) | 0 (0.0%) |
| 5 or more Children | 0 (0.0%) | 0 (0.0%) |
| Total | 0 (0.0%) | 0 (0.0%) |
Income Below Poverty Among Married-Couple vs Single-Parent Households in Batavia
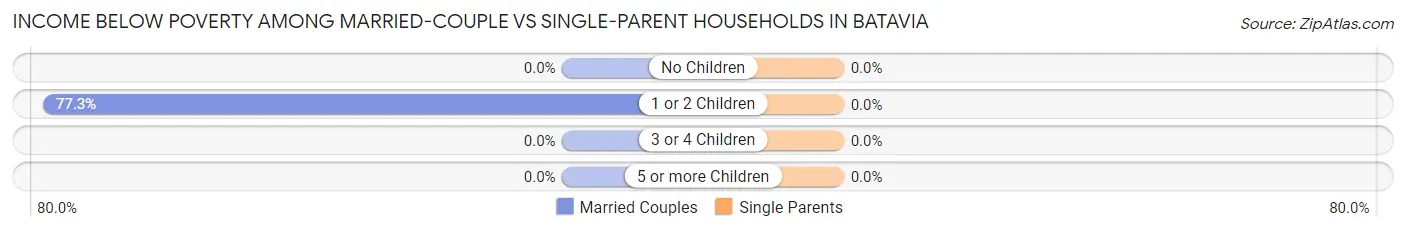
| Children | Married-Couple Families | Single-Parent Households |
| No Children | 0 (0.0%) | 0 (0.0%) |
| 1 or 2 Children | 17 (77.3%) | 0 (0.0%) |
| 3 or 4 Children | 0 (0.0%) | 0 (0.0%) |
| 5 or more Children | 0 (0.0%) | 0 (0.0%) |
| Total | 17 (13.6%) | 0 (0.0%) |
Race in Batavia
The most populous races in Batavia are White / Caucasian (620 | 90.2%), Native / Alaskan (49 | 7.1%), and Hispanic or Latino (25 | 3.6%).
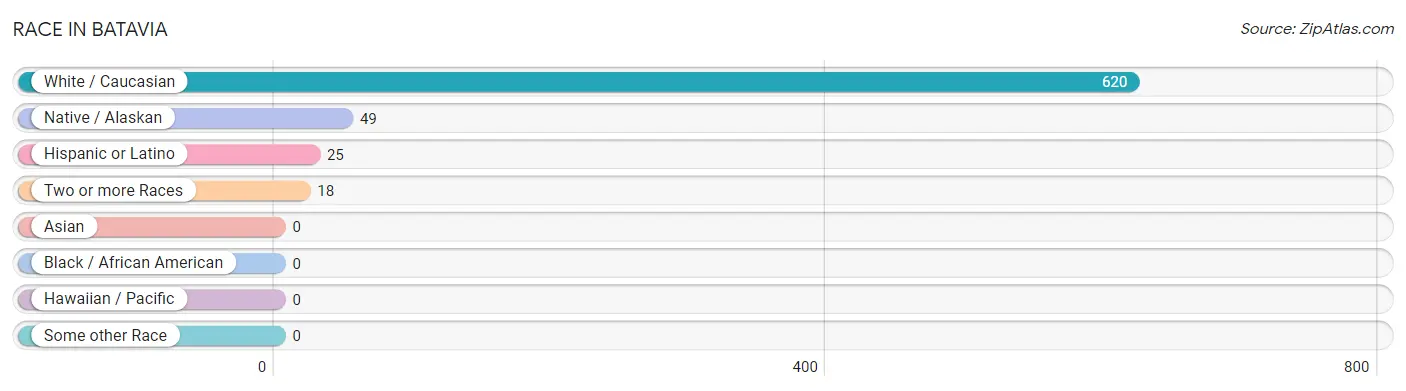
| Race | # Population | % Population |
| Asian | 0 | 0.0% |
| Black / African American | 0 | 0.0% |
| Hawaiian / Pacific | 0 | 0.0% |
| Hispanic or Latino | 25 | 3.6% |
| Native / Alaskan | 49 | 7.1% |
| White / Caucasian | 620 | 90.2% |
| Two or more Races | 18 | 2.6% |
| Some other Race | 0 | 0.0% |
| Total | 687 | 100.0% |
Ancestry in Batavia
The most populous ancestries reported in Batavia are German (212 | 30.9%), Irish (123 | 17.9%), Norwegian (71 | 10.3%), English (67 | 9.8%), and Blackfeet (49 | 7.1%), together accounting for 76.0% of all Batavia residents.
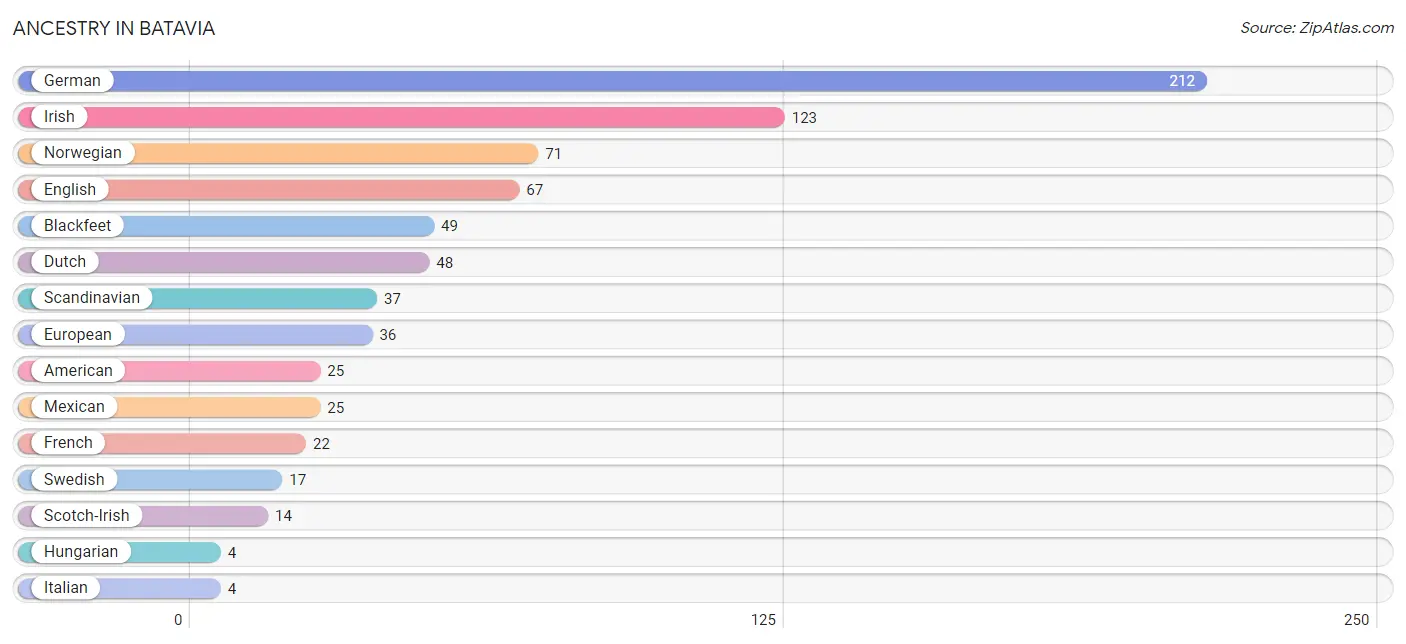
| Ancestry | # Population | % Population |
| American | 25 | 3.6% |
| Blackfeet | 49 | 7.1% |
| Dutch | 48 | 7.0% |
| English | 67 | 9.8% |
| European | 36 | 5.2% |
| French | 22 | 3.2% |
| German | 212 | 30.9% |
| Hungarian | 4 | 0.6% |
| Irish | 123 | 17.9% |
| Italian | 4 | 0.6% |
| Mexican | 25 | 3.6% |
| Norwegian | 71 | 10.3% |
| Scandinavian | 37 | 5.4% |
| Scotch-Irish | 14 | 2.0% |
| Swedish | 17 | 2.5% |
| Yugoslavian | 3 | 0.4% | View All 16 Rows |
Immigrants in Batavia

| Immigration Origin | # Population | % Population | View All 0 Rows |
Sex and Age in Batavia
Sex and Age in Batavia
The most populous age groups in Batavia are 40 to 44 Years (60 | 18.5%) for men and 60 to 64 Years (64 | 17.7%) for women.
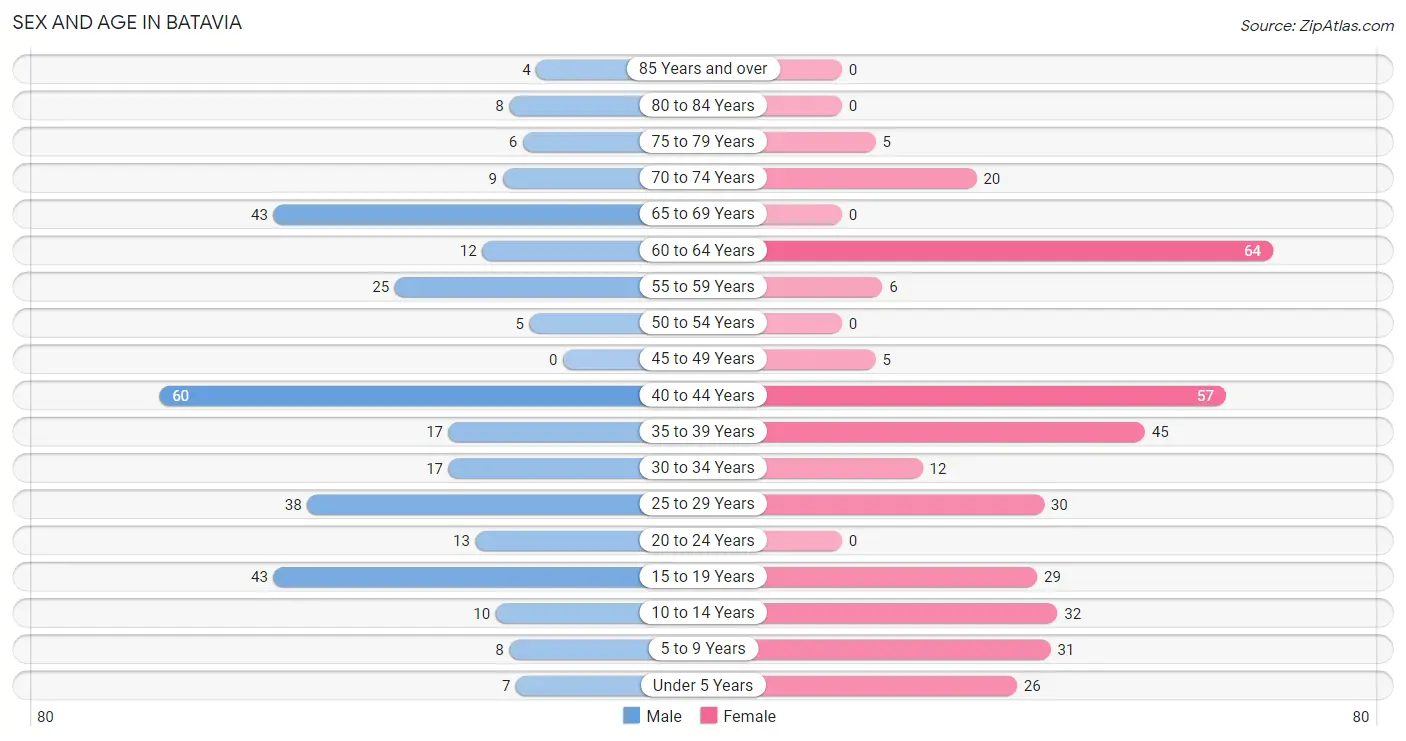
| Age Bracket | Male | Female |
| Under 5 Years | 7 (2.1%) | 26 (7.2%) |
| 5 to 9 Years | 8 (2.5%) | 31 (8.6%) |
| 10 to 14 Years | 10 (3.1%) | 32 (8.8%) |
| 15 to 19 Years | 43 (13.2%) | 29 (8.0%) |
| 20 to 24 Years | 13 (4.0%) | 0 (0.0%) |
| 25 to 29 Years | 38 (11.7%) | 30 (8.3%) |
| 30 to 34 Years | 17 (5.2%) | 12 (3.3%) |
| 35 to 39 Years | 17 (5.2%) | 45 (12.4%) |
| 40 to 44 Years | 60 (18.5%) | 57 (15.8%) |
| 45 to 49 Years | 0 (0.0%) | 5 (1.4%) |
| 50 to 54 Years | 5 (1.5%) | 0 (0.0%) |
| 55 to 59 Years | 25 (7.7%) | 6 (1.7%) |
| 60 to 64 Years | 12 (3.7%) | 64 (17.7%) |
| 65 to 69 Years | 43 (13.2%) | 0 (0.0%) |
| 70 to 74 Years | 9 (2.8%) | 20 (5.5%) |
| 75 to 79 Years | 6 (1.8%) | 5 (1.4%) |
| 80 to 84 Years | 8 (2.5%) | 0 (0.0%) |
| 85 Years and over | 4 (1.2%) | 0 (0.0%) |
| Total | 325 (100.0%) | 362 (100.0%) |
Families and Households in Batavia
Median Family Size in Batavia
The median family size in Batavia is 2.96 persons per family, with single female/mother families (11 | 7.0%) accounting for the largest median family size of 3.27 persons per family. On the other hand, married-couple families (125 | 80.1%) represent the smallest median family size with 2.91 persons per family.
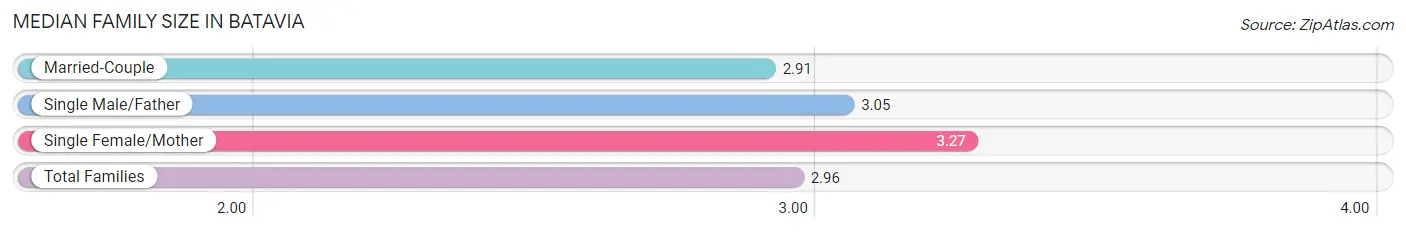
| Family Type | # Families | Family Size |
| Married-Couple | 125 (80.1%) | 2.91 |
| Single Male/Father | 20 (12.8%) | 3.05 |
| Single Female/Mother | 11 (7.0%) | 3.27 |
| Total Families | 156 (100.0%) | 2.96 |
Median Household Size in Batavia
The median household size in Batavia is 2.83 persons per household, with single male/father households (20 | 8.2%) accounting for the largest median household size of 5.2 persons per household. non-family households (87 | 35.8%) represent the smallest median household size with 1.33 persons per household.
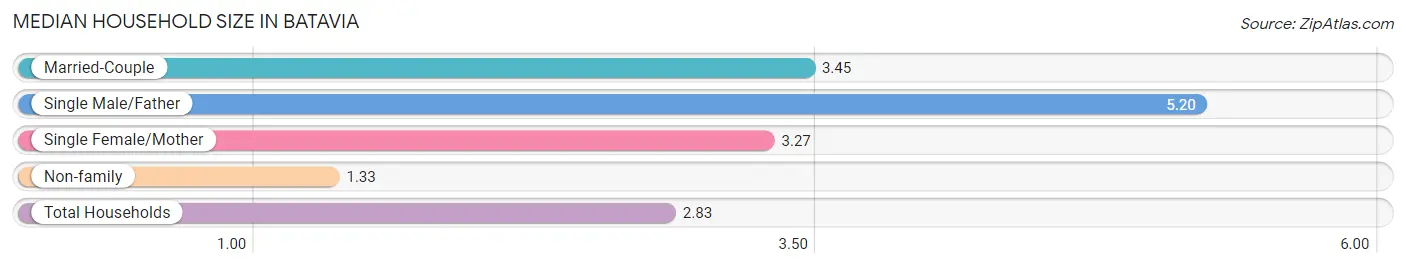
| Household Type | # Households | Household Size |
| Married-Couple | 125 (51.4%) | 3.45 |
| Single Male/Father | 20 (8.2%) | 5.20 |
| Single Female/Mother | 11 (4.5%) | 3.27 |
| Non-family | 87 (35.8%) | 1.33 |
| Total Households | 243 (100.0%) | 2.83 |
Household Size by Marriage Status in Batavia
Out of a total of 243 households in Batavia, 156 (64.2%) are family households, while 87 (35.8%) are nonfamily households. The most numerous type of family households are 2-person households, comprising 80, and the most common type of nonfamily households are 1-person households, comprising 57.
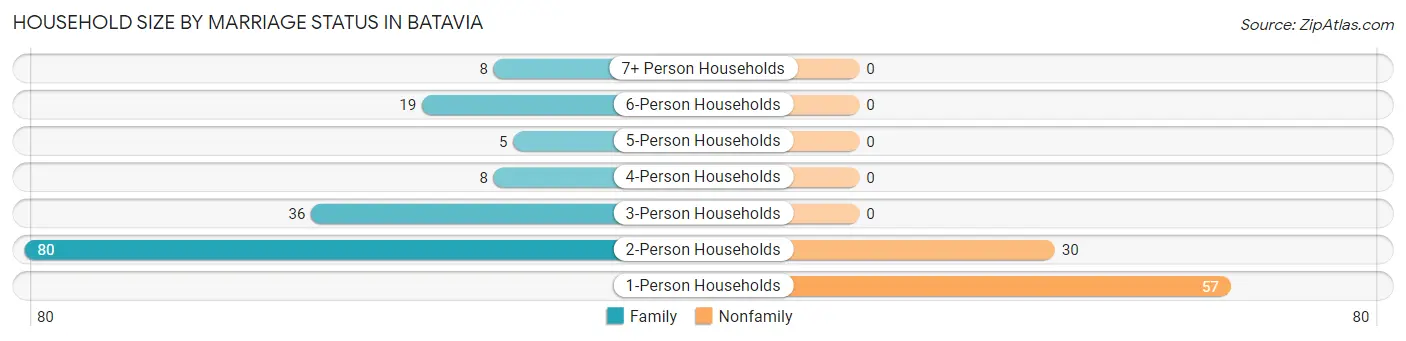
| Household Size | Family Households | Nonfamily Households |
| 1-Person Households | - | 57 (23.5%) |
| 2-Person Households | 80 (32.9%) | 30 (12.3%) |
| 3-Person Households | 36 (14.8%) | 0 (0.0%) |
| 4-Person Households | 8 (3.3%) | 0 (0.0%) |
| 5-Person Households | 5 (2.1%) | 0 (0.0%) |
| 6-Person Households | 19 (7.8%) | 0 (0.0%) |
| 7+ Person Households | 8 (3.3%) | 0 (0.0%) |
| Total | 156 (64.2%) | 87 (35.8%) |
Female Fertility in Batavia
Fertility by Age in Batavia
Average fertility rate in Batavia is 45.0 births per 1,000 women. Women in the age bracket of 20 to 34 years have the highest fertility rate with 190.0 births per 1,000 women. Women in the age bracket of 20 to 34 years acount for 100.0% of all women with births.
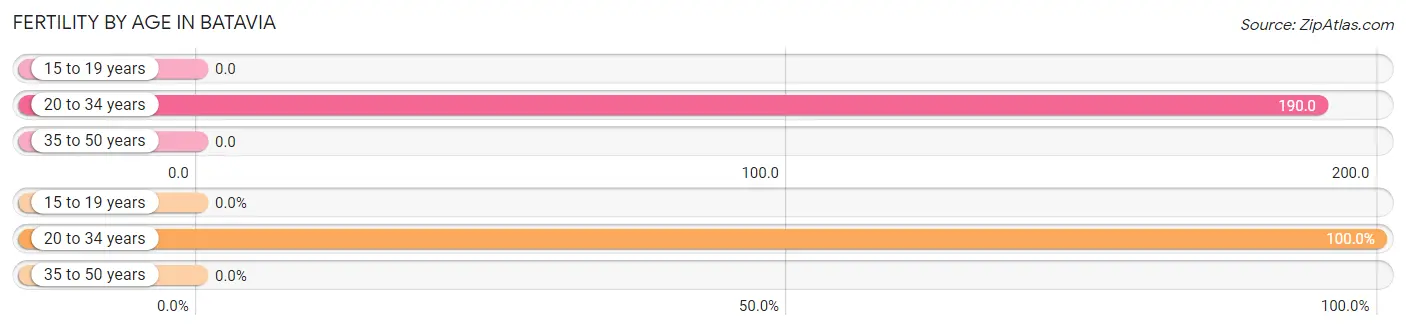
| Age Bracket | Women with Births | Births / 1,000 Women |
| 15 to 19 years | 0 (0.0%) | 0.0 |
| 20 to 34 years | 8 (100.0%) | 190.0 |
| 35 to 50 years | 0 (0.0%) | 0.0 |
| Total | 8 (100.0%) | 45.0 |
Fertility by Age by Marriage Status in Batavia
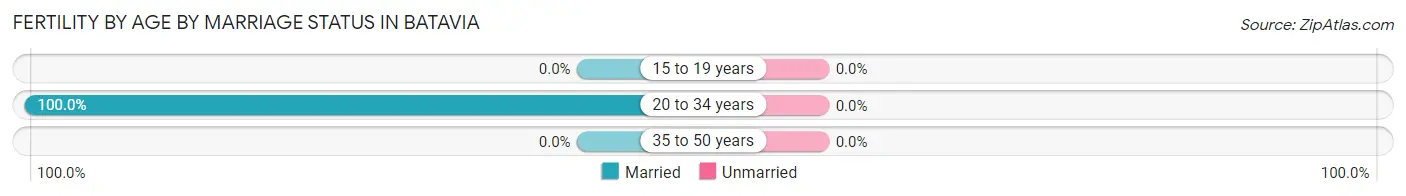
| Age Bracket | Married | Unmarried |
| 15 to 19 years | 0 (0.0%) | 0 (0.0%) |
| 20 to 34 years | 8 (100.0%) | 0 (0.0%) |
| 35 to 50 years | 0 (0.0%) | 0 (0.0%) |
| Total | 8 (100.0%) | 0 (0.0%) |
Fertility by Education in Batavia
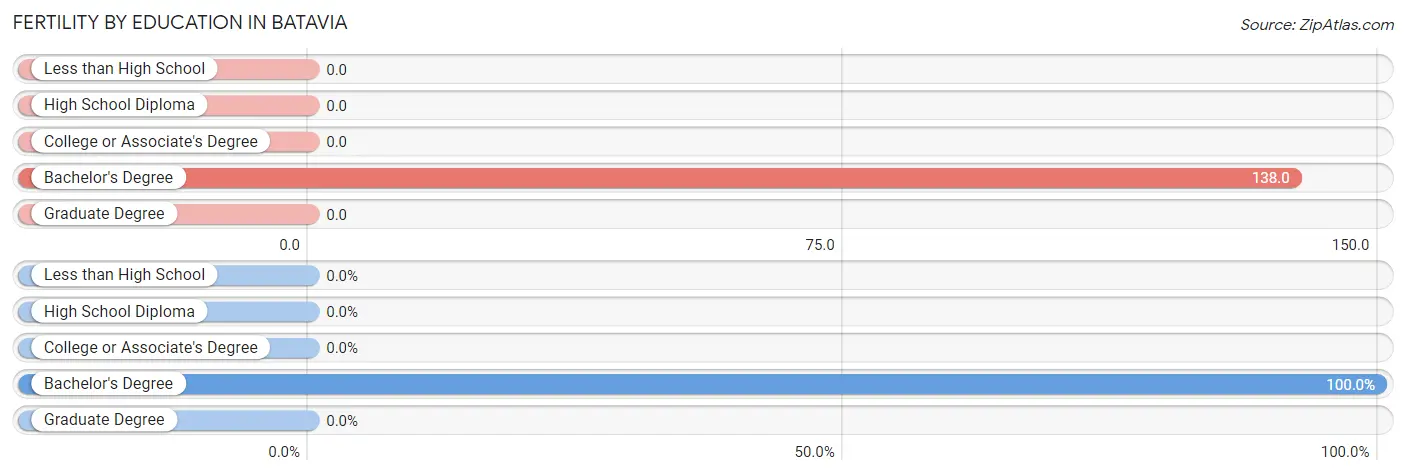
| Educational Attainment | Women with Births | Births / 1,000 Women |
| Less than High School | 0 (0.0%) | 0.0 |
| High School Diploma | 0 (0.0%) | 0.0 |
| College or Associate's Degree | 0 (0.0%) | 0.0 |
| Bachelor's Degree | 8 (100.0%) | 138.0 |
| Graduate Degree | 0 (0.0%) | 0.0 |
| Total | 8 (100.0%) | 45.0 |
Fertility by Education by Marriage Status in Batavia
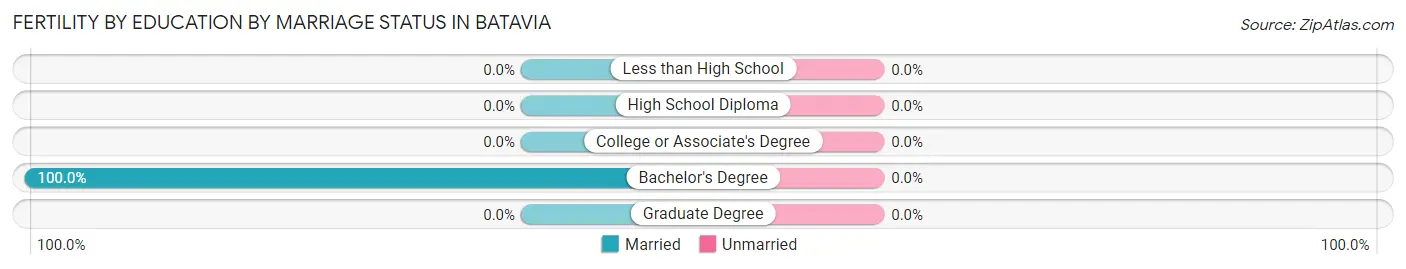
| Educational Attainment | Married | Unmarried |
| Less than High School | 0 (0.0%) | 0 (0.0%) |
| High School Diploma | 0 (0.0%) | 0 (0.0%) |
| College or Associate's Degree | 0 (0.0%) | 0 (0.0%) |
| Bachelor's Degree | 8 (100.0%) | 0 (0.0%) |
| Graduate Degree | 0 (0.0%) | 0 (0.0%) |
| Total | 8 (100.0%) | 0 (0.0%) |
Employment Characteristics in Batavia
Employment by Class of Employer in Batavia
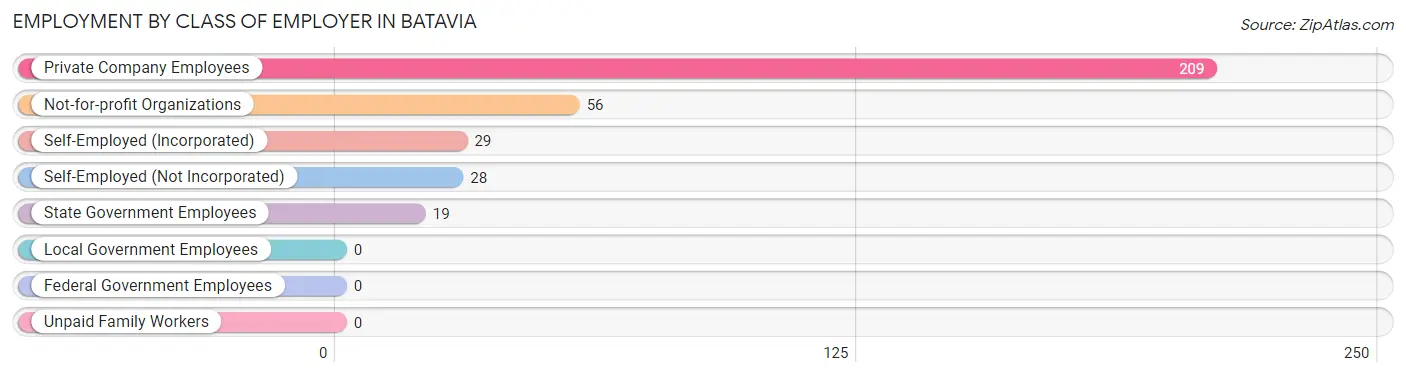
Among the 341 employed individuals in Batavia, private company employees (209 | 61.3%), not-for-profit organizations (56 | 16.4%), and self-employed (incorporated) (29 | 8.5%) make up the most common classes of employment.
| Employer Class | # Employees | % Employees |
| Private Company Employees | 209 | 61.3% |
| Self-Employed (Incorporated) | 29 | 8.5% |
| Self-Employed (Not Incorporated) | 28 | 8.2% |
| Not-for-profit Organizations | 56 | 16.4% |
| Local Government Employees | 0 | 0.0% |
| State Government Employees | 19 | 5.6% |
| Federal Government Employees | 0 | 0.0% |
| Unpaid Family Workers | 0 | 0.0% |
| Total | 341 | 100.0% |
Employment Status by Age in Batavia
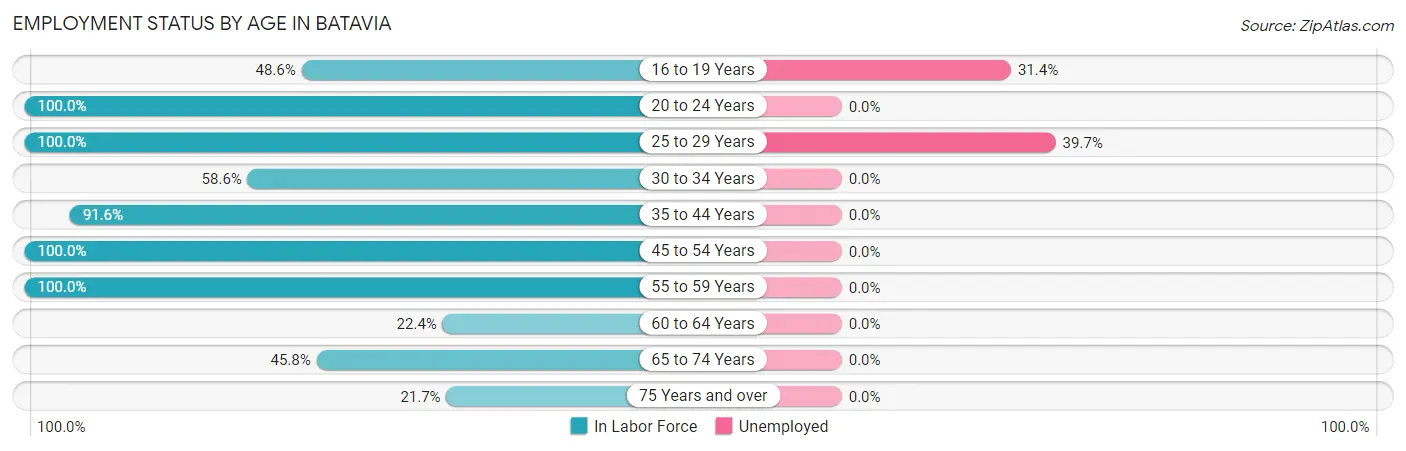
According to the labor force statistics for Batavia, out of the total population over 16 years of age (573), 68.6% or 393 individuals are in the labor force, with 9.7% or 38 of them unemployed. The age group with the highest labor force participation rate is 20 to 24 years, with 100.0% or 13 individuals in the labor force. Within the labor force, the 25 to 29 years age range has the highest percentage of unemployed individuals, with 39.7% or 27 of them being unemployed.
| Age Bracket | In Labor Force | Unemployed |
| 16 to 19 Years | 35 (48.6%) | 11 (31.4%) |
| 20 to 24 Years | 13 (100.0%) | 0 (0.0%) |
| 25 to 29 Years | 68 (100.0%) | 27 (39.7%) |
| 30 to 34 Years | 17 (58.6%) | 0 (0.0%) |
| 35 to 44 Years | 164 (91.6%) | 0 (0.0%) |
| 45 to 54 Years | 10 (100.0%) | 0 (0.0%) |
| 55 to 59 Years | 31 (100.0%) | 0 (0.0%) |
| 60 to 64 Years | 17 (22.4%) | 0 (0.0%) |
| 65 to 74 Years | 33 (45.8%) | 0 (0.0%) |
| 75 Years and over | 5 (21.7%) | 0 (0.0%) |
| Total | 393 (68.6%) | 38 (9.7%) |
Employment Status by Educational Attainment in Batavia
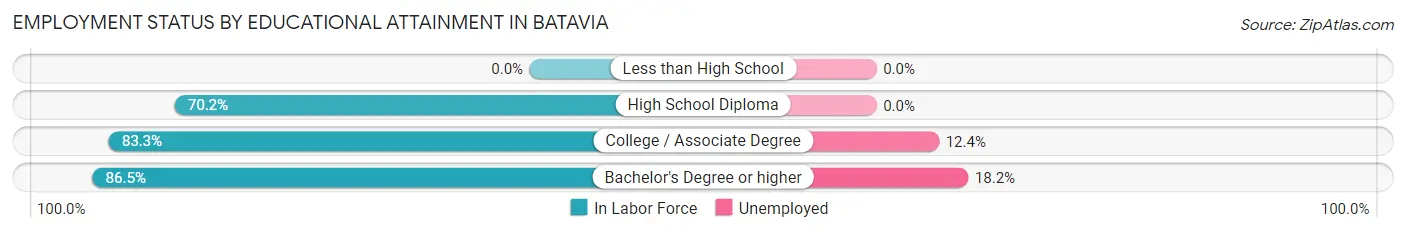
According to labor force statistics for Batavia, 78.1% of individuals (307) out of the total population between 25 and 64 years of age (393) are in the labor force, with 8.8% or 27 of them being unemployed. The group with the highest labor force participation rate are those with the educational attainment of bachelor's degree or higher, with 86.5% or 77 individuals in the labor force. Within the labor force, individuals with bachelor's degree or higher education have the highest percentage of unemployment, with 18.2% or 14 of them being unemployed.
| Educational Attainment | In Labor Force | Unemployed |
| Less than High School | 0 (0.0%) | 0 (0.0%) |
| High School Diploma | 125 (70.2%) | 0 (0.0%) |
| College / Associate Degree | 105 (83.3%) | 16 (12.4%) |
| Bachelor's Degree or higher | 77 (86.5%) | 16 (18.2%) |
| Total | 307 (78.1%) | 35 (8.8%) |
Employment Occupations by Sex in Batavia
Management, Business, Science and Arts Occupations
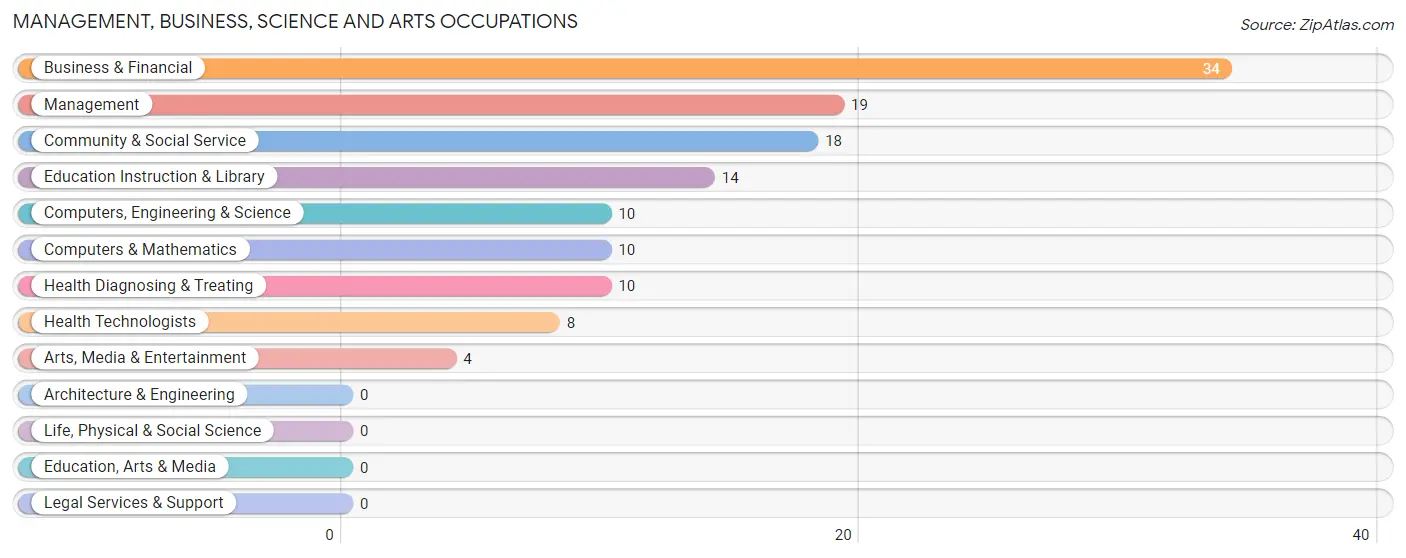
The most common Management, Business, Science and Arts occupations in Batavia are Business & Financial (34 | 9.6%), Management (19 | 5.3%), Community & Social Service (18 | 5.1%), Education Instruction & Library (14 | 3.9%), and Computers, Engineering & Science (10 | 2.8%).
Management, Business, Science and Arts Occupations by Sex
Within the Management, Business, Science and Arts occupations in Batavia, the most male-oriented occupations are Management (100.0%), Arts, Media & Entertainment (100.0%), and Community & Social Service (50.0%), while the most female-oriented occupations are Computers, Engineering & Science (100.0%), Computers & Mathematics (100.0%), and Health Diagnosing & Treating (100.0%).
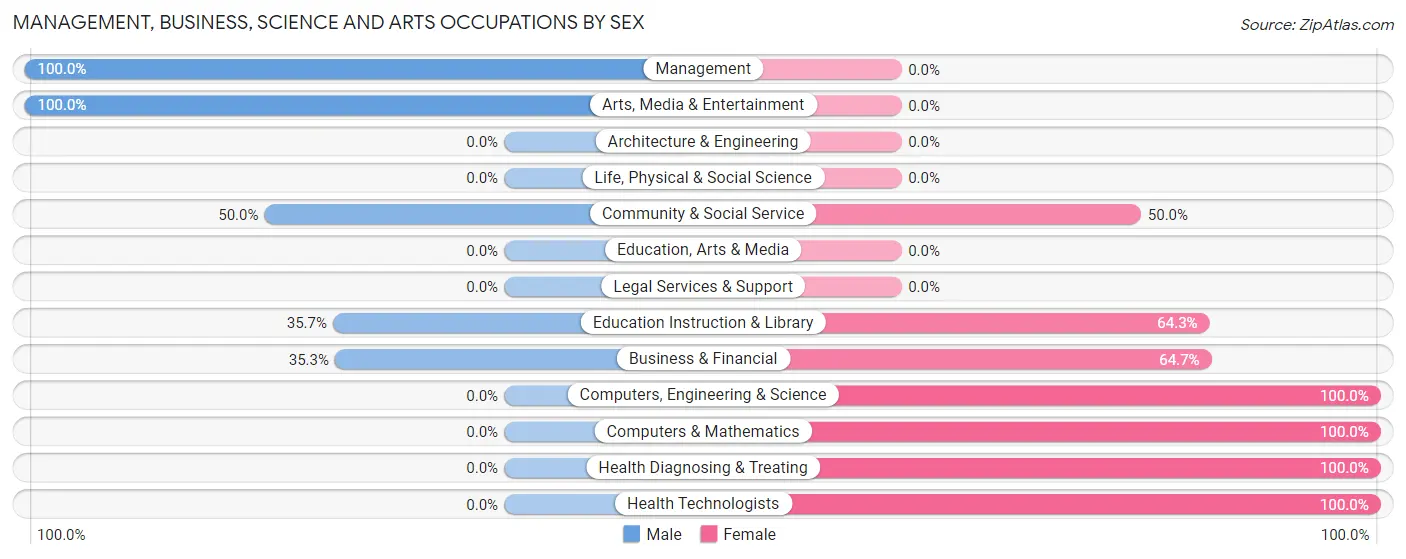
| Occupation | Male | Female |
| Management | 19 (100.0%) | 0 (0.0%) |
| Business & Financial | 12 (35.3%) | 22 (64.7%) |
| Computers, Engineering & Science | 0 (0.0%) | 10 (100.0%) |
| Computers & Mathematics | 0 (0.0%) | 10 (100.0%) |
| Architecture & Engineering | 0 (0.0%) | 0 (0.0%) |
| Life, Physical & Social Science | 0 (0.0%) | 0 (0.0%) |
| Community & Social Service | 9 (50.0%) | 9 (50.0%) |
| Education, Arts & Media | 0 (0.0%) | 0 (0.0%) |
| Legal Services & Support | 0 (0.0%) | 0 (0.0%) |
| Education Instruction & Library | 5 (35.7%) | 9 (64.3%) |
| Arts, Media & Entertainment | 4 (100.0%) | 0 (0.0%) |
| Health Diagnosing & Treating | 0 (0.0%) | 10 (100.0%) |
| Health Technologists | 0 (0.0%) | 8 (100.0%) |
| Total (Category) | 40 (44.0%) | 51 (56.0%) |
| Total (Overall) | 197 (55.5%) | 158 (44.5%) |
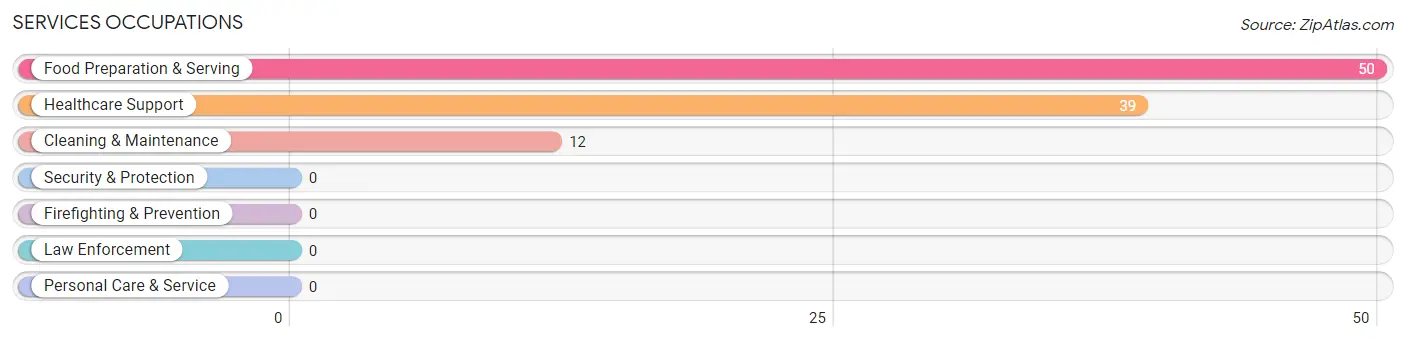
Services Occupations
The most common Services occupations in Batavia are Food Preparation & Serving (50 | 14.1%), Healthcare Support (39 | 11.0%), and Cleaning & Maintenance (12 | 3.4%).
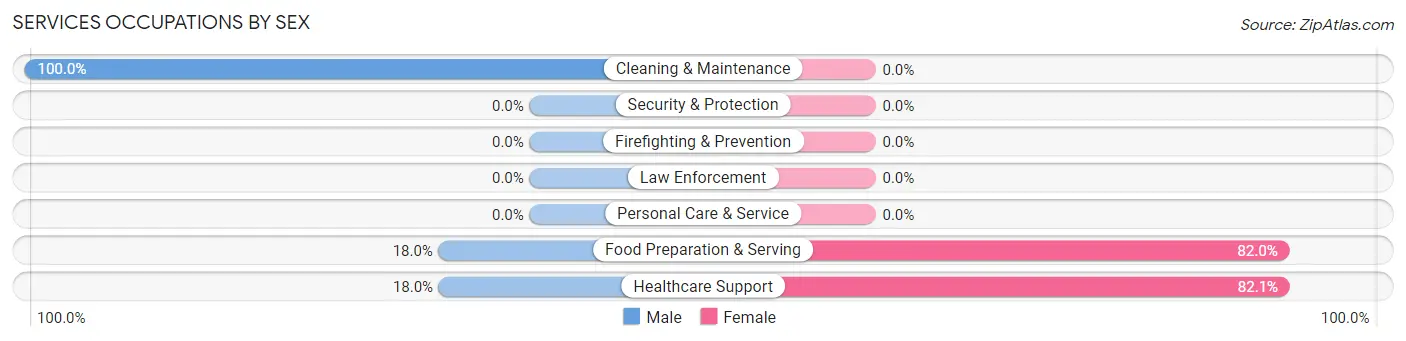
Services Occupations by Sex
Within the Services occupations in Batavia, the most male-oriented occupations are Cleaning & Maintenance (100.0%), Food Preparation & Serving (18.0%), and Healthcare Support (17.9%), while the most female-oriented occupations are Healthcare Support (82.1%), and Food Preparation & Serving (82.0%).
| Occupation | Male | Female |
| Healthcare Support | 7 (17.9%) | 32 (82.1%) |
| Security & Protection | 0 (0.0%) | 0 (0.0%) |
| Firefighting & Prevention | 0 (0.0%) | 0 (0.0%) |
| Law Enforcement | 0 (0.0%) | 0 (0.0%) |
| Food Preparation & Serving | 9 (18.0%) | 41 (82.0%) |
| Cleaning & Maintenance | 12 (100.0%) | 0 (0.0%) |
| Personal Care & Service | 0 (0.0%) | 0 (0.0%) |
| Total (Category) | 28 (27.7%) | 73 (72.3%) |
| Total (Overall) | 197 (55.5%) | 158 (44.5%) |
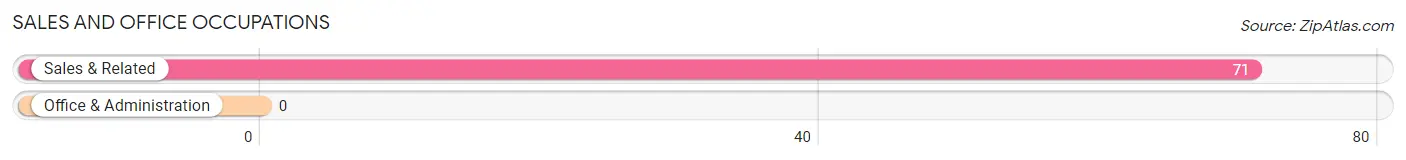
Sales and Office Occupations
The most common Sales and Office occupations in Batavia are , and Sales & Related (71 | 20.0%).
Sales and Office Occupations by Sex
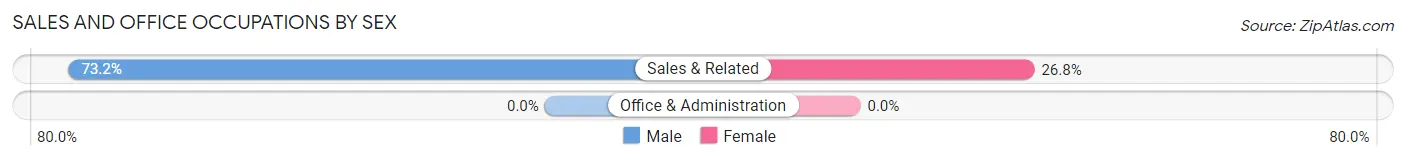
| Occupation | Male | Female |
| Sales & Related | 52 (73.2%) | 19 (26.8%) |
| Office & Administration | 0 (0.0%) | 0 (0.0%) |
| Total (Category) | 52 (73.2%) | 19 (26.8%) |
| Total (Overall) | 197 (55.5%) | 158 (44.5%) |
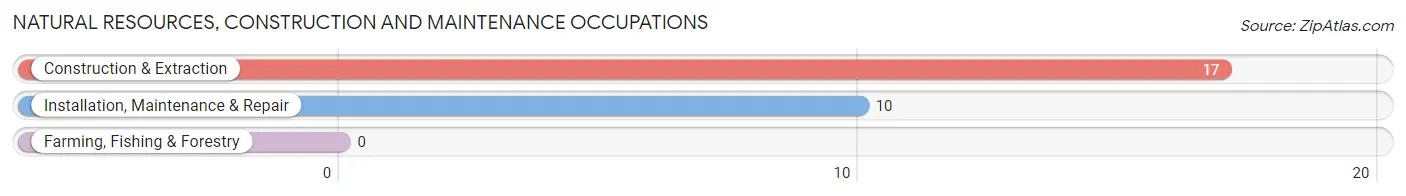
Natural Resources, Construction and Maintenance Occupations
The most common Natural Resources, Construction and Maintenance occupations in Batavia are Construction & Extraction (17 | 4.8%), and Installation, Maintenance & Repair (10 | 2.8%).
Natural Resources, Construction and Maintenance Occupations by Sex
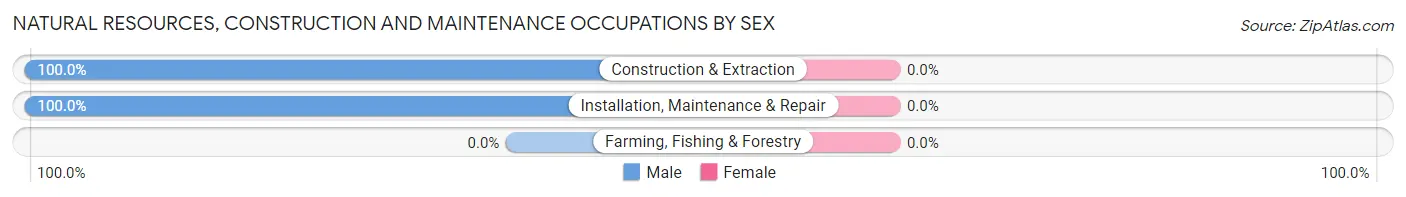
| Occupation | Male | Female |
| Farming, Fishing & Forestry | 0 (0.0%) | 0 (0.0%) |
| Construction & Extraction | 17 (100.0%) | 0 (0.0%) |
| Installation, Maintenance & Repair | 10 (100.0%) | 0 (0.0%) |
| Total (Category) | 27 (100.0%) | 0 (0.0%) |
| Total (Overall) | 197 (55.5%) | 158 (44.5%) |
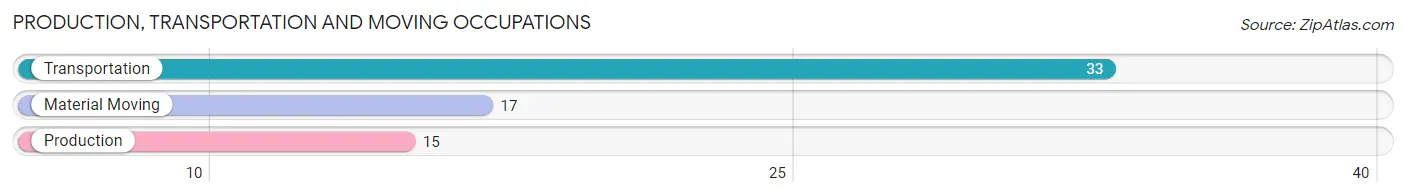
Production, Transportation and Moving Occupations
The most common Production, Transportation and Moving occupations in Batavia are Transportation (33 | 9.3%), Material Moving (17 | 4.8%), and Production (15 | 4.2%).
Production, Transportation and Moving Occupations by Sex
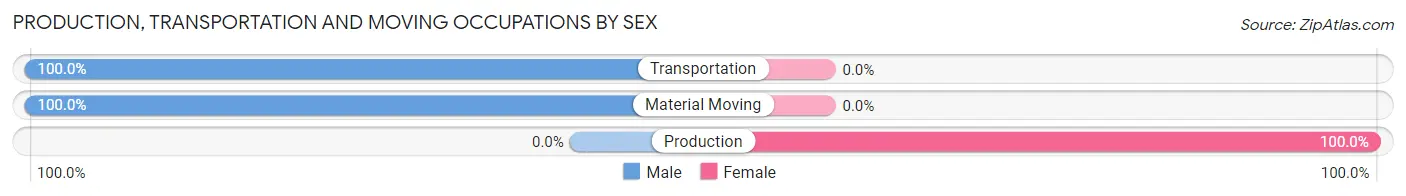
| Occupation | Male | Female |
| Production | 0 (0.0%) | 15 (100.0%) |
| Transportation | 33 (100.0%) | 0 (0.0%) |
| Material Moving | 17 (100.0%) | 0 (0.0%) |
| Total (Category) | 50 (76.9%) | 15 (23.1%) |
| Total (Overall) | 197 (55.5%) | 158 (44.5%) |
Employment Industries by Sex in Batavia
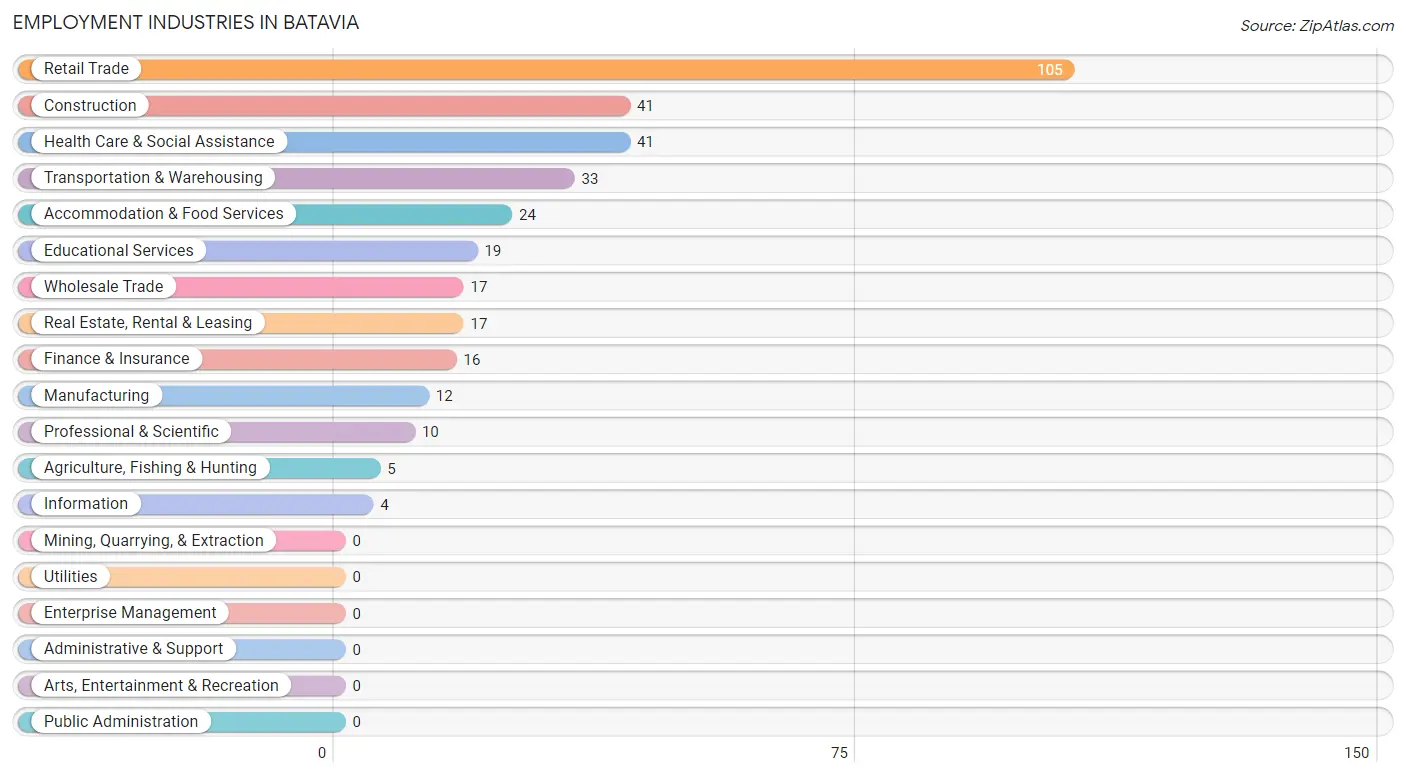
Employment Industries in Batavia
The major employment industries in Batavia include Retail Trade (105 | 29.6%), Construction (41 | 11.6%), Health Care & Social Assistance (41 | 11.6%), Transportation & Warehousing (33 | 9.3%), and Accommodation & Food Services (24 | 6.8%).
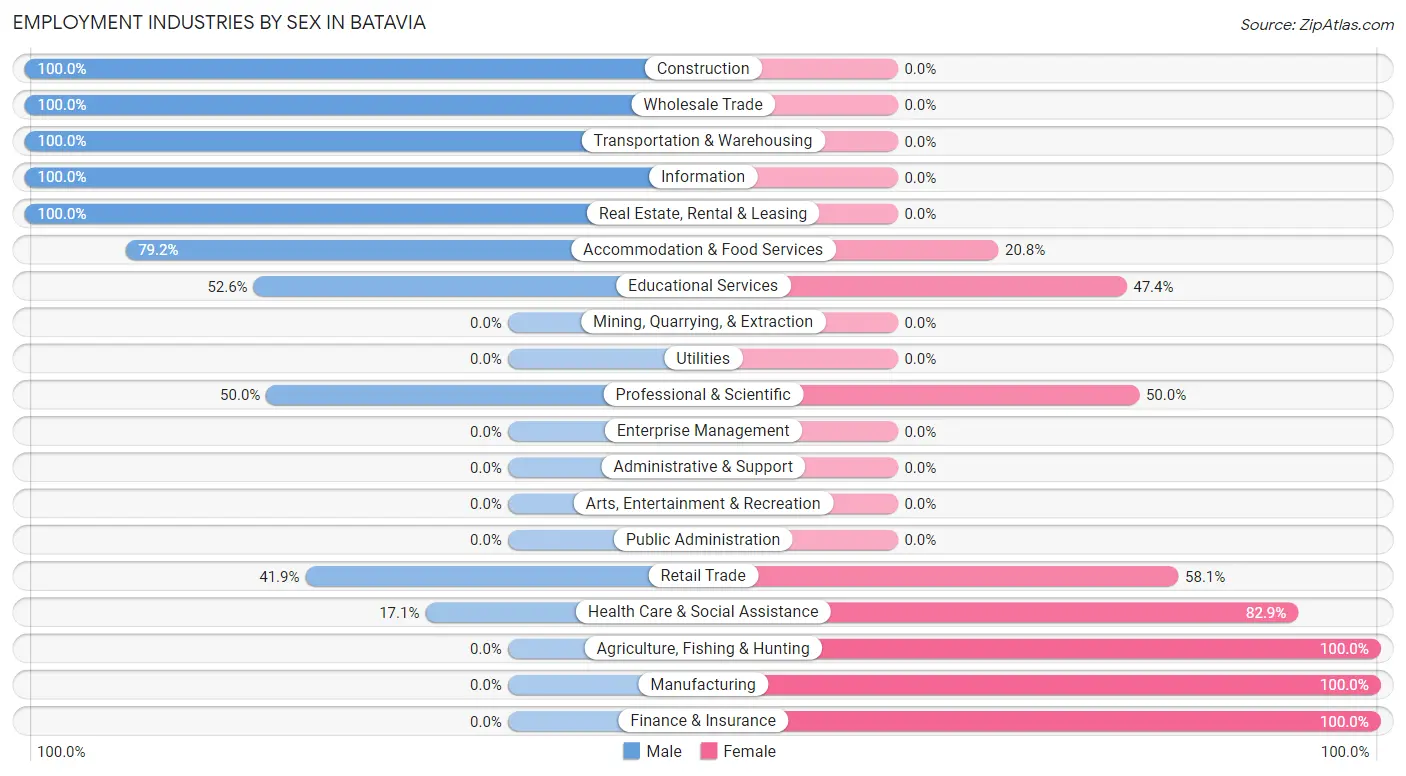
Employment Industries by Sex in Batavia
The Batavia industries that see more men than women are Construction (100.0%), Wholesale Trade (100.0%), and Transportation & Warehousing (100.0%), whereas the industries that tend to have a higher number of women are Agriculture, Fishing & Hunting (100.0%), Manufacturing (100.0%), and Finance & Insurance (100.0%).
| Industry | Male | Female |
| Agriculture, Fishing & Hunting | 0 (0.0%) | 5 (100.0%) |
| Mining, Quarrying, & Extraction | 0 (0.0%) | 0 (0.0%) |
| Construction | 41 (100.0%) | 0 (0.0%) |
| Manufacturing | 0 (0.0%) | 12 (100.0%) |
| Wholesale Trade | 17 (100.0%) | 0 (0.0%) |
| Retail Trade | 44 (41.9%) | 61 (58.1%) |
| Transportation & Warehousing | 33 (100.0%) | 0 (0.0%) |
| Utilities | 0 (0.0%) | 0 (0.0%) |
| Information | 4 (100.0%) | 0 (0.0%) |
| Finance & Insurance | 0 (0.0%) | 16 (100.0%) |
| Real Estate, Rental & Leasing | 17 (100.0%) | 0 (0.0%) |
| Professional & Scientific | 5 (50.0%) | 5 (50.0%) |
| Enterprise Management | 0 (0.0%) | 0 (0.0%) |
| Administrative & Support | 0 (0.0%) | 0 (0.0%) |
| Educational Services | 10 (52.6%) | 9 (47.4%) |
| Health Care & Social Assistance | 7 (17.1%) | 34 (82.9%) |
| Arts, Entertainment & Recreation | 0 (0.0%) | 0 (0.0%) |
| Accommodation & Food Services | 19 (79.2%) | 5 (20.8%) |
| Public Administration | 0 (0.0%) | 0 (0.0%) |
| Total | 197 (55.5%) | 158 (44.5%) |
Education in Batavia
School Enrollment in Batavia
The most common levels of schooling among the 150 students in Batavia are high school (57 | 38.0%), middle school (42 | 28.0%), and elementary school (39 | 26.0%).
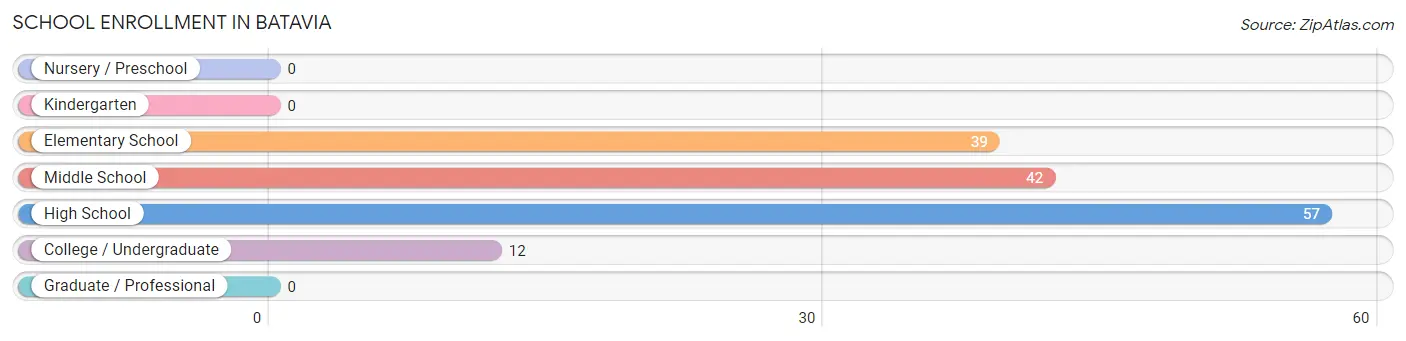
| School Level | # Students | % Students |
| Nursery / Preschool | 0 | 0.0% |
| Kindergarten | 0 | 0.0% |
| Elementary School | 39 | 26.0% |
| Middle School | 42 | 28.0% |
| High School | 57 | 38.0% |
| College / Undergraduate | 12 | 8.0% |
| Graduate / Professional | 0 | 0.0% |
| Total | 150 | 100.0% |
School Enrollment by Age by Funding Source in Batavia
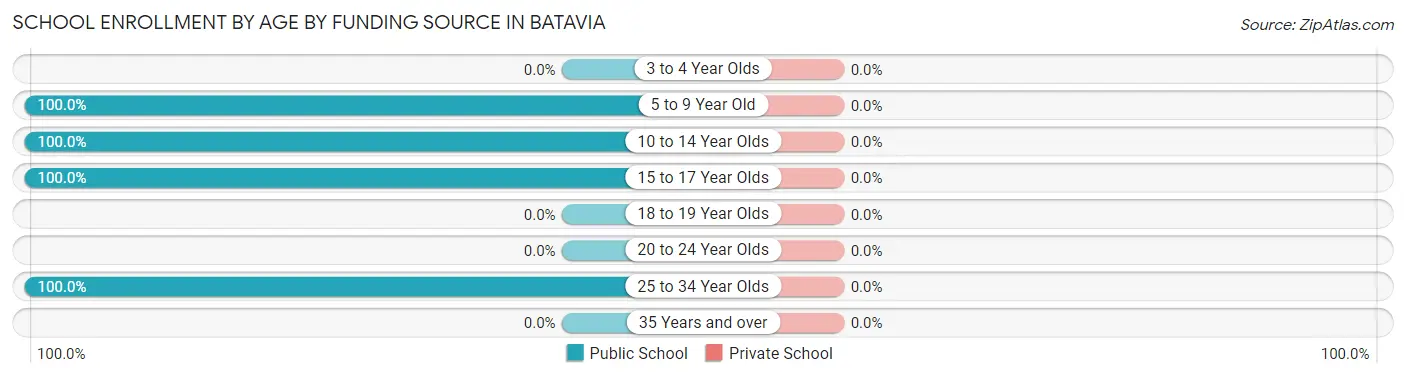
| Age Bracket | Public School | Private School |
| 3 to 4 Year Olds | 0 (0.0%) | 0 (0.0%) |
| 5 to 9 Year Old | 39 (100.0%) | 0 (0.0%) |
| 10 to 14 Year Olds | 42 (100.0%) | 0 (0.0%) |
| 15 to 17 Year Olds | 57 (100.0%) | 0 (0.0%) |
| 18 to 19 Year Olds | 0 (0.0%) | 0 (0.0%) |
| 20 to 24 Year Olds | 0 (0.0%) | 0 (0.0%) |
| 25 to 34 Year Olds | 12 (100.0%) | 0 (0.0%) |
| 35 Years and over | 0 (0.0%) | 0 (0.0%) |
| Total | 150 (100.0%) | 0 (0.0%) |
Educational Attainment by Field of Study in Batavia
Science & technology (27 | 20.3%), psychology (21 | 15.8%), education (19 | 14.3%), social sciences (16 | 12.0%), and computers & mathematics (12 | 9.0%) are the most common fields of study among 133 individuals in Batavia who have obtained a bachelor's degree or higher.
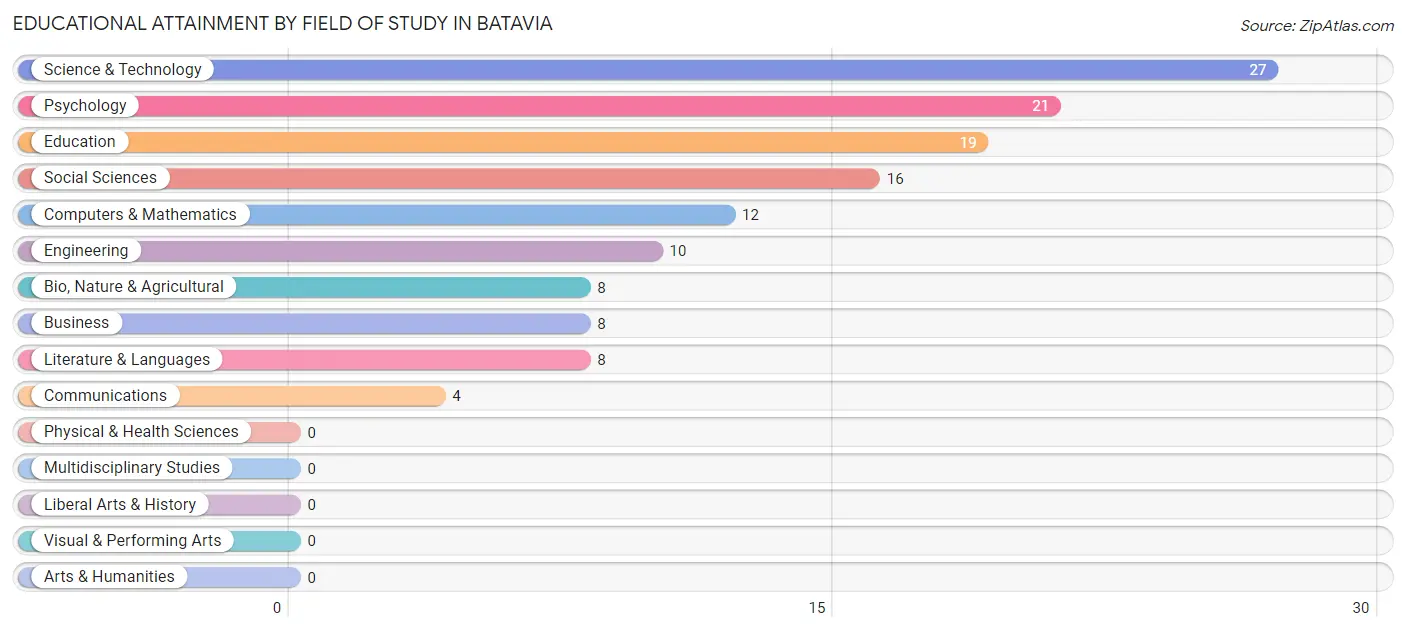
| Field of Study | # Graduates | % Graduates |
| Computers & Mathematics | 12 | 9.0% |
| Bio, Nature & Agricultural | 8 | 6.0% |
| Physical & Health Sciences | 0 | 0.0% |
| Psychology | 21 | 15.8% |
| Social Sciences | 16 | 12.0% |
| Engineering | 10 | 7.5% |
| Multidisciplinary Studies | 0 | 0.0% |
| Science & Technology | 27 | 20.3% |
| Business | 8 | 6.0% |
| Education | 19 | 14.3% |
| Literature & Languages | 8 | 6.0% |
| Liberal Arts & History | 0 | 0.0% |
| Visual & Performing Arts | 0 | 0.0% |
| Communications | 4 | 3.0% |
| Arts & Humanities | 0 | 0.0% |
| Total | 133 | 100.0% |
Transportation & Commute in Batavia
Vehicle Availability by Sex in Batavia
The most prevalent vehicle ownership categories in Batavia are males with 4 vehicles (57, accounting for 28.9%) and females with 4 vehicles (35, making up 39.6%).
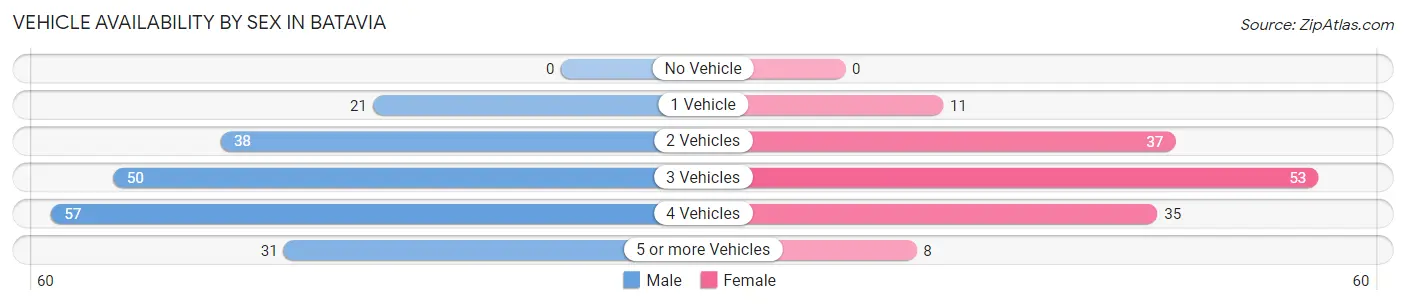
| Vehicles Available | Male | Female |
| No Vehicle | 0 (0.0%) | 0 (0.0%) |
| 1 Vehicle | 21 (10.7%) | 11 (7.6%) |
| 2 Vehicles | 38 (19.3%) | 37 (25.7%) |
| 3 Vehicles | 50 (25.4%) | 53 (36.8%) |
| 4 Vehicles | 57 (28.9%) | 35 (24.3%) |
| 5 or more Vehicles | 31 (15.7%) | 8 (5.6%) |
| Total | 197 (100.0%) | 144 (100.0%) |
Commute Time in Batavia
The most frequently occuring commute durations in Batavia are 15 to 19 minutes (94 commuters, 32.9%), 20 to 24 minutes (74 commuters, 25.9%), and 10 to 14 minutes (46 commuters, 16.1%).
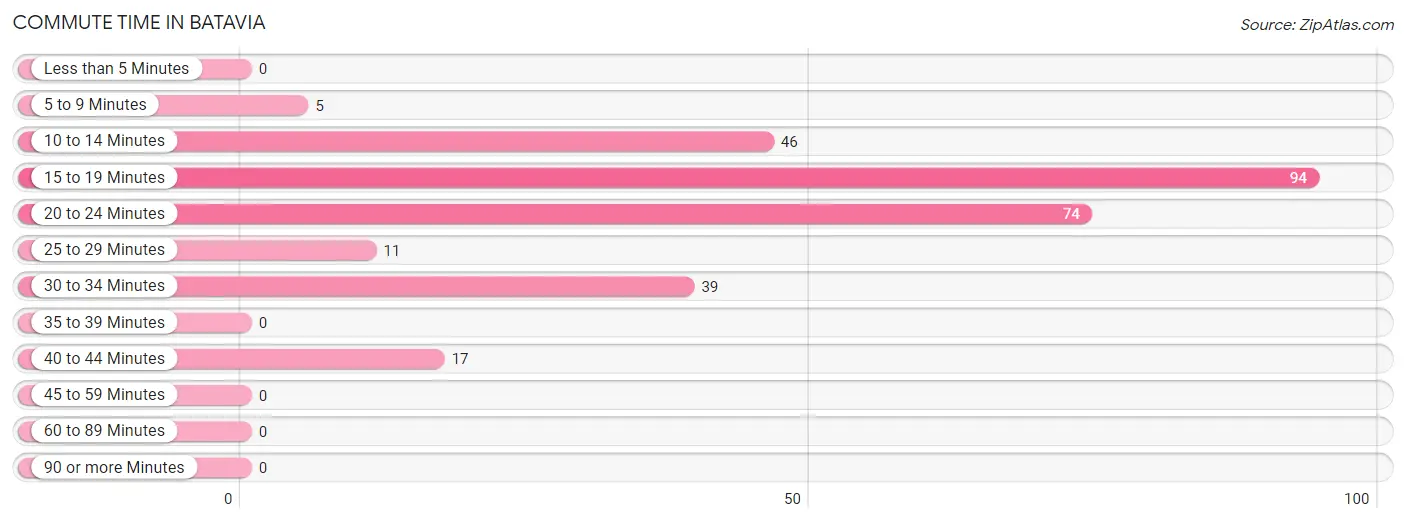
| Commute Time | # Commuters | % Commuters |
| Less than 5 Minutes | 0 | 0.0% |
| 5 to 9 Minutes | 5 | 1.8% |
| 10 to 14 Minutes | 46 | 16.1% |
| 15 to 19 Minutes | 94 | 32.9% |
| 20 to 24 Minutes | 74 | 25.9% |
| 25 to 29 Minutes | 11 | 3.8% |
| 30 to 34 Minutes | 39 | 13.6% |
| 35 to 39 Minutes | 0 | 0.0% |
| 40 to 44 Minutes | 17 | 5.9% |
| 45 to 59 Minutes | 0 | 0.0% |
| 60 to 89 Minutes | 0 | 0.0% |
| 90 or more Minutes | 0 | 0.0% |
Commute Time by Sex in Batavia
The most common commute times in Batavia are 15 to 19 minutes (53 commuters, 36.0%) for males and 20 to 24 minutes (57 commuters, 41.0%) for females.
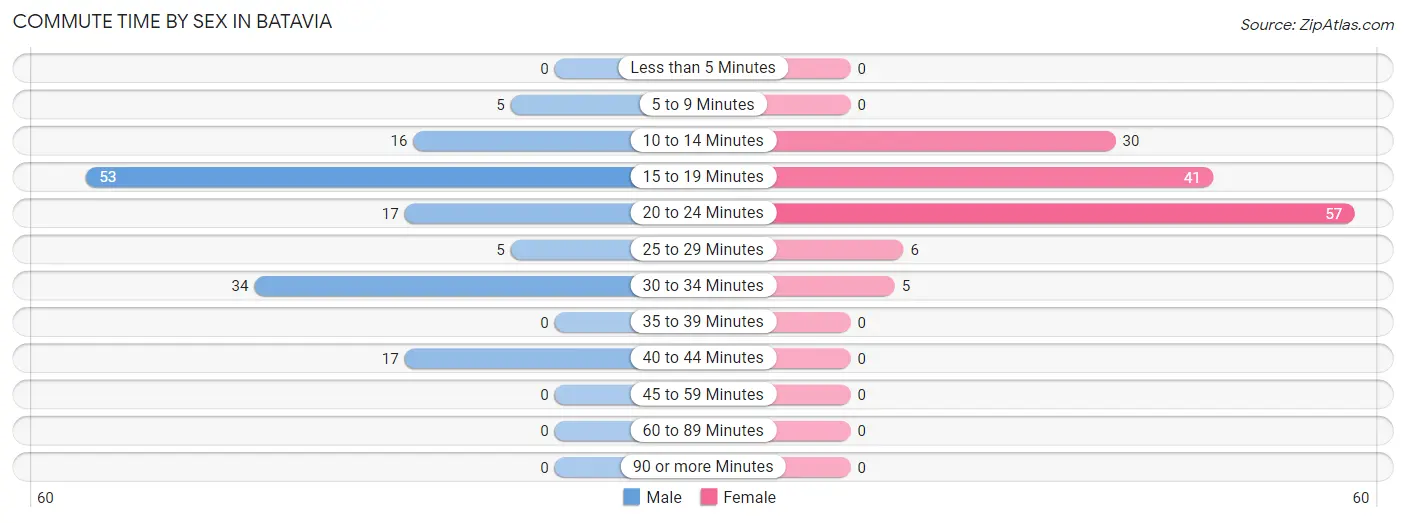
| Commute Time | Male | Female |
| Less than 5 Minutes | 0 (0.0%) | 0 (0.0%) |
| 5 to 9 Minutes | 5 (3.4%) | 0 (0.0%) |
| 10 to 14 Minutes | 16 (10.9%) | 30 (21.6%) |
| 15 to 19 Minutes | 53 (36.0%) | 41 (29.5%) |
| 20 to 24 Minutes | 17 (11.6%) | 57 (41.0%) |
| 25 to 29 Minutes | 5 (3.4%) | 6 (4.3%) |
| 30 to 34 Minutes | 34 (23.1%) | 5 (3.6%) |
| 35 to 39 Minutes | 0 (0.0%) | 0 (0.0%) |
| 40 to 44 Minutes | 17 (11.6%) | 0 (0.0%) |
| 45 to 59 Minutes | 0 (0.0%) | 0 (0.0%) |
| 60 to 89 Minutes | 0 (0.0%) | 0 (0.0%) |
| 90 or more Minutes | 0 (0.0%) | 0 (0.0%) |
Time of Departure to Work by Sex in Batavia
The most frequent times of departure to work in Batavia are 8:00 AM to 8:29 AM (52, 35.4%) for males and 6:00 AM to 6:29 AM (41, 29.5%) for females.
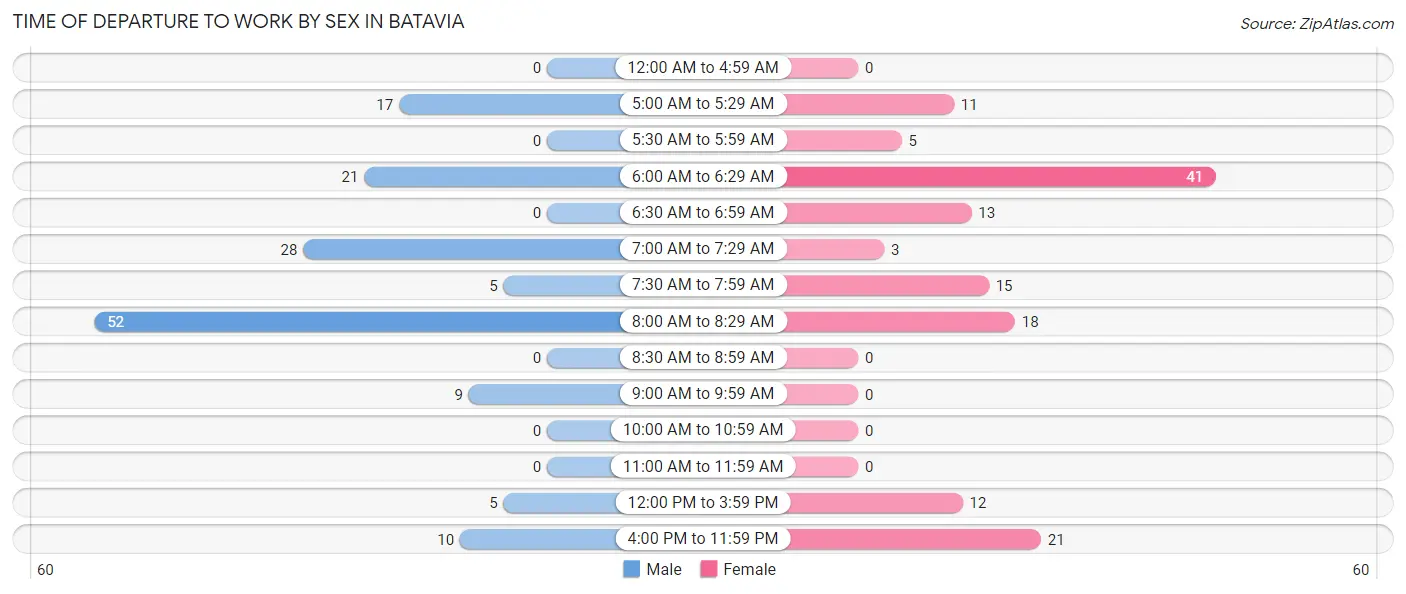
| Time of Departure | Male | Female |
| 12:00 AM to 4:59 AM | 0 (0.0%) | 0 (0.0%) |
| 5:00 AM to 5:29 AM | 17 (11.6%) | 11 (7.9%) |
| 5:30 AM to 5:59 AM | 0 (0.0%) | 5 (3.6%) |
| 6:00 AM to 6:29 AM | 21 (14.3%) | 41 (29.5%) |
| 6:30 AM to 6:59 AM | 0 (0.0%) | 13 (9.3%) |
| 7:00 AM to 7:29 AM | 28 (19.1%) | 3 (2.2%) |
| 7:30 AM to 7:59 AM | 5 (3.4%) | 15 (10.8%) |
| 8:00 AM to 8:29 AM | 52 (35.4%) | 18 (13.0%) |
| 8:30 AM to 8:59 AM | 0 (0.0%) | 0 (0.0%) |
| 9:00 AM to 9:59 AM | 9 (6.1%) | 0 (0.0%) |
| 10:00 AM to 10:59 AM | 0 (0.0%) | 0 (0.0%) |
| 11:00 AM to 11:59 AM | 0 (0.0%) | 0 (0.0%) |
| 12:00 PM to 3:59 PM | 5 (3.4%) | 12 (8.6%) |
| 4:00 PM to 11:59 PM | 10 (6.8%) | 21 (15.1%) |
| Total | 147 (100.0%) | 139 (100.0%) |
Housing Occupancy in Batavia
Occupancy by Ownership in Batavia
Of the total 243 dwellings in Batavia, owner-occupied units account for 177 (72.8%), while renter-occupied units make up 66 (27.2%).
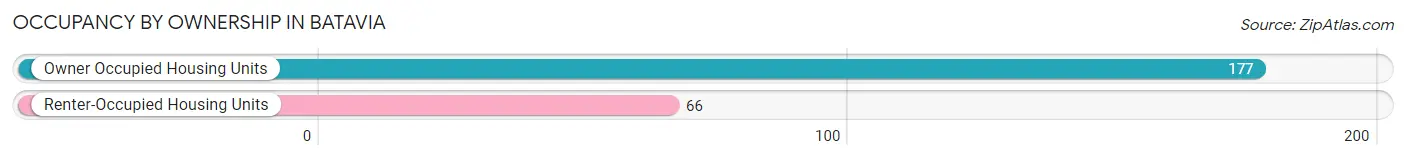
| Occupancy | # Housing Units | % Housing Units |
| Owner Occupied Housing Units | 177 | 72.8% |
| Renter-Occupied Housing Units | 66 | 27.2% |
| Total Occupied Housing Units | 243 | 100.0% |
Occupancy by Household Size in Batavia
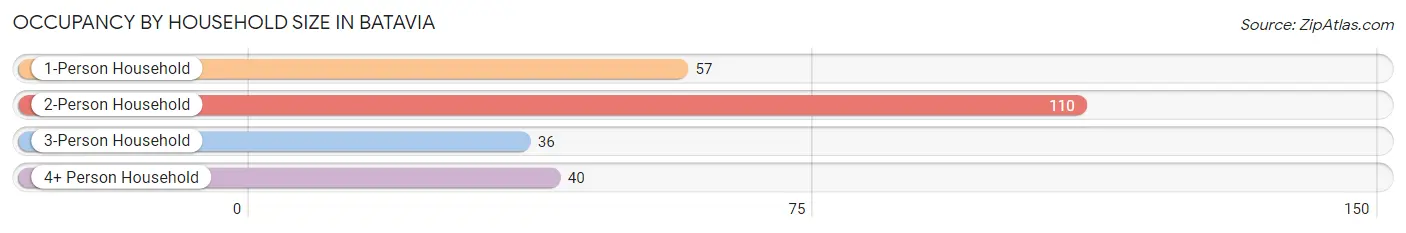
| Household Size | # Housing Units | % Housing Units |
| 1-Person Household | 57 | 23.5% |
| 2-Person Household | 110 | 45.3% |
| 3-Person Household | 36 | 14.8% |
| 4+ Person Household | 40 | 16.5% |
| Total Housing Units | 243 | 100.0% |
Occupancy by Ownership by Household Size in Batavia
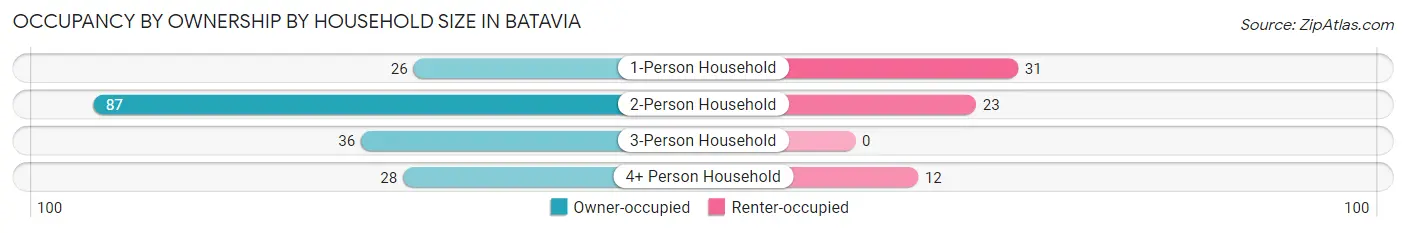
| Household Size | Owner-occupied | Renter-occupied |
| 1-Person Household | 26 (45.6%) | 31 (54.4%) |
| 2-Person Household | 87 (79.1%) | 23 (20.9%) |
| 3-Person Household | 36 (100.0%) | 0 (0.0%) |
| 4+ Person Household | 28 (70.0%) | 12 (30.0%) |
| Total Housing Units | 177 (72.8%) | 66 (27.2%) |
Occupancy by Educational Attainment in Batavia
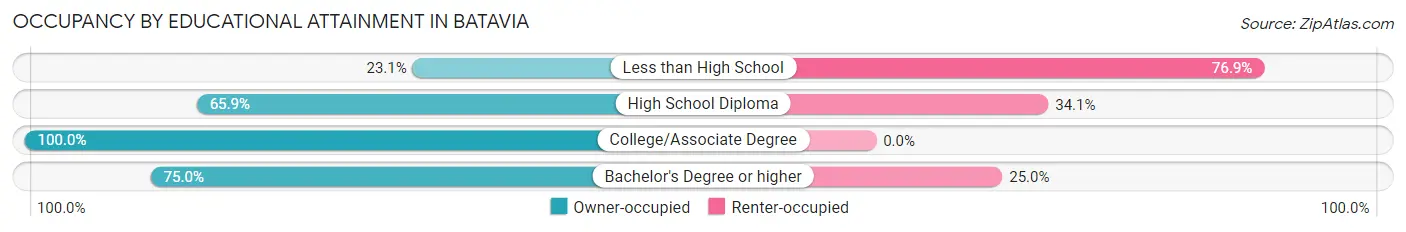
| Household Size | Owner-occupied | Renter-occupied |
| Less than High School | 3 (23.1%) | 10 (76.9%) |
| High School Diploma | 83 (65.9%) | 43 (34.1%) |
| College/Associate Degree | 52 (100.0%) | 0 (0.0%) |
| Bachelor's Degree or higher | 39 (75.0%) | 13 (25.0%) |
Occupancy by Age of Householder in Batavia
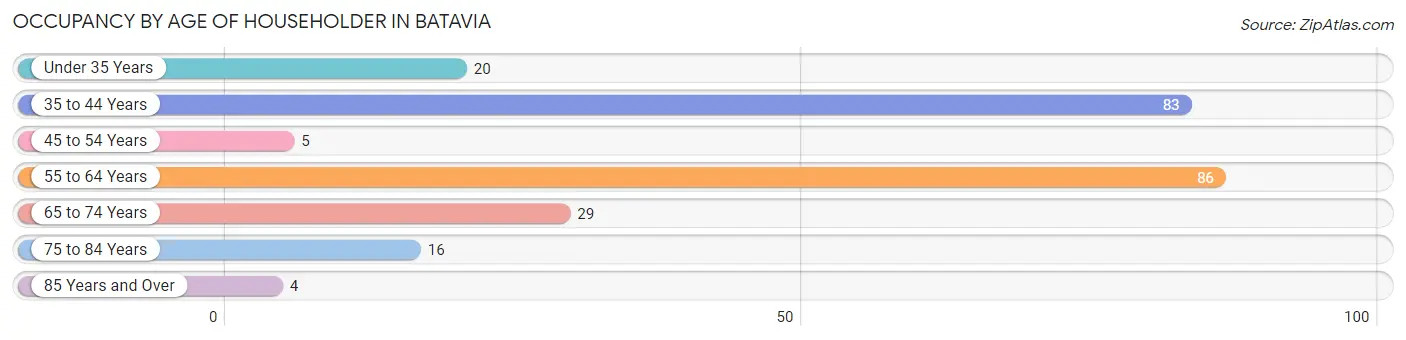
| Age Bracket | # Households | % Households |
| Under 35 Years | 20 | 8.2% |
| 35 to 44 Years | 83 | 34.2% |
| 45 to 54 Years | 5 | 2.1% |
| 55 to 64 Years | 86 | 35.4% |
| 65 to 74 Years | 29 | 11.9% |
| 75 to 84 Years | 16 | 6.6% |
| 85 Years and Over | 4 | 1.7% |
| Total | 243 | 100.0% |
Housing Finances in Batavia
Median Income by Occupancy in Batavia
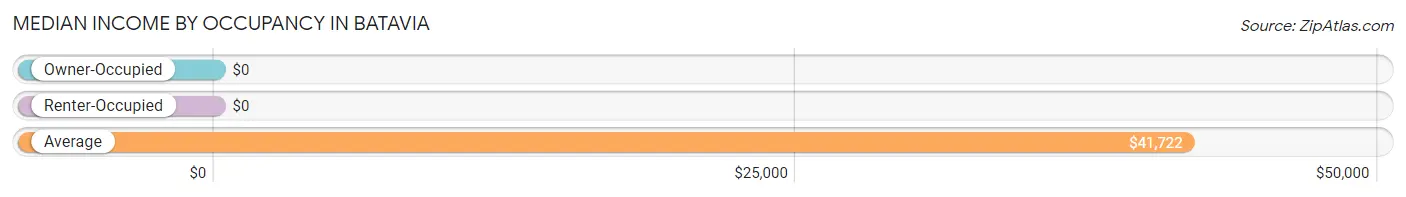
| Occupancy Type | # Households | Median Income |
| Owner-Occupied | 177 (72.8%) | $0 |
| Renter-Occupied | 66 (27.2%) | $0 |
| Average | 243 (100.0%) | $41,722 |
Occupancy by Householder Income Bracket in Batavia
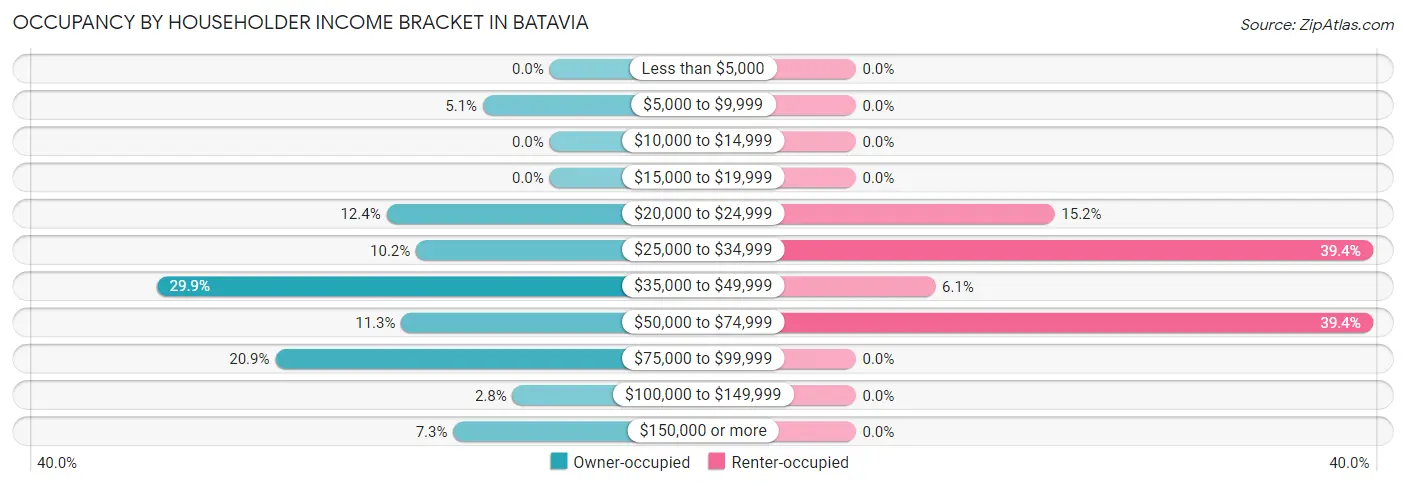
| Income Bracket | Owner-occupied | Renter-occupied |
| Less than $5,000 | 0 (0.0%) | 0 (0.0%) |
| $5,000 to $9,999 | 9 (5.1%) | 0 (0.0%) |
| $10,000 to $14,999 | 0 (0.0%) | 0 (0.0%) |
| $15,000 to $19,999 | 0 (0.0%) | 0 (0.0%) |
| $20,000 to $24,999 | 22 (12.4%) | 10 (15.1%) |
| $25,000 to $34,999 | 18 (10.2%) | 26 (39.4%) |
| $35,000 to $49,999 | 53 (29.9%) | 4 (6.1%) |
| $50,000 to $74,999 | 20 (11.3%) | 26 (39.4%) |
| $75,000 to $99,999 | 37 (20.9%) | 0 (0.0%) |
| $100,000 to $149,999 | 5 (2.8%) | 0 (0.0%) |
| $150,000 or more | 13 (7.3%) | 0 (0.0%) |
| Total | 177 (100.0%) | 66 (100.0%) |
Monthly Housing Cost Tiers in Batavia
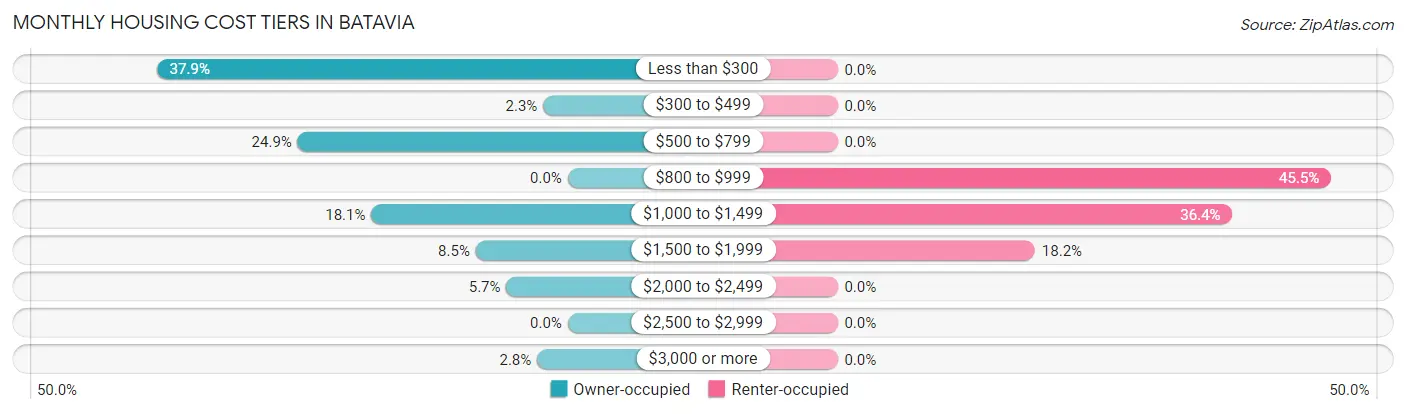
| Monthly Cost | Owner-occupied | Renter-occupied |
| Less than $300 | 67 (37.9%) | 0 (0.0%) |
| $300 to $499 | 4 (2.3%) | 0 (0.0%) |
| $500 to $799 | 44 (24.9%) | 0 (0.0%) |
| $800 to $999 | 0 (0.0%) | 30 (45.5%) |
| $1,000 to $1,499 | 32 (18.1%) | 24 (36.4%) |
| $1,500 to $1,999 | 15 (8.5%) | 12 (18.2%) |
| $2,000 to $2,499 | 10 (5.7%) | 0 (0.0%) |
| $2,500 to $2,999 | 0 (0.0%) | 0 (0.0%) |
| $3,000 or more | 5 (2.8%) | 0 (0.0%) |
| Total | 177 (100.0%) | 66 (100.0%) |
Physical Housing Characteristics in Batavia
Housing Structures in Batavia
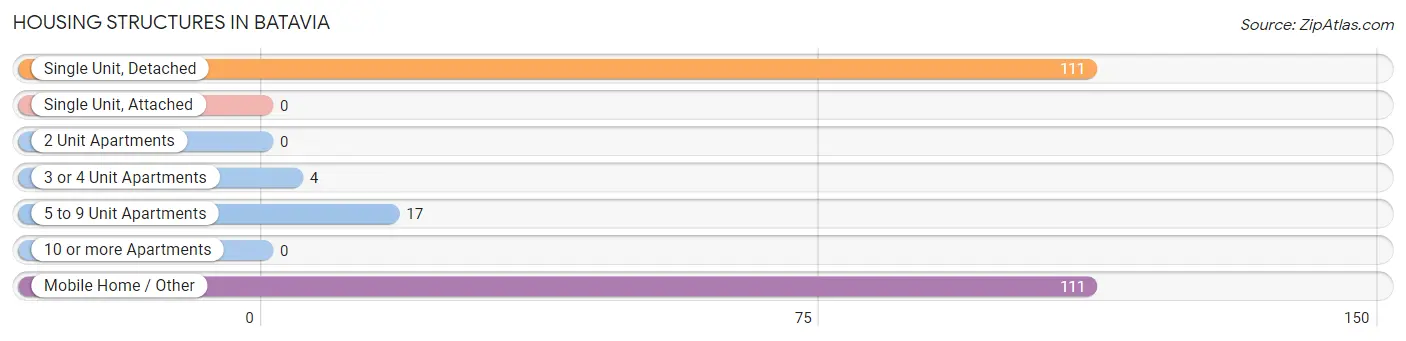
| Structure Type | # Housing Units | % Housing Units |
| Single Unit, Detached | 111 | 45.7% |
| Single Unit, Attached | 0 | 0.0% |
| 2 Unit Apartments | 0 | 0.0% |
| 3 or 4 Unit Apartments | 4 | 1.7% |
| 5 to 9 Unit Apartments | 17 | 7.0% |
| 10 or more Apartments | 0 | 0.0% |
| Mobile Home / Other | 111 | 45.7% |
| Total | 243 | 100.0% |
Housing Structures by Occupancy in Batavia
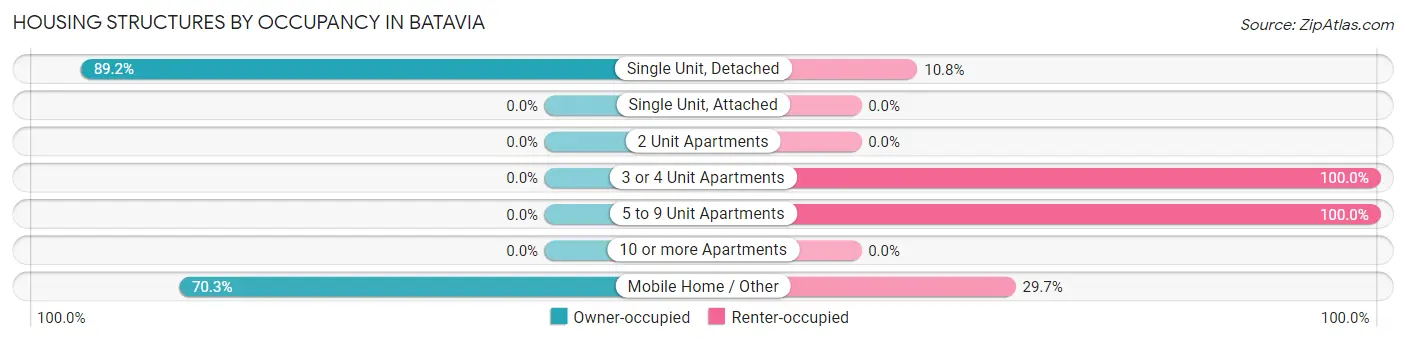
| Structure Type | Owner-occupied | Renter-occupied |
| Single Unit, Detached | 99 (89.2%) | 12 (10.8%) |
| Single Unit, Attached | 0 (0.0%) | 0 (0.0%) |
| 2 Unit Apartments | 0 (0.0%) | 0 (0.0%) |
| 3 or 4 Unit Apartments | 0 (0.0%) | 4 (100.0%) |
| 5 to 9 Unit Apartments | 0 (0.0%) | 17 (100.0%) |
| 10 or more Apartments | 0 (0.0%) | 0 (0.0%) |
| Mobile Home / Other | 78 (70.3%) | 33 (29.7%) |
| Total | 177 (72.8%) | 66 (27.2%) |
Housing Structures by Number of Rooms in Batavia
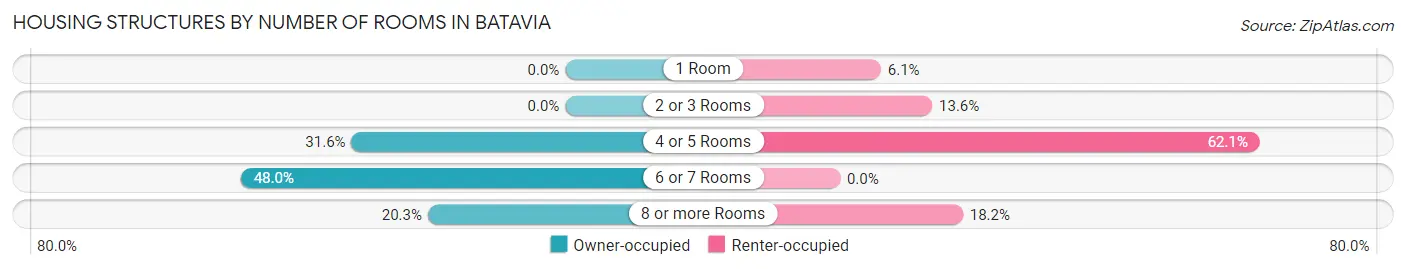
| Number of Rooms | Owner-occupied | Renter-occupied |
| 1 Room | 0 (0.0%) | 4 (6.1%) |
| 2 or 3 Rooms | 0 (0.0%) | 9 (13.6%) |
| 4 or 5 Rooms | 56 (31.6%) | 41 (62.1%) |
| 6 or 7 Rooms | 85 (48.0%) | 0 (0.0%) |
| 8 or more Rooms | 36 (20.3%) | 12 (18.2%) |
| Total | 177 (100.0%) | 66 (100.0%) |
Housing Structure by Heating Type in Batavia
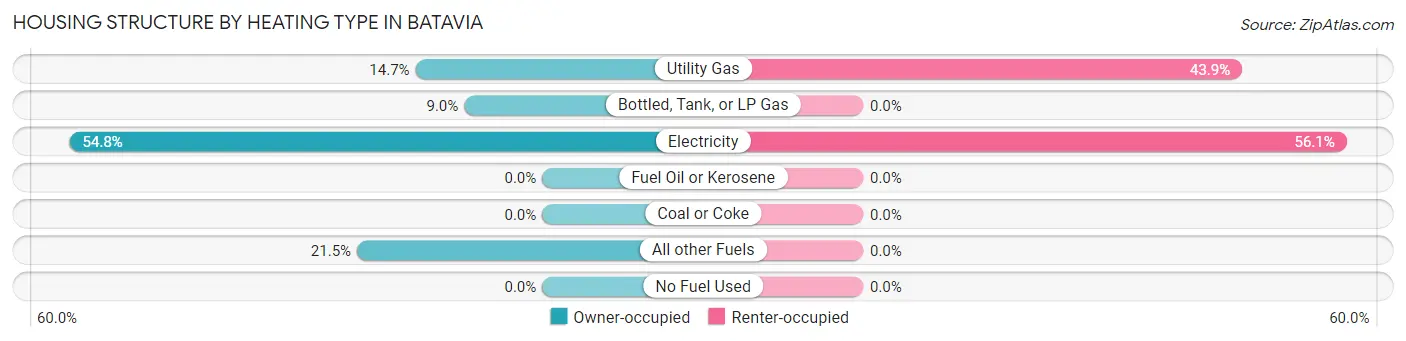
| Heating Type | Owner-occupied | Renter-occupied |
| Utility Gas | 26 (14.7%) | 29 (43.9%) |
| Bottled, Tank, or LP Gas | 16 (9.0%) | 0 (0.0%) |
| Electricity | 97 (54.8%) | 37 (56.1%) |
| Fuel Oil or Kerosene | 0 (0.0%) | 0 (0.0%) |
| Coal or Coke | 0 (0.0%) | 0 (0.0%) |
| All other Fuels | 38 (21.5%) | 0 (0.0%) |
| No Fuel Used | 0 (0.0%) | 0 (0.0%) |
| Total | 177 (100.0%) | 66 (100.0%) |
Household Vehicle Usage in Batavia
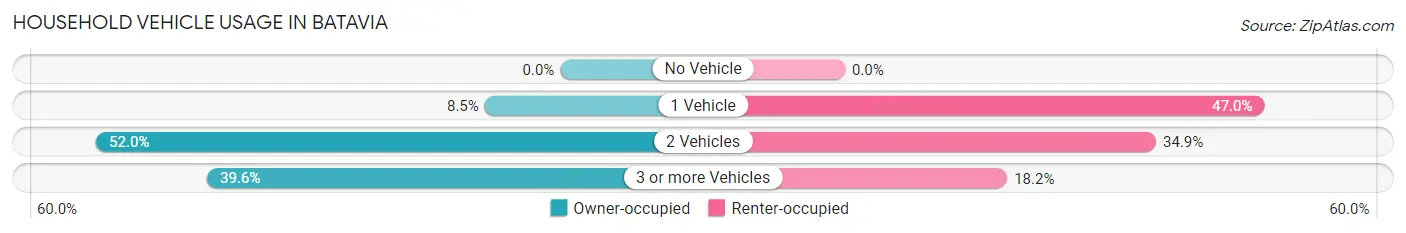
| Vehicles per Household | Owner-occupied | Renter-occupied |
| No Vehicle | 0 (0.0%) | 0 (0.0%) |
| 1 Vehicle | 15 (8.5%) | 31 (47.0%) |
| 2 Vehicles | 92 (52.0%) | 23 (34.8%) |
| 3 or more Vehicles | 70 (39.6%) | 12 (18.2%) |
| Total | 177 (100.0%) | 66 (100.0%) |
Real Estate & Mortgages in Batavia
Real Estate and Mortgage Overview in Batavia
| Characteristic | Without Mortgage | With Mortgage |
| Housing Units | 110 | 67 |
| Median Property Value | $116,500 | $468,800 |
| Median Household Income | $40,519 | $13 |
| Monthly Housing Costs | - | - |
| Real Estate Taxes | $932 | $0 |
Property Value by Mortgage Status in Batavia
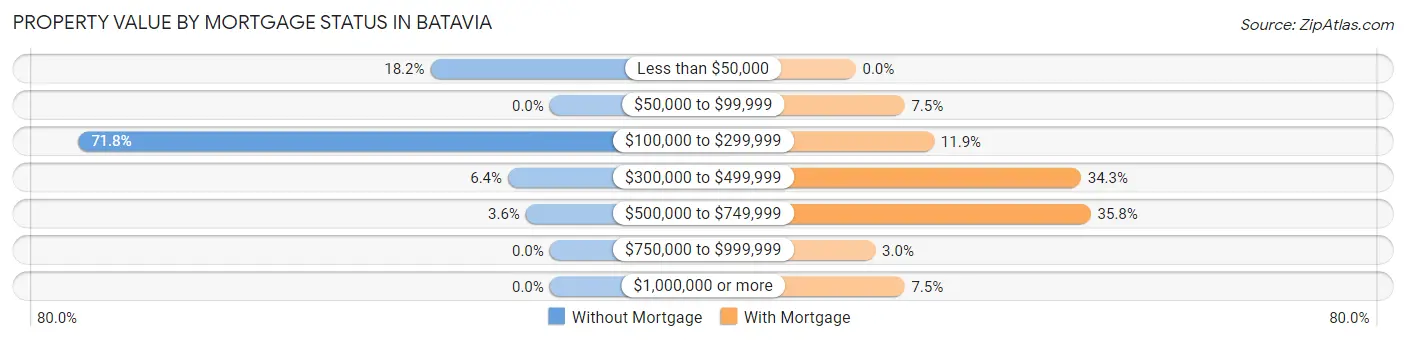
| Property Value | Without Mortgage | With Mortgage |
| Less than $50,000 | 20 (18.2%) | 0 (0.0%) |
| $50,000 to $99,999 | 0 (0.0%) | 5 (7.5%) |
| $100,000 to $299,999 | 79 (71.8%) | 8 (11.9%) |
| $300,000 to $499,999 | 7 (6.4%) | 23 (34.3%) |
| $500,000 to $749,999 | 4 (3.6%) | 24 (35.8%) |
| $750,000 to $999,999 | 0 (0.0%) | 2 (3.0%) |
| $1,000,000 or more | 0 (0.0%) | 5 (7.5%) |
| Total | 110 (100.0%) | 67 (100.0%) |
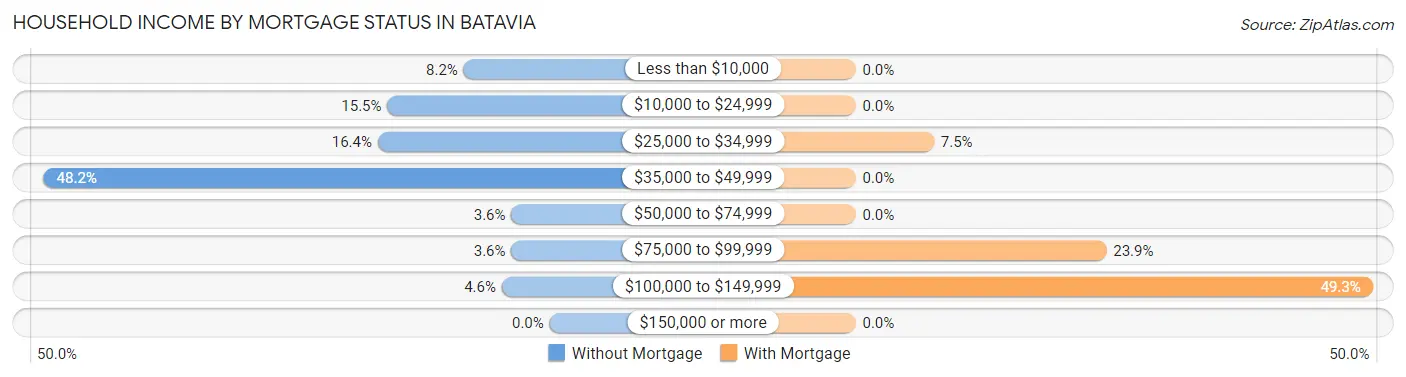
Household Income by Mortgage Status in Batavia
| Household Income | Without Mortgage | With Mortgage |
| Less than $10,000 | 9 (8.2%) | 0 (0.0%) |
| $10,000 to $24,999 | 17 (15.4%) | 0 (0.0%) |
| $25,000 to $34,999 | 18 (16.4%) | 5 (7.5%) |
| $35,000 to $49,999 | 53 (48.2%) | 0 (0.0%) |
| $50,000 to $74,999 | 4 (3.6%) | 0 (0.0%) |
| $75,000 to $99,999 | 4 (3.6%) | 16 (23.9%) |
| $100,000 to $149,999 | 5 (4.5%) | 33 (49.2%) |
| $150,000 or more | 0 (0.0%) | 0 (0.0%) |
| Total | 110 (100.0%) | 67 (100.0%) |
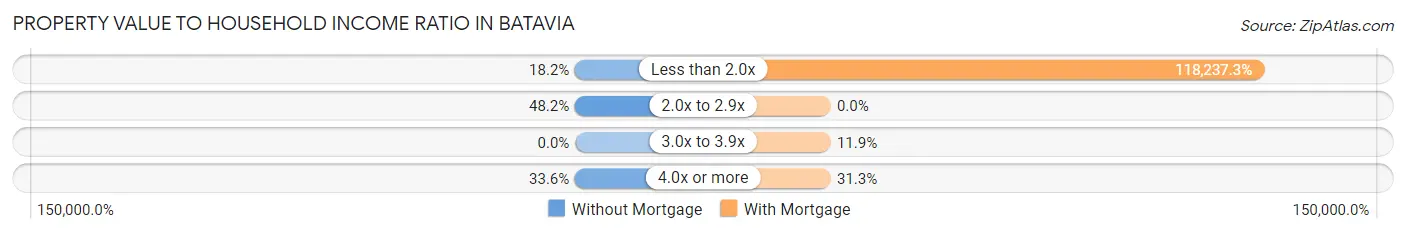
Property Value to Household Income Ratio in Batavia
| Value-to-Income Ratio | Without Mortgage | With Mortgage |
| Less than 2.0x | 20 (18.2%) | 79,219 (118,237.3%) |
| 2.0x to 2.9x | 53 (48.2%) | 0 (0.0%) |
| 3.0x to 3.9x | 0 (0.0%) | 8 (11.9%) |
| 4.0x or more | 37 (33.6%) | 21 (31.3%) |
| Total | 110 (100.0%) | 67 (100.0%) |
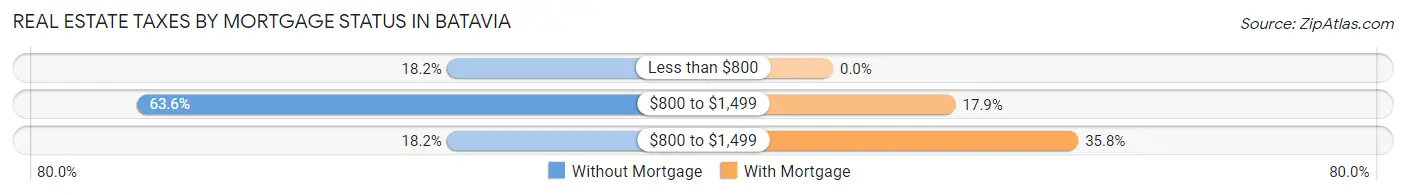
Real Estate Taxes by Mortgage Status in Batavia
| Property Taxes | Without Mortgage | With Mortgage |
| Less than $800 | 20 (18.2%) | 0 (0.0%) |
| $800 to $1,499 | 70 (63.6%) | 12 (17.9%) |
| $800 to $1,499 | 20 (18.2%) | 24 (35.8%) |
| Total | 110 (100.0%) | 67 (100.0%) |
Health & Disability in Batavia
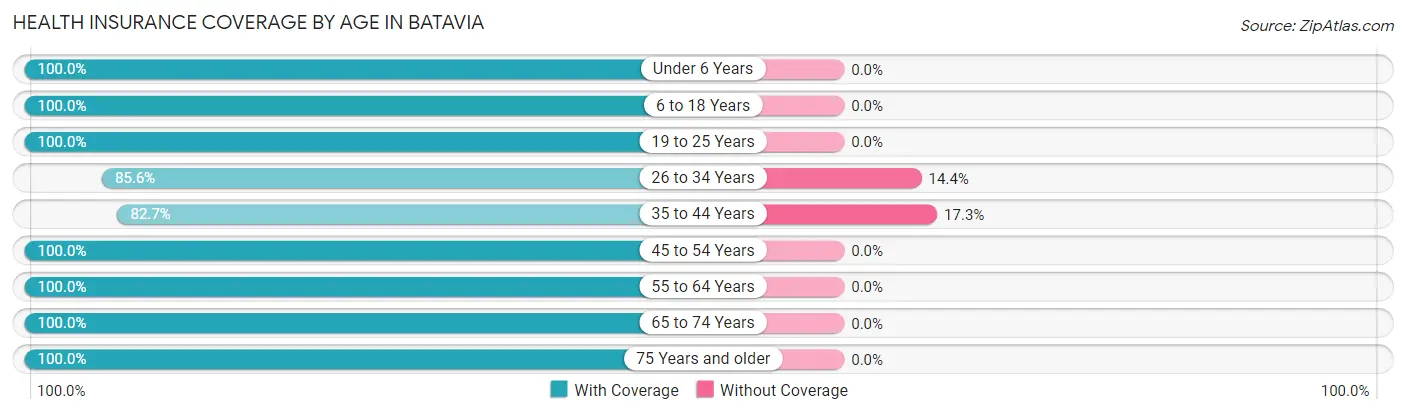
Health Insurance Coverage by Age in Batavia
| Age Bracket | With Coverage | Without Coverage |
| Under 6 Years | 33 (100.0%) | 0 (0.0%) |
| 6 to 18 Years | 153 (100.0%) | 0 (0.0%) |
| 19 to 25 Years | 13 (100.0%) | 0 (0.0%) |
| 26 to 34 Years | 83 (85.6%) | 14 (14.4%) |
| 35 to 44 Years | 148 (82.7%) | 31 (17.3%) |
| 45 to 54 Years | 10 (100.0%) | 0 (0.0%) |
| 55 to 64 Years | 107 (100.0%) | 0 (0.0%) |
| 65 to 74 Years | 72 (100.0%) | 0 (0.0%) |
| 75 Years and older | 23 (100.0%) | 0 (0.0%) |
| Total | 642 (93.4%) | 45 (6.6%) |
Health Insurance Coverage by Citizenship Status in Batavia
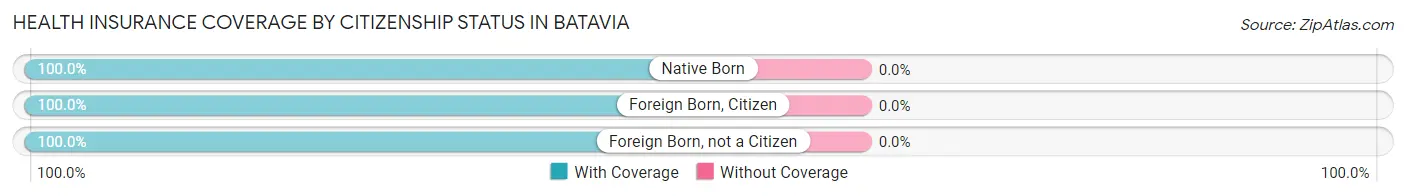
| Citizenship Status | With Coverage | Without Coverage |
| Native Born | 33 (100.0%) | 0 (0.0%) |
| Foreign Born, Citizen | 153 (100.0%) | 0 (0.0%) |
| Foreign Born, not a Citizen | 13 (100.0%) | 0 (0.0%) |
Health Insurance Coverage by Household Income in Batavia
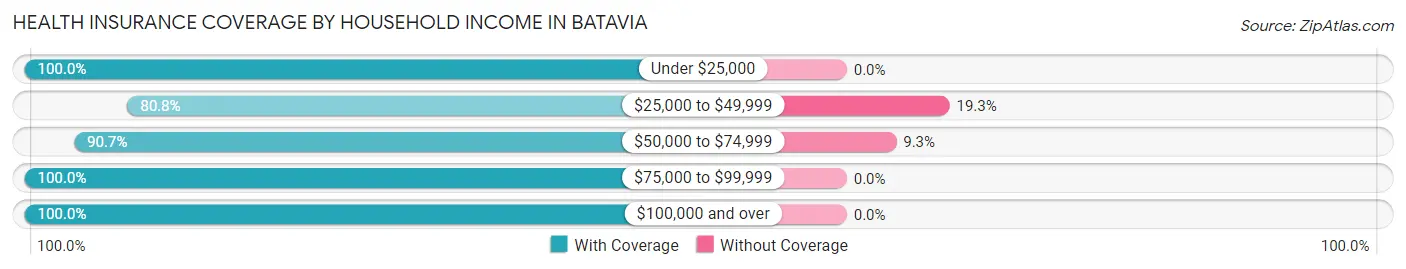
| Household Income | With Coverage | Without Coverage |
| Under $25,000 | 90 (100.0%) | 0 (0.0%) |
| $25,000 to $49,999 | 130 (80.7%) | 31 (19.3%) |
| $50,000 to $74,999 | 137 (90.7%) | 14 (9.3%) |
| $75,000 to $99,999 | 133 (100.0%) | 0 (0.0%) |
| $100,000 and over | 152 (100.0%) | 0 (0.0%) |
Public vs Private Health Insurance Coverage by Age in Batavia
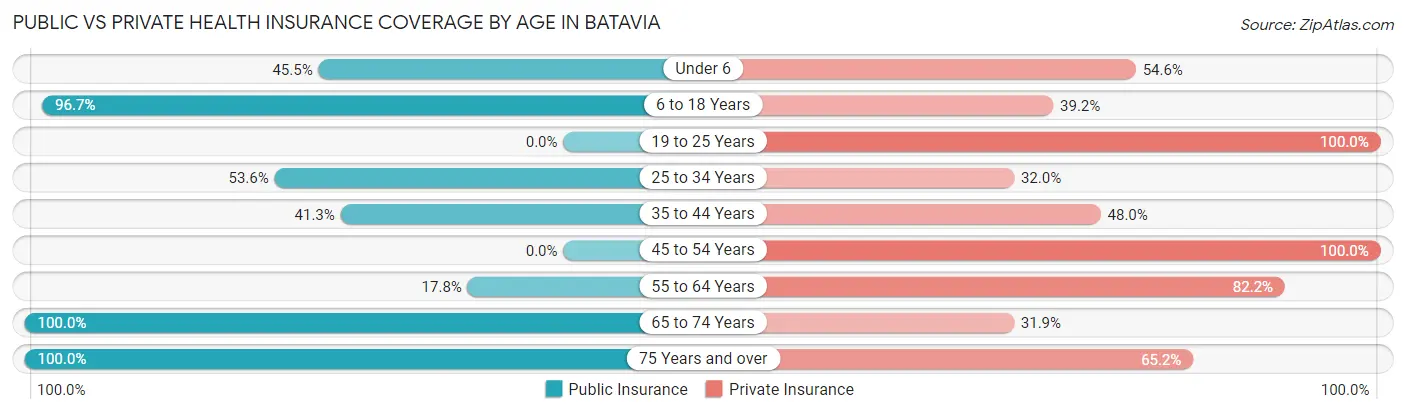
| Age Bracket | Public Insurance | Private Insurance |
| Under 6 | 15 (45.5%) | 18 (54.5%) |
| 6 to 18 Years | 148 (96.7%) | 60 (39.2%) |
| 19 to 25 Years | 0 (0.0%) | 13 (100.0%) |
| 25 to 34 Years | 52 (53.6%) | 31 (32.0%) |
| 35 to 44 Years | 74 (41.3%) | 86 (48.0%) |
| 45 to 54 Years | 0 (0.0%) | 10 (100.0%) |
| 55 to 64 Years | 19 (17.8%) | 88 (82.2%) |
| 65 to 74 Years | 72 (100.0%) | 23 (31.9%) |
| 75 Years and over | 23 (100.0%) | 15 (65.2%) |
| Total | 403 (58.7%) | 344 (50.1%) |
Disability Status by Sex by Age in Batavia
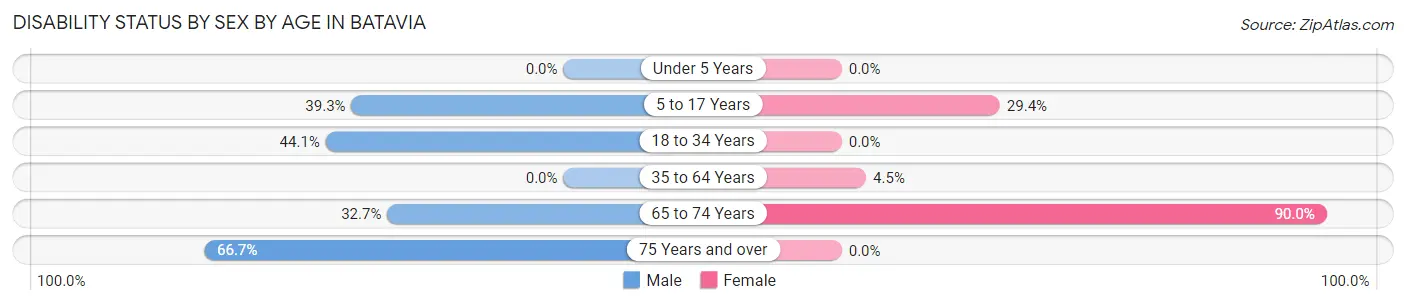
| Age Bracket | Male | Female |
| Under 5 Years | 0 (0.0%) | 0 (0.0%) |
| 5 to 17 Years | 24 (39.3%) | 27 (29.3%) |
| 18 to 34 Years | 30 (44.1%) | 0 (0.0%) |
| 35 to 64 Years | 0 (0.0%) | 8 (4.5%) |
| 65 to 74 Years | 17 (32.7%) | 18 (90.0%) |
| 75 Years and over | 12 (66.7%) | 0 (0.0%) |
Disability Class by Sex by Age in Batavia
Disability Class: Hearing Difficulty
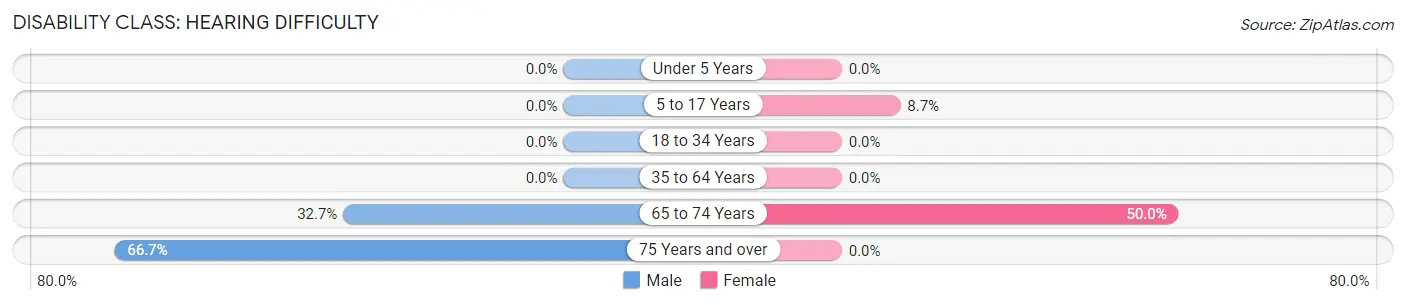
| Age Bracket | Male | Female |
| Under 5 Years | 0 (0.0%) | 0 (0.0%) |
| 5 to 17 Years | 0 (0.0%) | 8 (8.7%) |
| 18 to 34 Years | 0 (0.0%) | 0 (0.0%) |
| 35 to 64 Years | 0 (0.0%) | 0 (0.0%) |
| 65 to 74 Years | 17 (32.7%) | 10 (50.0%) |
| 75 Years and over | 12 (66.7%) | 0 (0.0%) |
Disability Class: Vision Difficulty
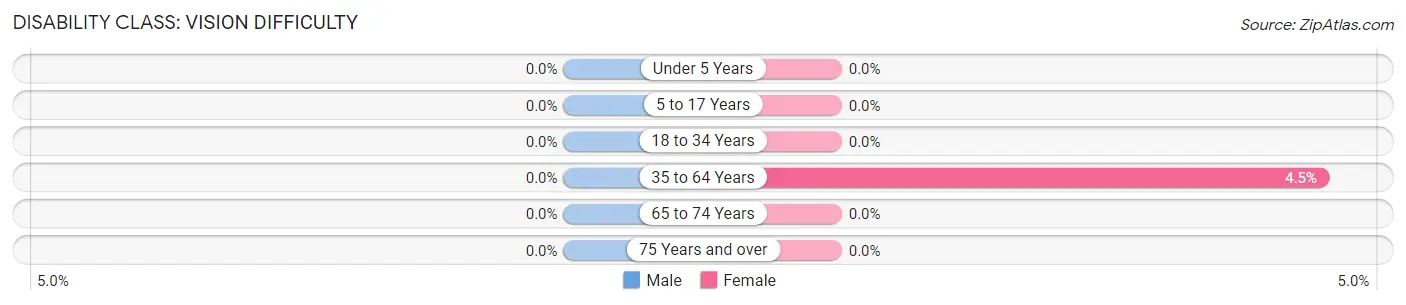
| Age Bracket | Male | Female |
| Under 5 Years | 0 (0.0%) | 0 (0.0%) |
| 5 to 17 Years | 0 (0.0%) | 0 (0.0%) |
| 18 to 34 Years | 0 (0.0%) | 0 (0.0%) |
| 35 to 64 Years | 0 (0.0%) | 8 (4.5%) |
| 65 to 74 Years | 0 (0.0%) | 0 (0.0%) |
| 75 Years and over | 0 (0.0%) | 0 (0.0%) |
Disability Class: Cognitive Difficulty
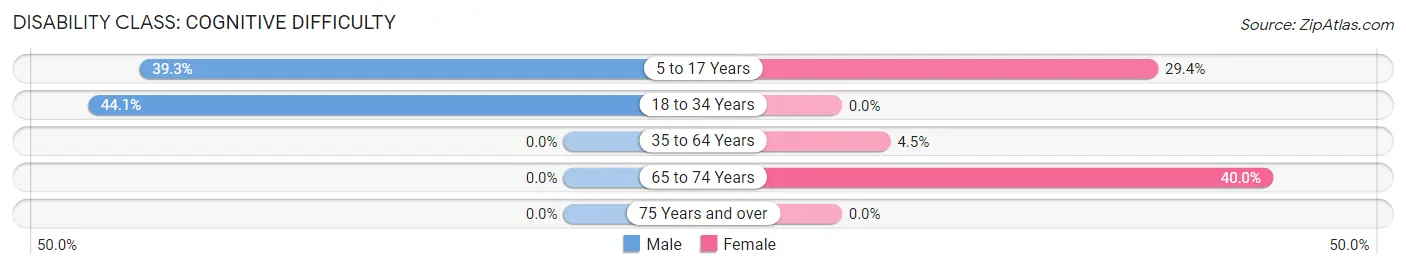
| Age Bracket | Male | Female |
| 5 to 17 Years | 24 (39.3%) | 27 (29.3%) |
| 18 to 34 Years | 30 (44.1%) | 0 (0.0%) |
| 35 to 64 Years | 0 (0.0%) | 8 (4.5%) |
| 65 to 74 Years | 0 (0.0%) | 8 (40.0%) |
| 75 Years and over | 0 (0.0%) | 0 (0.0%) |
Disability Class: Ambulatory Difficulty
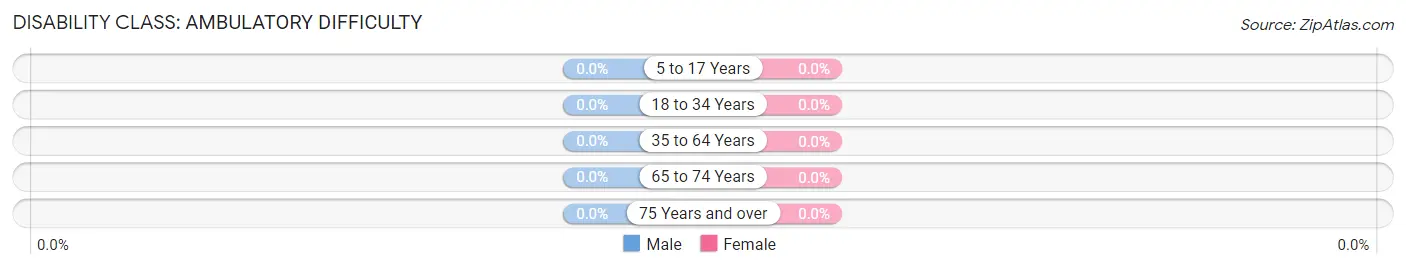
| Age Bracket | Male | Female |
| 5 to 17 Years | 0 (0.0%) | 0 (0.0%) |
| 18 to 34 Years | 0 (0.0%) | 0 (0.0%) |
| 35 to 64 Years | 0 (0.0%) | 0 (0.0%) |
| 65 to 74 Years | 0 (0.0%) | 0 (0.0%) |
| 75 Years and over | 0 (0.0%) | 0 (0.0%) |
Disability Class: Self-Care Difficulty
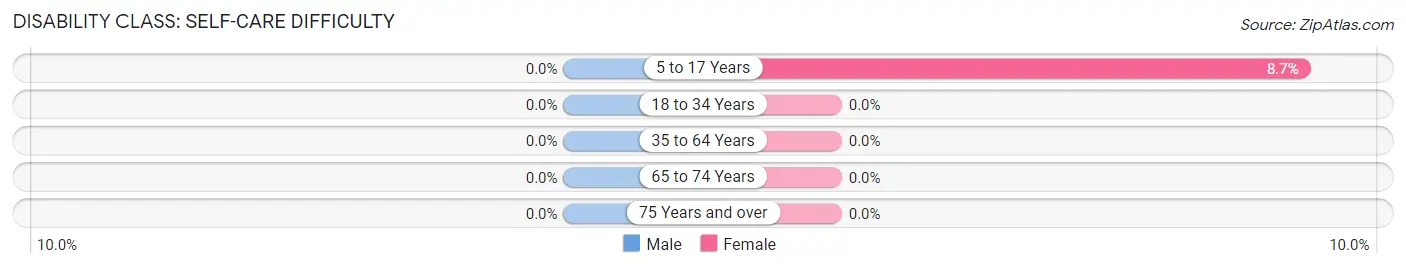
| Age Bracket | Male | Female |
| 5 to 17 Years | 0 (0.0%) | 8 (8.7%) |
| 18 to 34 Years | 0 (0.0%) | 0 (0.0%) |
| 35 to 64 Years | 0 (0.0%) | 0 (0.0%) |
| 65 to 74 Years | 0 (0.0%) | 0 (0.0%) |
| 75 Years and over | 0 (0.0%) | 0 (0.0%) |
Technology Access in Batavia
Computing Device Access in Batavia
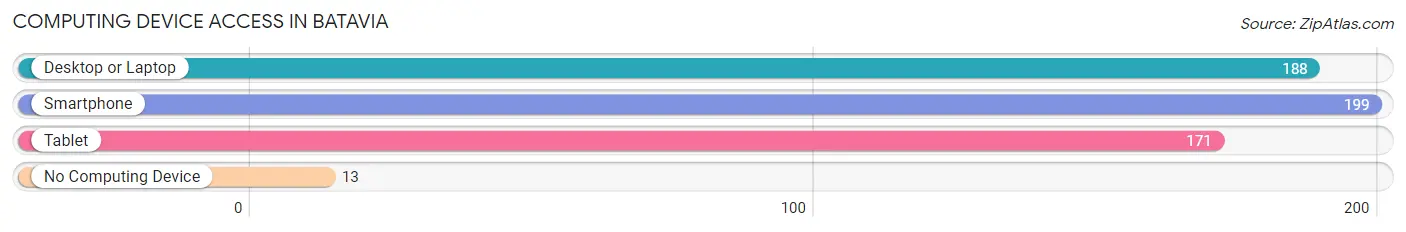
| Device Type | # Households | % Households |
| Desktop or Laptop | 188 | 77.4% |
| Smartphone | 199 | 81.9% |
| Tablet | 171 | 70.4% |
| No Computing Device | 13 | 5.3% |
| Total | 243 | 100.0% |
Internet Access in Batavia
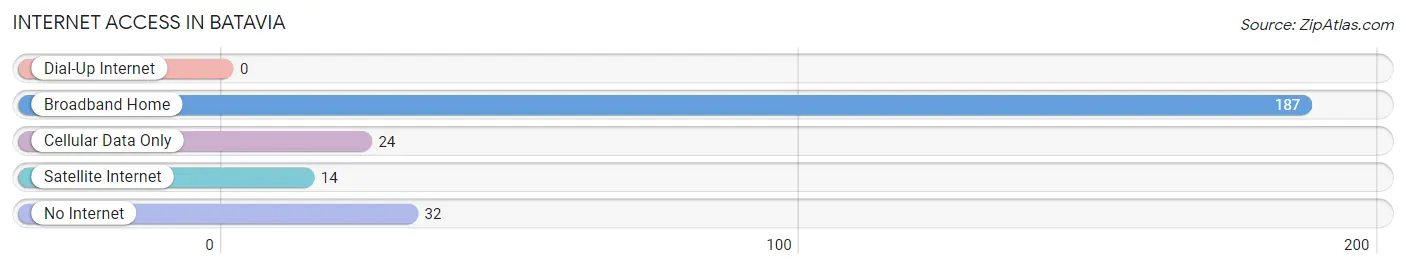
| Internet Type | # Households | % Households |
| Dial-Up Internet | 0 | 0.0% |
| Broadband Home | 187 | 76.9% |
| Cellular Data Only | 24 | 9.9% |
| Satellite Internet | 14 | 5.8% |
| No Internet | 32 | 13.2% |
| Total | 243 | 100.0% |
Batavia Summary
Batavia, Montana is a small town located in the western part of the state, in the foothills of the Rocky Mountains. It is situated in the Flathead Valley, near the Flathead River, and is surrounded by the Flathead National Forest. The town has a population of just over 500 people, and is the county seat of Flathead County.
Batavia was founded in 1883 by a group of settlers from the Midwest. The town was named after the nearby Batavia Creek, which was named after the city of Batavia in New York. The settlers were attracted to the area by the abundance of timber and the potential for farming. The town quickly grew, and by the early 1900s, it had become a bustling center of commerce and industry.
The economy of Batavia is largely based on agriculture and timber. The town is home to several large farms, as well as a number of smaller family-owned farms. The timber industry is also important to the local economy, with several sawmills located in the area. In addition, the town is home to a number of small businesses, including restaurants, shops, and other services.
The geography of Batavia is characterized by rolling hills, forests, and rivers. The town is located in the Flathead Valley, which is surrounded by the Rocky Mountains. The Flathead River runs through the town, providing a source of water for the local farms and businesses. The town is also home to several lakes, including Flathead Lake, which is the largest natural freshwater lake in the western United States.
The demographics of Batavia are largely white, with a small percentage of Native Americans and African Americans. The median age of the population is 44, and the median household income is $41,000. The town has a low unemployment rate, and the majority of the population is employed in the agricultural and timber industries.
Batavia is a small town with a rich history and a vibrant economy. It is a great place to live, work, and raise a family. The town is surrounded by beautiful scenery, and the people are friendly and welcoming. With its strong economy and diverse population, Batavia is a great place to call home.
Common Questions
What is Per Capita Income in Batavia?
Per Capita income in Batavia is $20,769.
What is the Median Family Income in Batavia?
Median Family Income in Batavia is $41,462.
What is the Median Household income in Batavia?
Median Household Income in Batavia is $41,722.
What is Income or Wage Gap in Batavia?
Income or Wage Gap in Batavia is 13.3%.
Women in Batavia earn 86.7 cents for every dollar earned by a man.
What is Inequality or Gini Index in Batavia?
Inequality or Gini Index in Batavia is 0.34.
What is the Total Population of Batavia?
Total Population of Batavia is 687.
What is the Total Male Population of Batavia?
Total Male Population of Batavia is 325.
What is the Total Female Population of Batavia?
Total Female Population of Batavia is 362.
What is the Ratio of Males per 100 Females in Batavia?
There are 89.78 Males per 100 Females in Batavia.
What is the Ratio of Females per 100 Males in Batavia?
There are 111.38 Females per 100 Males in Batavia.
What is the Median Population Age in Batavia?
Median Population Age in Batavia is 38.9 Years.
What is the Average Family Size in Batavia
Average Family Size in Batavia is 3.0 People.
What is the Average Household Size in Batavia
Average Household Size in Batavia is 2.8 People.
How Large is the Labor Force in Batavia?
There are 393 People in the Labor Forcein in Batavia.
What is the Percentage of People in the Labor Force in Batavia?
68.6% of People are in the Labor Force in Batavia.
What is the Unemployment Rate in Batavia?
Unemployment Rate in Batavia is 9.7%.