Fort Belknap Agency, MT Map & Demographics
Fort Belknap Agency Map
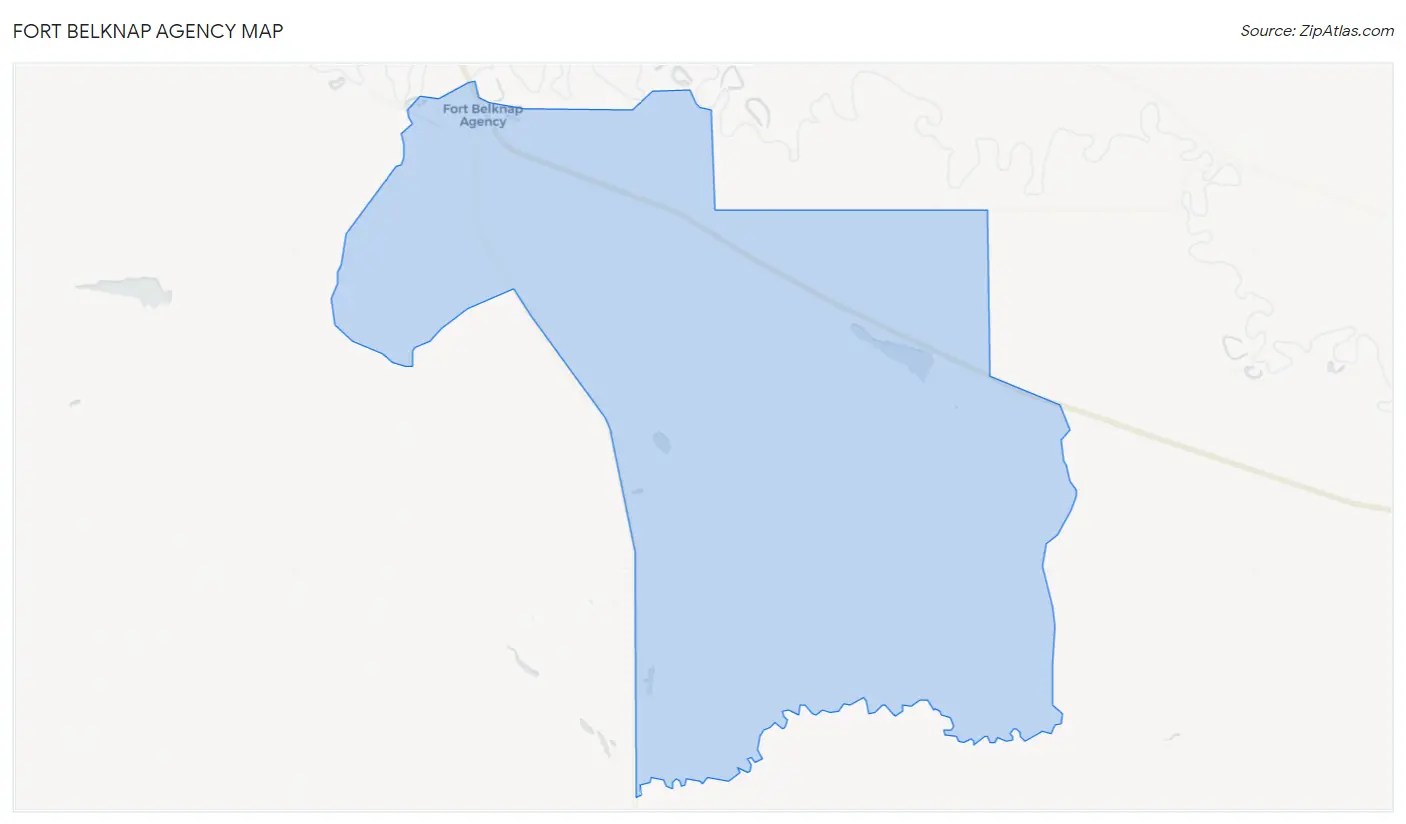
Fort Belknap Agency Overview
$15,764
PER CAPITA INCOME
$50,625
AVG FAMILY INCOME
$29,766
AVG HOUSEHOLD INCOME
24.4%
WAGE / INCOME GAP [ % ]
75.6¢/ $1
WAGE / INCOME GAP [ $ ]
0.48
INEQUALITY / GINI INDEX
1,473
TOTAL POPULATION
768
MALE POPULATION
705
FEMALE POPULATION
108.94
MALES / 100 FEMALES
91.80
FEMALES / 100 MALES
22.9
MEDIAN AGE
4.4
AVG FAMILY SIZE
3.9
AVG HOUSEHOLD SIZE
438
LABOR FORCE [ PEOPLE ]
46.9%
PERCENT IN LABOR FORCE
36.3%
UNEMPLOYMENT RATE
Income in Fort Belknap Agency
Income Overview in Fort Belknap Agency
Per Capita Income in Fort Belknap Agency is $15,764, while median incomes of families and households are $50,625 and $29,766 respectively.
| Characteristic | Number | Measure |
| Per Capita Income | 1,473 | $15,764 |
| Median Family Income | 295 | $50,625 |
| Mean Family Income | 295 | $61,876 |
| Median Household Income | 373 | $29,766 |
| Mean Household Income | 373 | $53,361 |
| Income Deficit | 295 | $0 |
| Wage / Income Gap (%) | 1,473 | 24.38% |
| Wage / Income Gap ($) | 1,473 | 75.62¢ per $1 |
| Gini / Inequality Index | 1,473 | 0.48 |
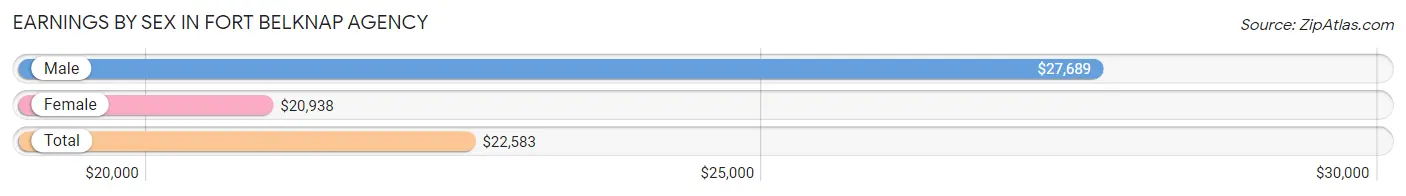
Earnings by Sex in Fort Belknap Agency
Average Earnings in Fort Belknap Agency are $22,583, $27,689 for men and $20,938 for women, a difference of 24.4%.
| Sex | Number | Average Earnings |
| Male | 207 (42.2%) | $27,689 |
| Female | 284 (57.8%) | $20,938 |
| Total | 491 (100.0%) | $22,583 |
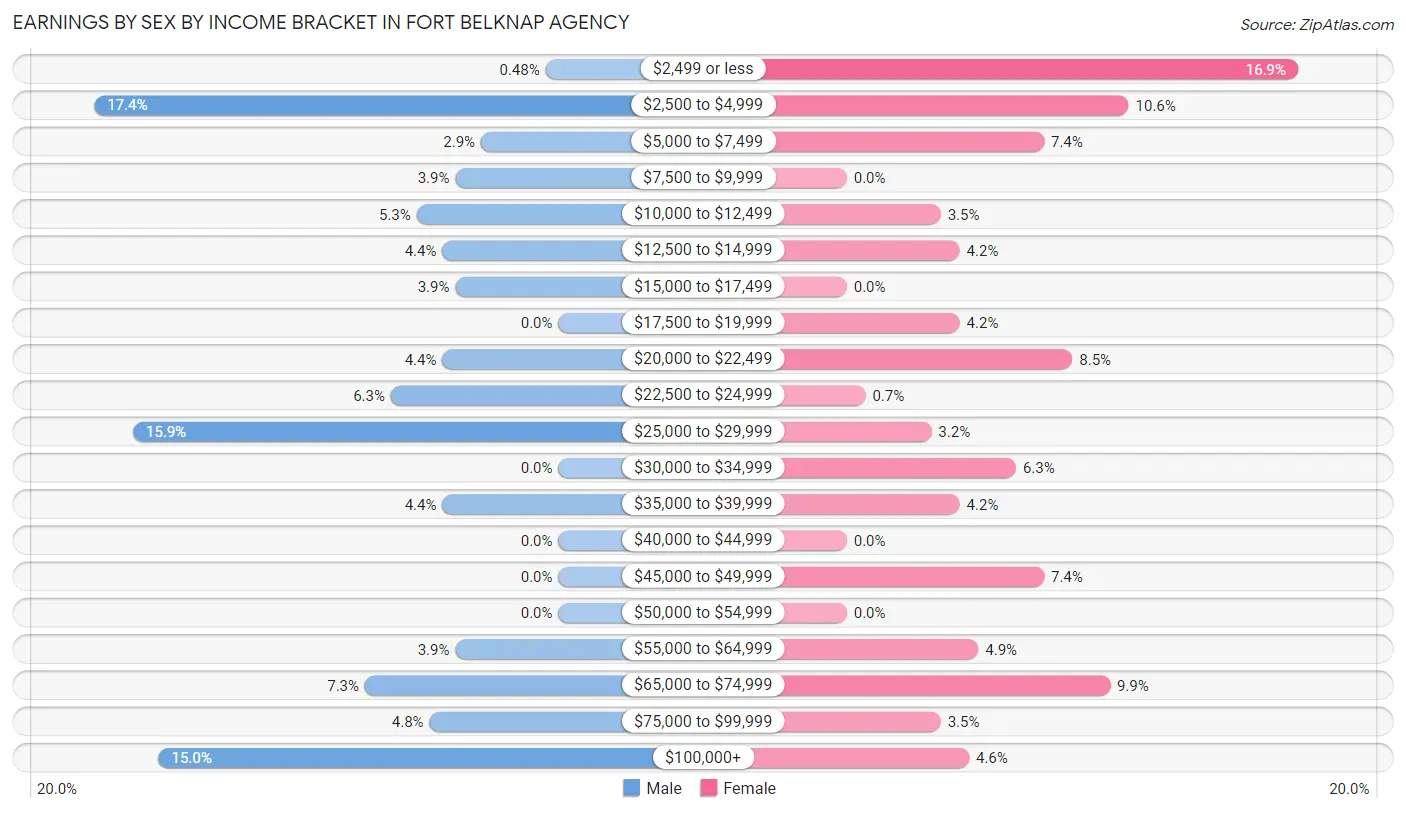
Earnings by Sex by Income Bracket in Fort Belknap Agency
The most common earnings brackets in Fort Belknap Agency are $2,500 to $4,999 for men (36 | 17.4%) and $2,499 or less for women (48 | 16.9%).
| Income | Male | Female |
| $2,499 or less | 1 (0.5%) | 48 (16.9%) |
| $2,500 to $4,999 | 36 (17.4%) | 30 (10.6%) |
| $5,000 to $7,499 | 6 (2.9%) | 21 (7.4%) |
| $7,500 to $9,999 | 8 (3.9%) | 0 (0.0%) |
| $10,000 to $12,499 | 11 (5.3%) | 10 (3.5%) |
| $12,500 to $14,999 | 9 (4.3%) | 12 (4.2%) |
| $15,000 to $17,499 | 8 (3.9%) | 0 (0.0%) |
| $17,500 to $19,999 | 0 (0.0%) | 12 (4.2%) |
| $20,000 to $22,499 | 9 (4.3%) | 24 (8.5%) |
| $22,500 to $24,999 | 13 (6.3%) | 2 (0.7%) |
| $25,000 to $29,999 | 33 (15.9%) | 9 (3.2%) |
| $30,000 to $34,999 | 0 (0.0%) | 18 (6.3%) |
| $35,000 to $39,999 | 9 (4.3%) | 12 (4.2%) |
| $40,000 to $44,999 | 0 (0.0%) | 0 (0.0%) |
| $45,000 to $49,999 | 0 (0.0%) | 21 (7.4%) |
| $50,000 to $54,999 | 0 (0.0%) | 0 (0.0%) |
| $55,000 to $64,999 | 8 (3.9%) | 14 (4.9%) |
| $65,000 to $74,999 | 15 (7.2%) | 28 (9.9%) |
| $75,000 to $99,999 | 10 (4.8%) | 10 (3.5%) |
| $100,000+ | 31 (15.0%) | 13 (4.6%) |
| Total | 207 (100.0%) | 284 (100.0%) |
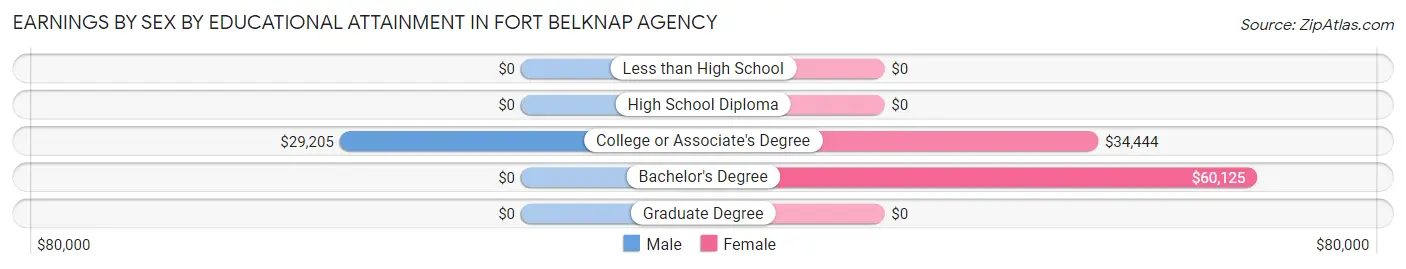
Earnings by Sex by Educational Attainment in Fort Belknap Agency
Average earnings in Fort Belknap Agency are $28,636 for men and $33,403 for women, a difference of 14.3%. Men with an educational attainment of college or associate's degree enjoy the highest average annual earnings of $29,205, while those with college or associate's degree education earn the least with $29,205. Women with an educational attainment of bachelor's degree earn the most with the average annual earnings of $60,125, while those with college or associate's degree education have the smallest earnings of $34,444.
| Educational Attainment | Male Income | Female Income |
| Less than High School | - | - |
| High School Diploma | - | - |
| College or Associate's Degree | $29,205 | $34,444 |
| Bachelor's Degree | - | - |
| Graduate Degree | - | - |
| Total | $28,636 | $33,403 |
Family Income in Fort Belknap Agency
Family Income Brackets in Fort Belknap Agency
According to the Fort Belknap Agency family income data, there are 71 families falling into the $100,000 to $149,999 income range, which is the most common income bracket and makes up 24.1% of all families.
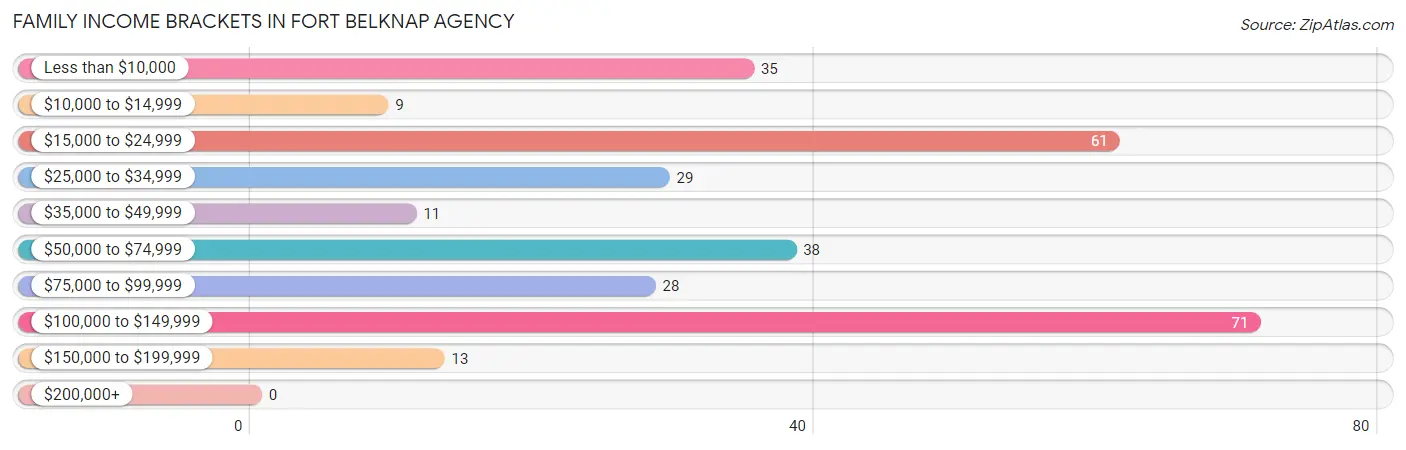
| Income Bracket | # Families | % Families |
| Less than $10,000 | 35 | 11.9% |
| $10,000 to $14,999 | 9 | 3.1% |
| $15,000 to $24,999 | 61 | 20.7% |
| $25,000 to $34,999 | 29 | 9.8% |
| $35,000 to $49,999 | 11 | 3.7% |
| $50,000 to $74,999 | 38 | 12.9% |
| $75,000 to $99,999 | 28 | 9.5% |
| $100,000 to $149,999 | 71 | 24.1% |
| $150,000 to $199,999 | 13 | 4.4% |
| $200,000+ | 0 | 0.0% |
Family Income by Famaliy Size in Fort Belknap Agency
2-person families (127 | 43.0%) account for the highest median family income in Fort Belknap Agency with $77,656 per family, while 2-person families (127 | 43.0%) have the highest median income of $38,828 per family member.
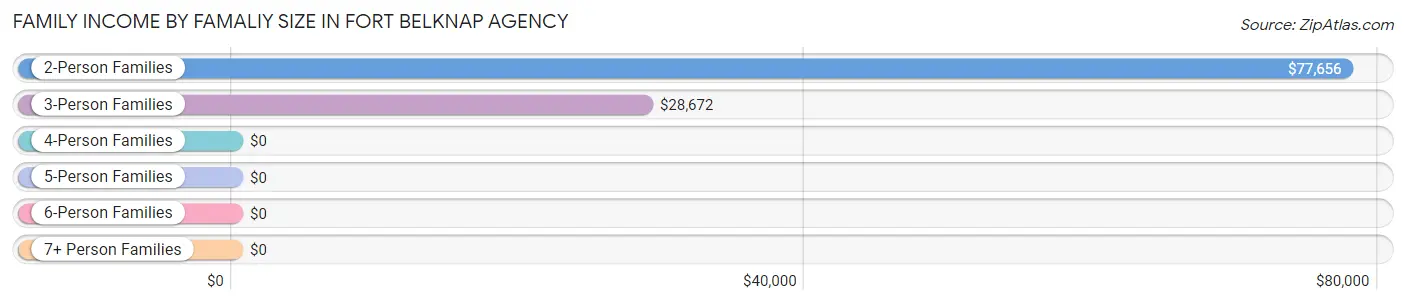
| Income Bracket | # Families | Median Income |
| 2-Person Families | 127 (43.0%) | $77,656 |
| 3-Person Families | 41 (13.9%) | $28,672 |
| 4-Person Families | 74 (25.1%) | $0 |
| 5-Person Families | 9 (3.0%) | $0 |
| 6-Person Families | 0 (0.0%) | $0 |
| 7+ Person Families | 44 (14.9%) | $0 |
| Total | 295 (100.0%) | $50,625 |
Family Income by Number of Earners in Fort Belknap Agency
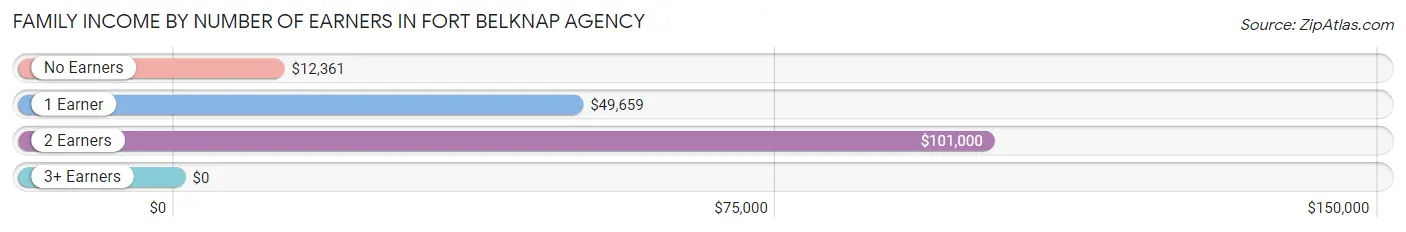
| Number of Earners | # Families | Median Income |
| No Earners | 39 (13.2%) | $12,361 |
| 1 Earner | 187 (63.4%) | $49,659 |
| 2 Earners | 50 (17.0%) | $101,000 |
| 3+ Earners | 19 (6.4%) | $0 |
| Total | 295 (100.0%) | $50,625 |
Household Income in Fort Belknap Agency
Household Income Brackets in Fort Belknap Agency
With 98 households falling in the category, the $15,000 to $24,999 income range is the most frequent in Fort Belknap Agency, accounting for 26.3% of all households.
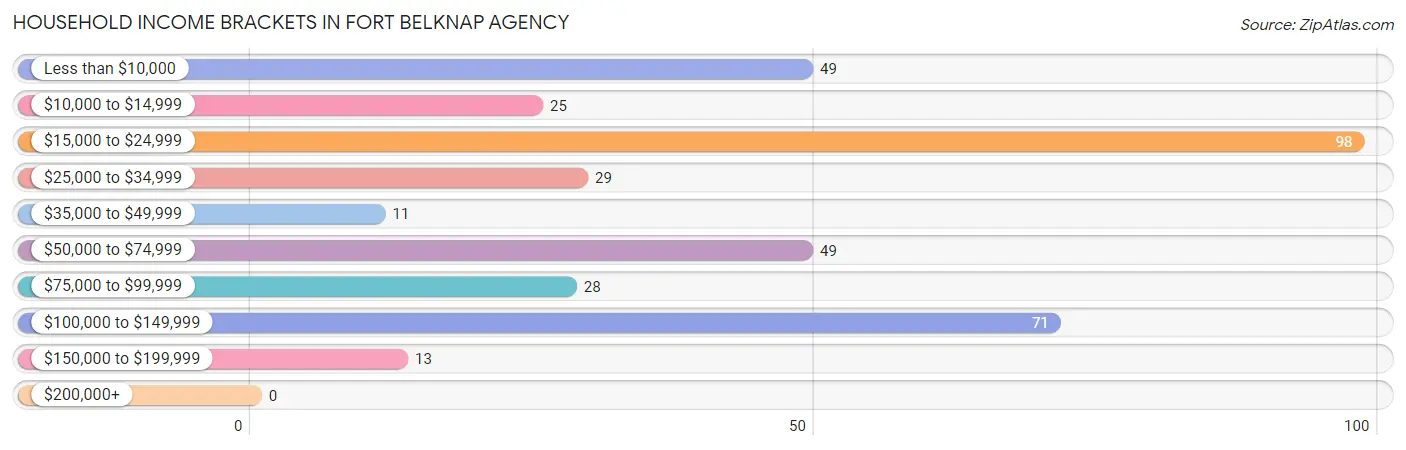
| Income Bracket | # Households | % Households |
| Less than $10,000 | 49 | 13.1% |
| $10,000 to $14,999 | 25 | 6.7% |
| $15,000 to $24,999 | 98 | 26.3% |
| $25,000 to $34,999 | 29 | 7.8% |
| $35,000 to $49,999 | 11 | 2.9% |
| $50,000 to $74,999 | 49 | 13.1% |
| $75,000 to $99,999 | 28 | 7.5% |
| $100,000 to $149,999 | 71 | 19.0% |
| $150,000 to $199,999 | 13 | 3.5% |
| $200,000+ | 0 | 0.0% |
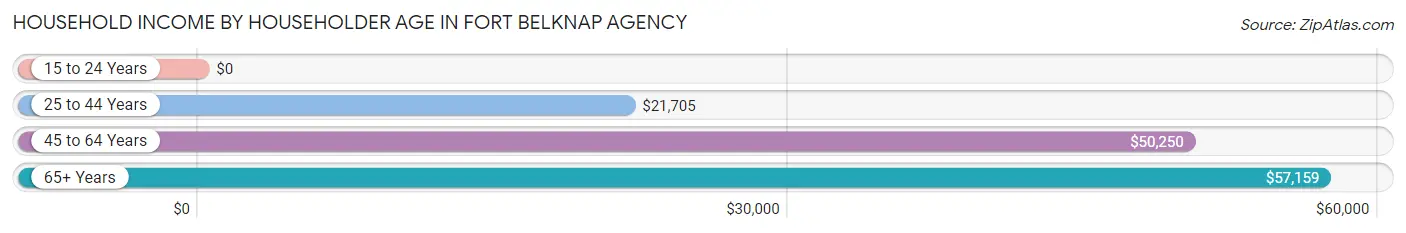
Household Income by Householder Age in Fort Belknap Agency
The median household income in Fort Belknap Agency is $29,766, with the highest median household income of $57,159 found in the 65+ years age bracket for the primary householder. A total of 129 households (34.6%) fall into this category. Meanwhile, the 15 to 24 years age bracket for the primary householder has the lowest median household income of $0, with 5 households (1.3%) in this group.
| Income Bracket | # Households | Median Income |
| 15 to 24 Years | 5 (1.3%) | $0 |
| 25 to 44 Years | 91 (24.4%) | $21,705 |
| 45 to 64 Years | 148 (39.7%) | $50,250 |
| 65+ Years | 129 (34.6%) | $57,159 |
| Total | 373 (100.0%) | $29,766 |
Poverty in Fort Belknap Agency
Income Below Poverty by Sex and Age in Fort Belknap Agency
With 32.9% poverty level for males and 35.9% for females among the residents of Fort Belknap Agency, 15 year old males and 12 to 14 year old females are the most vulnerable to poverty, with 20 males (100.0%) and 12 females (100.0%) in their respective age groups living below the poverty level.
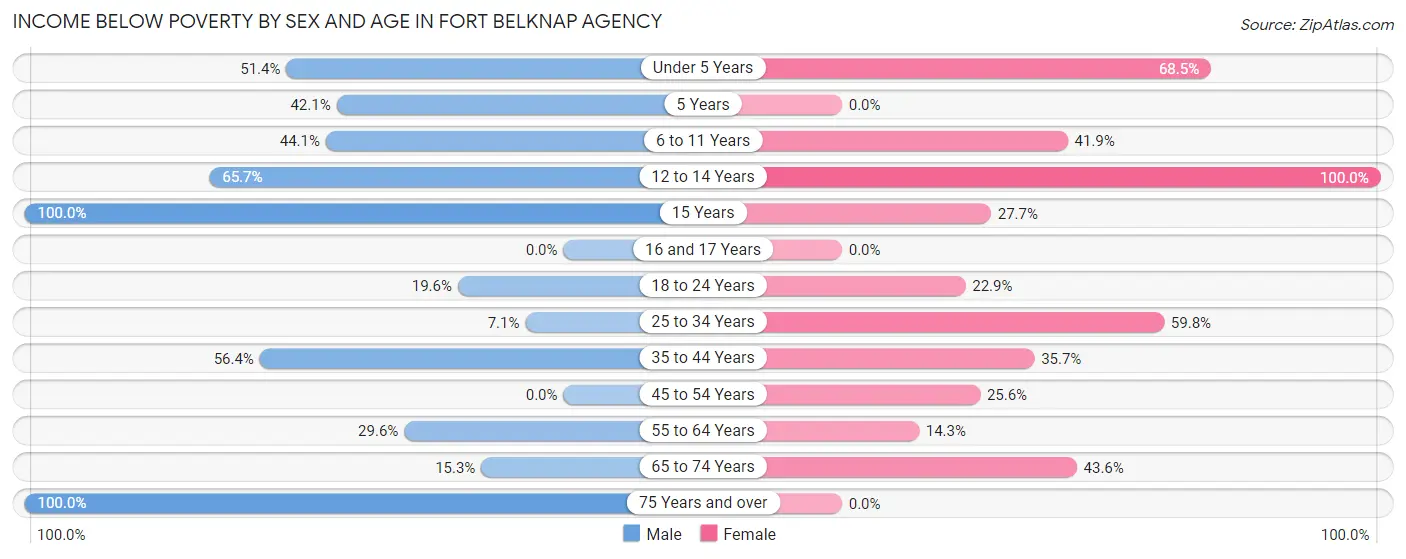
| Age Bracket | Male | Female |
| Under 5 Years | 36 (51.4%) | 37 (68.5%) |
| 5 Years | 24 (42.1%) | 0 (0.0%) |
| 6 to 11 Years | 56 (44.1%) | 44 (41.9%) |
| 12 to 14 Years | 23 (65.7%) | 12 (100.0%) |
| 15 Years | 20 (100.0%) | 13 (27.7%) |
| 16 and 17 Years | 0 (0.0%) | 0 (0.0%) |
| 18 to 24 Years | 19 (19.6%) | 22 (22.9%) |
| 25 to 34 Years | 6 (7.1%) | 58 (59.8%) |
| 35 to 44 Years | 31 (56.4%) | 20 (35.7%) |
| 45 to 54 Years | 0 (0.0%) | 10 (25.6%) |
| 55 to 64 Years | 13 (29.5%) | 15 (14.3%) |
| 65 to 74 Years | 9 (15.2%) | 17 (43.6%) |
| 75 Years and over | 6 (100.0%) | 0 (0.0%) |
| Total | 243 (32.9%) | 248 (35.9%) |
Income Above Poverty by Sex and Age in Fort Belknap Agency
According to the poverty statistics in Fort Belknap Agency, males aged 16 and 17 years and females aged 16 and 17 years are the age groups that are most secure financially, with 100.0% of males and 100.0% of females in these age groups living above the poverty line.
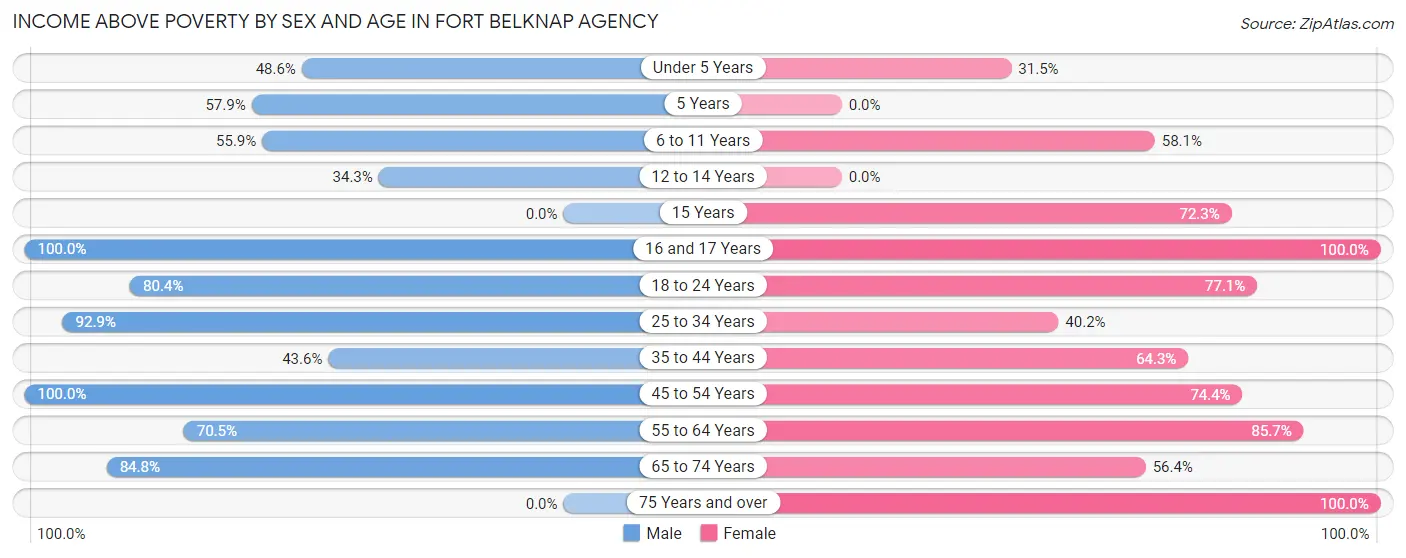
| Age Bracket | Male | Female |
| Under 5 Years | 34 (48.6%) | 17 (31.5%) |
| 5 Years | 33 (57.9%) | 0 (0.0%) |
| 6 to 11 Years | 71 (55.9%) | 61 (58.1%) |
| 12 to 14 Years | 12 (34.3%) | 0 (0.0%) |
| 15 Years | 0 (0.0%) | 34 (72.3%) |
| 16 and 17 Years | 41 (100.0%) | 5 (100.0%) |
| 18 to 24 Years | 78 (80.4%) | 74 (77.1%) |
| 25 to 34 Years | 79 (92.9%) | 39 (40.2%) |
| 35 to 44 Years | 24 (43.6%) | 36 (64.3%) |
| 45 to 54 Years | 43 (100.0%) | 29 (74.4%) |
| 55 to 64 Years | 31 (70.5%) | 90 (85.7%) |
| 65 to 74 Years | 50 (84.8%) | 22 (56.4%) |
| 75 Years and over | 0 (0.0%) | 35 (100.0%) |
| Total | 496 (67.1%) | 442 (64.1%) |
Income Below Poverty Among Married-Couple Families in Fort Belknap Agency
The poverty statistics for married-couple families in Fort Belknap Agency show that 12.6% or 11 of the total 87 families live below the poverty line. Families with 5 or more children have the highest poverty rate of 50.0%, comprising of 11 families. On the other hand, families with no children have the lowest poverty rate of 0.0%, which includes 0 families.
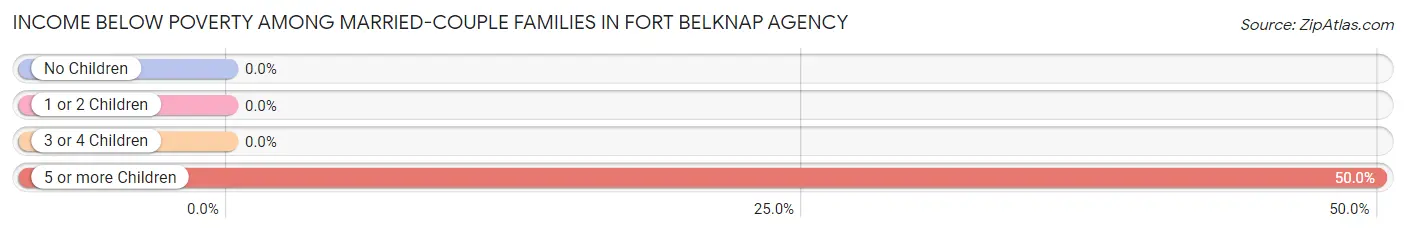
| Children | Above Poverty | Below Poverty |
| No Children | 39 (100.0%) | 0 (0.0%) |
| 1 or 2 Children | 16 (100.0%) | 0 (0.0%) |
| 3 or 4 Children | 10 (100.0%) | 0 (0.0%) |
| 5 or more Children | 11 (50.0%) | 11 (50.0%) |
| Total | 76 (87.4%) | 11 (12.6%) |
Income Below Poverty Among Single-Parent Households in Fort Belknap Agency
According to the poverty data in Fort Belknap Agency, 57.1% or 28 single-father households and 34.6% or 55 single-mother households are living below the poverty line. Among single-father households, those with no children have the highest poverty rate, with 9 households (100.0%) experiencing poverty. Likewise, among single-mother households, those with 3 or 4 children have the highest poverty rate, with 19 households (59.4%) falling below the poverty line.
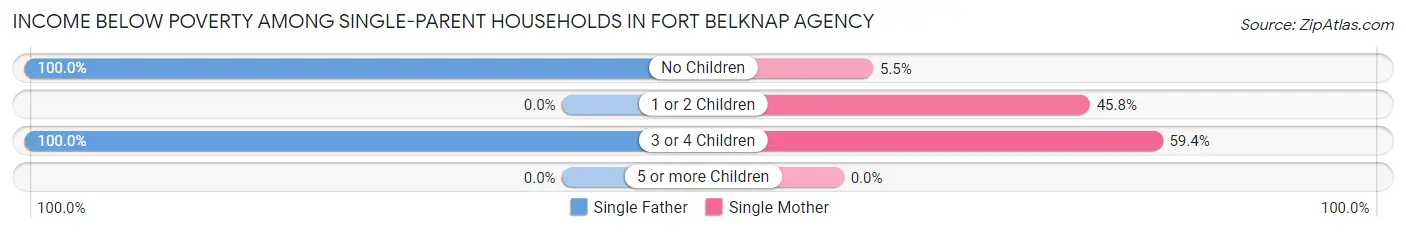
| Children | Single Father | Single Mother |
| No Children | 9 (100.0%) | 3 (5.4%) |
| 1 or 2 Children | 0 (0.0%) | 33 (45.8%) |
| 3 or 4 Children | 19 (100.0%) | 19 (59.4%) |
| 5 or more Children | 0 (0.0%) | 0 (0.0%) |
| Total | 28 (57.1%) | 55 (34.6%) |
Income Below Poverty Among Married-Couple vs Single-Parent Households in Fort Belknap Agency
The poverty data for Fort Belknap Agency shows that 11 of the married-couple family households (12.6%) and 83 of the single-parent households (39.9%) are living below the poverty level. Within the married-couple family households, those with 5 or more children have the highest poverty rate, with 11 households (50.0%) falling below the poverty line. Among the single-parent households, those with 3 or 4 children have the highest poverty rate, with 38 household (74.5%) living below poverty.
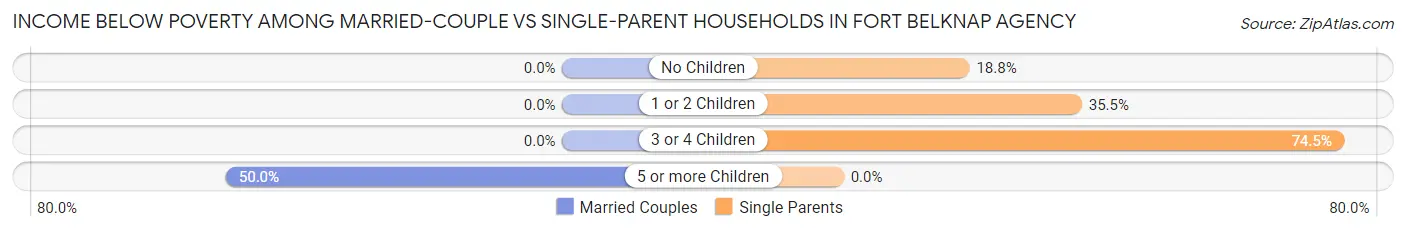
| Children | Married-Couple Families | Single-Parent Households |
| No Children | 0 (0.0%) | 12 (18.8%) |
| 1 or 2 Children | 0 (0.0%) | 33 (35.5%) |
| 3 or 4 Children | 0 (0.0%) | 38 (74.5%) |
| 5 or more Children | 11 (50.0%) | 0 (0.0%) |
| Total | 11 (12.6%) | 83 (39.9%) |
Race in Fort Belknap Agency
The most populous races in Fort Belknap Agency are Native / Alaskan (1,421 | 96.5%), Two or more Races (30 | 2.0%), and White / Caucasian (22 | 1.5%).
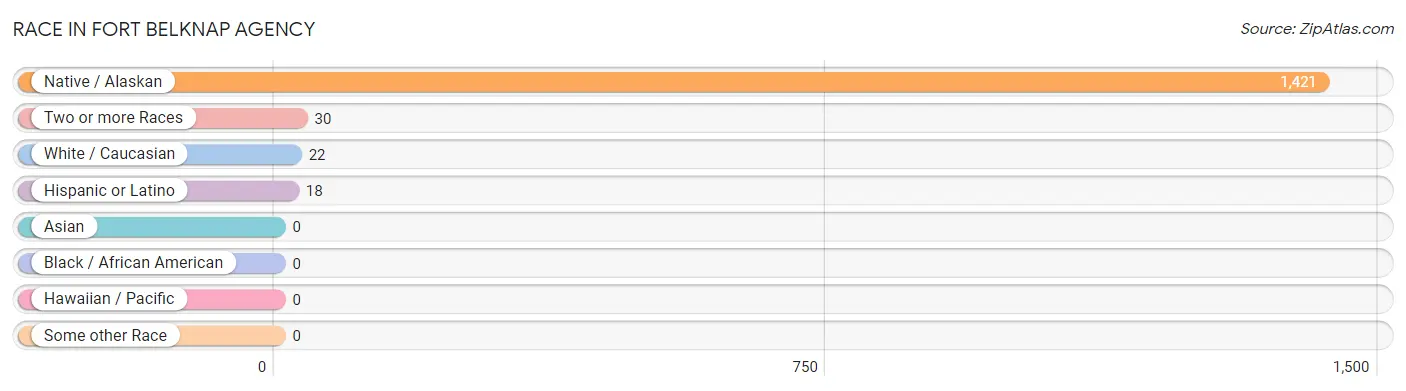
| Race | # Population | % Population |
| Asian | 0 | 0.0% |
| Black / African American | 0 | 0.0% |
| Hawaiian / Pacific | 0 | 0.0% |
| Hispanic or Latino | 18 | 1.2% |
| Native / Alaskan | 1,421 | 96.5% |
| White / Caucasian | 22 | 1.5% |
| Two or more Races | 30 | 2.0% |
| Some other Race | 0 | 0.0% |
| Total | 1,473 | 100.0% |
Ancestry in Fort Belknap Agency
The most populous ancestries reported in Fort Belknap Agency are Sioux (132 | 9.0%), Crow (18 | 1.2%), Central American (16 | 1.1%), Guatemalan (16 | 1.1%), and German (12 | 0.8%), together accounting for 13.2% of all Fort Belknap Agency residents.
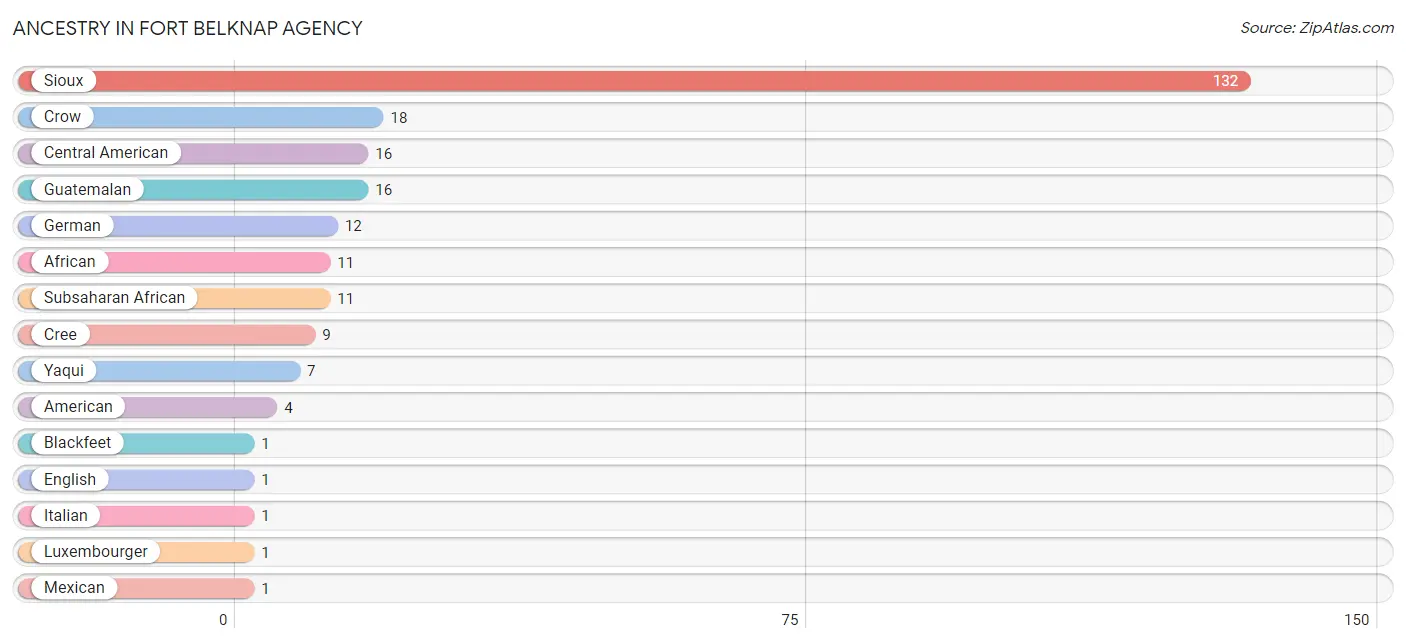
| Ancestry | # Population | % Population |
| African | 11 | 0.7% |
| American | 4 | 0.3% |
| Blackfeet | 1 | 0.1% |
| Central American | 16 | 1.1% |
| Cree | 9 | 0.6% |
| Crow | 18 | 1.2% |
| English | 1 | 0.1% |
| German | 12 | 0.8% |
| Guatemalan | 16 | 1.1% |
| Italian | 1 | 0.1% |
| Luxembourger | 1 | 0.1% |
| Mexican | 1 | 0.1% |
| Norwegian | 1 | 0.1% |
| Sioux | 132 | 9.0% |
| Spanish | 1 | 0.1% |
| Subsaharan African | 11 | 0.7% |
| Yaqui | 7 | 0.5% | View All 17 Rows |
Immigrants in Fort Belknap Agency

| Immigration Origin | # Population | % Population | View All 0 Rows |
Sex and Age in Fort Belknap Agency
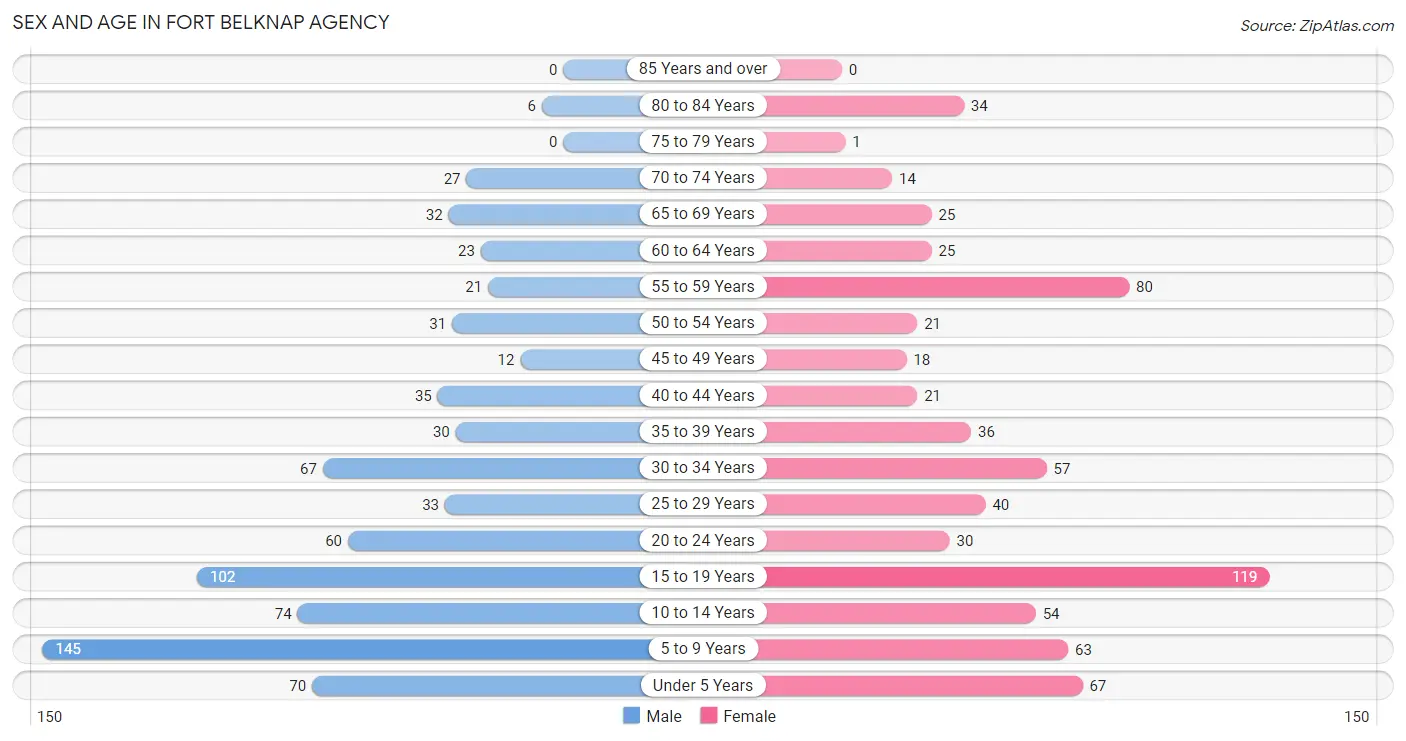
Sex and Age in Fort Belknap Agency
The most populous age groups in Fort Belknap Agency are 5 to 9 Years (145 | 18.9%) for men and 15 to 19 Years (119 | 16.9%) for women.
| Age Bracket | Male | Female |
| Under 5 Years | 70 (9.1%) | 67 (9.5%) |
| 5 to 9 Years | 145 (18.9%) | 63 (8.9%) |
| 10 to 14 Years | 74 (9.6%) | 54 (7.7%) |
| 15 to 19 Years | 102 (13.3%) | 119 (16.9%) |
| 20 to 24 Years | 60 (7.8%) | 30 (4.3%) |
| 25 to 29 Years | 33 (4.3%) | 40 (5.7%) |
| 30 to 34 Years | 67 (8.7%) | 57 (8.1%) |
| 35 to 39 Years | 30 (3.9%) | 36 (5.1%) |
| 40 to 44 Years | 35 (4.6%) | 21 (3.0%) |
| 45 to 49 Years | 12 (1.6%) | 18 (2.5%) |
| 50 to 54 Years | 31 (4.0%) | 21 (3.0%) |
| 55 to 59 Years | 21 (2.7%) | 80 (11.4%) |
| 60 to 64 Years | 23 (3.0%) | 25 (3.5%) |
| 65 to 69 Years | 32 (4.2%) | 25 (3.5%) |
| 70 to 74 Years | 27 (3.5%) | 14 (2.0%) |
| 75 to 79 Years | 0 (0.0%) | 1 (0.1%) |
| 80 to 84 Years | 6 (0.8%) | 34 (4.8%) |
| 85 Years and over | 0 (0.0%) | 0 (0.0%) |
| Total | 768 (100.0%) | 705 (100.0%) |
Families and Households in Fort Belknap Agency
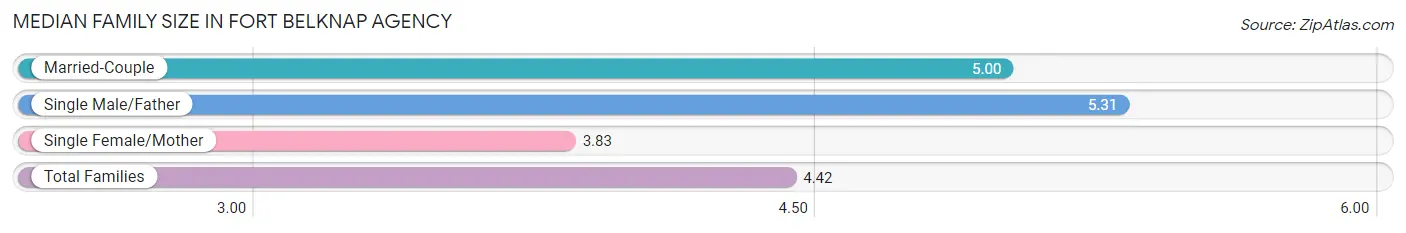
Median Family Size in Fort Belknap Agency
The median family size in Fort Belknap Agency is 4.42 persons per family, with single male/father families (49 | 16.6%) accounting for the largest median family size of 5.31 persons per family. On the other hand, single female/mother families (159 | 53.9%) represent the smallest median family size with 3.83 persons per family.
| Family Type | # Families | Family Size |
| Married-Couple | 87 (29.5%) | 5.00 |
| Single Male/Father | 49 (16.6%) | 5.31 |
| Single Female/Mother | 159 (53.9%) | 3.83 |
| Total Families | 295 (100.0%) | 4.42 |
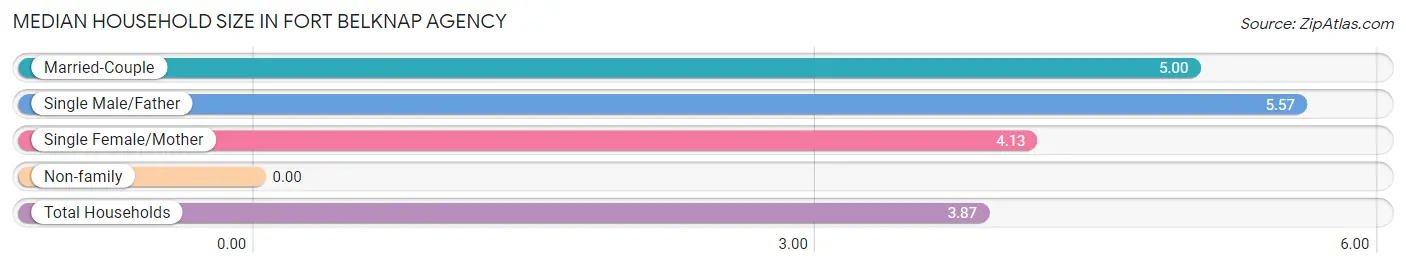
Median Household Size in Fort Belknap Agency
| Household Type | # Households | Household Size |
| Married-Couple | 87 (23.3%) | 5.00 |
| Single Male/Father | 49 (13.1%) | 5.57 |
| Single Female/Mother | 159 (42.6%) | 4.13 |
| Non-family | 78 (20.9%) | - |
| Total Households | 373 (100.0%) | 3.87 |
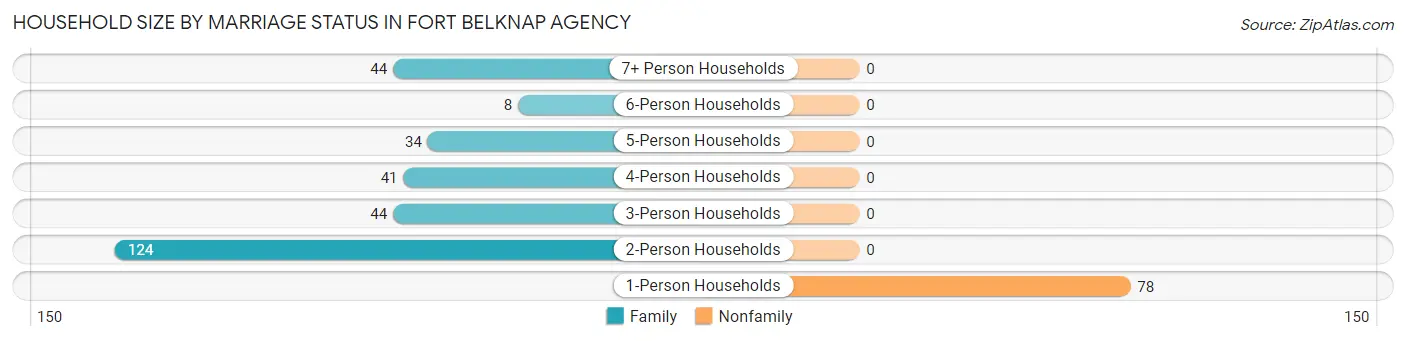
Household Size by Marriage Status in Fort Belknap Agency
Out of a total of 373 households in Fort Belknap Agency, 295 (79.1%) are family households, while 78 (20.9%) are nonfamily households. The most numerous type of family households are 2-person households, comprising 124, and the most common type of nonfamily households are 1-person households, comprising 78.
| Household Size | Family Households | Nonfamily Households |
| 1-Person Households | - | 78 (20.9%) |
| 2-Person Households | 124 (33.2%) | 0 (0.0%) |
| 3-Person Households | 44 (11.8%) | 0 (0.0%) |
| 4-Person Households | 41 (11.0%) | 0 (0.0%) |
| 5-Person Households | 34 (9.1%) | 0 (0.0%) |
| 6-Person Households | 8 (2.1%) | 0 (0.0%) |
| 7+ Person Households | 44 (11.8%) | 0 (0.0%) |
| Total | 295 (79.1%) | 78 (20.9%) |
Female Fertility in Fort Belknap Agency
Fertility by Age in Fort Belknap Agency
Average fertility rate in Fort Belknap Agency is 93.0 births per 1,000 women. Women in the age bracket of 20 to 34 years have the highest fertility rate with 236.0 births per 1,000 women. Women in the age bracket of 20 to 34 years acount for 100.0% of all women with births.
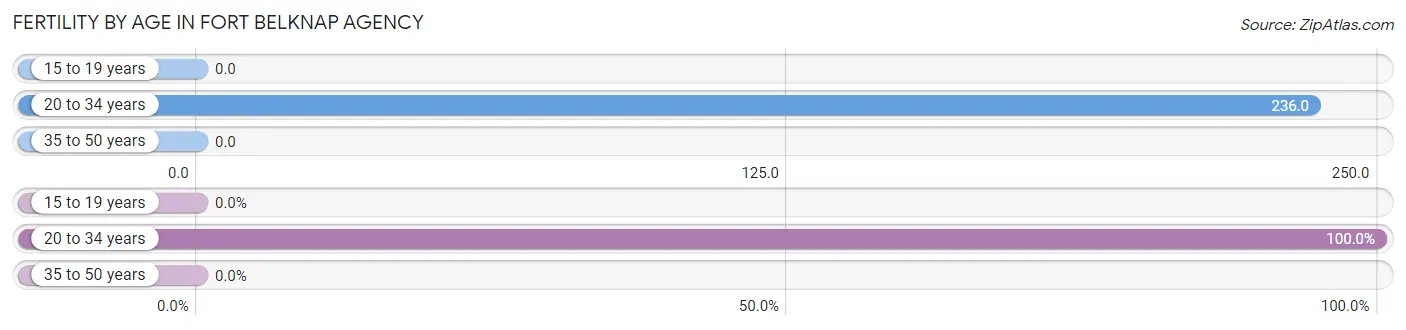
| Age Bracket | Women with Births | Births / 1,000 Women |
| 15 to 19 years | 0 (0.0%) | 0.0 |
| 20 to 34 years | 30 (100.0%) | 236.0 |
| 35 to 50 years | 0 (0.0%) | 0.0 |
| Total | 30 (100.0%) | 93.0 |
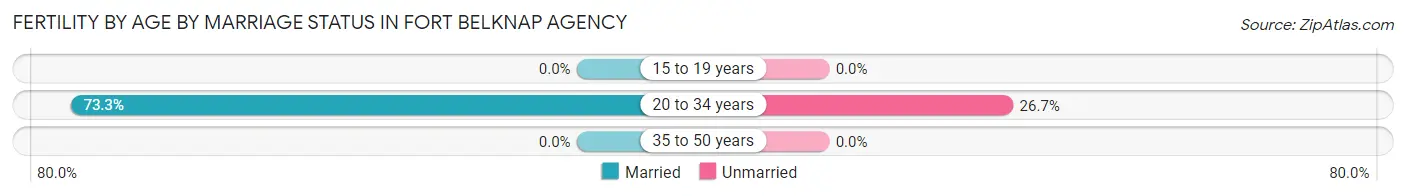
Fertility by Age by Marriage Status in Fort Belknap Agency
73.3% of women with births (30) in Fort Belknap Agency are married. The highest percentage of unmarried women with births falls into 20 to 34 years age bracket with 26.7% of them unmarried at the time of birth, while the lowest percentage of unmarried women with births belong to 20 to 34 years age bracket with 26.7% of them unmarried.
| Age Bracket | Married | Unmarried |
| 15 to 19 years | 0 (0.0%) | 0 (0.0%) |
| 20 to 34 years | 22 (73.3%) | 8 (26.7%) |
| 35 to 50 years | 0 (0.0%) | 0 (0.0%) |
| Total | 22 (73.3%) | 8 (26.7%) |
Fertility by Education in Fort Belknap Agency
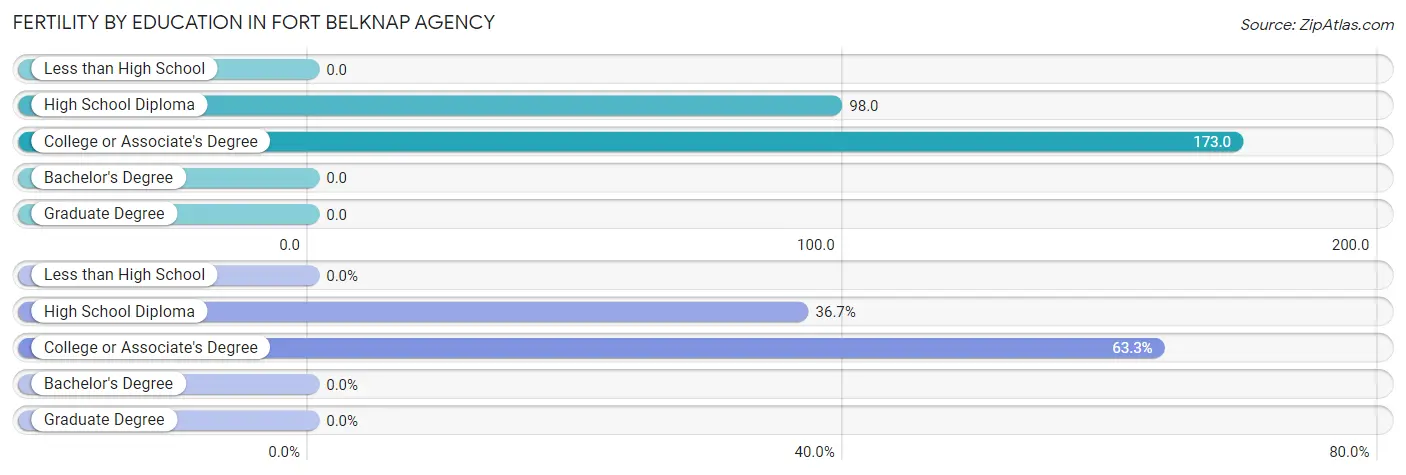
| Educational Attainment | Women with Births | Births / 1,000 Women |
| Less than High School | 0 (0.0%) | 0.0 |
| High School Diploma | 11 (36.7%) | 98.0 |
| College or Associate's Degree | 19 (63.3%) | 173.0 |
| Bachelor's Degree | 0 (0.0%) | 0.0 |
| Graduate Degree | 0 (0.0%) | 0.0 |
| Total | 30 (100.0%) | 93.0 |
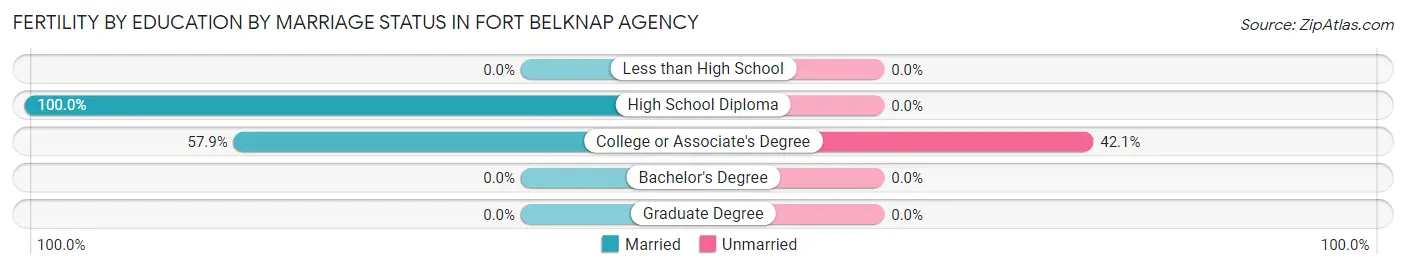
Fertility by Education by Marriage Status in Fort Belknap Agency
26.7% of women with births in Fort Belknap Agency are unmarried. Women with the educational attainment of high school diploma are most likely to be married with 100.0% of them married at childbirth, while women with the educational attainment of college or associate's degree are least likely to be married with 42.1% of them unmarried at childbirth.
| Educational Attainment | Married | Unmarried |
| Less than High School | 0 (0.0%) | 0 (0.0%) |
| High School Diploma | 11 (100.0%) | 0 (0.0%) |
| College or Associate's Degree | 11 (57.9%) | 8 (42.1%) |
| Bachelor's Degree | 0 (0.0%) | 0 (0.0%) |
| Graduate Degree | 0 (0.0%) | 0 (0.0%) |
| Total | 22 (73.3%) | 8 (26.7%) |
Employment Characteristics in Fort Belknap Agency
Employment by Class of Employer in Fort Belknap Agency
Among the 234 employed individuals in Fort Belknap Agency, local government employees (113 | 48.3%), private company employees (48 | 20.5%), and federal government employees (45 | 19.2%) make up the most common classes of employment.
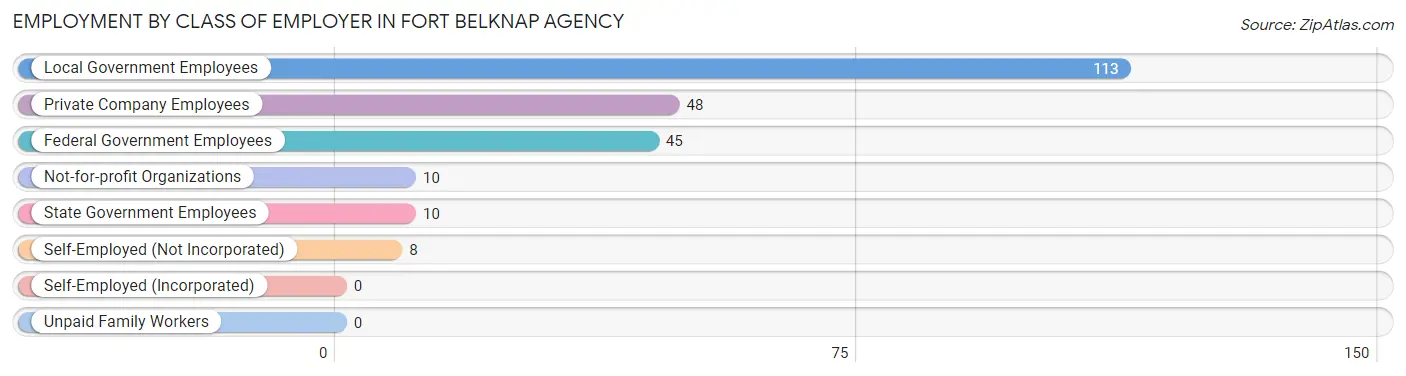
| Employer Class | # Employees | % Employees |
| Private Company Employees | 48 | 20.5% |
| Self-Employed (Incorporated) | 0 | 0.0% |
| Self-Employed (Not Incorporated) | 8 | 3.4% |
| Not-for-profit Organizations | 10 | 4.3% |
| Local Government Employees | 113 | 48.3% |
| State Government Employees | 10 | 4.3% |
| Federal Government Employees | 45 | 19.2% |
| Unpaid Family Workers | 0 | 0.0% |
| Total | 234 | 100.0% |
Employment Status by Age in Fort Belknap Agency
According to the labor force statistics for Fort Belknap Agency, out of the total population over 16 years of age (933), 46.9% or 438 individuals are in the labor force, with 36.3% or 159 of them unemployed. The age group with the highest labor force participation rate is 60 to 64 years, with 64.6% or 31 individuals in the labor force. Within the labor force, the 25 to 29 years age range has the highest percentage of unemployed individuals, with 82.2% or 37 of them being unemployed.
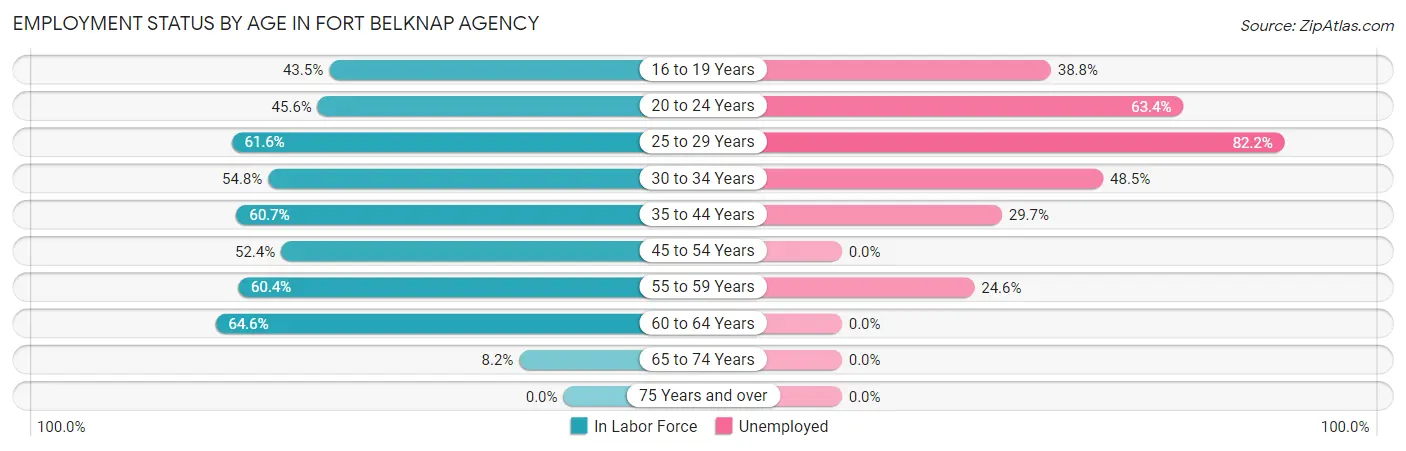
| Age Bracket | In Labor Force | Unemployed |
| 16 to 19 Years | 67 (43.5%) | 26 (38.8%) |
| 20 to 24 Years | 41 (45.6%) | 26 (63.4%) |
| 25 to 29 Years | 45 (61.6%) | 37 (82.2%) |
| 30 to 34 Years | 68 (54.8%) | 33 (48.5%) |
| 35 to 44 Years | 74 (60.7%) | 22 (29.7%) |
| 45 to 54 Years | 43 (52.4%) | 0 (0.0%) |
| 55 to 59 Years | 61 (60.4%) | 15 (24.6%) |
| 60 to 64 Years | 31 (64.6%) | 0 (0.0%) |
| 65 to 74 Years | 8 (8.2%) | 0 (0.0%) |
| 75 Years and over | 0 (0.0%) | 0 (0.0%) |
| Total | 438 (46.9%) | 159 (36.3%) |
Employment Status by Educational Attainment in Fort Belknap Agency
According to labor force statistics for Fort Belknap Agency, 58.5% of individuals (322) out of the total population between 25 and 64 years of age (550) are in the labor force, with 33.2% or 107 of them being unemployed. The group with the highest labor force participation rate are those with the educational attainment of bachelor's degree or higher, with 100.0% or 46 individuals in the labor force. Within the labor force, individuals with college / associate degree education have the highest percentage of unemployment, with 41.3% or 66 of them being unemployed.
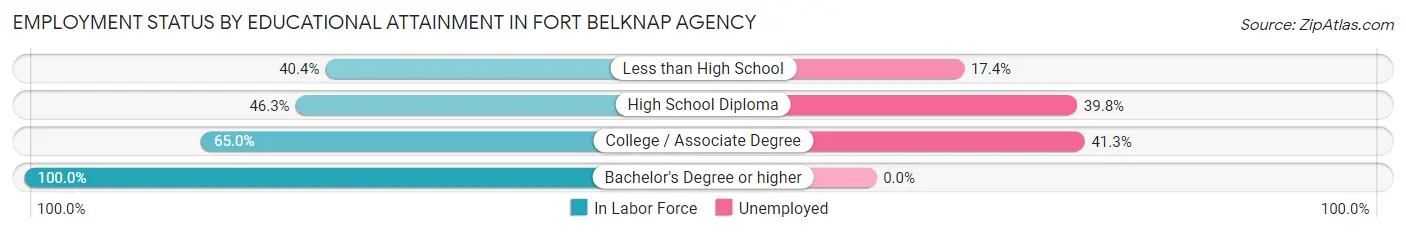
| Educational Attainment | In Labor Force | Unemployed |
| Less than High School | 23 (40.4%) | 10 (17.4%) |
| High School Diploma | 93 (46.3%) | 80 (39.8%) |
| College / Associate Degree | 160 (65.0%) | 102 (41.3%) |
| Bachelor's Degree or higher | 46 (100.0%) | 0 (0.0%) |
| Total | 322 (58.5%) | 183 (33.2%) |
Employment Occupations by Sex in Fort Belknap Agency
Management, Business, Science and Arts Occupations
The most common Management, Business, Science and Arts occupations in Fort Belknap Agency are Management (82 | 29.4%), Computers, Engineering & Science (32 | 11.5%), Architecture & Engineering (32 | 11.5%), Business & Financial (28 | 10.0%), and Community & Social Service (20 | 7.2%).
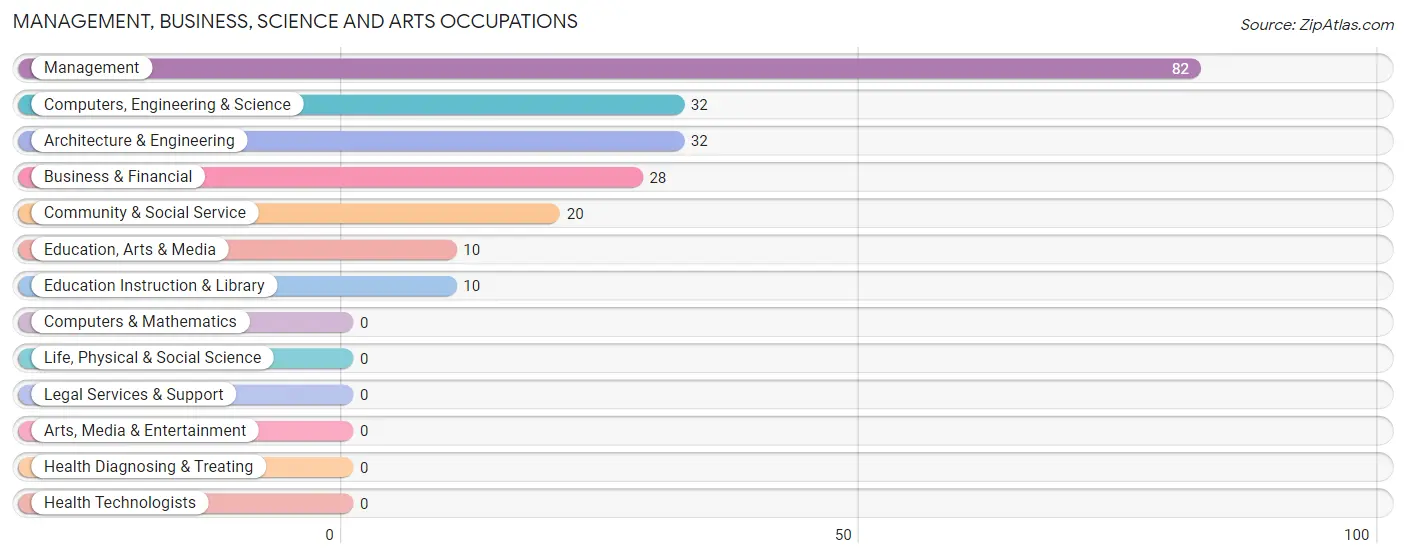
Management, Business, Science and Arts Occupations by Sex
Within the Management, Business, Science and Arts occupations in Fort Belknap Agency, the most male-oriented occupations are Management (59.8%), and Business & Financial (32.1%), while the most female-oriented occupations are Computers, Engineering & Science (100.0%), Architecture & Engineering (100.0%), and Community & Social Service (100.0%).
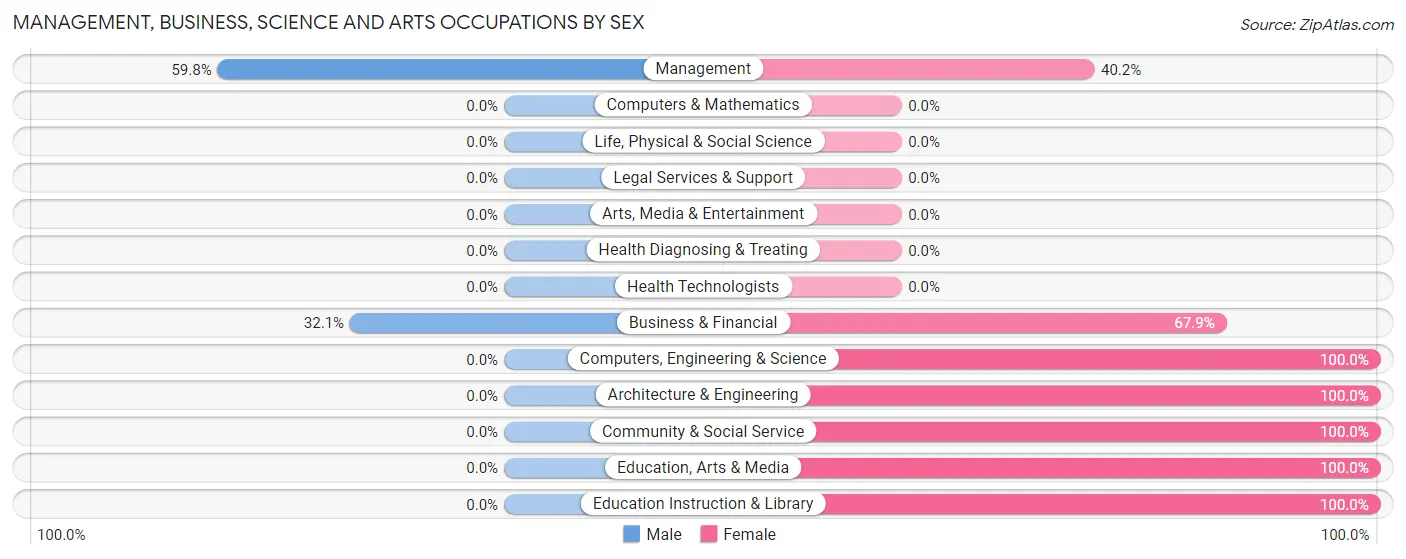
| Occupation | Male | Female |
| Management | 49 (59.8%) | 33 (40.2%) |
| Business & Financial | 9 (32.1%) | 19 (67.9%) |
| Computers, Engineering & Science | 0 (0.0%) | 32 (100.0%) |
| Computers & Mathematics | 0 (0.0%) | 0 (0.0%) |
| Architecture & Engineering | 0 (0.0%) | 32 (100.0%) |
| Life, Physical & Social Science | 0 (0.0%) | 0 (0.0%) |
| Community & Social Service | 0 (0.0%) | 20 (100.0%) |
| Education, Arts & Media | 0 (0.0%) | 10 (100.0%) |
| Legal Services & Support | 0 (0.0%) | 0 (0.0%) |
| Education Instruction & Library | 0 (0.0%) | 10 (100.0%) |
| Arts, Media & Entertainment | 0 (0.0%) | 0 (0.0%) |
| Health Diagnosing & Treating | 0 (0.0%) | 0 (0.0%) |
| Health Technologists | 0 (0.0%) | 0 (0.0%) |
| Total (Category) | 58 (35.8%) | 104 (64.2%) |
| Total (Overall) | 128 (45.9%) | 151 (54.1%) |
Services Occupations
The most common Services occupations in Fort Belknap Agency are , and Healthcare Support (2 | 0.7%).
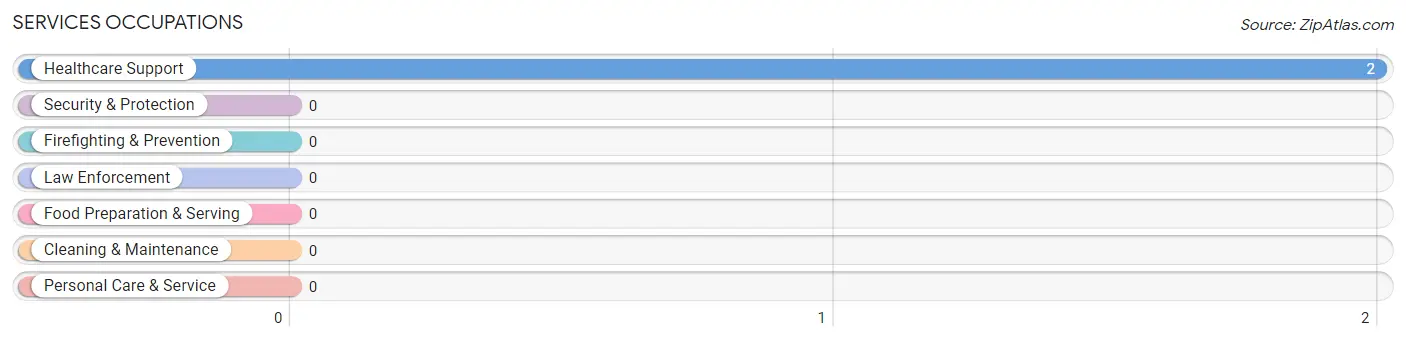
Services Occupations by Sex
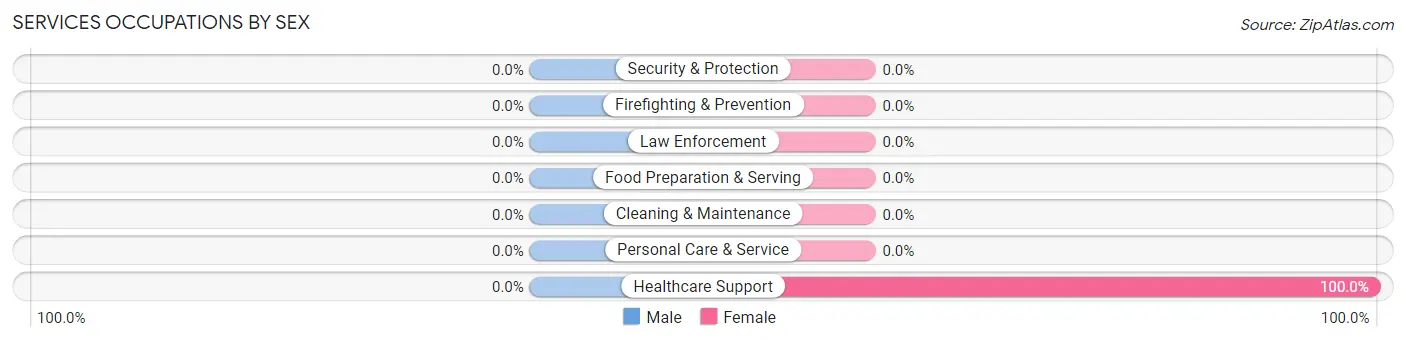
| Occupation | Male | Female |
| Healthcare Support | 0 (0.0%) | 2 (100.0%) |
| Security & Protection | 0 (0.0%) | 0 (0.0%) |
| Firefighting & Prevention | 0 (0.0%) | 0 (0.0%) |
| Law Enforcement | 0 (0.0%) | 0 (0.0%) |
| Food Preparation & Serving | 0 (0.0%) | 0 (0.0%) |
| Cleaning & Maintenance | 0 (0.0%) | 0 (0.0%) |
| Personal Care & Service | 0 (0.0%) | 0 (0.0%) |
| Total (Category) | 0 (0.0%) | 2 (100.0%) |
| Total (Overall) | 128 (45.9%) | 151 (54.1%) |
Sales and Office Occupations
The most common Sales and Office occupations in Fort Belknap Agency are Office & Administration (74 | 26.5%), and Sales & Related (21 | 7.5%).
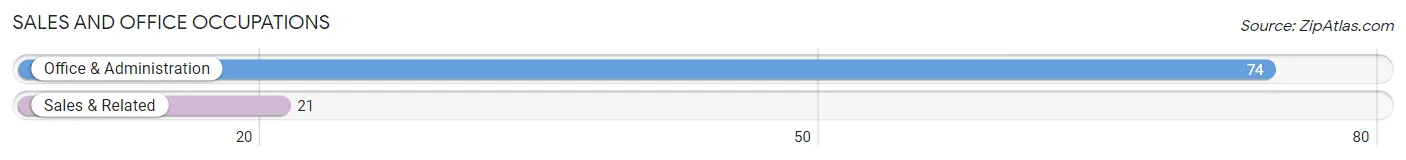
Sales and Office Occupations by Sex
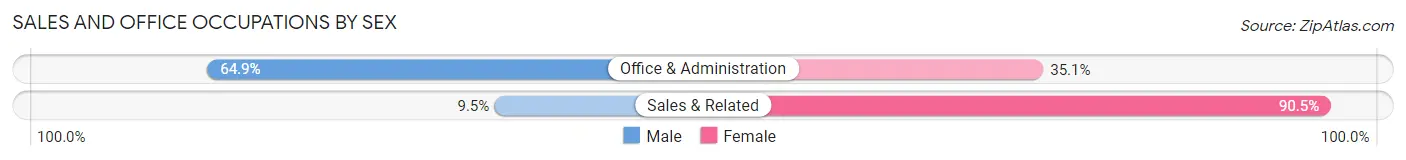
| Occupation | Male | Female |
| Sales & Related | 2 (9.5%) | 19 (90.5%) |
| Office & Administration | 48 (64.9%) | 26 (35.1%) |
| Total (Category) | 50 (52.6%) | 45 (47.4%) |
| Total (Overall) | 128 (45.9%) | 151 (54.1%) |
Natural Resources, Construction and Maintenance Occupations
The most common Natural Resources, Construction and Maintenance occupations in Fort Belknap Agency are , and Construction & Extraction (20 | 7.2%).
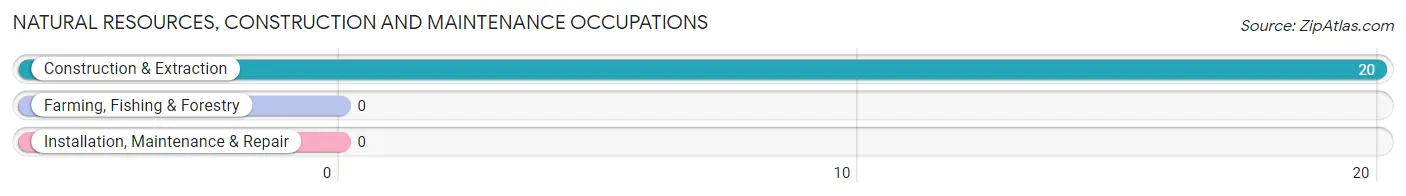
Natural Resources, Construction and Maintenance Occupations by Sex
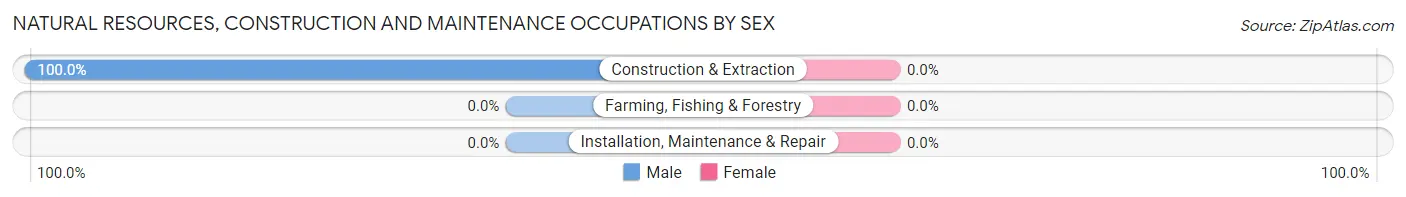
| Occupation | Male | Female |
| Farming, Fishing & Forestry | 0 (0.0%) | 0 (0.0%) |
| Construction & Extraction | 20 (100.0%) | 0 (0.0%) |
| Installation, Maintenance & Repair | 0 (0.0%) | 0 (0.0%) |
| Total (Category) | 20 (100.0%) | 0 (0.0%) |
| Total (Overall) | 128 (45.9%) | 151 (54.1%) |
Production, Transportation and Moving Occupations
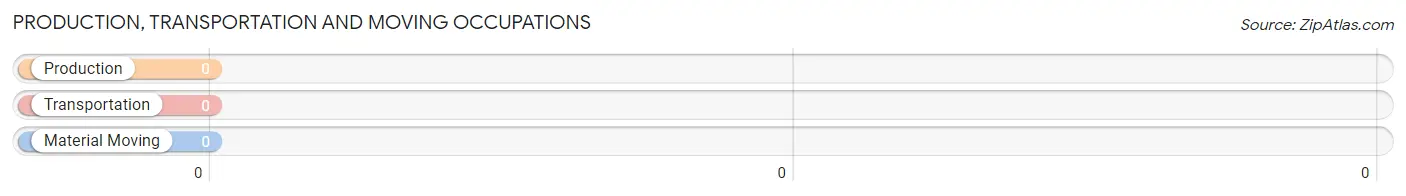
Production, Transportation and Moving Occupations by Sex
| Occupation | Male | Female |
| Production | 0 (0.0%) | 0 (0.0%) |
| Transportation | 0 (0.0%) | 0 (0.0%) |
| Material Moving | 0 (0.0%) | 0 (0.0%) |
| Total (Category) | 0 (0.0%) | 0 (0.0%) |
| Total (Overall) | 128 (45.9%) | 151 (54.1%) |
Employment Industries by Sex in Fort Belknap Agency
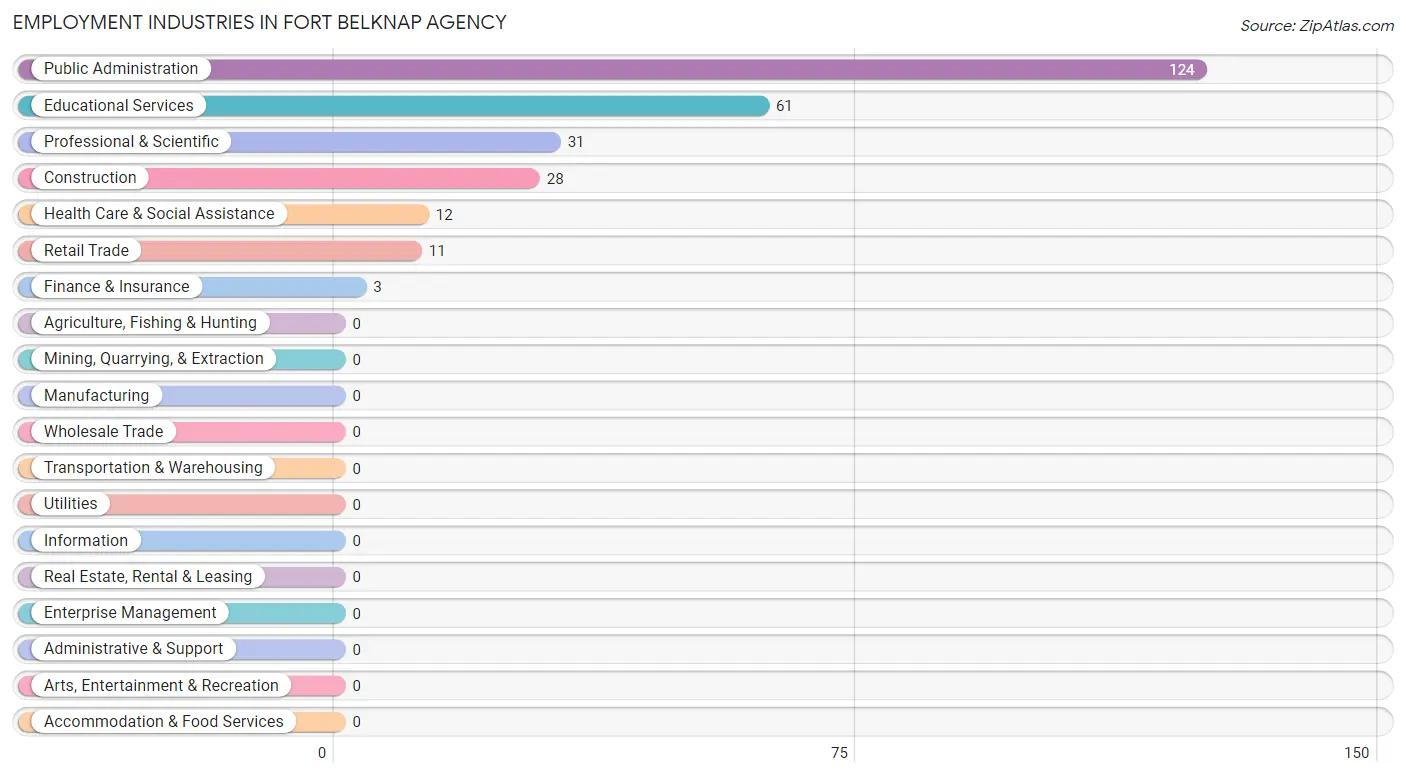
Employment Industries in Fort Belknap Agency
The major employment industries in Fort Belknap Agency include Public Administration (124 | 44.4%), Educational Services (61 | 21.9%), Professional & Scientific (31 | 11.1%), Construction (28 | 10.0%), and Health Care & Social Assistance (12 | 4.3%).
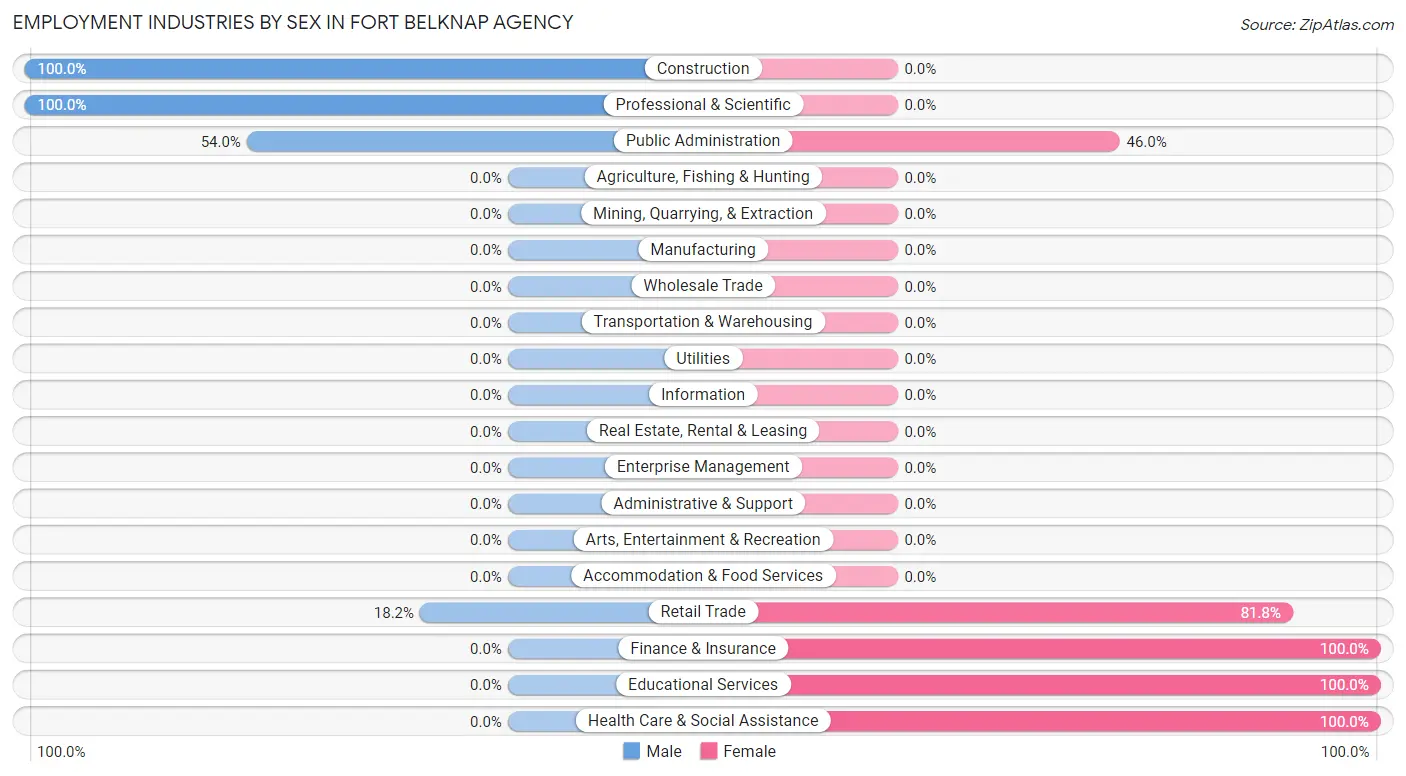
Employment Industries by Sex in Fort Belknap Agency
The Fort Belknap Agency industries that see more men than women are Construction (100.0%), Professional & Scientific (100.0%), and Public Administration (54.0%), whereas the industries that tend to have a higher number of women are Finance & Insurance (100.0%), Educational Services (100.0%), and Health Care & Social Assistance (100.0%).
| Industry | Male | Female |
| Agriculture, Fishing & Hunting | 0 (0.0%) | 0 (0.0%) |
| Mining, Quarrying, & Extraction | 0 (0.0%) | 0 (0.0%) |
| Construction | 28 (100.0%) | 0 (0.0%) |
| Manufacturing | 0 (0.0%) | 0 (0.0%) |
| Wholesale Trade | 0 (0.0%) | 0 (0.0%) |
| Retail Trade | 2 (18.2%) | 9 (81.8%) |
| Transportation & Warehousing | 0 (0.0%) | 0 (0.0%) |
| Utilities | 0 (0.0%) | 0 (0.0%) |
| Information | 0 (0.0%) | 0 (0.0%) |
| Finance & Insurance | 0 (0.0%) | 3 (100.0%) |
| Real Estate, Rental & Leasing | 0 (0.0%) | 0 (0.0%) |
| Professional & Scientific | 31 (100.0%) | 0 (0.0%) |
| Enterprise Management | 0 (0.0%) | 0 (0.0%) |
| Administrative & Support | 0 (0.0%) | 0 (0.0%) |
| Educational Services | 0 (0.0%) | 61 (100.0%) |
| Health Care & Social Assistance | 0 (0.0%) | 12 (100.0%) |
| Arts, Entertainment & Recreation | 0 (0.0%) | 0 (0.0%) |
| Accommodation & Food Services | 0 (0.0%) | 0 (0.0%) |
| Public Administration | 67 (54.0%) | 57 (46.0%) |
| Total | 128 (45.9%) | 151 (54.1%) |
Education in Fort Belknap Agency
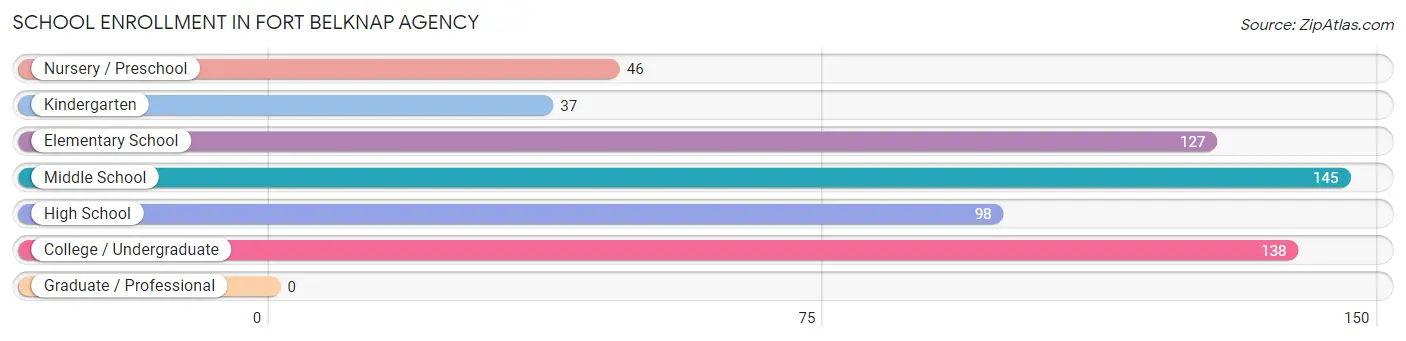
School Enrollment in Fort Belknap Agency
The most common levels of schooling among the 591 students in Fort Belknap Agency are middle school (145 | 24.5%), college / undergraduate (138 | 23.4%), and elementary school (127 | 21.5%).
| School Level | # Students | % Students |
| Nursery / Preschool | 46 | 7.8% |
| Kindergarten | 37 | 6.3% |
| Elementary School | 127 | 21.5% |
| Middle School | 145 | 24.5% |
| High School | 98 | 16.6% |
| College / Undergraduate | 138 | 23.4% |
| Graduate / Professional | 0 | 0.0% |
| Total | 591 | 100.0% |
School Enrollment by Age by Funding Source in Fort Belknap Agency
Out of a total of 591 students who are enrolled in schools in Fort Belknap Agency, 17 (2.9%) attend a private institution, while the remaining 574 (97.1%) are enrolled in public schools. The age group of 20 to 24 year olds has the highest likelihood of being enrolled in private schools, with 2 (50.0% in the age bracket) enrolled. Conversely, the age group of 3 to 4 year olds has the lowest likelihood of being enrolled in a private school, with 46 (100.0% in the age bracket) attending a public institution.
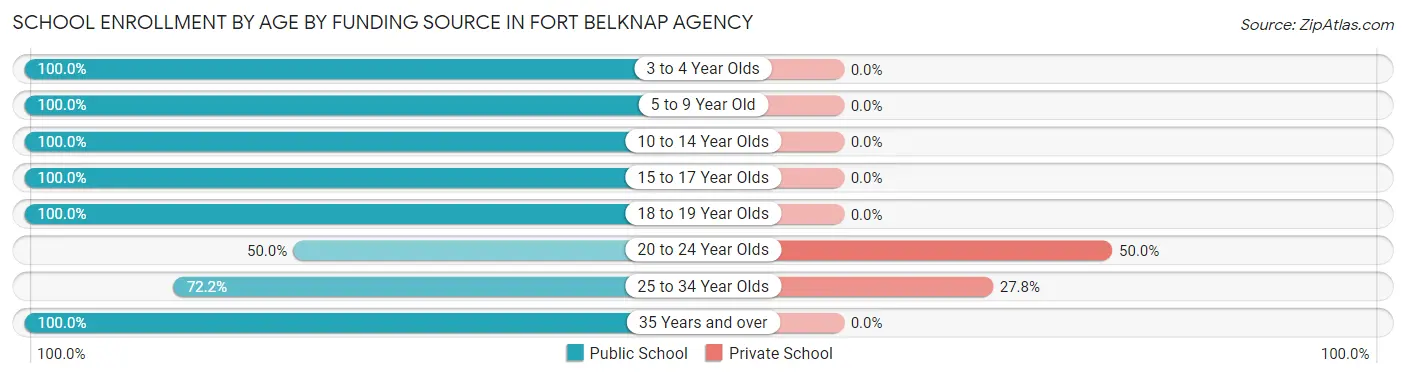
| Age Bracket | Public School | Private School |
| 3 to 4 Year Olds | 46 (100.0%) | 0 (0.0%) |
| 5 to 9 Year Old | 159 (100.0%) | 0 (0.0%) |
| 10 to 14 Year Olds | 128 (100.0%) | 0 (0.0%) |
| 15 to 17 Year Olds | 98 (100.0%) | 0 (0.0%) |
| 18 to 19 Year Olds | 72 (100.0%) | 0 (0.0%) |
| 20 to 24 Year Olds | 2 (50.0%) | 2 (50.0%) |
| 25 to 34 Year Olds | 39 (72.2%) | 15 (27.8%) |
| 35 Years and over | 30 (100.0%) | 0 (0.0%) |
| Total | 574 (97.1%) | 17 (2.9%) |
Educational Attainment by Field of Study in Fort Belknap Agency
Education (28 | 43.8%), business (20 | 31.2%), bio, nature & agricultural (15 | 23.4%), and science & technology (1 | 1.6%) are the most common fields of study among 64 individuals in Fort Belknap Agency who have obtained a bachelor's degree or higher.
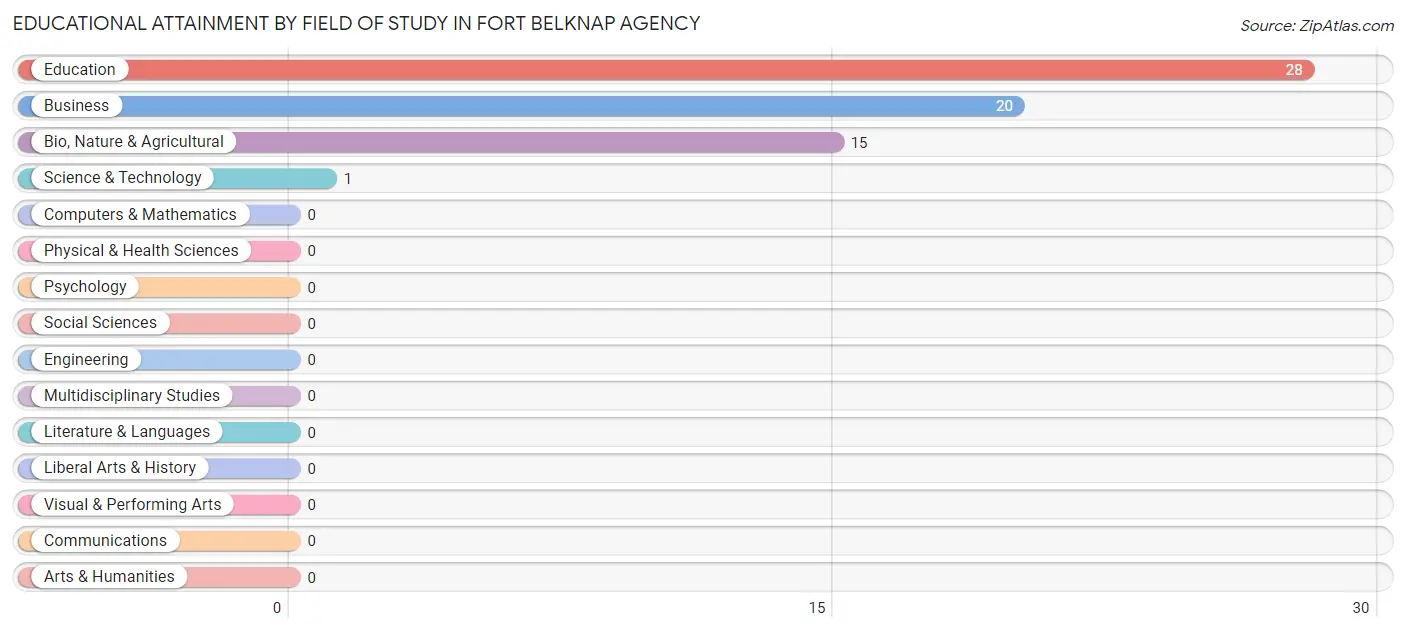
| Field of Study | # Graduates | % Graduates |
| Computers & Mathematics | 0 | 0.0% |
| Bio, Nature & Agricultural | 15 | 23.4% |
| Physical & Health Sciences | 0 | 0.0% |
| Psychology | 0 | 0.0% |
| Social Sciences | 0 | 0.0% |
| Engineering | 0 | 0.0% |
| Multidisciplinary Studies | 0 | 0.0% |
| Science & Technology | 1 | 1.6% |
| Business | 20 | 31.2% |
| Education | 28 | 43.8% |
| Literature & Languages | 0 | 0.0% |
| Liberal Arts & History | 0 | 0.0% |
| Visual & Performing Arts | 0 | 0.0% |
| Communications | 0 | 0.0% |
| Arts & Humanities | 0 | 0.0% |
| Total | 64 | 100.0% |
Transportation & Commute in Fort Belknap Agency
Vehicle Availability by Sex in Fort Belknap Agency
The most prevalent vehicle ownership categories in Fort Belknap Agency are males with 3 vehicles (41, accounting for 39.4%) and females with 3 vehicles (11, making up 31.5%).
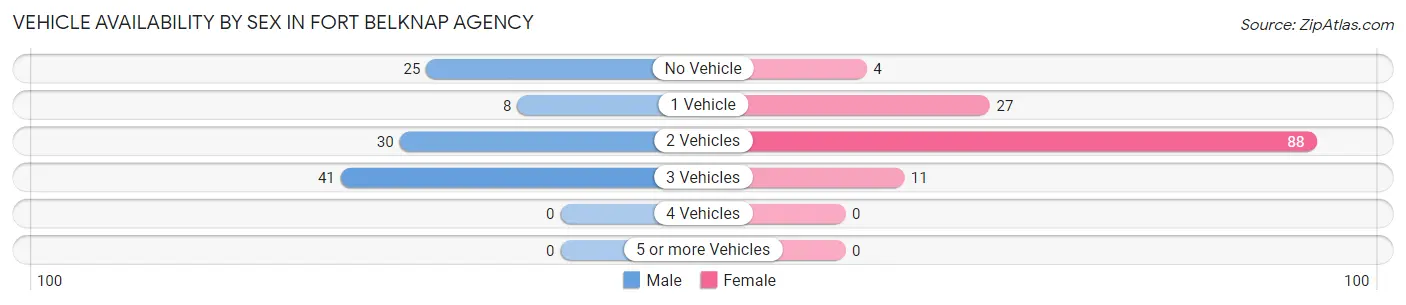
| Vehicles Available | Male | Female |
| No Vehicle | 25 (24.0%) | 4 (3.1%) |
| 1 Vehicle | 8 (7.7%) | 27 (20.8%) |
| 2 Vehicles | 30 (28.8%) | 88 (67.7%) |
| 3 Vehicles | 41 (39.4%) | 11 (8.5%) |
| 4 Vehicles | 0 (0.0%) | 0 (0.0%) |
| 5 or more Vehicles | 0 (0.0%) | 0 (0.0%) |
| Total | 104 (100.0%) | 130 (100.0%) |
Commute Time in Fort Belknap Agency
The most frequently occuring commute durations in Fort Belknap Agency are 5 to 9 minutes (110 commuters, 50.2%), less than 5 minutes (72 commuters, 32.9%), and 30 to 34 minutes (17 commuters, 7.8%).
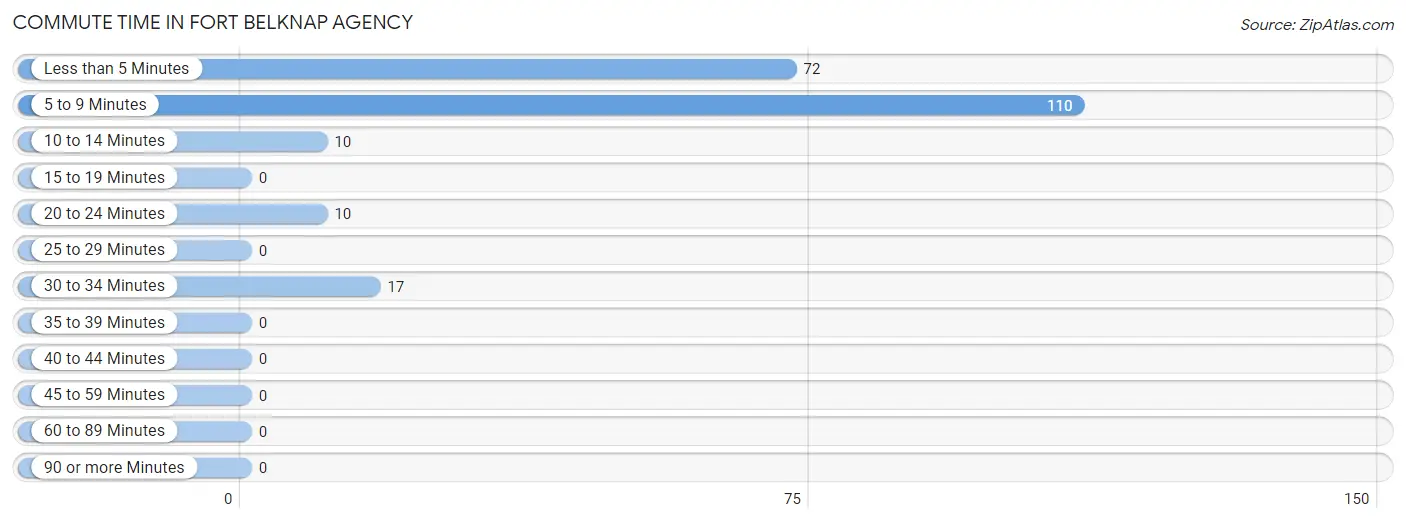
| Commute Time | # Commuters | % Commuters |
| Less than 5 Minutes | 72 | 32.9% |
| 5 to 9 Minutes | 110 | 50.2% |
| 10 to 14 Minutes | 10 | 4.6% |
| 15 to 19 Minutes | 0 | 0.0% |
| 20 to 24 Minutes | 10 | 4.6% |
| 25 to 29 Minutes | 0 | 0.0% |
| 30 to 34 Minutes | 17 | 7.8% |
| 35 to 39 Minutes | 0 | 0.0% |
| 40 to 44 Minutes | 0 | 0.0% |
| 45 to 59 Minutes | 0 | 0.0% |
| 60 to 89 Minutes | 0 | 0.0% |
| 90 or more Minutes | 0 | 0.0% |
Commute Time by Sex in Fort Belknap Agency
The most common commute times in Fort Belknap Agency are 5 to 9 minutes (58 commuters, 62.4%) for males and less than 5 minutes (54 commuters, 42.9%) for females.
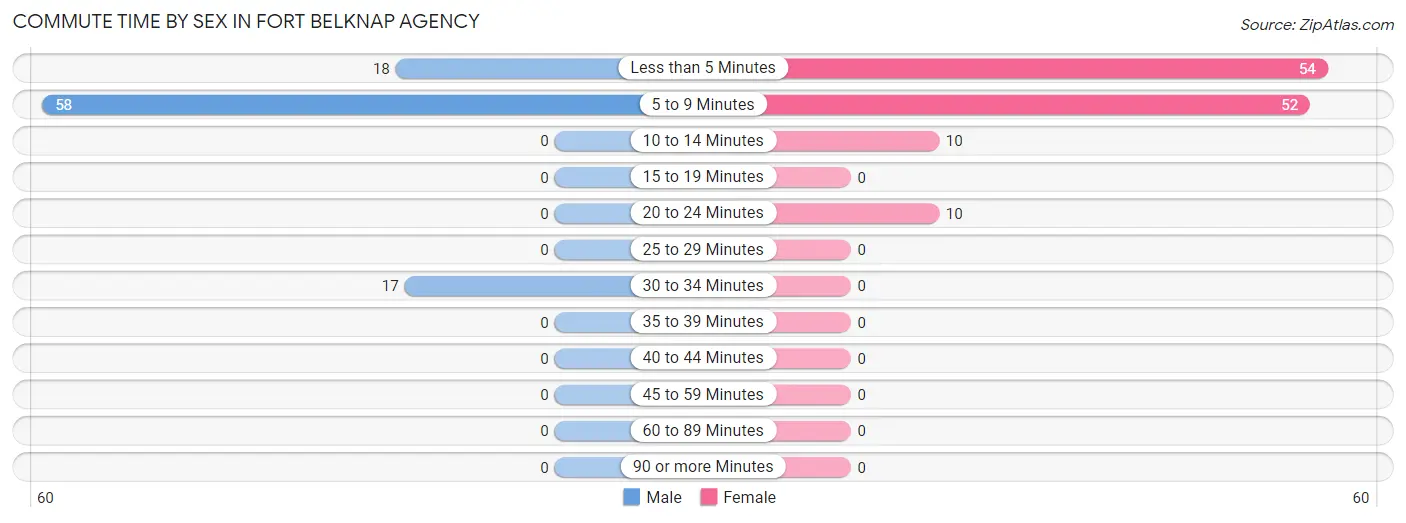
| Commute Time | Male | Female |
| Less than 5 Minutes | 18 (19.4%) | 54 (42.9%) |
| 5 to 9 Minutes | 58 (62.4%) | 52 (41.3%) |
| 10 to 14 Minutes | 0 (0.0%) | 10 (7.9%) |
| 15 to 19 Minutes | 0 (0.0%) | 0 (0.0%) |
| 20 to 24 Minutes | 0 (0.0%) | 10 (7.9%) |
| 25 to 29 Minutes | 0 (0.0%) | 0 (0.0%) |
| 30 to 34 Minutes | 17 (18.3%) | 0 (0.0%) |
| 35 to 39 Minutes | 0 (0.0%) | 0 (0.0%) |
| 40 to 44 Minutes | 0 (0.0%) | 0 (0.0%) |
| 45 to 59 Minutes | 0 (0.0%) | 0 (0.0%) |
| 60 to 89 Minutes | 0 (0.0%) | 0 (0.0%) |
| 90 or more Minutes | 0 (0.0%) | 0 (0.0%) |
Time of Departure to Work by Sex in Fort Belknap Agency
The most frequent times of departure to work in Fort Belknap Agency are 7:30 AM to 7:59 AM (55, 59.1%) for males and 7:30 AM to 7:59 AM (55, 43.6%) for females.
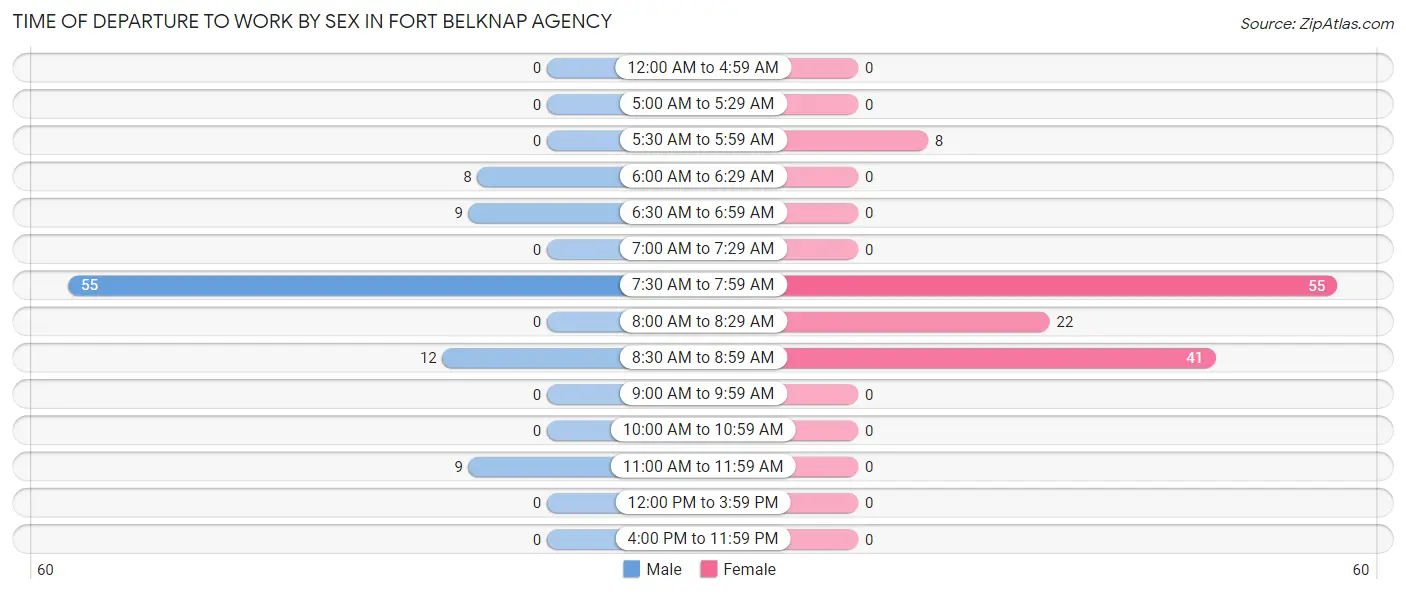
| Time of Departure | Male | Female |
| 12:00 AM to 4:59 AM | 0 (0.0%) | 0 (0.0%) |
| 5:00 AM to 5:29 AM | 0 (0.0%) | 0 (0.0%) |
| 5:30 AM to 5:59 AM | 0 (0.0%) | 8 (6.4%) |
| 6:00 AM to 6:29 AM | 8 (8.6%) | 0 (0.0%) |
| 6:30 AM to 6:59 AM | 9 (9.7%) | 0 (0.0%) |
| 7:00 AM to 7:29 AM | 0 (0.0%) | 0 (0.0%) |
| 7:30 AM to 7:59 AM | 55 (59.1%) | 55 (43.6%) |
| 8:00 AM to 8:29 AM | 0 (0.0%) | 22 (17.5%) |
| 8:30 AM to 8:59 AM | 12 (12.9%) | 41 (32.5%) |
| 9:00 AM to 9:59 AM | 0 (0.0%) | 0 (0.0%) |
| 10:00 AM to 10:59 AM | 0 (0.0%) | 0 (0.0%) |
| 11:00 AM to 11:59 AM | 9 (9.7%) | 0 (0.0%) |
| 12:00 PM to 3:59 PM | 0 (0.0%) | 0 (0.0%) |
| 4:00 PM to 11:59 PM | 0 (0.0%) | 0 (0.0%) |
| Total | 93 (100.0%) | 126 (100.0%) |
Housing Occupancy in Fort Belknap Agency
Occupancy by Ownership in Fort Belknap Agency
Of the total 373 dwellings in Fort Belknap Agency, owner-occupied units account for 199 (53.3%), while renter-occupied units make up 174 (46.7%).
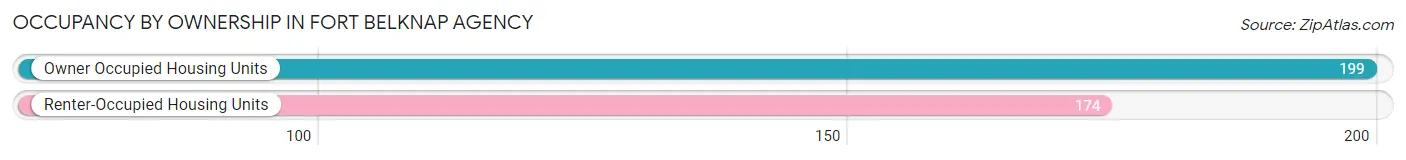
| Occupancy | # Housing Units | % Housing Units |
| Owner Occupied Housing Units | 199 | 53.3% |
| Renter-Occupied Housing Units | 174 | 46.7% |
| Total Occupied Housing Units | 373 | 100.0% |
Occupancy by Household Size in Fort Belknap Agency
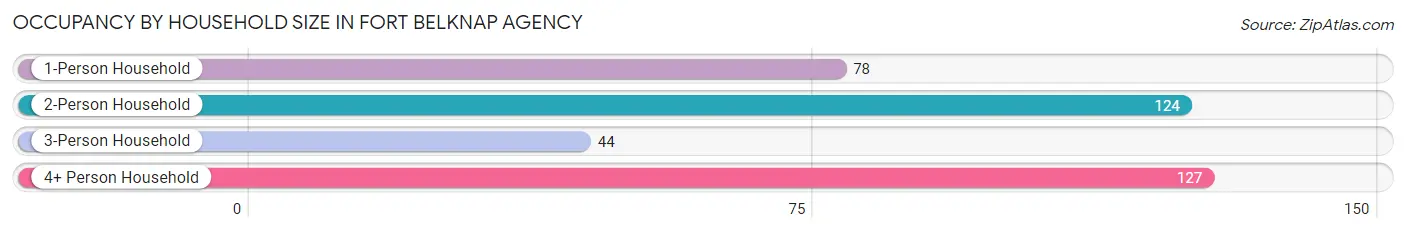
| Household Size | # Housing Units | % Housing Units |
| 1-Person Household | 78 | 20.9% |
| 2-Person Household | 124 | 33.2% |
| 3-Person Household | 44 | 11.8% |
| 4+ Person Household | 127 | 34.1% |
| Total Housing Units | 373 | 100.0% |
Occupancy by Ownership by Household Size in Fort Belknap Agency
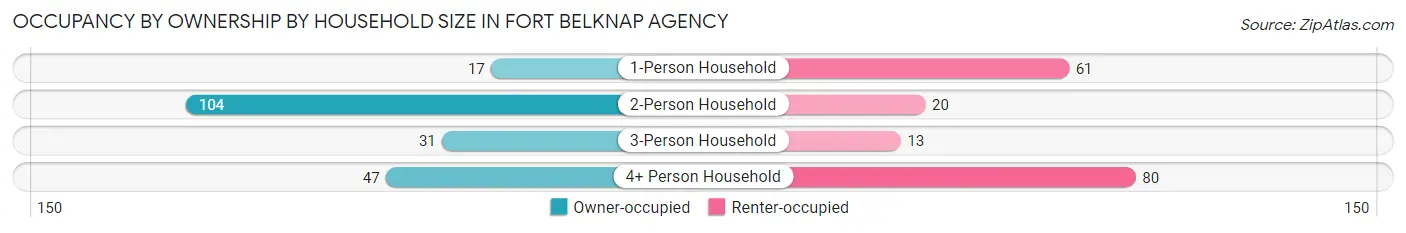
| Household Size | Owner-occupied | Renter-occupied |
| 1-Person Household | 17 (21.8%) | 61 (78.2%) |
| 2-Person Household | 104 (83.9%) | 20 (16.1%) |
| 3-Person Household | 31 (70.5%) | 13 (29.5%) |
| 4+ Person Household | 47 (37.0%) | 80 (63.0%) |
| Total Housing Units | 199 (53.3%) | 174 (46.7%) |
Occupancy by Educational Attainment in Fort Belknap Agency
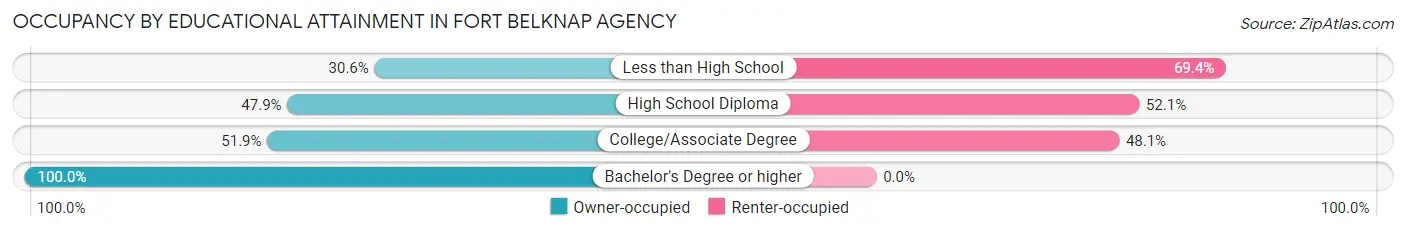
| Household Size | Owner-occupied | Renter-occupied |
| Less than High School | 15 (30.6%) | 34 (69.4%) |
| High School Diploma | 34 (47.9%) | 37 (52.1%) |
| College/Associate Degree | 111 (51.9%) | 103 (48.1%) |
| Bachelor's Degree or higher | 39 (100.0%) | 0 (0.0%) |
Occupancy by Age of Householder in Fort Belknap Agency
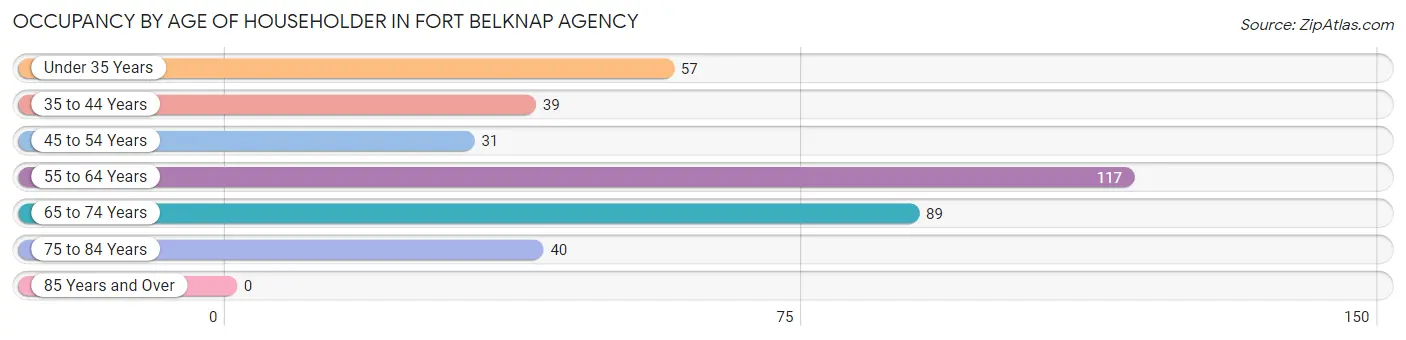
| Age Bracket | # Households | % Households |
| Under 35 Years | 57 | 15.3% |
| 35 to 44 Years | 39 | 10.5% |
| 45 to 54 Years | 31 | 8.3% |
| 55 to 64 Years | 117 | 31.4% |
| 65 to 74 Years | 89 | 23.9% |
| 75 to 84 Years | 40 | 10.7% |
| 85 Years and Over | 0 | 0.0% |
| Total | 373 | 100.0% |
Housing Finances in Fort Belknap Agency
Median Income by Occupancy in Fort Belknap Agency
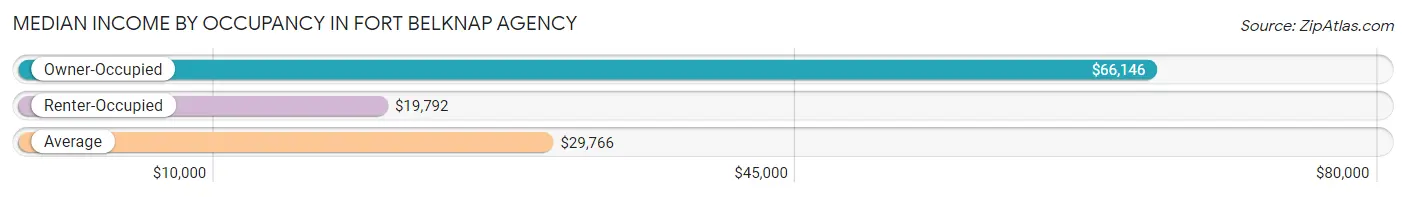
| Occupancy Type | # Households | Median Income |
| Owner-Occupied | 199 (53.3%) | $66,146 |
| Renter-Occupied | 174 (46.7%) | $19,792 |
| Average | 373 (100.0%) | $29,766 |
Occupancy by Householder Income Bracket in Fort Belknap Agency
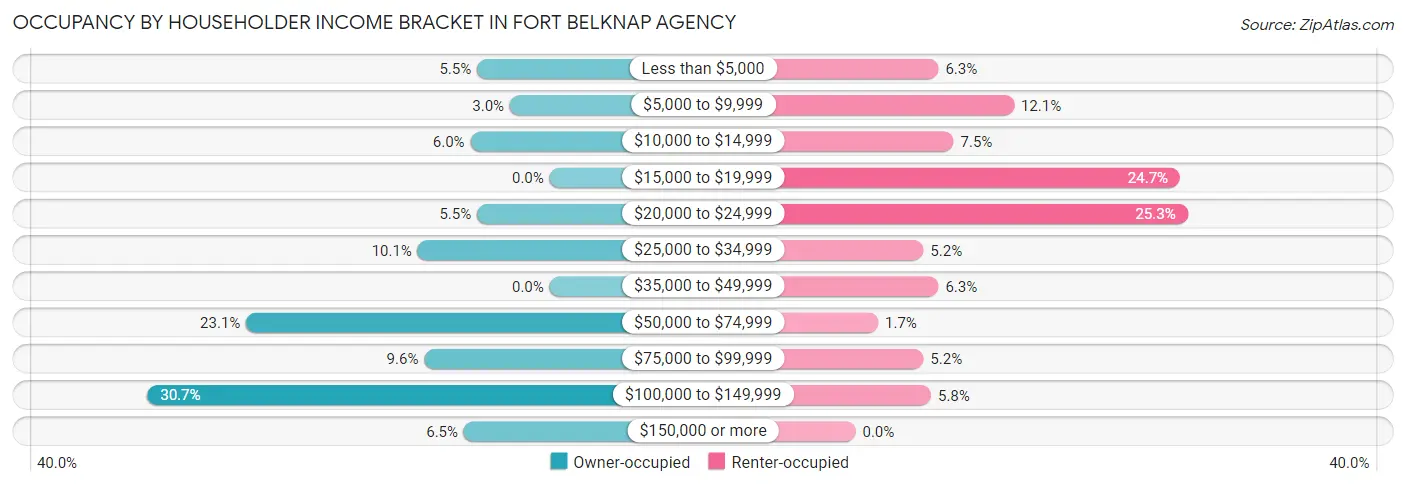
| Income Bracket | Owner-occupied | Renter-occupied |
| Less than $5,000 | 11 (5.5%) | 11 (6.3%) |
| $5,000 to $9,999 | 6 (3.0%) | 21 (12.1%) |
| $10,000 to $14,999 | 12 (6.0%) | 13 (7.5%) |
| $15,000 to $19,999 | 0 (0.0%) | 43 (24.7%) |
| $20,000 to $24,999 | 11 (5.5%) | 44 (25.3%) |
| $25,000 to $34,999 | 20 (10.1%) | 9 (5.2%) |
| $35,000 to $49,999 | 0 (0.0%) | 11 (6.3%) |
| $50,000 to $74,999 | 46 (23.1%) | 3 (1.7%) |
| $75,000 to $99,999 | 19 (9.6%) | 9 (5.2%) |
| $100,000 to $149,999 | 61 (30.6%) | 10 (5.8%) |
| $150,000 or more | 13 (6.5%) | 0 (0.0%) |
| Total | 199 (100.0%) | 174 (100.0%) |
Monthly Housing Cost Tiers in Fort Belknap Agency
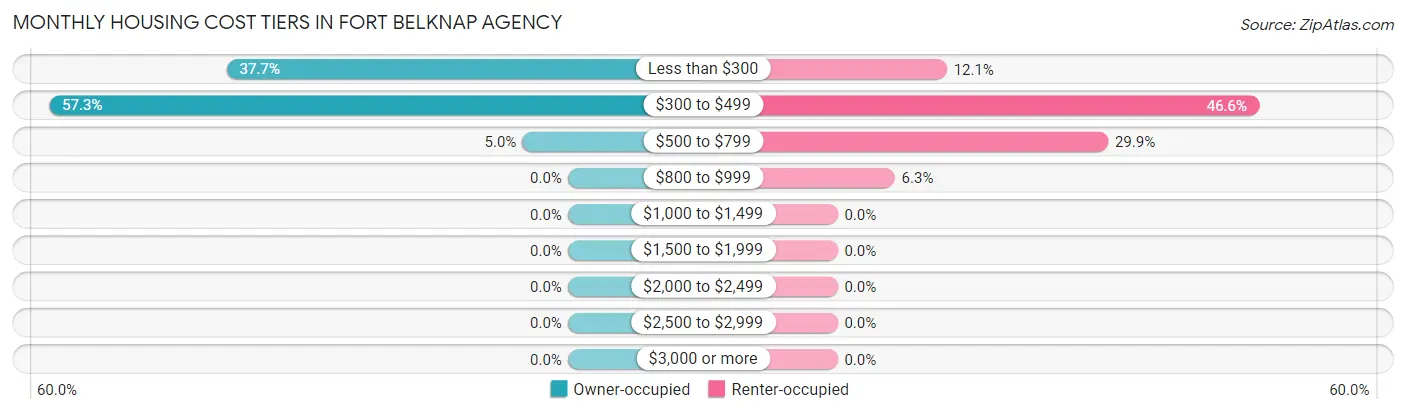
| Monthly Cost | Owner-occupied | Renter-occupied |
| Less than $300 | 75 (37.7%) | 21 (12.1%) |
| $300 to $499 | 114 (57.3%) | 81 (46.6%) |
| $500 to $799 | 10 (5.0%) | 52 (29.9%) |
| $800 to $999 | 0 (0.0%) | 11 (6.3%) |
| $1,000 to $1,499 | 0 (0.0%) | 0 (0.0%) |
| $1,500 to $1,999 | 0 (0.0%) | 0 (0.0%) |
| $2,000 to $2,499 | 0 (0.0%) | 0 (0.0%) |
| $2,500 to $2,999 | 0 (0.0%) | 0 (0.0%) |
| $3,000 or more | 0 (0.0%) | 0 (0.0%) |
| Total | 199 (100.0%) | 174 (100.0%) |
Physical Housing Characteristics in Fort Belknap Agency
Housing Structures in Fort Belknap Agency
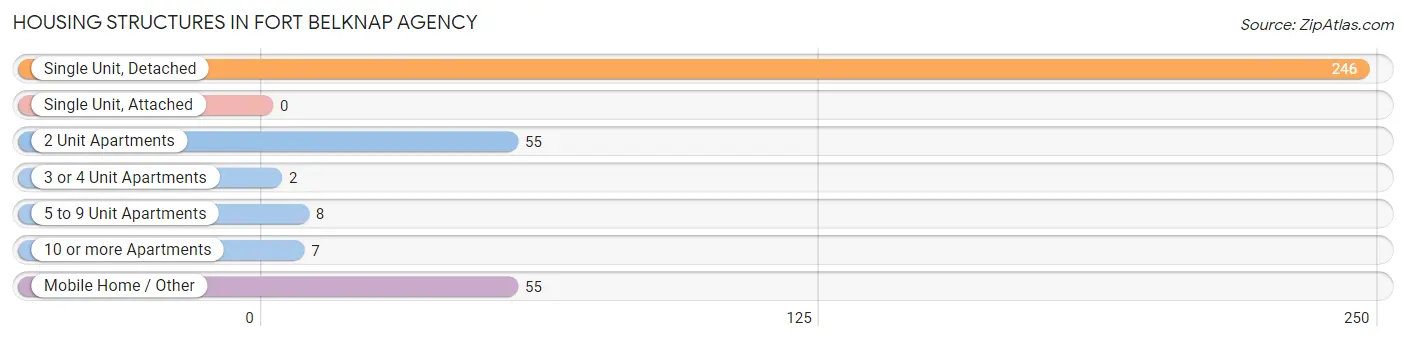
| Structure Type | # Housing Units | % Housing Units |
| Single Unit, Detached | 246 | 65.9% |
| Single Unit, Attached | 0 | 0.0% |
| 2 Unit Apartments | 55 | 14.7% |
| 3 or 4 Unit Apartments | 2 | 0.5% |
| 5 to 9 Unit Apartments | 8 | 2.1% |
| 10 or more Apartments | 7 | 1.9% |
| Mobile Home / Other | 55 | 14.7% |
| Total | 373 | 100.0% |
Housing Structures by Occupancy in Fort Belknap Agency
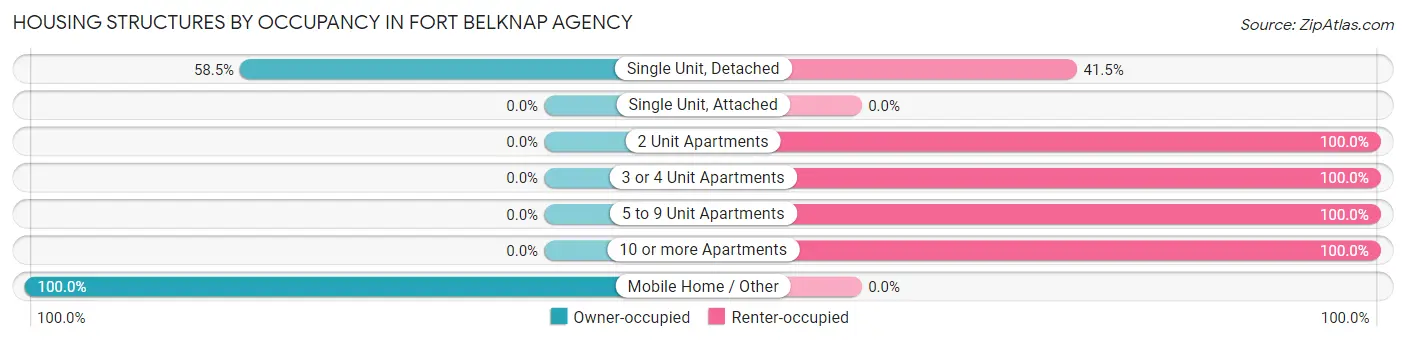
| Structure Type | Owner-occupied | Renter-occupied |
| Single Unit, Detached | 144 (58.5%) | 102 (41.5%) |
| Single Unit, Attached | 0 (0.0%) | 0 (0.0%) |
| 2 Unit Apartments | 0 (0.0%) | 55 (100.0%) |
| 3 or 4 Unit Apartments | 0 (0.0%) | 2 (100.0%) |
| 5 to 9 Unit Apartments | 0 (0.0%) | 8 (100.0%) |
| 10 or more Apartments | 0 (0.0%) | 7 (100.0%) |
| Mobile Home / Other | 55 (100.0%) | 0 (0.0%) |
| Total | 199 (53.3%) | 174 (46.7%) |
Housing Structures by Number of Rooms in Fort Belknap Agency
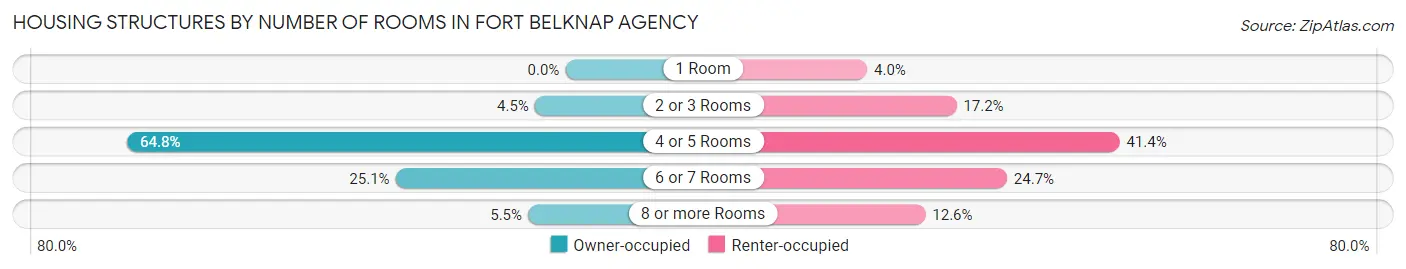
| Number of Rooms | Owner-occupied | Renter-occupied |
| 1 Room | 0 (0.0%) | 7 (4.0%) |
| 2 or 3 Rooms | 9 (4.5%) | 30 (17.2%) |
| 4 or 5 Rooms | 129 (64.8%) | 72 (41.4%) |
| 6 or 7 Rooms | 50 (25.1%) | 43 (24.7%) |
| 8 or more Rooms | 11 (5.5%) | 22 (12.6%) |
| Total | 199 (100.0%) | 174 (100.0%) |
Housing Structure by Heating Type in Fort Belknap Agency
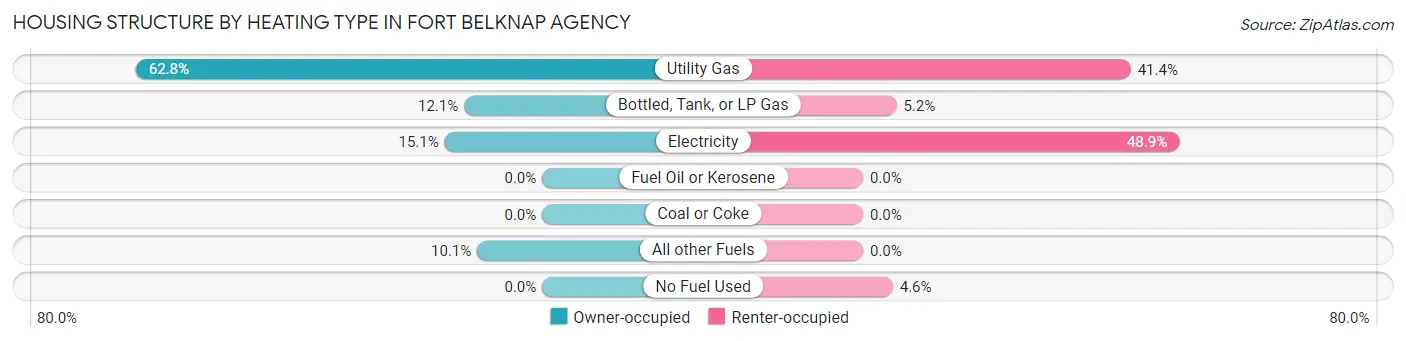
| Heating Type | Owner-occupied | Renter-occupied |
| Utility Gas | 125 (62.8%) | 72 (41.4%) |
| Bottled, Tank, or LP Gas | 24 (12.1%) | 9 (5.2%) |
| Electricity | 30 (15.1%) | 85 (48.8%) |
| Fuel Oil or Kerosene | 0 (0.0%) | 0 (0.0%) |
| Coal or Coke | 0 (0.0%) | 0 (0.0%) |
| All other Fuels | 20 (10.1%) | 0 (0.0%) |
| No Fuel Used | 0 (0.0%) | 8 (4.6%) |
| Total | 199 (100.0%) | 174 (100.0%) |
Household Vehicle Usage in Fort Belknap Agency
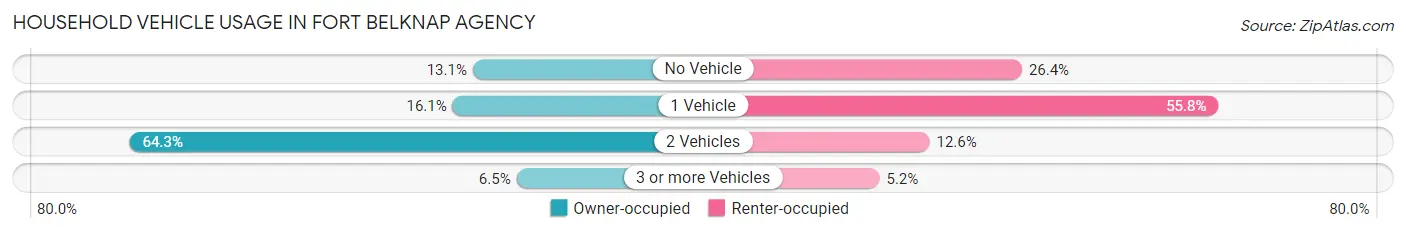
| Vehicles per Household | Owner-occupied | Renter-occupied |
| No Vehicle | 26 (13.1%) | 46 (26.4%) |
| 1 Vehicle | 32 (16.1%) | 97 (55.7%) |
| 2 Vehicles | 128 (64.3%) | 22 (12.6%) |
| 3 or more Vehicles | 13 (6.5%) | 9 (5.2%) |
| Total | 199 (100.0%) | 174 (100.0%) |
Real Estate & Mortgages in Fort Belknap Agency
Real Estate and Mortgage Overview in Fort Belknap Agency
| Characteristic | Without Mortgage | With Mortgage |
| Housing Units | 199 | 0 |
| Median Property Value | $68,900 | $0 |
| Median Household Income | $66,146 | $0 |
| Monthly Housing Costs | $322 | $0 |
| Real Estate Taxes | - | - |
Property Value by Mortgage Status in Fort Belknap Agency
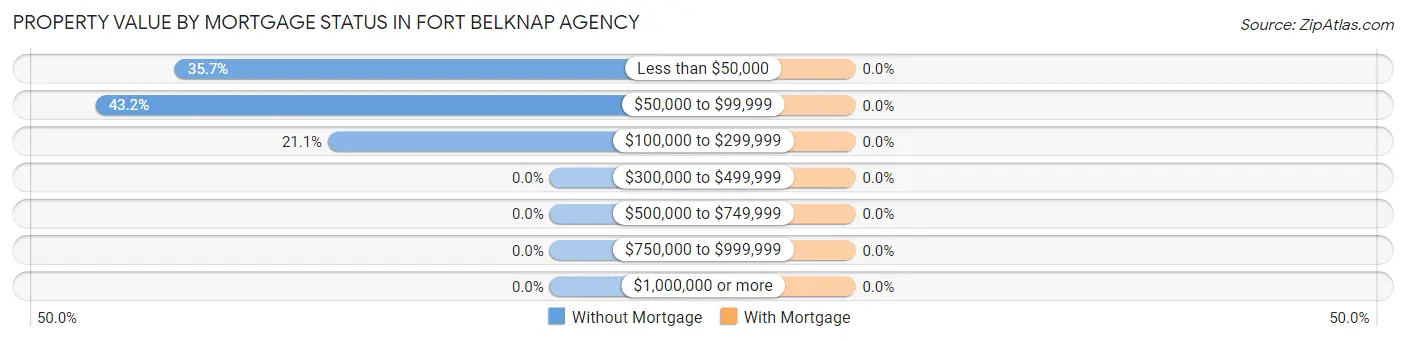
| Property Value | Without Mortgage | With Mortgage |
| Less than $50,000 | 71 (35.7%) | 0 (0.0%) |
| $50,000 to $99,999 | 86 (43.2%) | 0 (0.0%) |
| $100,000 to $299,999 | 42 (21.1%) | 0 (0.0%) |
| $300,000 to $499,999 | 0 (0.0%) | 0 (0.0%) |
| $500,000 to $749,999 | 0 (0.0%) | 0 (0.0%) |
| $750,000 to $999,999 | 0 (0.0%) | 0 (0.0%) |
| $1,000,000 or more | 0 (0.0%) | 0 (0.0%) |
| Total | 199 (100.0%) | 0 (0.0%) |
Household Income by Mortgage Status in Fort Belknap Agency
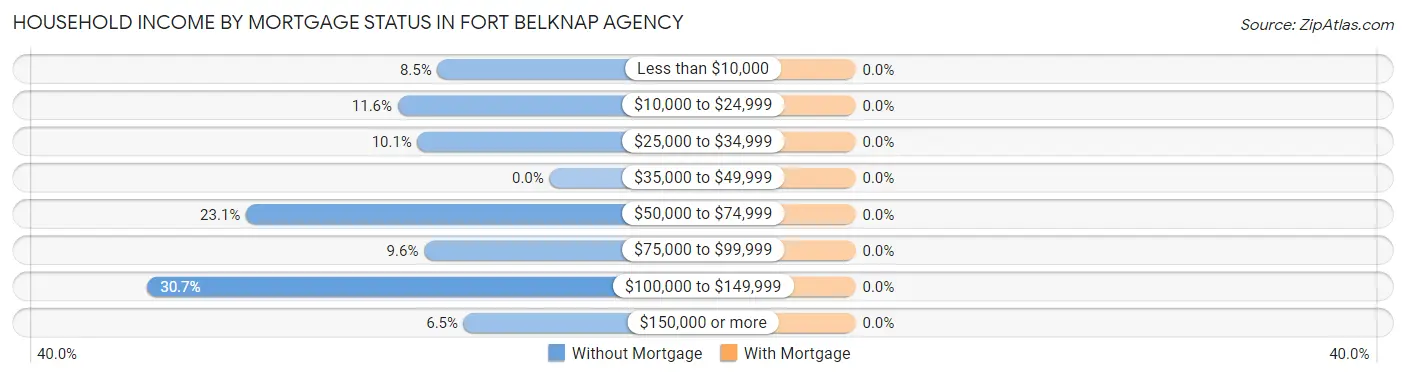
| Household Income | Without Mortgage | With Mortgage |
| Less than $10,000 | 17 (8.5%) | 0 (0.0%) |
| $10,000 to $24,999 | 23 (11.6%) | 0 (0.0%) |
| $25,000 to $34,999 | 20 (10.1%) | 0 (0.0%) |
| $35,000 to $49,999 | 0 (0.0%) | 0 (0.0%) |
| $50,000 to $74,999 | 46 (23.1%) | 0 (0.0%) |
| $75,000 to $99,999 | 19 (9.6%) | 0 (0.0%) |
| $100,000 to $149,999 | 61 (30.6%) | 0 (0.0%) |
| $150,000 or more | 13 (6.5%) | 0 (0.0%) |
| Total | 199 (100.0%) | 0 (0.0%) |
Property Value to Household Income Ratio in Fort Belknap Agency
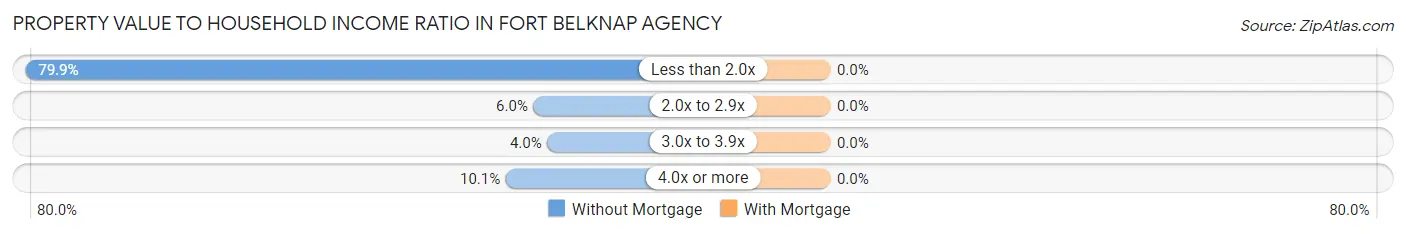
| Value-to-Income Ratio | Without Mortgage | With Mortgage |
| Less than 2.0x | 159 (79.9%) | 0 (0.0%) |
| 2.0x to 2.9x | 12 (6.0%) | 0 (0.0%) |
| 3.0x to 3.9x | 8 (4.0%) | 0 (0.0%) |
| 4.0x or more | 20 (10.1%) | 0 (0.0%) |
| Total | 199 (100.0%) | 0 (0.0%) |
Real Estate Taxes by Mortgage Status in Fort Belknap Agency
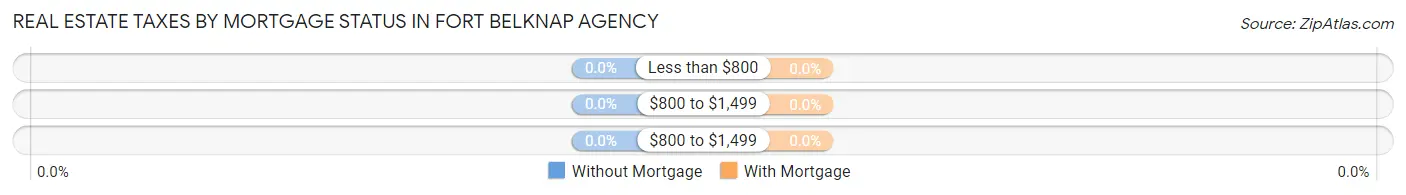
| Property Taxes | Without Mortgage | With Mortgage |
| Less than $800 | 0 (0.0%) | 0 (0.0%) |
| $800 to $1,499 | 0 (0.0%) | 0 (0.0%) |
| $800 to $1,499 | 0 (0.0%) | 0 (0.0%) |
| Total | 199 (100.0%) | 0 (0.0%) |
Health & Disability in Fort Belknap Agency
Health Insurance Coverage by Age in Fort Belknap Agency
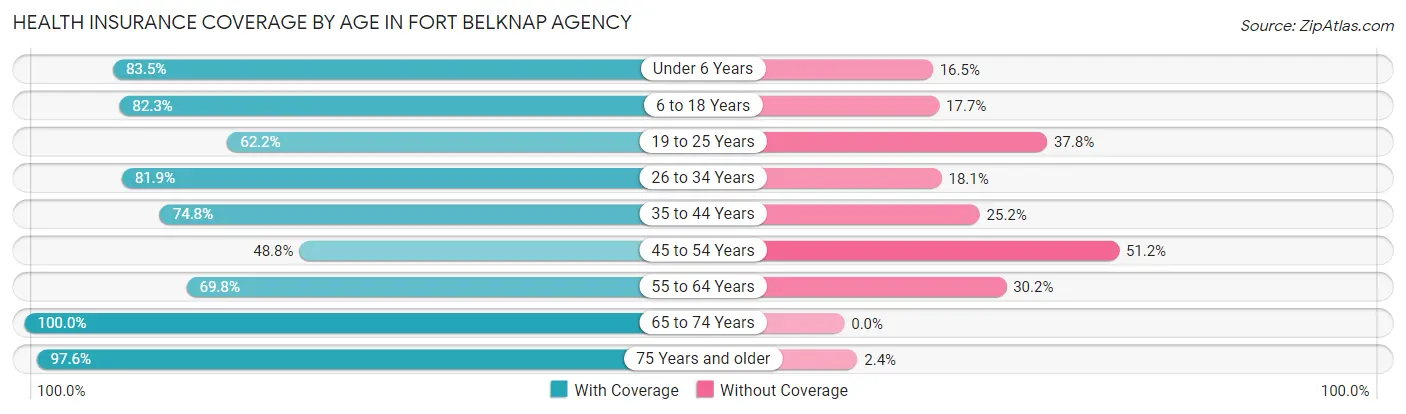
| Age Bracket | With Coverage | Without Coverage |
| Under 6 Years | 162 (83.5%) | 32 (16.5%) |
| 6 to 18 Years | 377 (82.3%) | 81 (17.7%) |
| 19 to 25 Years | 79 (62.2%) | 48 (37.8%) |
| 26 to 34 Years | 149 (81.9%) | 33 (18.1%) |
| 35 to 44 Years | 83 (74.8%) | 28 (25.2%) |
| 45 to 54 Years | 40 (48.8%) | 42 (51.2%) |
| 55 to 64 Years | 104 (69.8%) | 45 (30.2%) |
| 65 to 74 Years | 98 (100.0%) | 0 (0.0%) |
| 75 Years and older | 40 (97.6%) | 1 (2.4%) |
| Total | 1,132 (78.5%) | 310 (21.5%) |
Health Insurance Coverage by Citizenship Status in Fort Belknap Agency
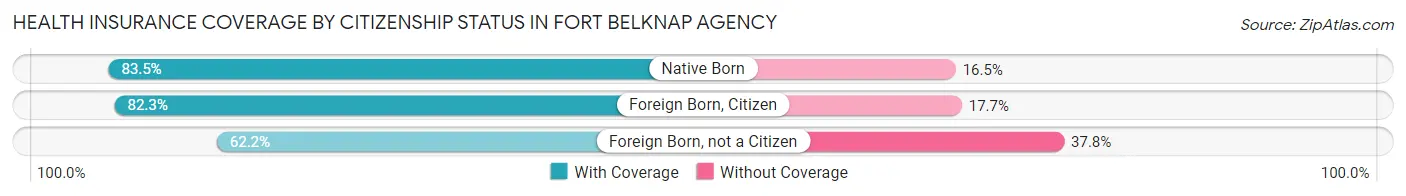
| Citizenship Status | With Coverage | Without Coverage |
| Native Born | 162 (83.5%) | 32 (16.5%) |
| Foreign Born, Citizen | 377 (82.3%) | 81 (17.7%) |
| Foreign Born, not a Citizen | 79 (62.2%) | 48 (37.8%) |
Health Insurance Coverage by Household Income in Fort Belknap Agency
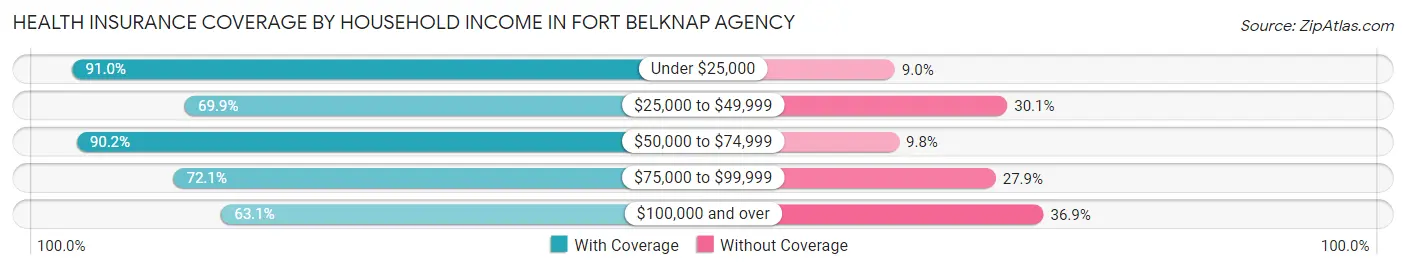
| Household Income | With Coverage | Without Coverage |
| Under $25,000 | 485 (91.0%) | 48 (9.0%) |
| $25,000 to $49,999 | 207 (69.9%) | 89 (30.1%) |
| $50,000 to $74,999 | 138 (90.2%) | 15 (9.8%) |
| $75,000 to $99,999 | 93 (72.1%) | 36 (27.9%) |
| $100,000 and over | 209 (63.1%) | 122 (36.9%) |
Public vs Private Health Insurance Coverage by Age in Fort Belknap Agency
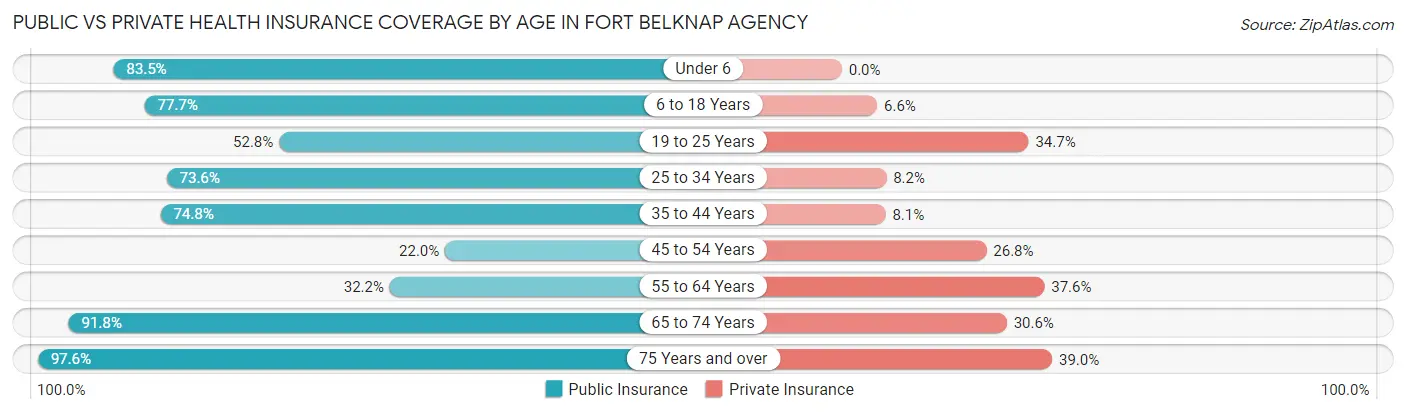
| Age Bracket | Public Insurance | Private Insurance |
| Under 6 | 162 (83.5%) | 0 (0.0%) |
| 6 to 18 Years | 356 (77.7%) | 30 (6.6%) |
| 19 to 25 Years | 67 (52.8%) | 44 (34.6%) |
| 25 to 34 Years | 134 (73.6%) | 15 (8.2%) |
| 35 to 44 Years | 83 (74.8%) | 9 (8.1%) |
| 45 to 54 Years | 18 (22.0%) | 22 (26.8%) |
| 55 to 64 Years | 48 (32.2%) | 56 (37.6%) |
| 65 to 74 Years | 90 (91.8%) | 30 (30.6%) |
| 75 Years and over | 40 (97.6%) | 16 (39.0%) |
| Total | 998 (69.2%) | 222 (15.4%) |
Disability Status by Sex by Age in Fort Belknap Agency
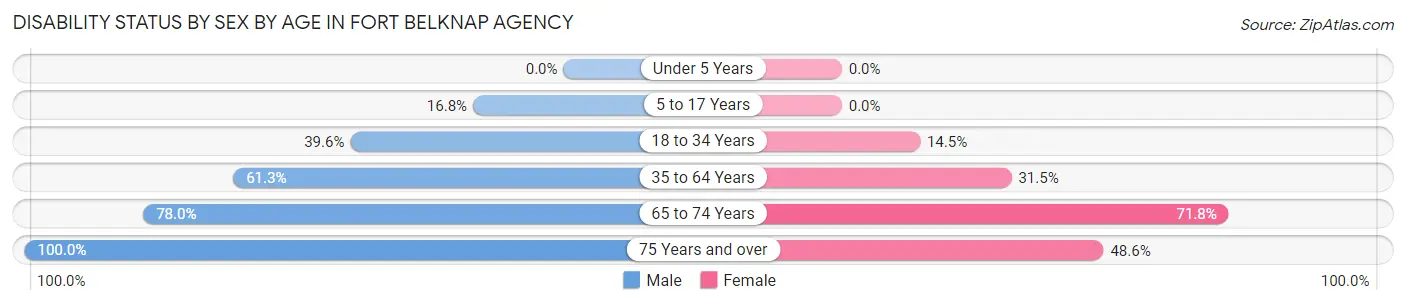
| Age Bracket | Male | Female |
| Under 5 Years | 0 (0.0%) | 0 (0.0%) |
| 5 to 17 Years | 47 (16.8%) | 0 (0.0%) |
| 18 to 34 Years | 72 (39.6%) | 28 (14.5%) |
| 35 to 64 Years | 87 (61.3%) | 63 (31.5%) |
| 65 to 74 Years | 46 (78.0%) | 28 (71.8%) |
| 75 Years and over | 6 (100.0%) | 17 (48.6%) |
Disability Class by Sex by Age in Fort Belknap Agency
Disability Class: Hearing Difficulty
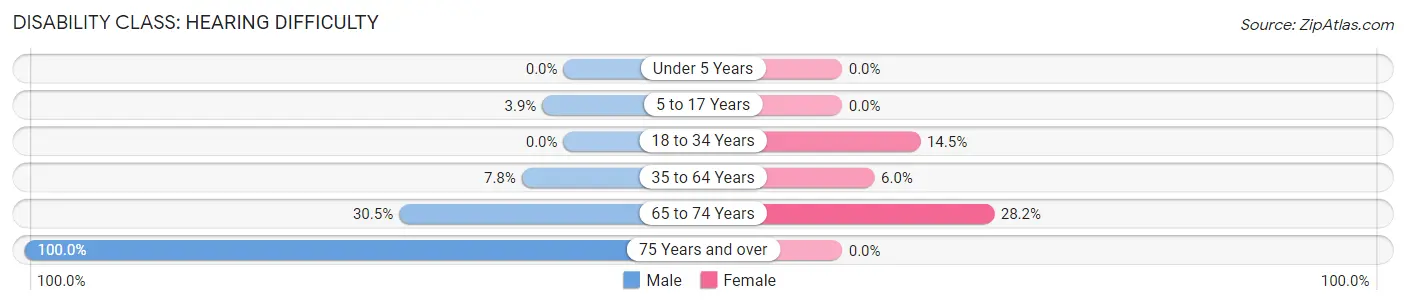
| Age Bracket | Male | Female |
| Under 5 Years | 0 (0.0%) | 0 (0.0%) |
| 5 to 17 Years | 11 (3.9%) | 0 (0.0%) |
| 18 to 34 Years | 0 (0.0%) | 28 (14.5%) |
| 35 to 64 Years | 11 (7.7%) | 12 (6.0%) |
| 65 to 74 Years | 18 (30.5%) | 11 (28.2%) |
| 75 Years and over | 6 (100.0%) | 0 (0.0%) |
Disability Class: Vision Difficulty
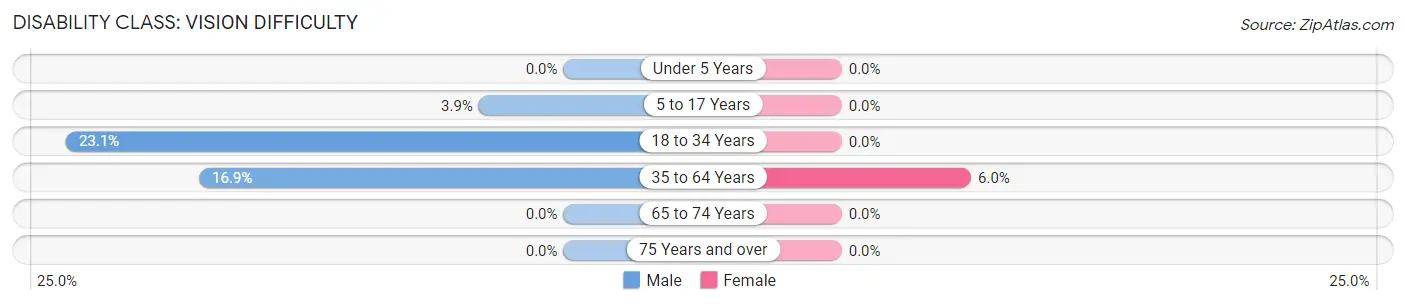
| Age Bracket | Male | Female |
| Under 5 Years | 0 (0.0%) | 0 (0.0%) |
| 5 to 17 Years | 11 (3.9%) | 0 (0.0%) |
| 18 to 34 Years | 42 (23.1%) | 0 (0.0%) |
| 35 to 64 Years | 24 (16.9%) | 12 (6.0%) |
| 65 to 74 Years | 0 (0.0%) | 0 (0.0%) |
| 75 Years and over | 0 (0.0%) | 0 (0.0%) |
Disability Class: Cognitive Difficulty
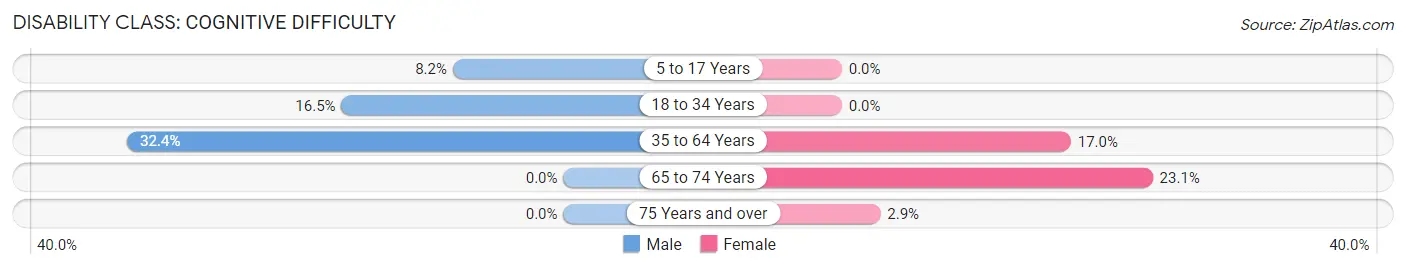
| Age Bracket | Male | Female |
| 5 to 17 Years | 23 (8.2%) | 0 (0.0%) |
| 18 to 34 Years | 30 (16.5%) | 0 (0.0%) |
| 35 to 64 Years | 46 (32.4%) | 34 (17.0%) |
| 65 to 74 Years | 0 (0.0%) | 9 (23.1%) |
| 75 Years and over | 0 (0.0%) | 1 (2.9%) |
Disability Class: Ambulatory Difficulty
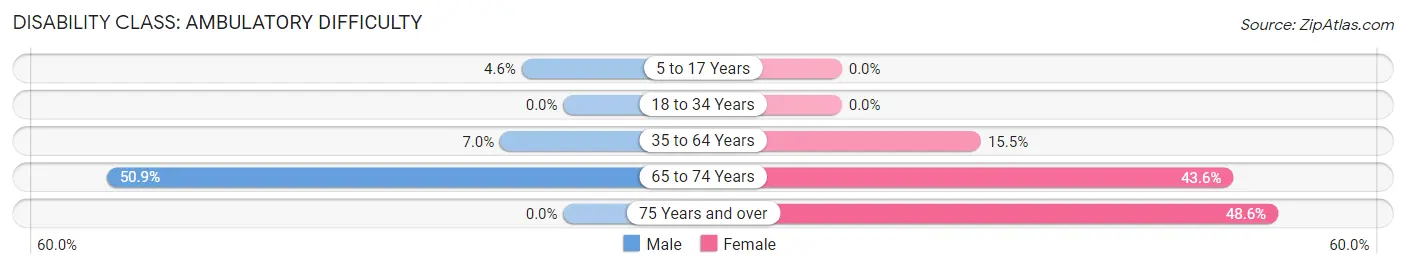
| Age Bracket | Male | Female |
| 5 to 17 Years | 13 (4.6%) | 0 (0.0%) |
| 18 to 34 Years | 0 (0.0%) | 0 (0.0%) |
| 35 to 64 Years | 10 (7.0%) | 31 (15.5%) |
| 65 to 74 Years | 30 (50.8%) | 17 (43.6%) |
| 75 Years and over | 0 (0.0%) | 17 (48.6%) |
Disability Class: Self-Care Difficulty
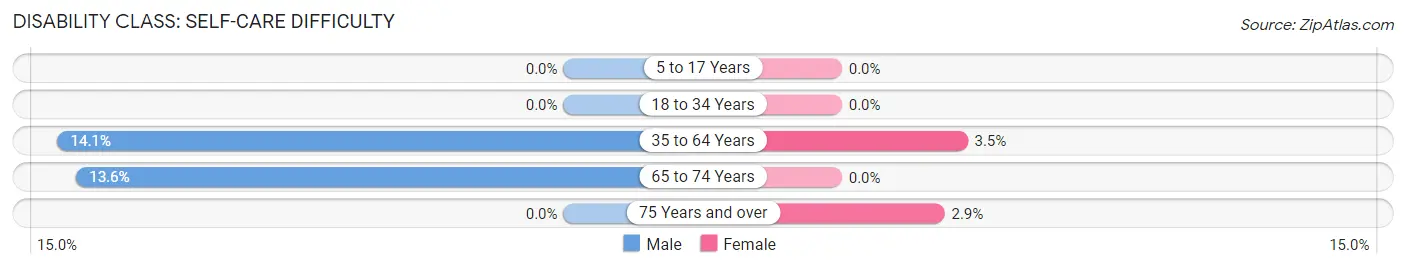
| Age Bracket | Male | Female |
| 5 to 17 Years | 0 (0.0%) | 0 (0.0%) |
| 18 to 34 Years | 0 (0.0%) | 0 (0.0%) |
| 35 to 64 Years | 20 (14.1%) | 7 (3.5%) |
| 65 to 74 Years | 8 (13.6%) | 0 (0.0%) |
| 75 Years and over | 0 (0.0%) | 1 (2.9%) |
Technology Access in Fort Belknap Agency
Computing Device Access in Fort Belknap Agency
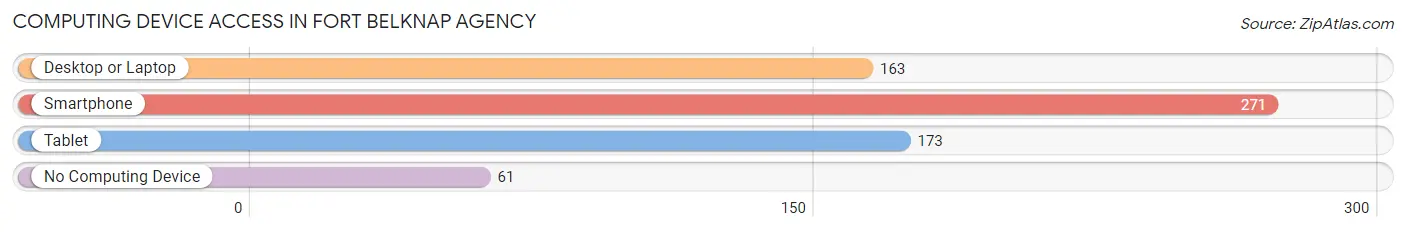
| Device Type | # Households | % Households |
| Desktop or Laptop | 163 | 43.7% |
| Smartphone | 271 | 72.7% |
| Tablet | 173 | 46.4% |
| No Computing Device | 61 | 16.4% |
| Total | 373 | 100.0% |
Internet Access in Fort Belknap Agency
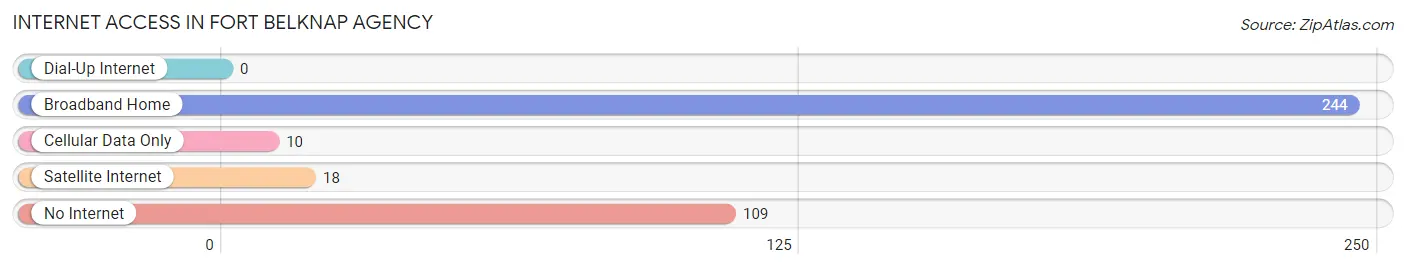
| Internet Type | # Households | % Households |
| Dial-Up Internet | 0 | 0.0% |
| Broadband Home | 244 | 65.4% |
| Cellular Data Only | 10 | 2.7% |
| Satellite Internet | 18 | 4.8% |
| No Internet | 109 | 29.2% |
| Total | 373 | 100.0% |
Fort Belknap Agency Summary
Introduction
Fort Belknap Agency is a small community located in north-central Montana, near the border of Canada. It is the administrative center of the Fort Belknap Indian Reservation, which is home to the Gros Ventre and Assiniboine tribes. The reservation is located in the foothills of the Rocky Mountains and is home to a variety of wildlife, including elk, deer, antelope, and bighorn sheep. The area is also known for its rich cultural heritage, with many traditional ceremonies and festivals taking place throughout the year.
Geography
Fort Belknap Agency is located in north-central Montana, near the border of Canada. The reservation is situated in the foothills of the Rocky Mountains and is home to a variety of wildlife, including elk, deer, antelope, and bighorn sheep. The area is also known for its rich cultural heritage, with many traditional ceremonies and festivals taking place throughout the year. The reservation is approximately 1,500 square miles in size and is divided into two parts: the Fort Belknap Indian Reservation and the Fort Belknap Agency. The Agency is located in the northern part of the reservation and is home to the administrative offices of the Fort Belknap Indian Community.
Economy
The economy of Fort Belknap Agency is largely based on agriculture and tourism. The reservation is home to a variety of crops, including wheat, barley, oats, and hay. The area is also known for its cattle and sheep ranching. Tourism is also an important part of the local economy, with many visitors coming to the area to experience the unique culture and natural beauty of the reservation. The Fort Belknap Indian Community also operates a number of businesses, including a casino, a hotel, and a golf course.
Demographics
As of the 2010 census, the population of Fort Belknap Agency was 1,890. The majority of the population (90.3%) identified as Native American, with the remaining population identifying as white (7.2%), Hispanic (1.2%), and other (1.3%). The median age of the population was 28.7 years, with a median household income of $25,000.
Conclusion
Fort Belknap Agency is a small community located in north-central Montana, near the border of Canada. It is the administrative center of the Fort Belknap Indian Reservation, which is home to the Gros Ventre and Assiniboine tribes. The reservation is home to a variety of wildlife, including elk, deer, antelope, and bighorn sheep. The economy of Fort Belknap Agency is largely based on agriculture and tourism, with many visitors coming to the area to experience the unique culture and natural beauty of the reservation. As of the 2010 census, the population of Fort Belknap Agency was 1,890, with the majority of the population identifying as Native American.
Common Questions
What is Per Capita Income in Fort Belknap Agency?
Per Capita income in Fort Belknap Agency is $15,764.
What is the Median Family Income in Fort Belknap Agency?
Median Family Income in Fort Belknap Agency is $50,625.
What is the Median Household income in Fort Belknap Agency?
Median Household Income in Fort Belknap Agency is $29,766.
What is Income or Wage Gap in Fort Belknap Agency?
Income or Wage Gap in Fort Belknap Agency is 24.4%.
Women in Fort Belknap Agency earn 75.6 cents for every dollar earned by a man.
What is Inequality or Gini Index in Fort Belknap Agency?
Inequality or Gini Index in Fort Belknap Agency is 0.48.
What is the Total Population of Fort Belknap Agency?
Total Population of Fort Belknap Agency is 1,473.
What is the Total Male Population of Fort Belknap Agency?
Total Male Population of Fort Belknap Agency is 768.
What is the Total Female Population of Fort Belknap Agency?
Total Female Population of Fort Belknap Agency is 705.
What is the Ratio of Males per 100 Females in Fort Belknap Agency?
There are 108.94 Males per 100 Females in Fort Belknap Agency.
What is the Ratio of Females per 100 Males in Fort Belknap Agency?
There are 91.80 Females per 100 Males in Fort Belknap Agency.
What is the Median Population Age in Fort Belknap Agency?
Median Population Age in Fort Belknap Agency is 22.9 Years.
What is the Average Family Size in Fort Belknap Agency
Average Family Size in Fort Belknap Agency is 4.4 People.
What is the Average Household Size in Fort Belknap Agency
Average Household Size in Fort Belknap Agency is 3.9 People.
How Large is the Labor Force in Fort Belknap Agency?
There are 438 People in the Labor Forcein in Fort Belknap Agency.
What is the Percentage of People in the Labor Force in Fort Belknap Agency?
46.9% of People are in the Labor Force in Fort Belknap Agency.
What is the Unemployment Rate in Fort Belknap Agency?
Unemployment Rate in Fort Belknap Agency is 36.3%.