Chinook, MT Map & Demographics
Chinook Map
Chinook Overview
$37,044
PER CAPITA INCOME
$102,708
AVG FAMILY INCOME
$47,067
AVG HOUSEHOLD INCOME
28.5%
WAGE / INCOME GAP [ % ]
71.5¢/ $1
WAGE / INCOME GAP [ $ ]
$7,500
FAMILY INCOME DEFICIT
0.49
INEQUALITY / GINI INDEX
1,488
TOTAL POPULATION
770
MALE POPULATION
718
FEMALE POPULATION
107.24
MALES / 100 FEMALES
93.25
FEMALES / 100 MALES
41.2
MEDIAN AGE
3.2
AVG FAMILY SIZE
2.1
AVG HOUSEHOLD SIZE
779
LABOR FORCE [ PEOPLE ]
69.3%
PERCENT IN LABOR FORCE
2.3%
UNEMPLOYMENT RATE
Chinook Zip Codes
Chinook Area Codes
Income in Chinook
Income Overview in Chinook
Per Capita Income in Chinook is $37,044, while median incomes of families and households are $102,708 and $47,067 respectively.
| Characteristic | Number | Measure |
| Per Capita Income | 1,488 | $37,044 |
| Median Family Income | 361 | $102,708 |
| Mean Family Income | 361 | $115,064 |
| Median Household Income | 699 | $47,067 |
| Mean Household Income | 699 | $75,603 |
| Income Deficit | 361 | $7,500 |
| Wage / Income Gap (%) | 1,488 | 28.48% |
| Wage / Income Gap ($) | 1,488 | 71.52¢ per $1 |
| Gini / Inequality Index | 1,488 | 0.49 |
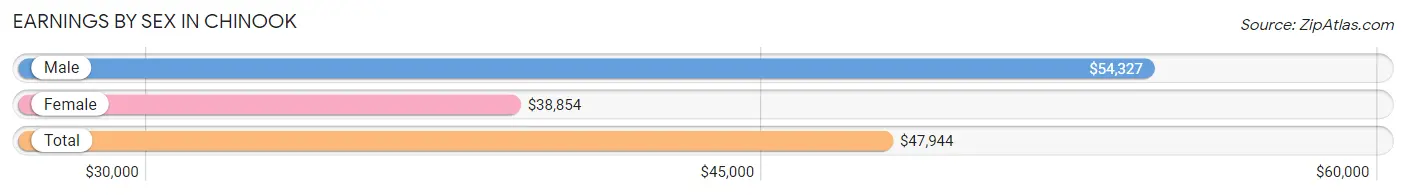
Earnings by Sex in Chinook
Average Earnings in Chinook are $47,944, $54,327 for men and $38,854 for women, a difference of 28.5%.
| Sex | Number | Average Earnings |
| Male | 409 (50.4%) | $54,327 |
| Female | 403 (49.6%) | $38,854 |
| Total | 812 (100.0%) | $47,944 |
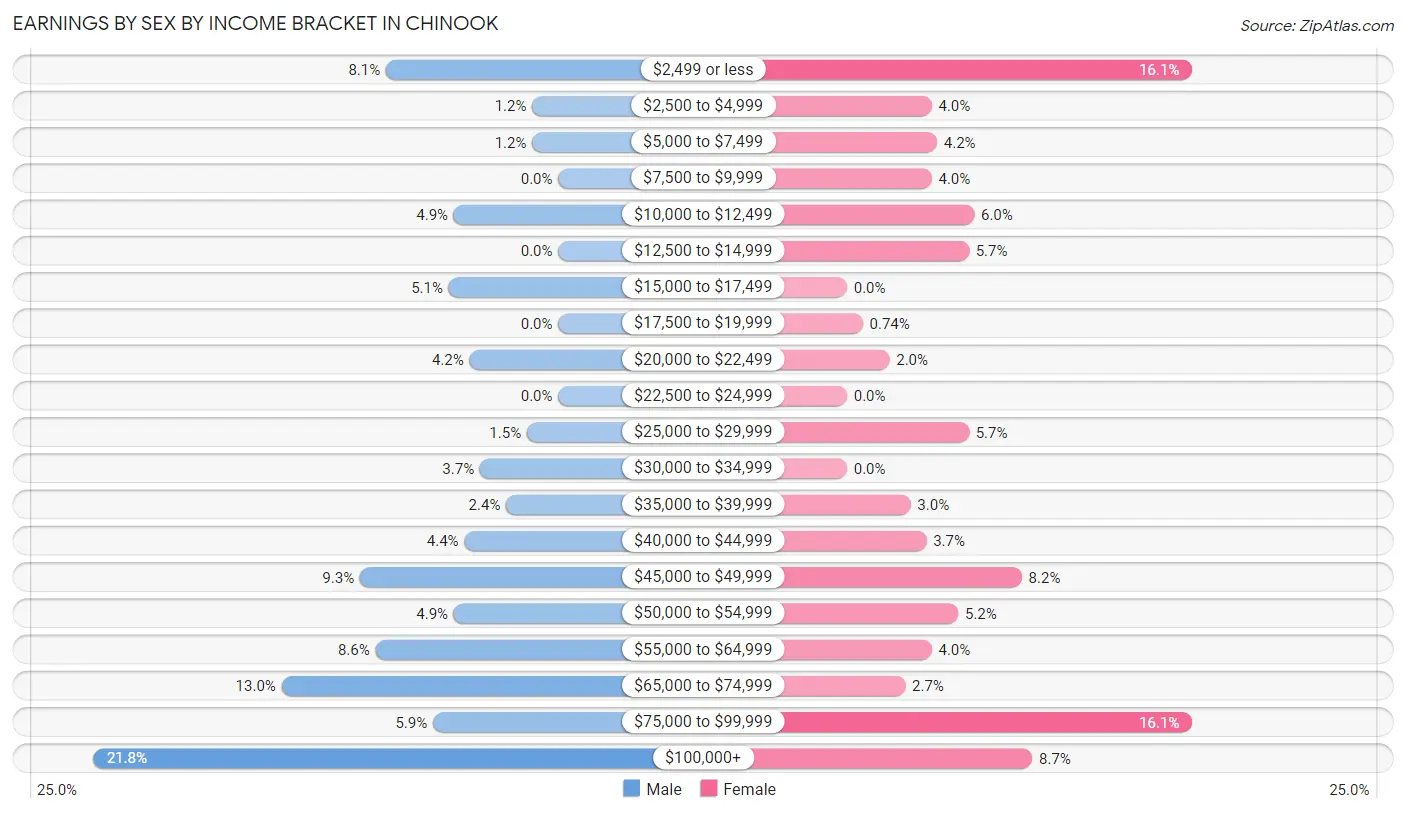
Earnings by Sex by Income Bracket in Chinook
The most common earnings brackets in Chinook are $100,000+ for men (89 | 21.8%) and $2,499 or less for women (65 | 16.1%).
| Income | Male | Female |
| $2,499 or less | 33 (8.1%) | 65 (16.1%) |
| $2,500 to $4,999 | 5 (1.2%) | 16 (4.0%) |
| $5,000 to $7,499 | 5 (1.2%) | 17 (4.2%) |
| $7,500 to $9,999 | 0 (0.0%) | 16 (4.0%) |
| $10,000 to $12,499 | 20 (4.9%) | 24 (6.0%) |
| $12,500 to $14,999 | 0 (0.0%) | 23 (5.7%) |
| $15,000 to $17,499 | 21 (5.1%) | 0 (0.0%) |
| $17,500 to $19,999 | 0 (0.0%) | 3 (0.7%) |
| $20,000 to $22,499 | 17 (4.2%) | 8 (2.0%) |
| $22,500 to $24,999 | 0 (0.0%) | 0 (0.0%) |
| $25,000 to $29,999 | 6 (1.5%) | 23 (5.7%) |
| $30,000 to $34,999 | 15 (3.7%) | 0 (0.0%) |
| $35,000 to $39,999 | 10 (2.4%) | 12 (3.0%) |
| $40,000 to $44,999 | 18 (4.4%) | 15 (3.7%) |
| $45,000 to $49,999 | 38 (9.3%) | 33 (8.2%) |
| $50,000 to $54,999 | 20 (4.9%) | 21 (5.2%) |
| $55,000 to $64,999 | 35 (8.6%) | 16 (4.0%) |
| $65,000 to $74,999 | 53 (13.0%) | 11 (2.7%) |
| $75,000 to $99,999 | 24 (5.9%) | 65 (16.1%) |
| $100,000+ | 89 (21.8%) | 35 (8.7%) |
| Total | 409 (100.0%) | 403 (100.0%) |
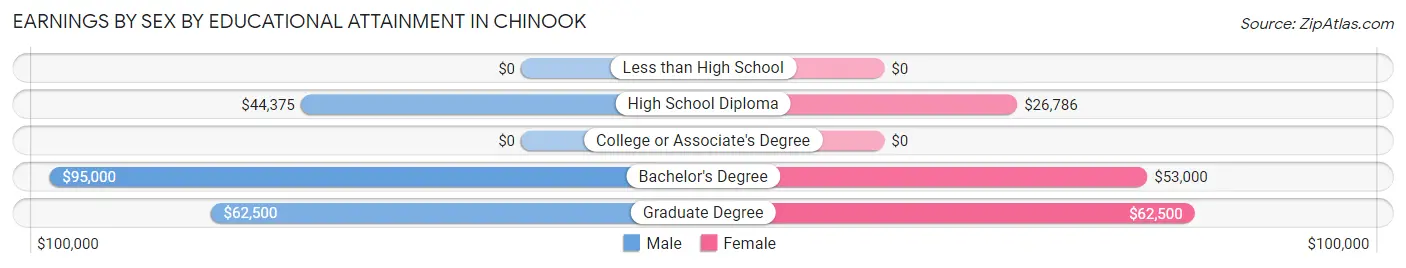
Earnings by Sex by Educational Attainment in Chinook
Average earnings in Chinook are $55,417 for men and $46,597 for women, a difference of 15.9%. Men with an educational attainment of bachelor's degree enjoy the highest average annual earnings of $95,000, while those with high school diploma education earn the least with $44,375. Women with an educational attainment of graduate degree earn the most with the average annual earnings of $62,500, while those with high school diploma education have the smallest earnings of $26,786.
| Educational Attainment | Male Income | Female Income |
| Less than High School | - | - |
| High School Diploma | $44,375 | $26,786 |
| College or Associate's Degree | - | - |
| Bachelor's Degree | $95,000 | $53,000 |
| Graduate Degree | $62,500 | $62,500 |
| Total | $55,417 | $46,597 |
Family Income in Chinook
Family Income Brackets in Chinook
According to the Chinook family income data, there are 108 families falling into the $100,000 to $149,999 income range, which is the most common income bracket and makes up 29.9% of all families.
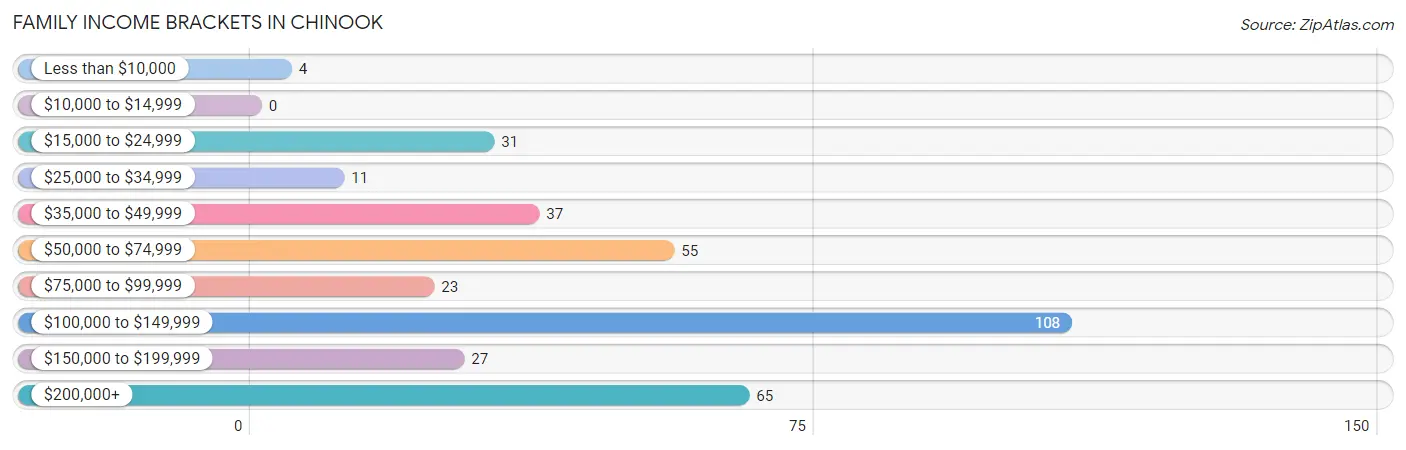
| Income Bracket | # Families | % Families |
| Less than $10,000 | 4 | 1.1% |
| $10,000 to $14,999 | 0 | 0.0% |
| $15,000 to $24,999 | 31 | 8.6% |
| $25,000 to $34,999 | 11 | 3.0% |
| $35,000 to $49,999 | 37 | 10.2% |
| $50,000 to $74,999 | 55 | 15.2% |
| $75,000 to $99,999 | 23 | 6.4% |
| $100,000 to $149,999 | 108 | 29.9% |
| $150,000 to $199,999 | 27 | 7.5% |
| $200,000+ | 65 | 18.0% |
Family Income by Famaliy Size in Chinook
4-person families (56 | 15.5%) account for the highest median family income in Chinook with $121,875 per family, while 2-person families (147 | 40.7%) have the highest median income of $36,625 per family member.
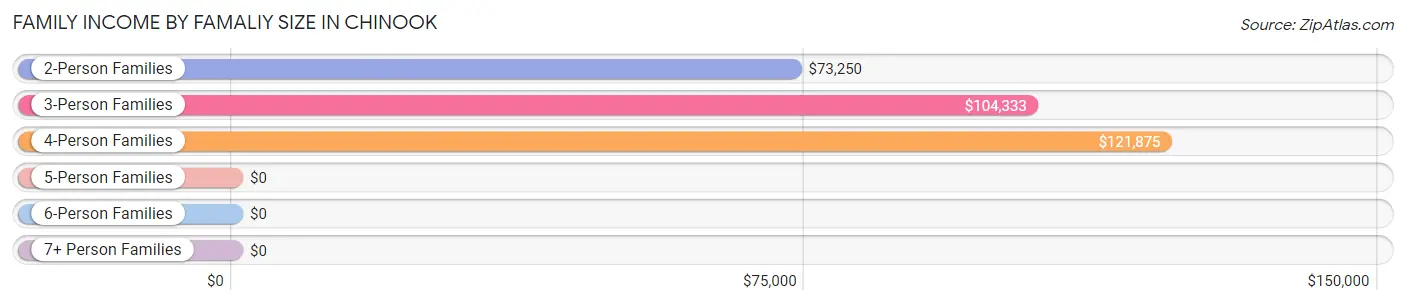
| Income Bracket | # Families | Median Income |
| 2-Person Families | 147 (40.7%) | $73,250 |
| 3-Person Families | 76 (21.0%) | $104,333 |
| 4-Person Families | 56 (15.5%) | $121,875 |
| 5-Person Families | 45 (12.5%) | $0 |
| 6-Person Families | 37 (10.2%) | $0 |
| 7+ Person Families | 0 (0.0%) | $0 |
| Total | 361 (100.0%) | $102,708 |
Family Income by Number of Earners in Chinook
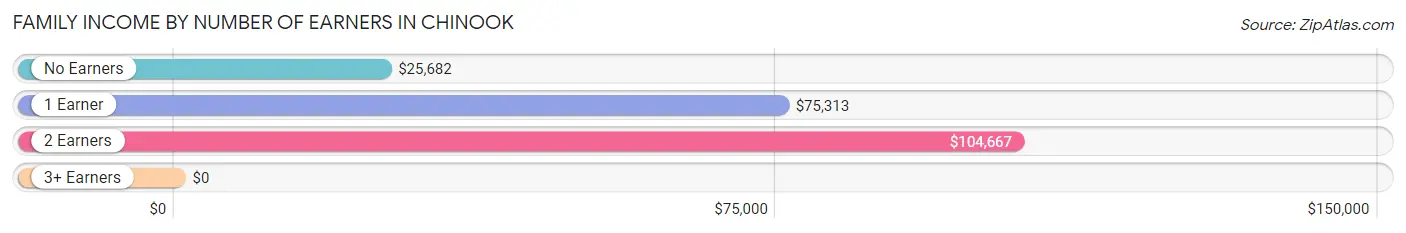
| Number of Earners | # Families | Median Income |
| No Earners | 38 (10.5%) | $25,682 |
| 1 Earner | 104 (28.8%) | $75,313 |
| 2 Earners | 198 (54.8%) | $104,667 |
| 3+ Earners | 21 (5.8%) | $0 |
| Total | 361 (100.0%) | $102,708 |
Household Income in Chinook
Household Income Brackets in Chinook
With 141 households falling in the category, the $15,000 to $24,999 income range is the most frequent in Chinook, accounting for 20.2% of all households. In contrast, only 14 households (2.0%) fall into the $10,000 to $14,999 income bracket, making it the least populous group.
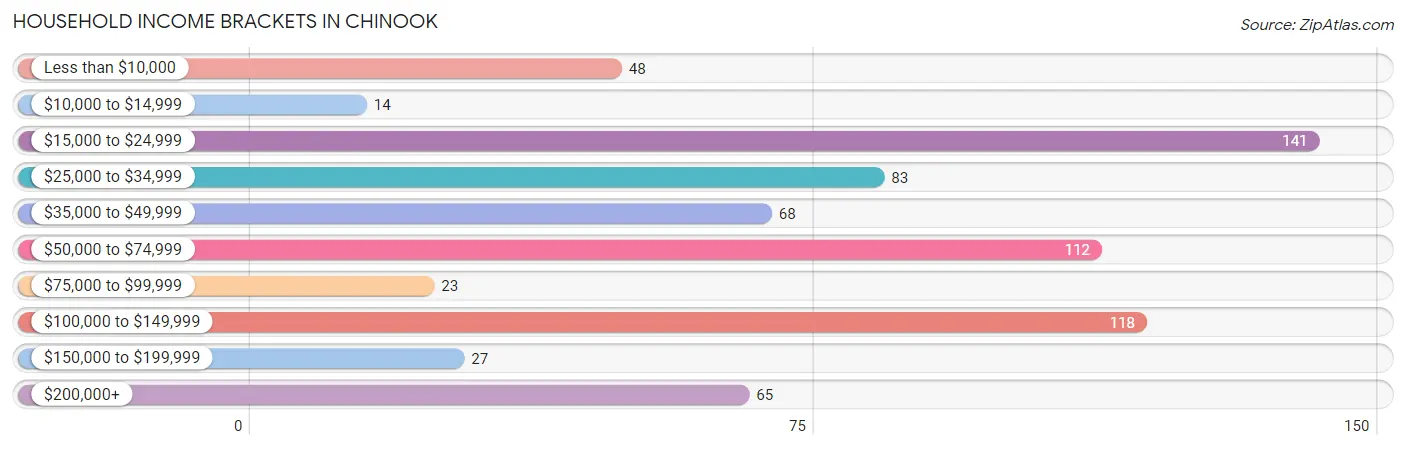
| Income Bracket | # Households | % Households |
| Less than $10,000 | 48 | 6.9% |
| $10,000 to $14,999 | 14 | 2.0% |
| $15,000 to $24,999 | 141 | 20.2% |
| $25,000 to $34,999 | 83 | 11.9% |
| $35,000 to $49,999 | 68 | 9.7% |
| $50,000 to $74,999 | 112 | 16.0% |
| $75,000 to $99,999 | 23 | 3.3% |
| $100,000 to $149,999 | 118 | 16.9% |
| $150,000 to $199,999 | 27 | 3.9% |
| $200,000+ | 65 | 9.3% |
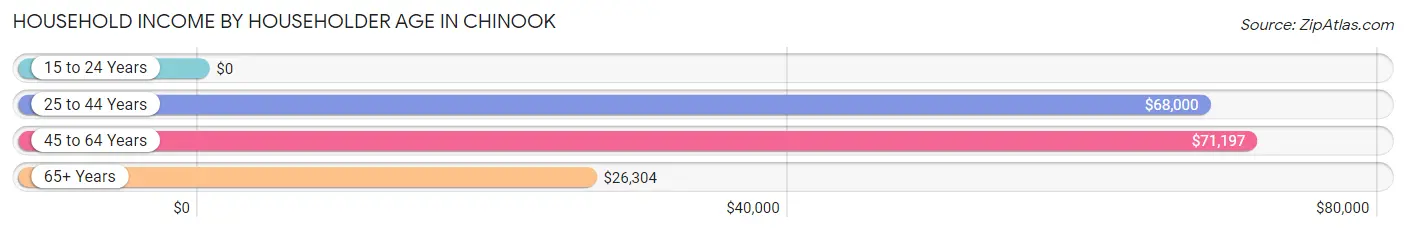
Household Income by Householder Age in Chinook
The median household income in Chinook is $47,067, with the highest median household income of $71,197 found in the 45 to 64 years age bracket for the primary householder. A total of 255 households (36.5%) fall into this category.
| Income Bracket | # Households | Median Income |
| 15 to 24 Years | 0 (0.0%) | $0 |
| 25 to 44 Years | 220 (31.5%) | $68,000 |
| 45 to 64 Years | 255 (36.5%) | $71,197 |
| 65+ Years | 224 (32.1%) | $26,304 |
| Total | 699 (100.0%) | $47,067 |
Poverty in Chinook
Income Below Poverty by Sex and Age in Chinook
With 9.8% poverty level for males and 9.9% for females among the residents of Chinook, 55 to 64 year old males and 25 to 34 year old females are the most vulnerable to poverty, with 21 males (25.0%) and 27 females (30.0%) in their respective age groups living below the poverty level.
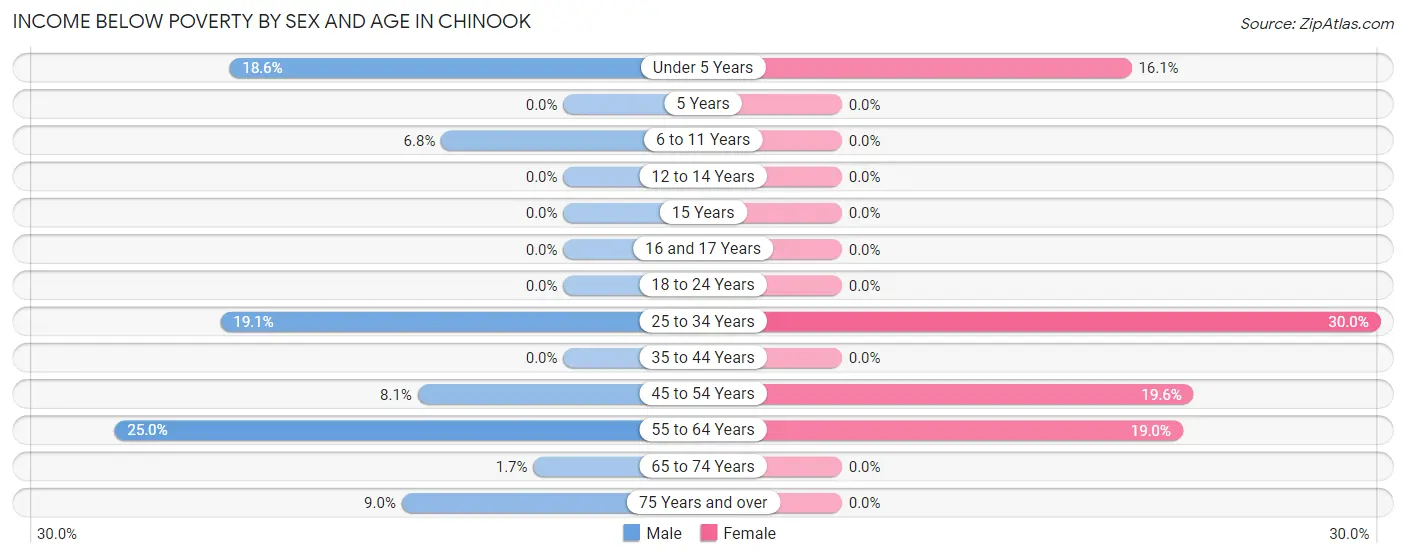
| Age Bracket | Male | Female |
| Under 5 Years | 8 (18.6%) | 10 (16.1%) |
| 5 Years | 0 (0.0%) | 0 (0.0%) |
| 6 to 11 Years | 7 (6.8%) | 0 (0.0%) |
| 12 to 14 Years | 0 (0.0%) | 0 (0.0%) |
| 15 Years | 0 (0.0%) | 0 (0.0%) |
| 16 and 17 Years | 0 (0.0%) | 0 (0.0%) |
| 18 to 24 Years | 0 (0.0%) | 0 (0.0%) |
| 25 to 34 Years | 17 (19.1%) | 27 (30.0%) |
| 35 to 44 Years | 0 (0.0%) | 0 (0.0%) |
| 45 to 54 Years | 12 (8.1%) | 19 (19.6%) |
| 55 to 64 Years | 21 (25.0%) | 15 (19.0%) |
| 65 to 74 Years | 1 (1.7%) | 0 (0.0%) |
| 75 Years and over | 9 (9.0%) | 0 (0.0%) |
| Total | 75 (9.8%) | 71 (9.9%) |
Income Above Poverty by Sex and Age in Chinook
According to the poverty statistics in Chinook, males aged 5 years and females aged 5 years are the age groups that are most secure financially, with 100.0% of males and 100.0% of females in these age groups living above the poverty line.
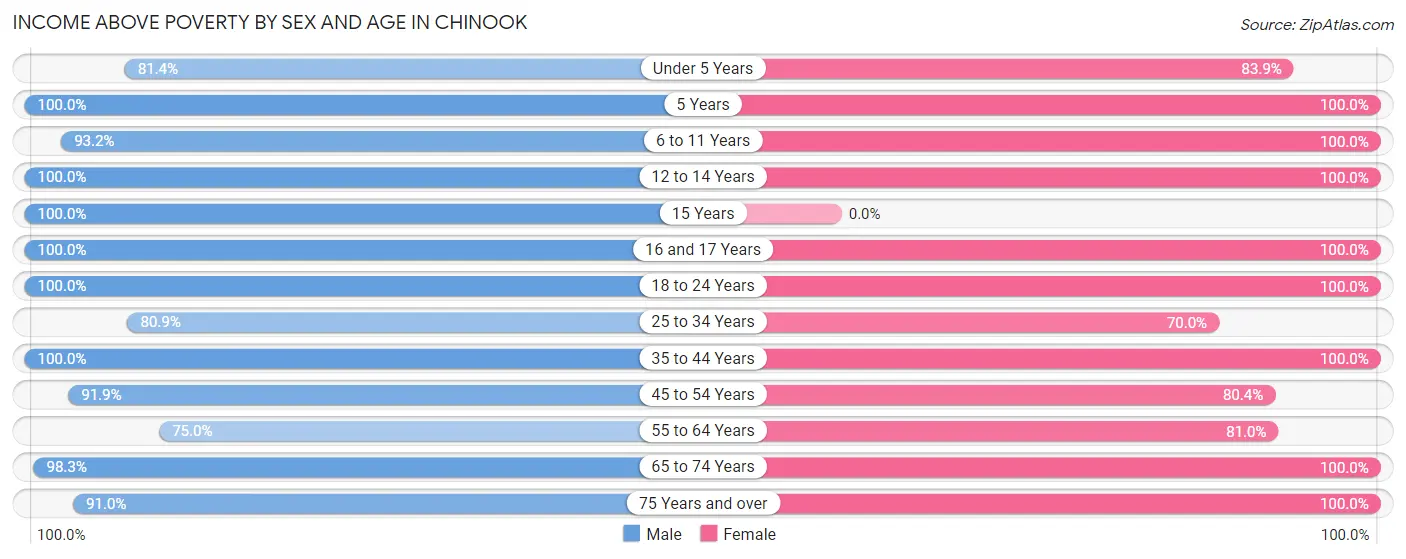
| Age Bracket | Male | Female |
| Under 5 Years | 35 (81.4%) | 52 (83.9%) |
| 5 Years | 3 (100.0%) | 3 (100.0%) |
| 6 to 11 Years | 96 (93.2%) | 26 (100.0%) |
| 12 to 14 Years | 24 (100.0%) | 75 (100.0%) |
| 15 Years | 24 (100.0%) | 0 (0.0%) |
| 16 and 17 Years | 15 (100.0%) | 30 (100.0%) |
| 18 to 24 Years | 7 (100.0%) | 34 (100.0%) |
| 25 to 34 Years | 72 (80.9%) | 63 (70.0%) |
| 35 to 44 Years | 69 (100.0%) | 76 (100.0%) |
| 45 to 54 Years | 136 (91.9%) | 78 (80.4%) |
| 55 to 64 Years | 63 (75.0%) | 64 (81.0%) |
| 65 to 74 Years | 59 (98.3%) | 74 (100.0%) |
| 75 Years and over | 91 (91.0%) | 72 (100.0%) |
| Total | 694 (90.2%) | 647 (90.1%) |
Income Below Poverty Among Married-Couple Families in Chinook
The poverty statistics for married-couple families in Chinook show that 11.3% or 33 of the total 293 families live below the poverty line. Families with 3 or 4 children have the highest poverty rate of 20.7%, comprising of 17 families. On the other hand, families with 1 or 2 children have the lowest poverty rate of 0.0%, which includes 0 families.
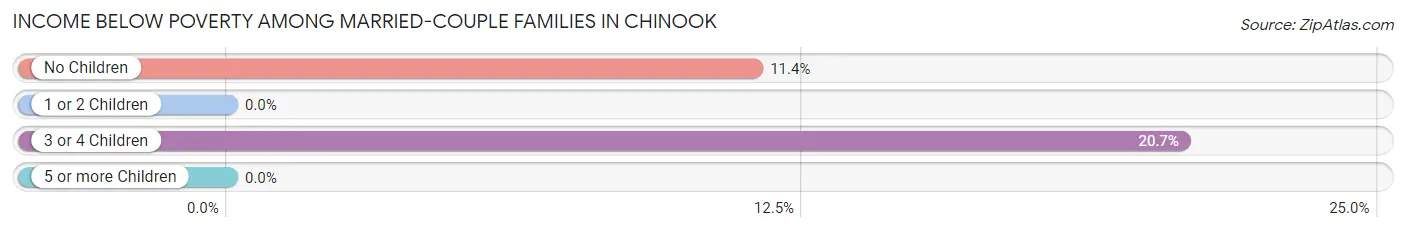
| Children | Above Poverty | Below Poverty |
| No Children | 124 (88.6%) | 16 (11.4%) |
| 1 or 2 Children | 71 (100.0%) | 0 (0.0%) |
| 3 or 4 Children | 65 (79.3%) | 17 (20.7%) |
| 5 or more Children | 0 (0.0%) | 0 (0.0%) |
| Total | 260 (88.7%) | 33 (11.3%) |
Income Below Poverty Among Single-Parent Households in Chinook
| Children | Single Father | Single Mother |
| No Children | 0 (0.0%) | 0 (0.0%) |
| 1 or 2 Children | 0 (0.0%) | 0 (0.0%) |
| 3 or 4 Children | 0 (0.0%) | 0 (0.0%) |
| 5 or more Children | 0 (0.0%) | 0 (0.0%) |
| Total | 0 (0.0%) | 0 (0.0%) |
Income Below Poverty Among Married-Couple vs Single-Parent Households in Chinook
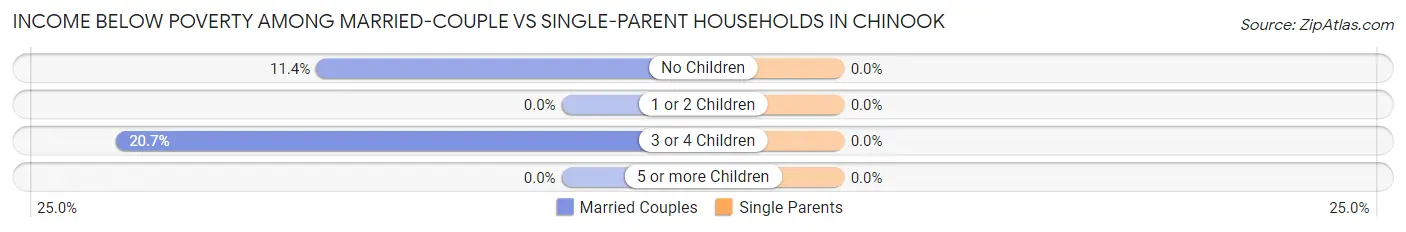
| Children | Married-Couple Families | Single-Parent Households |
| No Children | 16 (11.4%) | 0 (0.0%) |
| 1 or 2 Children | 0 (0.0%) | 0 (0.0%) |
| 3 or 4 Children | 17 (20.7%) | 0 (0.0%) |
| 5 or more Children | 0 (0.0%) | 0 (0.0%) |
| Total | 33 (11.3%) | 0 (0.0%) |
Race in Chinook
The most populous races in Chinook are White / Caucasian (1,395 | 93.8%), Native / Alaskan (58 | 3.9%), and Black / African American (25 | 1.7%).
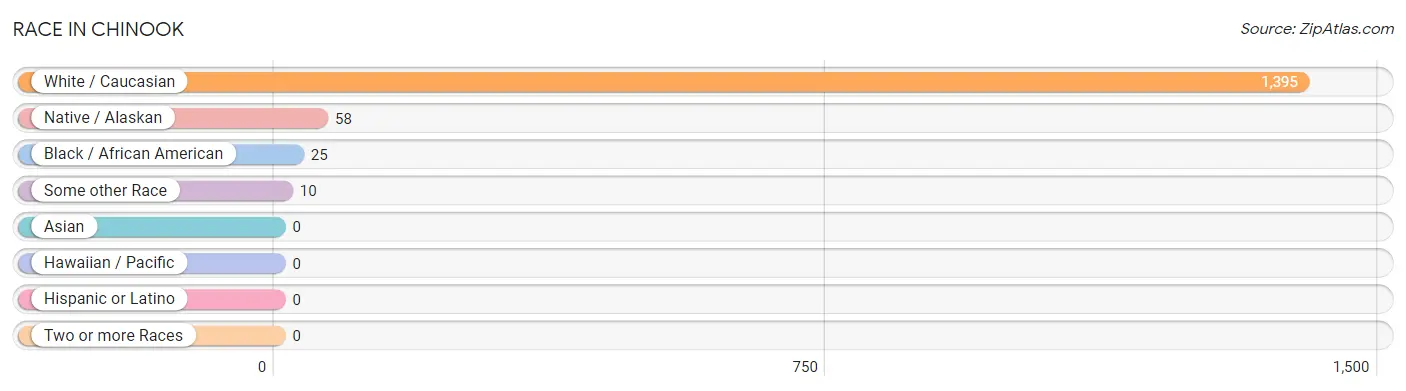
| Race | # Population | % Population |
| Asian | 0 | 0.0% |
| Black / African American | 25 | 1.7% |
| Hawaiian / Pacific | 0 | 0.0% |
| Hispanic or Latino | 0 | 0.0% |
| Native / Alaskan | 58 | 3.9% |
| White / Caucasian | 1,395 | 93.8% |
| Two or more Races | 0 | 0.0% |
| Some other Race | 10 | 0.7% |
| Total | 1,488 | 100.0% |
Ancestry in Chinook
The most populous ancestries reported in Chinook are German (318 | 21.4%), English (257 | 17.3%), Norwegian (210 | 14.1%), American (150 | 10.1%), and Swedish (129 | 8.7%), together accounting for 71.5% of all Chinook residents.
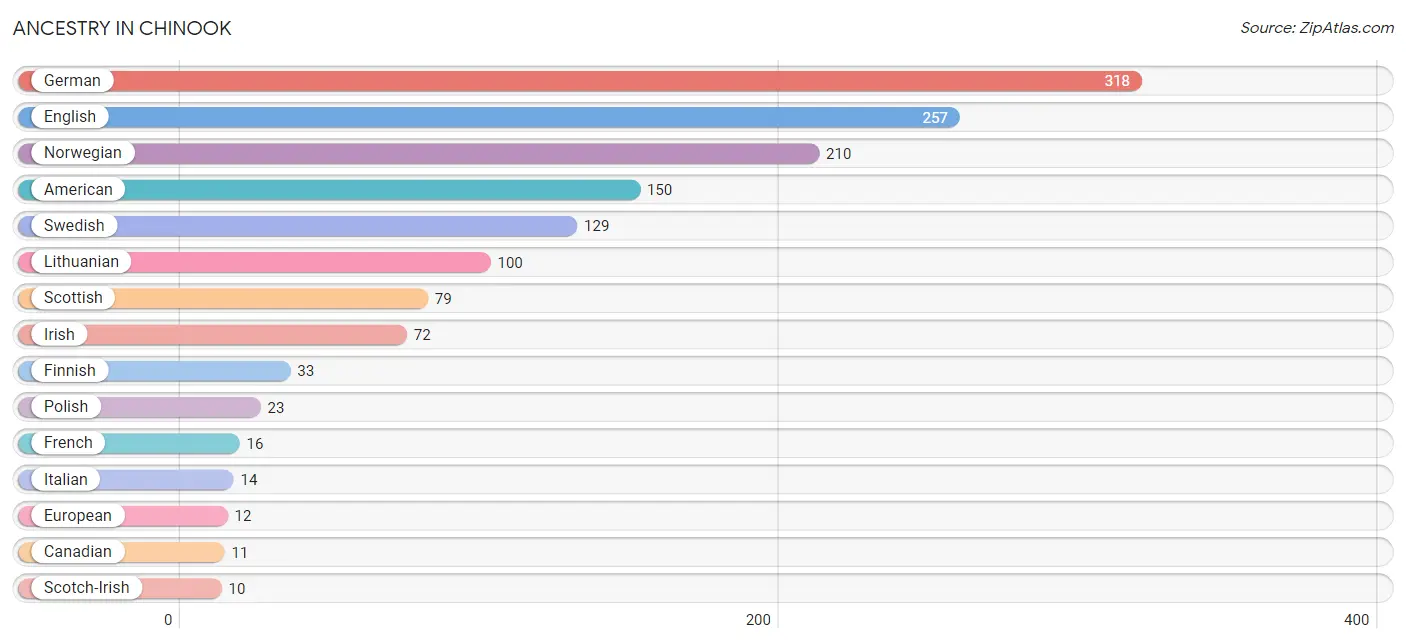
| Ancestry | # Population | % Population |
| American | 150 | 10.1% |
| Austrian | 5 | 0.3% |
| Canadian | 11 | 0.7% |
| Danish | 8 | 0.5% |
| English | 257 | 17.3% |
| European | 12 | 0.8% |
| Finnish | 33 | 2.2% |
| French | 16 | 1.1% |
| German | 318 | 21.4% |
| Irish | 72 | 4.8% |
| Italian | 14 | 0.9% |
| Lithuanian | 100 | 6.7% |
| Norwegian | 210 | 14.1% |
| Polish | 23 | 1.5% |
| Russian | 7 | 0.5% |
| Scandinavian | 8 | 0.5% |
| Scotch-Irish | 10 | 0.7% |
| Scottish | 79 | 5.3% |
| Swedish | 129 | 8.7% | View All 19 Rows |
Immigrants in Chinook
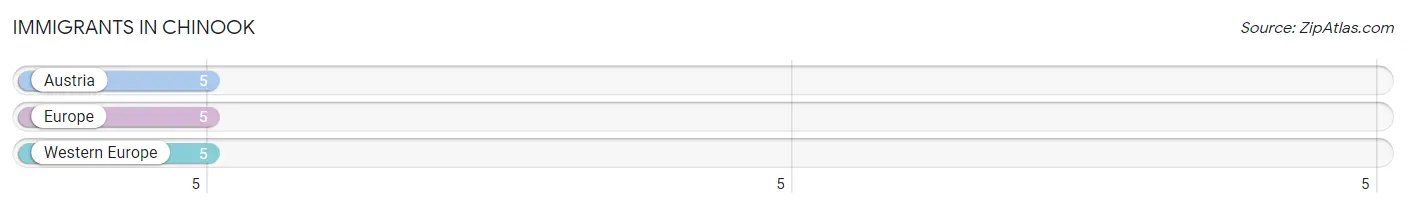
The most numerous immigrant groups reported in Chinook came from Austria (5 | 0.3%), Europe (5 | 0.3%), and Western Europe (5 | 0.3%), together accounting for 1.0% of all Chinook residents.
| Immigration Origin | # Population | % Population |
| Austria | 5 | 0.3% |
| Europe | 5 | 0.3% |
| Western Europe | 5 | 0.3% | View All 3 Rows |
Sex and Age in Chinook
Sex and Age in Chinook
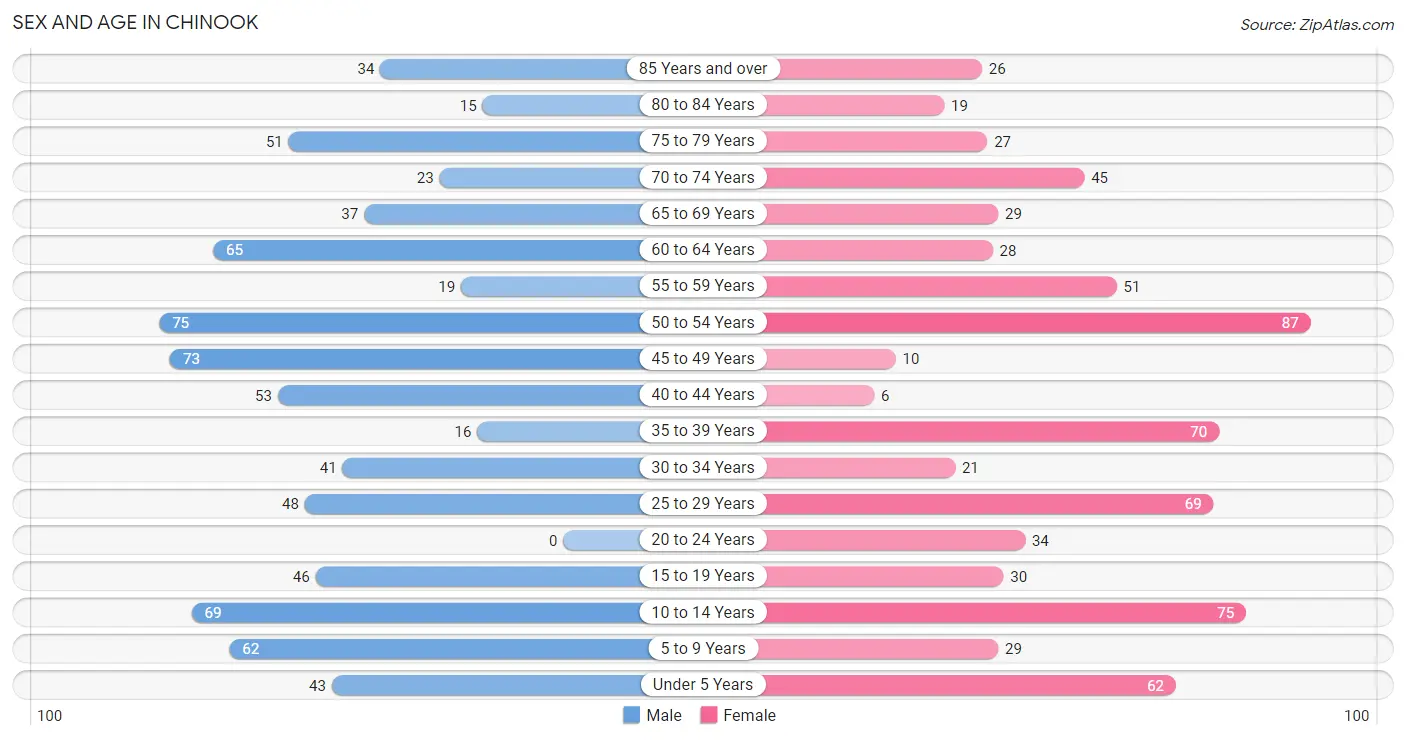
The most populous age groups in Chinook are 50 to 54 Years (75 | 9.7%) for men and 50 to 54 Years (87 | 12.1%) for women.
| Age Bracket | Male | Female |
| Under 5 Years | 43 (5.6%) | 62 (8.6%) |
| 5 to 9 Years | 62 (8.1%) | 29 (4.0%) |
| 10 to 14 Years | 69 (9.0%) | 75 (10.4%) |
| 15 to 19 Years | 46 (6.0%) | 30 (4.2%) |
| 20 to 24 Years | 0 (0.0%) | 34 (4.7%) |
| 25 to 29 Years | 48 (6.2%) | 69 (9.6%) |
| 30 to 34 Years | 41 (5.3%) | 21 (2.9%) |
| 35 to 39 Years | 16 (2.1%) | 70 (9.8%) |
| 40 to 44 Years | 53 (6.9%) | 6 (0.8%) |
| 45 to 49 Years | 73 (9.5%) | 10 (1.4%) |
| 50 to 54 Years | 75 (9.7%) | 87 (12.1%) |
| 55 to 59 Years | 19 (2.5%) | 51 (7.1%) |
| 60 to 64 Years | 65 (8.4%) | 28 (3.9%) |
| 65 to 69 Years | 37 (4.8%) | 29 (4.0%) |
| 70 to 74 Years | 23 (3.0%) | 45 (6.3%) |
| 75 to 79 Years | 51 (6.6%) | 27 (3.8%) |
| 80 to 84 Years | 15 (1.9%) | 19 (2.6%) |
| 85 Years and over | 34 (4.4%) | 26 (3.6%) |
| Total | 770 (100.0%) | 718 (100.0%) |
Families and Households in Chinook
Median Family Size in Chinook
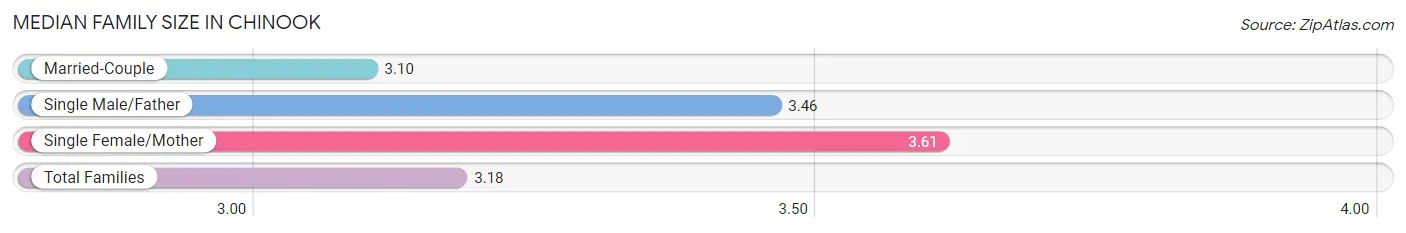
The median family size in Chinook is 3.18 persons per family, with single female/mother families (31 | 8.6%) accounting for the largest median family size of 3.61 persons per family. On the other hand, married-couple families (293 | 81.2%) represent the smallest median family size with 3.10 persons per family.
| Family Type | # Families | Family Size |
| Married-Couple | 293 (81.2%) | 3.10 |
| Single Male/Father | 37 (10.2%) | 3.46 |
| Single Female/Mother | 31 (8.6%) | 3.61 |
| Total Families | 361 (100.0%) | 3.18 |
Median Household Size in Chinook
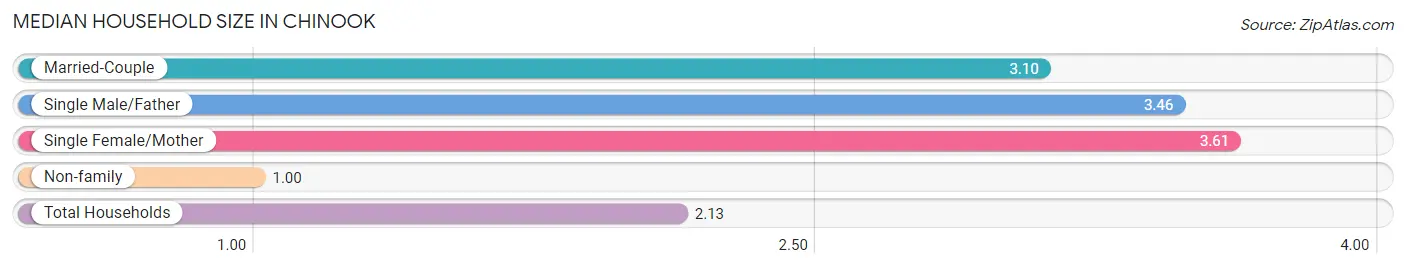
The median household size in Chinook is 2.13 persons per household, with single female/mother households (31 | 4.4%) accounting for the largest median household size of 3.61 persons per household. non-family households (338 | 48.3%) represent the smallest median household size with 1.00 persons per household.
| Household Type | # Households | Household Size |
| Married-Couple | 293 (41.9%) | 3.10 |
| Single Male/Father | 37 (5.3%) | 3.46 |
| Single Female/Mother | 31 (4.4%) | 3.61 |
| Non-family | 338 (48.3%) | 1.00 |
| Total Households | 699 (100.0%) | 2.13 |
Household Size by Marriage Status in Chinook
Out of a total of 699 households in Chinook, 361 (51.6%) are family households, while 338 (48.3%) are nonfamily households. The most numerous type of family households are 2-person households, comprising 147, and the most common type of nonfamily households are 1-person households, comprising 337.
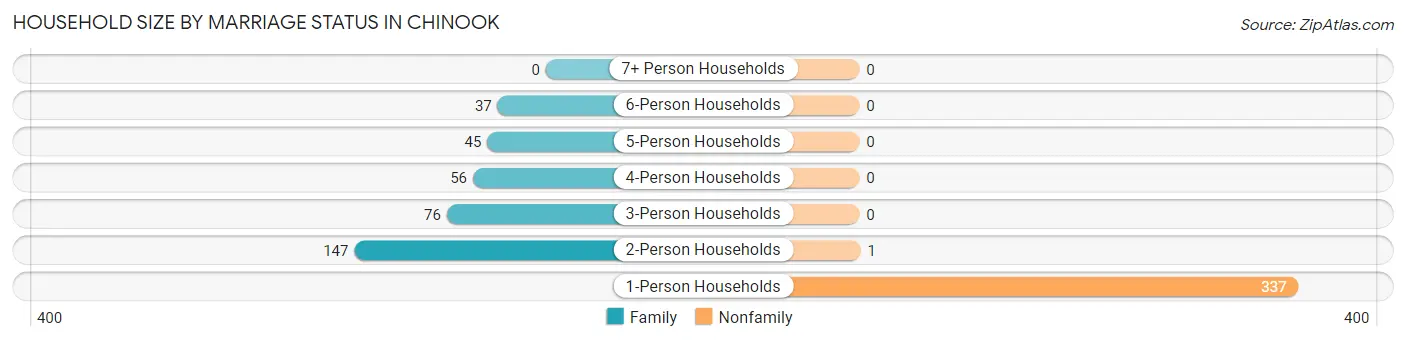
| Household Size | Family Households | Nonfamily Households |
| 1-Person Households | - | 337 (48.2%) |
| 2-Person Households | 147 (21.0%) | 1 (0.1%) |
| 3-Person Households | 76 (10.9%) | 0 (0.0%) |
| 4-Person Households | 56 (8.0%) | 0 (0.0%) |
| 5-Person Households | 45 (6.4%) | 0 (0.0%) |
| 6-Person Households | 37 (5.3%) | 0 (0.0%) |
| 7+ Person Households | 0 (0.0%) | 0 (0.0%) |
| Total | 361 (51.6%) | 338 (48.3%) |
Female Fertility in Chinook
Fertility by Age in Chinook
Average fertility rate in Chinook is 37.0 births per 1,000 women. Women in the age bracket of 20 to 34 years have the highest fertility rate with 81.0 births per 1,000 women. Women in the age bracket of 20 to 34 years acount for 100.0% of all women with births.
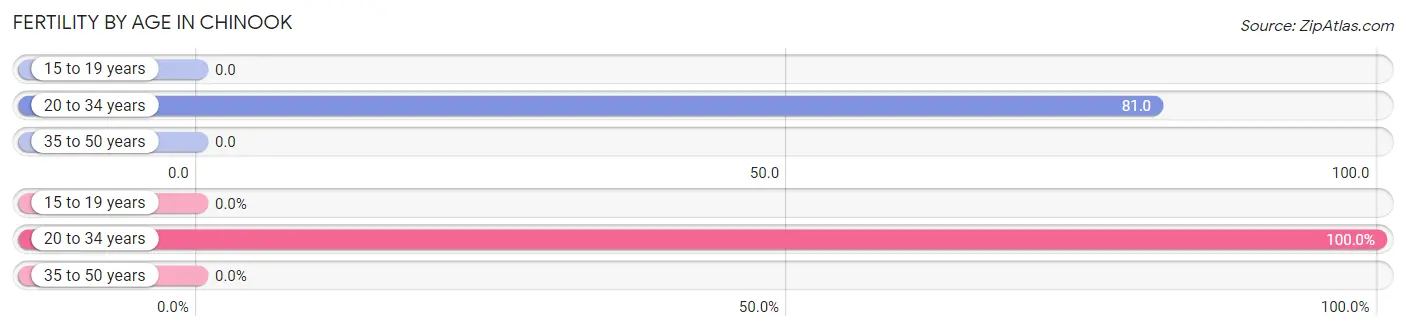
| Age Bracket | Women with Births | Births / 1,000 Women |
| 15 to 19 years | 0 (0.0%) | 0.0 |
| 20 to 34 years | 10 (100.0%) | 81.0 |
| 35 to 50 years | 0 (0.0%) | 0.0 |
| Total | 10 (100.0%) | 37.0 |
Fertility by Age by Marriage Status in Chinook
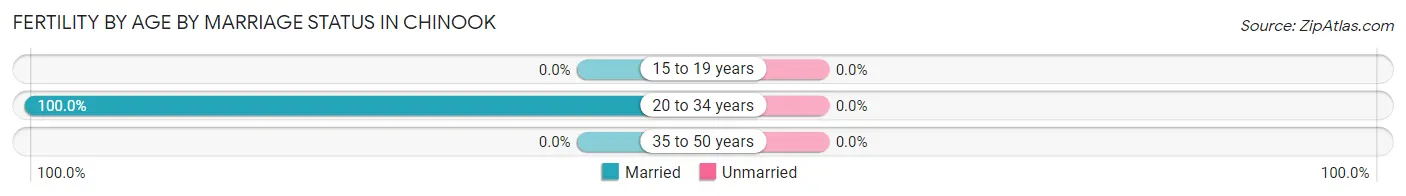
| Age Bracket | Married | Unmarried |
| 15 to 19 years | 0 (0.0%) | 0 (0.0%) |
| 20 to 34 years | 10 (100.0%) | 0 (0.0%) |
| 35 to 50 years | 0 (0.0%) | 0 (0.0%) |
| Total | 10 (100.0%) | 0 (0.0%) |
Fertility by Education in Chinook
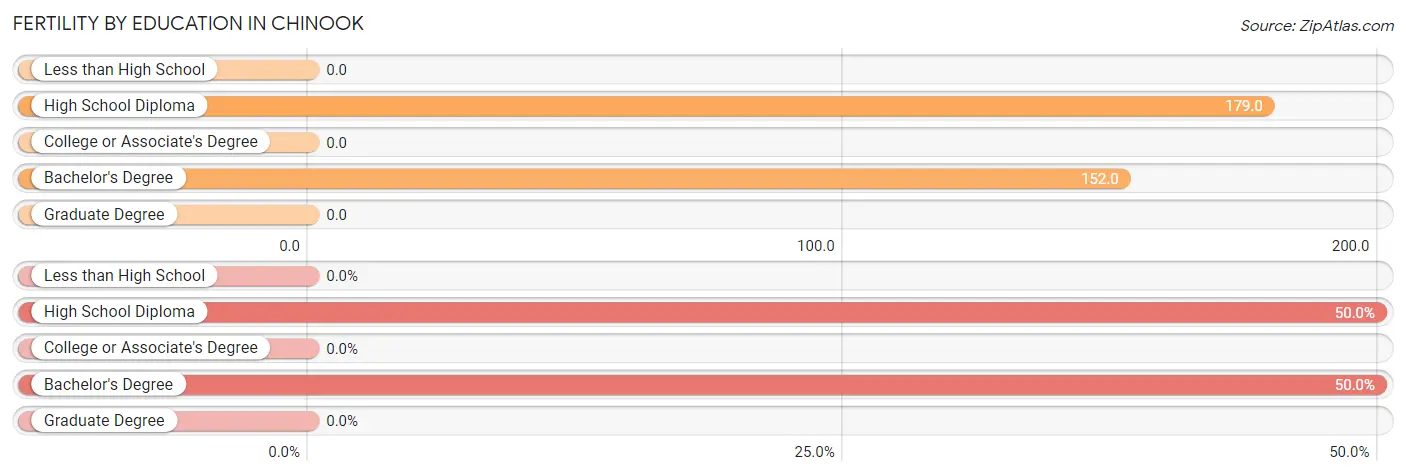
| Educational Attainment | Women with Births | Births / 1,000 Women |
| Less than High School | 0 (0.0%) | 0.0 |
| High School Diploma | 5 (50.0%) | 179.0 |
| College or Associate's Degree | 0 (0.0%) | 0.0 |
| Bachelor's Degree | 5 (50.0%) | 152.0 |
| Graduate Degree | 0 (0.0%) | 0.0 |
| Total | 10 (100.0%) | 37.0 |
Fertility by Education by Marriage Status in Chinook
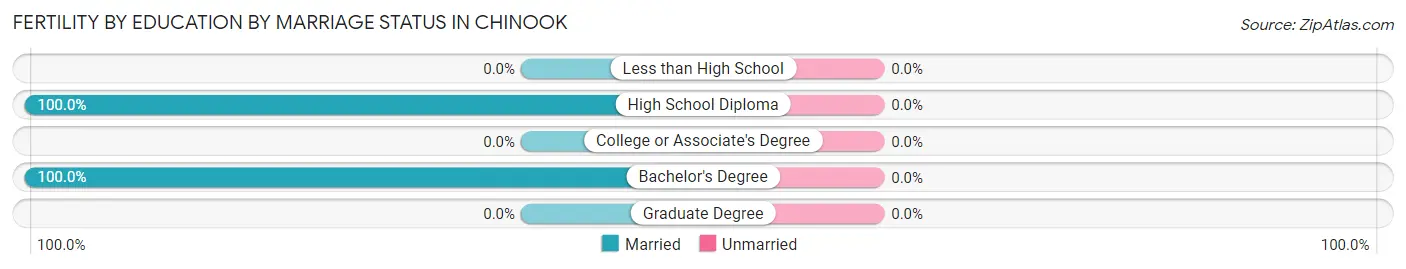
| Educational Attainment | Married | Unmarried |
| Less than High School | 0 (0.0%) | 0 (0.0%) |
| High School Diploma | 5 (100.0%) | 0 (0.0%) |
| College or Associate's Degree | 0 (0.0%) | 0 (0.0%) |
| Bachelor's Degree | 5 (100.0%) | 0 (0.0%) |
| Graduate Degree | 0 (0.0%) | 0 (0.0%) |
| Total | 10 (100.0%) | 0 (0.0%) |
Employment Characteristics in Chinook
Employment by Class of Employer in Chinook
Among the 734 employed individuals in Chinook, private company employees (362 | 49.3%), local government employees (141 | 19.2%), and self-employed (incorporated) (68 | 9.3%) make up the most common classes of employment.
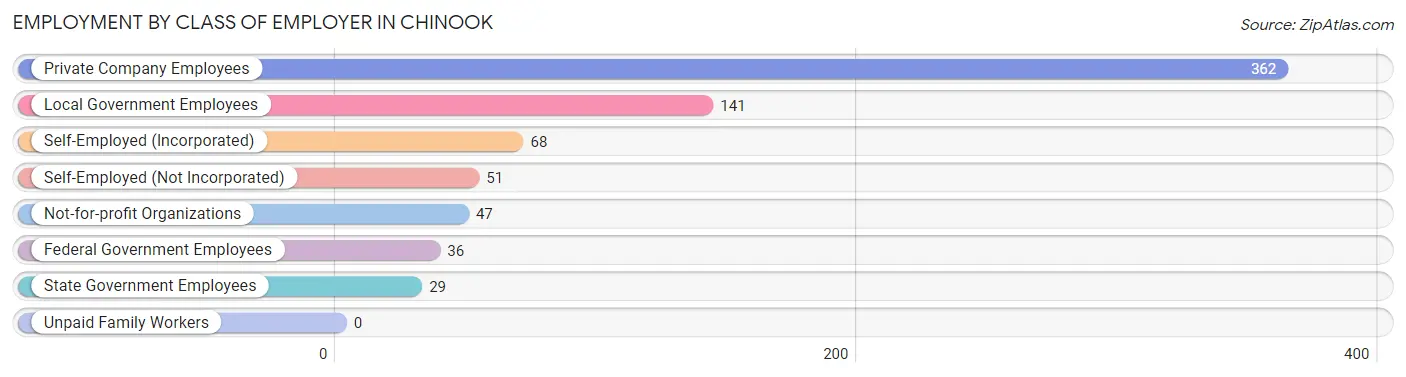
| Employer Class | # Employees | % Employees |
| Private Company Employees | 362 | 49.3% |
| Self-Employed (Incorporated) | 68 | 9.3% |
| Self-Employed (Not Incorporated) | 51 | 7.0% |
| Not-for-profit Organizations | 47 | 6.4% |
| Local Government Employees | 141 | 19.2% |
| State Government Employees | 29 | 4.0% |
| Federal Government Employees | 36 | 4.9% |
| Unpaid Family Workers | 0 | 0.0% |
| Total | 734 | 100.0% |
Employment Status by Age in Chinook
According to the labor force statistics for Chinook, out of the total population over 16 years of age (1,124), 69.3% or 779 individuals are in the labor force, with 2.3% or 18 of them unemployed. The age group with the highest labor force participation rate is 20 to 24 years, with 100.0% or 34 individuals in the labor force. Within the labor force, the 16 to 19 years age range has the highest percentage of unemployed individuals, with 20.0% or 7 of them being unemployed.
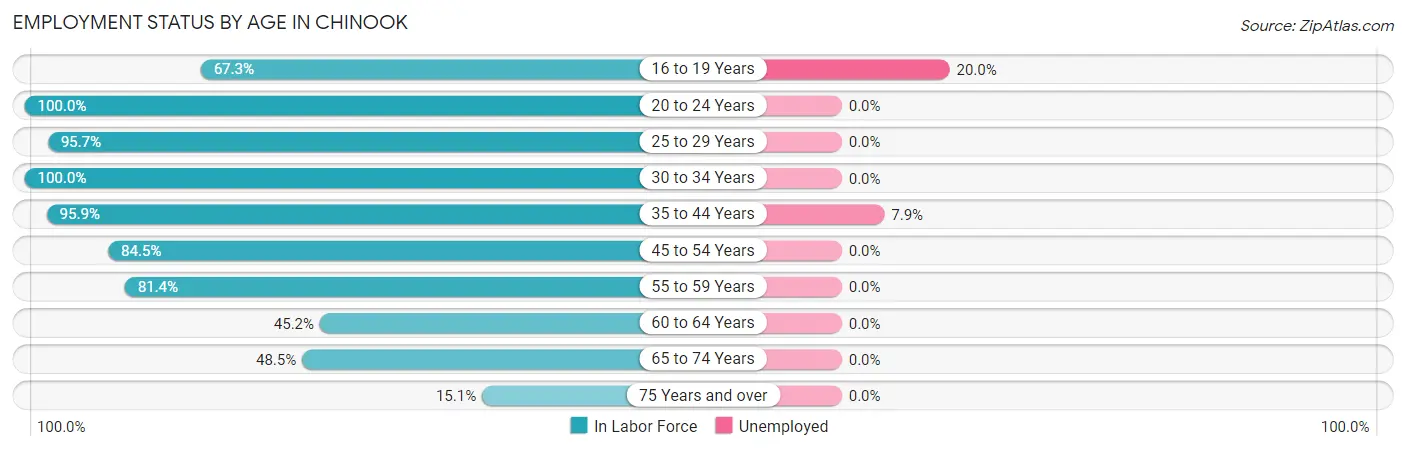
| Age Bracket | In Labor Force | Unemployed |
| 16 to 19 Years | 35 (67.3%) | 7 (20.0%) |
| 20 to 24 Years | 34 (100.0%) | 0 (0.0%) |
| 25 to 29 Years | 112 (95.7%) | 0 (0.0%) |
| 30 to 34 Years | 62 (100.0%) | 0 (0.0%) |
| 35 to 44 Years | 139 (95.9%) | 11 (7.9%) |
| 45 to 54 Years | 207 (84.5%) | 0 (0.0%) |
| 55 to 59 Years | 57 (81.4%) | 0 (0.0%) |
| 60 to 64 Years | 42 (45.2%) | 0 (0.0%) |
| 65 to 74 Years | 65 (48.5%) | 0 (0.0%) |
| 75 Years and over | 26 (15.1%) | 0 (0.0%) |
| Total | 779 (69.3%) | 18 (2.3%) |
Employment Status by Educational Attainment in Chinook
According to labor force statistics for Chinook, 84.6% of individuals (619) out of the total population between 25 and 64 years of age (732) are in the labor force, with 1.8% or 11 of them being unemployed. The group with the highest labor force participation rate are those with the educational attainment of less than high school, with 100.0% or 34 individuals in the labor force. Within the labor force, individuals with college / associate degree education have the highest percentage of unemployment, with 7.1% or 11 of them being unemployed.
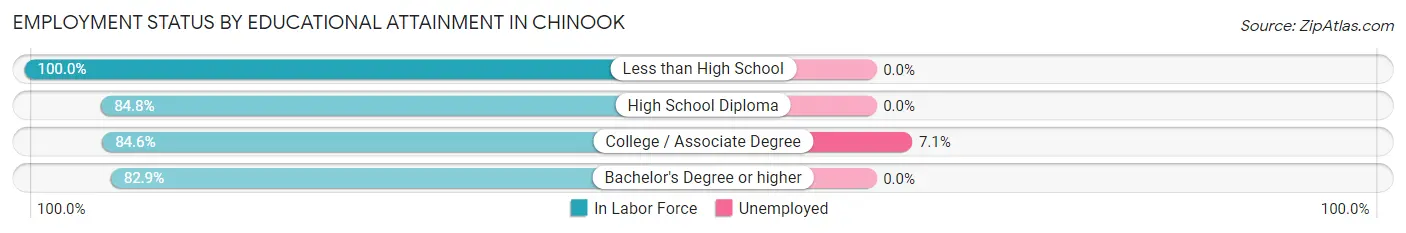
| Educational Attainment | In Labor Force | Unemployed |
| Less than High School | 34 (100.0%) | 0 (0.0%) |
| High School Diploma | 145 (84.8%) | 0 (0.0%) |
| College / Associate Degree | 154 (84.6%) | 13 (7.1%) |
| Bachelor's Degree or higher | 286 (82.9%) | 0 (0.0%) |
| Total | 619 (84.6%) | 13 (1.8%) |
Employment Occupations by Sex in Chinook
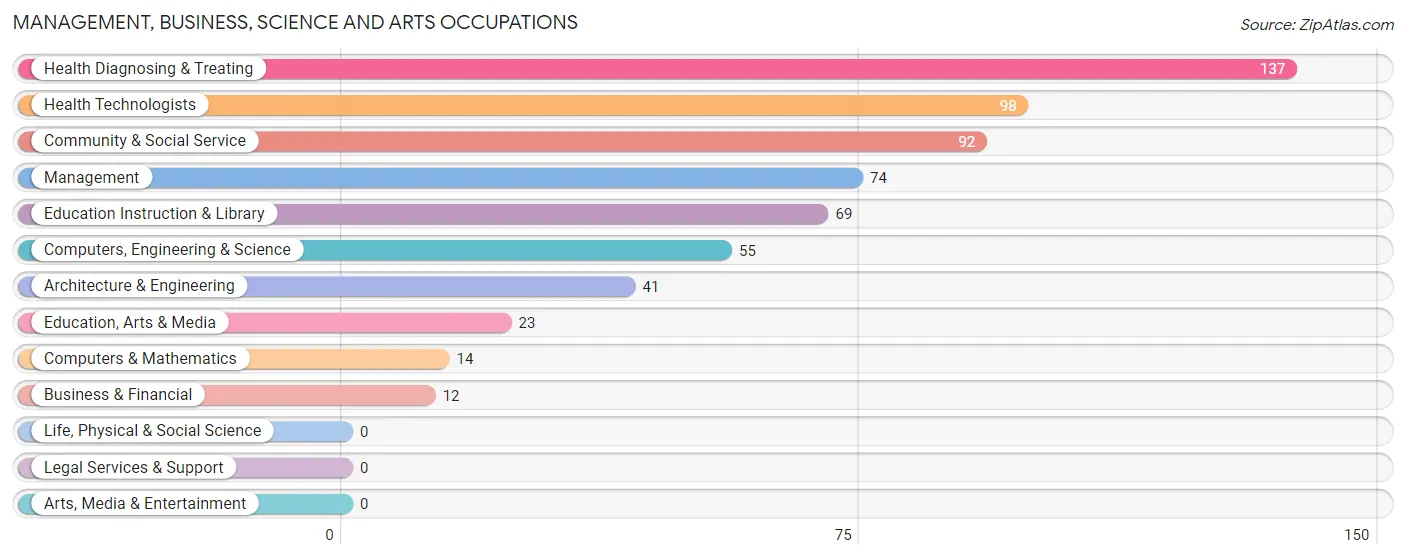
Management, Business, Science and Arts Occupations
The most common Management, Business, Science and Arts occupations in Chinook are Health Diagnosing & Treating (137 | 18.0%), Health Technologists (98 | 12.9%), Community & Social Service (92 | 12.1%), Management (74 | 9.7%), and Education Instruction & Library (69 | 9.1%).
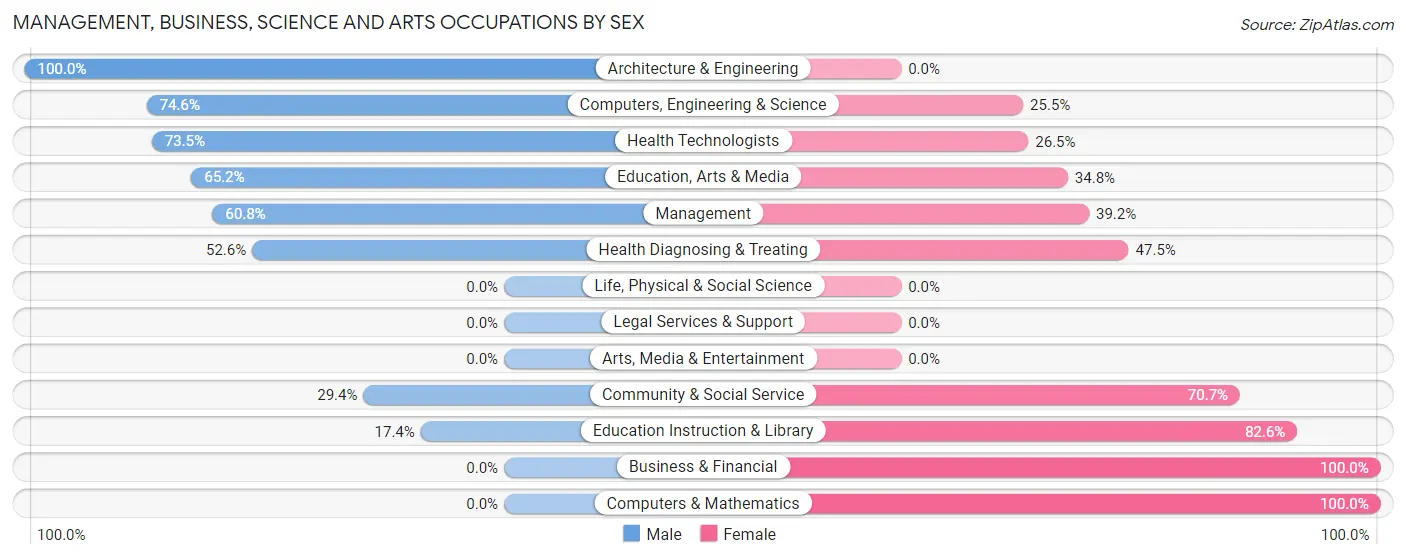
Management, Business, Science and Arts Occupations by Sex
Within the Management, Business, Science and Arts occupations in Chinook, the most male-oriented occupations are Architecture & Engineering (100.0%), Computers, Engineering & Science (74.6%), and Health Technologists (73.5%), while the most female-oriented occupations are Business & Financial (100.0%), Computers & Mathematics (100.0%), and Education Instruction & Library (82.6%).
| Occupation | Male | Female |
| Management | 45 (60.8%) | 29 (39.2%) |
| Business & Financial | 0 (0.0%) | 12 (100.0%) |
| Computers, Engineering & Science | 41 (74.6%) | 14 (25.5%) |
| Computers & Mathematics | 0 (0.0%) | 14 (100.0%) |
| Architecture & Engineering | 41 (100.0%) | 0 (0.0%) |
| Life, Physical & Social Science | 0 (0.0%) | 0 (0.0%) |
| Community & Social Service | 27 (29.3%) | 65 (70.7%) |
| Education, Arts & Media | 15 (65.2%) | 8 (34.8%) |
| Legal Services & Support | 0 (0.0%) | 0 (0.0%) |
| Education Instruction & Library | 12 (17.4%) | 57 (82.6%) |
| Arts, Media & Entertainment | 0 (0.0%) | 0 (0.0%) |
| Health Diagnosing & Treating | 72 (52.5%) | 65 (47.4%) |
| Health Technologists | 72 (73.5%) | 26 (26.5%) |
| Total (Category) | 185 (50.0%) | 185 (50.0%) |
| Total (Overall) | 396 (52.0%) | 365 (48.0%) |
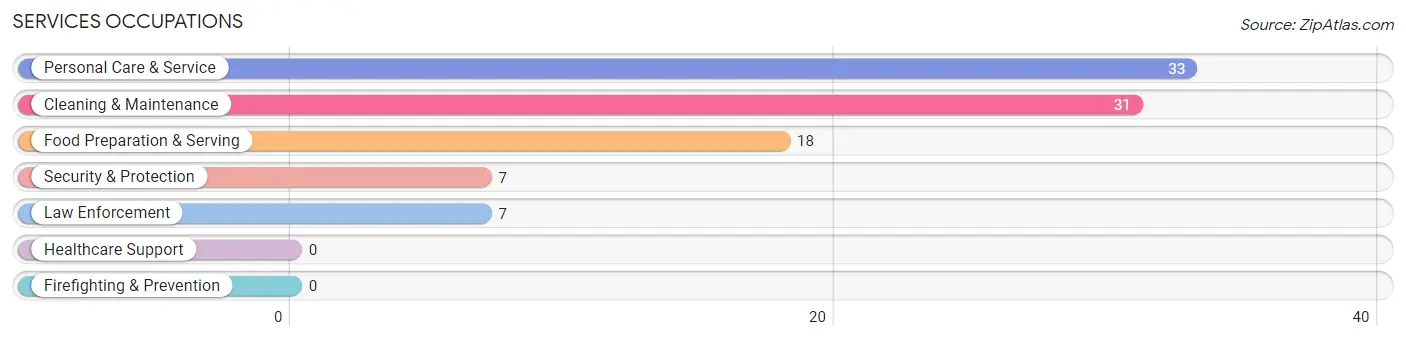
Services Occupations
The most common Services occupations in Chinook are Personal Care & Service (33 | 4.3%), Cleaning & Maintenance (31 | 4.1%), Food Preparation & Serving (18 | 2.4%), Security & Protection (7 | 0.9%), and Law Enforcement (7 | 0.9%).
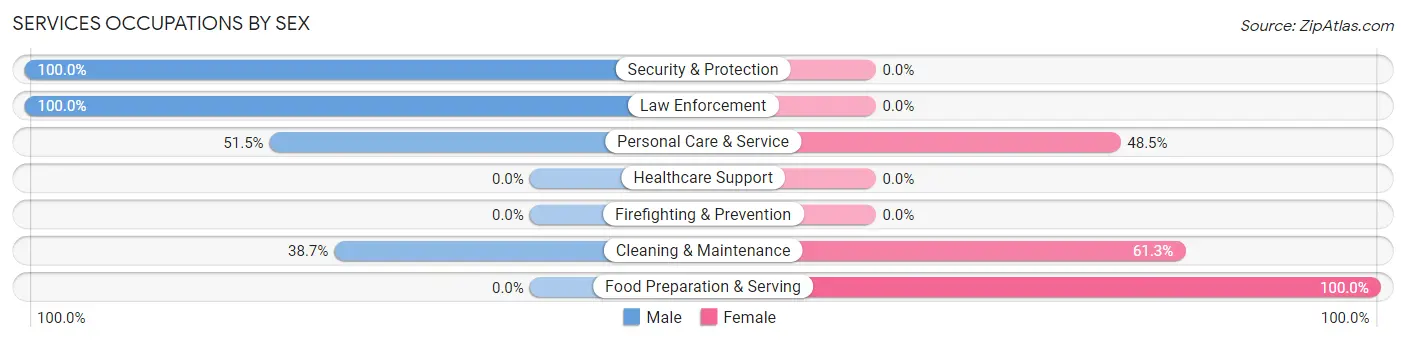
Services Occupations by Sex
Within the Services occupations in Chinook, the most male-oriented occupations are Security & Protection (100.0%), Law Enforcement (100.0%), and Personal Care & Service (51.5%), while the most female-oriented occupations are Food Preparation & Serving (100.0%), Cleaning & Maintenance (61.3%), and Personal Care & Service (48.5%).
| Occupation | Male | Female |
| Healthcare Support | 0 (0.0%) | 0 (0.0%) |
| Security & Protection | 7 (100.0%) | 0 (0.0%) |
| Firefighting & Prevention | 0 (0.0%) | 0 (0.0%) |
| Law Enforcement | 7 (100.0%) | 0 (0.0%) |
| Food Preparation & Serving | 0 (0.0%) | 18 (100.0%) |
| Cleaning & Maintenance | 12 (38.7%) | 19 (61.3%) |
| Personal Care & Service | 17 (51.5%) | 16 (48.5%) |
| Total (Category) | 36 (40.5%) | 53 (59.6%) |
| Total (Overall) | 396 (52.0%) | 365 (48.0%) |
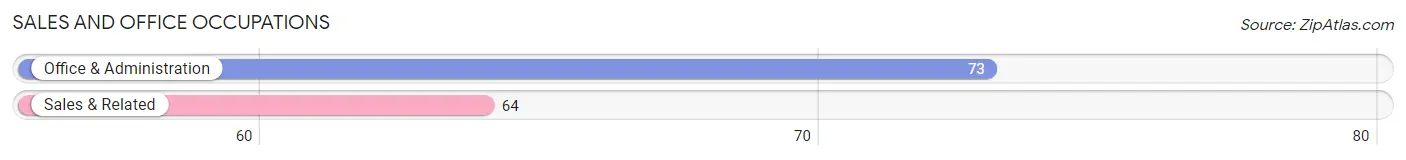
Sales and Office Occupations
The most common Sales and Office occupations in Chinook are Office & Administration (73 | 9.6%), and Sales & Related (64 | 8.4%).
Sales and Office Occupations by Sex
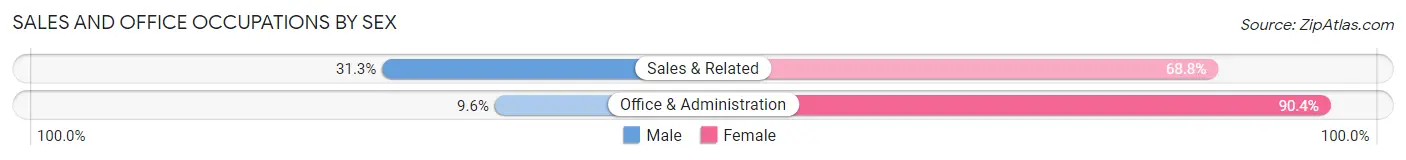
| Occupation | Male | Female |
| Sales & Related | 20 (31.2%) | 44 (68.8%) |
| Office & Administration | 7 (9.6%) | 66 (90.4%) |
| Total (Category) | 27 (19.7%) | 110 (80.3%) |
| Total (Overall) | 396 (52.0%) | 365 (48.0%) |
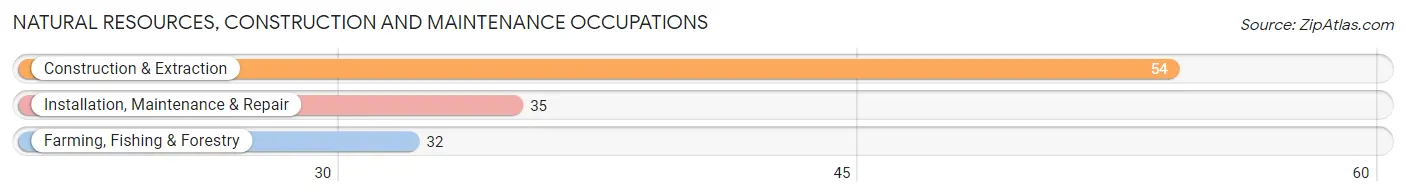
Natural Resources, Construction and Maintenance Occupations
The most common Natural Resources, Construction and Maintenance occupations in Chinook are Construction & Extraction (54 | 7.1%), Installation, Maintenance & Repair (35 | 4.6%), and Farming, Fishing & Forestry (32 | 4.2%).
Natural Resources, Construction and Maintenance Occupations by Sex
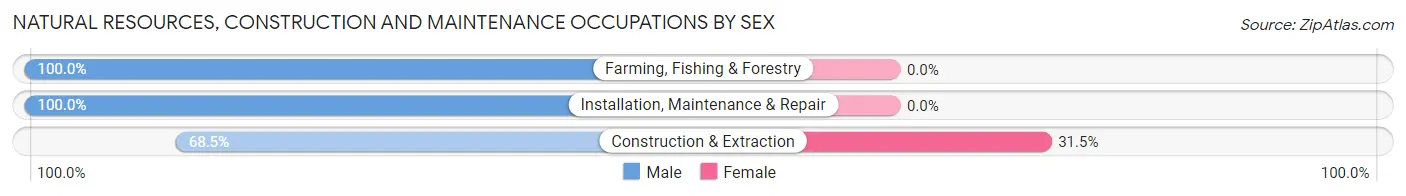
| Occupation | Male | Female |
| Farming, Fishing & Forestry | 32 (100.0%) | 0 (0.0%) |
| Construction & Extraction | 37 (68.5%) | 17 (31.5%) |
| Installation, Maintenance & Repair | 35 (100.0%) | 0 (0.0%) |
| Total (Category) | 104 (86.0%) | 17 (14.1%) |
| Total (Overall) | 396 (52.0%) | 365 (48.0%) |
Production, Transportation and Moving Occupations
The most common Production, Transportation and Moving occupations in Chinook are Transportation (19 | 2.5%), Production (15 | 2.0%), and Material Moving (10 | 1.3%).
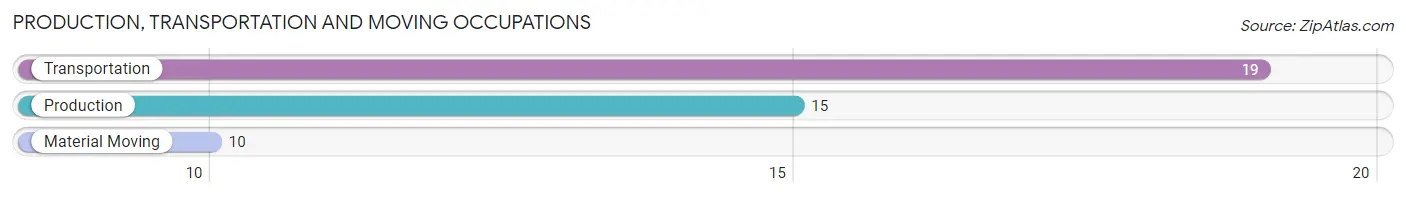
Production, Transportation and Moving Occupations by Sex
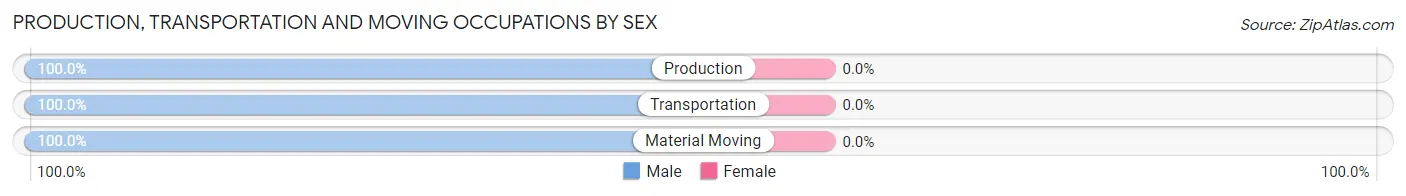
| Occupation | Male | Female |
| Production | 15 (100.0%) | 0 (0.0%) |
| Transportation | 19 (100.0%) | 0 (0.0%) |
| Material Moving | 10 (100.0%) | 0 (0.0%) |
| Total (Category) | 44 (100.0%) | 0 (0.0%) |
| Total (Overall) | 396 (52.0%) | 365 (48.0%) |
Employment Industries by Sex in Chinook
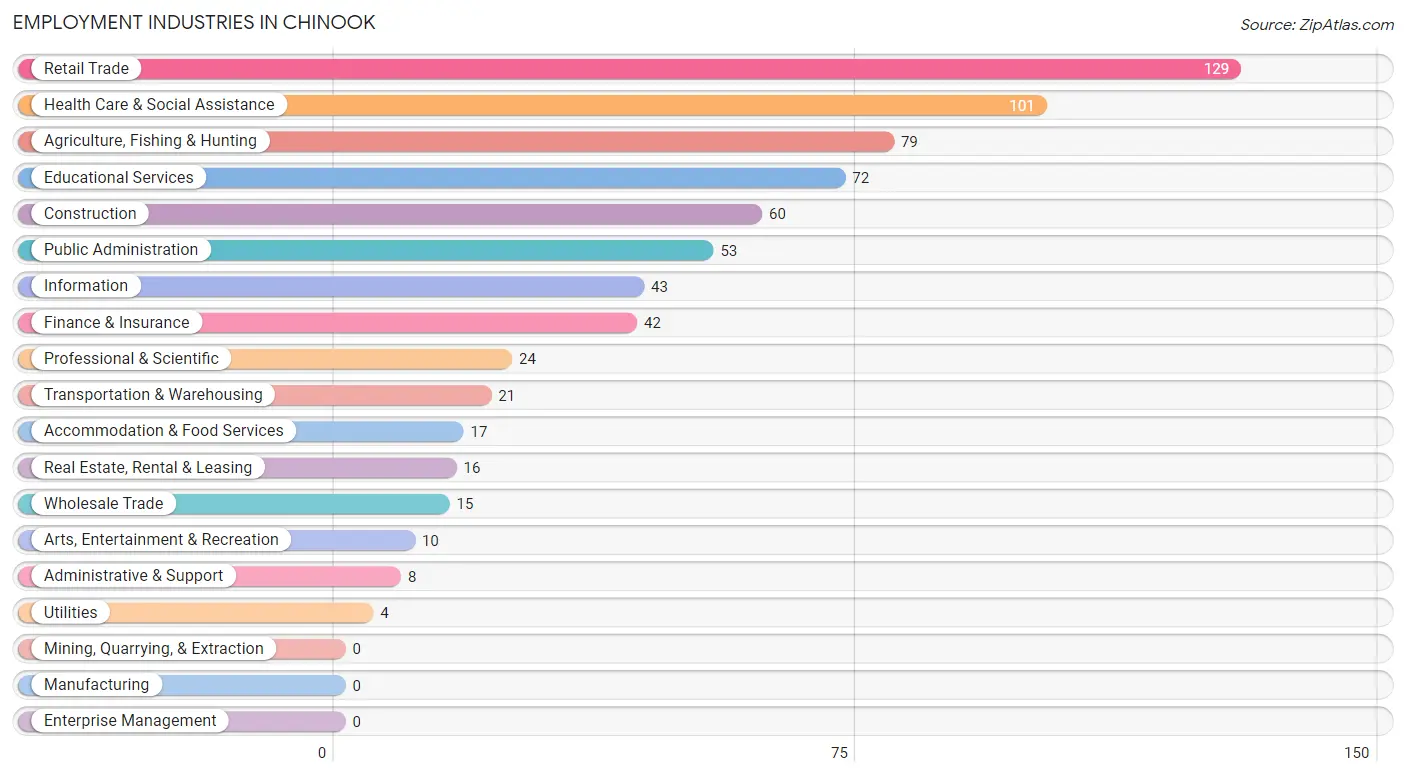
Employment Industries in Chinook
The major employment industries in Chinook include Retail Trade (129 | 17.0%), Health Care & Social Assistance (101 | 13.3%), Agriculture, Fishing & Hunting (79 | 10.4%), Educational Services (72 | 9.5%), and Construction (60 | 7.9%).
Employment Industries by Sex in Chinook
The Chinook industries that see more men than women are Transportation & Warehousing (100.0%), Utilities (100.0%), and Professional & Scientific (100.0%), whereas the industries that tend to have a higher number of women are Arts, Entertainment & Recreation (100.0%), Accommodation & Food Services (100.0%), and Public Administration (86.8%).
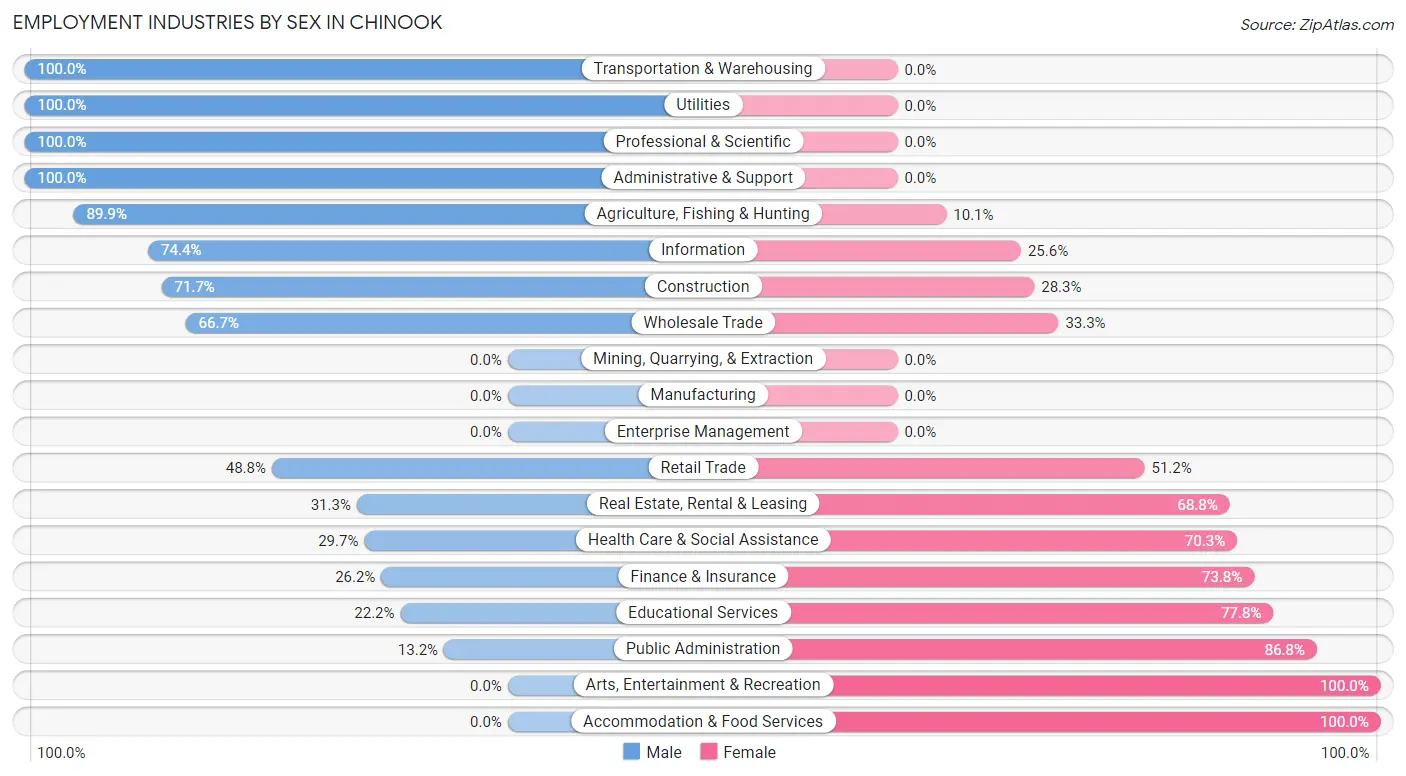
| Industry | Male | Female |
| Agriculture, Fishing & Hunting | 71 (89.9%) | 8 (10.1%) |
| Mining, Quarrying, & Extraction | 0 (0.0%) | 0 (0.0%) |
| Construction | 43 (71.7%) | 17 (28.3%) |
| Manufacturing | 0 (0.0%) | 0 (0.0%) |
| Wholesale Trade | 10 (66.7%) | 5 (33.3%) |
| Retail Trade | 63 (48.8%) | 66 (51.2%) |
| Transportation & Warehousing | 21 (100.0%) | 0 (0.0%) |
| Utilities | 4 (100.0%) | 0 (0.0%) |
| Information | 32 (74.4%) | 11 (25.6%) |
| Finance & Insurance | 11 (26.2%) | 31 (73.8%) |
| Real Estate, Rental & Leasing | 5 (31.2%) | 11 (68.8%) |
| Professional & Scientific | 24 (100.0%) | 0 (0.0%) |
| Enterprise Management | 0 (0.0%) | 0 (0.0%) |
| Administrative & Support | 8 (100.0%) | 0 (0.0%) |
| Educational Services | 16 (22.2%) | 56 (77.8%) |
| Health Care & Social Assistance | 30 (29.7%) | 71 (70.3%) |
| Arts, Entertainment & Recreation | 0 (0.0%) | 10 (100.0%) |
| Accommodation & Food Services | 0 (0.0%) | 17 (100.0%) |
| Public Administration | 7 (13.2%) | 46 (86.8%) |
| Total | 396 (52.0%) | 365 (48.0%) |
Education in Chinook
School Enrollment in Chinook
The most common levels of schooling among the 404 students in Chinook are middle school (125 | 30.9%), high school (92 | 22.8%), and elementary school (85 | 21.0%).
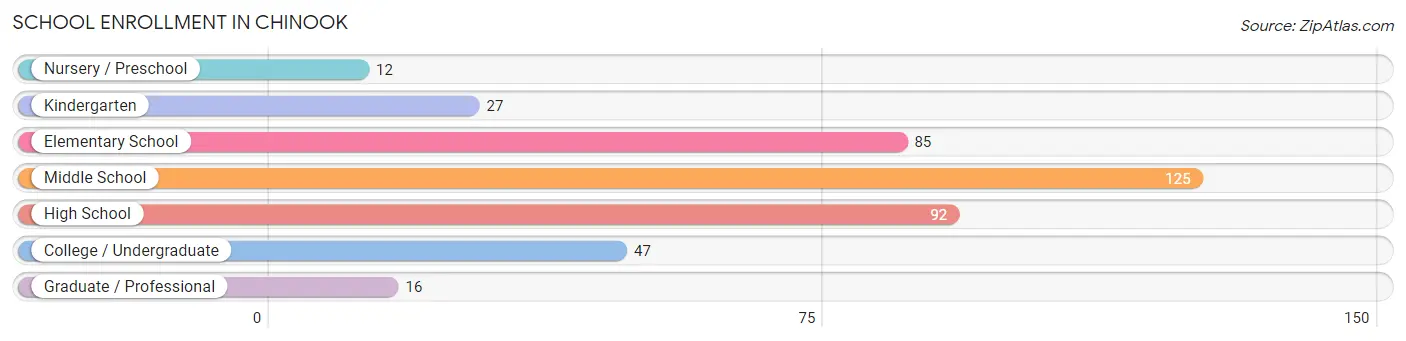
| School Level | # Students | % Students |
| Nursery / Preschool | 12 | 3.0% |
| Kindergarten | 27 | 6.7% |
| Elementary School | 85 | 21.0% |
| Middle School | 125 | 30.9% |
| High School | 92 | 22.8% |
| College / Undergraduate | 47 | 11.6% |
| Graduate / Professional | 16 | 4.0% |
| Total | 404 | 100.0% |
School Enrollment by Age by Funding Source in Chinook
Out of a total of 404 students who are enrolled in schools in Chinook, 61 (15.1%) attend a private institution, while the remaining 343 (84.9%) are enrolled in public schools. The age group of 3 to 4 year olds has the highest likelihood of being enrolled in private schools, with 12 (100.0% in the age bracket) enrolled. Conversely, the age group of 18 to 19 year olds has the lowest likelihood of being enrolled in a private school, with 7 (100.0% in the age bracket) attending a public institution.
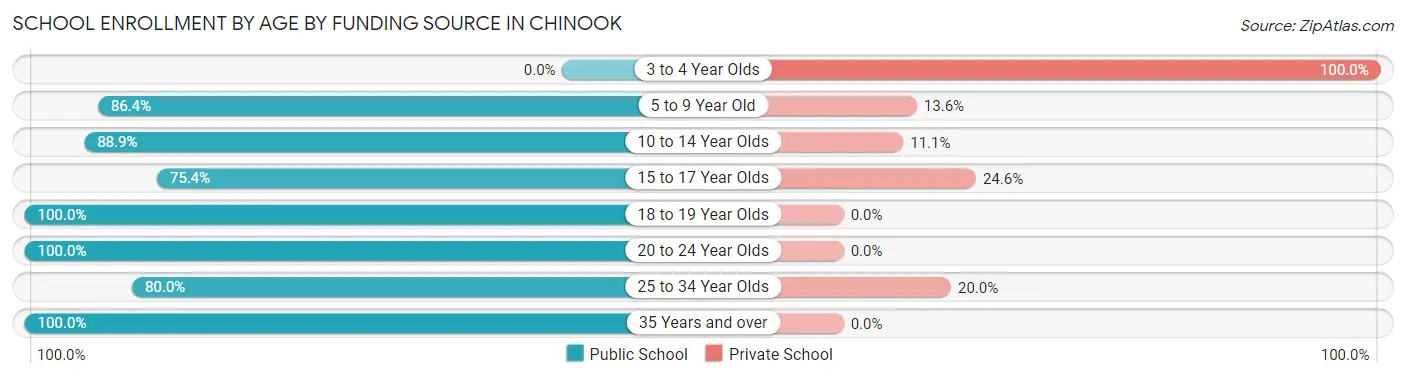
| Age Bracket | Public School | Private School |
| 3 to 4 Year Olds | 0 (0.0%) | 12 (100.0%) |
| 5 to 9 Year Old | 76 (86.4%) | 12 (13.6%) |
| 10 to 14 Year Olds | 128 (88.9%) | 16 (11.1%) |
| 15 to 17 Year Olds | 52 (75.4%) | 17 (24.6%) |
| 18 to 19 Year Olds | 7 (100.0%) | 0 (0.0%) |
| 20 to 24 Year Olds | 34 (100.0%) | 0 (0.0%) |
| 25 to 34 Year Olds | 16 (80.0%) | 4 (20.0%) |
| 35 Years and over | 30 (100.0%) | 0 (0.0%) |
| Total | 343 (84.9%) | 61 (15.1%) |
Educational Attainment by Field of Study in Chinook
Science & technology (119 | 30.9%), education (94 | 24.4%), bio, nature & agricultural (69 | 17.9%), business (34 | 8.8%), and liberal arts & history (23 | 6.0%) are the most common fields of study among 385 individuals in Chinook who have obtained a bachelor's degree or higher.
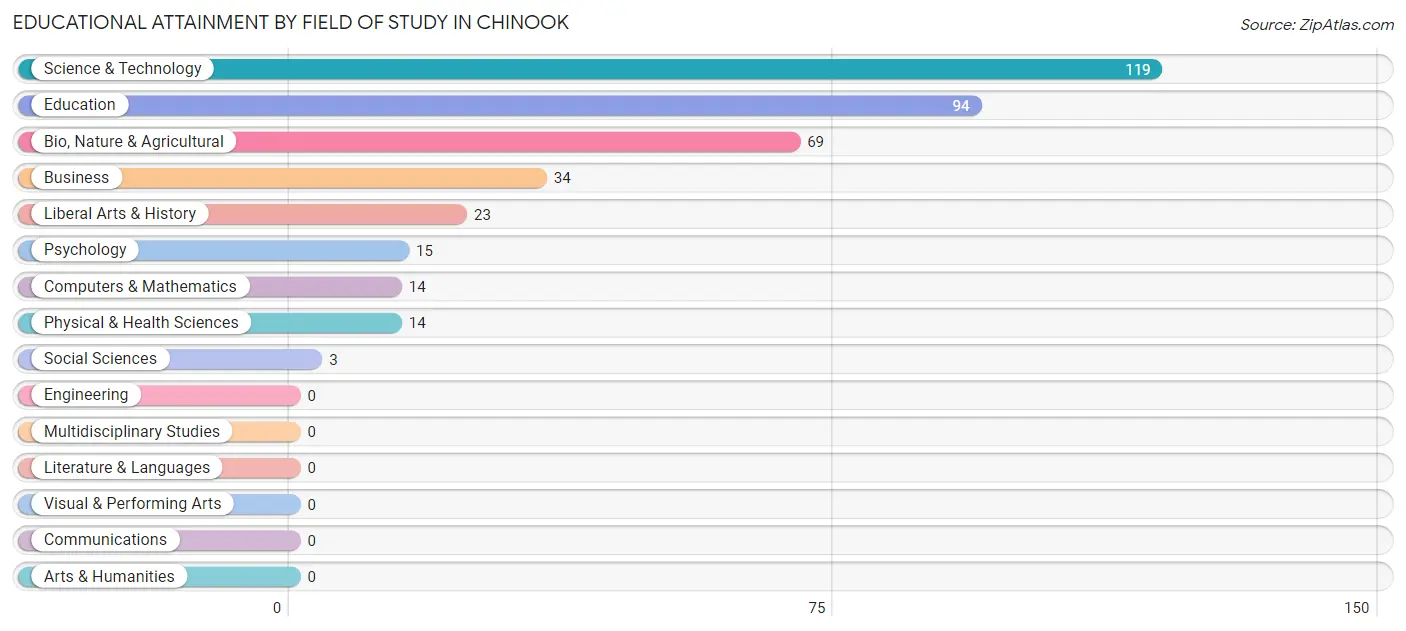
| Field of Study | # Graduates | % Graduates |
| Computers & Mathematics | 14 | 3.6% |
| Bio, Nature & Agricultural | 69 | 17.9% |
| Physical & Health Sciences | 14 | 3.6% |
| Psychology | 15 | 3.9% |
| Social Sciences | 3 | 0.8% |
| Engineering | 0 | 0.0% |
| Multidisciplinary Studies | 0 | 0.0% |
| Science & Technology | 119 | 30.9% |
| Business | 34 | 8.8% |
| Education | 94 | 24.4% |
| Literature & Languages | 0 | 0.0% |
| Liberal Arts & History | 23 | 6.0% |
| Visual & Performing Arts | 0 | 0.0% |
| Communications | 0 | 0.0% |
| Arts & Humanities | 0 | 0.0% |
| Total | 385 | 100.0% |
Transportation & Commute in Chinook
Vehicle Availability by Sex in Chinook
The most prevalent vehicle ownership categories in Chinook are males with 2 vehicles (154, accounting for 40.1%) and females with 2 vehicles (109, making up 44.0%).
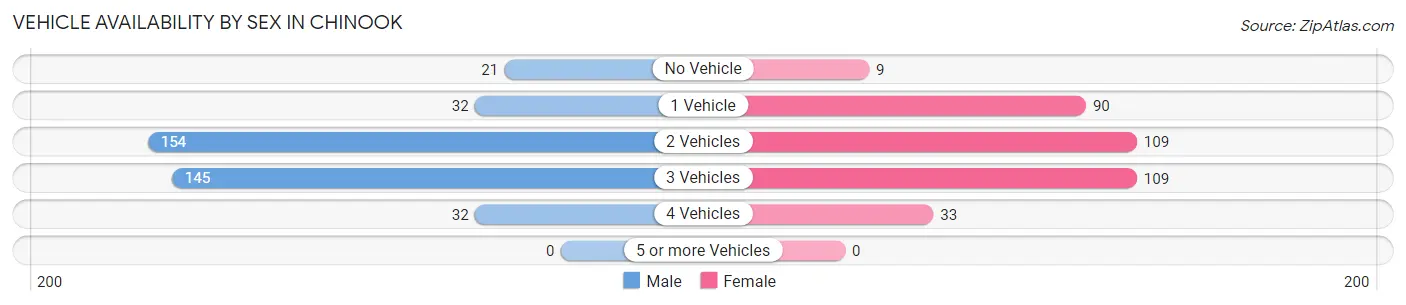
| Vehicles Available | Male | Female |
| No Vehicle | 21 (5.5%) | 9 (2.6%) |
| 1 Vehicle | 32 (8.3%) | 90 (25.7%) |
| 2 Vehicles | 154 (40.1%) | 109 (31.1%) |
| 3 Vehicles | 145 (37.8%) | 109 (31.1%) |
| 4 Vehicles | 32 (8.3%) | 33 (9.4%) |
| 5 or more Vehicles | 0 (0.0%) | 0 (0.0%) |
| Total | 384 (100.0%) | 350 (100.0%) |
Commute Time in Chinook
The most frequently occuring commute durations in Chinook are less than 5 minutes (308 commuters, 45.2%), 5 to 9 minutes (139 commuters, 20.4%), and 10 to 14 minutes (72 commuters, 10.6%).
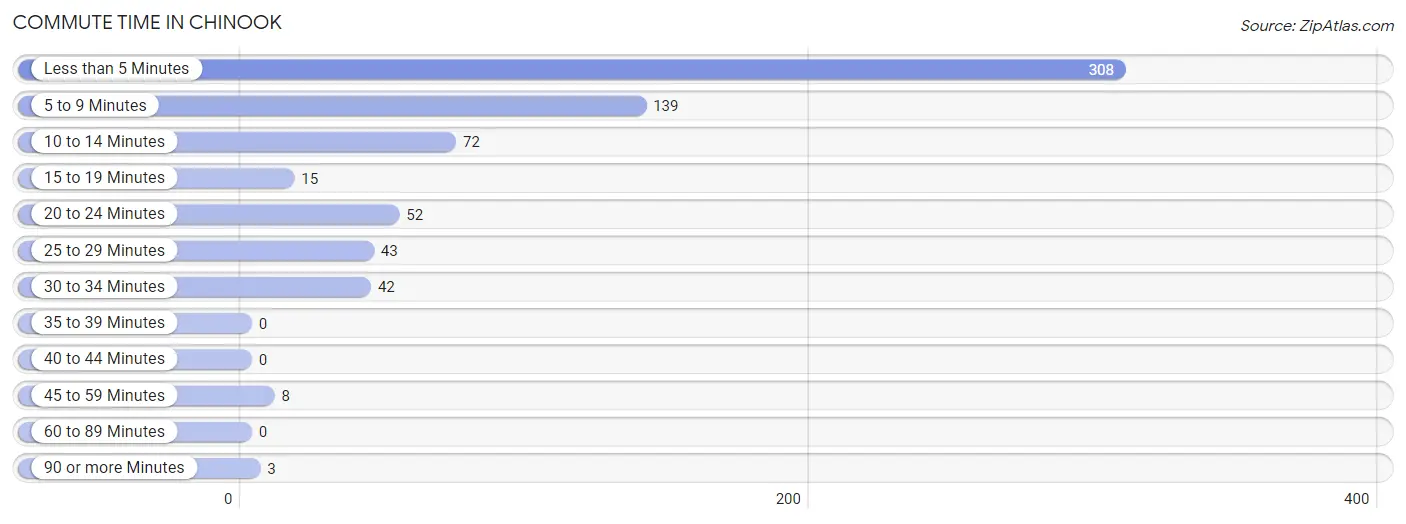
| Commute Time | # Commuters | % Commuters |
| Less than 5 Minutes | 308 | 45.2% |
| 5 to 9 Minutes | 139 | 20.4% |
| 10 to 14 Minutes | 72 | 10.6% |
| 15 to 19 Minutes | 15 | 2.2% |
| 20 to 24 Minutes | 52 | 7.6% |
| 25 to 29 Minutes | 43 | 6.3% |
| 30 to 34 Minutes | 42 | 6.2% |
| 35 to 39 Minutes | 0 | 0.0% |
| 40 to 44 Minutes | 0 | 0.0% |
| 45 to 59 Minutes | 8 | 1.2% |
| 60 to 89 Minutes | 0 | 0.0% |
| 90 or more Minutes | 3 | 0.4% |
Commute Time by Sex in Chinook
The most common commute times in Chinook are less than 5 minutes (125 commuters, 35.9%) for males and less than 5 minutes (183 commuters, 54.8%) for females.
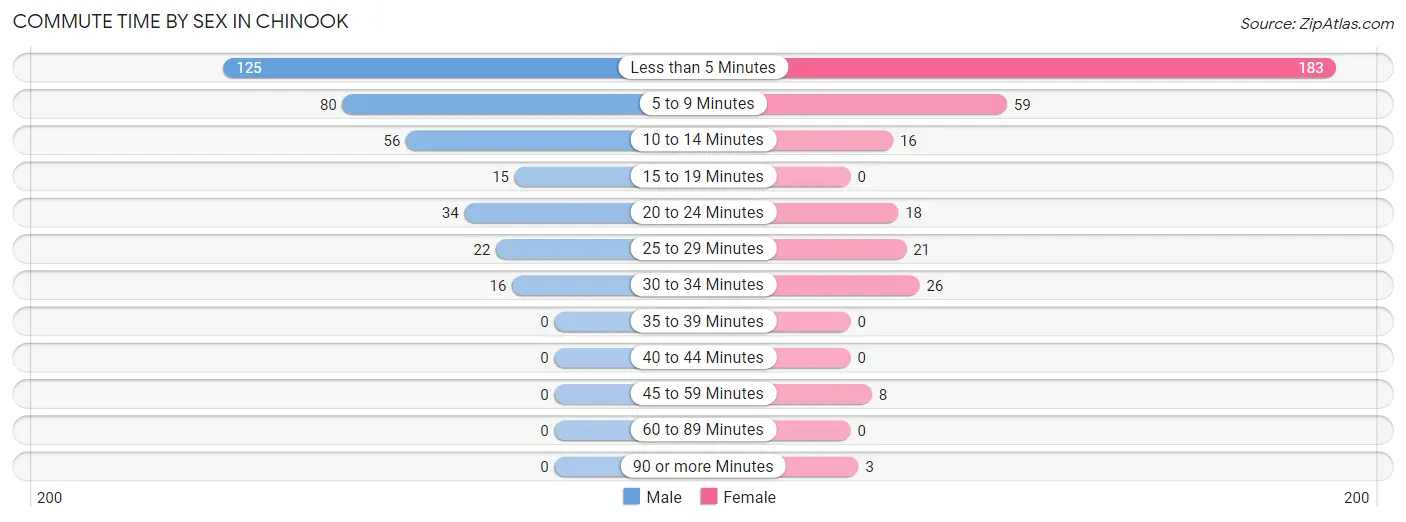
| Commute Time | Male | Female |
| Less than 5 Minutes | 125 (35.9%) | 183 (54.8%) |
| 5 to 9 Minutes | 80 (23.0%) | 59 (17.7%) |
| 10 to 14 Minutes | 56 (16.1%) | 16 (4.8%) |
| 15 to 19 Minutes | 15 (4.3%) | 0 (0.0%) |
| 20 to 24 Minutes | 34 (9.8%) | 18 (5.4%) |
| 25 to 29 Minutes | 22 (6.3%) | 21 (6.3%) |
| 30 to 34 Minutes | 16 (4.6%) | 26 (7.8%) |
| 35 to 39 Minutes | 0 (0.0%) | 0 (0.0%) |
| 40 to 44 Minutes | 0 (0.0%) | 0 (0.0%) |
| 45 to 59 Minutes | 0 (0.0%) | 8 (2.4%) |
| 60 to 89 Minutes | 0 (0.0%) | 0 (0.0%) |
| 90 or more Minutes | 0 (0.0%) | 3 (0.9%) |
Time of Departure to Work by Sex in Chinook
The most frequent times of departure to work in Chinook are 7:30 AM to 7:59 AM (76, 21.8%) for males and 7:30 AM to 7:59 AM (98, 29.3%) for females.
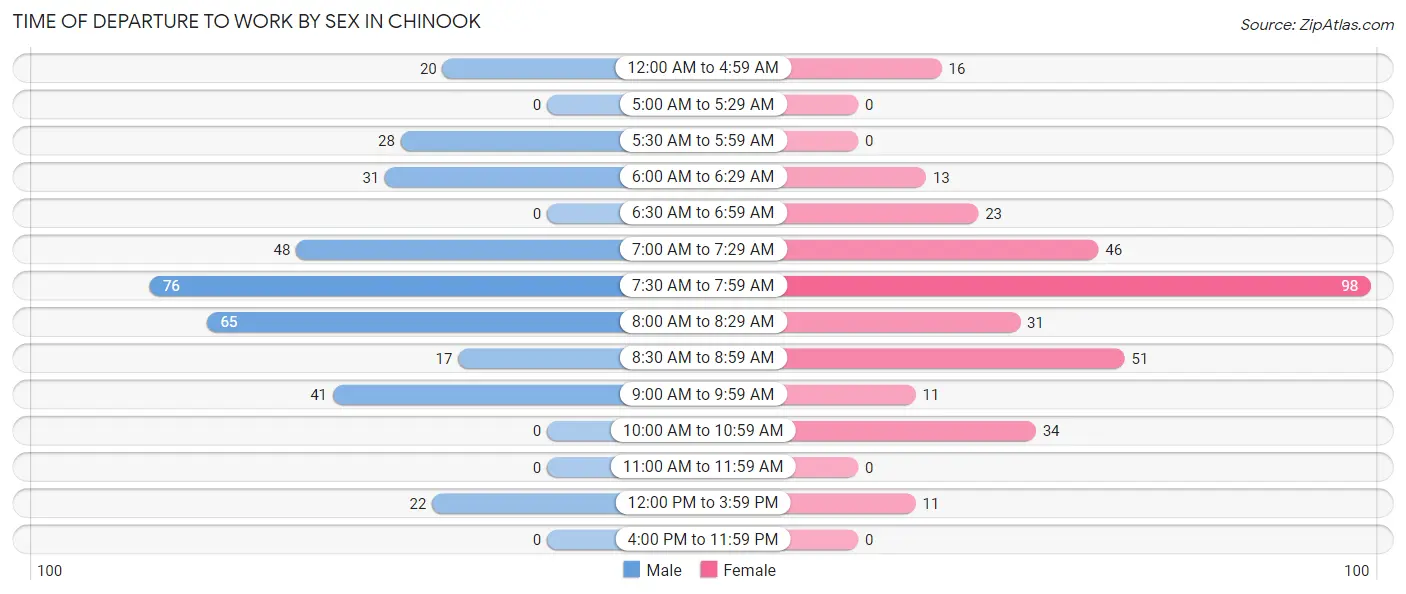
| Time of Departure | Male | Female |
| 12:00 AM to 4:59 AM | 20 (5.8%) | 16 (4.8%) |
| 5:00 AM to 5:29 AM | 0 (0.0%) | 0 (0.0%) |
| 5:30 AM to 5:59 AM | 28 (8.1%) | 0 (0.0%) |
| 6:00 AM to 6:29 AM | 31 (8.9%) | 13 (3.9%) |
| 6:30 AM to 6:59 AM | 0 (0.0%) | 23 (6.9%) |
| 7:00 AM to 7:29 AM | 48 (13.8%) | 46 (13.8%) |
| 7:30 AM to 7:59 AM | 76 (21.8%) | 98 (29.3%) |
| 8:00 AM to 8:29 AM | 65 (18.7%) | 31 (9.3%) |
| 8:30 AM to 8:59 AM | 17 (4.9%) | 51 (15.3%) |
| 9:00 AM to 9:59 AM | 41 (11.8%) | 11 (3.3%) |
| 10:00 AM to 10:59 AM | 0 (0.0%) | 34 (10.2%) |
| 11:00 AM to 11:59 AM | 0 (0.0%) | 0 (0.0%) |
| 12:00 PM to 3:59 PM | 22 (6.3%) | 11 (3.3%) |
| 4:00 PM to 11:59 PM | 0 (0.0%) | 0 (0.0%) |
| Total | 348 (100.0%) | 334 (100.0%) |
Housing Occupancy in Chinook
Occupancy by Ownership in Chinook
Of the total 699 dwellings in Chinook, owner-occupied units account for 500 (71.5%), while renter-occupied units make up 199 (28.5%).
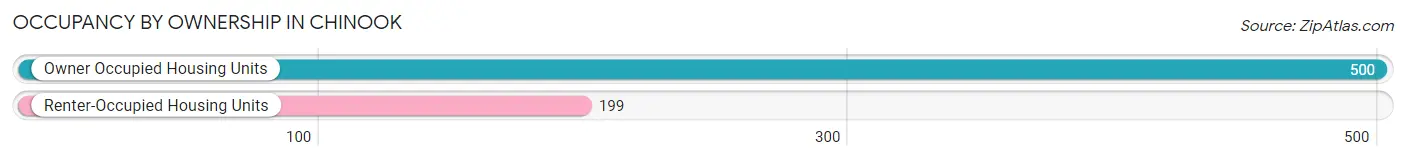
| Occupancy | # Housing Units | % Housing Units |
| Owner Occupied Housing Units | 500 | 71.5% |
| Renter-Occupied Housing Units | 199 | 28.5% |
| Total Occupied Housing Units | 699 | 100.0% |
Occupancy by Household Size in Chinook
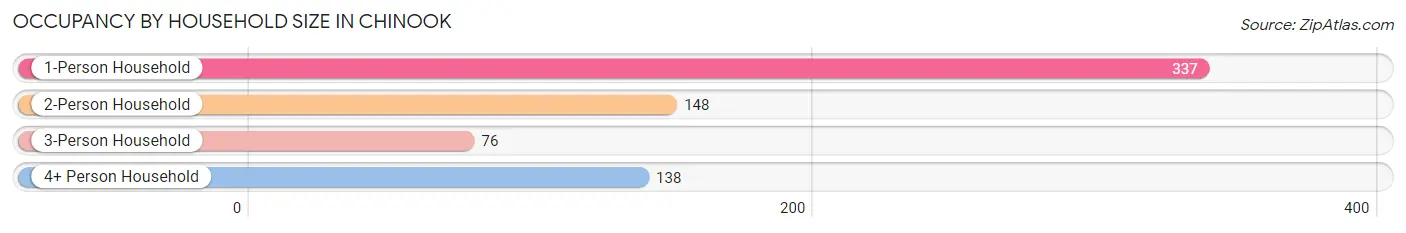
| Household Size | # Housing Units | % Housing Units |
| 1-Person Household | 337 | 48.2% |
| 2-Person Household | 148 | 21.2% |
| 3-Person Household | 76 | 10.9% |
| 4+ Person Household | 138 | 19.7% |
| Total Housing Units | 699 | 100.0% |
Occupancy by Ownership by Household Size in Chinook
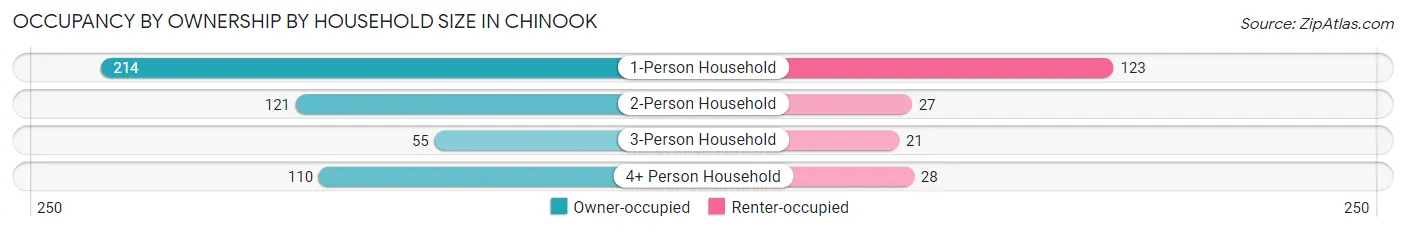
| Household Size | Owner-occupied | Renter-occupied |
| 1-Person Household | 214 (63.5%) | 123 (36.5%) |
| 2-Person Household | 121 (81.8%) | 27 (18.2%) |
| 3-Person Household | 55 (72.4%) | 21 (27.6%) |
| 4+ Person Household | 110 (79.7%) | 28 (20.3%) |
| Total Housing Units | 500 (71.5%) | 199 (28.5%) |
Occupancy by Educational Attainment in Chinook
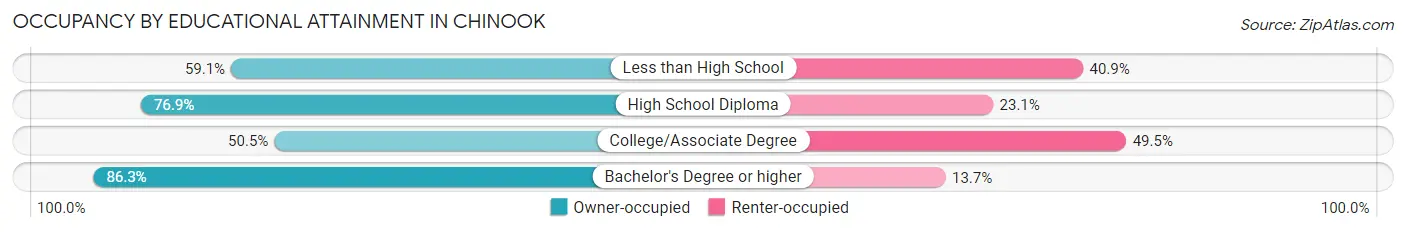
| Household Size | Owner-occupied | Renter-occupied |
| Less than High School | 26 (59.1%) | 18 (40.9%) |
| High School Diploma | 180 (76.9%) | 54 (23.1%) |
| College/Associate Degree | 98 (50.5%) | 96 (49.5%) |
| Bachelor's Degree or higher | 196 (86.3%) | 31 (13.7%) |
Occupancy by Age of Householder in Chinook
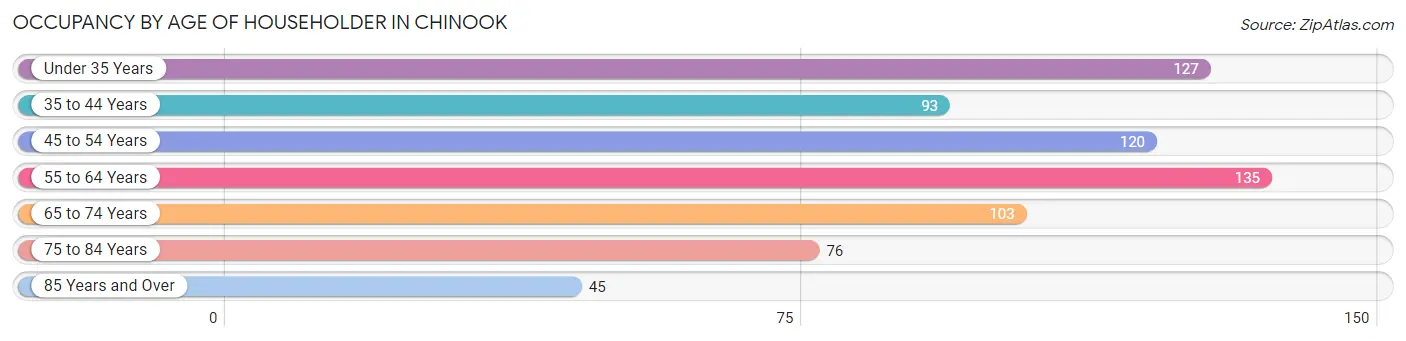
| Age Bracket | # Households | % Households |
| Under 35 Years | 127 | 18.2% |
| 35 to 44 Years | 93 | 13.3% |
| 45 to 54 Years | 120 | 17.2% |
| 55 to 64 Years | 135 | 19.3% |
| 65 to 74 Years | 103 | 14.7% |
| 75 to 84 Years | 76 | 10.9% |
| 85 Years and Over | 45 | 6.4% |
| Total | 699 | 100.0% |
Housing Finances in Chinook
Median Income by Occupancy in Chinook
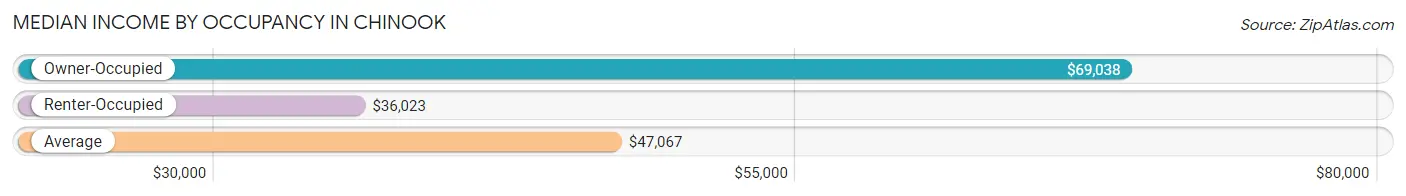
| Occupancy Type | # Households | Median Income |
| Owner-Occupied | 500 (71.5%) | $69,038 |
| Renter-Occupied | 199 (28.5%) | $36,023 |
| Average | 699 (100.0%) | $47,067 |
Occupancy by Householder Income Bracket in Chinook
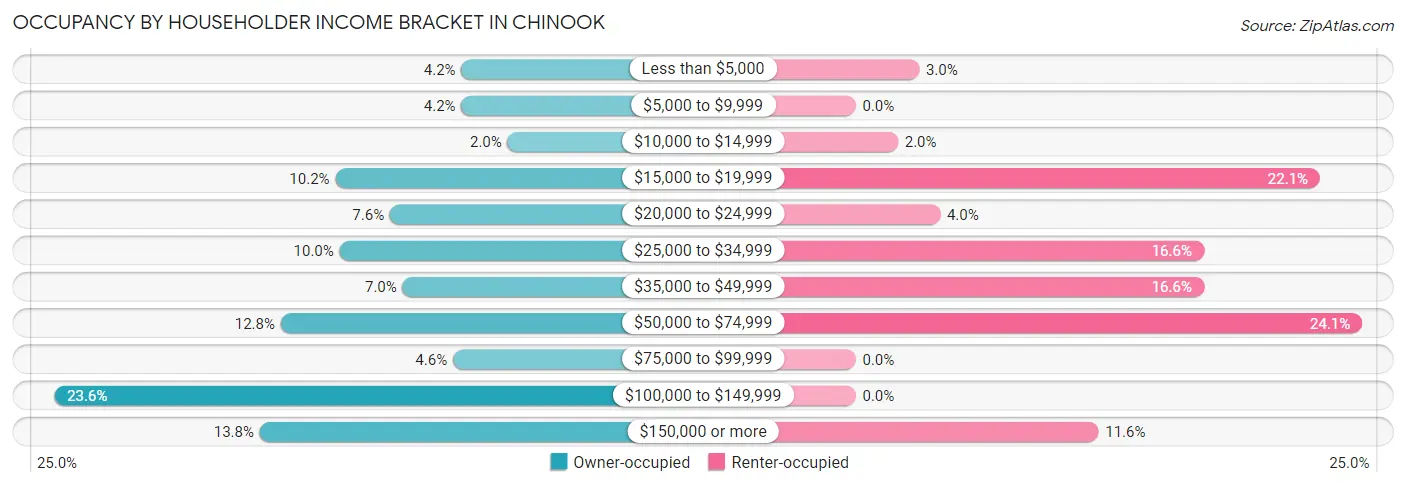
| Income Bracket | Owner-occupied | Renter-occupied |
| Less than $5,000 | 21 (4.2%) | 6 (3.0%) |
| $5,000 to $9,999 | 21 (4.2%) | 0 (0.0%) |
| $10,000 to $14,999 | 10 (2.0%) | 4 (2.0%) |
| $15,000 to $19,999 | 51 (10.2%) | 44 (22.1%) |
| $20,000 to $24,999 | 38 (7.6%) | 8 (4.0%) |
| $25,000 to $34,999 | 50 (10.0%) | 33 (16.6%) |
| $35,000 to $49,999 | 35 (7.0%) | 33 (16.6%) |
| $50,000 to $74,999 | 64 (12.8%) | 48 (24.1%) |
| $75,000 to $99,999 | 23 (4.6%) | 0 (0.0%) |
| $100,000 to $149,999 | 118 (23.6%) | 0 (0.0%) |
| $150,000 or more | 69 (13.8%) | 23 (11.6%) |
| Total | 500 (100.0%) | 199 (100.0%) |
Monthly Housing Cost Tiers in Chinook
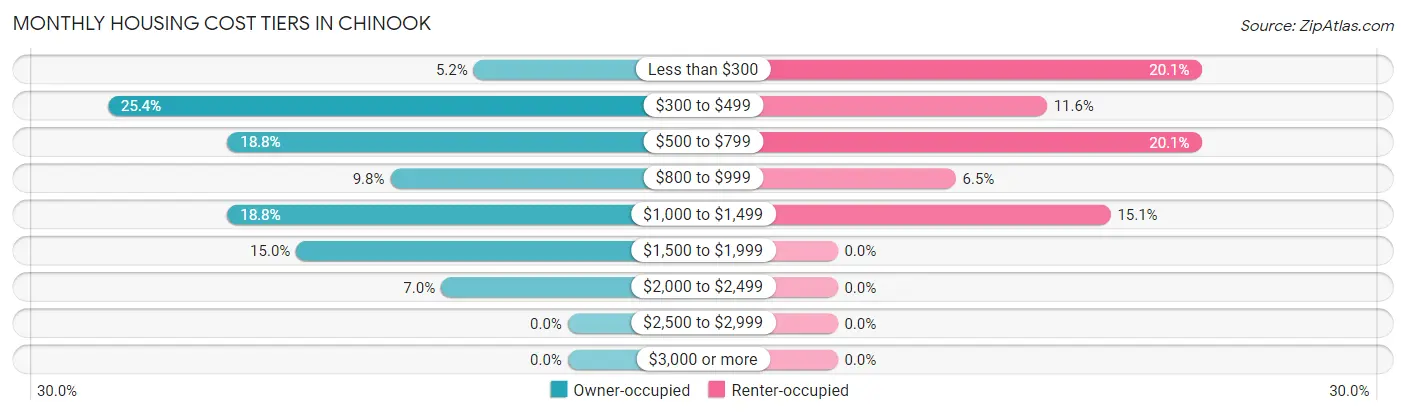
| Monthly Cost | Owner-occupied | Renter-occupied |
| Less than $300 | 26 (5.2%) | 40 (20.1%) |
| $300 to $499 | 127 (25.4%) | 23 (11.6%) |
| $500 to $799 | 94 (18.8%) | 40 (20.1%) |
| $800 to $999 | 49 (9.8%) | 13 (6.5%) |
| $1,000 to $1,499 | 94 (18.8%) | 30 (15.1%) |
| $1,500 to $1,999 | 75 (15.0%) | 0 (0.0%) |
| $2,000 to $2,499 | 35 (7.0%) | 0 (0.0%) |
| $2,500 to $2,999 | 0 (0.0%) | 0 (0.0%) |
| $3,000 or more | 0 (0.0%) | 0 (0.0%) |
| Total | 500 (100.0%) | 199 (100.0%) |
Physical Housing Characteristics in Chinook
Housing Structures in Chinook
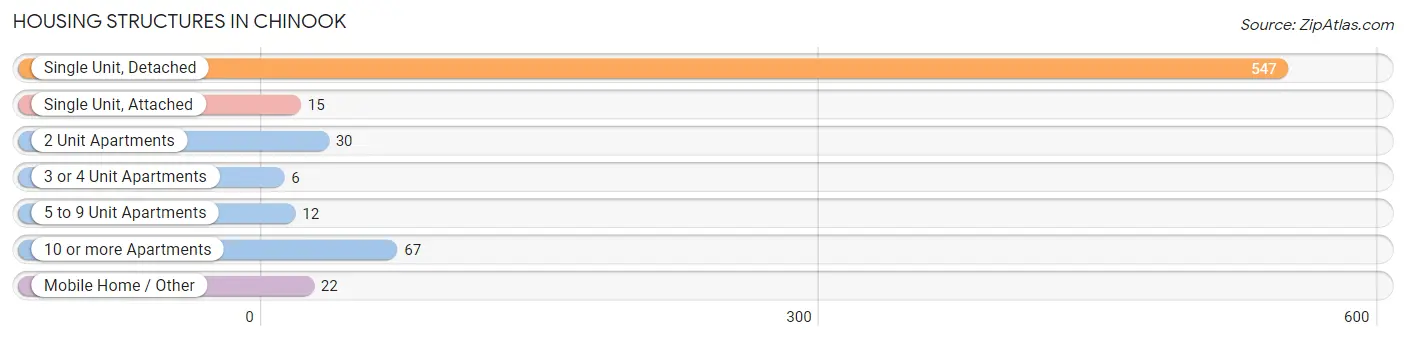
| Structure Type | # Housing Units | % Housing Units |
| Single Unit, Detached | 547 | 78.2% |
| Single Unit, Attached | 15 | 2.1% |
| 2 Unit Apartments | 30 | 4.3% |
| 3 or 4 Unit Apartments | 6 | 0.9% |
| 5 to 9 Unit Apartments | 12 | 1.7% |
| 10 or more Apartments | 67 | 9.6% |
| Mobile Home / Other | 22 | 3.2% |
| Total | 699 | 100.0% |
Housing Structures by Occupancy in Chinook
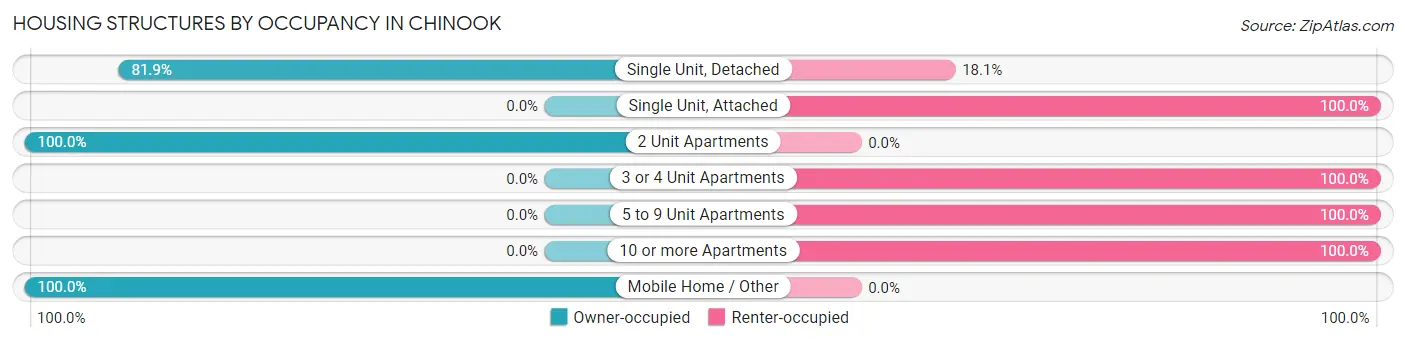
| Structure Type | Owner-occupied | Renter-occupied |
| Single Unit, Detached | 448 (81.9%) | 99 (18.1%) |
| Single Unit, Attached | 0 (0.0%) | 15 (100.0%) |
| 2 Unit Apartments | 30 (100.0%) | 0 (0.0%) |
| 3 or 4 Unit Apartments | 0 (0.0%) | 6 (100.0%) |
| 5 to 9 Unit Apartments | 0 (0.0%) | 12 (100.0%) |
| 10 or more Apartments | 0 (0.0%) | 67 (100.0%) |
| Mobile Home / Other | 22 (100.0%) | 0 (0.0%) |
| Total | 500 (71.5%) | 199 (28.5%) |
Housing Structures by Number of Rooms in Chinook
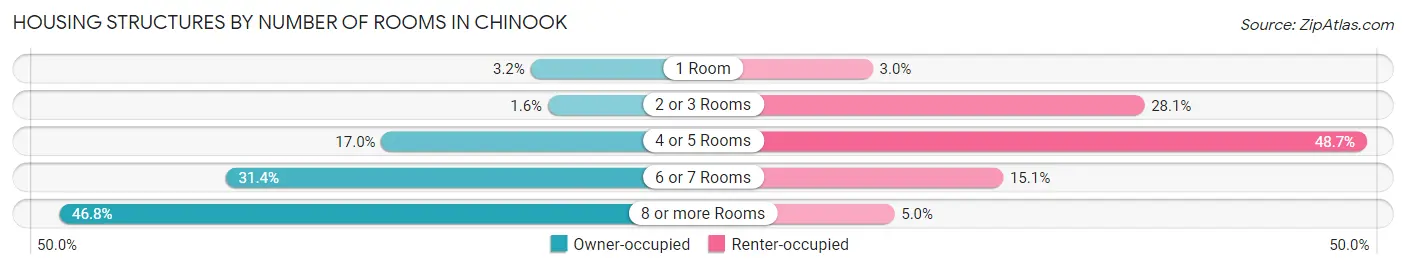
| Number of Rooms | Owner-occupied | Renter-occupied |
| 1 Room | 16 (3.2%) | 6 (3.0%) |
| 2 or 3 Rooms | 8 (1.6%) | 56 (28.1%) |
| 4 or 5 Rooms | 85 (17.0%) | 97 (48.7%) |
| 6 or 7 Rooms | 157 (31.4%) | 30 (15.1%) |
| 8 or more Rooms | 234 (46.8%) | 10 (5.0%) |
| Total | 500 (100.0%) | 199 (100.0%) |
Housing Structure by Heating Type in Chinook
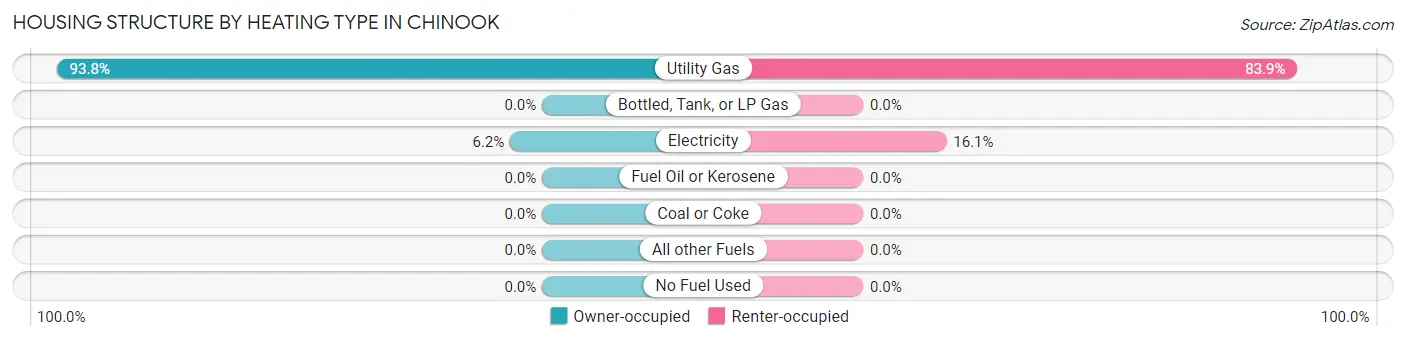
| Heating Type | Owner-occupied | Renter-occupied |
| Utility Gas | 469 (93.8%) | 167 (83.9%) |
| Bottled, Tank, or LP Gas | 0 (0.0%) | 0 (0.0%) |
| Electricity | 31 (6.2%) | 32 (16.1%) |
| Fuel Oil or Kerosene | 0 (0.0%) | 0 (0.0%) |
| Coal or Coke | 0 (0.0%) | 0 (0.0%) |
| All other Fuels | 0 (0.0%) | 0 (0.0%) |
| No Fuel Used | 0 (0.0%) | 0 (0.0%) |
| Total | 500 (100.0%) | 199 (100.0%) |
Household Vehicle Usage in Chinook
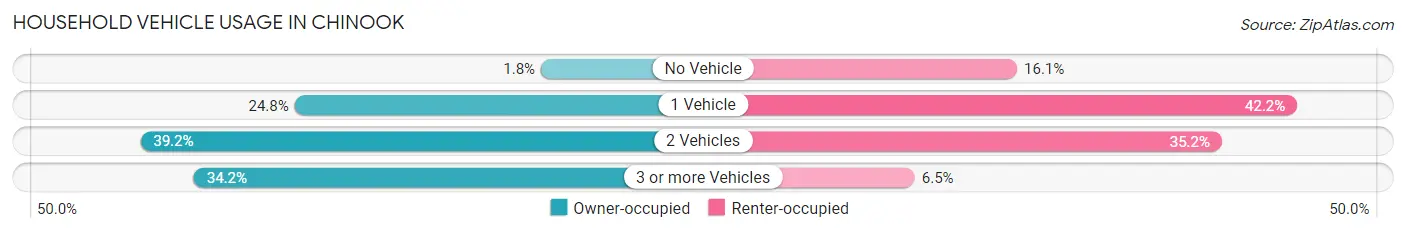
| Vehicles per Household | Owner-occupied | Renter-occupied |
| No Vehicle | 9 (1.8%) | 32 (16.1%) |
| 1 Vehicle | 124 (24.8%) | 84 (42.2%) |
| 2 Vehicles | 196 (39.2%) | 70 (35.2%) |
| 3 or more Vehicles | 171 (34.2%) | 13 (6.5%) |
| Total | 500 (100.0%) | 199 (100.0%) |
Real Estate & Mortgages in Chinook
Real Estate and Mortgage Overview in Chinook
| Characteristic | Without Mortgage | With Mortgage |
| Housing Units | 251 | 249 |
| Median Property Value | $117,300 | $215,200 |
| Median Household Income | - | - |
| Monthly Housing Costs | $477 | $0 |
| Real Estate Taxes | $2,159 | $24 |
Property Value by Mortgage Status in Chinook
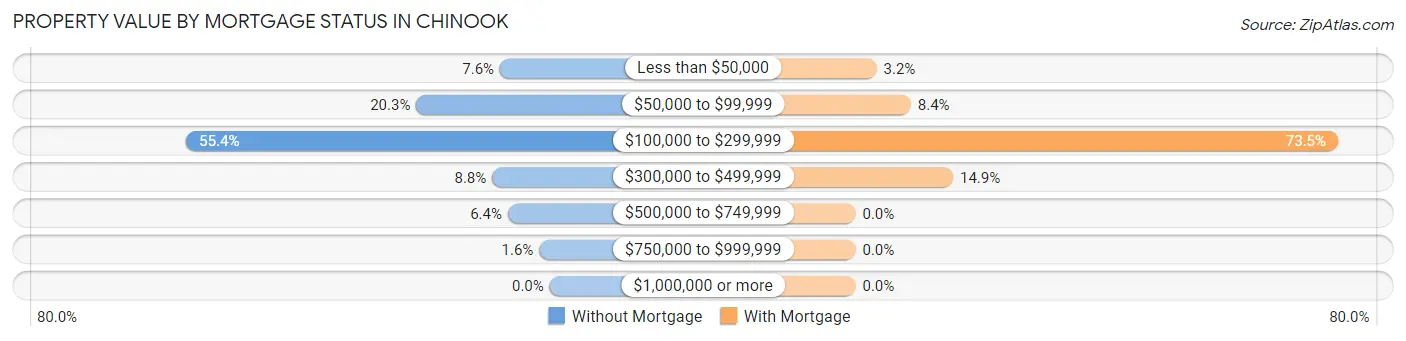
| Property Value | Without Mortgage | With Mortgage |
| Less than $50,000 | 19 (7.6%) | 8 (3.2%) |
| $50,000 to $99,999 | 51 (20.3%) | 21 (8.4%) |
| $100,000 to $299,999 | 139 (55.4%) | 183 (73.5%) |
| $300,000 to $499,999 | 22 (8.8%) | 37 (14.9%) |
| $500,000 to $749,999 | 16 (6.4%) | 0 (0.0%) |
| $750,000 to $999,999 | 4 (1.6%) | 0 (0.0%) |
| $1,000,000 or more | 0 (0.0%) | 0 (0.0%) |
| Total | 251 (100.0%) | 249 (100.0%) |
Household Income by Mortgage Status in Chinook
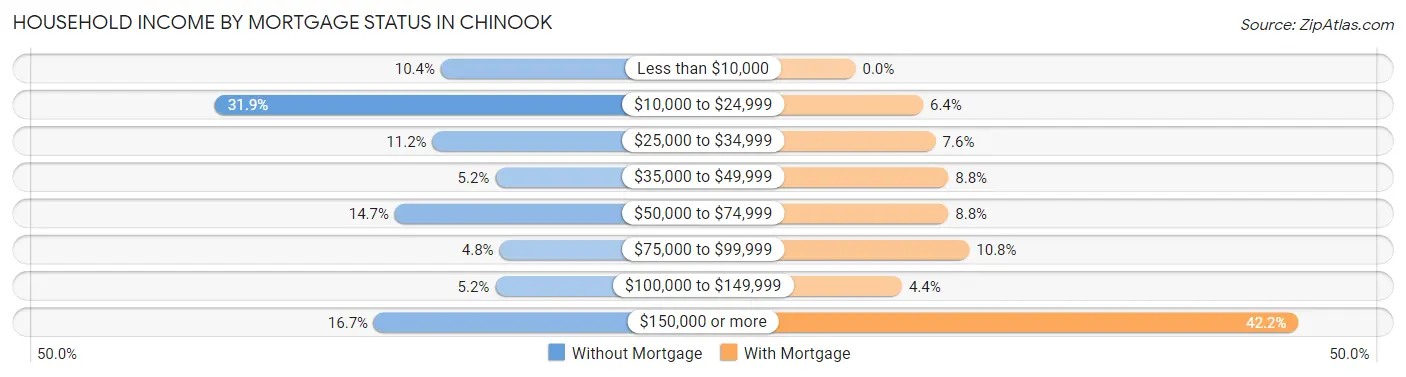
| Household Income | Without Mortgage | With Mortgage |
| Less than $10,000 | 26 (10.4%) | 0 (0.0%) |
| $10,000 to $24,999 | 80 (31.9%) | 16 (6.4%) |
| $25,000 to $34,999 | 28 (11.2%) | 19 (7.6%) |
| $35,000 to $49,999 | 13 (5.2%) | 22 (8.8%) |
| $50,000 to $74,999 | 37 (14.7%) | 22 (8.8%) |
| $75,000 to $99,999 | 12 (4.8%) | 27 (10.8%) |
| $100,000 to $149,999 | 13 (5.2%) | 11 (4.4%) |
| $150,000 or more | 42 (16.7%) | 105 (42.2%) |
| Total | 251 (100.0%) | 249 (100.0%) |
Property Value to Household Income Ratio in Chinook
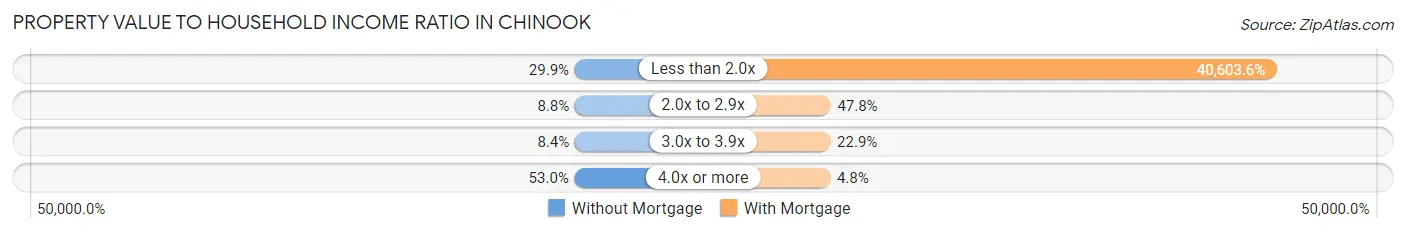
| Value-to-Income Ratio | Without Mortgage | With Mortgage |
| Less than 2.0x | 75 (29.9%) | 101,103 (40,603.6%) |
| 2.0x to 2.9x | 22 (8.8%) | 119 (47.8%) |
| 3.0x to 3.9x | 21 (8.4%) | 57 (22.9%) |
| 4.0x or more | 133 (53.0%) | 12 (4.8%) |
| Total | 251 (100.0%) | 249 (100.0%) |
Real Estate Taxes by Mortgage Status in Chinook
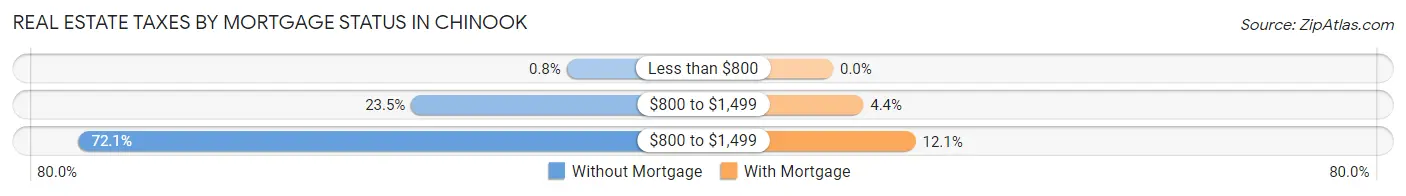
| Property Taxes | Without Mortgage | With Mortgage |
| Less than $800 | 2 (0.8%) | 0 (0.0%) |
| $800 to $1,499 | 59 (23.5%) | 11 (4.4%) |
| $800 to $1,499 | 181 (72.1%) | 30 (12.0%) |
| Total | 251 (100.0%) | 249 (100.0%) |
Health & Disability in Chinook
Health Insurance Coverage by Age in Chinook
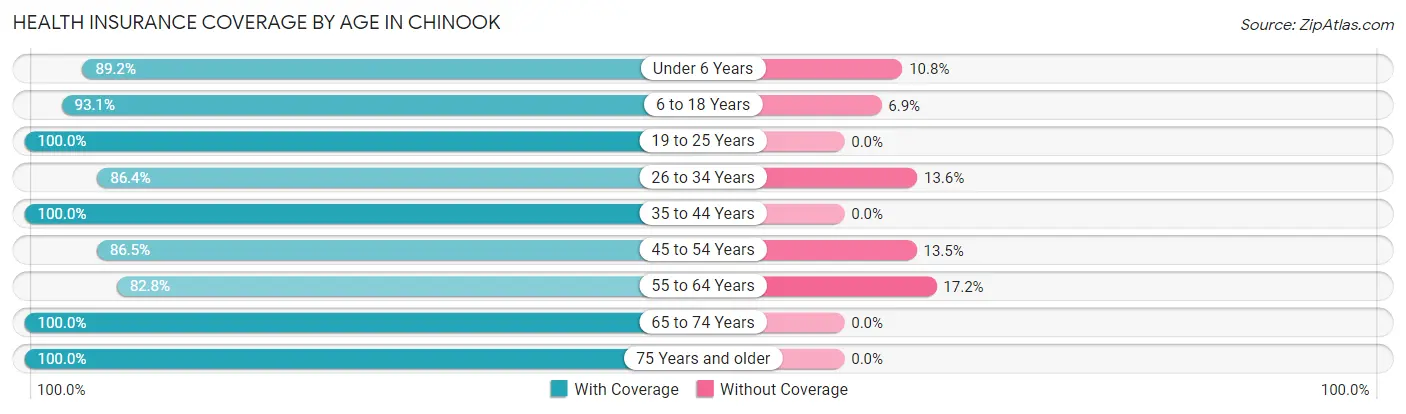
| Age Bracket | With Coverage | Without Coverage |
| Under 6 Years | 99 (89.2%) | 12 (10.8%) |
| 6 to 18 Years | 283 (93.1%) | 21 (6.9%) |
| 19 to 25 Years | 73 (100.0%) | 0 (0.0%) |
| 26 to 34 Years | 121 (86.4%) | 19 (13.6%) |
| 35 to 44 Years | 145 (100.0%) | 0 (0.0%) |
| 45 to 54 Years | 212 (86.5%) | 33 (13.5%) |
| 55 to 64 Years | 135 (82.8%) | 28 (17.2%) |
| 65 to 74 Years | 134 (100.0%) | 0 (0.0%) |
| 75 Years and older | 172 (100.0%) | 0 (0.0%) |
| Total | 1,374 (92.4%) | 113 (7.6%) |
Health Insurance Coverage by Citizenship Status in Chinook
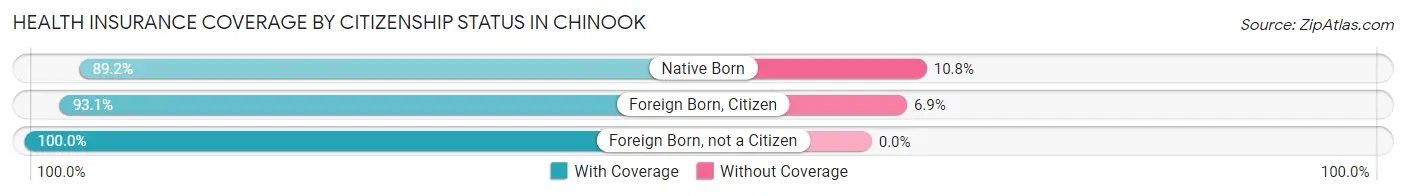
| Citizenship Status | With Coverage | Without Coverage |
| Native Born | 99 (89.2%) | 12 (10.8%) |
| Foreign Born, Citizen | 283 (93.1%) | 21 (6.9%) |
| Foreign Born, not a Citizen | 73 (100.0%) | 0 (0.0%) |
Health Insurance Coverage by Household Income in Chinook
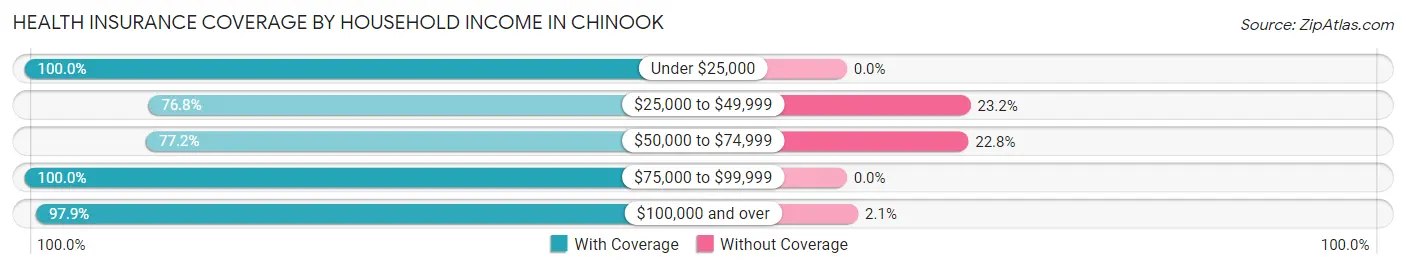
| Household Income | With Coverage | Without Coverage |
| Under $25,000 | 261 (100.0%) | 0 (0.0%) |
| $25,000 to $49,999 | 169 (76.8%) | 51 (23.2%) |
| $50,000 to $74,999 | 156 (77.2%) | 46 (22.8%) |
| $75,000 to $99,999 | 53 (100.0%) | 0 (0.0%) |
| $100,000 and over | 735 (97.9%) | 16 (2.1%) |
Public vs Private Health Insurance Coverage by Age in Chinook
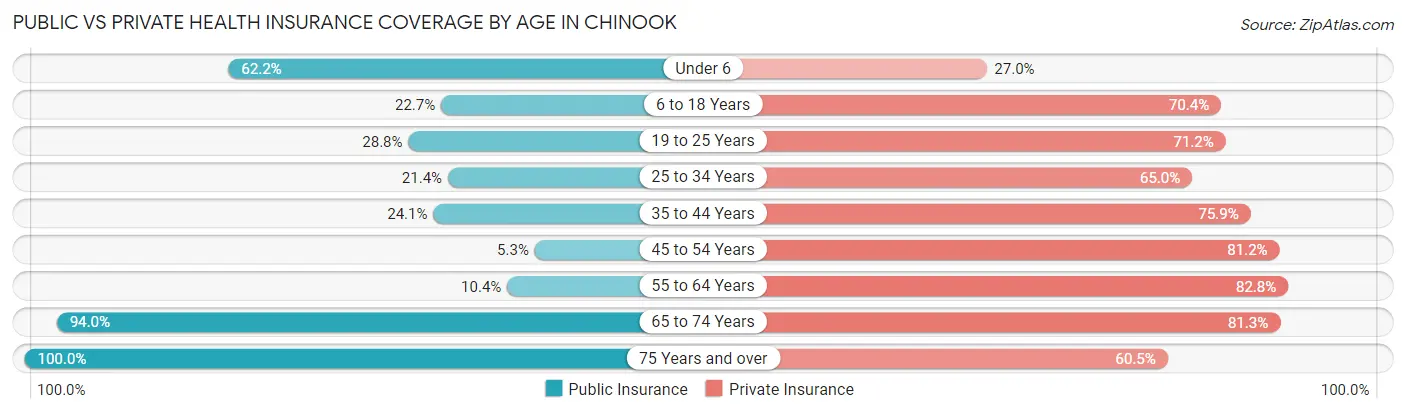
| Age Bracket | Public Insurance | Private Insurance |
| Under 6 | 69 (62.2%) | 30 (27.0%) |
| 6 to 18 Years | 69 (22.7%) | 214 (70.4%) |
| 19 to 25 Years | 21 (28.8%) | 52 (71.2%) |
| 25 to 34 Years | 30 (21.4%) | 91 (65.0%) |
| 35 to 44 Years | 35 (24.1%) | 110 (75.9%) |
| 45 to 54 Years | 13 (5.3%) | 199 (81.2%) |
| 55 to 64 Years | 17 (10.4%) | 135 (82.8%) |
| 65 to 74 Years | 126 (94.0%) | 109 (81.3%) |
| 75 Years and over | 172 (100.0%) | 104 (60.5%) |
| Total | 552 (37.1%) | 1,044 (70.2%) |
Disability Status by Sex by Age in Chinook
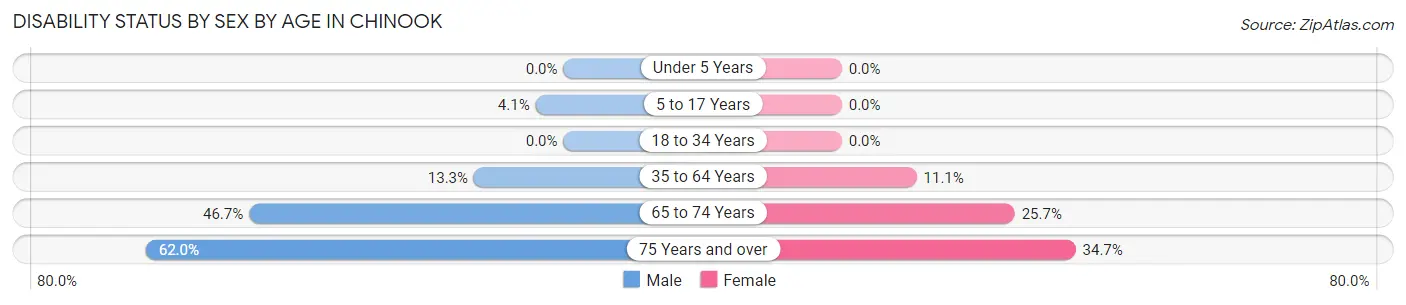
| Age Bracket | Male | Female |
| Under 5 Years | 0 (0.0%) | 0 (0.0%) |
| 5 to 17 Years | 7 (4.1%) | 0 (0.0%) |
| 18 to 34 Years | 0 (0.0%) | 0 (0.0%) |
| 35 to 64 Years | 40 (13.3%) | 28 (11.1%) |
| 65 to 74 Years | 28 (46.7%) | 19 (25.7%) |
| 75 Years and over | 62 (62.0%) | 25 (34.7%) |
Disability Class by Sex by Age in Chinook
Disability Class: Hearing Difficulty
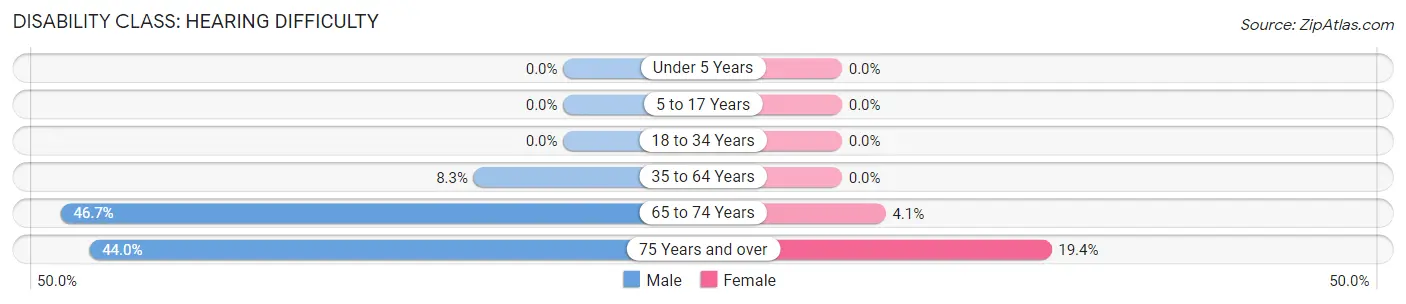
| Age Bracket | Male | Female |
| Under 5 Years | 0 (0.0%) | 0 (0.0%) |
| 5 to 17 Years | 0 (0.0%) | 0 (0.0%) |
| 18 to 34 Years | 0 (0.0%) | 0 (0.0%) |
| 35 to 64 Years | 25 (8.3%) | 0 (0.0%) |
| 65 to 74 Years | 28 (46.7%) | 3 (4.1%) |
| 75 Years and over | 44 (44.0%) | 14 (19.4%) |
Disability Class: Vision Difficulty
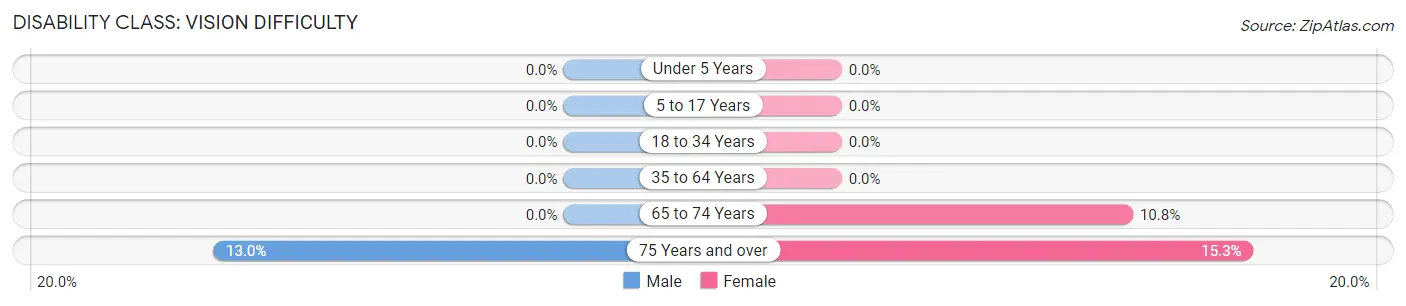
| Age Bracket | Male | Female |
| Under 5 Years | 0 (0.0%) | 0 (0.0%) |
| 5 to 17 Years | 0 (0.0%) | 0 (0.0%) |
| 18 to 34 Years | 0 (0.0%) | 0 (0.0%) |
| 35 to 64 Years | 0 (0.0%) | 0 (0.0%) |
| 65 to 74 Years | 0 (0.0%) | 8 (10.8%) |
| 75 Years and over | 13 (13.0%) | 11 (15.3%) |
Disability Class: Cognitive Difficulty
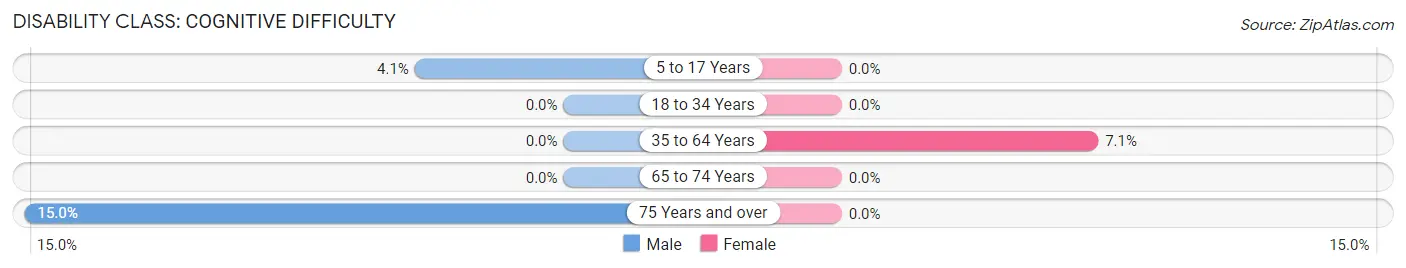
| Age Bracket | Male | Female |
| 5 to 17 Years | 7 (4.1%) | 0 (0.0%) |
| 18 to 34 Years | 0 (0.0%) | 0 (0.0%) |
| 35 to 64 Years | 0 (0.0%) | 18 (7.1%) |
| 65 to 74 Years | 0 (0.0%) | 0 (0.0%) |
| 75 Years and over | 15 (15.0%) | 0 (0.0%) |
Disability Class: Ambulatory Difficulty
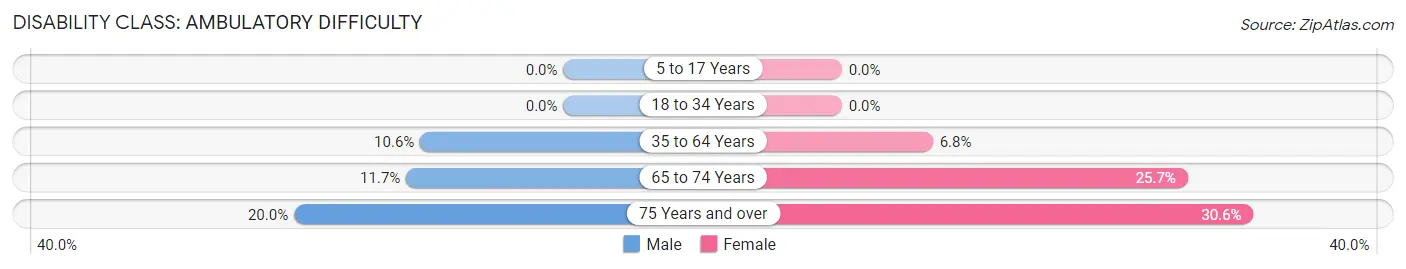
| Age Bracket | Male | Female |
| 5 to 17 Years | 0 (0.0%) | 0 (0.0%) |
| 18 to 34 Years | 0 (0.0%) | 0 (0.0%) |
| 35 to 64 Years | 32 (10.6%) | 17 (6.8%) |
| 65 to 74 Years | 7 (11.7%) | 19 (25.7%) |
| 75 Years and over | 20 (20.0%) | 22 (30.6%) |
Disability Class: Self-Care Difficulty
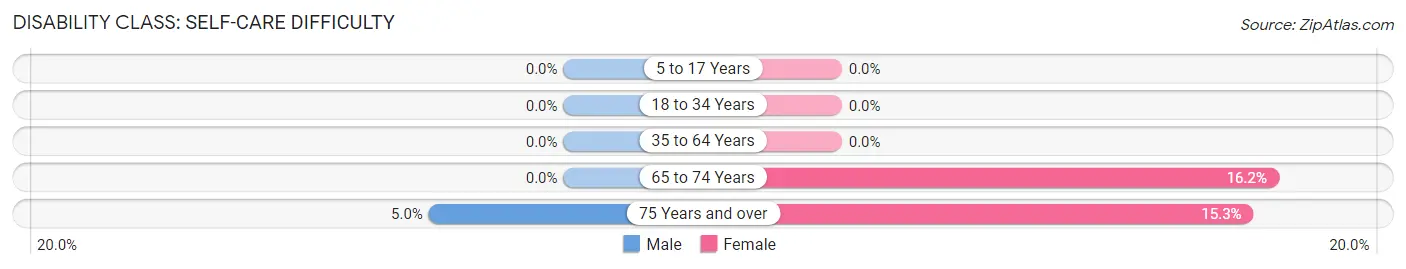
| Age Bracket | Male | Female |
| 5 to 17 Years | 0 (0.0%) | 0 (0.0%) |
| 18 to 34 Years | 0 (0.0%) | 0 (0.0%) |
| 35 to 64 Years | 0 (0.0%) | 0 (0.0%) |
| 65 to 74 Years | 0 (0.0%) | 12 (16.2%) |
| 75 Years and over | 5 (5.0%) | 11 (15.3%) |
Technology Access in Chinook
Computing Device Access in Chinook
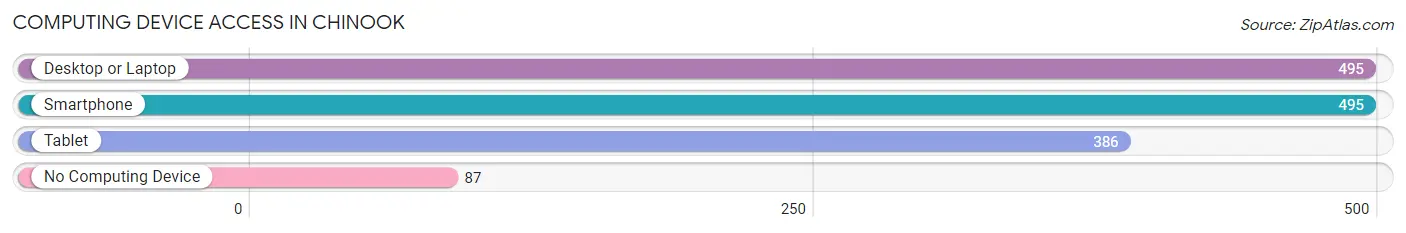
| Device Type | # Households | % Households |
| Desktop or Laptop | 495 | 70.8% |
| Smartphone | 495 | 70.8% |
| Tablet | 386 | 55.2% |
| No Computing Device | 87 | 12.4% |
| Total | 699 | 100.0% |
Internet Access in Chinook
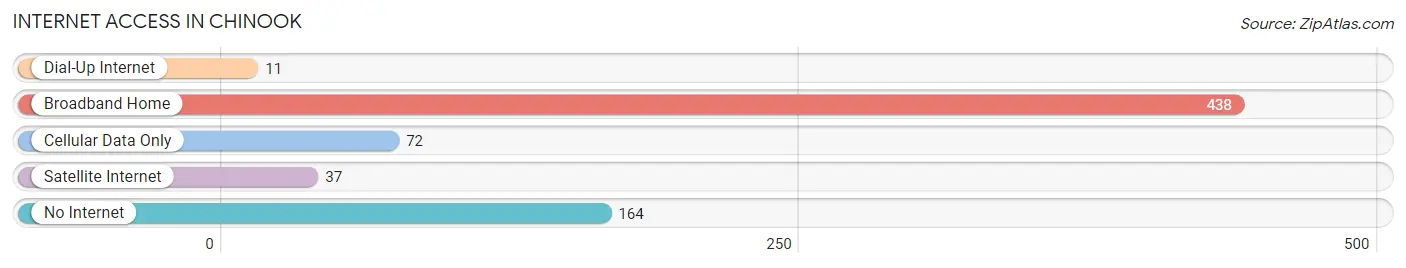
| Internet Type | # Households | % Households |
| Dial-Up Internet | 11 | 1.6% |
| Broadband Home | 438 | 62.7% |
| Cellular Data Only | 72 | 10.3% |
| Satellite Internet | 37 | 5.3% |
| No Internet | 164 | 23.5% |
| Total | 699 | 100.0% |
Chinook Summary
Chinook, Montana is a small town located in Blaine County in the north-central part of the state. It is situated along the Milk River, near the Canadian border. The town was founded in 1887 and has a population of approximately 1,000 people.
Geography
Chinook is located in the northern part of Montana, near the Canadian border. It is situated along the Milk River, which is a tributary of the Missouri River. The town is surrounded by rolling hills and prairies, and is located in the middle of the Great Plains. The climate is semi-arid, with hot summers and cold winters.
Economy
The economy of Chinook is largely based on agriculture and ranching. The town is home to several large farms and ranches, which produce a variety of crops and livestock. The town also has a small manufacturing sector, which produces a variety of products, including furniture, clothing, and food products.
Demographics
As of the 2010 census, the population of Chinook was 1,000 people. The racial makeup of the town was 95.2% White, 0.7% Native American, 0.3% Asian, 0.1% Pacific Islander, 0.1% from other races, and 3.7% from two or more races. The median household income was $37,500, and the median family income was $45,000.
History
Chinook was founded in 1887 by a group of settlers from Minnesota. The town was named after the Chinook tribe, which had inhabited the area for centuries. The town quickly grew, and by the early 1900s, it had become a bustling center of commerce and industry. The town was home to several businesses, including a flour mill, a sawmill, and a creamery.
In the early 1900s, Chinook was also home to a large Chinese population. The Chinese immigrants had come to the area to work in the mines and on the railroads. The Chinese population eventually dwindled, and by the 1950s, the town was mostly populated by white settlers.
In the late 20th century, Chinook experienced a period of economic decline. Many of the businesses that had once been the backbone of the town’s economy had closed, and the population had decreased. In recent years, however, the town has seen a resurgence in economic activity, and the population has begun to grow again.
Today, Chinook is a small but vibrant town. It is home to a variety of businesses, including restaurants, shops, and a museum. The town is also home to a number of festivals and events, including the Chinook Rodeo and the Chinook Music Festival. The town is a popular destination for tourists, who come to enjoy the town’s natural beauty and its unique history.
Common Questions
What is Per Capita Income in Chinook?
Per Capita income in Chinook is $37,044.
What is the Median Family Income in Chinook?
Median Family Income in Chinook is $102,708.
What is the Median Household income in Chinook?
Median Household Income in Chinook is $47,067.
What is Income or Wage Gap in Chinook?
Income or Wage Gap in Chinook is 28.5%.
Women in Chinook earn 71.5 cents for every dollar earned by a man.
What is Family Income Deficit in Chinook?
Family Income Deficit in Chinook is $7,500.
Families that are below poverty line in Chinook earn $7,500 less on average than the poverty threshold level.
What is Inequality or Gini Index in Chinook?
Inequality or Gini Index in Chinook is 0.49.
What is the Total Population of Chinook?
Total Population of Chinook is 1,488.
What is the Total Male Population of Chinook?
Total Male Population of Chinook is 770.
What is the Total Female Population of Chinook?
Total Female Population of Chinook is 718.
What is the Ratio of Males per 100 Females in Chinook?
There are 107.24 Males per 100 Females in Chinook.
What is the Ratio of Females per 100 Males in Chinook?
There are 93.25 Females per 100 Males in Chinook.
What is the Median Population Age in Chinook?
Median Population Age in Chinook is 41.2 Years.
What is the Average Family Size in Chinook
Average Family Size in Chinook is 3.2 People.
What is the Average Household Size in Chinook
Average Household Size in Chinook is 2.1 People.
How Large is the Labor Force in Chinook?
There are 779 People in the Labor Forcein in Chinook.
What is the Percentage of People in the Labor Force in Chinook?
69.3% of People are in the Labor Force in Chinook.
What is the Unemployment Rate in Chinook?
Unemployment Rate in Chinook is 2.3%.