Zip Codes with the Highest Percentage of Population Employed in Mining, Quarrying, & Extraction in Iowa
RELATED REPORTS & OPTIONS
Mining, Quarrying, & Extraction
Iowa
Compare Zip Codes
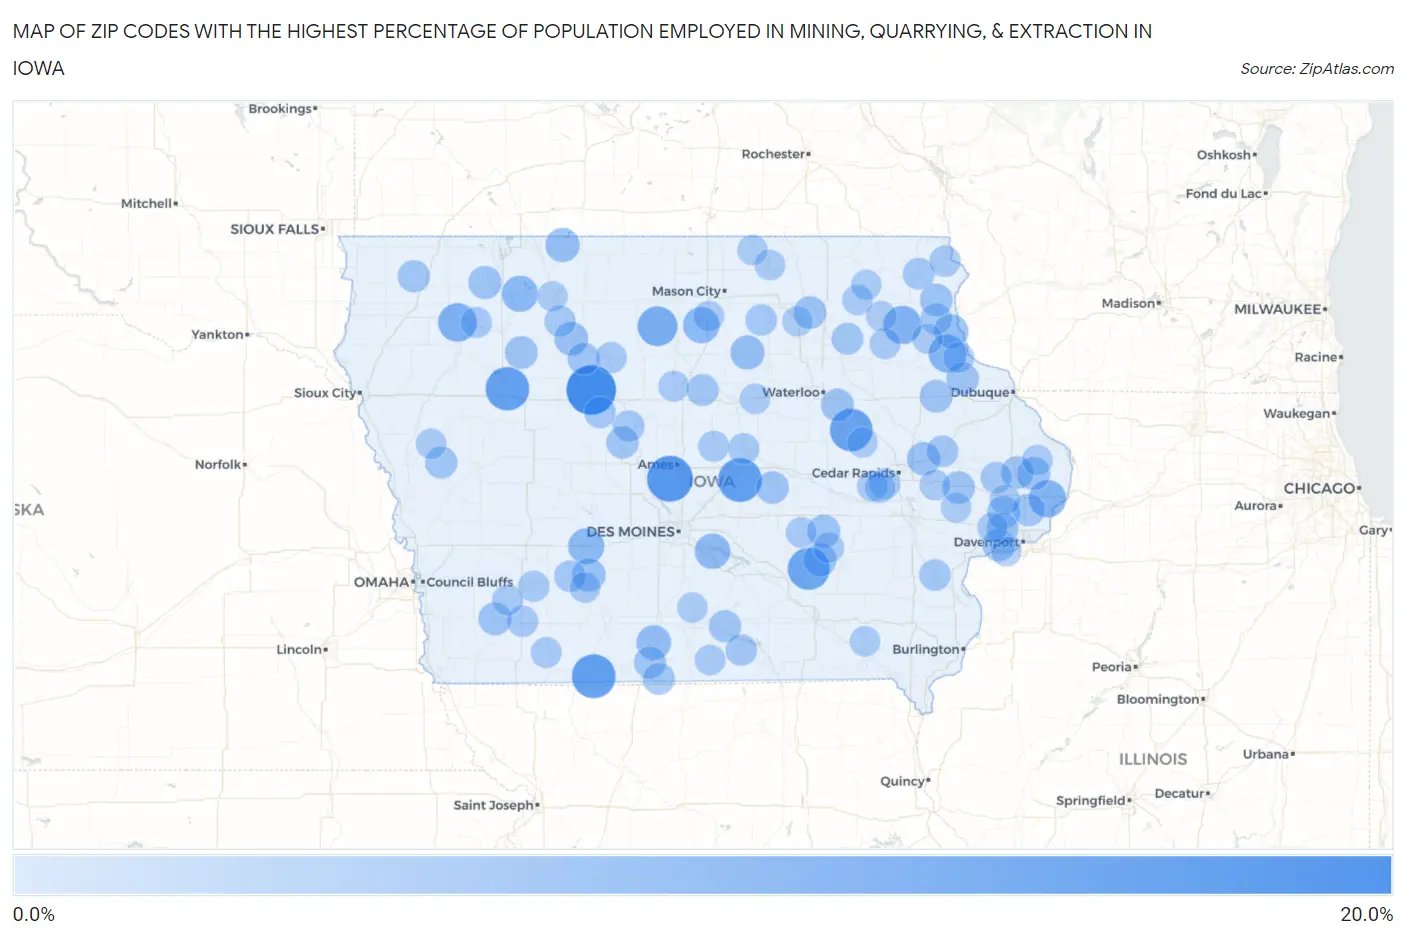
Map of Zip Codes with the Highest Percentage of Population Employed in Mining, Quarrying, & Extraction in Iowa
0.0%
20.0%
Zip Codes with the Highest Percentage of Population Employed in Mining, Quarrying, & Extraction in Iowa
| Zip Code | % Employed | vs State | vs National | |
| 1. | 50518 | 15.2% | 0.17%(+15.0)#1 | 0.44%(+14.7)#419 |
| 2. | 50134 | 12.3% | 0.17%(+12.1)#2 | 0.44%(+11.9)#609 |
| 3. | 50162 | 10.8% | 0.17%(+10.6)#3 | 0.44%(+10.4)#728 |
| 4. | 50860 | 10.7% | 0.17%(+10.5)#4 | 0.44%(+10.3)#741 |
| 5. | 50567 | 10.6% | 0.17%(+10.4)#5 | 0.44%(+10.1)#751 |
| 6. | 52313 | 9.9% | 0.17%(+9.69)#6 | 0.44%(+9.43)#834 |
| 7. | 52586 | 9.4% | 0.17%(+9.24)#7 | 0.44%(+8.97)#890 |
| 8. | 50447 | 7.7% | 0.17%(+7.53)#8 | 0.44%(+7.26)#1,128 |
| 9. | 51009 | 6.9% | 0.17%(+6.73)#9 | 0.44%(+6.46)#1,284 |
| 10. | 52141 | 6.5% | 0.17%(+6.32)#10 | 0.44%(+6.05)#1,364 |
| 11. | 52048 | 6.2% | 0.17%(+6.08)#11 | 0.44%(+5.81)#1,414 |
| 12. | 52757 | 5.9% | 0.17%(+5.71)#12 | 0.44%(+5.44)#1,502 |
| 13. | 50479 | 5.2% | 0.17%(+5.06)#13 | 0.44%(+4.79)#1,696 |
| 14. | 51333 | 5.1% | 0.17%(+4.92)#14 | 0.44%(+4.65)#1,744 |
| 15. | 50164 | 5.0% | 0.17%(+4.83)#15 | 0.44%(+4.56)#1,769 |
| 16. | 50252 | 4.5% | 0.17%(+4.34)#16 | 0.44%(+4.07)#1,929 |
| 17. | 50262 | 4.0% | 0.17%(+3.83)#17 | 0.44%(+3.56)#2,140 |
| 18. | 52049 | 3.6% | 0.17%(+3.41)#18 | 0.44%(+3.14)#2,358 |
| 19. | 50625 | 3.6% | 0.17%(+3.41)#19 | 0.44%(+3.14)#2,361 |
| 20. | 50531 | 3.6% | 0.17%(+3.40)#20 | 0.44%(+3.13)#2,370 |
| 21. | 50581 | 3.3% | 0.17%(+3.13)#21 | 0.44%(+2.86)#2,551 |
| 22. | 50849 | 3.2% | 0.17%(+3.01)#22 | 0.44%(+2.74)#2,607 |
| 23. | 52336 | 3.1% | 0.17%(+2.89)#23 | 0.44%(+2.62)#2,691 |
| 24. | 51338 | 2.9% | 0.17%(+2.74)#24 | 0.44%(+2.47)#2,796 |
| 25. | 50268 | 2.8% | 0.17%(+2.67)#25 | 0.44%(+2.40)#2,853 |
| 26. | 51566 | 2.8% | 0.17%(+2.58)#26 | 0.44%(+2.31)#2,931 |
| 27. | 52731 | 2.7% | 0.17%(+2.56)#27 | 0.44%(+2.29)#2,951 |
| 28. | 52222 | 2.7% | 0.17%(+2.53)#28 | 0.44%(+2.26)#2,967 |
| 29. | 52745 | 2.7% | 0.17%(+2.50)#29 | 0.44%(+2.23)#3,001 |
| 30. | 50634 | 2.6% | 0.17%(+2.45)#30 | 0.44%(+2.18)#3,033 |
| 31. | 50510 | 2.6% | 0.17%(+2.43)#31 | 0.44%(+2.16)#3,053 |
| 32. | 52036 | 2.6% | 0.17%(+2.43)#32 | 0.44%(+2.16)#3,054 |
| 33. | 52159 | 2.6% | 0.17%(+2.41)#33 | 0.44%(+2.14)#3,062 |
| 34. | 52037 | 2.6% | 0.17%(+2.39)#34 | 0.44%(+2.12)#3,084 |
| 35. | 50645 | 2.5% | 0.17%(+2.35)#35 | 0.44%(+2.08)#3,118 |
| 36. | 52065 | 2.5% | 0.17%(+2.31)#36 | 0.44%(+2.04)#3,150 |
| 37. | 52726 | 2.4% | 0.17%(+2.26)#37 | 0.44%(+2.00)#3,195 |
| 38. | 52337 | 2.4% | 0.17%(+2.25)#38 | 0.44%(+1.98)#3,210 |
| 39. | 50106 | 2.4% | 0.17%(+2.25)#39 | 0.44%(+1.98)#3,212 |
| 40. | 52756 | 2.2% | 0.17%(+2.06)#40 | 0.44%(+1.79)#3,413 |
| 41. | 50238 | 2.2% | 0.17%(+2.05)#41 | 0.44%(+1.78)#3,422 |
| 42. | 50040 | 2.2% | 0.17%(+2.05)#42 | 0.44%(+1.78)#3,425 |
| 43. | 51244 | 2.2% | 0.17%(+2.03)#43 | 0.44%(+1.76)#3,454 |
| 44. | 51060 | 2.1% | 0.17%(+1.96)#44 | 0.44%(+1.69)#3,521 |
| 45. | 50541 | 2.1% | 0.17%(+1.91)#45 | 0.44%(+1.64)#3,573 |
| 46. | 52773 | 2.1% | 0.17%(+1.89)#46 | 0.44%(+1.62)#3,589 |
| 47. | 50067 | 2.1% | 0.17%(+1.89)#47 | 0.44%(+1.62)#3,595 |
| 48. | 50006 | 2.0% | 0.17%(+1.86)#48 | 0.44%(+1.59)#3,624 |
| 49. | 50065 | 2.0% | 0.17%(+1.84)#49 | 0.44%(+1.57)#3,650 |
| 50. | 50674 | 1.9% | 0.17%(+1.69)#50 | 0.44%(+1.42)#3,822 |
| 51. | 52172 | 1.8% | 0.17%(+1.60)#51 | 0.44%(+1.33)#3,931 |
| 52. | 52205 | 1.8% | 0.17%(+1.59)#52 | 0.44%(+1.32)#3,947 |
| 53. | 52738 | 1.8% | 0.17%(+1.58)#53 | 0.44%(+1.31)#3,955 |
| 54. | 50530 | 1.7% | 0.17%(+1.54)#54 | 0.44%(+1.27)#4,011 |
| 55. | 52047 | 1.7% | 0.17%(+1.52)#55 | 0.44%(+1.25)#4,032 |
| 56. | 50523 | 1.7% | 0.17%(+1.51)#56 | 0.44%(+1.25)#4,053 |
| 57. | 50846 | 1.7% | 0.17%(+1.50)#57 | 0.44%(+1.23)#4,072 |
| 58. | 50653 | 1.7% | 0.17%(+1.50)#58 | 0.44%(+1.23)#4,090 |
| 59. | 52581 | 1.6% | 0.17%(+1.45)#59 | 0.44%(+1.19)#4,142 |
| 60. | 52254 | 1.6% | 0.17%(+1.43)#60 | 0.44%(+1.16)#4,181 |
| 61. | 52151 | 1.5% | 0.17%(+1.32)#61 | 0.44%(+1.05)#4,370 |
| 62. | 50864 | 1.5% | 0.17%(+1.32)#62 | 0.44%(+1.05)#4,379 |
| 63. | 50562 | 1.4% | 0.17%(+1.28)#63 | 0.44%(+1.01)#4,448 |
| 64. | 50843 | 1.4% | 0.17%(+1.24)#64 | 0.44%(+0.975)#4,504 |
| 65. | 51047 | 1.4% | 0.17%(+1.20)#65 | 0.44%(+0.933)#4,587 |
| 66. | 50005 | 1.4% | 0.17%(+1.20)#66 | 0.44%(+0.930)#4,593 |
| 67. | 50529 | 1.4% | 0.17%(+1.19)#67 | 0.44%(+0.919)#4,608 |
| 68. | 50278 | 1.2% | 0.17%(+1.05)#68 | 0.44%(+0.776)#4,871 |
| 69. | 51532 | 1.2% | 0.17%(+1.03)#69 | 0.44%(+0.761)#4,907 |
| 70. | 50848 | 1.2% | 0.17%(+1.00)#70 | 0.44%(+0.736)#4,949 |
| 71. | 52253 | 1.1% | 0.17%(+0.948)#71 | 0.44%(+0.679)#5,080 |
| 72. | 52142 | 1.1% | 0.17%(+0.920)#72 | 0.44%(+0.651)#5,158 |
| 73. | 50136 | 1.1% | 0.17%(+0.881)#73 | 0.44%(+0.612)#5,253 |
| 74. | 52729 | 1.1% | 0.17%(+0.879)#74 | 0.44%(+0.610)#5,257 |
| 75. | 50858 | 1.0% | 0.17%(+0.873)#75 | 0.44%(+0.604)#5,268 |
| 76. | 50171 | 1.0% | 0.17%(+0.872)#76 | 0.44%(+0.603)#5,270 |
| 77. | 50477 | 1.0% | 0.17%(+0.849)#77 | 0.44%(+0.580)#5,325 |
| 78. | 52228 | 1.0% | 0.17%(+0.834)#78 | 0.44%(+0.565)#5,363 |
| 79. | 50034 | 0.99% | 0.17%(+0.819)#79 | 0.44%(+0.550)#5,413 |
| 80. | 50060 | 0.97% | 0.17%(+0.799)#80 | 0.44%(+0.531)#5,460 |
| 81. | 52318 | 0.97% | 0.17%(+0.795)#81 | 0.44%(+0.526)#5,475 |
| 82. | 52052 | 0.96% | 0.17%(+0.785)#82 | 0.44%(+0.516)#5,494 |
| 83. | 50461 | 0.95% | 0.17%(+0.781)#83 | 0.44%(+0.512)#5,505 |
| 84. | 52171 | 0.95% | 0.17%(+0.778)#84 | 0.44%(+0.509)#5,514 |
| 85. | 52175 | 0.91% | 0.17%(+0.737)#85 | 0.44%(+0.468)#5,629 |
| 86. | 52351 | 0.90% | 0.17%(+0.729)#86 | 0.44%(+0.461)#5,653 |
| 87. | 52535 | 0.90% | 0.17%(+0.729)#87 | 0.44%(+0.461)#5,654 |
| 88. | 52772 | 0.90% | 0.17%(+0.724)#88 | 0.44%(+0.455)#5,669 |
| 89. | 52069 | 0.89% | 0.17%(+0.717)#89 | 0.44%(+0.448)#5,687 |
| 90. | 50680 | 0.88% | 0.17%(+0.713)#90 | 0.44%(+0.445)#5,689 |
| 91. | 51034 | 0.88% | 0.17%(+0.711)#91 | 0.44%(+0.442)#5,701 |
| 92. | 50658 | 0.88% | 0.17%(+0.710)#92 | 0.44%(+0.441)#5,706 |
| 93. | 50151 | 0.87% | 0.17%(+0.703)#93 | 0.44%(+0.434)#5,727 |
| 94. | 52043 | 0.87% | 0.17%(+0.694)#94 | 0.44%(+0.426)#5,747 |
| 95. | 50536 | 0.85% | 0.17%(+0.683)#95 | 0.44%(+0.414)#5,795 |
| 96. | 52728 | 0.85% | 0.17%(+0.683)#96 | 0.44%(+0.414)#5,796 |
| 97. | 52769 | 0.85% | 0.17%(+0.680)#97 | 0.44%(+0.411)#5,808 |
| 98. | 52349 | 0.81% | 0.17%(+0.635)#98 | 0.44%(+0.366)#5,969 |
| 99. | 52132 | 0.79% | 0.17%(+0.615)#99 | 0.44%(+0.346)#6,031 |
| 100. | 50472 | 0.78% | 0.17%(+0.608)#100 | 0.44%(+0.339)#6,056 |
Common Questions
What are the Top 10 Zip Codes with the Highest Percentage of Population Employed in Mining, Quarrying, & Extraction in Iowa?
Top 10 Zip Codes with the Highest Percentage of Population Employed in Mining, Quarrying, & Extraction in Iowa are:
What zip code has the Highest Percentage of Population Employed in Mining, Quarrying, & Extraction in Iowa?
50518 has the Highest Percentage of Population Employed in Mining, Quarrying, & Extraction in Iowa with 15.2%.
What is the Percentage of Population Employed in Mining, Quarrying, & Extraction in the State of Iowa?
Percentage of Population Employed in Mining, Quarrying, & Extraction in Iowa is 0.17%.
What is the Percentage of Population Employed in Mining, Quarrying, & Extraction in the United States?
Percentage of Population Employed in Mining, Quarrying, & Extraction in the United States is 0.44%.