Gulf Stream, FL Map & Demographics
Gulf Stream Map
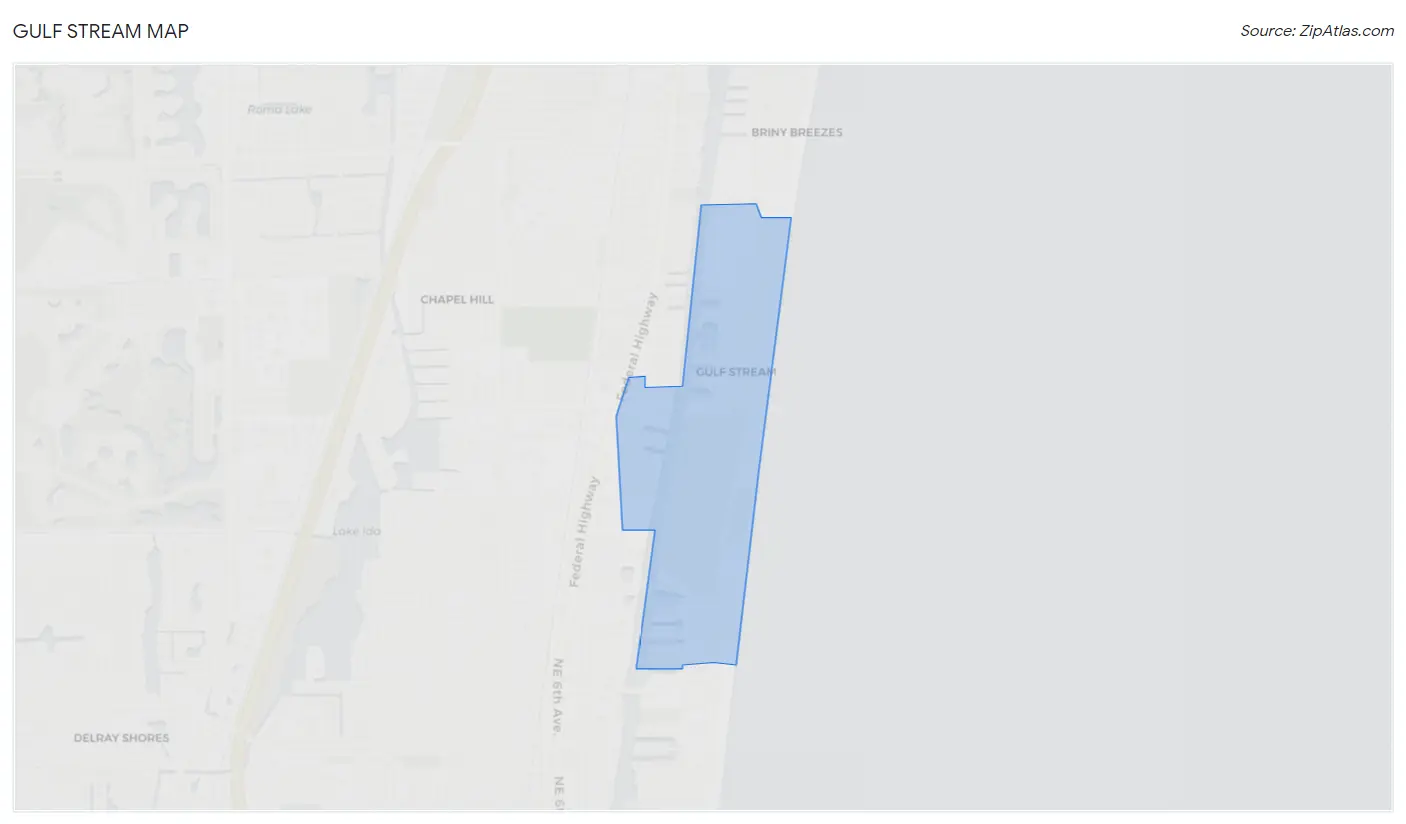
Gulf Stream Overview
$219,550
PER CAPITA INCOME
$250,001
AVG FAMILY INCOME
$227,500
AVG HOUSEHOLD INCOME
0.60
INEQUALITY / GINI INDEX
848
TOTAL POPULATION
425
MALE POPULATION
423
FEMALE POPULATION
100.47
MALES / 100 FEMALES
99.53
FEMALES / 100 MALES
61.8
MEDIAN AGE
2.4
AVG FAMILY SIZE
2.2
AVG HOUSEHOLD SIZE
334
LABOR FORCE [ PEOPLE ]
43.3%
PERCENT IN LABOR FORCE
6.0%
UNEMPLOYMENT RATE
Gulf Stream Area Codes
Income in Gulf Stream
Income Overview in Gulf Stream
Per Capita Income in Gulf Stream is $219,550, while median incomes of families and households are $250,001 and $227,500 respectively.
| Characteristic | Number | Measure |
| Per Capita Income | 848 | $219,550 |
| Median Family Income | 289 | $250,001 |
| Mean Family Income | 289 | $552,027 |
| Median Household Income | 392 | $227,500 |
| Mean Household Income | 392 | $475,275 |
| Income Deficit | 289 | $0 |
| Wage / Income Gap (%) | 848 | 0.00% |
| Wage / Income Gap ($) | 848 | 100.00¢ per $1 |
| Gini / Inequality Index | 848 | 0.60 |
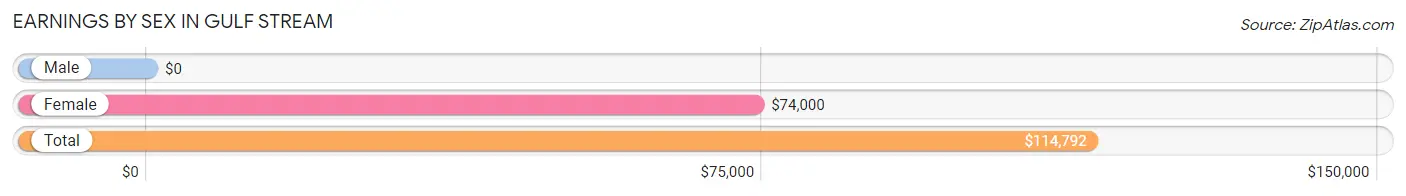
Earnings by Sex in Gulf Stream
| Sex | Number | Average Earnings |
| Male | 217 (61.1%) | $0 |
| Female | 138 (38.9%) | $74,000 |
| Total | 355 (100.0%) | $114,792 |
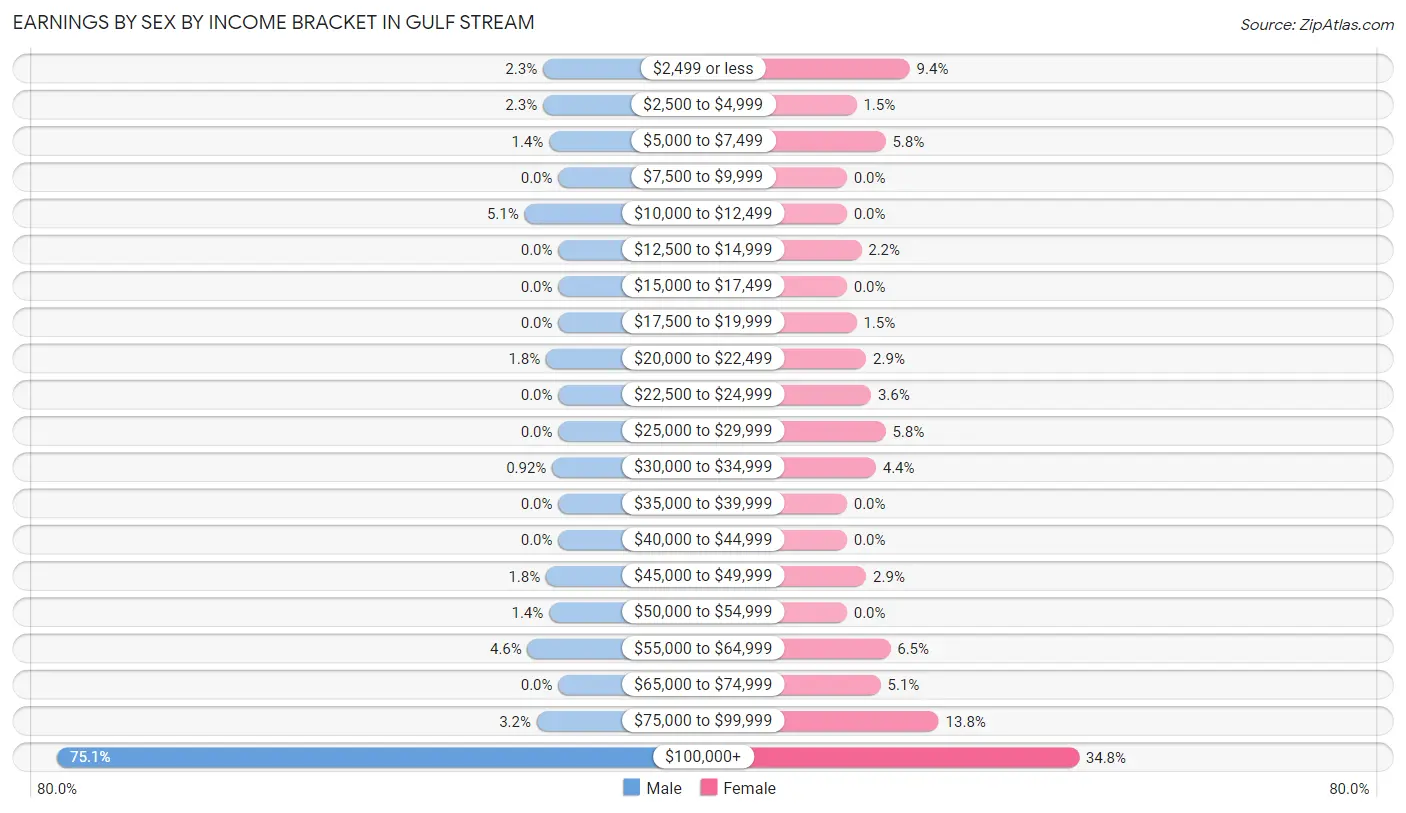
Earnings by Sex by Income Bracket in Gulf Stream
The most common earnings brackets in Gulf Stream are $100,000+ for men (163 | 75.1%) and $100,000+ for women (48 | 34.8%).
| Income | Male | Female |
| $2,499 or less | 5 (2.3%) | 13 (9.4%) |
| $2,500 to $4,999 | 5 (2.3%) | 2 (1.5%) |
| $5,000 to $7,499 | 3 (1.4%) | 8 (5.8%) |
| $7,500 to $9,999 | 0 (0.0%) | 0 (0.0%) |
| $10,000 to $12,499 | 11 (5.1%) | 0 (0.0%) |
| $12,500 to $14,999 | 0 (0.0%) | 3 (2.2%) |
| $15,000 to $17,499 | 0 (0.0%) | 0 (0.0%) |
| $17,500 to $19,999 | 0 (0.0%) | 2 (1.5%) |
| $20,000 to $22,499 | 4 (1.8%) | 4 (2.9%) |
| $22,500 to $24,999 | 0 (0.0%) | 5 (3.6%) |
| $25,000 to $29,999 | 0 (0.0%) | 8 (5.8%) |
| $30,000 to $34,999 | 2 (0.9%) | 6 (4.3%) |
| $35,000 to $39,999 | 0 (0.0%) | 0 (0.0%) |
| $40,000 to $44,999 | 0 (0.0%) | 0 (0.0%) |
| $45,000 to $49,999 | 4 (1.8%) | 4 (2.9%) |
| $50,000 to $54,999 | 3 (1.4%) | 0 (0.0%) |
| $55,000 to $64,999 | 10 (4.6%) | 9 (6.5%) |
| $65,000 to $74,999 | 0 (0.0%) | 7 (5.1%) |
| $75,000 to $99,999 | 7 (3.2%) | 19 (13.8%) |
| $100,000+ | 163 (75.1%) | 48 (34.8%) |
| Total | 217 (100.0%) | 138 (100.0%) |
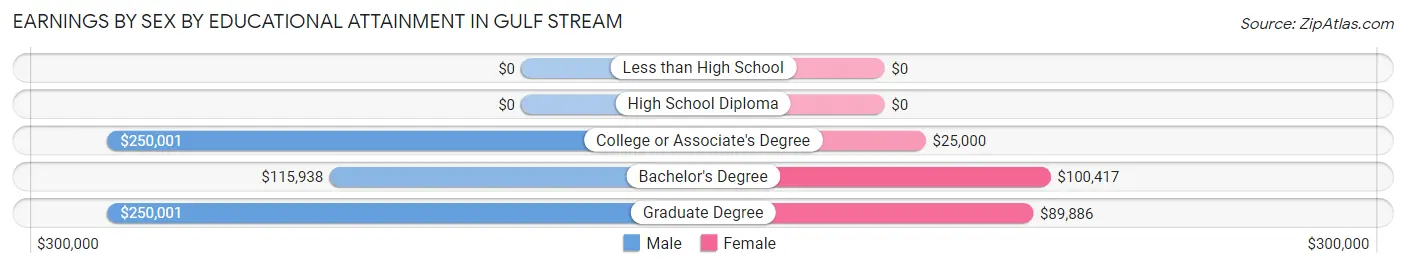
Earnings by Sex by Educational Attainment in Gulf Stream
Average earnings in Gulf Stream are $202,750 for men and $85,000 for women, a difference of 58.1%. Men with an educational attainment of college or associate's degree enjoy the highest average annual earnings of $250,001, while those with bachelor's degree education earn the least with $115,938. Women with an educational attainment of bachelor's degree earn the most with the average annual earnings of $100,417, while those with college or associate's degree education have the smallest earnings of $25,000.
| Educational Attainment | Male Income | Female Income |
| Less than High School | - | - |
| High School Diploma | - | - |
| College or Associate's Degree | $250,001 | $25,000 |
| Bachelor's Degree | $115,938 | $100,417 |
| Graduate Degree | $250,001 | $89,886 |
| Total | $202,750 | $85,000 |
Family Income in Gulf Stream
Family Income Brackets in Gulf Stream
According to the Gulf Stream family income data, there are 168 families falling into the $200,000+ income range, which is the most common income bracket and makes up 58.1% of all families. Conversely, the less than $10,000 income bracket is the least frequent group with only 3 families (1.0%) belonging to this category.
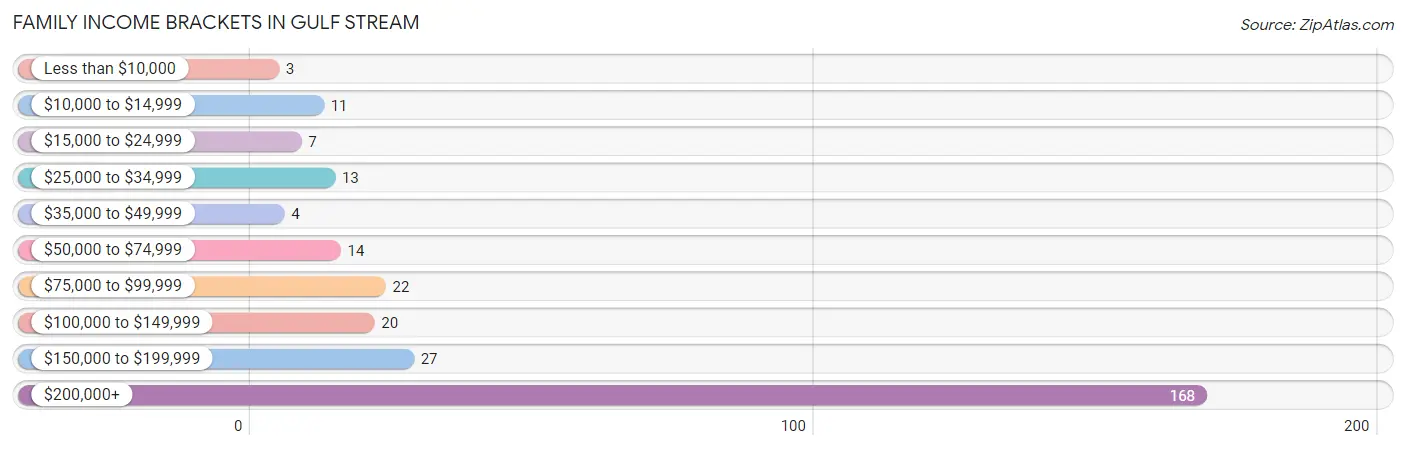
| Income Bracket | # Families | % Families |
| Less than $10,000 | 3 | 1.0% |
| $10,000 to $14,999 | 11 | 3.8% |
| $15,000 to $24,999 | 7 | 2.4% |
| $25,000 to $34,999 | 13 | 4.5% |
| $35,000 to $49,999 | 4 | 1.4% |
| $50,000 to $74,999 | 14 | 4.8% |
| $75,000 to $99,999 | 22 | 7.6% |
| $100,000 to $149,999 | 20 | 6.9% |
| $150,000 to $199,999 | 27 | 9.3% |
| $200,000+ | 168 | 58.1% |
Family Income by Famaliy Size in Gulf Stream
2-person families (226 | 78.2%) account for the highest median family income in Gulf Stream with $250,001 per family, while 2-person families (226 | 78.2%) have the highest median income of $125,000 per family member.
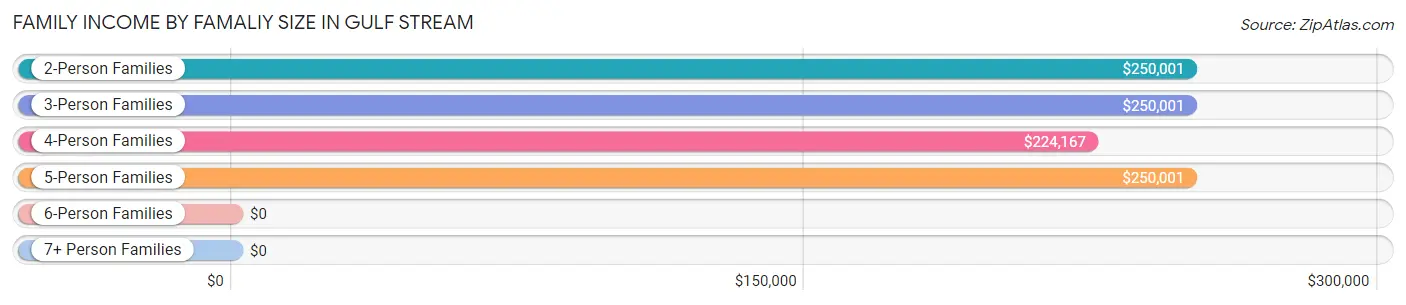
| Income Bracket | # Families | Median Income |
| 2-Person Families | 226 (78.2%) | $250,001 |
| 3-Person Families | 33 (11.4%) | $250,001 |
| 4-Person Families | 18 (6.2%) | $224,167 |
| 5-Person Families | 9 (3.1%) | $250,001 |
| 6-Person Families | 3 (1.0%) | $0 |
| 7+ Person Families | 0 (0.0%) | $0 |
| Total | 289 (100.0%) | $250,001 |
Family Income by Number of Earners in Gulf Stream
The median family income in Gulf Stream is $250,001, with families comprising 1 earner (104) having the highest median family income of $250,001, while families with no earners (106) have the lowest median family income of $89,167, accounting for 36.0% and 36.7% of families, respectively.
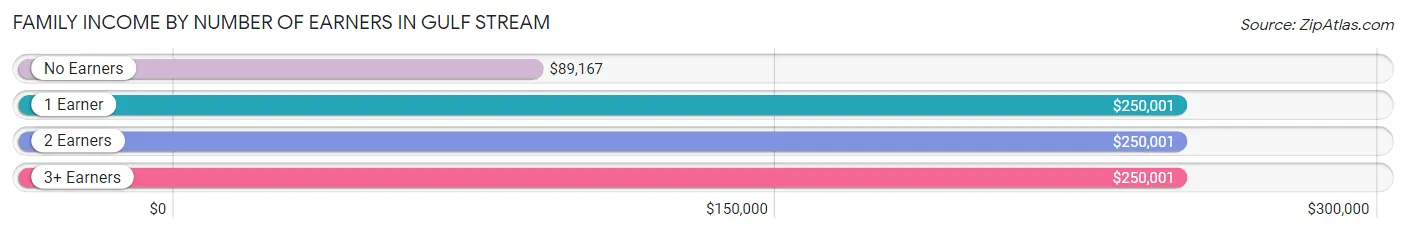
| Number of Earners | # Families | Median Income |
| No Earners | 106 (36.7%) | $89,167 |
| 1 Earner | 104 (36.0%) | $250,001 |
| 2 Earners | 67 (23.2%) | $250,001 |
| 3+ Earners | 12 (4.2%) | $250,001 |
| Total | 289 (100.0%) | $250,001 |
Household Income in Gulf Stream
Household Income Brackets in Gulf Stream
With 202 households falling in the category, the $200,000+ income range is the most frequent in Gulf Stream, accounting for 51.5% of all households. In contrast, only 12 households (3.1%) fall into the less than $10,000 income bracket, making it the least populous group.
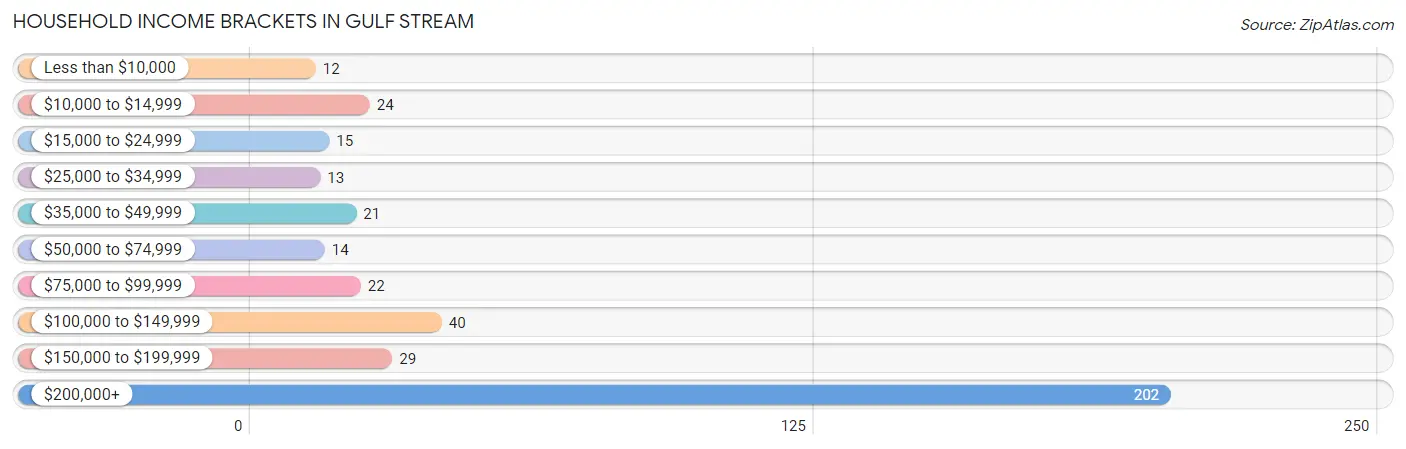
| Income Bracket | # Households | % Households |
| Less than $10,000 | 12 | 3.1% |
| $10,000 to $14,999 | 24 | 6.1% |
| $15,000 to $24,999 | 15 | 3.8% |
| $25,000 to $34,999 | 13 | 3.3% |
| $35,000 to $49,999 | 21 | 5.4% |
| $50,000 to $74,999 | 14 | 3.6% |
| $75,000 to $99,999 | 22 | 5.6% |
| $100,000 to $149,999 | 40 | 10.2% |
| $150,000 to $199,999 | 29 | 7.4% |
| $200,000+ | 202 | 51.5% |
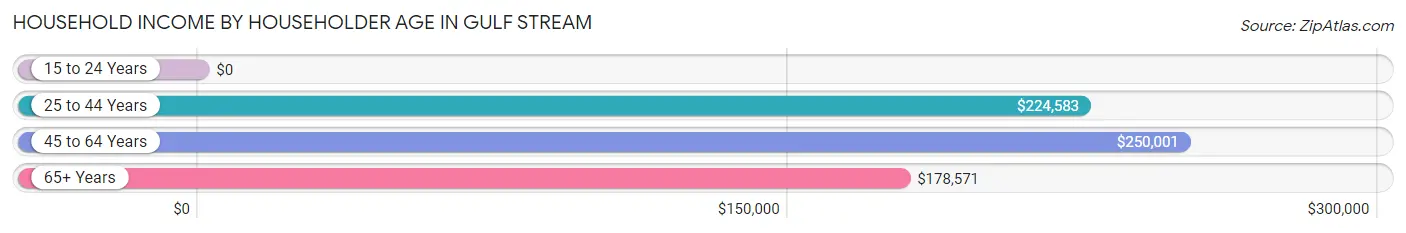
Household Income by Householder Age in Gulf Stream
The median household income in Gulf Stream is $227,500, with the highest median household income of $250,001 found in the 45 to 64 years age bracket for the primary householder. A total of 153 households (39.0%) fall into this category.
| Income Bracket | # Households | Median Income |
| 15 to 24 Years | 0 (0.0%) | $0 |
| 25 to 44 Years | 31 (7.9%) | $224,583 |
| 45 to 64 Years | 153 (39.0%) | $250,001 |
| 65+ Years | 208 (53.1%) | $178,571 |
| Total | 392 (100.0%) | $227,500 |
Poverty in Gulf Stream
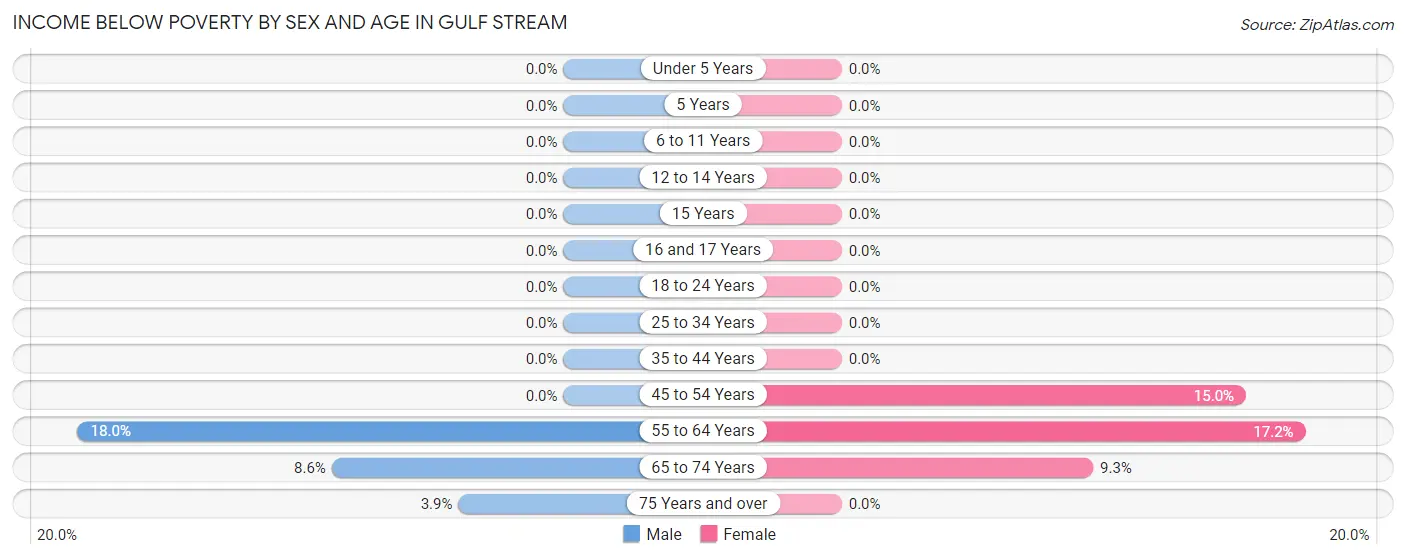
Income Below Poverty by Sex and Age in Gulf Stream
With 7.8% poverty level for males and 8.7% for females among the residents of Gulf Stream, 55 to 64 year old males and 55 to 64 year old females are the most vulnerable to poverty, with 22 males (18.0%) and 21 females (17.2%) in their respective age groups living below the poverty level.
| Age Bracket | Male | Female |
| Under 5 Years | 0 (0.0%) | 0 (0.0%) |
| 5 Years | 0 (0.0%) | 0 (0.0%) |
| 6 to 11 Years | 0 (0.0%) | 0 (0.0%) |
| 12 to 14 Years | 0 (0.0%) | 0 (0.0%) |
| 15 Years | 0 (0.0%) | 0 (0.0%) |
| 16 and 17 Years | 0 (0.0%) | 0 (0.0%) |
| 18 to 24 Years | 0 (0.0%) | 0 (0.0%) |
| 25 to 34 Years | 0 (0.0%) | 0 (0.0%) |
| 35 to 44 Years | 0 (0.0%) | 0 (0.0%) |
| 45 to 54 Years | 0 (0.0%) | 9 (15.0%) |
| 55 to 64 Years | 22 (18.0%) | 21 (17.2%) |
| 65 to 74 Years | 8 (8.6%) | 7 (9.3%) |
| 75 Years and over | 3 (3.9%) | 0 (0.0%) |
| Total | 33 (7.8%) | 37 (8.7%) |
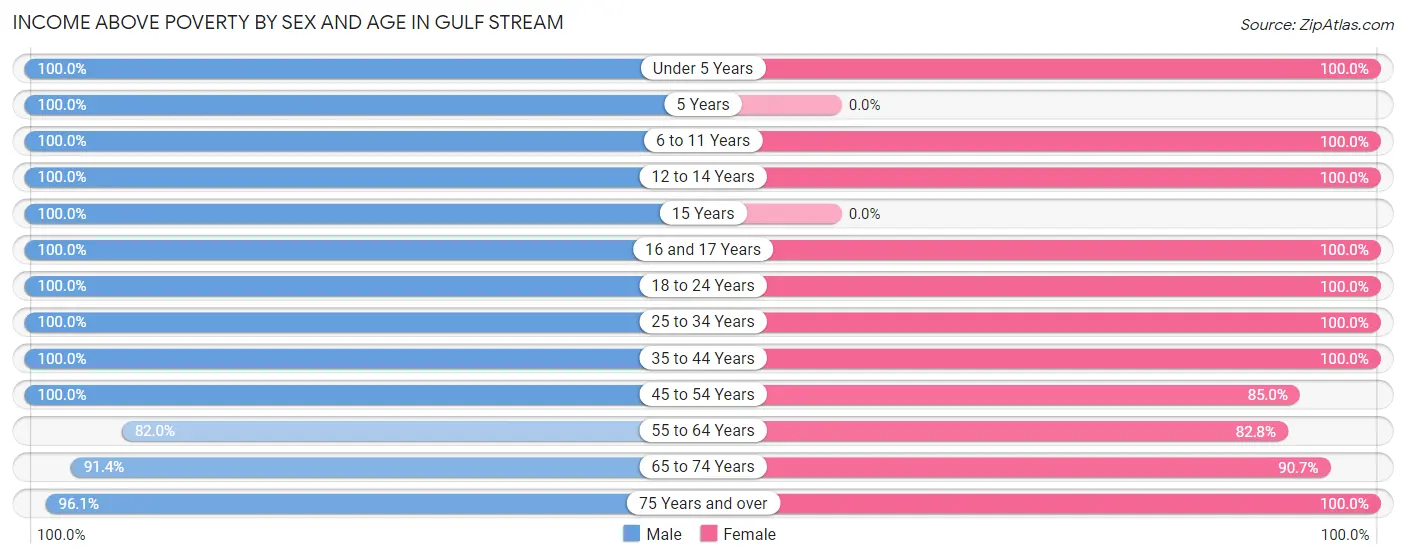
Income Above Poverty by Sex and Age in Gulf Stream
According to the poverty statistics in Gulf Stream, males aged under 5 years and females aged under 5 years are the age groups that are most secure financially, with 100.0% of males and 100.0% of females in these age groups living above the poverty line.
| Age Bracket | Male | Female |
| Under 5 Years | 10 (100.0%) | 13 (100.0%) |
| 5 Years | 8 (100.0%) | 0 (0.0%) |
| 6 to 11 Years | 9 (100.0%) | 21 (100.0%) |
| 12 to 14 Years | 3 (100.0%) | 10 (100.0%) |
| 15 Years | 2 (100.0%) | 0 (0.0%) |
| 16 and 17 Years | 11 (100.0%) | 4 (100.0%) |
| 18 to 24 Years | 25 (100.0%) | 16 (100.0%) |
| 25 to 34 Years | 4 (100.0%) | 16 (100.0%) |
| 35 to 44 Years | 25 (100.0%) | 16 (100.0%) |
| 45 to 54 Years | 36 (100.0%) | 51 (85.0%) |
| 55 to 64 Years | 100 (82.0%) | 101 (82.8%) |
| 65 to 74 Years | 85 (91.4%) | 68 (90.7%) |
| 75 Years and over | 74 (96.1%) | 70 (100.0%) |
| Total | 392 (92.2%) | 386 (91.2%) |
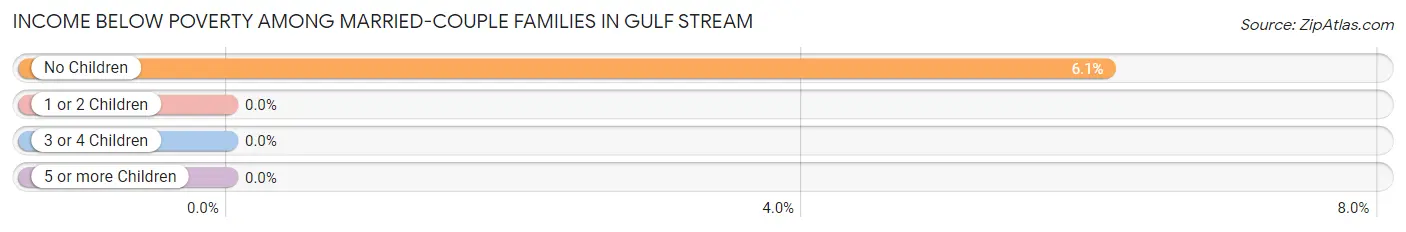
Income Below Poverty Among Married-Couple Families in Gulf Stream
The poverty statistics for married-couple families in Gulf Stream show that 5.2% or 14 of the total 267 families live below the poverty line. Families with no children have the highest poverty rate of 6.1%, comprising of 14 families. On the other hand, families with 1 or 2 children have the lowest poverty rate of 0.0%, which includes 0 families.
| Children | Above Poverty | Below Poverty |
| No Children | 215 (93.9%) | 14 (6.1%) |
| 1 or 2 Children | 31 (100.0%) | 0 (0.0%) |
| 3 or 4 Children | 7 (100.0%) | 0 (0.0%) |
| 5 or more Children | 0 (0.0%) | 0 (0.0%) |
| Total | 253 (94.8%) | 14 (5.2%) |
Income Below Poverty Among Single-Parent Households in Gulf Stream
| Children | Single Father | Single Mother |
| No Children | 0 (0.0%) | 0 (0.0%) |
| 1 or 2 Children | 0 (0.0%) | 0 (0.0%) |
| 3 or 4 Children | 0 (0.0%) | 0 (0.0%) |
| 5 or more Children | 0 (0.0%) | 0 (0.0%) |
| Total | 0 (0.0%) | 0 (0.0%) |
Income Below Poverty Among Married-Couple vs Single-Parent Households in Gulf Stream
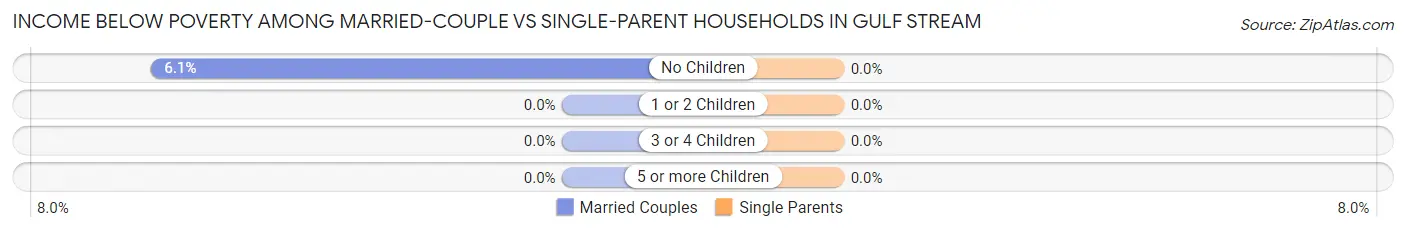
| Children | Married-Couple Families | Single-Parent Households |
| No Children | 14 (6.1%) | 0 (0.0%) |
| 1 or 2 Children | 0 (0.0%) | 0 (0.0%) |
| 3 or 4 Children | 0 (0.0%) | 0 (0.0%) |
| 5 or more Children | 0 (0.0%) | 0 (0.0%) |
| Total | 14 (5.2%) | 0 (0.0%) |
Race in Gulf Stream
The most populous races in Gulf Stream are White / Caucasian (780 | 92.0%), Hispanic or Latino (43 | 5.1%), and Asian (33 | 3.9%).
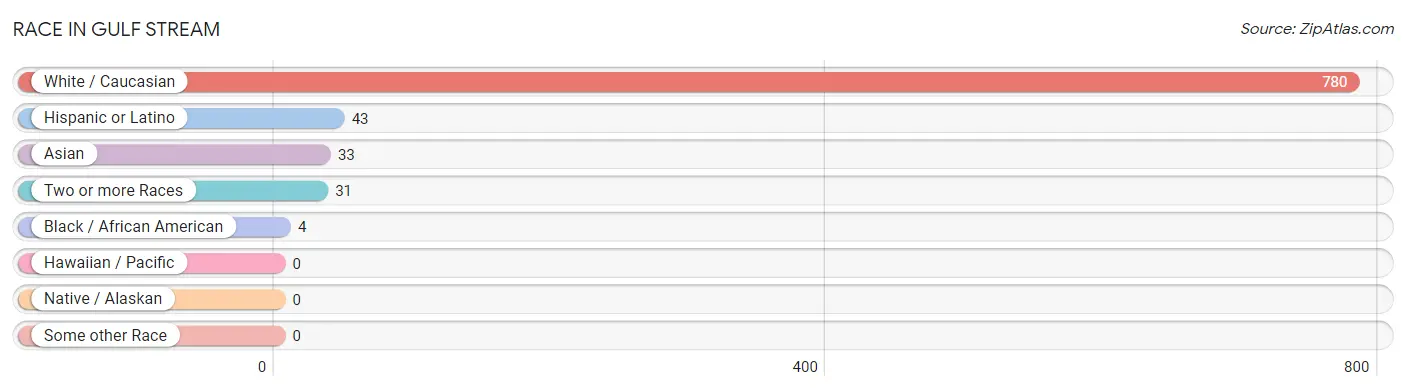
| Race | # Population | % Population |
| Asian | 33 | 3.9% |
| Black / African American | 4 | 0.5% |
| Hawaiian / Pacific | 0 | 0.0% |
| Hispanic or Latino | 43 | 5.1% |
| Native / Alaskan | 0 | 0.0% |
| White / Caucasian | 780 | 92.0% |
| Two or more Races | 31 | 3.7% |
| Some other Race | 0 | 0.0% |
| Total | 848 | 100.0% |
Ancestry in Gulf Stream
The most populous ancestries reported in Gulf Stream are English (202 | 23.8%), Irish (135 | 15.9%), German (110 | 13.0%), Italian (80 | 9.4%), and Polish (55 | 6.5%), together accounting for 68.6% of all Gulf Stream residents.
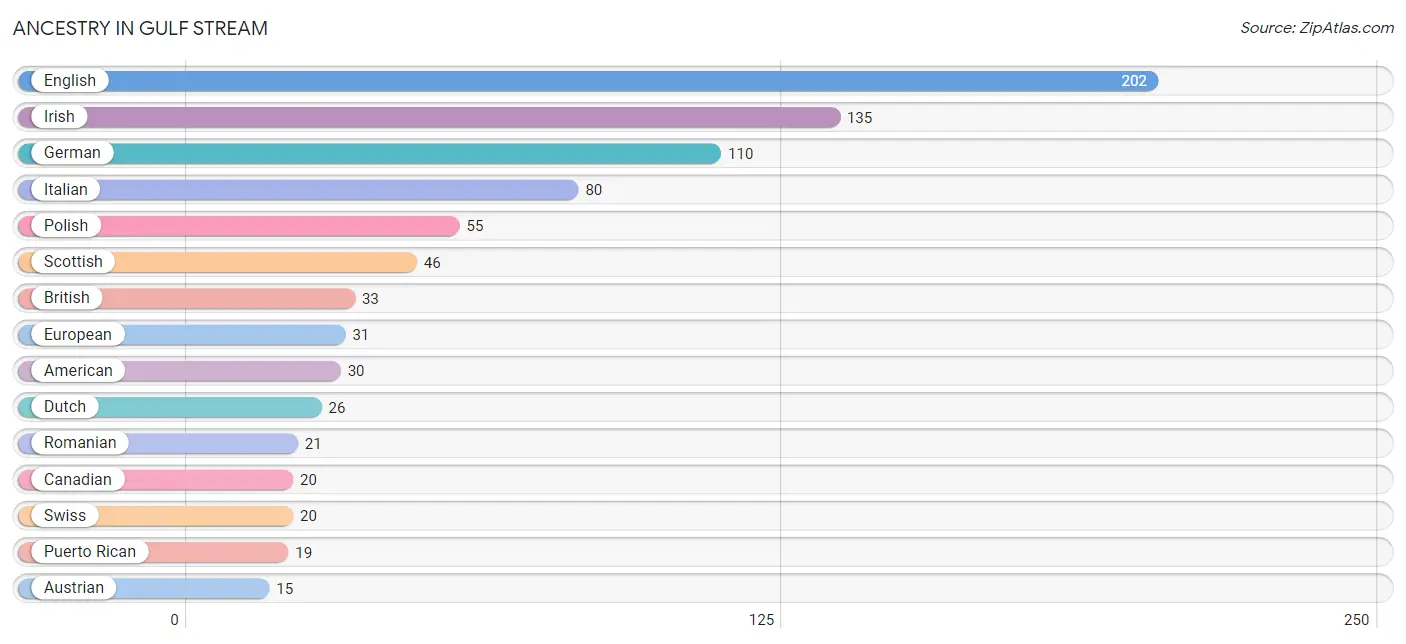
| Ancestry | # Population | % Population |
| American | 30 | 3.5% |
| Arab | 9 | 1.1% |
| Armenian | 9 | 1.1% |
| Austrian | 15 | 1.8% |
| Belgian | 2 | 0.2% |
| Bhutanese | 4 | 0.5% |
| British | 33 | 3.9% |
| Burmese | 15 | 1.8% |
| Canadian | 20 | 2.4% |
| Cuban | 13 | 1.5% |
| Danish | 9 | 1.1% |
| Dutch | 26 | 3.1% |
| Eastern European | 4 | 0.5% |
| English | 202 | 23.8% |
| European | 31 | 3.7% |
| Finnish | 4 | 0.5% |
| French | 10 | 1.2% |
| French Canadian | 7 | 0.8% |
| German | 110 | 13.0% |
| Greek | 2 | 0.2% |
| Irish | 135 | 15.9% |
| Italian | 80 | 9.4% |
| Korean | 6 | 0.7% |
| Lebanese | 9 | 1.1% |
| Lithuanian | 4 | 0.5% |
| Mexican | 11 | 1.3% |
| Polish | 55 | 6.5% |
| Puerto Rican | 19 | 2.2% |
| Romanian | 21 | 2.5% |
| Russian | 2 | 0.2% |
| Scotch-Irish | 5 | 0.6% |
| Scottish | 46 | 5.4% |
| South African | 8 | 0.9% |
| Subsaharan African | 8 | 0.9% |
| Swedish | 9 | 1.1% |
| Swiss | 20 | 2.4% |
| Thai | 14 | 1.7% |
| Ukrainian | 1 | 0.1% | View All 38 Rows |
Immigrants in Gulf Stream
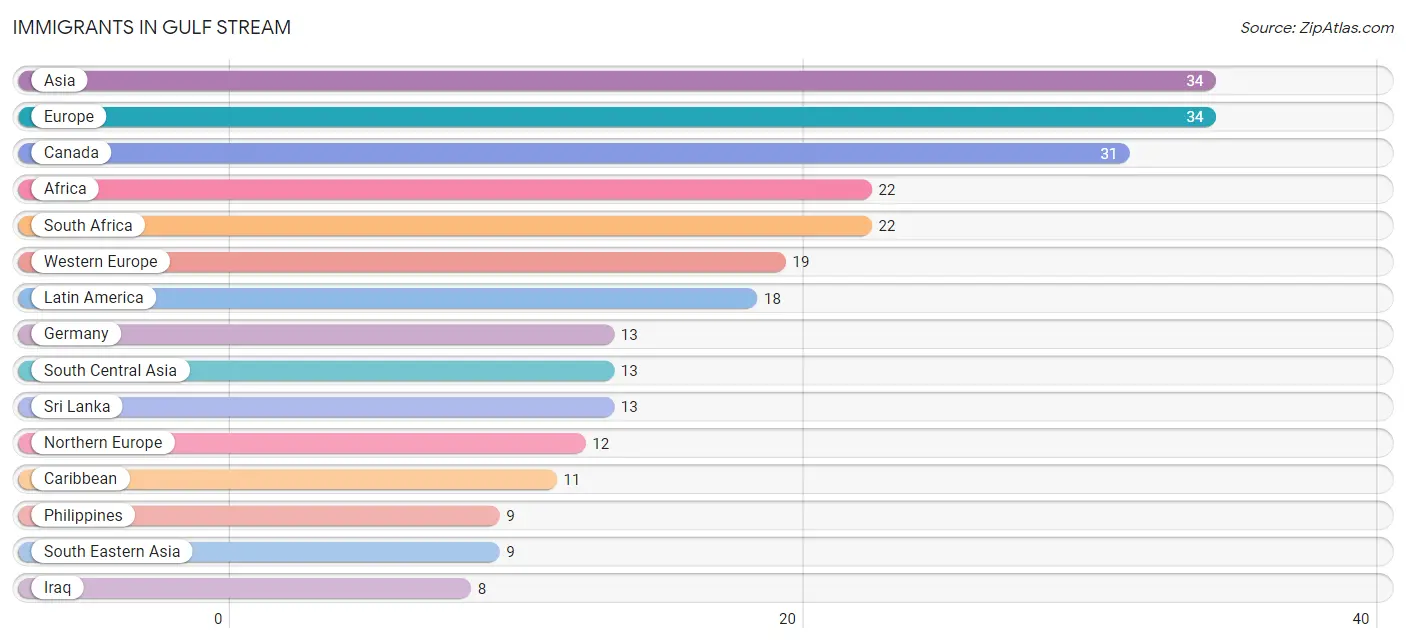
The most numerous immigrant groups reported in Gulf Stream came from Asia (34 | 4.0%), Europe (34 | 4.0%), Canada (31 | 3.7%), Africa (22 | 2.6%), and South Africa (22 | 2.6%), together accounting for 16.9% of all Gulf Stream residents.
| Immigration Origin | # Population | % Population |
| Africa | 22 | 2.6% |
| Asia | 34 | 4.0% |
| Belgium | 2 | 0.2% |
| Canada | 31 | 3.7% |
| Caribbean | 11 | 1.3% |
| Central America | 7 | 0.8% |
| Cuba | 7 | 0.8% |
| Eastern Asia | 4 | 0.5% |
| Eastern Europe | 3 | 0.4% |
| England | 5 | 0.6% |
| Europe | 34 | 4.0% |
| Germany | 13 | 1.5% |
| Iraq | 8 | 0.9% |
| Jamaica | 4 | 0.5% |
| Japan | 4 | 0.5% |
| Latin America | 18 | 2.1% |
| Mexico | 7 | 0.8% |
| Northern Europe | 12 | 1.4% |
| Philippines | 9 | 1.1% |
| Romania | 3 | 0.4% |
| South Africa | 22 | 2.6% |
| South Central Asia | 13 | 1.5% |
| South Eastern Asia | 9 | 1.1% |
| Sri Lanka | 13 | 1.5% |
| Switzerland | 4 | 0.5% |
| Western Asia | 8 | 0.9% |
| Western Europe | 19 | 2.2% | View All 27 Rows |
Sex and Age in Gulf Stream
Sex and Age in Gulf Stream
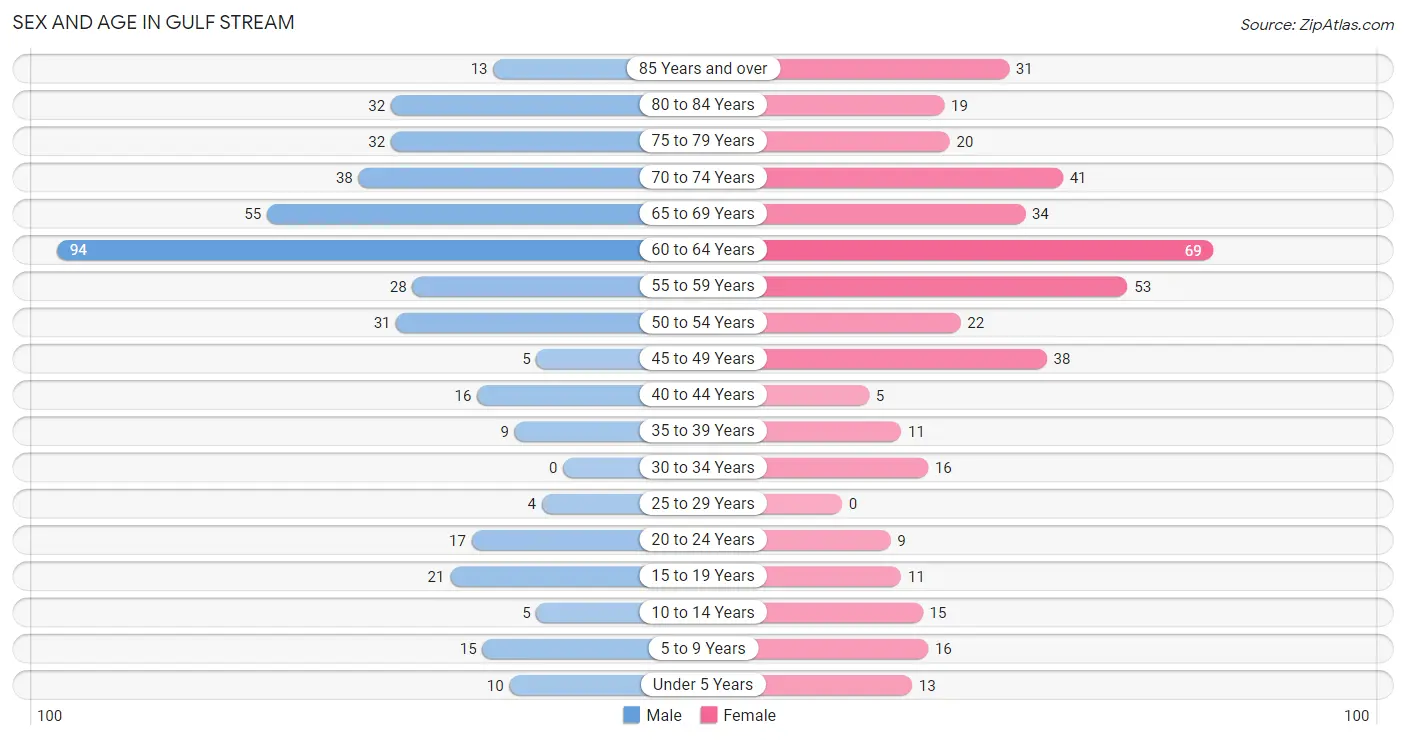
The most populous age groups in Gulf Stream are 60 to 64 Years (94 | 22.1%) for men and 60 to 64 Years (69 | 16.3%) for women.
| Age Bracket | Male | Female |
| Under 5 Years | 10 (2.4%) | 13 (3.1%) |
| 5 to 9 Years | 15 (3.5%) | 16 (3.8%) |
| 10 to 14 Years | 5 (1.2%) | 15 (3.5%) |
| 15 to 19 Years | 21 (4.9%) | 11 (2.6%) |
| 20 to 24 Years | 17 (4.0%) | 9 (2.1%) |
| 25 to 29 Years | 4 (0.9%) | 0 (0.0%) |
| 30 to 34 Years | 0 (0.0%) | 16 (3.8%) |
| 35 to 39 Years | 9 (2.1%) | 11 (2.6%) |
| 40 to 44 Years | 16 (3.8%) | 5 (1.2%) |
| 45 to 49 Years | 5 (1.2%) | 38 (9.0%) |
| 50 to 54 Years | 31 (7.3%) | 22 (5.2%) |
| 55 to 59 Years | 28 (6.6%) | 53 (12.5%) |
| 60 to 64 Years | 94 (22.1%) | 69 (16.3%) |
| 65 to 69 Years | 55 (12.9%) | 34 (8.0%) |
| 70 to 74 Years | 38 (8.9%) | 41 (9.7%) |
| 75 to 79 Years | 32 (7.5%) | 20 (4.7%) |
| 80 to 84 Years | 32 (7.5%) | 19 (4.5%) |
| 85 Years and over | 13 (3.1%) | 31 (7.3%) |
| Total | 425 (100.0%) | 423 (100.0%) |
Families and Households in Gulf Stream
Median Family Size in Gulf Stream
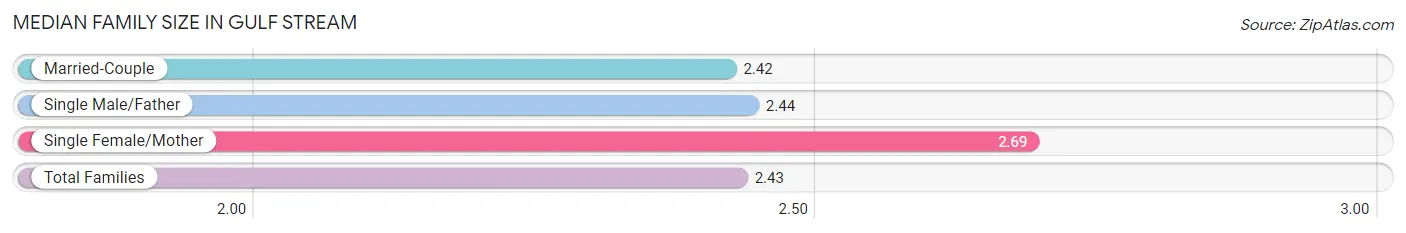
The median family size in Gulf Stream is 2.43 persons per family, with single female/mother families (13 | 4.5%) accounting for the largest median family size of 2.69 persons per family. On the other hand, married-couple families (267 | 92.4%) represent the smallest median family size with 2.42 persons per family.
| Family Type | # Families | Family Size |
| Married-Couple | 267 (92.4%) | 2.42 |
| Single Male/Father | 9 (3.1%) | 2.44 |
| Single Female/Mother | 13 (4.5%) | 2.69 |
| Total Families | 289 (100.0%) | 2.43 |
Median Household Size in Gulf Stream
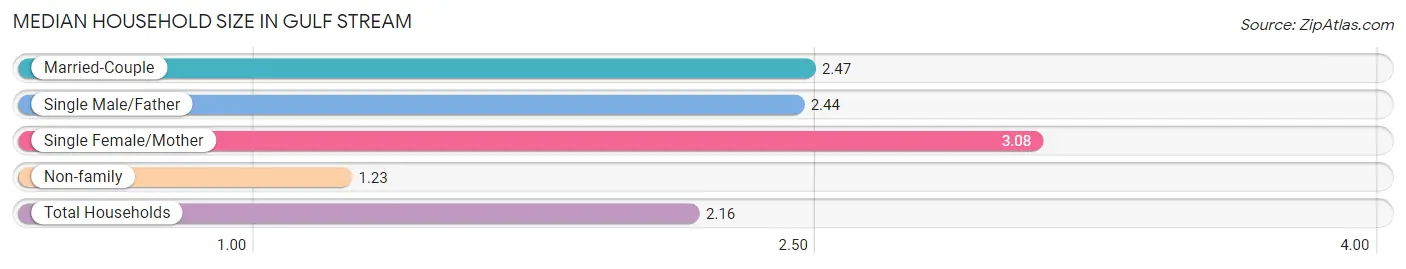
The median household size in Gulf Stream is 2.16 persons per household, with single female/mother households (13 | 3.3%) accounting for the largest median household size of 3.08 persons per household. non-family households (103 | 26.3%) represent the smallest median household size with 1.23 persons per household.
| Household Type | # Households | Household Size |
| Married-Couple | 267 (68.1%) | 2.47 |
| Single Male/Father | 9 (2.3%) | 2.44 |
| Single Female/Mother | 13 (3.3%) | 3.08 |
| Non-family | 103 (26.3%) | 1.23 |
| Total Households | 392 (100.0%) | 2.16 |
Household Size by Marriage Status in Gulf Stream
Out of a total of 392 households in Gulf Stream, 289 (73.7%) are family households, while 103 (26.3%) are nonfamily households. The most numerous type of family households are 2-person households, comprising 222, and the most common type of nonfamily households are 1-person households, comprising 81.
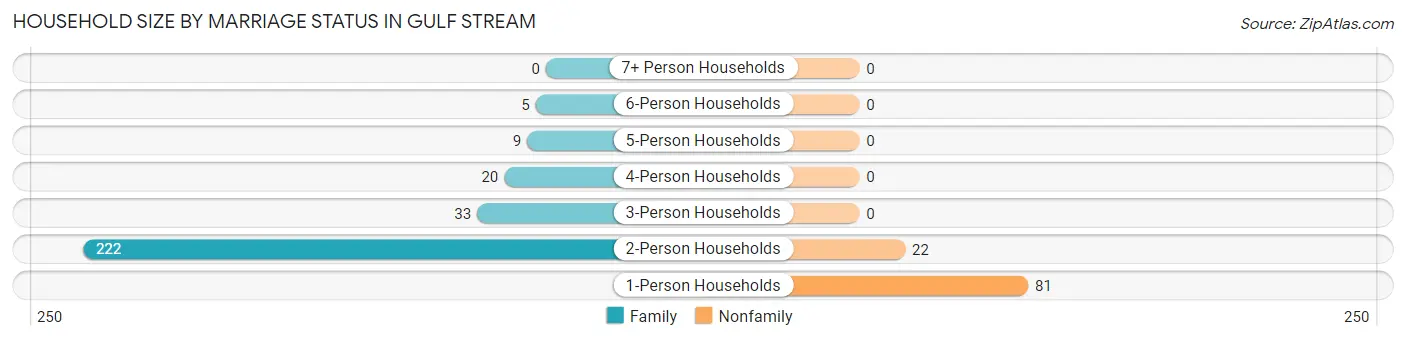
| Household Size | Family Households | Nonfamily Households |
| 1-Person Households | - | 81 (20.7%) |
| 2-Person Households | 222 (56.6%) | 22 (5.6%) |
| 3-Person Households | 33 (8.4%) | 0 (0.0%) |
| 4-Person Households | 20 (5.1%) | 0 (0.0%) |
| 5-Person Households | 9 (2.3%) | 0 (0.0%) |
| 6-Person Households | 5 (1.3%) | 0 (0.0%) |
| 7+ Person Households | 0 (0.0%) | 0 (0.0%) |
| Total | 289 (73.7%) | 103 (26.3%) |
Female Fertility in Gulf Stream
Fertility by Age in Gulf Stream
| Age Bracket | Women with Births | Births / 1,000 Women |
| 15 to 19 years | 0 (0.0%) | 0.0 |
| 20 to 34 years | 0 (0.0%) | 0.0 |
| 35 to 50 years | 0 (0.0%) | 0.0 |
| Total | 0 (0.0%) | 0.0 |
Fertility by Age by Marriage Status in Gulf Stream
| Age Bracket | Married | Unmarried |
| 15 to 19 years | 0 (0.0%) | 0 (0.0%) |
| 20 to 34 years | 0 (0.0%) | 0 (0.0%) |
| 35 to 50 years | 0 (0.0%) | 0 (0.0%) |
| Total | 0 (0.0%) | 0 (0.0%) |
Fertility by Education in Gulf Stream
| Educational Attainment | Women with Births | Births / 1,000 Women |
| Less than High School | 0 (0.0%) | 0.0 |
| High School Diploma | 0 (0.0%) | 0.0 |
| College or Associate's Degree | 0 (0.0%) | 0.0 |
| Bachelor's Degree | 0 (0.0%) | 0.0 |
| Graduate Degree | 0 (0.0%) | 0.0 |
| Total | 0 (0.0%) | 0.0 |
Fertility by Education by Marriage Status in Gulf Stream
| Educational Attainment | Married | Unmarried |
| Less than High School | 0 (0.0%) | 0 (0.0%) |
| High School Diploma | 0 (0.0%) | 0 (0.0%) |
| College or Associate's Degree | 0 (0.0%) | 0 (0.0%) |
| Bachelor's Degree | 0 (0.0%) | 0 (0.0%) |
| Graduate Degree | 0 (0.0%) | 0 (0.0%) |
| Total | 0 (0.0%) | 0 (0.0%) |
Employment Characteristics in Gulf Stream
Employment by Class of Employer in Gulf Stream
Among the 311 employed individuals in Gulf Stream, private company employees (171 | 55.0%), self-employed (incorporated) (83 | 26.7%), and self-employed (not incorporated) (37 | 11.9%) make up the most common classes of employment.
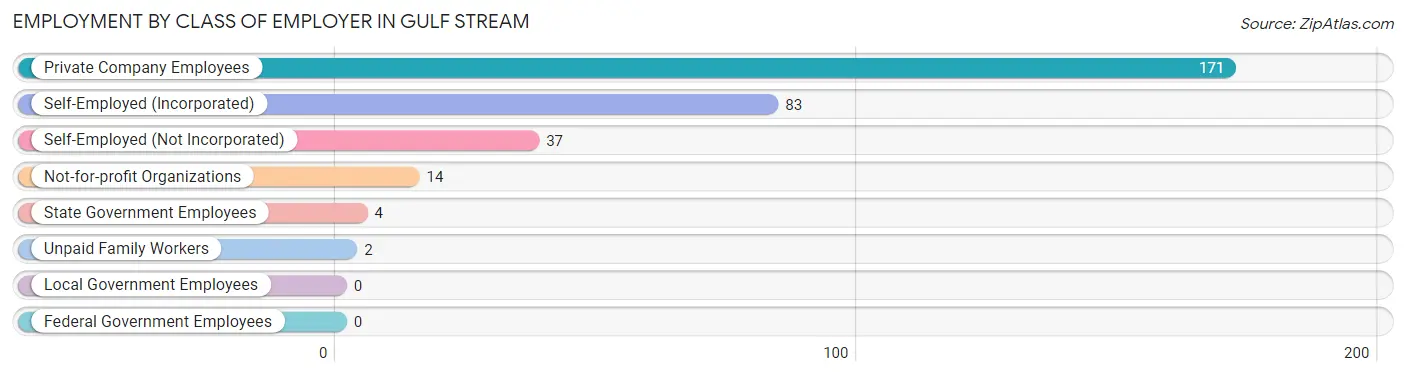
| Employer Class | # Employees | % Employees |
| Private Company Employees | 171 | 55.0% |
| Self-Employed (Incorporated) | 83 | 26.7% |
| Self-Employed (Not Incorporated) | 37 | 11.9% |
| Not-for-profit Organizations | 14 | 4.5% |
| Local Government Employees | 0 | 0.0% |
| State Government Employees | 4 | 1.3% |
| Federal Government Employees | 0 | 0.0% |
| Unpaid Family Workers | 2 | 0.6% |
| Total | 311 | 100.0% |
Employment Status by Age in Gulf Stream
According to the labor force statistics for Gulf Stream, out of the total population over 16 years of age (772), 43.3% or 334 individuals are in the labor force, with 6.0% or 20 of them unemployed. The age group with the highest labor force participation rate is 25 to 29 years, with 100.0% or 4 individuals in the labor force. Within the labor force, the 30 to 34 years age range has the highest percentage of unemployed individuals, with 71.4% or 10 of them being unemployed.
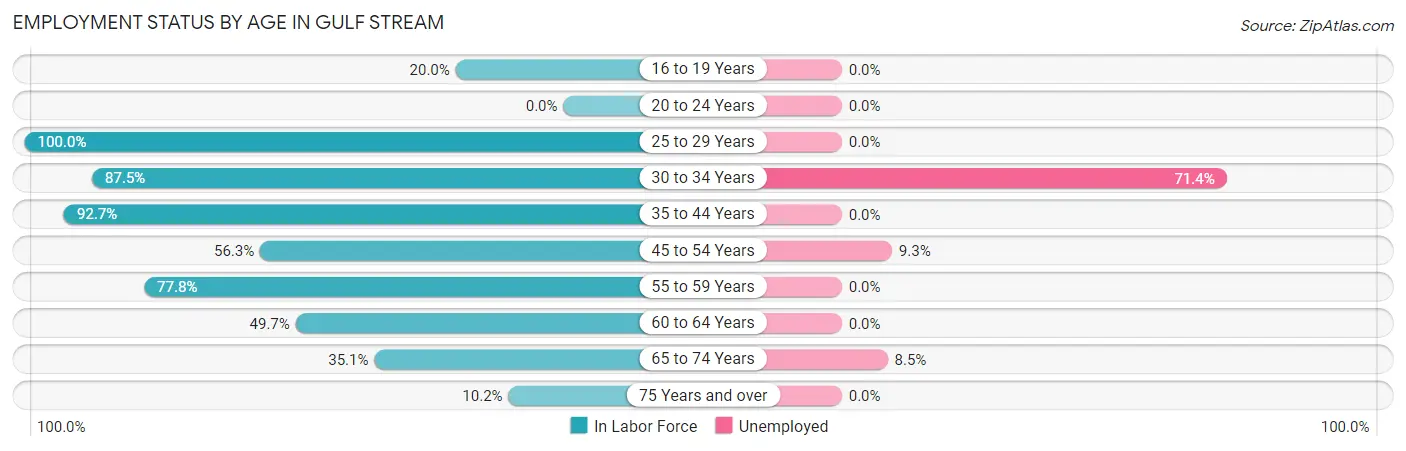
| Age Bracket | In Labor Force | Unemployed |
| 16 to 19 Years | 6 (20.0%) | 0 (0.0%) |
| 20 to 24 Years | 0 (0.0%) | 0 (0.0%) |
| 25 to 29 Years | 4 (100.0%) | 0 (0.0%) |
| 30 to 34 Years | 14 (87.5%) | 10 (71.4%) |
| 35 to 44 Years | 38 (92.7%) | 0 (0.0%) |
| 45 to 54 Years | 54 (56.3%) | 5 (9.3%) |
| 55 to 59 Years | 63 (77.8%) | 0 (0.0%) |
| 60 to 64 Years | 81 (49.7%) | 0 (0.0%) |
| 65 to 74 Years | 59 (35.1%) | 5 (8.5%) |
| 75 Years and over | 15 (10.2%) | 0 (0.0%) |
| Total | 334 (43.3%) | 20 (6.0%) |
Employment Status by Educational Attainment in Gulf Stream
According to labor force statistics for Gulf Stream, 63.3% of individuals (254) out of the total population between 25 and 64 years of age (401) are in the labor force, with 5.9% or 15 of them being unemployed. The group with the highest labor force participation rate are those with the educational attainment of less than high school, with 100.0% or 8 individuals in the labor force. Within the labor force, individuals with college / associate degree education have the highest percentage of unemployment, with 35.3% or 6 of them being unemployed.
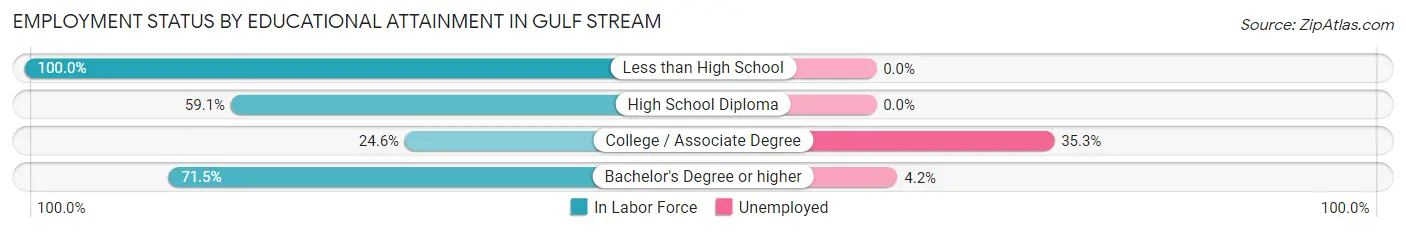
| Educational Attainment | In Labor Force | Unemployed |
| Less than High School | 8 (100.0%) | 0 (0.0%) |
| High School Diploma | 13 (59.1%) | 0 (0.0%) |
| College / Associate Degree | 17 (24.6%) | 24 (35.3%) |
| Bachelor's Degree or higher | 216 (71.5%) | 13 (4.2%) |
| Total | 254 (63.3%) | 24 (5.9%) |
Employment Occupations by Sex in Gulf Stream
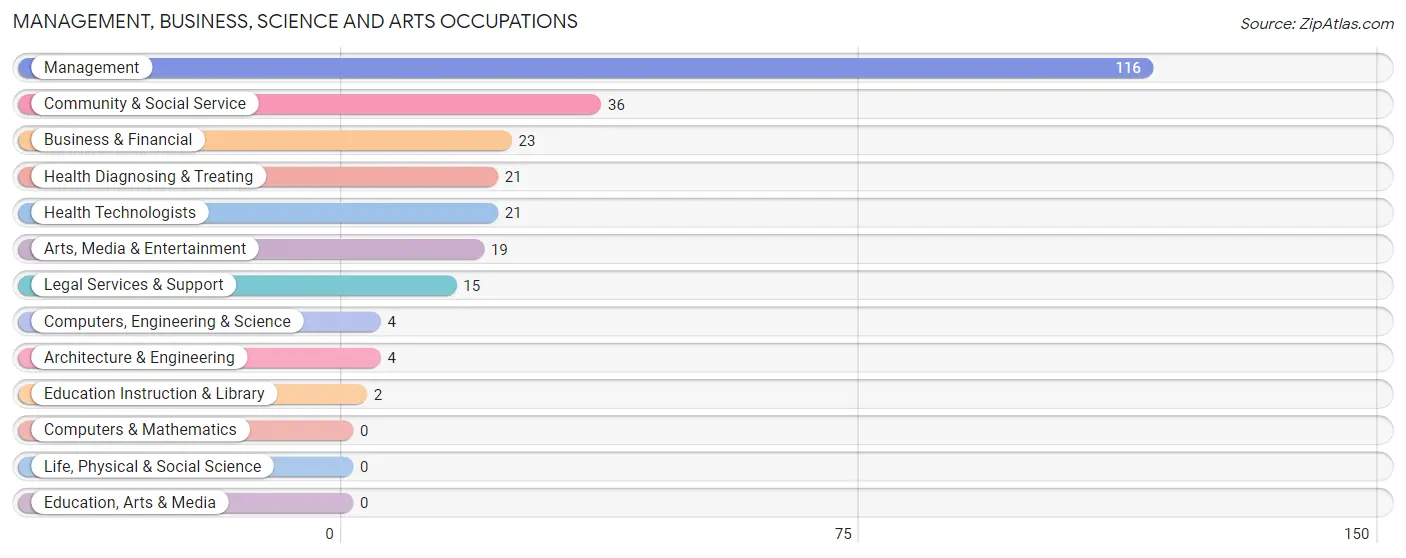
Management, Business, Science and Arts Occupations
The most common Management, Business, Science and Arts occupations in Gulf Stream are Management (116 | 36.9%), Community & Social Service (36 | 11.5%), Business & Financial (23 | 7.3%), Health Diagnosing & Treating (21 | 6.7%), and Health Technologists (21 | 6.7%).
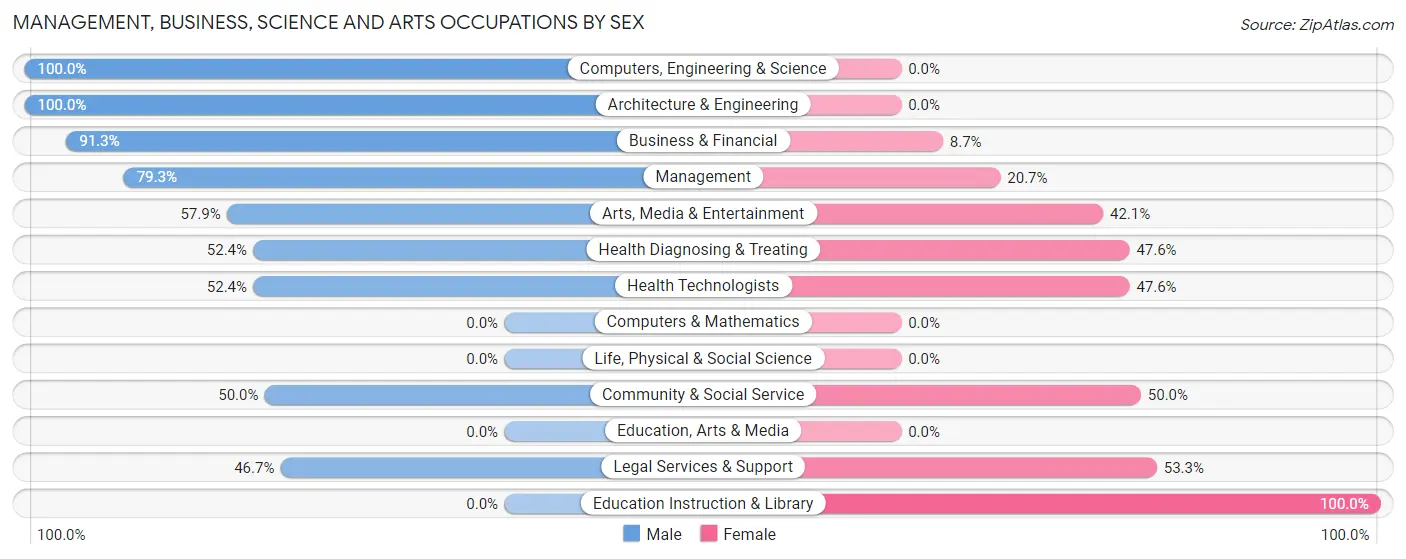
Management, Business, Science and Arts Occupations by Sex
Within the Management, Business, Science and Arts occupations in Gulf Stream, the most male-oriented occupations are Computers, Engineering & Science (100.0%), Architecture & Engineering (100.0%), and Business & Financial (91.3%), while the most female-oriented occupations are Education Instruction & Library (100.0%), Legal Services & Support (53.3%), and Community & Social Service (50.0%).
| Occupation | Male | Female |
| Management | 92 (79.3%) | 24 (20.7%) |
| Business & Financial | 21 (91.3%) | 2 (8.7%) |
| Computers, Engineering & Science | 4 (100.0%) | 0 (0.0%) |
| Computers & Mathematics | 0 (0.0%) | 0 (0.0%) |
| Architecture & Engineering | 4 (100.0%) | 0 (0.0%) |
| Life, Physical & Social Science | 0 (0.0%) | 0 (0.0%) |
| Community & Social Service | 18 (50.0%) | 18 (50.0%) |
| Education, Arts & Media | 0 (0.0%) | 0 (0.0%) |
| Legal Services & Support | 7 (46.7%) | 8 (53.3%) |
| Education Instruction & Library | 0 (0.0%) | 2 (100.0%) |
| Arts, Media & Entertainment | 11 (57.9%) | 8 (42.1%) |
| Health Diagnosing & Treating | 11 (52.4%) | 10 (47.6%) |
| Health Technologists | 11 (52.4%) | 10 (47.6%) |
| Total (Category) | 146 (73.0%) | 54 (27.0%) |
| Total (Overall) | 205 (65.3%) | 109 (34.7%) |
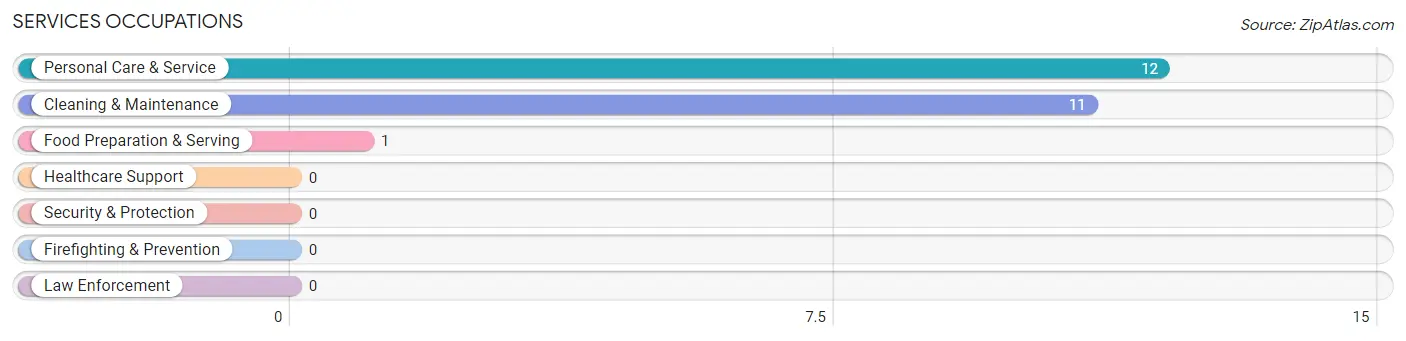
Services Occupations
The most common Services occupations in Gulf Stream are Personal Care & Service (12 | 3.8%), Cleaning & Maintenance (11 | 3.5%), and Food Preparation & Serving (1 | 0.3%).
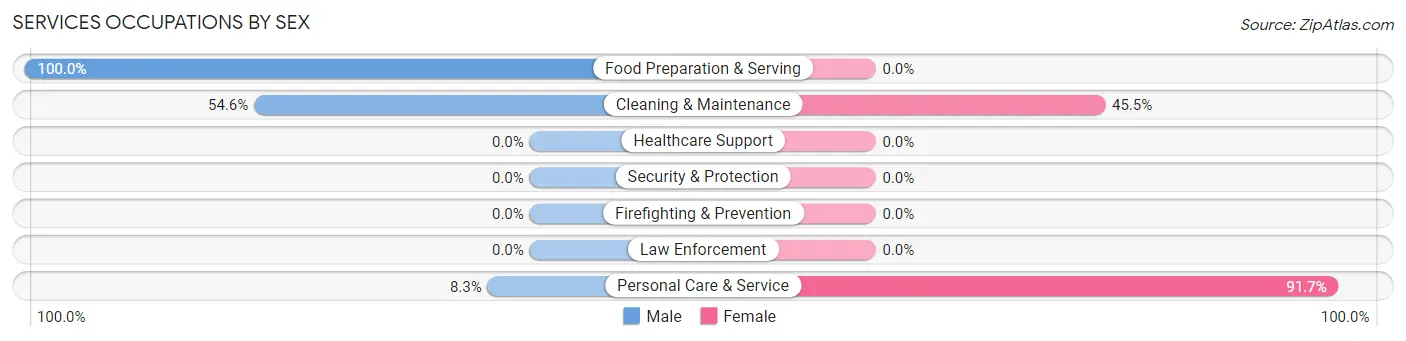
Services Occupations by Sex
Within the Services occupations in Gulf Stream, the most male-oriented occupations are Food Preparation & Serving (100.0%), Cleaning & Maintenance (54.5%), and Personal Care & Service (8.3%), while the most female-oriented occupations are Personal Care & Service (91.7%), and Cleaning & Maintenance (45.5%).
| Occupation | Male | Female |
| Healthcare Support | 0 (0.0%) | 0 (0.0%) |
| Security & Protection | 0 (0.0%) | 0 (0.0%) |
| Firefighting & Prevention | 0 (0.0%) | 0 (0.0%) |
| Law Enforcement | 0 (0.0%) | 0 (0.0%) |
| Food Preparation & Serving | 1 (100.0%) | 0 (0.0%) |
| Cleaning & Maintenance | 6 (54.5%) | 5 (45.5%) |
| Personal Care & Service | 1 (8.3%) | 11 (91.7%) |
| Total (Category) | 8 (33.3%) | 16 (66.7%) |
| Total (Overall) | 205 (65.3%) | 109 (34.7%) |
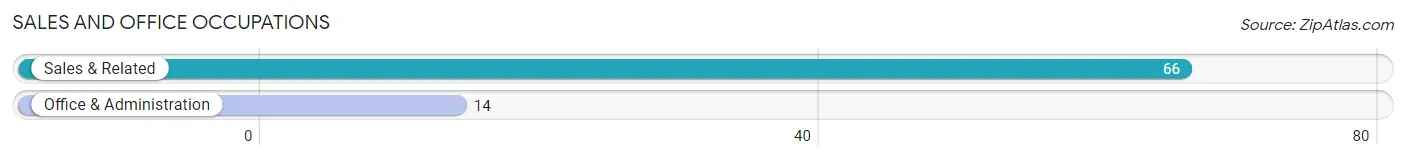
Sales and Office Occupations
The most common Sales and Office occupations in Gulf Stream are Sales & Related (66 | 21.0%), and Office & Administration (14 | 4.5%).
Sales and Office Occupations by Sex
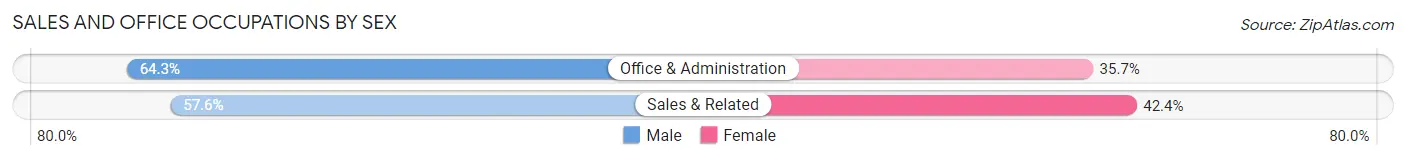
| Occupation | Male | Female |
| Sales & Related | 38 (57.6%) | 28 (42.4%) |
| Office & Administration | 9 (64.3%) | 5 (35.7%) |
| Total (Category) | 47 (58.8%) | 33 (41.2%) |
| Total (Overall) | 205 (65.3%) | 109 (34.7%) |
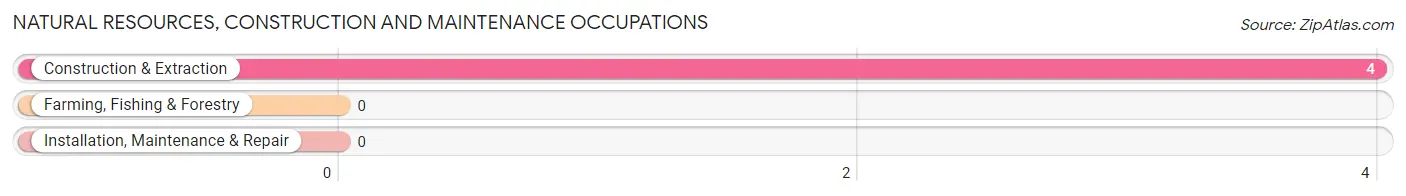
Natural Resources, Construction and Maintenance Occupations
The most common Natural Resources, Construction and Maintenance occupations in Gulf Stream are , and Construction & Extraction (4 | 1.3%).
Natural Resources, Construction and Maintenance Occupations by Sex
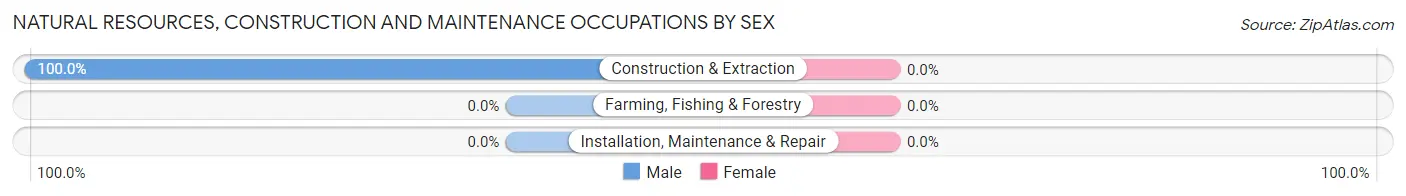
| Occupation | Male | Female |
| Farming, Fishing & Forestry | 0 (0.0%) | 0 (0.0%) |
| Construction & Extraction | 4 (100.0%) | 0 (0.0%) |
| Installation, Maintenance & Repair | 0 (0.0%) | 0 (0.0%) |
| Total (Category) | 4 (100.0%) | 0 (0.0%) |
| Total (Overall) | 205 (65.3%) | 109 (34.7%) |
Production, Transportation and Moving Occupations
The most common Production, Transportation and Moving occupations in Gulf Stream are Production (4 | 1.3%), and Material Moving (2 | 0.6%).
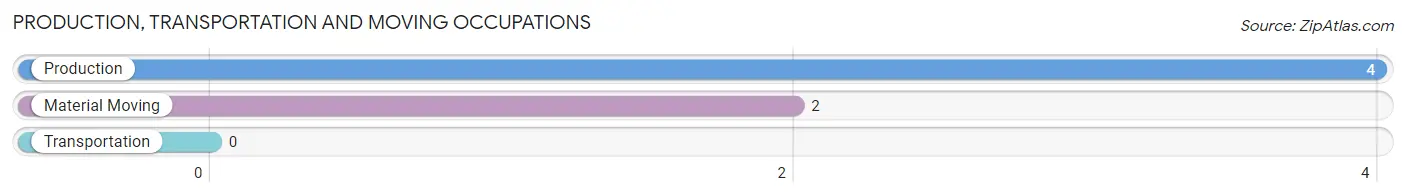
Production, Transportation and Moving Occupations by Sex
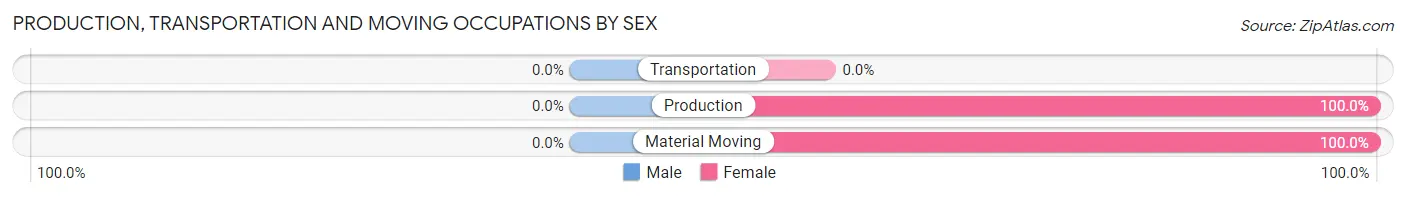
| Occupation | Male | Female |
| Production | 0 (0.0%) | 4 (100.0%) |
| Transportation | 0 (0.0%) | 0 (0.0%) |
| Material Moving | 0 (0.0%) | 2 (100.0%) |
| Total (Category) | 0 (0.0%) | 6 (100.0%) |
| Total (Overall) | 205 (65.3%) | 109 (34.7%) |
Employment Industries by Sex in Gulf Stream
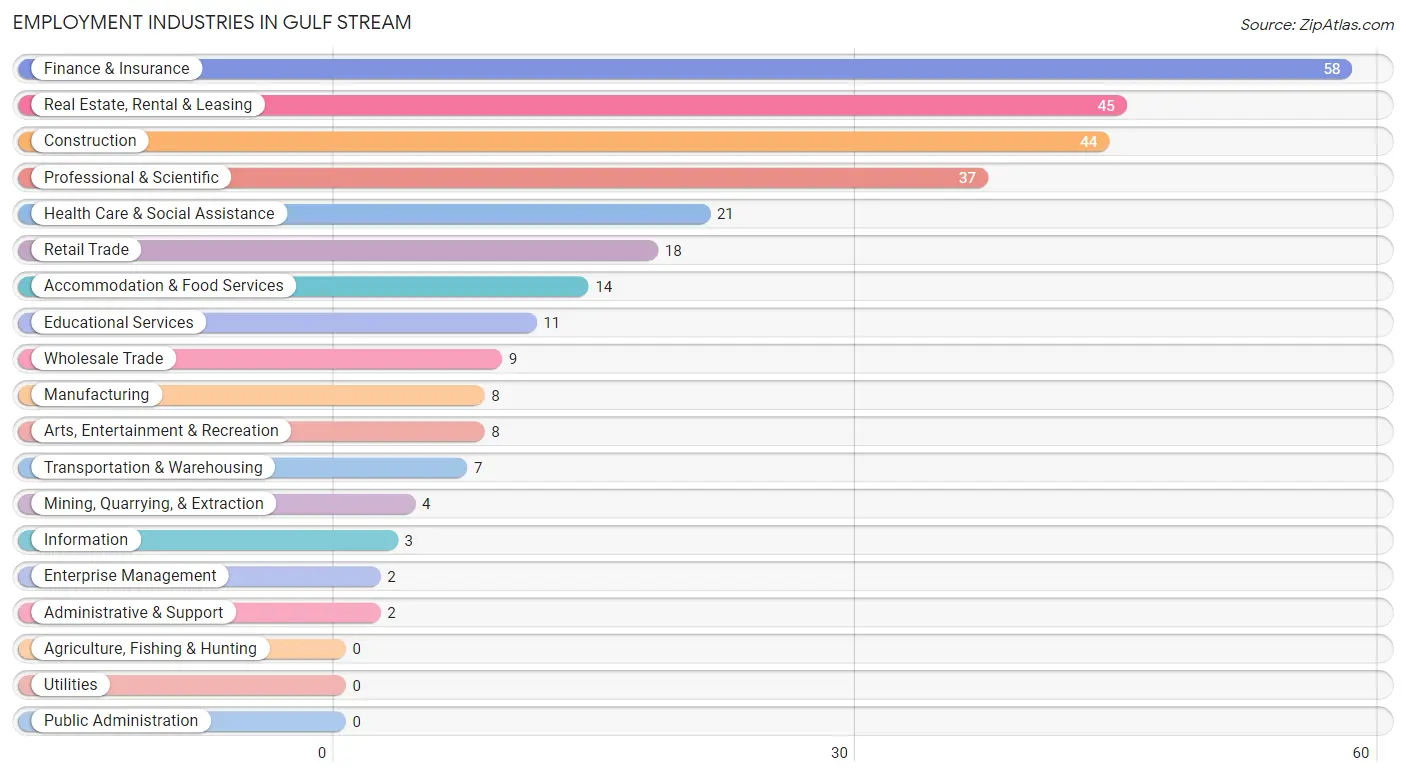
Employment Industries in Gulf Stream
The major employment industries in Gulf Stream include Finance & Insurance (58 | 18.5%), Real Estate, Rental & Leasing (45 | 14.3%), Construction (44 | 14.0%), Professional & Scientific (37 | 11.8%), and Health Care & Social Assistance (21 | 6.7%).
Employment Industries by Sex in Gulf Stream
The Gulf Stream industries that see more men than women are Mining, Quarrying, & Extraction (100.0%), Construction (100.0%), and Wholesale Trade (100.0%), whereas the industries that tend to have a higher number of women are Information (100.0%), Enterprise Management (100.0%), and Administrative & Support (100.0%).
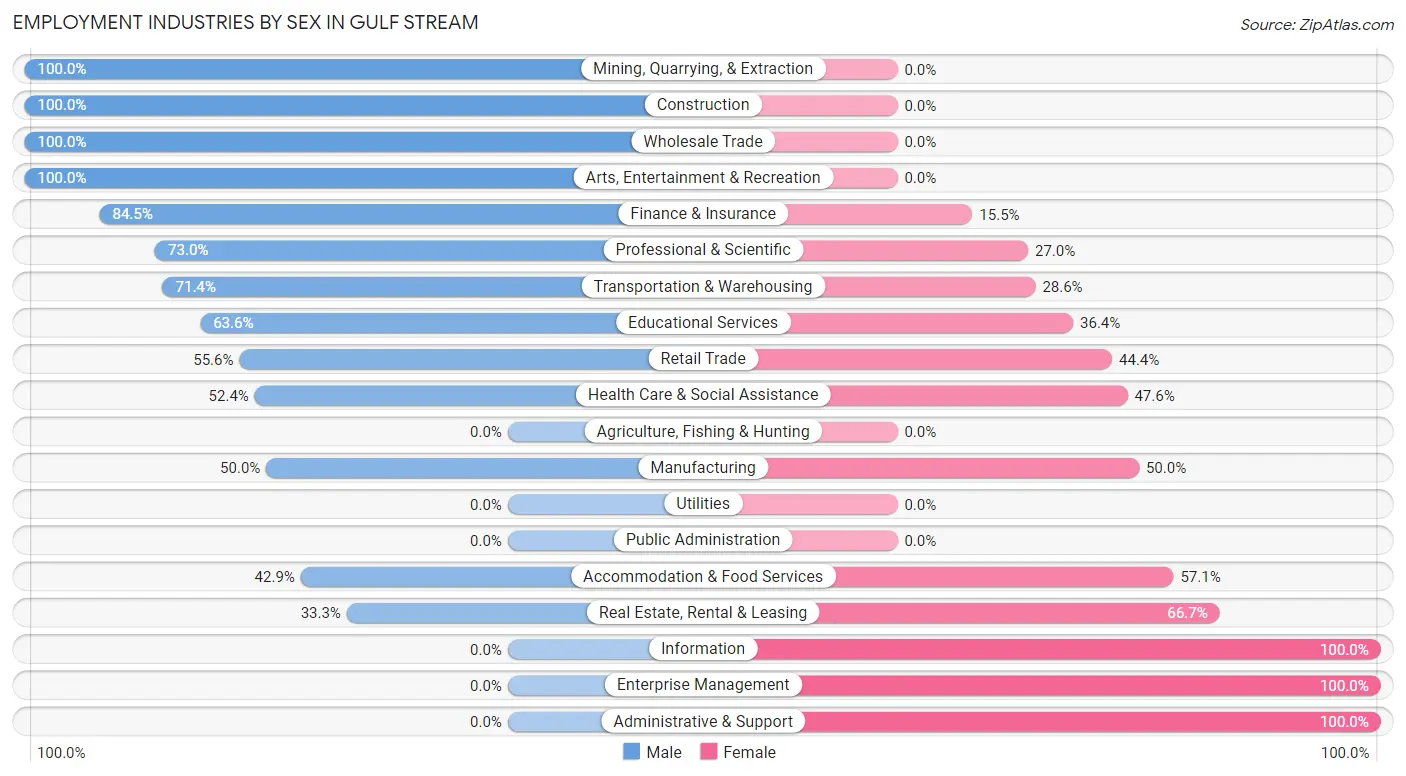
| Industry | Male | Female |
| Agriculture, Fishing & Hunting | 0 (0.0%) | 0 (0.0%) |
| Mining, Quarrying, & Extraction | 4 (100.0%) | 0 (0.0%) |
| Construction | 44 (100.0%) | 0 (0.0%) |
| Manufacturing | 4 (50.0%) | 4 (50.0%) |
| Wholesale Trade | 9 (100.0%) | 0 (0.0%) |
| Retail Trade | 10 (55.6%) | 8 (44.4%) |
| Transportation & Warehousing | 5 (71.4%) | 2 (28.6%) |
| Utilities | 0 (0.0%) | 0 (0.0%) |
| Information | 0 (0.0%) | 3 (100.0%) |
| Finance & Insurance | 49 (84.5%) | 9 (15.5%) |
| Real Estate, Rental & Leasing | 15 (33.3%) | 30 (66.7%) |
| Professional & Scientific | 27 (73.0%) | 10 (27.0%) |
| Enterprise Management | 0 (0.0%) | 2 (100.0%) |
| Administrative & Support | 0 (0.0%) | 2 (100.0%) |
| Educational Services | 7 (63.6%) | 4 (36.4%) |
| Health Care & Social Assistance | 11 (52.4%) | 10 (47.6%) |
| Arts, Entertainment & Recreation | 8 (100.0%) | 0 (0.0%) |
| Accommodation & Food Services | 6 (42.9%) | 8 (57.1%) |
| Public Administration | 0 (0.0%) | 0 (0.0%) |
| Total | 205 (65.3%) | 109 (34.7%) |
Education in Gulf Stream
School Enrollment in Gulf Stream
The most common levels of schooling among the 109 students in Gulf Stream are college / undergraduate (30 | 27.5%), high school (27 | 24.8%), and nursery / preschool (20 | 18.3%).
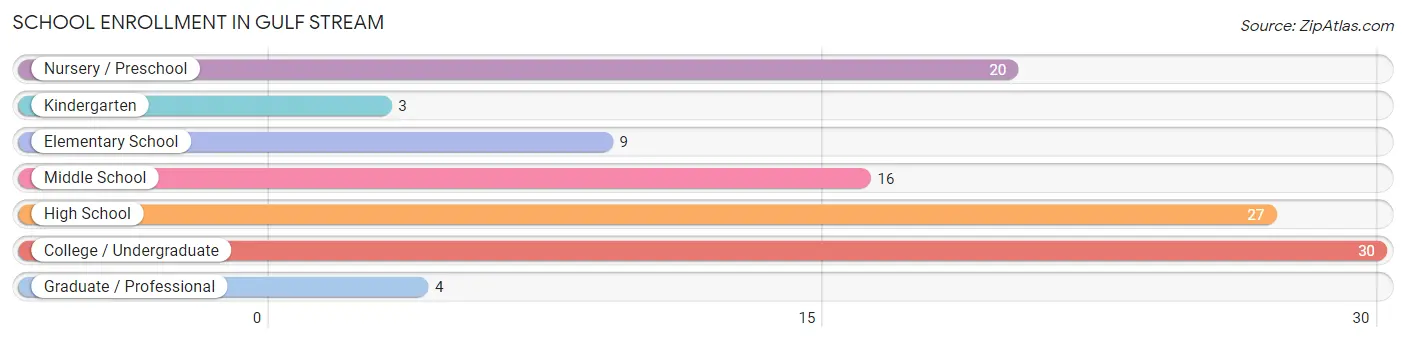
| School Level | # Students | % Students |
| Nursery / Preschool | 20 | 18.3% |
| Kindergarten | 3 | 2.8% |
| Elementary School | 9 | 8.3% |
| Middle School | 16 | 14.7% |
| High School | 27 | 24.8% |
| College / Undergraduate | 30 | 27.5% |
| Graduate / Professional | 4 | 3.7% |
| Total | 109 | 100.0% |
School Enrollment by Age by Funding Source in Gulf Stream
Out of a total of 109 students who are enrolled in schools in Gulf Stream, 82 (75.2%) attend a private institution, while the remaining 27 (24.8%) are enrolled in public schools. The age group of 3 to 4 year olds has the highest likelihood of being enrolled in private schools, with 12 (100.0% in the age bracket) enrolled. Conversely, the age group of 5 to 9 year old has the lowest likelihood of being enrolled in a private school, with 7 (38.9% in the age bracket) attending a public institution.
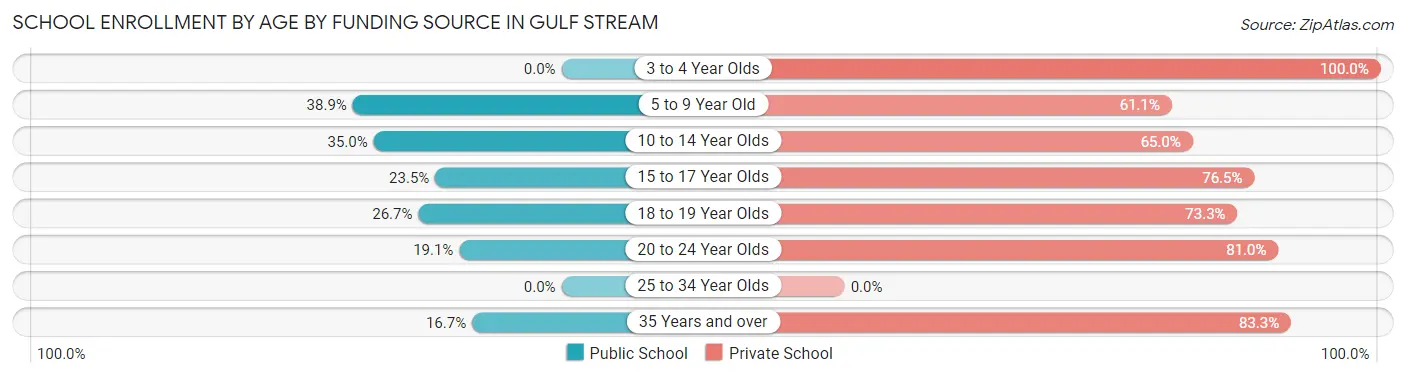
| Age Bracket | Public School | Private School |
| 3 to 4 Year Olds | 0 (0.0%) | 12 (100.0%) |
| 5 to 9 Year Old | 7 (38.9%) | 11 (61.1%) |
| 10 to 14 Year Olds | 7 (35.0%) | 13 (65.0%) |
| 15 to 17 Year Olds | 4 (23.5%) | 13 (76.5%) |
| 18 to 19 Year Olds | 4 (26.7%) | 11 (73.3%) |
| 20 to 24 Year Olds | 4 (19.1%) | 17 (80.9%) |
| 25 to 34 Year Olds | 0 (0.0%) | 0 (0.0%) |
| 35 Years and over | 1 (16.7%) | 5 (83.3%) |
| Total | 27 (24.8%) | 82 (75.2%) |
Educational Attainment by Field of Study in Gulf Stream
Business (155 | 28.2%), social sciences (82 | 14.9%), engineering (51 | 9.3%), liberal arts & history (49 | 8.9%), and visual & performing arts (41 | 7.4%) are the most common fields of study among 550 individuals in Gulf Stream who have obtained a bachelor's degree or higher.
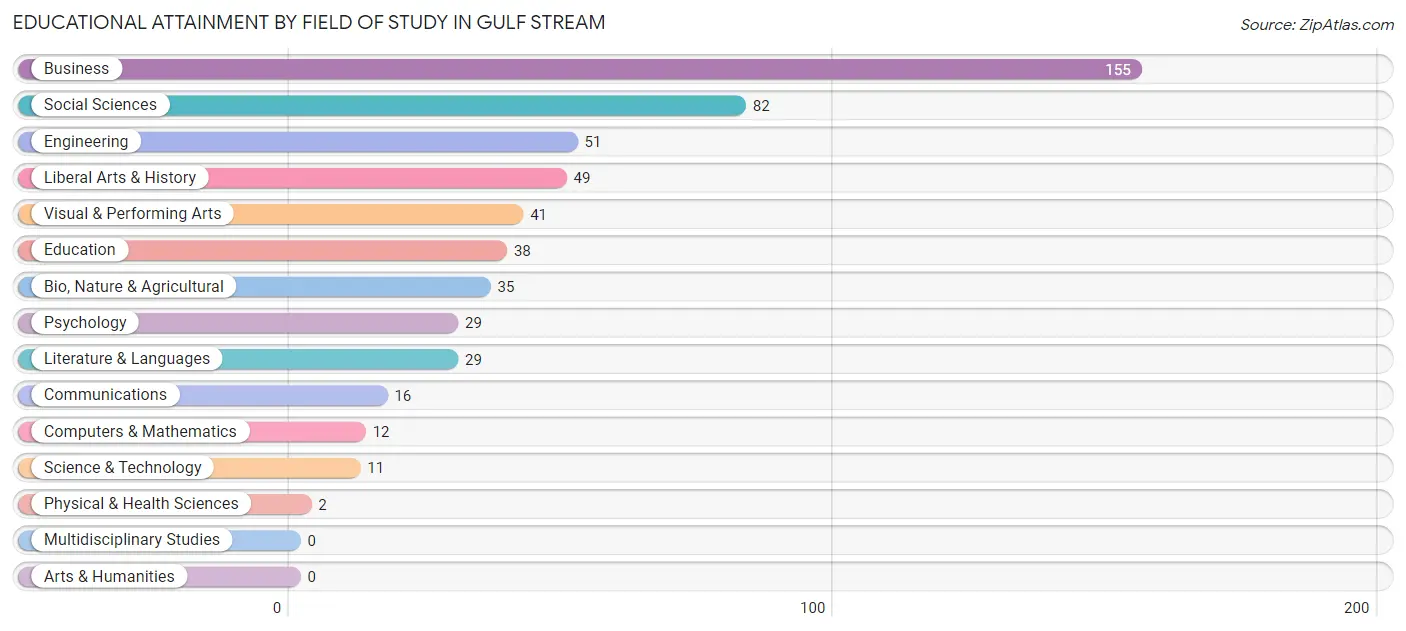
| Field of Study | # Graduates | % Graduates |
| Computers & Mathematics | 12 | 2.2% |
| Bio, Nature & Agricultural | 35 | 6.4% |
| Physical & Health Sciences | 2 | 0.4% |
| Psychology | 29 | 5.3% |
| Social Sciences | 82 | 14.9% |
| Engineering | 51 | 9.3% |
| Multidisciplinary Studies | 0 | 0.0% |
| Science & Technology | 11 | 2.0% |
| Business | 155 | 28.2% |
| Education | 38 | 6.9% |
| Literature & Languages | 29 | 5.3% |
| Liberal Arts & History | 49 | 8.9% |
| Visual & Performing Arts | 41 | 7.4% |
| Communications | 16 | 2.9% |
| Arts & Humanities | 0 | 0.0% |
| Total | 550 | 100.0% |
Transportation & Commute in Gulf Stream
Vehicle Availability by Sex in Gulf Stream
The most prevalent vehicle ownership categories in Gulf Stream are males with 2 vehicles (99, accounting for 48.3%) and females with 2 vehicles (52, making up 93.4%).
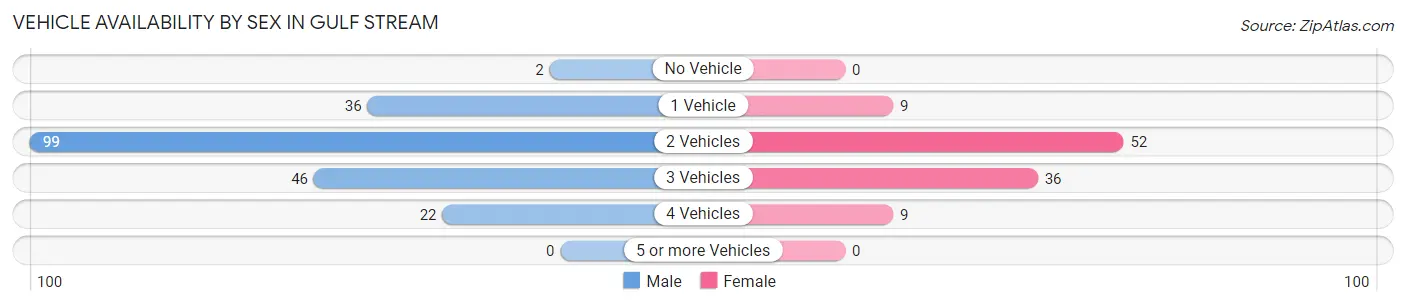
| Vehicles Available | Male | Female |
| No Vehicle | 2 (1.0%) | 0 (0.0%) |
| 1 Vehicle | 36 (17.6%) | 9 (8.5%) |
| 2 Vehicles | 99 (48.3%) | 52 (49.1%) |
| 3 Vehicles | 46 (22.4%) | 36 (34.0%) |
| 4 Vehicles | 22 (10.7%) | 9 (8.5%) |
| 5 or more Vehicles | 0 (0.0%) | 0 (0.0%) |
| Total | 205 (100.0%) | 106 (100.0%) |
Commute Time in Gulf Stream
The most frequently occuring commute durations in Gulf Stream are 5 to 9 minutes (60 commuters, 23.6%), 20 to 24 minutes (47 commuters, 18.5%), and 10 to 14 minutes (40 commuters, 15.8%).
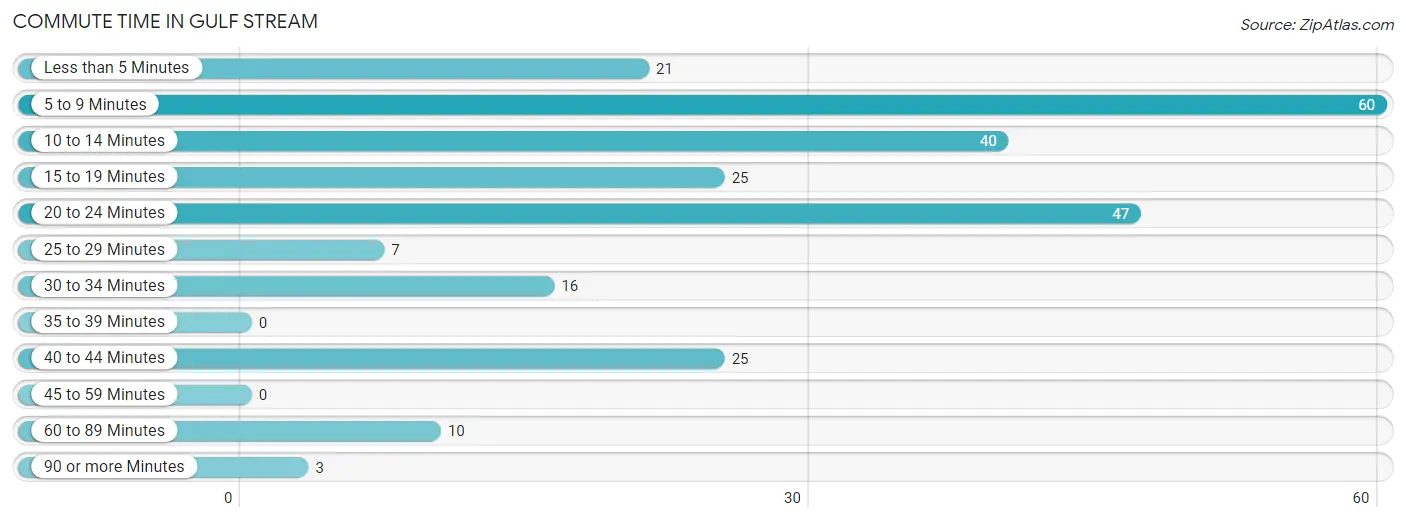
| Commute Time | # Commuters | % Commuters |
| Less than 5 Minutes | 21 | 8.3% |
| 5 to 9 Minutes | 60 | 23.6% |
| 10 to 14 Minutes | 40 | 15.8% |
| 15 to 19 Minutes | 25 | 9.8% |
| 20 to 24 Minutes | 47 | 18.5% |
| 25 to 29 Minutes | 7 | 2.8% |
| 30 to 34 Minutes | 16 | 6.3% |
| 35 to 39 Minutes | 0 | 0.0% |
| 40 to 44 Minutes | 25 | 9.8% |
| 45 to 59 Minutes | 0 | 0.0% |
| 60 to 89 Minutes | 10 | 3.9% |
| 90 or more Minutes | 3 | 1.2% |
Commute Time by Sex in Gulf Stream
The most common commute times in Gulf Stream are 20 to 24 minutes (40 commuters, 24.2%) for males and 5 to 9 minutes (35 commuters, 39.3%) for females.
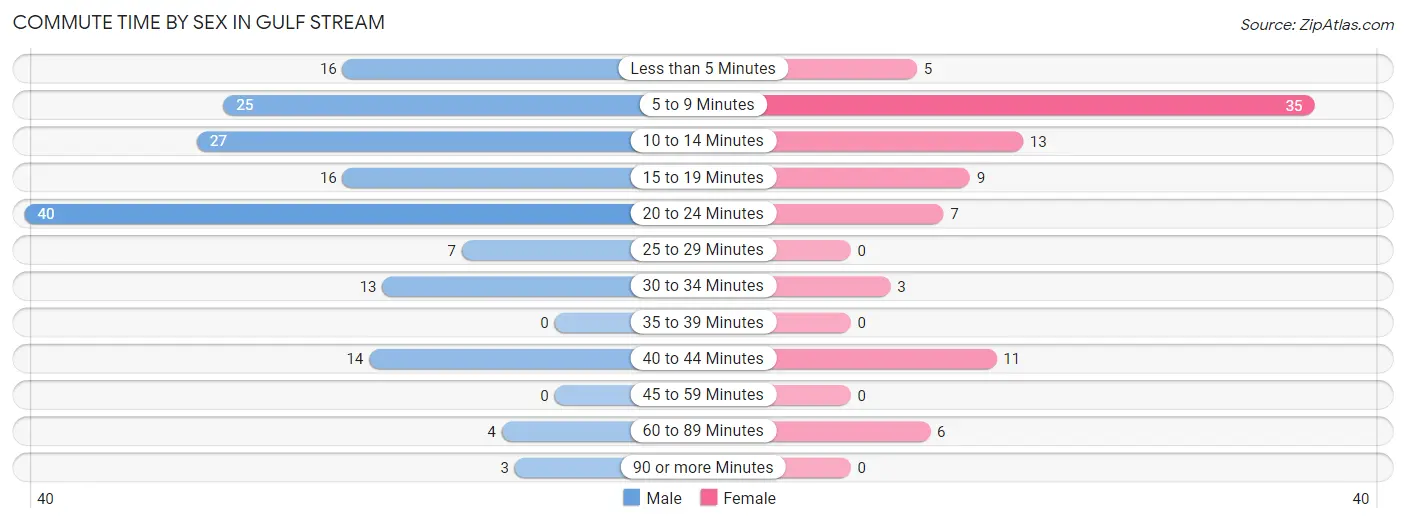
| Commute Time | Male | Female |
| Less than 5 Minutes | 16 (9.7%) | 5 (5.6%) |
| 5 to 9 Minutes | 25 (15.1%) | 35 (39.3%) |
| 10 to 14 Minutes | 27 (16.4%) | 13 (14.6%) |
| 15 to 19 Minutes | 16 (9.7%) | 9 (10.1%) |
| 20 to 24 Minutes | 40 (24.2%) | 7 (7.9%) |
| 25 to 29 Minutes | 7 (4.2%) | 0 (0.0%) |
| 30 to 34 Minutes | 13 (7.9%) | 3 (3.4%) |
| 35 to 39 Minutes | 0 (0.0%) | 0 (0.0%) |
| 40 to 44 Minutes | 14 (8.5%) | 11 (12.4%) |
| 45 to 59 Minutes | 0 (0.0%) | 0 (0.0%) |
| 60 to 89 Minutes | 4 (2.4%) | 6 (6.7%) |
| 90 or more Minutes | 3 (1.8%) | 0 (0.0%) |
Time of Departure to Work by Sex in Gulf Stream
The most frequent times of departure to work in Gulf Stream are 9:00 AM to 9:59 AM (46, 27.9%) for males and 12:00 PM to 3:59 PM (22, 24.7%) for females.
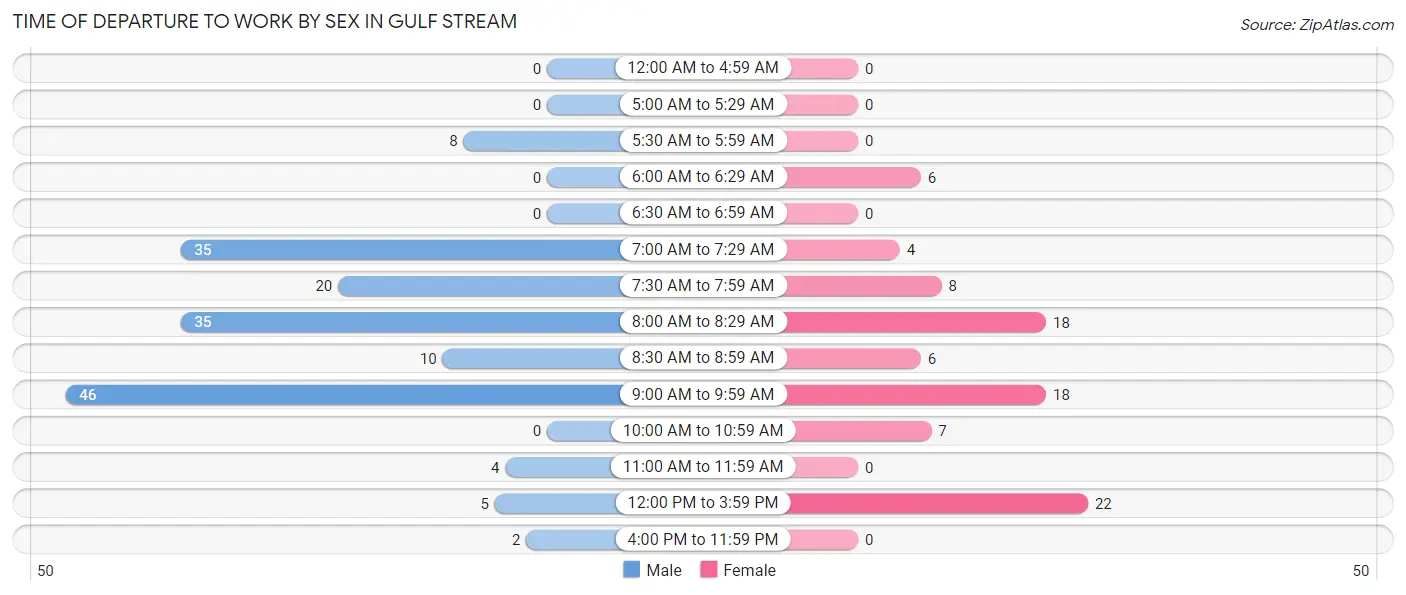
| Time of Departure | Male | Female |
| 12:00 AM to 4:59 AM | 0 (0.0%) | 0 (0.0%) |
| 5:00 AM to 5:29 AM | 0 (0.0%) | 0 (0.0%) |
| 5:30 AM to 5:59 AM | 8 (4.9%) | 0 (0.0%) |
| 6:00 AM to 6:29 AM | 0 (0.0%) | 6 (6.7%) |
| 6:30 AM to 6:59 AM | 0 (0.0%) | 0 (0.0%) |
| 7:00 AM to 7:29 AM | 35 (21.2%) | 4 (4.5%) |
| 7:30 AM to 7:59 AM | 20 (12.1%) | 8 (9.0%) |
| 8:00 AM to 8:29 AM | 35 (21.2%) | 18 (20.2%) |
| 8:30 AM to 8:59 AM | 10 (6.1%) | 6 (6.7%) |
| 9:00 AM to 9:59 AM | 46 (27.9%) | 18 (20.2%) |
| 10:00 AM to 10:59 AM | 0 (0.0%) | 7 (7.9%) |
| 11:00 AM to 11:59 AM | 4 (2.4%) | 0 (0.0%) |
| 12:00 PM to 3:59 PM | 5 (3.0%) | 22 (24.7%) |
| 4:00 PM to 11:59 PM | 2 (1.2%) | 0 (0.0%) |
| Total | 165 (100.0%) | 89 (100.0%) |
Housing Occupancy in Gulf Stream
Occupancy by Ownership in Gulf Stream
Of the total 392 dwellings in Gulf Stream, owner-occupied units account for 353 (90.0%), while renter-occupied units make up 39 (10.0%).
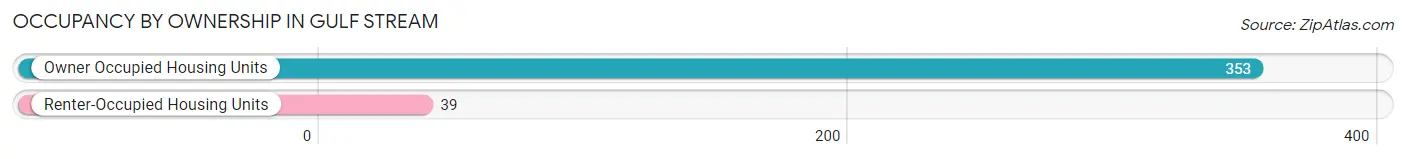
| Occupancy | # Housing Units | % Housing Units |
| Owner Occupied Housing Units | 353 | 90.0% |
| Renter-Occupied Housing Units | 39 | 10.0% |
| Total Occupied Housing Units | 392 | 100.0% |
Occupancy by Household Size in Gulf Stream
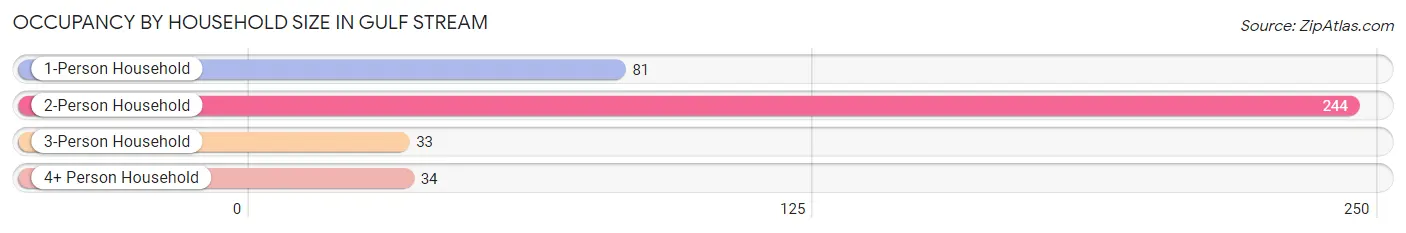
| Household Size | # Housing Units | % Housing Units |
| 1-Person Household | 81 | 20.7% |
| 2-Person Household | 244 | 62.2% |
| 3-Person Household | 33 | 8.4% |
| 4+ Person Household | 34 | 8.7% |
| Total Housing Units | 392 | 100.0% |
Occupancy by Ownership by Household Size in Gulf Stream
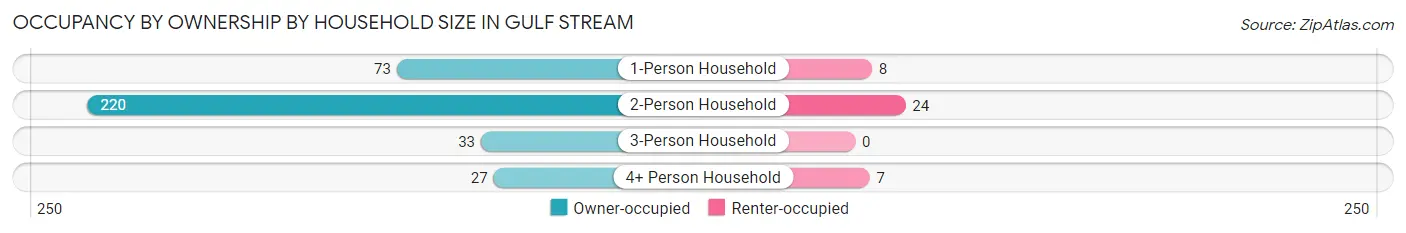
| Household Size | Owner-occupied | Renter-occupied |
| 1-Person Household | 73 (90.1%) | 8 (9.9%) |
| 2-Person Household | 220 (90.2%) | 24 (9.8%) |
| 3-Person Household | 33 (100.0%) | 0 (0.0%) |
| 4+ Person Household | 27 (79.4%) | 7 (20.6%) |
| Total Housing Units | 353 (90.0%) | 39 (10.0%) |
Occupancy by Educational Attainment in Gulf Stream
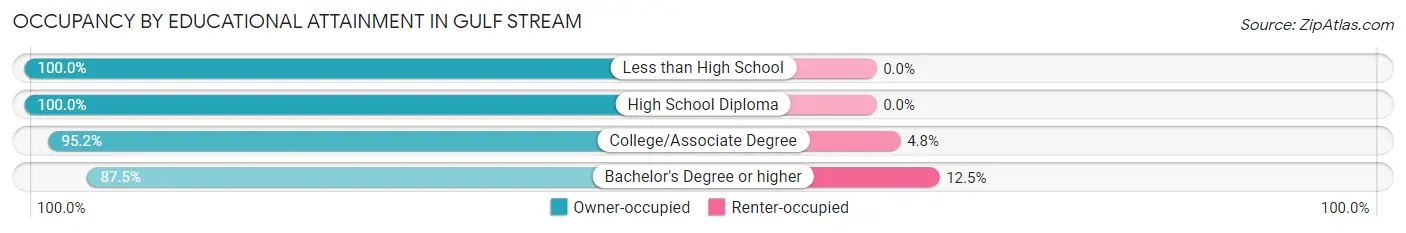
| Household Size | Owner-occupied | Renter-occupied |
| Less than High School | 5 (100.0%) | 0 (0.0%) |
| High School Diploma | 23 (100.0%) | 0 (0.0%) |
| College/Associate Degree | 80 (95.2%) | 4 (4.8%) |
| Bachelor's Degree or higher | 245 (87.5%) | 35 (12.5%) |
Occupancy by Age of Householder in Gulf Stream
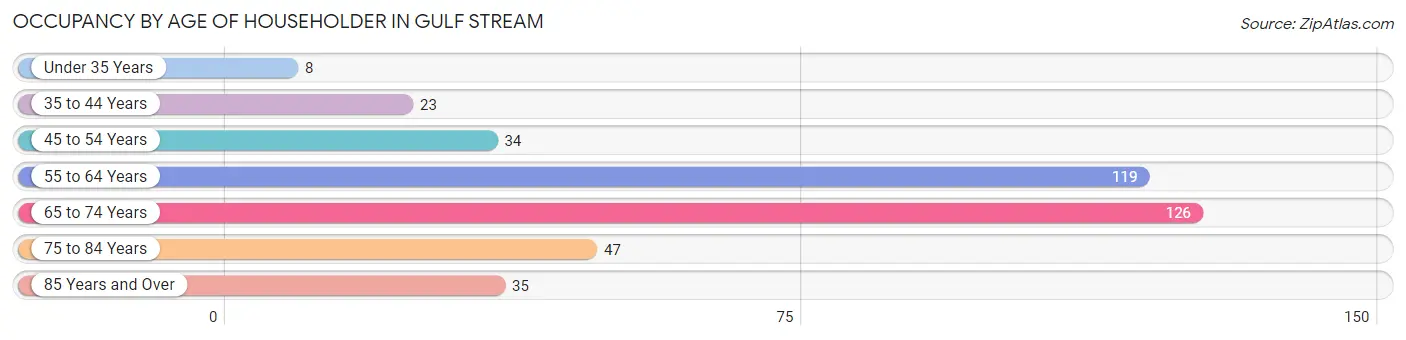
| Age Bracket | # Households | % Households |
| Under 35 Years | 8 | 2.0% |
| 35 to 44 Years | 23 | 5.9% |
| 45 to 54 Years | 34 | 8.7% |
| 55 to 64 Years | 119 | 30.4% |
| 65 to 74 Years | 126 | 32.1% |
| 75 to 84 Years | 47 | 12.0% |
| 85 Years and Over | 35 | 8.9% |
| Total | 392 | 100.0% |
Housing Finances in Gulf Stream
Median Income by Occupancy in Gulf Stream
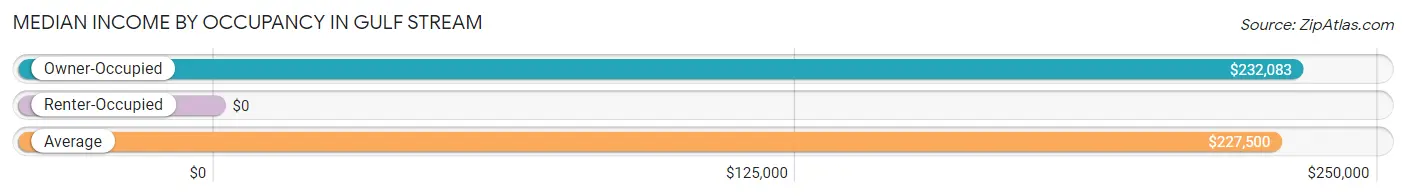
| Occupancy Type | # Households | Median Income |
| Owner-Occupied | 353 (90.0%) | $232,083 |
| Renter-Occupied | 39 (10.0%) | $0 |
| Average | 392 (100.0%) | $227,500 |
Occupancy by Householder Income Bracket in Gulf Stream
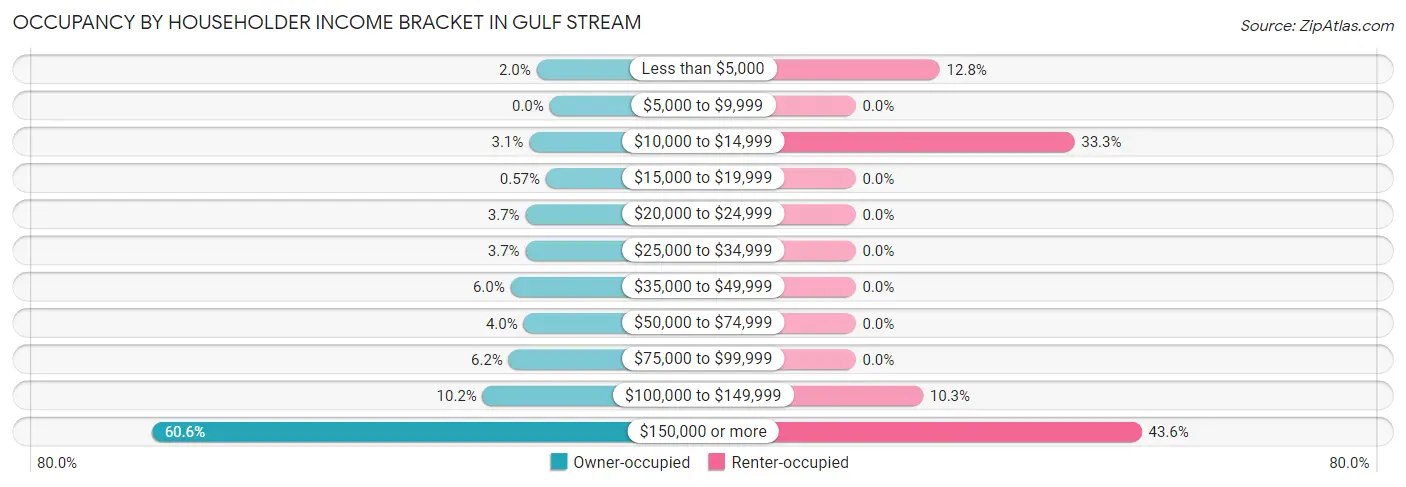
| Income Bracket | Owner-occupied | Renter-occupied |
| Less than $5,000 | 7 (2.0%) | 5 (12.8%) |
| $5,000 to $9,999 | 0 (0.0%) | 0 (0.0%) |
| $10,000 to $14,999 | 11 (3.1%) | 13 (33.3%) |
| $15,000 to $19,999 | 2 (0.6%) | 0 (0.0%) |
| $20,000 to $24,999 | 13 (3.7%) | 0 (0.0%) |
| $25,000 to $34,999 | 13 (3.7%) | 0 (0.0%) |
| $35,000 to $49,999 | 21 (5.9%) | 0 (0.0%) |
| $50,000 to $74,999 | 14 (4.0%) | 0 (0.0%) |
| $75,000 to $99,999 | 22 (6.2%) | 0 (0.0%) |
| $100,000 to $149,999 | 36 (10.2%) | 4 (10.3%) |
| $150,000 or more | 214 (60.6%) | 17 (43.6%) |
| Total | 353 (100.0%) | 39 (100.0%) |
Monthly Housing Cost Tiers in Gulf Stream
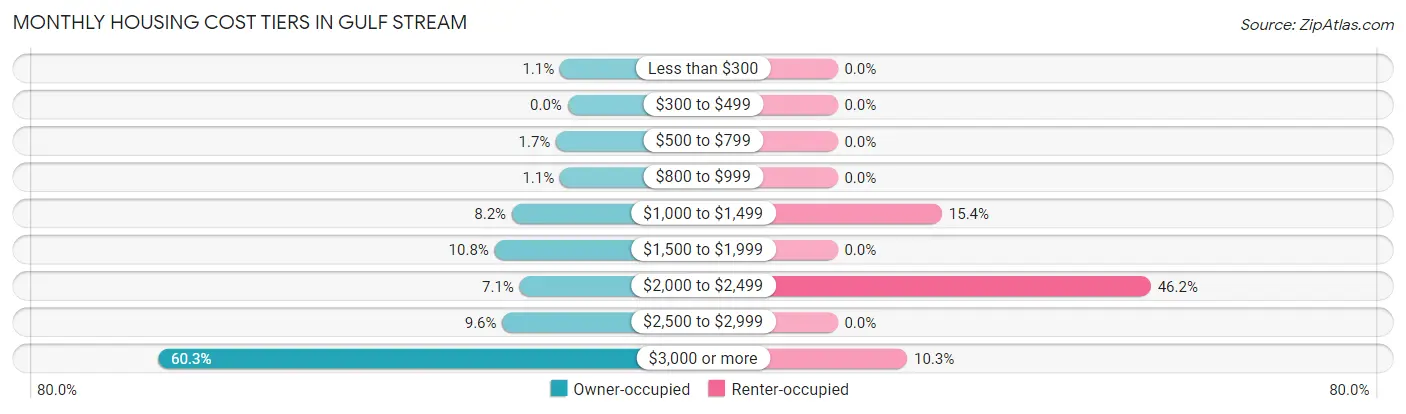
| Monthly Cost | Owner-occupied | Renter-occupied |
| Less than $300 | 4 (1.1%) | 0 (0.0%) |
| $300 to $499 | 0 (0.0%) | 0 (0.0%) |
| $500 to $799 | 6 (1.7%) | 0 (0.0%) |
| $800 to $999 | 4 (1.1%) | 0 (0.0%) |
| $1,000 to $1,499 | 29 (8.2%) | 6 (15.4%) |
| $1,500 to $1,999 | 38 (10.8%) | 0 (0.0%) |
| $2,000 to $2,499 | 25 (7.1%) | 18 (46.2%) |
| $2,500 to $2,999 | 34 (9.6%) | 0 (0.0%) |
| $3,000 or more | 213 (60.3%) | 4 (10.3%) |
| Total | 353 (100.0%) | 39 (100.0%) |
Physical Housing Characteristics in Gulf Stream
Housing Structures in Gulf Stream
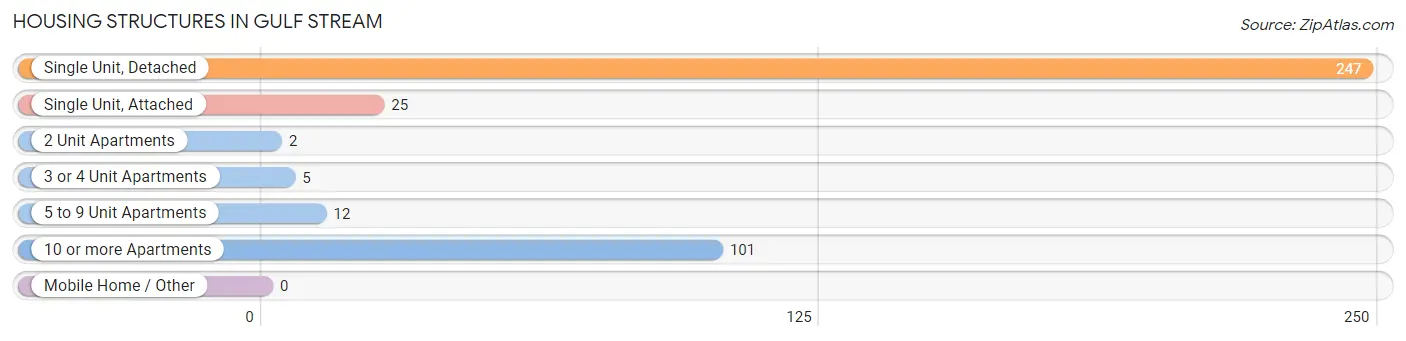
| Structure Type | # Housing Units | % Housing Units |
| Single Unit, Detached | 247 | 63.0% |
| Single Unit, Attached | 25 | 6.4% |
| 2 Unit Apartments | 2 | 0.5% |
| 3 or 4 Unit Apartments | 5 | 1.3% |
| 5 to 9 Unit Apartments | 12 | 3.1% |
| 10 or more Apartments | 101 | 25.8% |
| Mobile Home / Other | 0 | 0.0% |
| Total | 392 | 100.0% |
Housing Structures by Occupancy in Gulf Stream
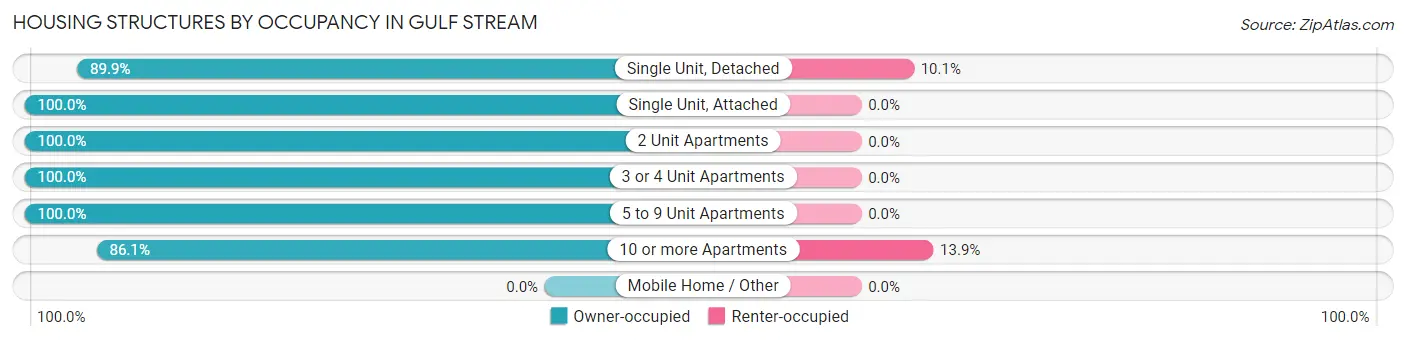
| Structure Type | Owner-occupied | Renter-occupied |
| Single Unit, Detached | 222 (89.9%) | 25 (10.1%) |
| Single Unit, Attached | 25 (100.0%) | 0 (0.0%) |
| 2 Unit Apartments | 2 (100.0%) | 0 (0.0%) |
| 3 or 4 Unit Apartments | 5 (100.0%) | 0 (0.0%) |
| 5 to 9 Unit Apartments | 12 (100.0%) | 0 (0.0%) |
| 10 or more Apartments | 87 (86.1%) | 14 (13.9%) |
| Mobile Home / Other | 0 (0.0%) | 0 (0.0%) |
| Total | 353 (90.0%) | 39 (10.0%) |
Housing Structures by Number of Rooms in Gulf Stream
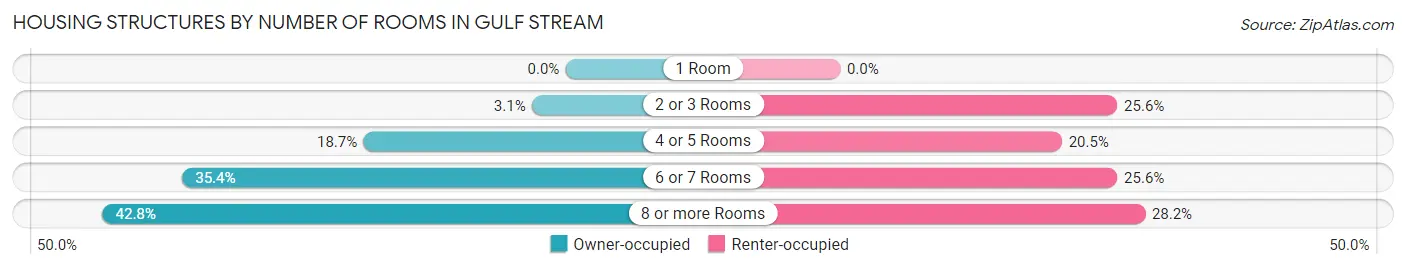
| Number of Rooms | Owner-occupied | Renter-occupied |
| 1 Room | 0 (0.0%) | 0 (0.0%) |
| 2 or 3 Rooms | 11 (3.1%) | 10 (25.6%) |
| 4 or 5 Rooms | 66 (18.7%) | 8 (20.5%) |
| 6 or 7 Rooms | 125 (35.4%) | 10 (25.6%) |
| 8 or more Rooms | 151 (42.8%) | 11 (28.2%) |
| Total | 353 (100.0%) | 39 (100.0%) |
Housing Structure by Heating Type in Gulf Stream
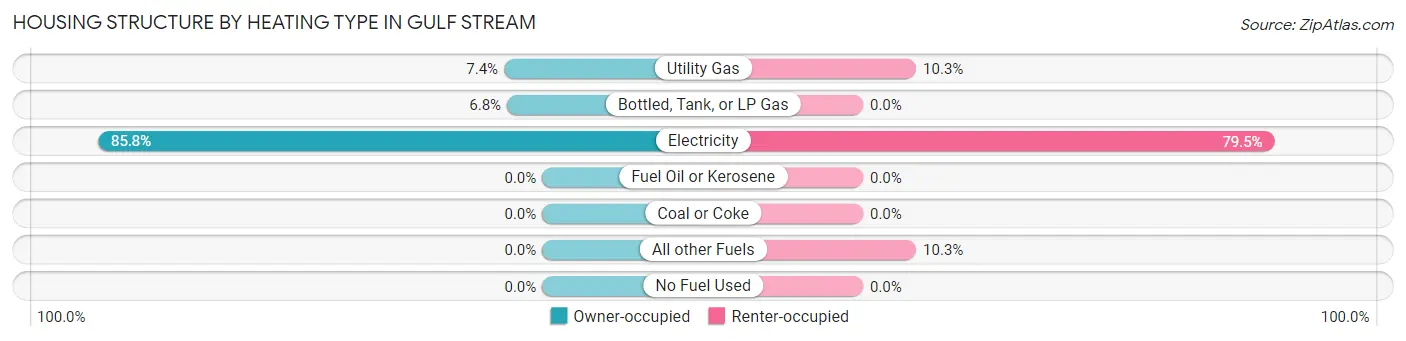
| Heating Type | Owner-occupied | Renter-occupied |
| Utility Gas | 26 (7.4%) | 4 (10.3%) |
| Bottled, Tank, or LP Gas | 24 (6.8%) | 0 (0.0%) |
| Electricity | 303 (85.8%) | 31 (79.5%) |
| Fuel Oil or Kerosene | 0 (0.0%) | 0 (0.0%) |
| Coal or Coke | 0 (0.0%) | 0 (0.0%) |
| All other Fuels | 0 (0.0%) | 4 (10.3%) |
| No Fuel Used | 0 (0.0%) | 0 (0.0%) |
| Total | 353 (100.0%) | 39 (100.0%) |
Household Vehicle Usage in Gulf Stream
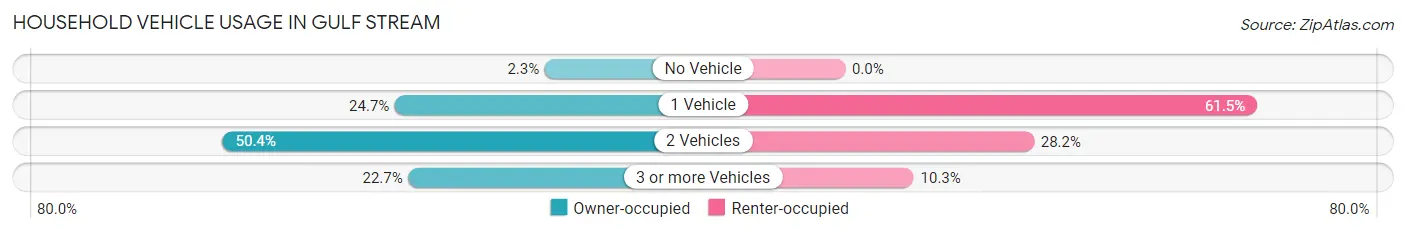
| Vehicles per Household | Owner-occupied | Renter-occupied |
| No Vehicle | 8 (2.3%) | 0 (0.0%) |
| 1 Vehicle | 87 (24.6%) | 24 (61.5%) |
| 2 Vehicles | 178 (50.4%) | 11 (28.2%) |
| 3 or more Vehicles | 80 (22.7%) | 4 (10.3%) |
| Total | 353 (100.0%) | 39 (100.0%) |
Real Estate & Mortgages in Gulf Stream
Real Estate and Mortgage Overview in Gulf Stream
| Characteristic | Without Mortgage | With Mortgage |
| Housing Units | 245 | 108 |
| Median Property Value | $2,000,001 | $2,000,000 |
| Median Household Income | $250,001 | $73 |
| Monthly Housing Costs | $1,501 | $90 |
| Real Estate Taxes | $10,001 | $0 |
Property Value by Mortgage Status in Gulf Stream
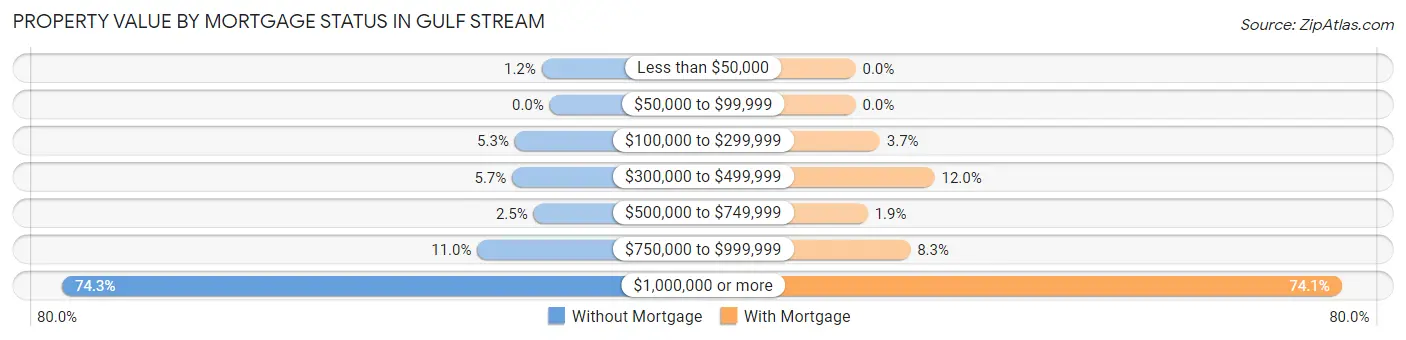
| Property Value | Without Mortgage | With Mortgage |
| Less than $50,000 | 3 (1.2%) | 0 (0.0%) |
| $50,000 to $99,999 | 0 (0.0%) | 0 (0.0%) |
| $100,000 to $299,999 | 13 (5.3%) | 4 (3.7%) |
| $300,000 to $499,999 | 14 (5.7%) | 13 (12.0%) |
| $500,000 to $749,999 | 6 (2.5%) | 2 (1.8%) |
| $750,000 to $999,999 | 27 (11.0%) | 9 (8.3%) |
| $1,000,000 or more | 182 (74.3%) | 80 (74.1%) |
| Total | 245 (100.0%) | 108 (100.0%) |
Household Income by Mortgage Status in Gulf Stream
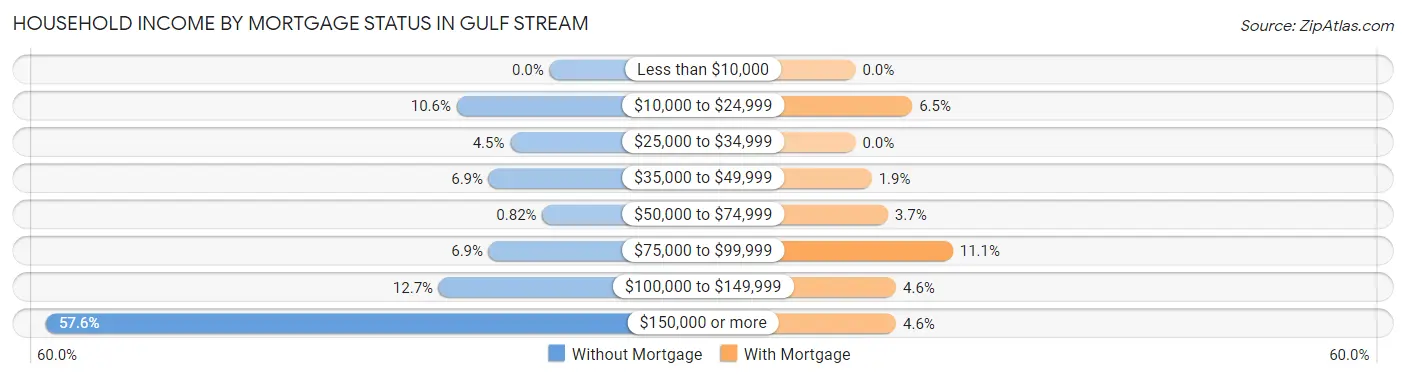
| Household Income | Without Mortgage | With Mortgage |
| Less than $10,000 | 0 (0.0%) | 0 (0.0%) |
| $10,000 to $24,999 | 26 (10.6%) | 7 (6.5%) |
| $25,000 to $34,999 | 11 (4.5%) | 0 (0.0%) |
| $35,000 to $49,999 | 17 (6.9%) | 2 (1.8%) |
| $50,000 to $74,999 | 2 (0.8%) | 4 (3.7%) |
| $75,000 to $99,999 | 17 (6.9%) | 12 (11.1%) |
| $100,000 to $149,999 | 31 (12.7%) | 5 (4.6%) |
| $150,000 or more | 141 (57.6%) | 5 (4.6%) |
| Total | 245 (100.0%) | 108 (100.0%) |
Property Value to Household Income Ratio in Gulf Stream
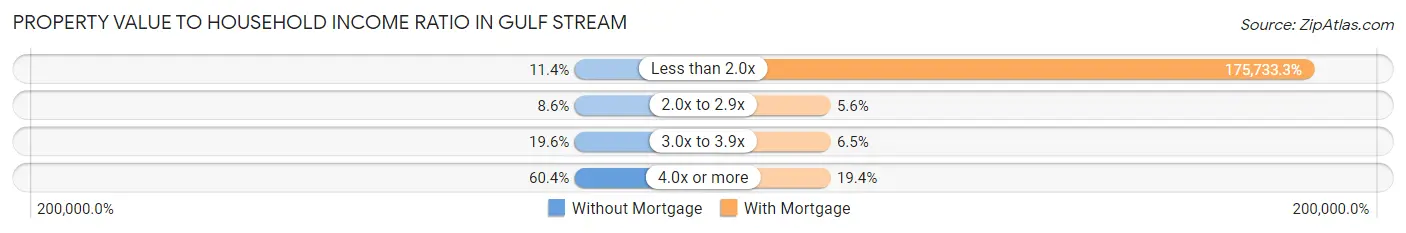
| Value-to-Income Ratio | Without Mortgage | With Mortgage |
| Less than 2.0x | 28 (11.4%) | 189,792 (175,733.3%) |
| 2.0x to 2.9x | 21 (8.6%) | 6 (5.6%) |
| 3.0x to 3.9x | 48 (19.6%) | 7 (6.5%) |
| 4.0x or more | 148 (60.4%) | 21 (19.4%) |
| Total | 245 (100.0%) | 108 (100.0%) |
Real Estate Taxes by Mortgage Status in Gulf Stream
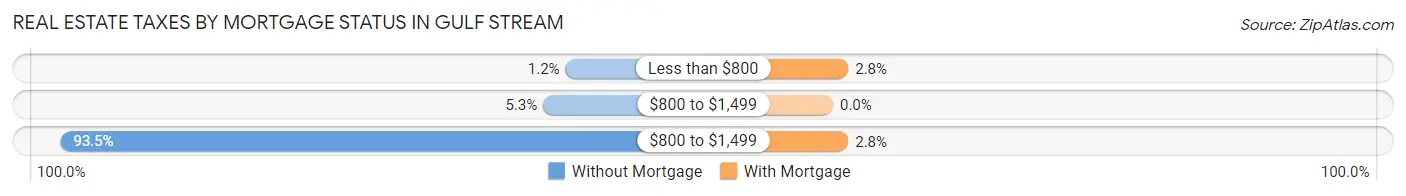
| Property Taxes | Without Mortgage | With Mortgage |
| Less than $800 | 3 (1.2%) | 3 (2.8%) |
| $800 to $1,499 | 13 (5.3%) | 0 (0.0%) |
| $800 to $1,499 | 229 (93.5%) | 3 (2.8%) |
| Total | 245 (100.0%) | 108 (100.0%) |
Health & Disability in Gulf Stream
Health Insurance Coverage by Age in Gulf Stream
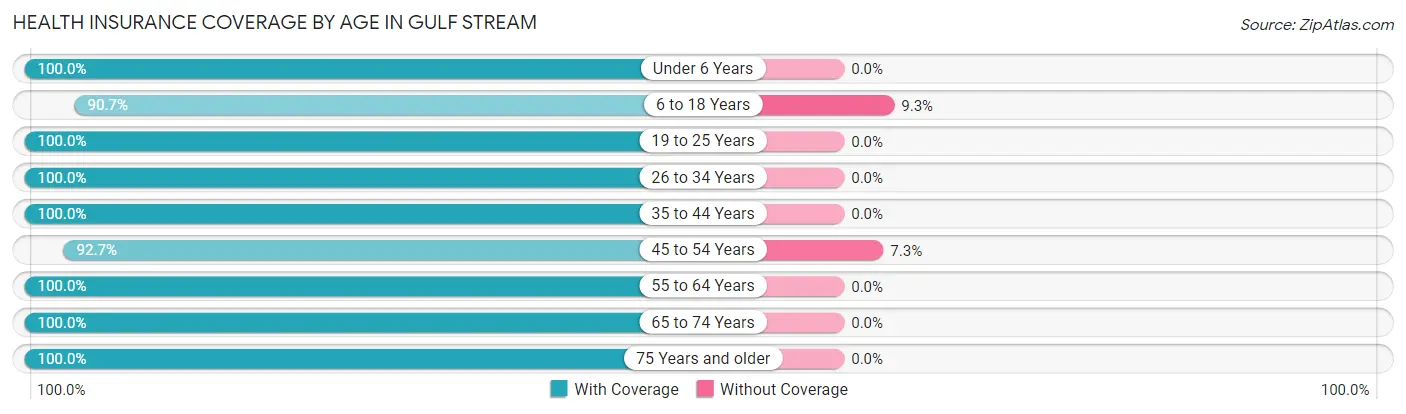
| Age Bracket | With Coverage | Without Coverage |
| Under 6 Years | 31 (100.0%) | 0 (0.0%) |
| 6 to 18 Years | 68 (90.7%) | 7 (9.3%) |
| 19 to 25 Years | 30 (100.0%) | 0 (0.0%) |
| 26 to 34 Years | 16 (100.0%) | 0 (0.0%) |
| 35 to 44 Years | 41 (100.0%) | 0 (0.0%) |
| 45 to 54 Years | 89 (92.7%) | 7 (7.3%) |
| 55 to 64 Years | 244 (100.0%) | 0 (0.0%) |
| 65 to 74 Years | 168 (100.0%) | 0 (0.0%) |
| 75 Years and older | 147 (100.0%) | 0 (0.0%) |
| Total | 834 (98.4%) | 14 (1.7%) |
Health Insurance Coverage by Citizenship Status in Gulf Stream
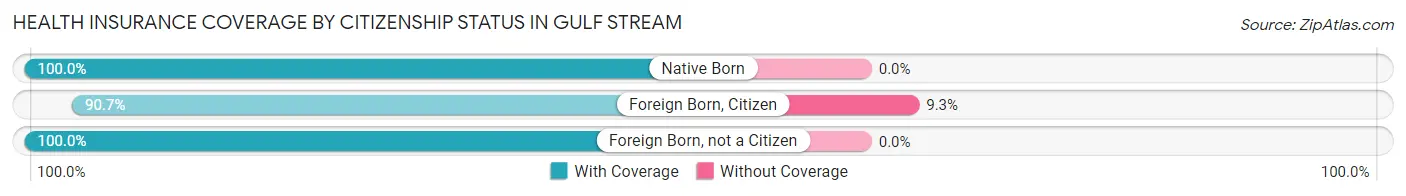
| Citizenship Status | With Coverage | Without Coverage |
| Native Born | 31 (100.0%) | 0 (0.0%) |
| Foreign Born, Citizen | 68 (90.7%) | 7 (9.3%) |
| Foreign Born, not a Citizen | 30 (100.0%) | 0 (0.0%) |
Health Insurance Coverage by Household Income in Gulf Stream
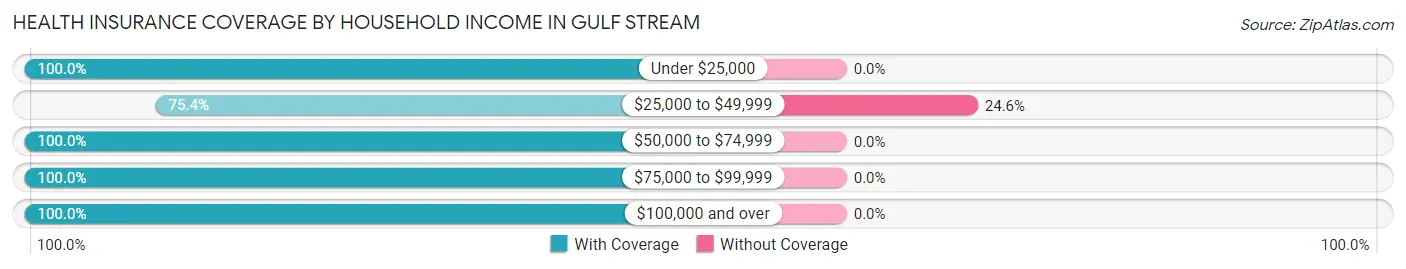
| Household Income | With Coverage | Without Coverage |
| Under $25,000 | 82 (100.0%) | 0 (0.0%) |
| $25,000 to $49,999 | 43 (75.4%) | 14 (24.6%) |
| $50,000 to $74,999 | 33 (100.0%) | 0 (0.0%) |
| $75,000 to $99,999 | 64 (100.0%) | 0 (0.0%) |
| $100,000 and over | 612 (100.0%) | 0 (0.0%) |
Public vs Private Health Insurance Coverage by Age in Gulf Stream
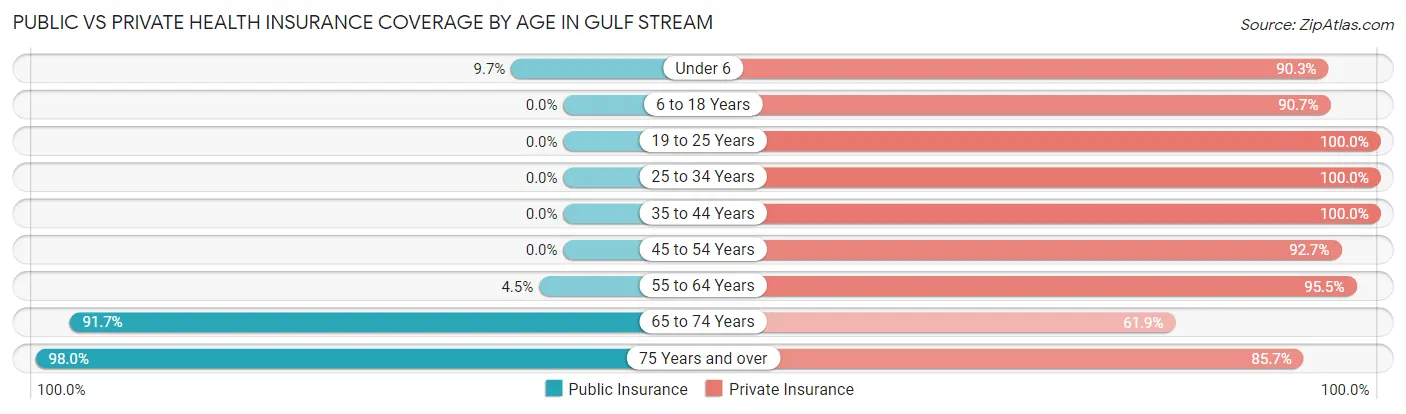
| Age Bracket | Public Insurance | Private Insurance |
| Under 6 | 3 (9.7%) | 28 (90.3%) |
| 6 to 18 Years | 0 (0.0%) | 68 (90.7%) |
| 19 to 25 Years | 0 (0.0%) | 30 (100.0%) |
| 25 to 34 Years | 0 (0.0%) | 16 (100.0%) |
| 35 to 44 Years | 0 (0.0%) | 41 (100.0%) |
| 45 to 54 Years | 0 (0.0%) | 89 (92.7%) |
| 55 to 64 Years | 11 (4.5%) | 233 (95.5%) |
| 65 to 74 Years | 154 (91.7%) | 104 (61.9%) |
| 75 Years and over | 144 (98.0%) | 126 (85.7%) |
| Total | 312 (36.8%) | 735 (86.7%) |
Disability Status by Sex by Age in Gulf Stream
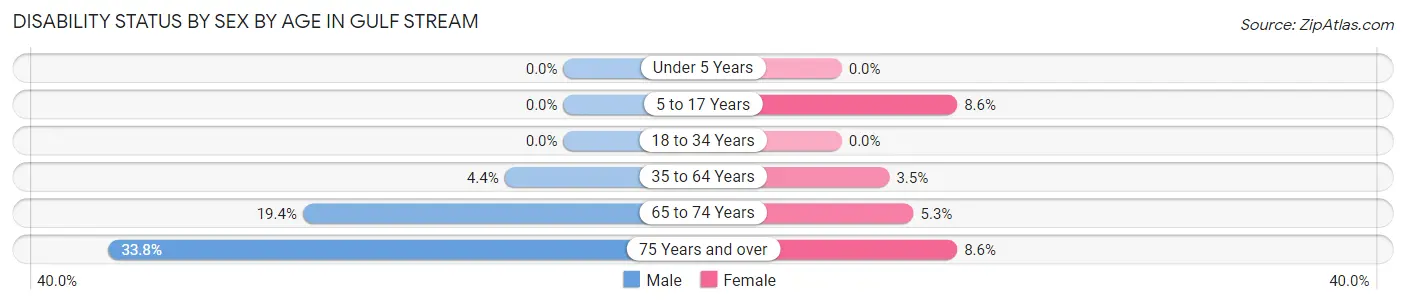
| Age Bracket | Male | Female |
| Under 5 Years | 0 (0.0%) | 0 (0.0%) |
| 5 to 17 Years | 0 (0.0%) | 3 (8.6%) |
| 18 to 34 Years | 0 (0.0%) | 0 (0.0%) |
| 35 to 64 Years | 8 (4.4%) | 7 (3.5%) |
| 65 to 74 Years | 18 (19.4%) | 4 (5.3%) |
| 75 Years and over | 26 (33.8%) | 6 (8.6%) |
Disability Class by Sex by Age in Gulf Stream
Disability Class: Hearing Difficulty
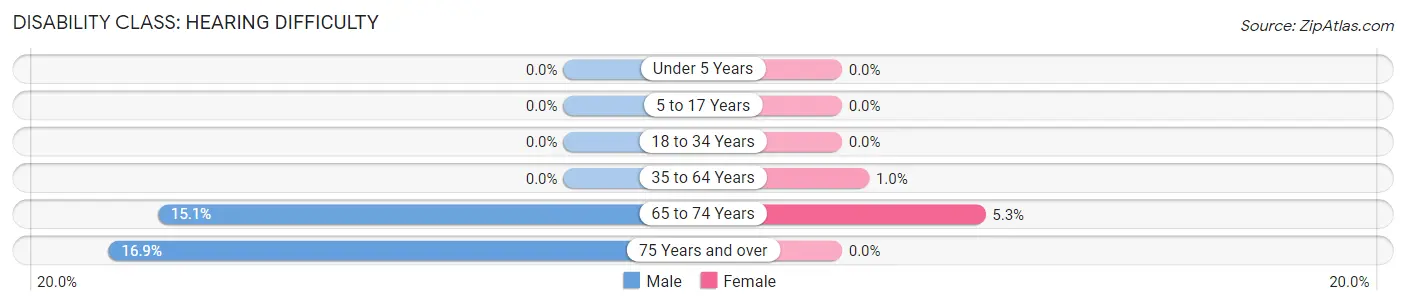
| Age Bracket | Male | Female |
| Under 5 Years | 0 (0.0%) | 0 (0.0%) |
| 5 to 17 Years | 0 (0.0%) | 0 (0.0%) |
| 18 to 34 Years | 0 (0.0%) | 0 (0.0%) |
| 35 to 64 Years | 0 (0.0%) | 2 (1.0%) |
| 65 to 74 Years | 14 (15.0%) | 4 (5.3%) |
| 75 Years and over | 13 (16.9%) | 0 (0.0%) |
Disability Class: Vision Difficulty
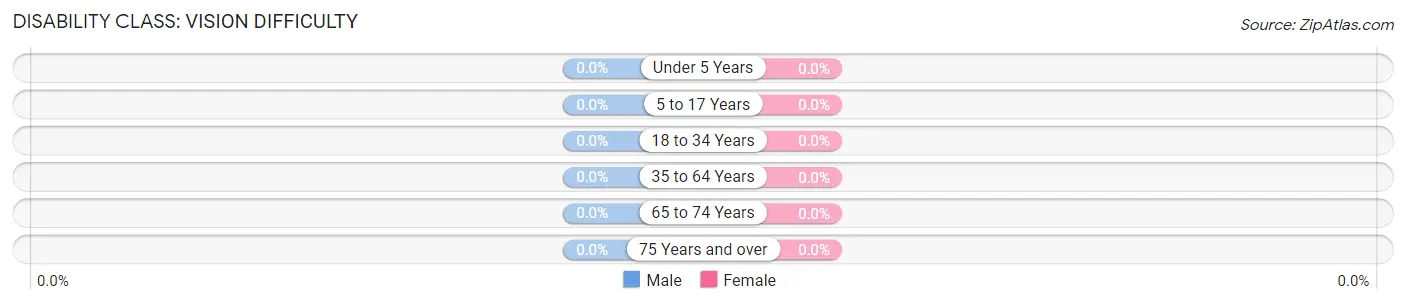
| Age Bracket | Male | Female |
| Under 5 Years | 0 (0.0%) | 0 (0.0%) |
| 5 to 17 Years | 0 (0.0%) | 0 (0.0%) |
| 18 to 34 Years | 0 (0.0%) | 0 (0.0%) |
| 35 to 64 Years | 0 (0.0%) | 0 (0.0%) |
| 65 to 74 Years | 0 (0.0%) | 0 (0.0%) |
| 75 Years and over | 0 (0.0%) | 0 (0.0%) |
Disability Class: Cognitive Difficulty
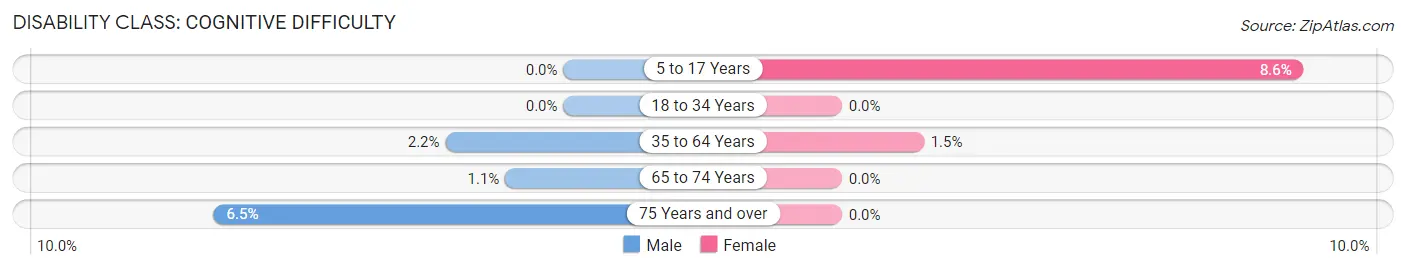
| Age Bracket | Male | Female |
| 5 to 17 Years | 0 (0.0%) | 3 (8.6%) |
| 18 to 34 Years | 0 (0.0%) | 0 (0.0%) |
| 35 to 64 Years | 4 (2.2%) | 3 (1.5%) |
| 65 to 74 Years | 1 (1.1%) | 0 (0.0%) |
| 75 Years and over | 5 (6.5%) | 0 (0.0%) |
Disability Class: Ambulatory Difficulty
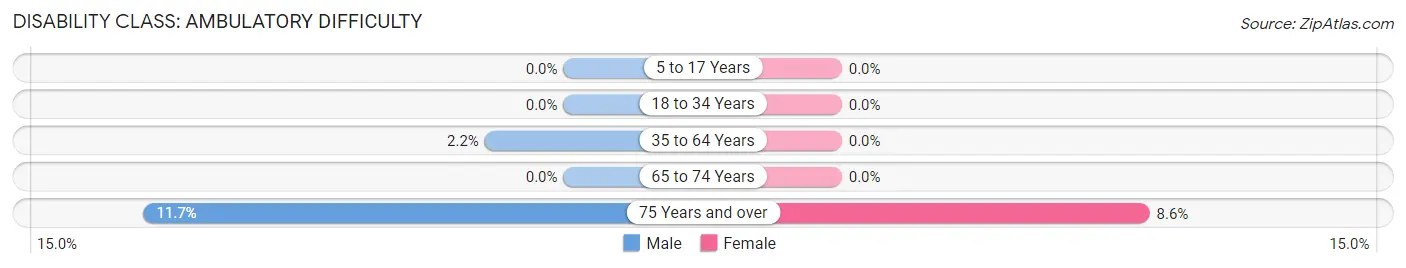
| Age Bracket | Male | Female |
| 5 to 17 Years | 0 (0.0%) | 0 (0.0%) |
| 18 to 34 Years | 0 (0.0%) | 0 (0.0%) |
| 35 to 64 Years | 4 (2.2%) | 0 (0.0%) |
| 65 to 74 Years | 0 (0.0%) | 0 (0.0%) |
| 75 Years and over | 9 (11.7%) | 6 (8.6%) |
Disability Class: Self-Care Difficulty
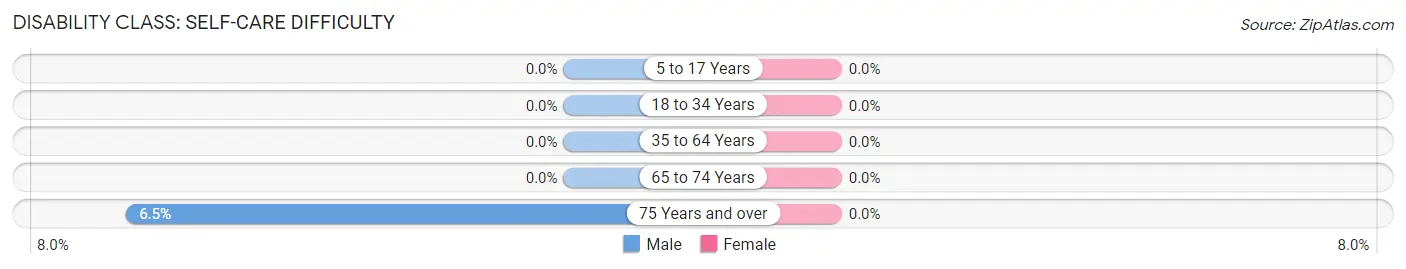
| Age Bracket | Male | Female |
| 5 to 17 Years | 0 (0.0%) | 0 (0.0%) |
| 18 to 34 Years | 0 (0.0%) | 0 (0.0%) |
| 35 to 64 Years | 0 (0.0%) | 0 (0.0%) |
| 65 to 74 Years | 0 (0.0%) | 0 (0.0%) |
| 75 Years and over | 5 (6.5%) | 0 (0.0%) |
Technology Access in Gulf Stream
Computing Device Access in Gulf Stream
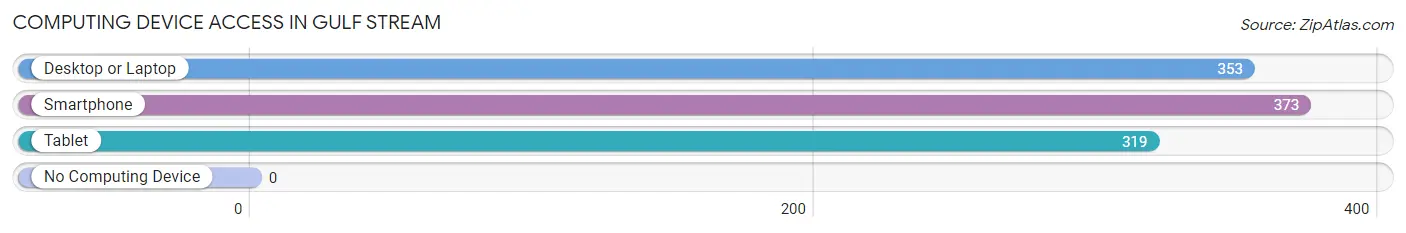
| Device Type | # Households | % Households |
| Desktop or Laptop | 353 | 90.0% |
| Smartphone | 373 | 95.2% |
| Tablet | 319 | 81.4% |
| No Computing Device | 0 | 0.0% |
| Total | 392 | 100.0% |
Internet Access in Gulf Stream
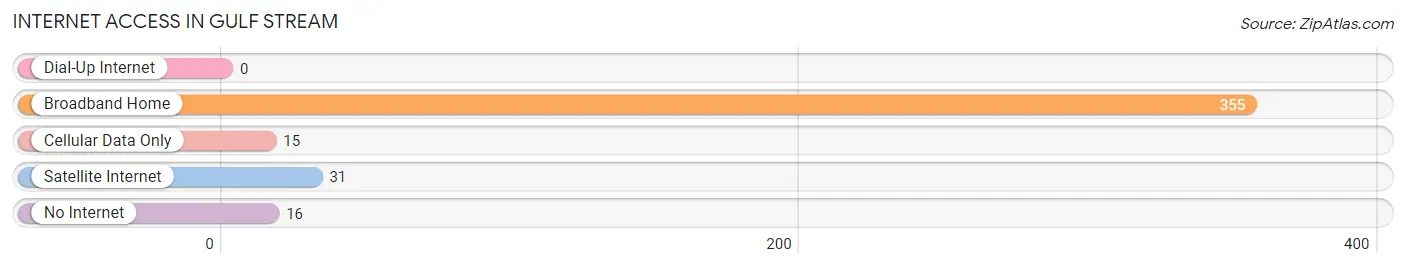
| Internet Type | # Households | % Households |
| Dial-Up Internet | 0 | 0.0% |
| Broadband Home | 355 | 90.6% |
| Cellular Data Only | 15 | 3.8% |
| Satellite Internet | 31 | 7.9% |
| No Internet | 16 | 4.1% |
| Total | 392 | 100.0% |
Gulf Stream Summary
Gulf Stream is a small town located in Palm Beach County, Florida. It is situated on the Atlantic Ocean, just north of Delray Beach and south of Boca Raton. The town is known for its beautiful beaches, lush tropical vegetation, and its laid-back atmosphere.
History
Gulf Stream was first settled in the late 1800s by a group of settlers from the Bahamas. The settlers were attracted to the area due to its abundant fishing and hunting opportunities. The town was officially incorporated in 1925 and was named after the Gulf Stream, a warm ocean current that flows from the Caribbean Sea to the Atlantic Ocean.
Geography
Gulf Stream is located on the Atlantic Ocean, just north of Delray Beach and south of Boca Raton. The town is bordered by the Intracoastal Waterway to the west and the Atlantic Ocean to the east. The town is situated on a barrier island, which is separated from the mainland by the Intracoastal Waterway. The town has a total area of 0.9 square miles, all of which is land.
Economy
Gulf Stream’s economy is largely based on tourism and real estate. The town is home to several luxury resorts and hotels, as well as a number of upscale restaurants and shops. The town also has a thriving real estate market, with many luxury homes and condos available for purchase.
Demographics
As of the 2010 census, Gulf Stream had a population of 862. The racial makeup of the town was 94.3% White, 2.2% African American, 0.2% Native American, 0.7% Asian, 0.1% Pacific Islander, 0.9% from other races, and 1.6% from two or more races. Hispanic or Latino of any race were 4.2% of the population.
The median income for a household in the town was $90,938, and the median income for a family was $103,938. The per capita income for the town was $50,938. About 4.2% of families and 5.2% of the population were below the poverty line, including 6.2% of those under age 18 and none of those age 65 or over.
Conclusion
Gulf Stream is a small town located in Palm Beach County, Florida. It is situated on the Atlantic Ocean, just north of Delray Beach and south of Boca Raton. The town is known for its beautiful beaches, lush tropical vegetation, and its laid-back atmosphere. The town’s economy is largely based on tourism and real estate, and the population is largely white. The median income for a household in the town is $90,938, and the median income for a family is $103,938.
Common Questions
What is Per Capita Income in Gulf Stream?
Per Capita income in Gulf Stream is $219,550.
What is the Median Family Income in Gulf Stream?
Median Family Income in Gulf Stream is $250,001.
What is the Median Household income in Gulf Stream?
Median Household Income in Gulf Stream is $227,500.
What is Inequality or Gini Index in Gulf Stream?
Inequality or Gini Index in Gulf Stream is 0.60.
What is the Total Population of Gulf Stream?
Total Population of Gulf Stream is 848.
What is the Total Male Population of Gulf Stream?
Total Male Population of Gulf Stream is 425.
What is the Total Female Population of Gulf Stream?
Total Female Population of Gulf Stream is 423.
What is the Ratio of Males per 100 Females in Gulf Stream?
There are 100.47 Males per 100 Females in Gulf Stream.
What is the Ratio of Females per 100 Males in Gulf Stream?
There are 99.53 Females per 100 Males in Gulf Stream.
What is the Median Population Age in Gulf Stream?
Median Population Age in Gulf Stream is 61.8 Years.
What is the Average Family Size in Gulf Stream
Average Family Size in Gulf Stream is 2.4 People.
What is the Average Household Size in Gulf Stream
Average Household Size in Gulf Stream is 2.2 People.
How Large is the Labor Force in Gulf Stream?
There are 334 People in the Labor Forcein in Gulf Stream.
What is the Percentage of People in the Labor Force in Gulf Stream?
43.3% of People are in the Labor Force in Gulf Stream.
What is the Unemployment Rate in Gulf Stream?
Unemployment Rate in Gulf Stream is 6.0%.