The Villages, FL Map & Demographics
The Villages Map
The Villages Overview
$53,403
PER CAPITA INCOME
$88,649
AVG FAMILY INCOME
$73,415
AVG HOUSEHOLD INCOME
8.5%
WAGE / INCOME GAP [ % ]
91.5¢/ $1
WAGE / INCOME GAP [ $ ]
0.40
INEQUALITY / GINI INDEX
79,108
TOTAL POPULATION
36,443
MALE POPULATION
42,665
FEMALE POPULATION
85.42
MALES / 100 FEMALES
117.07
FEMALES / 100 MALES
73.4
MEDIAN AGE
2.0
AVG FAMILY SIZE
1.7
AVG HOUSEHOLD SIZE
9,145
LABOR FORCE [ PEOPLE ]
11.6%
PERCENT IN LABOR FORCE
2.7%
UNEMPLOYMENT RATE
The Villages Area Codes
Income in The Villages
Income Overview in The Villages
Per Capita Income in The Villages is $53,403, while median incomes of families and households are $88,649 and $73,415 respectively.
| Characteristic | Number | Measure |
| Per Capita Income | 79,108 | $53,403 |
| Median Family Income | 29,704 | $88,649 |
| Mean Family Income | 29,704 | $104,367 |
| Median Household Income | 46,009 | $73,415 |
| Mean Household Income | 46,009 | $92,127 |
| Income Deficit | 29,704 | $0 |
| Wage / Income Gap (%) | 79,108 | 8.49% |
| Wage / Income Gap ($) | 79,108 | 91.51¢ per $1 |
| Gini / Inequality Index | 79,108 | 0.40 |
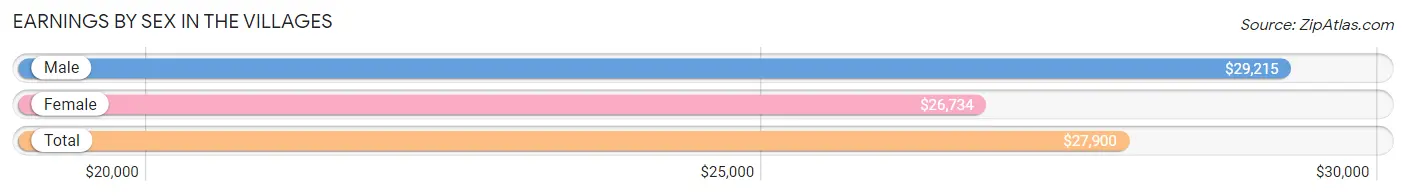
Earnings by Sex in The Villages
Average Earnings in The Villages are $27,900, $29,215 for men and $26,734 for women, a difference of 8.5%.
| Sex | Number | Average Earnings |
| Male | 5,095 (46.1%) | $29,215 |
| Female | 5,956 (53.9%) | $26,734 |
| Total | 11,051 (100.0%) | $27,900 |
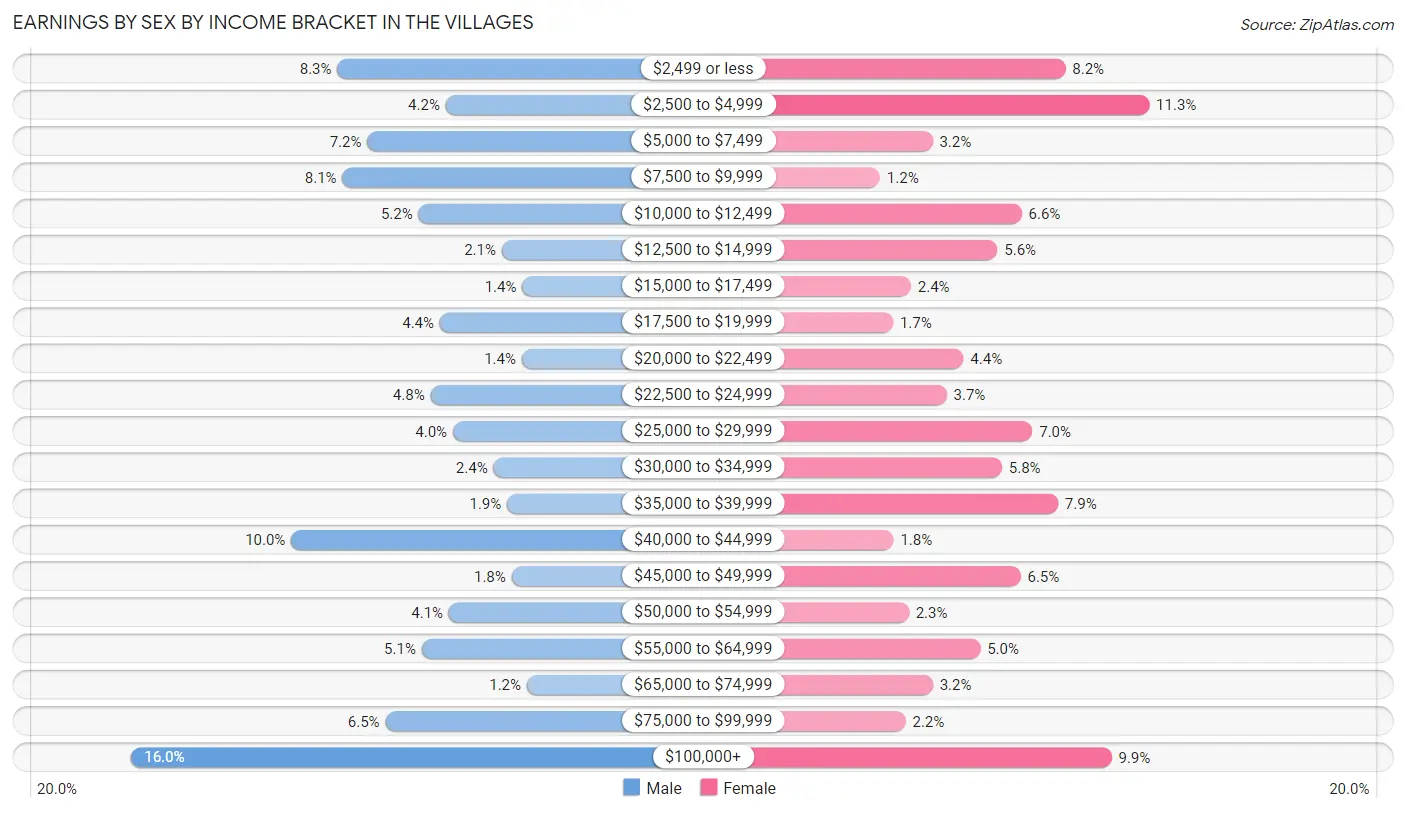
Earnings by Sex by Income Bracket in The Villages
The most common earnings brackets in The Villages are $100,000+ for men (815 | 16.0%) and $2,500 to $4,999 for women (675 | 11.3%).
| Income | Male | Female |
| $2,499 or less | 422 (8.3%) | 488 (8.2%) |
| $2,500 to $4,999 | 215 (4.2%) | 675 (11.3%) |
| $5,000 to $7,499 | 365 (7.2%) | 191 (3.2%) |
| $7,500 to $9,999 | 412 (8.1%) | 74 (1.2%) |
| $10,000 to $12,499 | 267 (5.2%) | 390 (6.6%) |
| $12,500 to $14,999 | 108 (2.1%) | 336 (5.6%) |
| $15,000 to $17,499 | 69 (1.3%) | 143 (2.4%) |
| $17,500 to $19,999 | 226 (4.4%) | 103 (1.7%) |
| $20,000 to $22,499 | 70 (1.4%) | 260 (4.4%) |
| $22,500 to $24,999 | 244 (4.8%) | 223 (3.7%) |
| $25,000 to $29,999 | 201 (4.0%) | 414 (7.0%) |
| $30,000 to $34,999 | 124 (2.4%) | 346 (5.8%) |
| $35,000 to $39,999 | 98 (1.9%) | 471 (7.9%) |
| $40,000 to $44,999 | 510 (10.0%) | 104 (1.8%) |
| $45,000 to $49,999 | 89 (1.8%) | 388 (6.5%) |
| $50,000 to $54,999 | 209 (4.1%) | 138 (2.3%) |
| $55,000 to $64,999 | 261 (5.1%) | 298 (5.0%) |
| $65,000 to $74,999 | 60 (1.2%) | 192 (3.2%) |
| $75,000 to $99,999 | 330 (6.5%) | 131 (2.2%) |
| $100,000+ | 815 (16.0%) | 591 (9.9%) |
| Total | 5,095 (100.0%) | 5,956 (100.0%) |
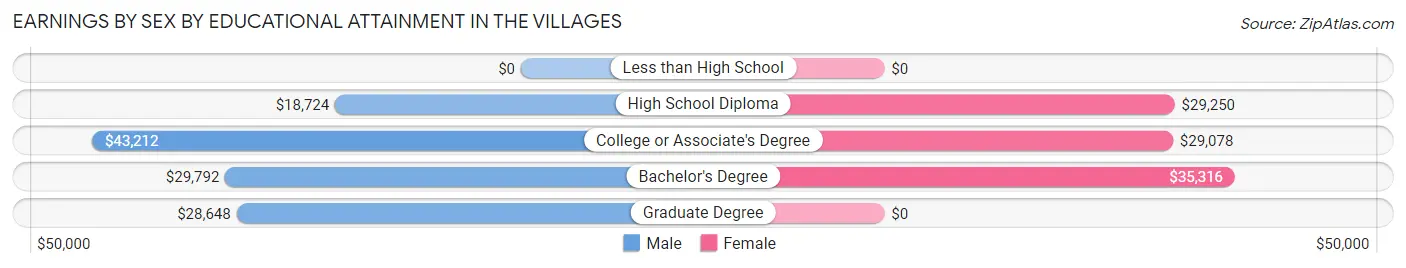
Earnings by Sex by Educational Attainment in The Villages
Average earnings in The Villages are $29,215 for men and $26,633 for women, a difference of 8.8%. Men with an educational attainment of college or associate's degree enjoy the highest average annual earnings of $43,212, while those with high school diploma education earn the least with $18,724. Women with an educational attainment of bachelor's degree earn the most with the average annual earnings of $35,316, while those with college or associate's degree education have the smallest earnings of $29,078.
| Educational Attainment | Male Income | Female Income |
| Less than High School | - | - |
| High School Diploma | $18,724 | $29,250 |
| College or Associate's Degree | $43,212 | $29,078 |
| Bachelor's Degree | $29,792 | $35,316 |
| Graduate Degree | $28,648 | $0 |
| Total | $29,215 | $26,633 |
Family Income in The Villages
Family Income Brackets in The Villages
According to the The Villages family income data, there are 7,277 families falling into the $100,000 to $149,999 income range, which is the most common income bracket and makes up 24.5% of all families. Conversely, the $10,000 to $14,999 income bracket is the least frequent group with only 208 families (0.7%) belonging to this category.
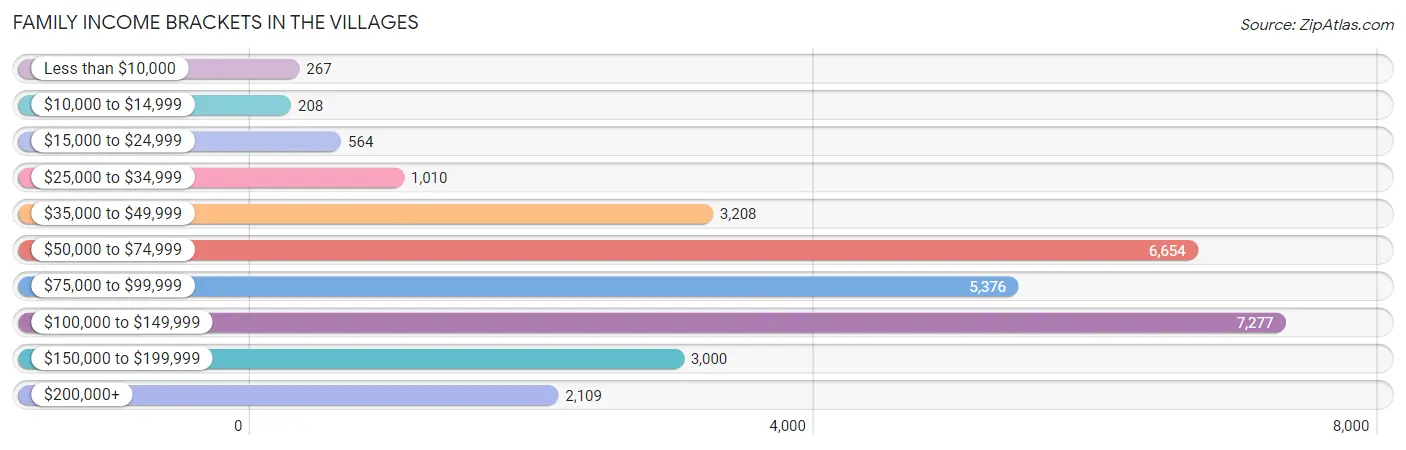
| Income Bracket | # Families | % Families |
| Less than $10,000 | 267 | 0.9% |
| $10,000 to $14,999 | 208 | 0.7% |
| $15,000 to $24,999 | 564 | 1.9% |
| $25,000 to $34,999 | 1,010 | 3.4% |
| $35,000 to $49,999 | 3,208 | 10.8% |
| $50,000 to $74,999 | 6,654 | 22.4% |
| $75,000 to $99,999 | 5,376 | 18.1% |
| $100,000 to $149,999 | 7,277 | 24.5% |
| $150,000 to $199,999 | 3,000 | 10.1% |
| $200,000+ | 2,109 | 7.1% |
Family Income by Famaliy Size in The Villages
4-person families (90 | 0.3%) account for the highest median family income in The Villages with $186,000 per family, while 4-person families (90 | 0.3%) have the highest median income of $46,500 per family member.
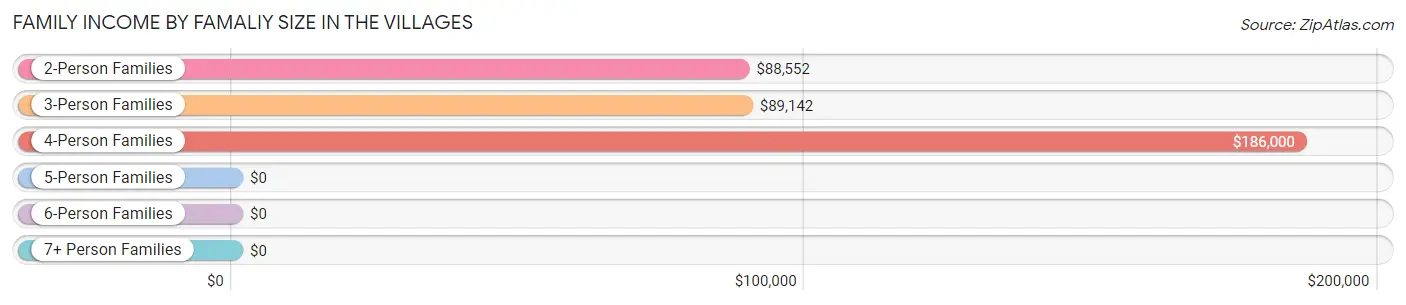
| Income Bracket | # Families | Median Income |
| 2-Person Families | 28,382 (95.6%) | $88,552 |
| 3-Person Families | 1,232 (4.2%) | $89,142 |
| 4-Person Families | 90 (0.3%) | $186,000 |
| 5-Person Families | 0 (0.0%) | $0 |
| 6-Person Families | 0 (0.0%) | $0 |
| 7+ Person Families | 0 (0.0%) | $0 |
| Total | 29,704 (100.0%) | $88,649 |
Family Income by Number of Earners in The Villages
The median family income in The Villages is $88,649, with families comprising 3+ earners (88) having the highest median family income of $197,917, while families with no earners (22,679) have the lowest median family income of $82,935, accounting for 0.3% and 76.3% of families, respectively.
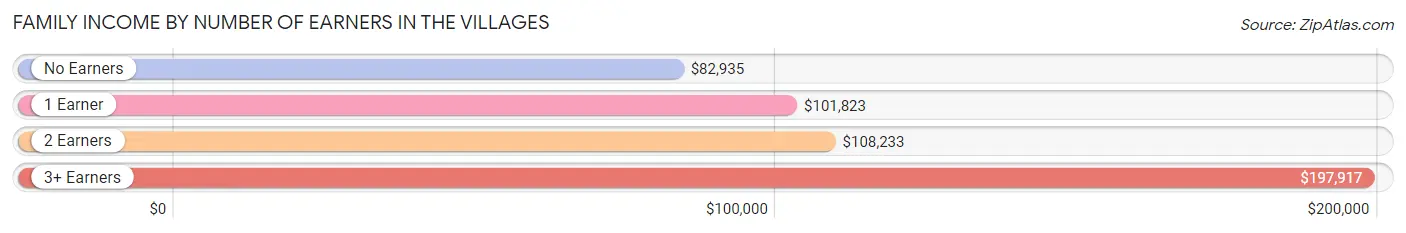
| Number of Earners | # Families | Median Income |
| No Earners | 22,679 (76.3%) | $82,935 |
| 1 Earner | 5,528 (18.6%) | $101,823 |
| 2 Earners | 1,409 (4.7%) | $108,233 |
| 3+ Earners | 88 (0.3%) | $197,917 |
| Total | 29,704 (100.0%) | $88,649 |
Household Income in The Villages
Household Income Brackets in The Villages
With 10,214 households falling in the category, the $50,000 to $74,999 income range is the most frequent in The Villages, accounting for 22.2% of all households. In contrast, only 736 households (1.6%) fall into the $10,000 to $14,999 income bracket, making it the least populous group.
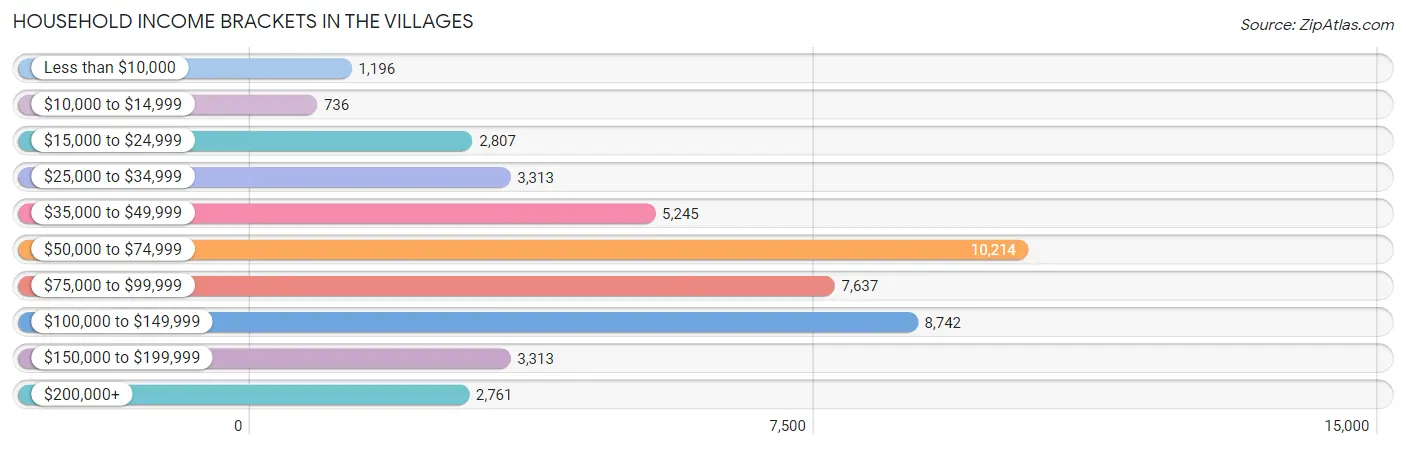
| Income Bracket | # Households | % Households |
| Less than $10,000 | 1,196 | 2.6% |
| $10,000 to $14,999 | 736 | 1.6% |
| $15,000 to $24,999 | 2,807 | 6.1% |
| $25,000 to $34,999 | 3,313 | 7.2% |
| $35,000 to $49,999 | 5,245 | 11.4% |
| $50,000 to $74,999 | 10,214 | 22.2% |
| $75,000 to $99,999 | 7,637 | 16.6% |
| $100,000 to $149,999 | 8,742 | 19.0% |
| $150,000 to $199,999 | 3,313 | 7.2% |
| $200,000+ | 2,761 | 6.0% |
Household Income by Householder Age in The Villages
The median household income in The Villages is $73,415, with the highest median household income of $73,734 found in the 65+ years age bracket for the primary householder. A total of 40,656 households (88.4%) fall into this category.
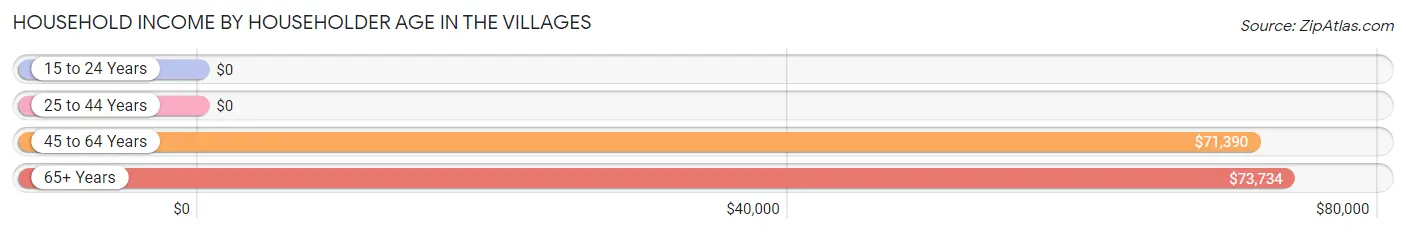
| Income Bracket | # Households | Median Income |
| 15 to 24 Years | 0 (0.0%) | $0 |
| 25 to 44 Years | 122 (0.3%) | $0 |
| 45 to 64 Years | 5,231 (11.4%) | $71,390 |
| 65+ Years | 40,656 (88.4%) | $73,734 |
| Total | 46,009 (100.0%) | $73,415 |
Poverty in The Villages
Income Below Poverty by Sex and Age in The Villages
With 2.6% poverty level for males and 4.6% for females among the residents of The Villages, 18 to 24 year old males and 45 to 54 year old females are the most vulnerable to poverty, with 17 males (100.0%) and 180 females (19.7%) in their respective age groups living below the poverty level.
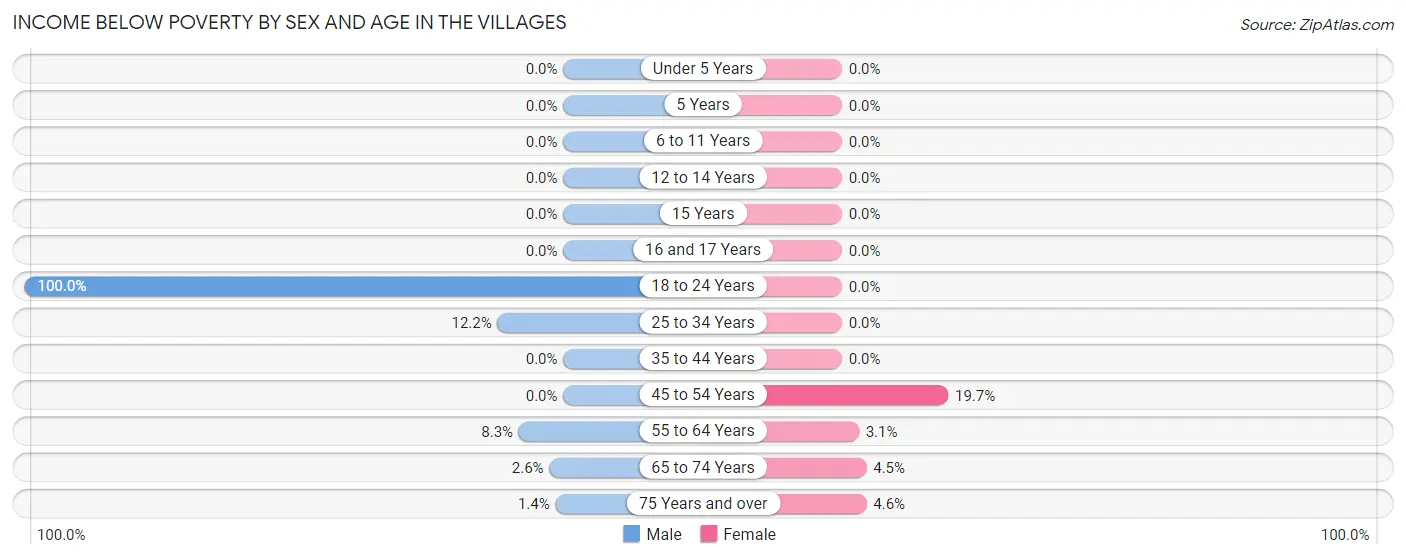
| Age Bracket | Male | Female |
| Under 5 Years | 0 (0.0%) | 0 (0.0%) |
| 5 Years | 0 (0.0%) | 0 (0.0%) |
| 6 to 11 Years | 0 (0.0%) | 0 (0.0%) |
| 12 to 14 Years | 0 (0.0%) | 0 (0.0%) |
| 15 Years | 0 (0.0%) | 0 (0.0%) |
| 16 and 17 Years | 0 (0.0%) | 0 (0.0%) |
| 18 to 24 Years | 17 (100.0%) | 0 (0.0%) |
| 25 to 34 Years | 26 (12.2%) | 0 (0.0%) |
| 35 to 44 Years | 0 (0.0%) | 0 (0.0%) |
| 45 to 54 Years | 0 (0.0%) | 180 (19.7%) |
| 55 to 64 Years | 289 (8.3%) | 154 (3.1%) |
| 65 to 74 Years | 392 (2.6%) | 933 (4.5%) |
| 75 Years and over | 237 (1.4%) | 713 (4.5%) |
| Total | 961 (2.6%) | 1,980 (4.6%) |
Income Above Poverty by Sex and Age in The Villages
According to the poverty statistics in The Villages, males aged under 5 years and females aged under 5 years are the age groups that are most secure financially, with 100.0% of males and 100.0% of females in these age groups living above the poverty line.
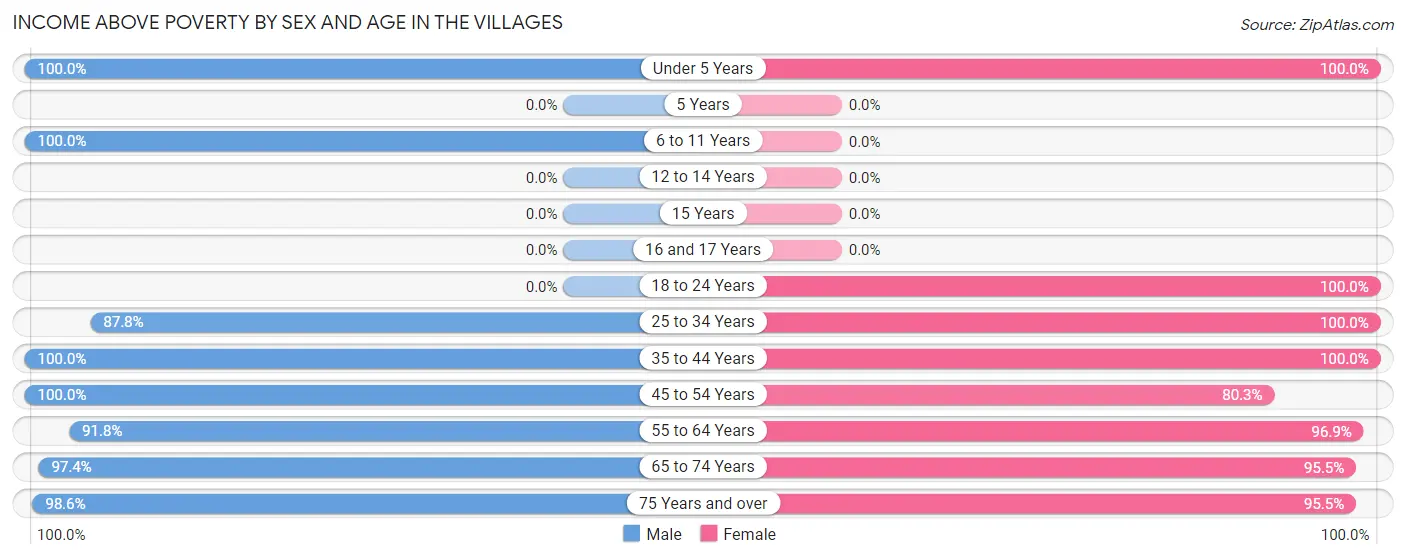
| Age Bracket | Male | Female |
| Under 5 Years | 39 (100.0%) | 58 (100.0%) |
| 5 Years | 0 (0.0%) | 0 (0.0%) |
| 6 to 11 Years | 132 (100.0%) | 0 (0.0%) |
| 12 to 14 Years | 0 (0.0%) | 0 (0.0%) |
| 15 Years | 0 (0.0%) | 0 (0.0%) |
| 16 and 17 Years | 0 (0.0%) | 0 (0.0%) |
| 18 to 24 Years | 0 (0.0%) | 67 (100.0%) |
| 25 to 34 Years | 187 (87.8%) | 175 (100.0%) |
| 35 to 44 Years | 287 (100.0%) | 228 (100.0%) |
| 45 to 54 Years | 559 (100.0%) | 733 (80.3%) |
| 55 to 64 Years | 3,216 (91.7%) | 4,748 (96.9%) |
| 65 to 74 Years | 14,794 (97.4%) | 19,623 (95.5%) |
| 75 Years and over | 16,251 (98.6%) | 14,962 (95.5%) |
| Total | 35,465 (97.4%) | 40,594 (95.4%) |
Income Below Poverty Among Married-Couple Families in The Villages
The poverty statistics for married-couple families in The Villages show that 1.5% or 441 of the total 28,671 families live below the poverty line. Families with no children have the highest poverty rate of 1.5%, comprising of 441 families. On the other hand, families with 1 or 2 children have the lowest poverty rate of 0.0%, which includes 0 families.
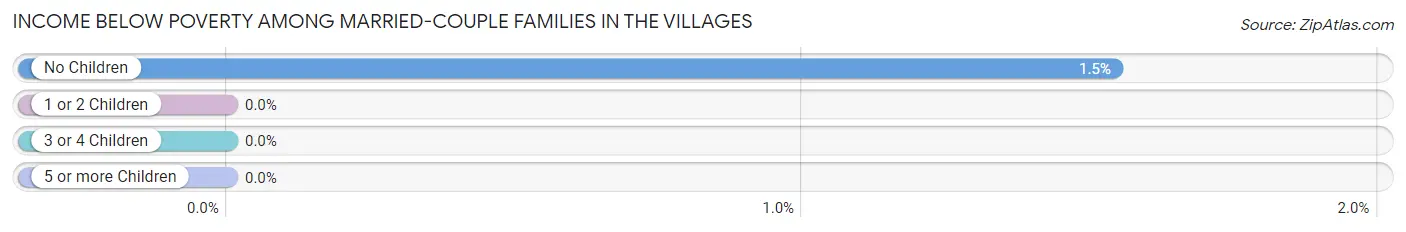
| Children | Above Poverty | Below Poverty |
| No Children | 28,195 (98.5%) | 441 (1.5%) |
| 1 or 2 Children | 35 (100.0%) | 0 (0.0%) |
| 3 or 4 Children | 0 (0.0%) | 0 (0.0%) |
| 5 or more Children | 0 (0.0%) | 0 (0.0%) |
| Total | 28,230 (98.5%) | 441 (1.5%) |
Income Below Poverty Among Single-Parent Households in The Villages
According to the poverty data in The Villages, 5.6% or 16 single-father households and 9.6% or 72 single-mother households are living below the poverty line. Among single-father households, those with no children have the highest poverty rate, with 16 households (7.4%) experiencing poverty. Likewise, among single-mother households, those with no children have the highest poverty rate, with 72 households (9.6%) falling below the poverty line.
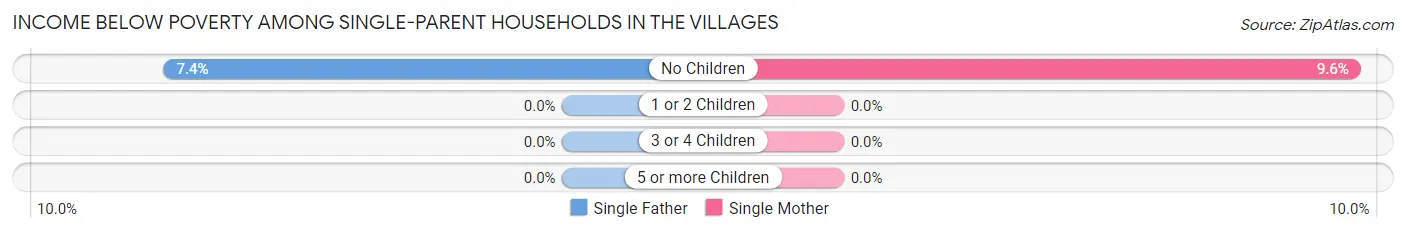
| Children | Single Father | Single Mother |
| No Children | 16 (7.4%) | 72 (9.6%) |
| 1 or 2 Children | 0 (0.0%) | 0 (0.0%) |
| 3 or 4 Children | 0 (0.0%) | 0 (0.0%) |
| 5 or more Children | 0 (0.0%) | 0 (0.0%) |
| Total | 16 (5.6%) | 72 (9.6%) |
Income Below Poverty Among Married-Couple vs Single-Parent Households in The Villages
The poverty data for The Villages shows that 441 of the married-couple family households (1.5%) and 88 of the single-parent households (8.5%) are living below the poverty level. Within the married-couple family households, those with no children have the highest poverty rate, with 441 households (1.5%) falling below the poverty line. Among the single-parent households, those with no children have the highest poverty rate, with 88 household (9.1%) living below poverty.
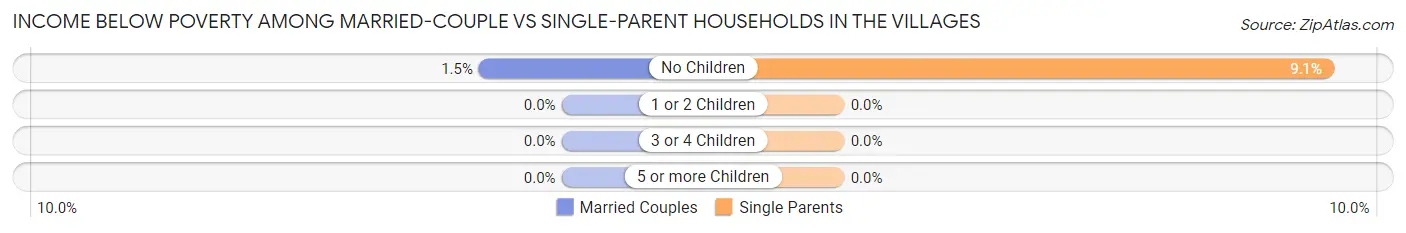
| Children | Married-Couple Families | Single-Parent Households |
| No Children | 441 (1.5%) | 88 (9.1%) |
| 1 or 2 Children | 0 (0.0%) | 0 (0.0%) |
| 3 or 4 Children | 0 (0.0%) | 0 (0.0%) |
| 5 or more Children | 0 (0.0%) | 0 (0.0%) |
| Total | 441 (1.5%) | 88 (8.5%) |
Race in The Villages
The most populous races in The Villages are White / Caucasian (77,078 | 97.4%), Hispanic or Latino (1,133 | 1.4%), and Two or more Races (985 | 1.3%).
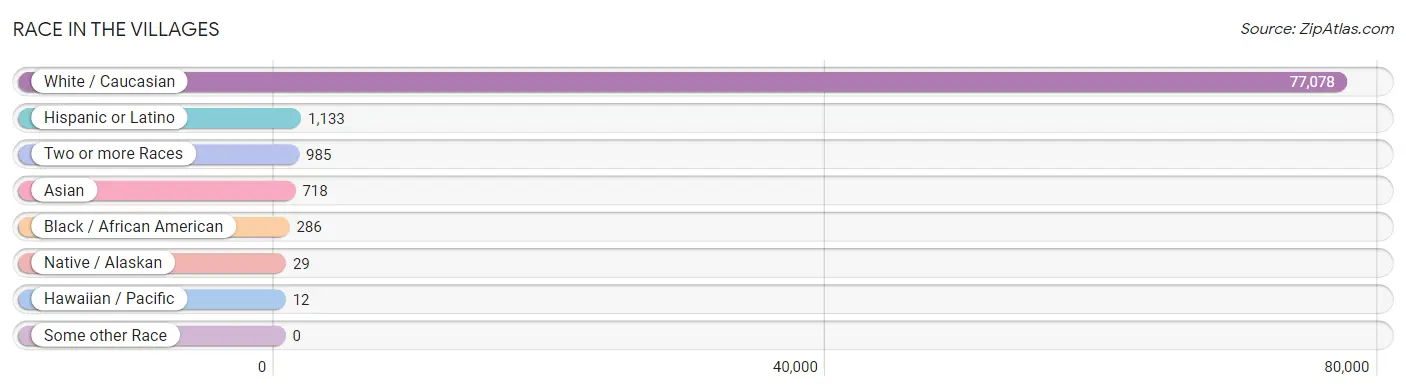
| Race | # Population | % Population |
| Asian | 718 | 0.9% |
| Black / African American | 286 | 0.4% |
| Hawaiian / Pacific | 12 | 0.0% |
| Hispanic or Latino | 1,133 | 1.4% |
| Native / Alaskan | 29 | 0.0% |
| White / Caucasian | 77,078 | 97.4% |
| Two or more Races | 985 | 1.3% |
| Some other Race | 0 | 0.0% |
| Total | 79,108 | 100.0% |
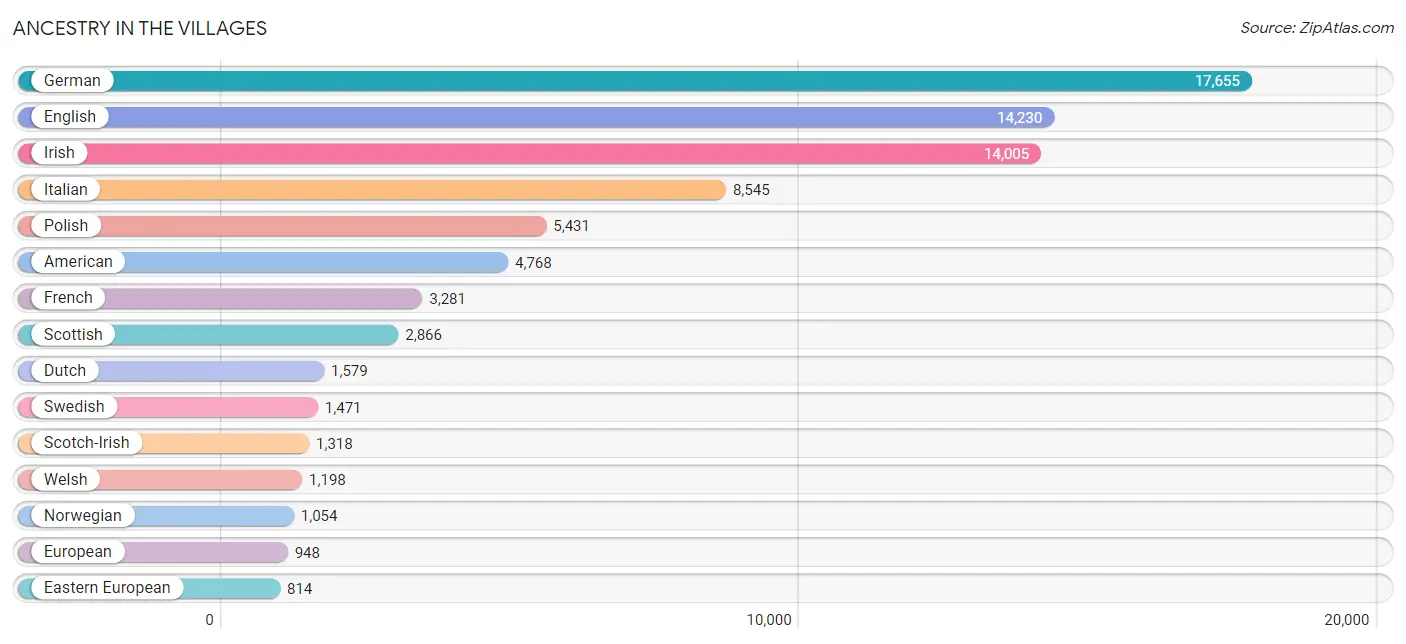
Ancestry in The Villages
The most populous ancestries reported in The Villages are German (17,655 | 22.3%), English (14,230 | 18.0%), Irish (14,005 | 17.7%), Italian (8,545 | 10.8%), and Polish (5,431 | 6.9%), together accounting for 75.7% of all The Villages residents.
| Ancestry | # Population | % Population |
| African | 47 | 0.1% |
| American | 4,768 | 6.0% |
| Arab | 168 | 0.2% |
| Australian | 8 | 0.0% |
| Austrian | 451 | 0.6% |
| Bahamian | 8 | 0.0% |
| Belgian | 245 | 0.3% |
| Bhutanese | 29 | 0.0% |
| British | 784 | 1.0% |
| Bulgarian | 28 | 0.0% |
| Burmese | 113 | 0.1% |
| Canadian | 558 | 0.7% |
| Central American | 15 | 0.0% |
| Cherokee | 82 | 0.1% |
| Colombian | 22 | 0.0% |
| Costa Rican | 15 | 0.0% |
| Croatian | 88 | 0.1% |
| Cuban | 286 | 0.4% |
| Czech | 255 | 0.3% |
| Czechoslovakian | 131 | 0.2% |
| Danish | 440 | 0.6% |
| Dutch | 1,579 | 2.0% |
| Eastern European | 814 | 1.0% |
| Egyptian | 95 | 0.1% |
| English | 14,230 | 18.0% |
| European | 948 | 1.2% |
| Finnish | 186 | 0.2% |
| French | 3,281 | 4.2% |
| French Canadian | 790 | 1.0% |
| German | 17,655 | 22.3% |
| Greek | 413 | 0.5% |
| Hungarian | 546 | 0.7% |
| Indian (Asian) | 67 | 0.1% |
| Irish | 14,005 | 17.7% |
| Israeli | 14 | 0.0% |
| Italian | 8,545 | 10.8% |
| Korean | 465 | 0.6% |
| Latvian | 109 | 0.1% |
| Lebanese | 38 | 0.1% |
| Lithuanian | 332 | 0.4% |
| Luxembourger | 58 | 0.1% |
| Maltese | 54 | 0.1% |
| Mexican | 164 | 0.2% |
| Native Hawaiian | 41 | 0.1% |
| Nigerian | 52 | 0.1% |
| Northern European | 388 | 0.5% |
| Norwegian | 1,054 | 1.3% |
| Pakistani | 62 | 0.1% |
| Pennsylvania German | 106 | 0.1% |
| Peruvian | 209 | 0.3% |
| Polish | 5,431 | 6.9% |
| Portuguese | 67 | 0.1% |
| Puerto Rican | 327 | 0.4% |
| Romanian | 22 | 0.0% |
| Russian | 801 | 1.0% |
| Scandinavian | 307 | 0.4% |
| Scotch-Irish | 1,318 | 1.7% |
| Scottish | 2,866 | 3.6% |
| Serbian | 75 | 0.1% |
| Slavic | 125 | 0.2% |
| Slovak | 411 | 0.5% |
| Slovene | 63 | 0.1% |
| South American | 282 | 0.4% |
| Spaniard | 12 | 0.0% |
| Spanish | 47 | 0.1% |
| Sri Lankan | 49 | 0.1% |
| Subsaharan African | 99 | 0.1% |
| Swedish | 1,471 | 1.9% |
| Swiss | 327 | 0.4% |
| Syrian | 35 | 0.0% |
| Thai | 28 | 0.0% |
| Ukrainian | 755 | 0.9% |
| Venezuelan | 51 | 0.1% |
| Welsh | 1,198 | 1.5% |
| Yugoslavian | 31 | 0.0% | View All 75 Rows |
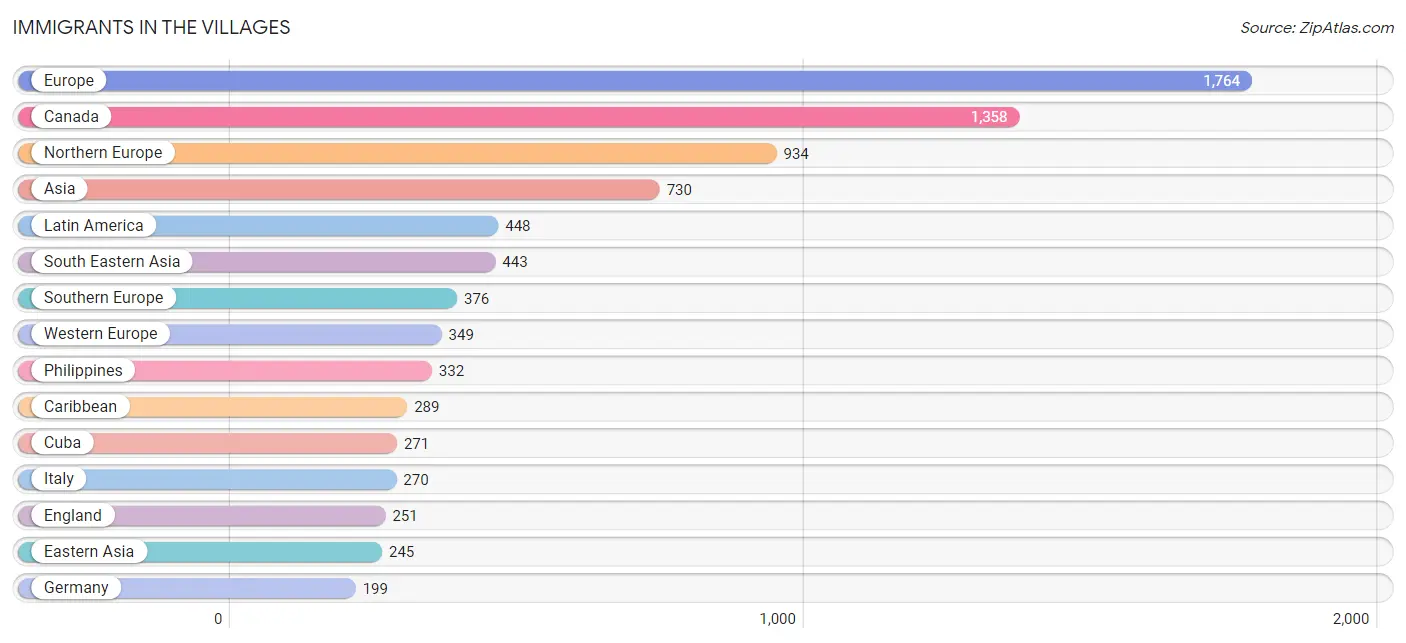
Immigrants in The Villages
The most numerous immigrant groups reported in The Villages came from Europe (1,764 | 2.2%), Canada (1,358 | 1.7%), Northern Europe (934 | 1.2%), Asia (730 | 0.9%), and Latin America (448 | 0.6%), together accounting for 6.6% of all The Villages residents.
| Immigration Origin | # Population | % Population |
| Africa | 108 | 0.1% |
| Asia | 730 | 0.9% |
| Austria | 48 | 0.1% |
| Canada | 1,358 | 1.7% |
| Caribbean | 289 | 0.4% |
| Central America | 52 | 0.1% |
| China | 77 | 0.1% |
| Colombia | 22 | 0.0% |
| Costa Rica | 15 | 0.0% |
| Cuba | 271 | 0.3% |
| Czechoslovakia | 53 | 0.1% |
| Denmark | 48 | 0.1% |
| Eastern Asia | 245 | 0.3% |
| Eastern Europe | 105 | 0.1% |
| Egypt | 95 | 0.1% |
| England | 251 | 0.3% |
| Europe | 1,764 | 2.2% |
| Germany | 199 | 0.3% |
| Greece | 52 | 0.1% |
| Haiti | 18 | 0.0% |
| Honduras | 15 | 0.0% |
| Hong Kong | 53 | 0.1% |
| India | 28 | 0.0% |
| Ireland | 49 | 0.1% |
| Israel | 14 | 0.0% |
| Italy | 270 | 0.3% |
| Japan | 58 | 0.1% |
| Korea | 110 | 0.1% |
| Latin America | 448 | 0.6% |
| Mexico | 22 | 0.0% |
| Netherlands | 80 | 0.1% |
| Northern Africa | 95 | 0.1% |
| Northern Europe | 934 | 1.2% |
| Norway | 15 | 0.0% |
| Peru | 85 | 0.1% |
| Philippines | 332 | 0.4% |
| Romania | 15 | 0.0% |
| Scotland | 20 | 0.0% |
| South Africa | 13 | 0.0% |
| South America | 107 | 0.1% |
| South Central Asia | 28 | 0.0% |
| South Eastern Asia | 443 | 0.6% |
| Southern Europe | 376 | 0.5% |
| Sweden | 44 | 0.1% |
| Switzerland | 22 | 0.0% |
| Thailand | 62 | 0.1% |
| Ukraine | 37 | 0.1% |
| Vietnam | 49 | 0.1% |
| Western Asia | 14 | 0.0% |
| Western Europe | 349 | 0.4% | View All 50 Rows |
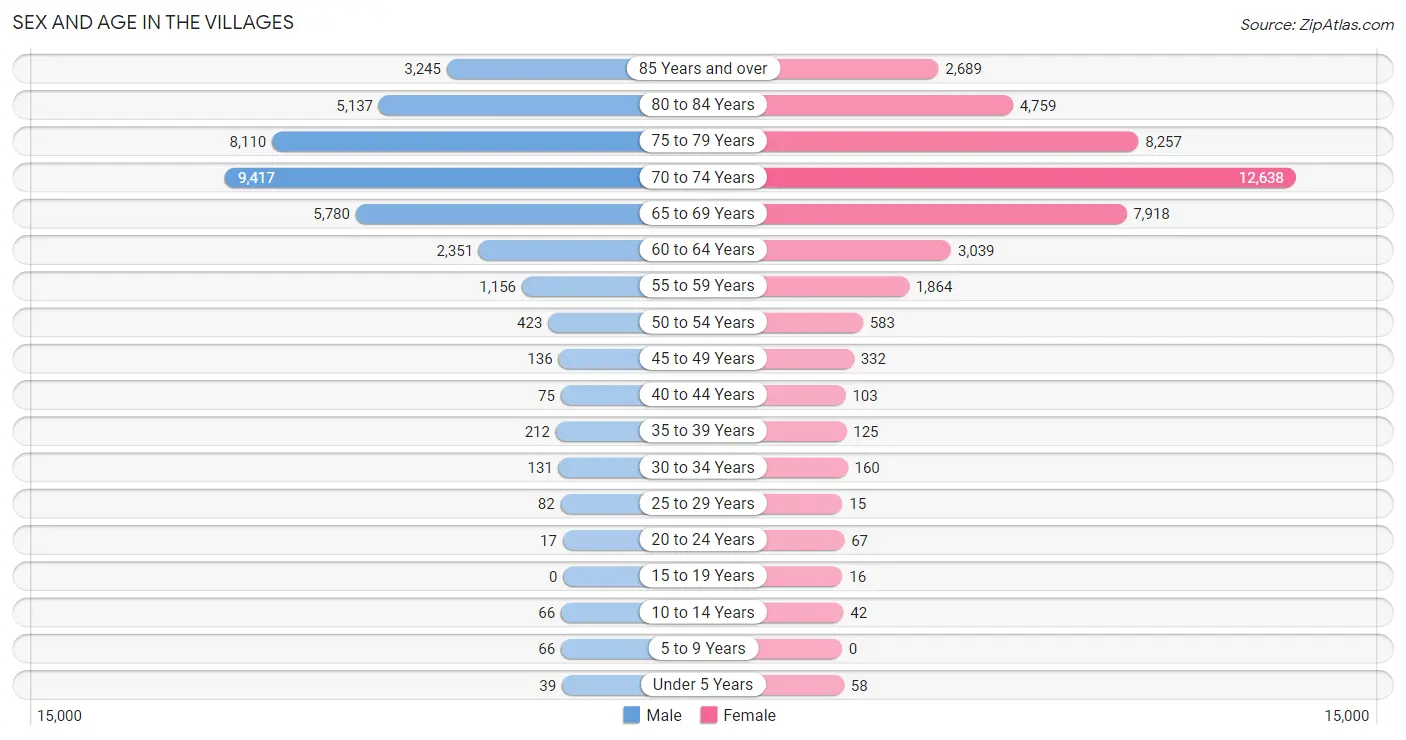
Sex and Age in The Villages
Sex and Age in The Villages
The most populous age groups in The Villages are 70 to 74 Years (9,417 | 25.8%) for men and 70 to 74 Years (12,638 | 29.6%) for women.
| Age Bracket | Male | Female |
| Under 5 Years | 39 (0.1%) | 58 (0.1%) |
| 5 to 9 Years | 66 (0.2%) | 0 (0.0%) |
| 10 to 14 Years | 66 (0.2%) | 42 (0.1%) |
| 15 to 19 Years | 0 (0.0%) | 16 (0.0%) |
| 20 to 24 Years | 17 (0.1%) | 67 (0.2%) |
| 25 to 29 Years | 82 (0.2%) | 15 (0.0%) |
| 30 to 34 Years | 131 (0.4%) | 160 (0.4%) |
| 35 to 39 Years | 212 (0.6%) | 125 (0.3%) |
| 40 to 44 Years | 75 (0.2%) | 103 (0.2%) |
| 45 to 49 Years | 136 (0.4%) | 332 (0.8%) |
| 50 to 54 Years | 423 (1.2%) | 583 (1.4%) |
| 55 to 59 Years | 1,156 (3.2%) | 1,864 (4.4%) |
| 60 to 64 Years | 2,351 (6.5%) | 3,039 (7.1%) |
| 65 to 69 Years | 5,780 (15.9%) | 7,918 (18.6%) |
| 70 to 74 Years | 9,417 (25.8%) | 12,638 (29.6%) |
| 75 to 79 Years | 8,110 (22.3%) | 8,257 (19.4%) |
| 80 to 84 Years | 5,137 (14.1%) | 4,759 (11.2%) |
| 85 Years and over | 3,245 (8.9%) | 2,689 (6.3%) |
| Total | 36,443 (100.0%) | 42,665 (100.0%) |
Families and Households in The Villages
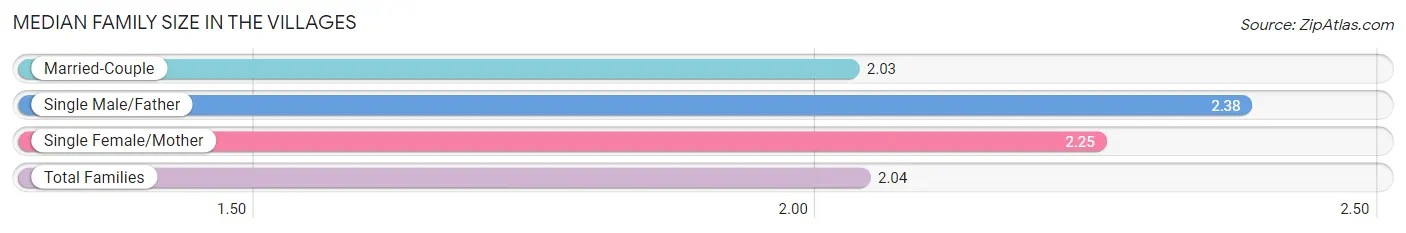
Median Family Size in The Villages
The median family size in The Villages is 2.04 persons per family, with single male/father families (285 | 1.0%) accounting for the largest median family size of 2.38 persons per family. On the other hand, married-couple families (28,671 | 96.5%) represent the smallest median family size with 2.03 persons per family.
| Family Type | # Families | Family Size |
| Married-Couple | 28,671 (96.5%) | 2.03 |
| Single Male/Father | 285 (1.0%) | 2.38 |
| Single Female/Mother | 748 (2.5%) | 2.25 |
| Total Families | 29,704 (100.0%) | 2.04 |
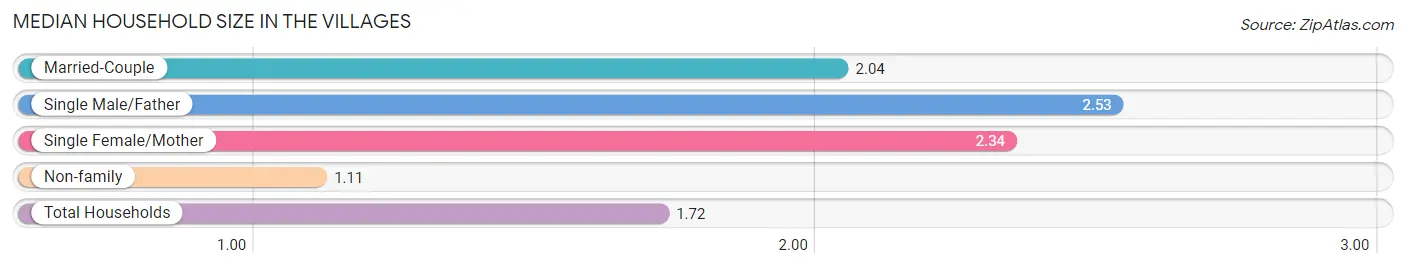
Median Household Size in The Villages
The median household size in The Villages is 1.72 persons per household, with single male/father households (285 | 0.6%) accounting for the largest median household size of 2.53 persons per household. non-family households (16,305 | 35.4%) represent the smallest median household size with 1.11 persons per household.
| Household Type | # Households | Household Size |
| Married-Couple | 28,671 (62.3%) | 2.04 |
| Single Male/Father | 285 (0.6%) | 2.53 |
| Single Female/Mother | 748 (1.6%) | 2.34 |
| Non-family | 16,305 (35.4%) | 1.11 |
| Total Households | 46,009 (100.0%) | 1.72 |
Household Size by Marriage Status in The Villages
Out of a total of 46,009 households in The Villages, 29,704 (64.6%) are family households, while 16,305 (35.4%) are nonfamily households. The most numerous type of family households are 2-person households, comprising 28,186, and the most common type of nonfamily households are 1-person households, comprising 14,543.
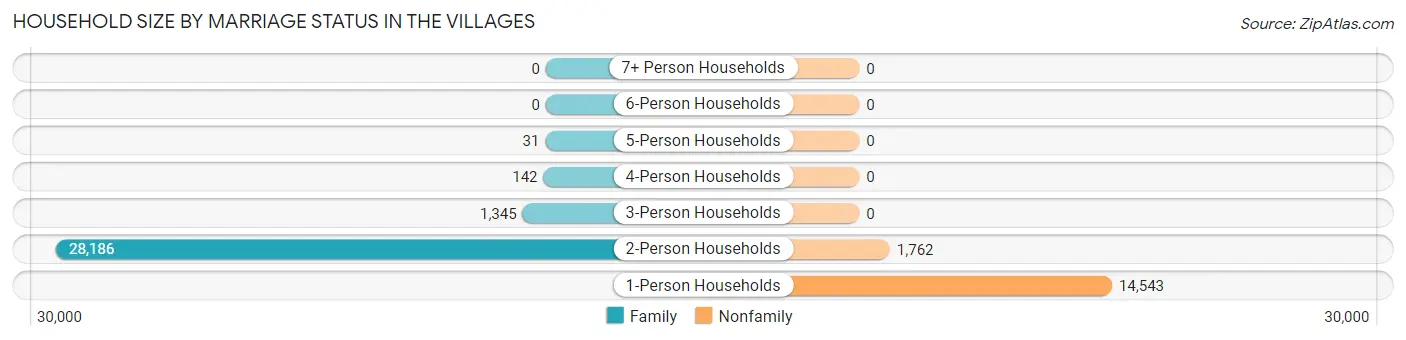
| Household Size | Family Households | Nonfamily Households |
| 1-Person Households | - | 14,543 (31.6%) |
| 2-Person Households | 28,186 (61.3%) | 1,762 (3.8%) |
| 3-Person Households | 1,345 (2.9%) | 0 (0.0%) |
| 4-Person Households | 142 (0.3%) | 0 (0.0%) |
| 5-Person Households | 31 (0.1%) | 0 (0.0%) |
| 6-Person Households | 0 (0.0%) | 0 (0.0%) |
| 7+ Person Households | 0 (0.0%) | 0 (0.0%) |
| Total | 29,704 (64.6%) | 16,305 (35.4%) |
Female Fertility in The Villages
Fertility by Age in The Villages
| Age Bracket | Women with Births | Births / 1,000 Women |
| 15 to 19 years | 0 (0.0%) | 0.0 |
| 20 to 34 years | 0 (0.0%) | 0.0 |
| 35 to 50 years | 0 (0.0%) | 0.0 |
| Total | 0 (0.0%) | 0.0 |
Fertility by Age by Marriage Status in The Villages
| Age Bracket | Married | Unmarried |
| 15 to 19 years | 0 (0.0%) | 0 (0.0%) |
| 20 to 34 years | 0 (0.0%) | 0 (0.0%) |
| 35 to 50 years | 0 (0.0%) | 0 (0.0%) |
| Total | 0 (0.0%) | 0 (0.0%) |
Fertility by Education in The Villages
| Educational Attainment | Women with Births | Births / 1,000 Women |
| Less than High School | 0 (0.0%) | 0.0 |
| High School Diploma | 0 (0.0%) | 0.0 |
| College or Associate's Degree | 0 (0.0%) | 0.0 |
| Bachelor's Degree | 0 (0.0%) | 0.0 |
| Graduate Degree | 0 (0.0%) | 0.0 |
| Total | 0 (0.0%) | 0.0 |
Fertility by Education by Marriage Status in The Villages
| Educational Attainment | Married | Unmarried |
| Less than High School | 0 (0.0%) | 0 (0.0%) |
| High School Diploma | 0 (0.0%) | 0 (0.0%) |
| College or Associate's Degree | 0 (0.0%) | 0 (0.0%) |
| Bachelor's Degree | 0 (0.0%) | 0 (0.0%) |
| Graduate Degree | 0 (0.0%) | 0 (0.0%) |
| Total | 0 (0.0%) | 0 (0.0%) |
Employment Characteristics in The Villages
Employment by Class of Employer in The Villages
Among the 8,617 employed individuals in The Villages, private company employees (6,006 | 69.7%), self-employed (incorporated) (687 | 8.0%), and self-employed (not incorporated) (639 | 7.4%) make up the most common classes of employment.
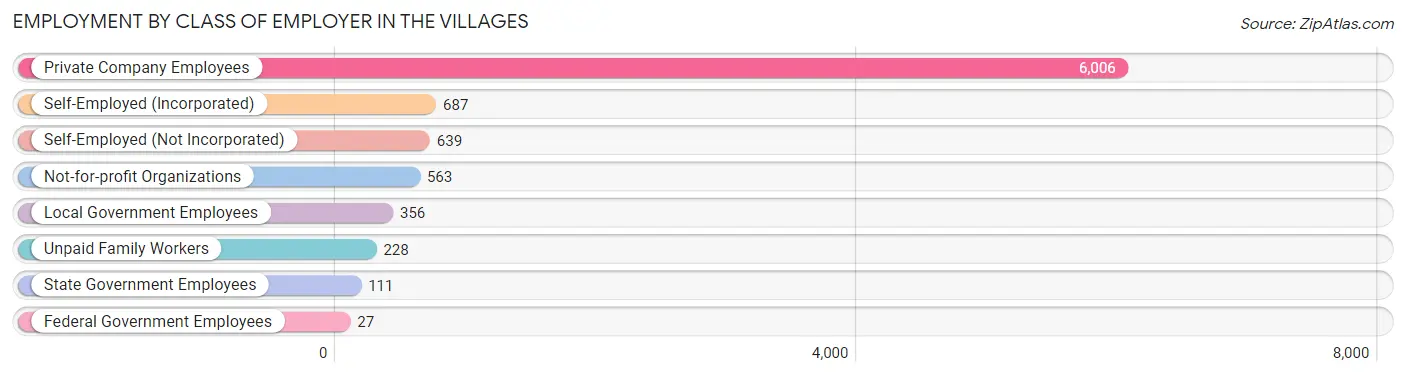
| Employer Class | # Employees | % Employees |
| Private Company Employees | 6,006 | 69.7% |
| Self-Employed (Incorporated) | 687 | 8.0% |
| Self-Employed (Not Incorporated) | 639 | 7.4% |
| Not-for-profit Organizations | 563 | 6.5% |
| Local Government Employees | 356 | 4.1% |
| State Government Employees | 111 | 1.3% |
| Federal Government Employees | 27 | 0.3% |
| Unpaid Family Workers | 228 | 2.6% |
| Total | 8,617 | 100.0% |
Employment Status by Age in The Villages
According to the labor force statistics for The Villages, out of the total population over 16 years of age (78,837), 11.6% or 9,145 individuals are in the labor force, with 2.7% or 247 of them unemployed. The age group with the highest labor force participation rate is 16 to 19 years, with 100.0% or 16 individuals in the labor force. Within the labor force, the 20 to 24 years age range has the highest percentage of unemployed individuals, with 20.2% or 17 of them being unemployed.
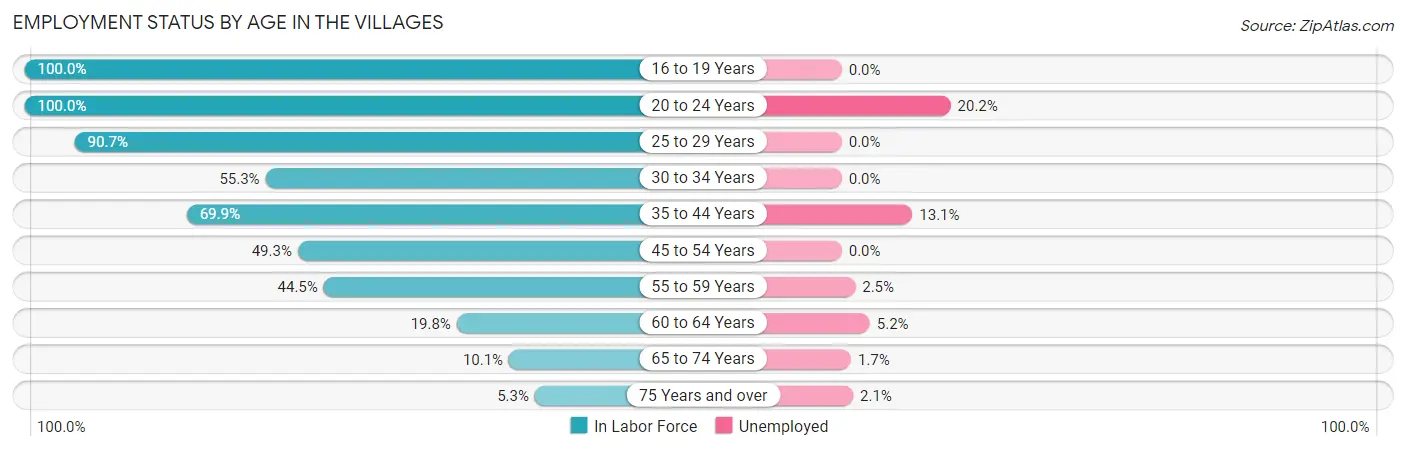
| Age Bracket | In Labor Force | Unemployed |
| 16 to 19 Years | 16 (100.0%) | 0 (0.0%) |
| 20 to 24 Years | 84 (100.0%) | 17 (20.2%) |
| 25 to 29 Years | 88 (90.7%) | 0 (0.0%) |
| 30 to 34 Years | 161 (55.3%) | 0 (0.0%) |
| 35 to 44 Years | 360 (69.9%) | 47 (13.1%) |
| 45 to 54 Years | 727 (49.3%) | 0 (0.0%) |
| 55 to 59 Years | 1,344 (44.5%) | 34 (2.5%) |
| 60 to 64 Years | 1,067 (19.8%) | 55 (5.2%) |
| 65 to 74 Years | 3,611 (10.1%) | 61 (1.7%) |
| 75 Years and over | 1,706 (5.3%) | 36 (2.1%) |
| Total | 9,145 (11.6%) | 247 (2.7%) |
Employment Status by Educational Attainment in The Villages
According to labor force statistics for The Villages, 34.7% of individuals (3,743) out of the total population between 25 and 64 years of age (10,787) are in the labor force, with 3.7% or 138 of them being unemployed. The group with the highest labor force participation rate are those with the educational attainment of bachelor's degree or higher, with 39.9% or 1,626 individuals in the labor force. Within the labor force, individuals with high school diploma education have the highest percentage of unemployment, with 5.1% or 34 of them being unemployed.
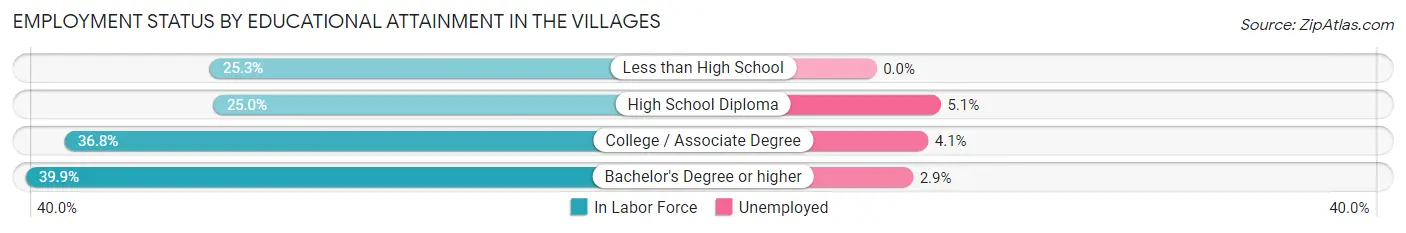
| Educational Attainment | In Labor Force | Unemployed |
| Less than High School | 81 (25.3%) | 0 (0.0%) |
| High School Diploma | 664 (25.0%) | 136 (5.1%) |
| College / Associate Degree | 1,374 (36.8%) | 153 (4.1%) |
| Bachelor's Degree or higher | 1,626 (39.9%) | 118 (2.9%) |
| Total | 3,743 (34.7%) | 399 (3.7%) |
Employment Occupations by Sex in The Villages
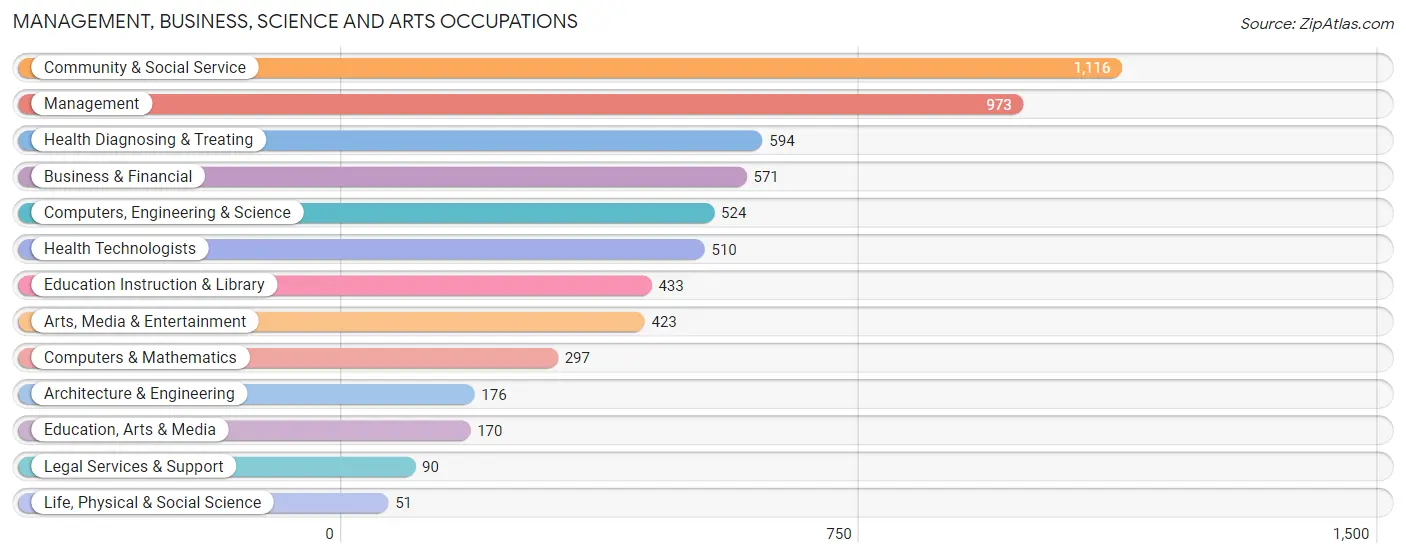
Management, Business, Science and Arts Occupations
The most common Management, Business, Science and Arts occupations in The Villages are Community & Social Service (1,116 | 12.5%), Management (973 | 10.9%), Health Diagnosing & Treating (594 | 6.7%), Business & Financial (571 | 6.4%), and Computers, Engineering & Science (524 | 5.9%).
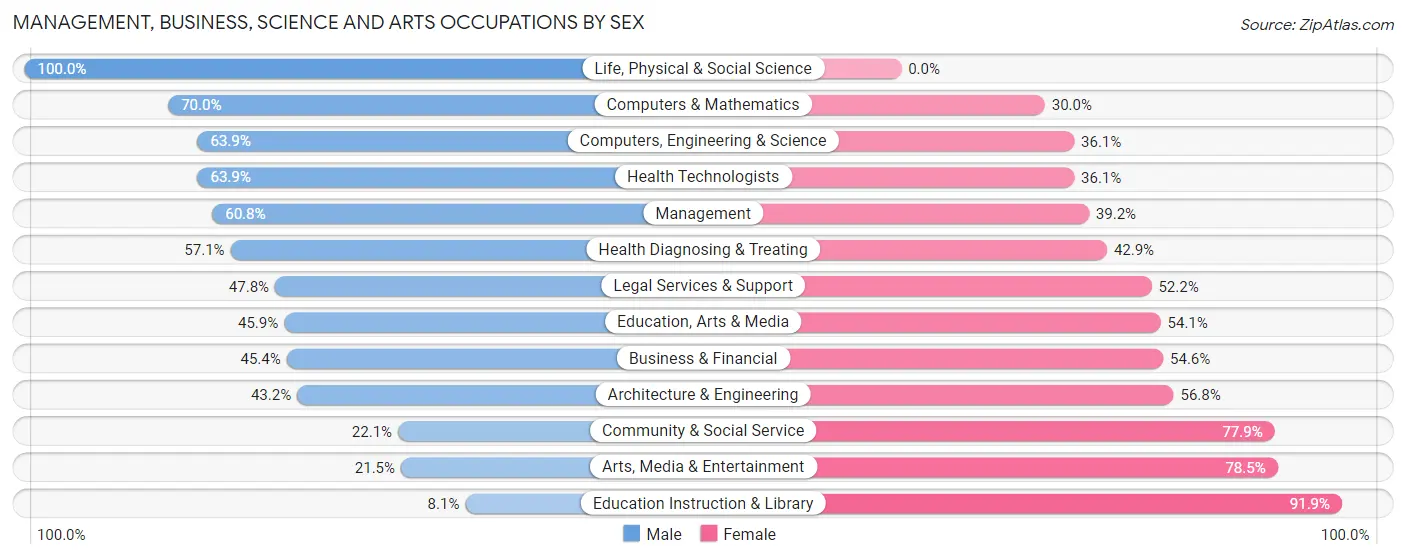
Management, Business, Science and Arts Occupations by Sex
Within the Management, Business, Science and Arts occupations in The Villages, the most male-oriented occupations are Life, Physical & Social Science (100.0%), Computers & Mathematics (70.0%), and Computers, Engineering & Science (63.9%), while the most female-oriented occupations are Education Instruction & Library (91.9%), Arts, Media & Entertainment (78.5%), and Community & Social Service (77.9%).
| Occupation | Male | Female |
| Management | 592 (60.8%) | 381 (39.2%) |
| Business & Financial | 259 (45.4%) | 312 (54.6%) |
| Computers, Engineering & Science | 335 (63.9%) | 189 (36.1%) |
| Computers & Mathematics | 208 (70.0%) | 89 (30.0%) |
| Architecture & Engineering | 76 (43.2%) | 100 (56.8%) |
| Life, Physical & Social Science | 51 (100.0%) | 0 (0.0%) |
| Community & Social Service | 247 (22.1%) | 869 (77.9%) |
| Education, Arts & Media | 78 (45.9%) | 92 (54.1%) |
| Legal Services & Support | 43 (47.8%) | 47 (52.2%) |
| Education Instruction & Library | 35 (8.1%) | 398 (91.9%) |
| Arts, Media & Entertainment | 91 (21.5%) | 332 (78.5%) |
| Health Diagnosing & Treating | 339 (57.1%) | 255 (42.9%) |
| Health Technologists | 326 (63.9%) | 184 (36.1%) |
| Total (Category) | 1,772 (46.9%) | 2,006 (53.1%) |
| Total (Overall) | 4,306 (48.4%) | 4,597 (51.6%) |
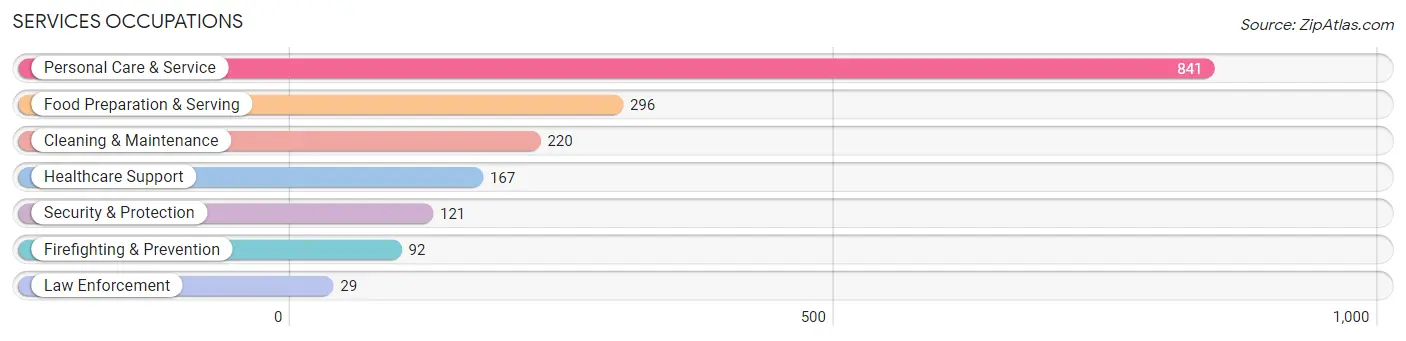
Services Occupations
The most common Services occupations in The Villages are Personal Care & Service (841 | 9.5%), Food Preparation & Serving (296 | 3.3%), Cleaning & Maintenance (220 | 2.5%), Healthcare Support (167 | 1.9%), and Security & Protection (121 | 1.4%).
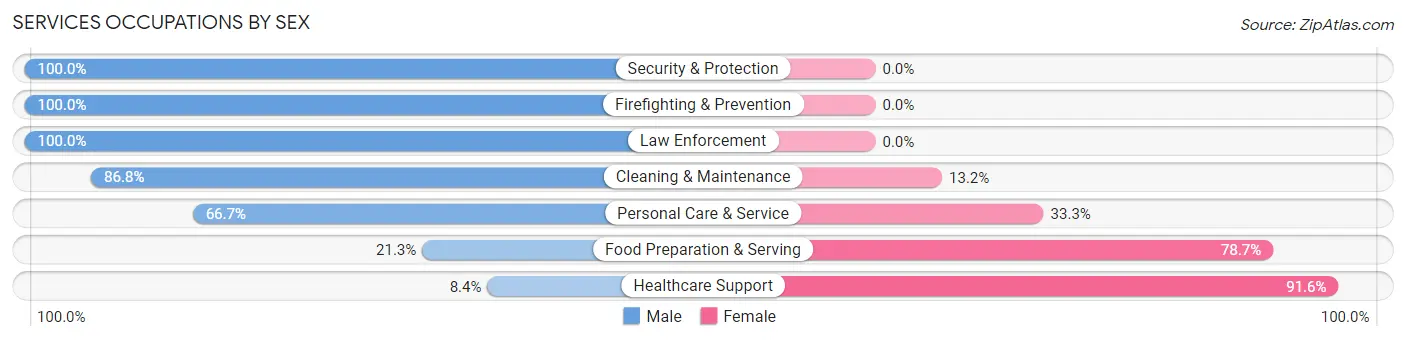
Services Occupations by Sex
Within the Services occupations in The Villages, the most male-oriented occupations are Security & Protection (100.0%), Firefighting & Prevention (100.0%), and Law Enforcement (100.0%), while the most female-oriented occupations are Healthcare Support (91.6%), Food Preparation & Serving (78.7%), and Personal Care & Service (33.3%).
| Occupation | Male | Female |
| Healthcare Support | 14 (8.4%) | 153 (91.6%) |
| Security & Protection | 121 (100.0%) | 0 (0.0%) |
| Firefighting & Prevention | 92 (100.0%) | 0 (0.0%) |
| Law Enforcement | 29 (100.0%) | 0 (0.0%) |
| Food Preparation & Serving | 63 (21.3%) | 233 (78.7%) |
| Cleaning & Maintenance | 191 (86.8%) | 29 (13.2%) |
| Personal Care & Service | 561 (66.7%) | 280 (33.3%) |
| Total (Category) | 950 (57.8%) | 695 (42.2%) |
| Total (Overall) | 4,306 (48.4%) | 4,597 (51.6%) |
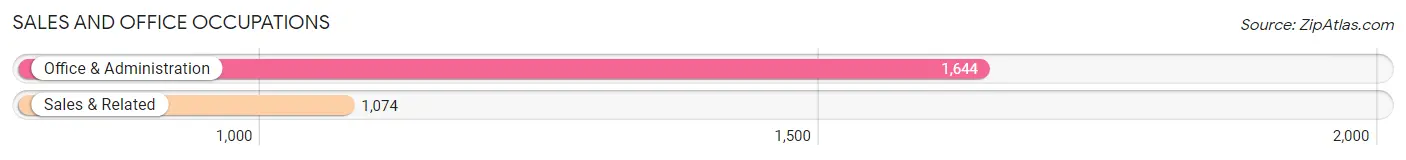
Sales and Office Occupations
The most common Sales and Office occupations in The Villages are Office & Administration (1,644 | 18.5%), and Sales & Related (1,074 | 12.1%).
Sales and Office Occupations by Sex
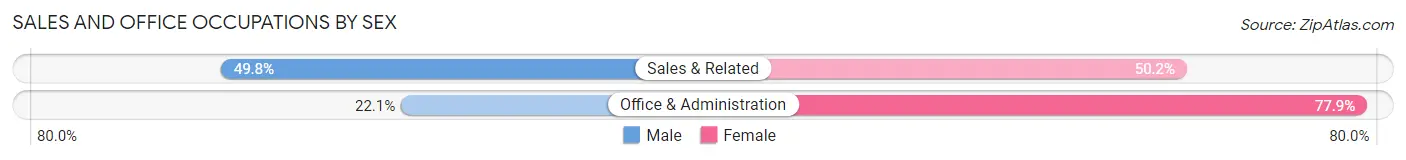
| Occupation | Male | Female |
| Sales & Related | 535 (49.8%) | 539 (50.2%) |
| Office & Administration | 363 (22.1%) | 1,281 (77.9%) |
| Total (Category) | 898 (33.0%) | 1,820 (67.0%) |
| Total (Overall) | 4,306 (48.4%) | 4,597 (51.6%) |
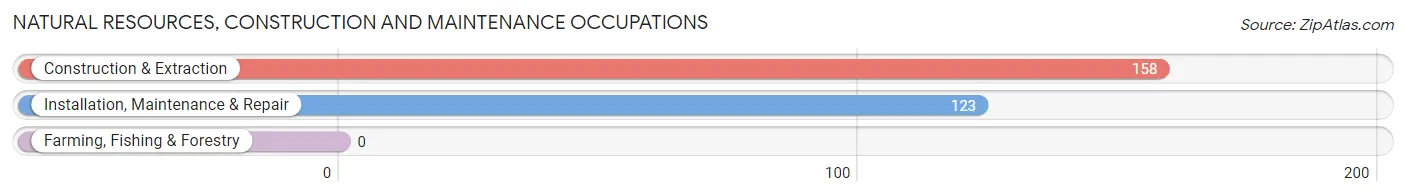
Natural Resources, Construction and Maintenance Occupations
The most common Natural Resources, Construction and Maintenance occupations in The Villages are Construction & Extraction (158 | 1.8%), and Installation, Maintenance & Repair (123 | 1.4%).
Natural Resources, Construction and Maintenance Occupations by Sex
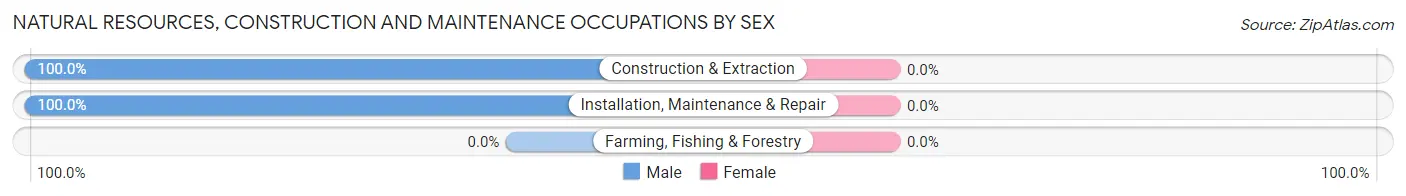
| Occupation | Male | Female |
| Farming, Fishing & Forestry | 0 (0.0%) | 0 (0.0%) |
| Construction & Extraction | 158 (100.0%) | 0 (0.0%) |
| Installation, Maintenance & Repair | 123 (100.0%) | 0 (0.0%) |
| Total (Category) | 281 (100.0%) | 0 (0.0%) |
| Total (Overall) | 4,306 (48.4%) | 4,597 (51.6%) |
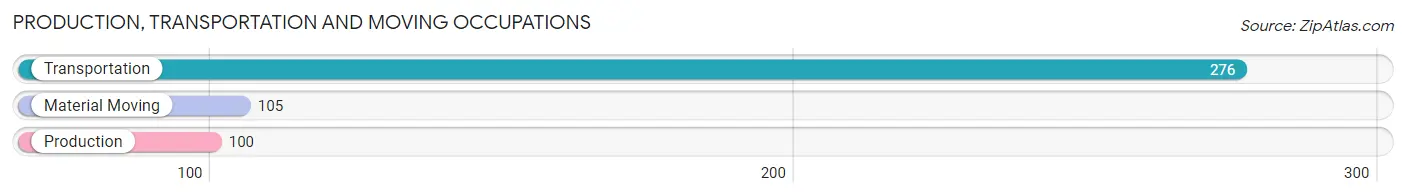
Production, Transportation and Moving Occupations
The most common Production, Transportation and Moving occupations in The Villages are Transportation (276 | 3.1%), Material Moving (105 | 1.2%), and Production (100 | 1.1%).
Production, Transportation and Moving Occupations by Sex
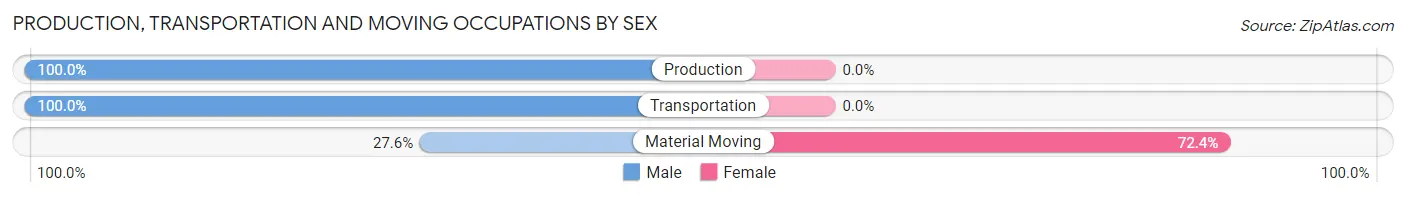
| Occupation | Male | Female |
| Production | 100 (100.0%) | 0 (0.0%) |
| Transportation | 276 (100.0%) | 0 (0.0%) |
| Material Moving | 29 (27.6%) | 76 (72.4%) |
| Total (Category) | 405 (84.2%) | 76 (15.8%) |
| Total (Overall) | 4,306 (48.4%) | 4,597 (51.6%) |
Employment Industries by Sex in The Villages
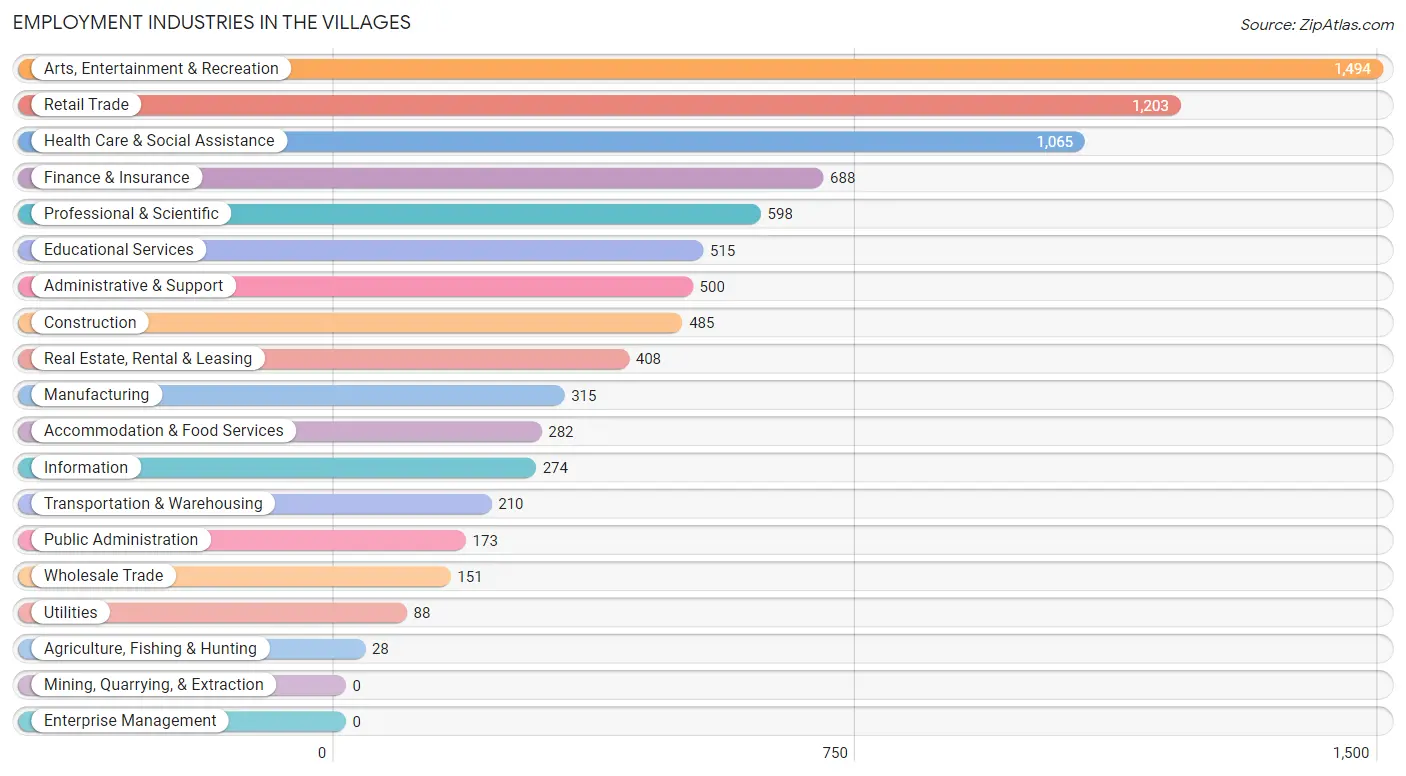
Employment Industries in The Villages
The major employment industries in The Villages include Arts, Entertainment & Recreation (1,494 | 16.8%), Retail Trade (1,203 | 13.5%), Health Care & Social Assistance (1,065 | 12.0%), Finance & Insurance (688 | 7.7%), and Professional & Scientific (598 | 6.7%).
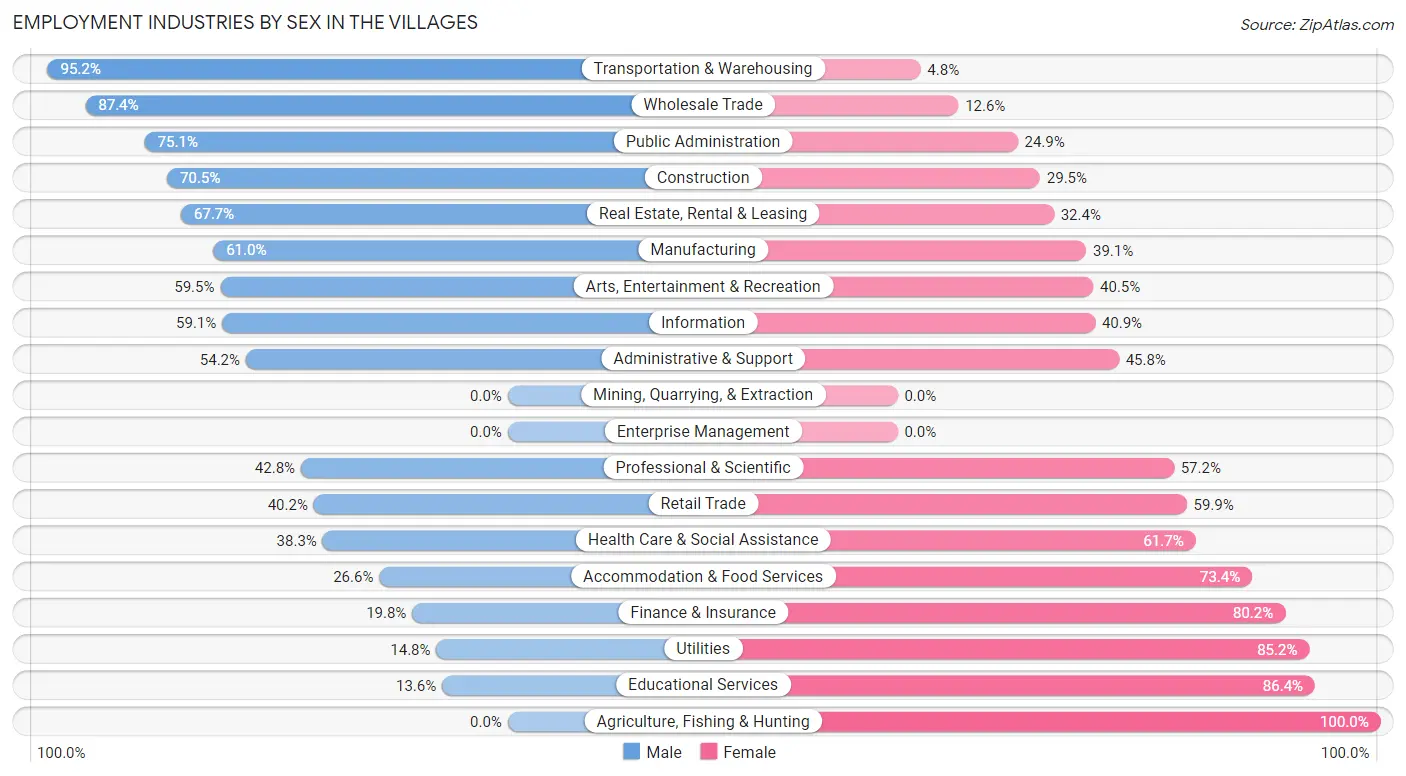
Employment Industries by Sex in The Villages
The The Villages industries that see more men than women are Transportation & Warehousing (95.2%), Wholesale Trade (87.4%), and Public Administration (75.1%), whereas the industries that tend to have a higher number of women are Agriculture, Fishing & Hunting (100.0%), Educational Services (86.4%), and Utilities (85.2%).
| Industry | Male | Female |
| Agriculture, Fishing & Hunting | 0 (0.0%) | 28 (100.0%) |
| Mining, Quarrying, & Extraction | 0 (0.0%) | 0 (0.0%) |
| Construction | 342 (70.5%) | 143 (29.5%) |
| Manufacturing | 192 (61.0%) | 123 (39.1%) |
| Wholesale Trade | 132 (87.4%) | 19 (12.6%) |
| Retail Trade | 483 (40.2%) | 720 (59.9%) |
| Transportation & Warehousing | 200 (95.2%) | 10 (4.8%) |
| Utilities | 13 (14.8%) | 75 (85.2%) |
| Information | 162 (59.1%) | 112 (40.9%) |
| Finance & Insurance | 136 (19.8%) | 552 (80.2%) |
| Real Estate, Rental & Leasing | 276 (67.6%) | 132 (32.4%) |
| Professional & Scientific | 256 (42.8%) | 342 (57.2%) |
| Enterprise Management | 0 (0.0%) | 0 (0.0%) |
| Administrative & Support | 271 (54.2%) | 229 (45.8%) |
| Educational Services | 70 (13.6%) | 445 (86.4%) |
| Health Care & Social Assistance | 408 (38.3%) | 657 (61.7%) |
| Arts, Entertainment & Recreation | 889 (59.5%) | 605 (40.5%) |
| Accommodation & Food Services | 75 (26.6%) | 207 (73.4%) |
| Public Administration | 130 (75.1%) | 43 (24.9%) |
| Total | 4,306 (48.4%) | 4,597 (51.6%) |
Education in The Villages
School Enrollment in The Villages
The most common levels of schooling among the 733 students in The Villages are college / undergraduate (334 | 45.6%), graduate / professional (208 | 28.4%), and elementary school (66 | 9.0%).
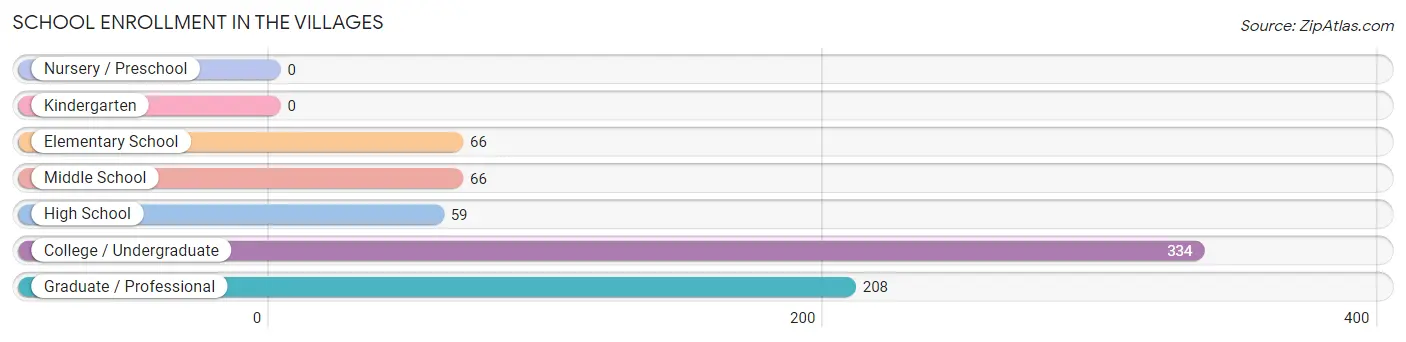
| School Level | # Students | % Students |
| Nursery / Preschool | 0 | 0.0% |
| Kindergarten | 0 | 0.0% |
| Elementary School | 66 | 9.0% |
| Middle School | 66 | 9.0% |
| High School | 59 | 8.1% |
| College / Undergraduate | 334 | 45.6% |
| Graduate / Professional | 208 | 28.4% |
| Total | 733 | 100.0% |
School Enrollment by Age by Funding Source in The Villages
Out of a total of 733 students who are enrolled in schools in The Villages, 232 (31.7%) attend a private institution, while the remaining 501 (68.3%) are enrolled in public schools. The age group of 35 years and over has the highest likelihood of being enrolled in private schools, with 232 (42.7% in the age bracket) enrolled. Conversely, the age group of 5 to 9 year old has the lowest likelihood of being enrolled in a private school, with 66 (100.0% in the age bracket) attending a public institution.
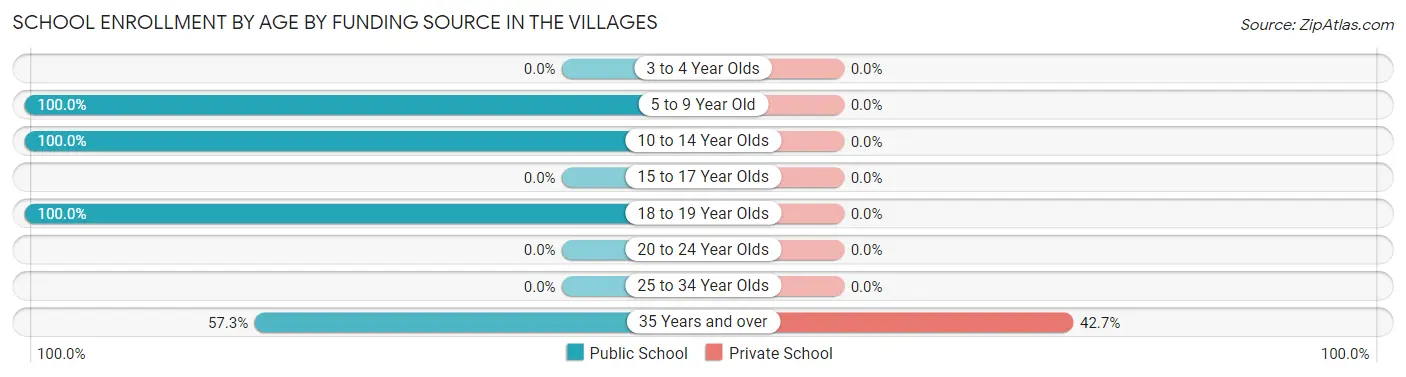
| Age Bracket | Public School | Private School |
| 3 to 4 Year Olds | 0 (0.0%) | 0 (0.0%) |
| 5 to 9 Year Old | 66 (100.0%) | 0 (0.0%) |
| 10 to 14 Year Olds | 108 (100.0%) | 0 (0.0%) |
| 15 to 17 Year Olds | 0 (0.0%) | 0 (0.0%) |
| 18 to 19 Year Olds | 16 (100.0%) | 0 (0.0%) |
| 20 to 24 Year Olds | 0 (0.0%) | 0 (0.0%) |
| 25 to 34 Year Olds | 0 (0.0%) | 0 (0.0%) |
| 35 Years and over | 311 (57.3%) | 232 (42.7%) |
| Total | 501 (68.3%) | 232 (31.7%) |
Educational Attainment by Field of Study in The Villages
Education (8,476 | 23.8%), business (7,641 | 21.5%), science & technology (3,100 | 8.7%), engineering (2,810 | 7.9%), and social sciences (2,637 | 7.4%) are the most common fields of study among 35,545 individuals in The Villages who have obtained a bachelor's degree or higher.
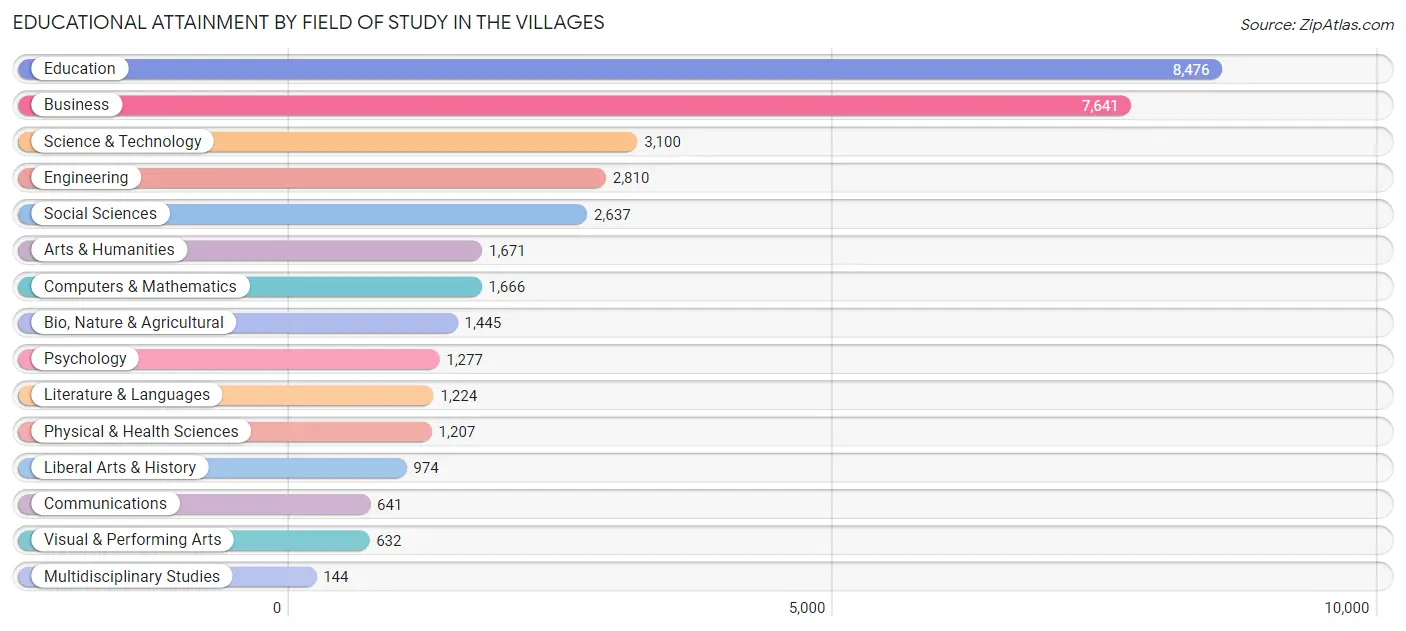
| Field of Study | # Graduates | % Graduates |
| Computers & Mathematics | 1,666 | 4.7% |
| Bio, Nature & Agricultural | 1,445 | 4.1% |
| Physical & Health Sciences | 1,207 | 3.4% |
| Psychology | 1,277 | 3.6% |
| Social Sciences | 2,637 | 7.4% |
| Engineering | 2,810 | 7.9% |
| Multidisciplinary Studies | 144 | 0.4% |
| Science & Technology | 3,100 | 8.7% |
| Business | 7,641 | 21.5% |
| Education | 8,476 | 23.8% |
| Literature & Languages | 1,224 | 3.4% |
| Liberal Arts & History | 974 | 2.7% |
| Visual & Performing Arts | 632 | 1.8% |
| Communications | 641 | 1.8% |
| Arts & Humanities | 1,671 | 4.7% |
| Total | 35,545 | 100.0% |
Transportation & Commute in The Villages
Vehicle Availability by Sex in The Villages
The most prevalent vehicle ownership categories in The Villages are males with 1 vehicle (2,295, accounting for 54.8%) and females with 1 vehicle (2,176, making up 52.0%).
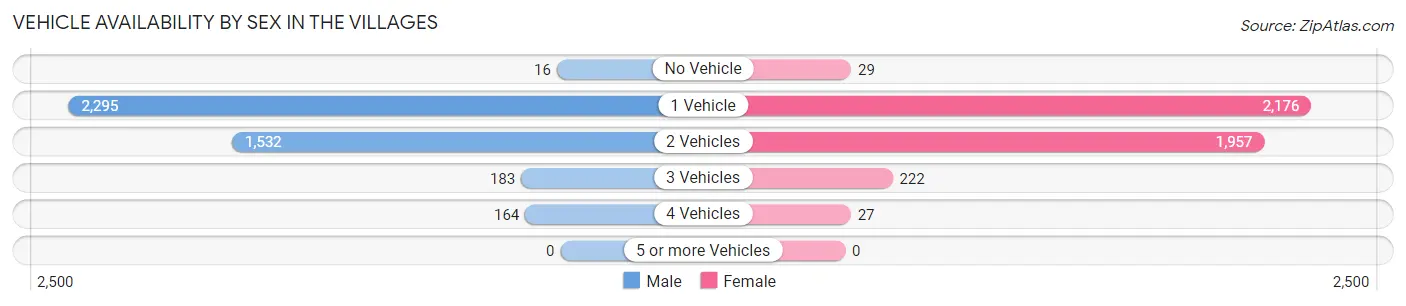
| Vehicles Available | Male | Female |
| No Vehicle | 16 (0.4%) | 29 (0.7%) |
| 1 Vehicle | 2,295 (54.8%) | 2,176 (49.3%) |
| 2 Vehicles | 1,532 (36.6%) | 1,957 (44.4%) |
| 3 Vehicles | 183 (4.4%) | 222 (5.0%) |
| 4 Vehicles | 164 (3.9%) | 27 (0.6%) |
| 5 or more Vehicles | 0 (0.0%) | 0 (0.0%) |
| Total | 4,190 (100.0%) | 4,411 (100.0%) |
Commute Time in The Villages
The most frequently occuring commute durations in The Villages are 15 to 19 minutes (1,428 commuters, 23.0%), 10 to 14 minutes (1,306 commuters, 21.0%), and 20 to 24 minutes (855 commuters, 13.8%).
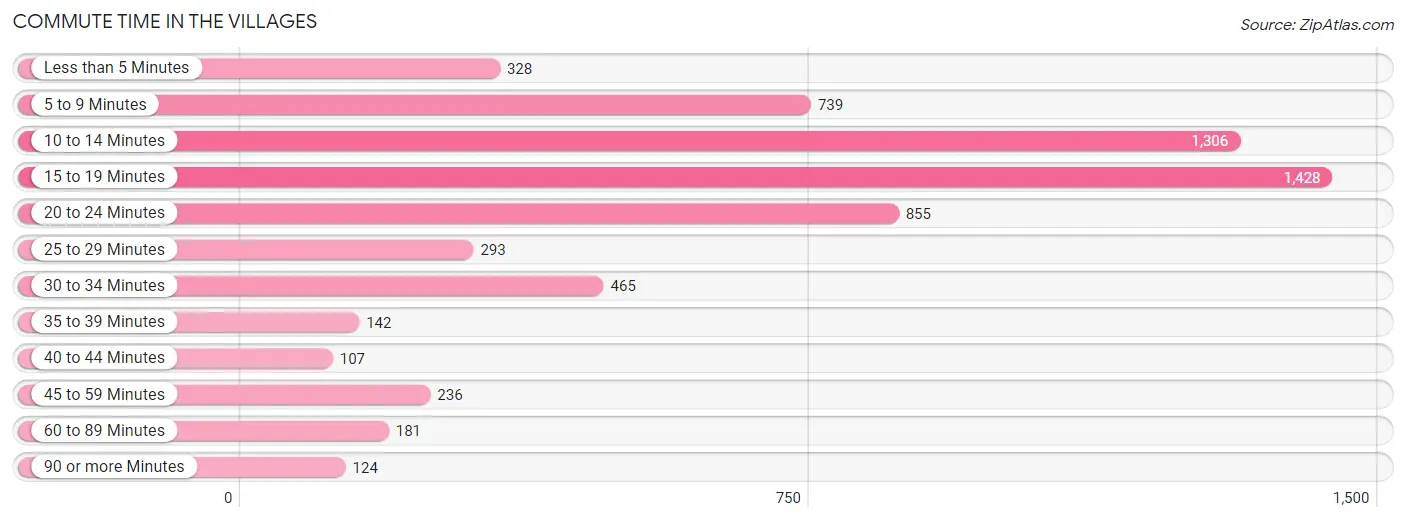
| Commute Time | # Commuters | % Commuters |
| Less than 5 Minutes | 328 | 5.3% |
| 5 to 9 Minutes | 739 | 11.9% |
| 10 to 14 Minutes | 1,306 | 21.0% |
| 15 to 19 Minutes | 1,428 | 23.0% |
| 20 to 24 Minutes | 855 | 13.8% |
| 25 to 29 Minutes | 293 | 4.7% |
| 30 to 34 Minutes | 465 | 7.5% |
| 35 to 39 Minutes | 142 | 2.3% |
| 40 to 44 Minutes | 107 | 1.7% |
| 45 to 59 Minutes | 236 | 3.8% |
| 60 to 89 Minutes | 181 | 2.9% |
| 90 or more Minutes | 124 | 2.0% |
Commute Time by Sex in The Villages
The most common commute times in The Villages are 15 to 19 minutes (769 commuters, 24.3%) for males and 10 to 14 minutes (686 commuters, 22.6%) for females.
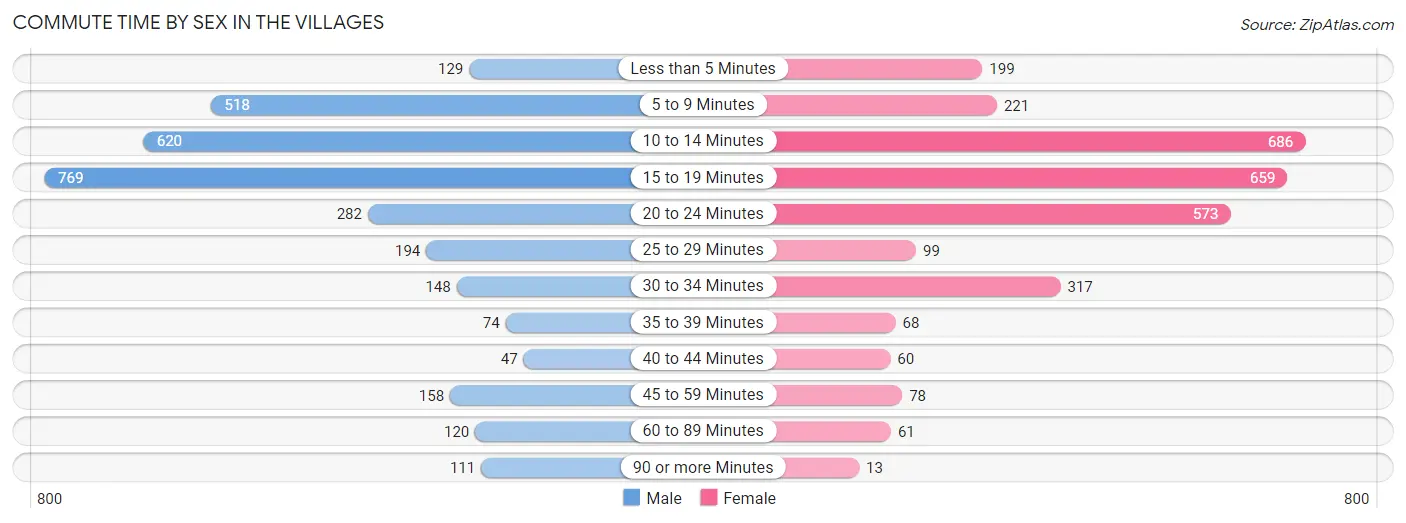
| Commute Time | Male | Female |
| Less than 5 Minutes | 129 (4.1%) | 199 (6.6%) |
| 5 to 9 Minutes | 518 (16.3%) | 221 (7.3%) |
| 10 to 14 Minutes | 620 (19.6%) | 686 (22.6%) |
| 15 to 19 Minutes | 769 (24.3%) | 659 (21.7%) |
| 20 to 24 Minutes | 282 (8.9%) | 573 (18.9%) |
| 25 to 29 Minutes | 194 (6.1%) | 99 (3.3%) |
| 30 to 34 Minutes | 148 (4.7%) | 317 (10.4%) |
| 35 to 39 Minutes | 74 (2.3%) | 68 (2.2%) |
| 40 to 44 Minutes | 47 (1.5%) | 60 (2.0%) |
| 45 to 59 Minutes | 158 (5.0%) | 78 (2.6%) |
| 60 to 89 Minutes | 120 (3.8%) | 61 (2.0%) |
| 90 or more Minutes | 111 (3.5%) | 13 (0.4%) |
Time of Departure to Work by Sex in The Villages
The most frequent times of departure to work in The Villages are 6:00 AM to 6:29 AM (710, 22.4%) for males and 7:00 AM to 7:29 AM (475, 15.7%) for females.
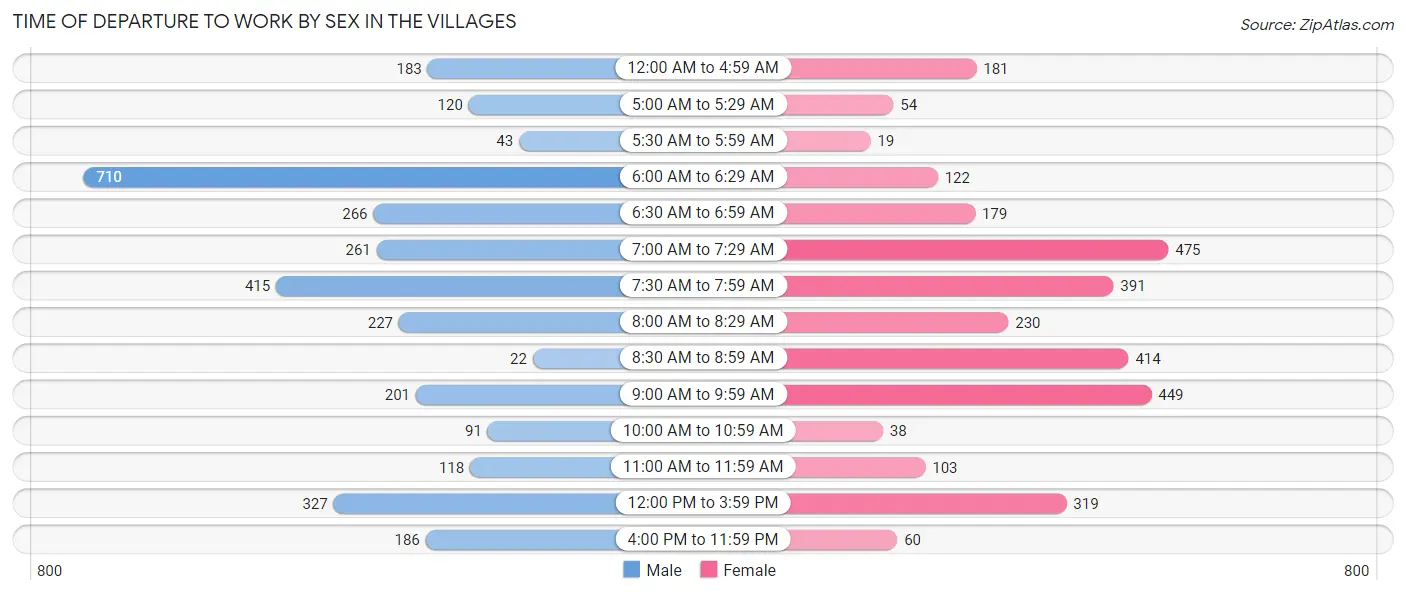
| Time of Departure | Male | Female |
| 12:00 AM to 4:59 AM | 183 (5.8%) | 181 (6.0%) |
| 5:00 AM to 5:29 AM | 120 (3.8%) | 54 (1.8%) |
| 5:30 AM to 5:59 AM | 43 (1.4%) | 19 (0.6%) |
| 6:00 AM to 6:29 AM | 710 (22.4%) | 122 (4.0%) |
| 6:30 AM to 6:59 AM | 266 (8.4%) | 179 (5.9%) |
| 7:00 AM to 7:29 AM | 261 (8.2%) | 475 (15.7%) |
| 7:30 AM to 7:59 AM | 415 (13.1%) | 391 (12.9%) |
| 8:00 AM to 8:29 AM | 227 (7.2%) | 230 (7.6%) |
| 8:30 AM to 8:59 AM | 22 (0.7%) | 414 (13.7%) |
| 9:00 AM to 9:59 AM | 201 (6.3%) | 449 (14.8%) |
| 10:00 AM to 10:59 AM | 91 (2.9%) | 38 (1.3%) |
| 11:00 AM to 11:59 AM | 118 (3.7%) | 103 (3.4%) |
| 12:00 PM to 3:59 PM | 327 (10.3%) | 319 (10.5%) |
| 4:00 PM to 11:59 PM | 186 (5.9%) | 60 (2.0%) |
| Total | 3,170 (100.0%) | 3,034 (100.0%) |
Housing Occupancy in The Villages
Occupancy by Ownership in The Villages
Of the total 46,009 dwellings in The Villages, owner-occupied units account for 43,430 (94.4%), while renter-occupied units make up 2,579 (5.6%).
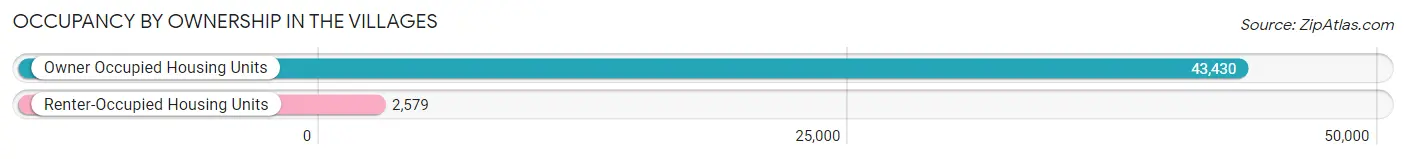
| Occupancy | # Housing Units | % Housing Units |
| Owner Occupied Housing Units | 43,430 | 94.4% |
| Renter-Occupied Housing Units | 2,579 | 5.6% |
| Total Occupied Housing Units | 46,009 | 100.0% |
Occupancy by Household Size in The Villages
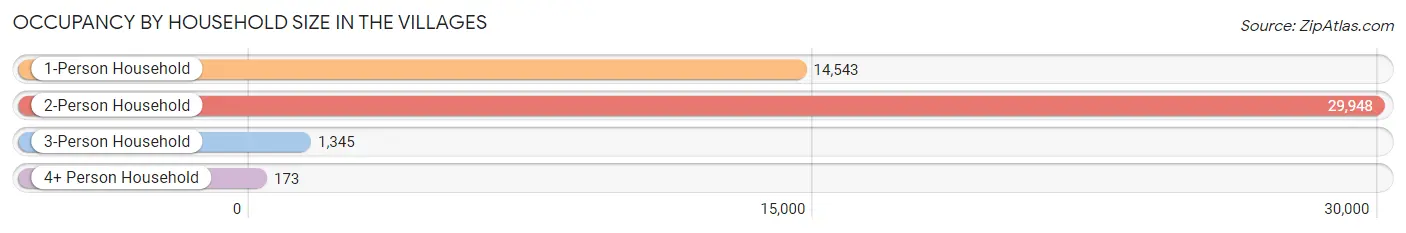
| Household Size | # Housing Units | % Housing Units |
| 1-Person Household | 14,543 | 31.6% |
| 2-Person Household | 29,948 | 65.1% |
| 3-Person Household | 1,345 | 2.9% |
| 4+ Person Household | 173 | 0.4% |
| Total Housing Units | 46,009 | 100.0% |
Occupancy by Ownership by Household Size in The Villages
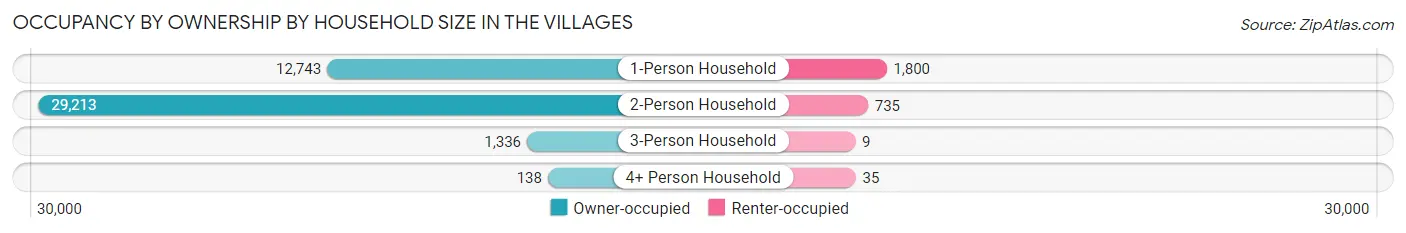
| Household Size | Owner-occupied | Renter-occupied |
| 1-Person Household | 12,743 (87.6%) | 1,800 (12.4%) |
| 2-Person Household | 29,213 (97.6%) | 735 (2.5%) |
| 3-Person Household | 1,336 (99.3%) | 9 (0.7%) |
| 4+ Person Household | 138 (79.8%) | 35 (20.2%) |
| Total Housing Units | 43,430 (94.4%) | 2,579 (5.6%) |
Occupancy by Educational Attainment in The Villages
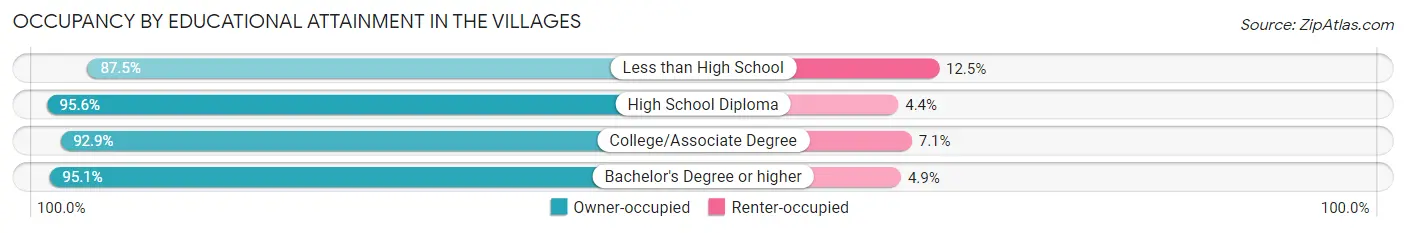
| Household Size | Owner-occupied | Renter-occupied |
| Less than High School | 639 (87.5%) | 91 (12.5%) |
| High School Diploma | 8,699 (95.6%) | 398 (4.4%) |
| College/Associate Degree | 13,462 (92.9%) | 1,022 (7.1%) |
| Bachelor's Degree or higher | 20,630 (95.1%) | 1,068 (4.9%) |
Occupancy by Age of Householder in The Villages
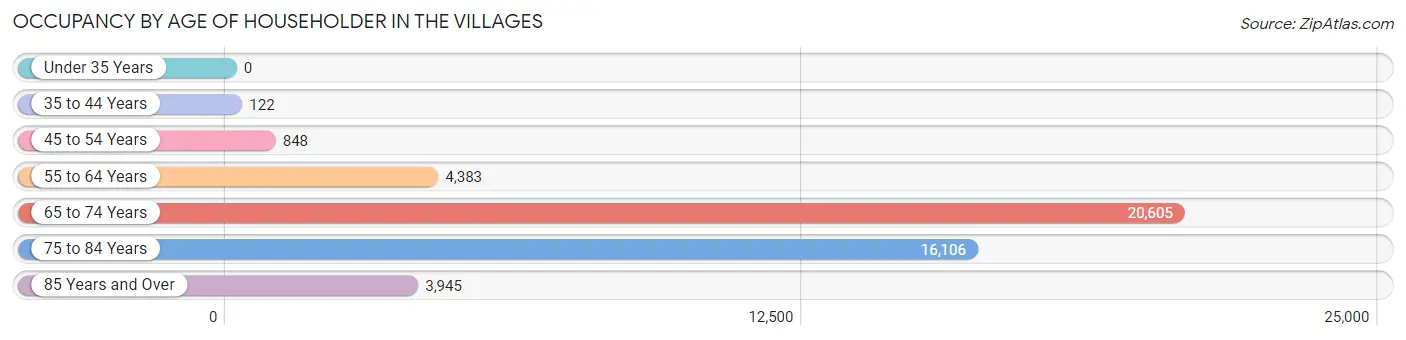
| Age Bracket | # Households | % Households |
| Under 35 Years | 0 | 0.0% |
| 35 to 44 Years | 122 | 0.3% |
| 45 to 54 Years | 848 | 1.8% |
| 55 to 64 Years | 4,383 | 9.5% |
| 65 to 74 Years | 20,605 | 44.8% |
| 75 to 84 Years | 16,106 | 35.0% |
| 85 Years and Over | 3,945 | 8.6% |
| Total | 46,009 | 100.0% |
Housing Finances in The Villages
Median Income by Occupancy in The Villages
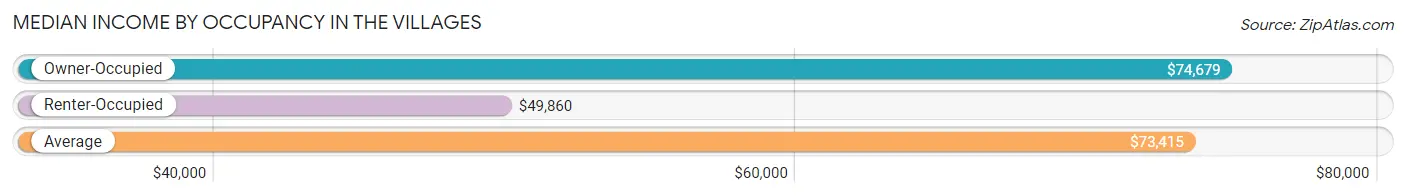
| Occupancy Type | # Households | Median Income |
| Owner-Occupied | 43,430 (94.4%) | $74,679 |
| Renter-Occupied | 2,579 (5.6%) | $49,860 |
| Average | 46,009 (100.0%) | $73,415 |
Occupancy by Householder Income Bracket in The Villages
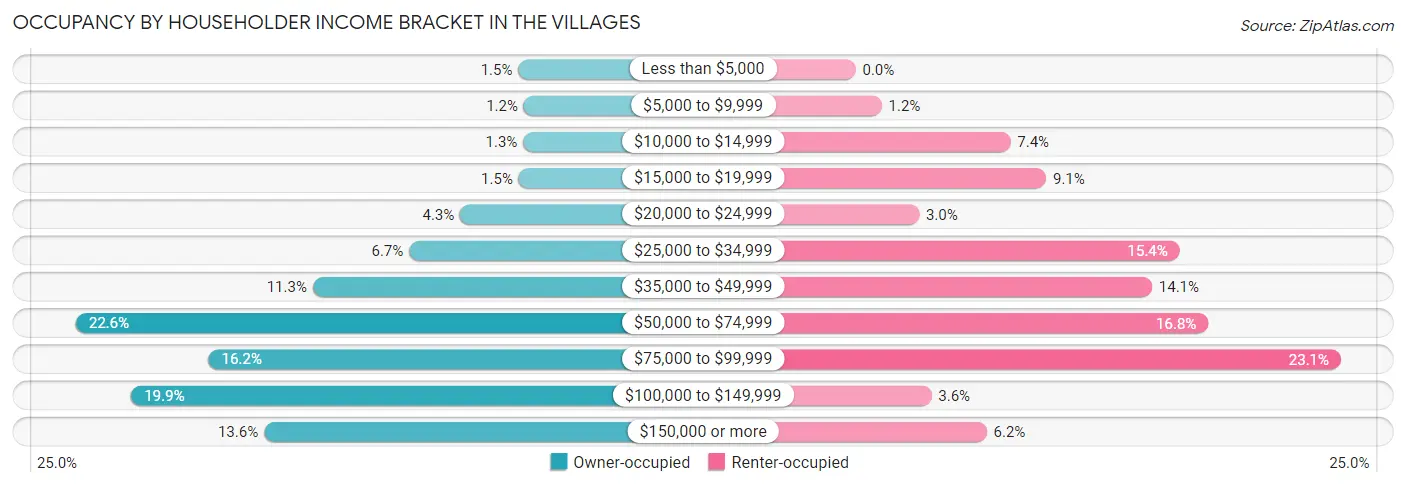
| Income Bracket | Owner-occupied | Renter-occupied |
| Less than $5,000 | 649 (1.5%) | 0 (0.0%) |
| $5,000 to $9,999 | 536 (1.2%) | 32 (1.2%) |
| $10,000 to $14,999 | 546 (1.3%) | 190 (7.4%) |
| $15,000 to $19,999 | 640 (1.5%) | 234 (9.1%) |
| $20,000 to $24,999 | 1,849 (4.3%) | 78 (3.0%) |
| $25,000 to $34,999 | 2,905 (6.7%) | 398 (15.4%) |
| $35,000 to $49,999 | 4,900 (11.3%) | 364 (14.1%) |
| $50,000 to $74,999 | 9,799 (22.6%) | 433 (16.8%) |
| $75,000 to $99,999 | 7,051 (16.2%) | 596 (23.1%) |
| $100,000 to $149,999 | 8,650 (19.9%) | 93 (3.6%) |
| $150,000 or more | 5,905 (13.6%) | 161 (6.2%) |
| Total | 43,430 (100.0%) | 2,579 (100.0%) |
Monthly Housing Cost Tiers in The Villages
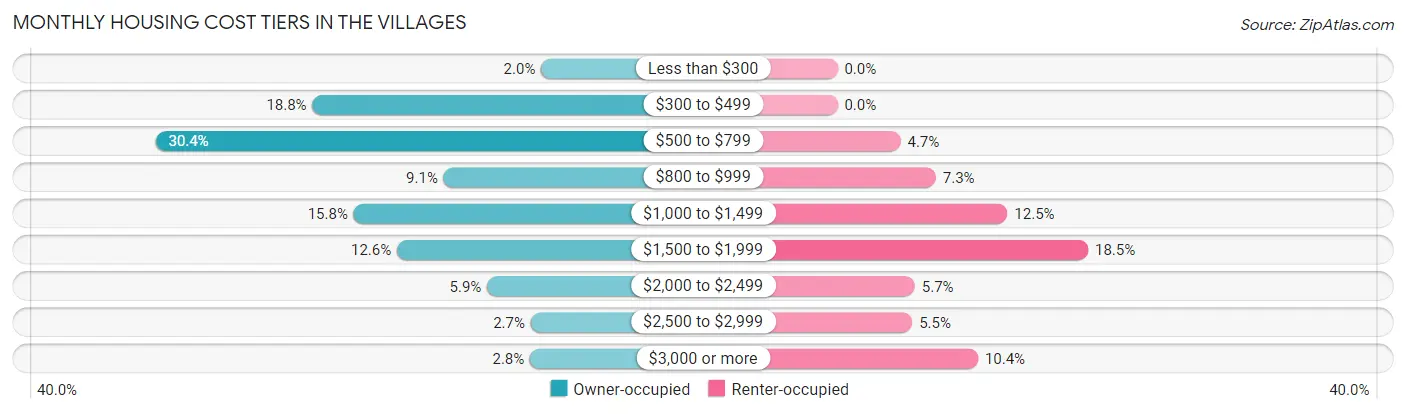
| Monthly Cost | Owner-occupied | Renter-occupied |
| Less than $300 | 848 (1.9%) | 0 (0.0%) |
| $300 to $499 | 8,166 (18.8%) | 0 (0.0%) |
| $500 to $799 | 13,187 (30.4%) | 120 (4.6%) |
| $800 to $999 | 3,967 (9.1%) | 187 (7.2%) |
| $1,000 to $1,499 | 6,843 (15.8%) | 323 (12.5%) |
| $1,500 to $1,999 | 5,459 (12.6%) | 476 (18.5%) |
| $2,000 to $2,499 | 2,576 (5.9%) | 147 (5.7%) |
| $2,500 to $2,999 | 1,183 (2.7%) | 142 (5.5%) |
| $3,000 or more | 1,201 (2.8%) | 267 (10.3%) |
| Total | 43,430 (100.0%) | 2,579 (100.0%) |
Physical Housing Characteristics in The Villages
Housing Structures in The Villages
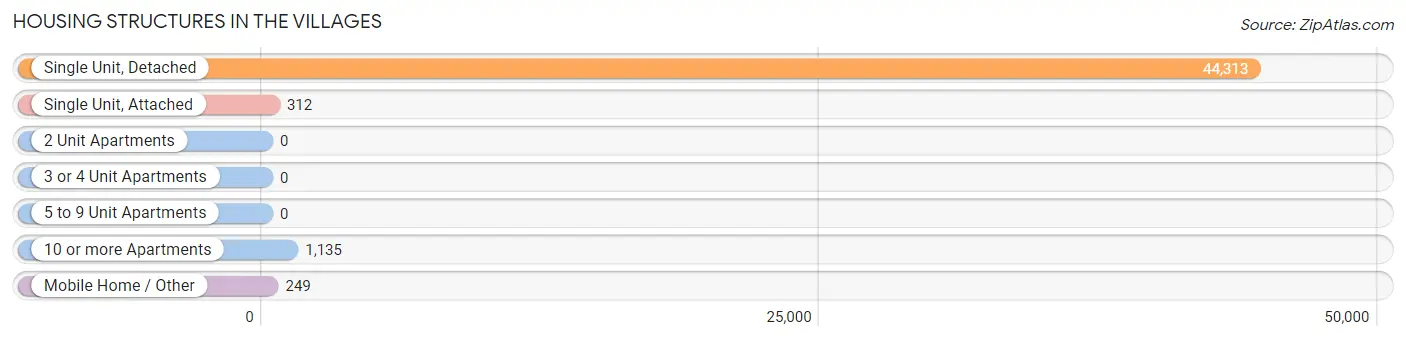
| Structure Type | # Housing Units | % Housing Units |
| Single Unit, Detached | 44,313 | 96.3% |
| Single Unit, Attached | 312 | 0.7% |
| 2 Unit Apartments | 0 | 0.0% |
| 3 or 4 Unit Apartments | 0 | 0.0% |
| 5 to 9 Unit Apartments | 0 | 0.0% |
| 10 or more Apartments | 1,135 | 2.5% |
| Mobile Home / Other | 249 | 0.5% |
| Total | 46,009 | 100.0% |
Housing Structures by Occupancy in The Villages
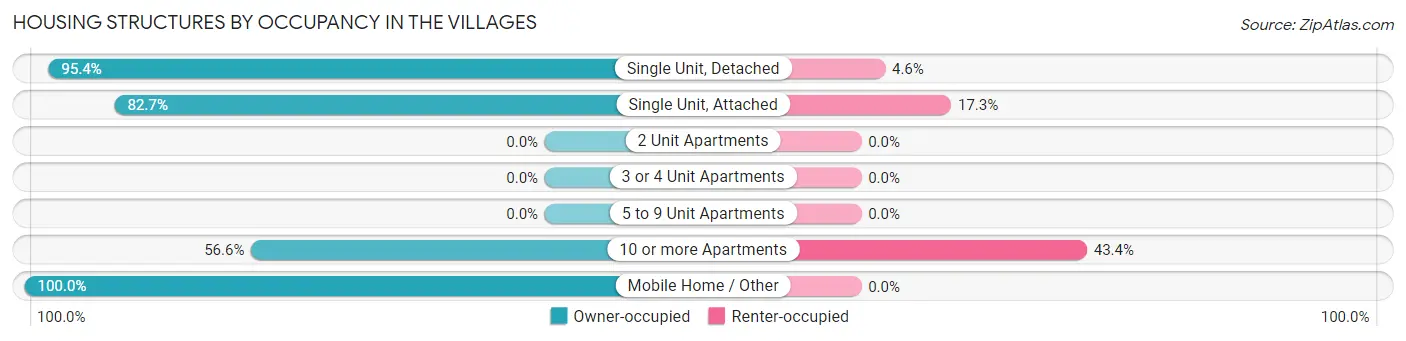
| Structure Type | Owner-occupied | Renter-occupied |
| Single Unit, Detached | 42,281 (95.4%) | 2,032 (4.6%) |
| Single Unit, Attached | 258 (82.7%) | 54 (17.3%) |
| 2 Unit Apartments | 0 (0.0%) | 0 (0.0%) |
| 3 or 4 Unit Apartments | 0 (0.0%) | 0 (0.0%) |
| 5 to 9 Unit Apartments | 0 (0.0%) | 0 (0.0%) |
| 10 or more Apartments | 642 (56.6%) | 493 (43.4%) |
| Mobile Home / Other | 249 (100.0%) | 0 (0.0%) |
| Total | 43,430 (94.4%) | 2,579 (5.6%) |
Housing Structures by Number of Rooms in The Villages
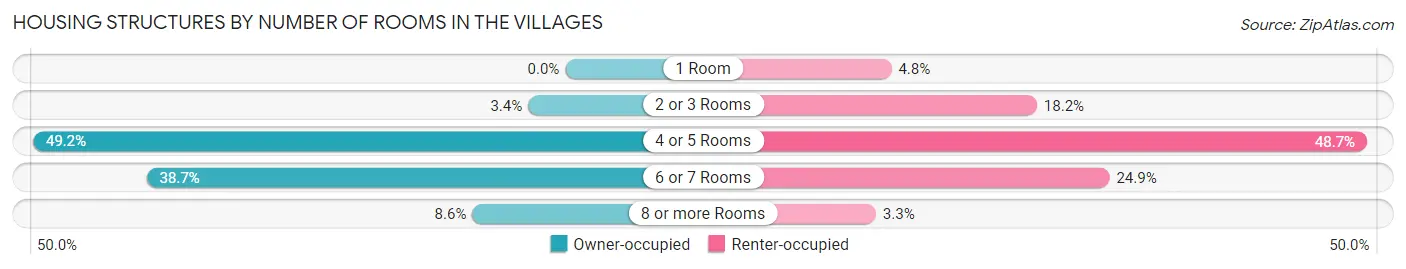
| Number of Rooms | Owner-occupied | Renter-occupied |
| 1 Room | 0 (0.0%) | 123 (4.8%) |
| 2 or 3 Rooms | 1,495 (3.4%) | 470 (18.2%) |
| 4 or 5 Rooms | 21,383 (49.2%) | 1,257 (48.7%) |
| 6 or 7 Rooms | 16,819 (38.7%) | 643 (24.9%) |
| 8 or more Rooms | 3,733 (8.6%) | 86 (3.3%) |
| Total | 43,430 (100.0%) | 2,579 (100.0%) |
Housing Structure by Heating Type in The Villages
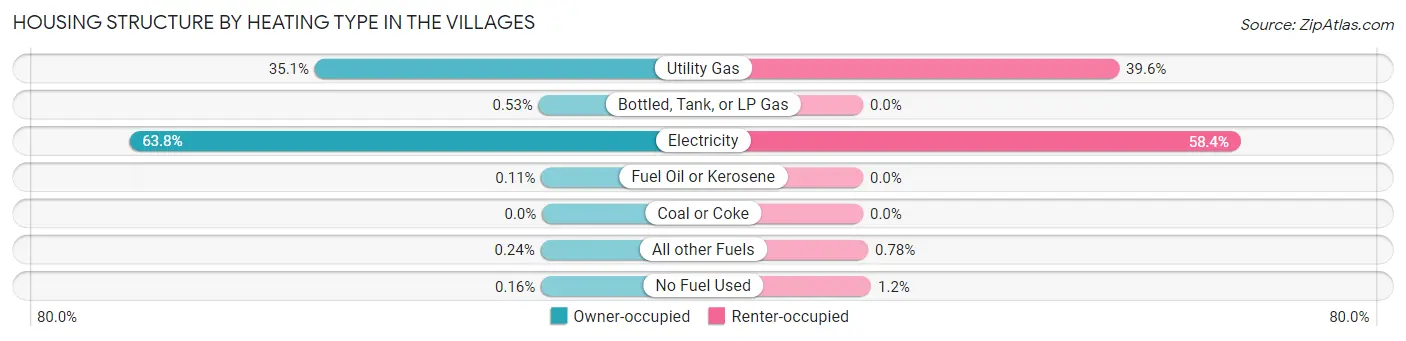
| Heating Type | Owner-occupied | Renter-occupied |
| Utility Gas | 15,256 (35.1%) | 1,021 (39.6%) |
| Bottled, Tank, or LP Gas | 231 (0.5%) | 0 (0.0%) |
| Electricity | 27,718 (63.8%) | 1,506 (58.4%) |
| Fuel Oil or Kerosene | 48 (0.1%) | 0 (0.0%) |
| Coal or Coke | 0 (0.0%) | 0 (0.0%) |
| All other Fuels | 106 (0.2%) | 20 (0.8%) |
| No Fuel Used | 71 (0.2%) | 32 (1.2%) |
| Total | 43,430 (100.0%) | 2,579 (100.0%) |
Household Vehicle Usage in The Villages
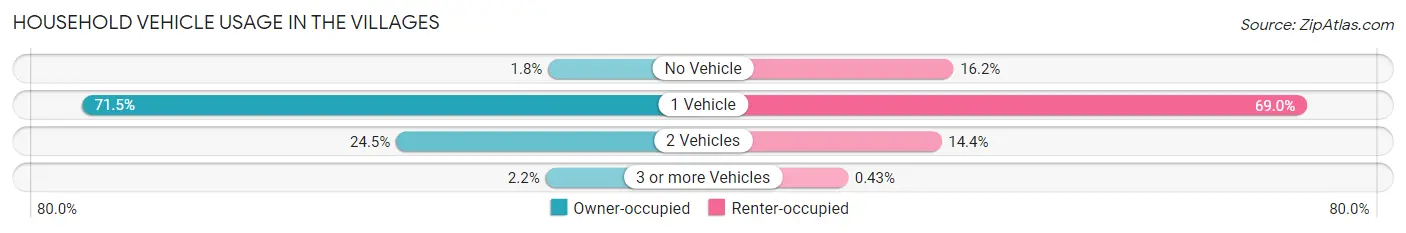
| Vehicles per Household | Owner-occupied | Renter-occupied |
| No Vehicle | 782 (1.8%) | 417 (16.2%) |
| 1 Vehicle | 31,047 (71.5%) | 1,780 (69.0%) |
| 2 Vehicles | 10,645 (24.5%) | 371 (14.4%) |
| 3 or more Vehicles | 956 (2.2%) | 11 (0.4%) |
| Total | 43,430 (100.0%) | 2,579 (100.0%) |
Real Estate & Mortgages in The Villages
Real Estate and Mortgage Overview in The Villages
| Characteristic | Without Mortgage | With Mortgage |
| Housing Units | 26,572 | 16,858 |
| Median Property Value | $347,700 | $345,500 |
| Median Household Income | $71,090 | $2,370 |
| Monthly Housing Costs | $587 | $805 |
| Real Estate Taxes | $3,072 | $297 |
Property Value by Mortgage Status in The Villages
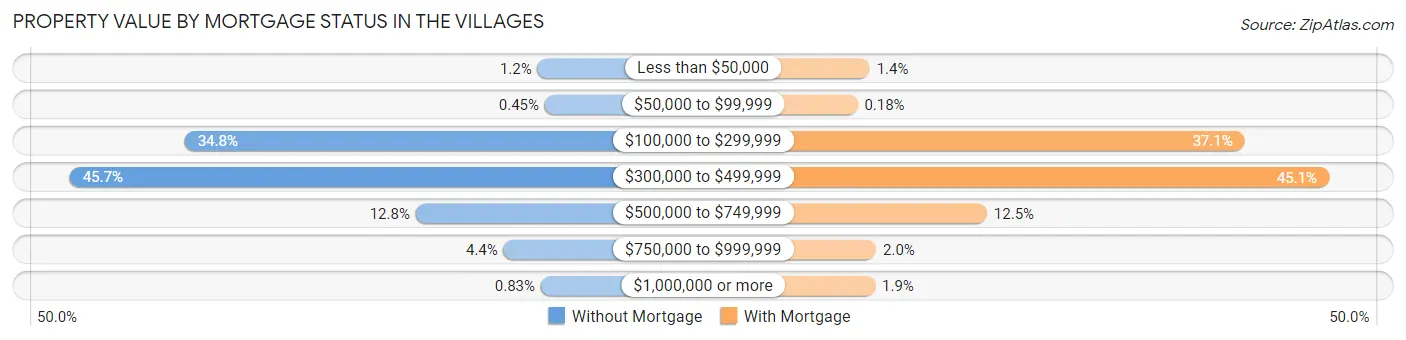
| Property Value | Without Mortgage | With Mortgage |
| Less than $50,000 | 305 (1.1%) | 227 (1.3%) |
| $50,000 to $99,999 | 120 (0.4%) | 31 (0.2%) |
| $100,000 to $299,999 | 9,233 (34.7%) | 6,247 (37.1%) |
| $300,000 to $499,999 | 12,144 (45.7%) | 7,600 (45.1%) |
| $500,000 to $749,999 | 3,387 (12.8%) | 2,109 (12.5%) |
| $750,000 to $999,999 | 1,163 (4.4%) | 331 (2.0%) |
| $1,000,000 or more | 220 (0.8%) | 313 (1.9%) |
| Total | 26,572 (100.0%) | 16,858 (100.0%) |
Household Income by Mortgage Status in The Villages
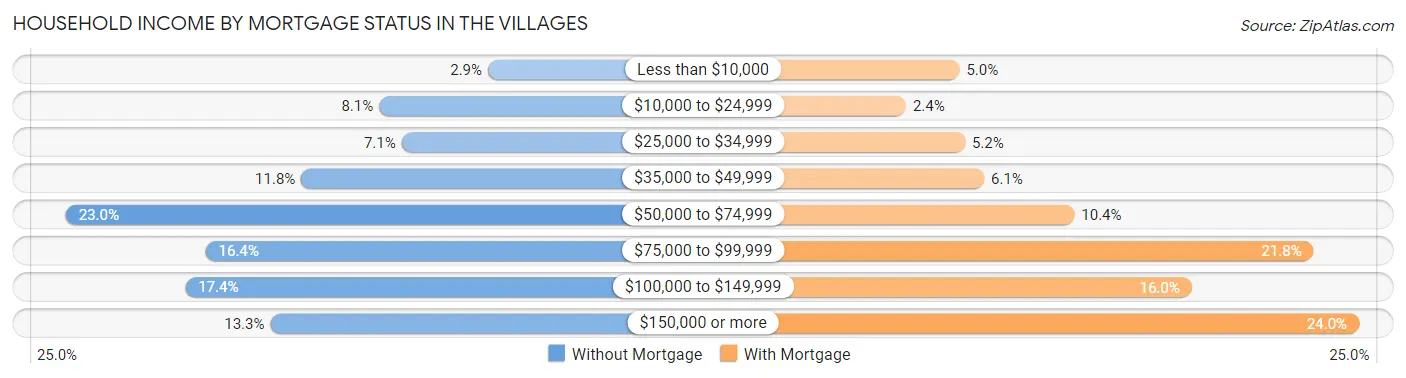
| Household Income | Without Mortgage | With Mortgage |
| Less than $10,000 | 781 (2.9%) | 835 (5.0%) |
| $10,000 to $24,999 | 2,157 (8.1%) | 404 (2.4%) |
| $25,000 to $34,999 | 1,873 (7.0%) | 878 (5.2%) |
| $35,000 to $49,999 | 3,143 (11.8%) | 1,032 (6.1%) |
| $50,000 to $74,999 | 6,122 (23.0%) | 1,757 (10.4%) |
| $75,000 to $99,999 | 4,352 (16.4%) | 3,677 (21.8%) |
| $100,000 to $149,999 | 4,609 (17.3%) | 2,699 (16.0%) |
| $150,000 or more | 3,535 (13.3%) | 4,041 (24.0%) |
| Total | 26,572 (100.0%) | 16,858 (100.0%) |
Property Value to Household Income Ratio in The Villages
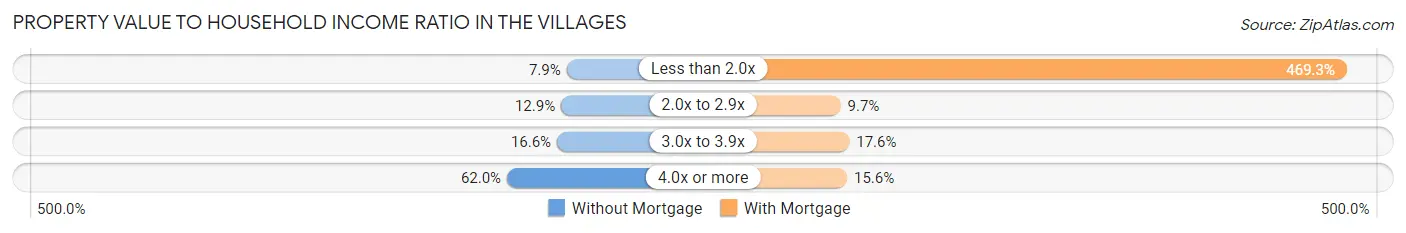
| Value-to-Income Ratio | Without Mortgage | With Mortgage |
| Less than 2.0x | 2,096 (7.9%) | 79,121 (469.3%) |
| 2.0x to 2.9x | 3,432 (12.9%) | 1,638 (9.7%) |
| 3.0x to 3.9x | 4,412 (16.6%) | 2,962 (17.6%) |
| 4.0x or more | 16,476 (62.0%) | 2,621 (15.5%) |
| Total | 26,572 (100.0%) | 16,858 (100.0%) |
Real Estate Taxes by Mortgage Status in The Villages
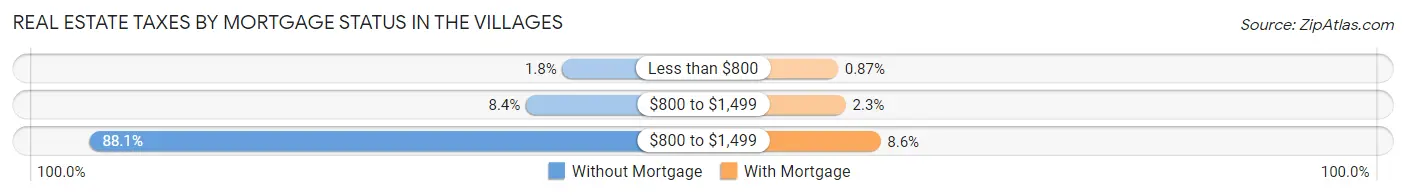
| Property Taxes | Without Mortgage | With Mortgage |
| Less than $800 | 465 (1.8%) | 147 (0.9%) |
| $800 to $1,499 | 2,231 (8.4%) | 387 (2.3%) |
| $800 to $1,499 | 23,421 (88.1%) | 1,456 (8.6%) |
| Total | 26,572 (100.0%) | 16,858 (100.0%) |
Health & Disability in The Villages
Health Insurance Coverage by Age in The Villages
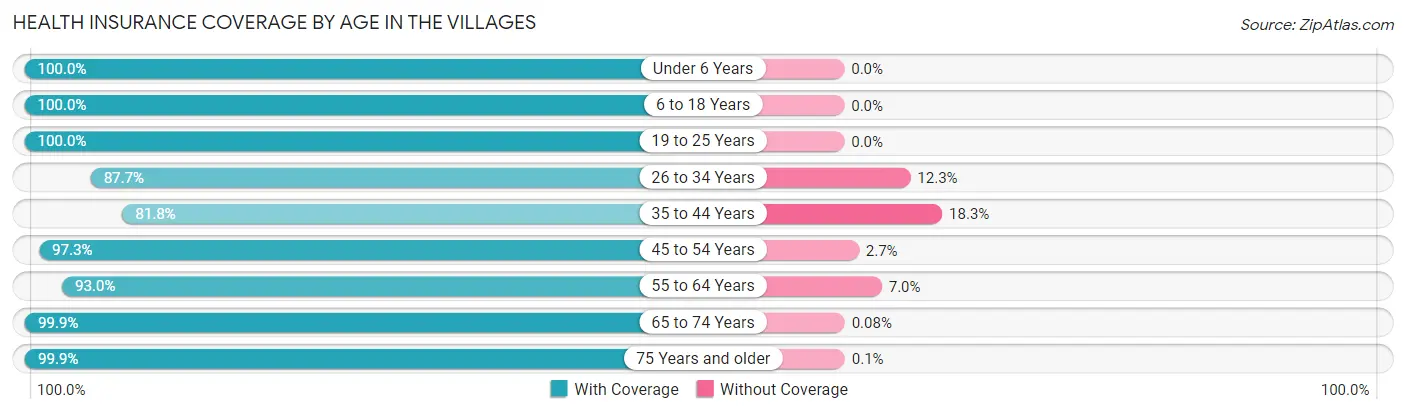
| Age Bracket | With Coverage | Without Coverage |
| Under 6 Years | 97 (100.0%) | 0 (0.0%) |
| 6 to 18 Years | 174 (100.0%) | 0 (0.0%) |
| 19 to 25 Years | 115 (100.0%) | 0 (0.0%) |
| 26 to 34 Years | 327 (87.7%) | 46 (12.3%) |
| 35 to 44 Years | 421 (81.8%) | 94 (18.2%) |
| 45 to 54 Years | 1,432 (97.3%) | 40 (2.7%) |
| 55 to 64 Years | 7,819 (93.0%) | 588 (7.0%) |
| 65 to 74 Years | 35,714 (99.9%) | 28 (0.1%) |
| 75 Years and older | 32,132 (99.9%) | 31 (0.1%) |
| Total | 78,231 (99.0%) | 827 (1.1%) |
Health Insurance Coverage by Citizenship Status in The Villages
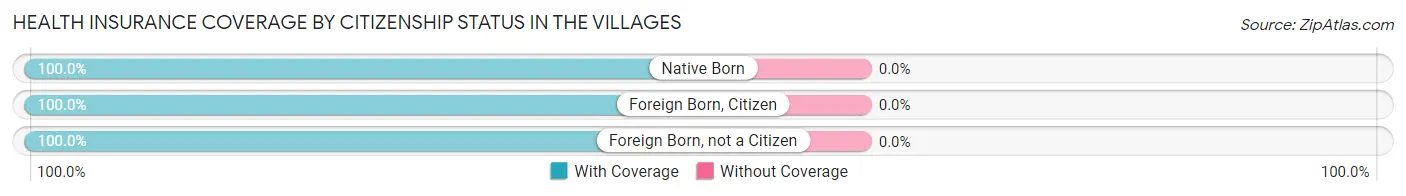
| Citizenship Status | With Coverage | Without Coverage |
| Native Born | 97 (100.0%) | 0 (0.0%) |
| Foreign Born, Citizen | 174 (100.0%) | 0 (0.0%) |
| Foreign Born, not a Citizen | 115 (100.0%) | 0 (0.0%) |
Health Insurance Coverage by Household Income in The Villages
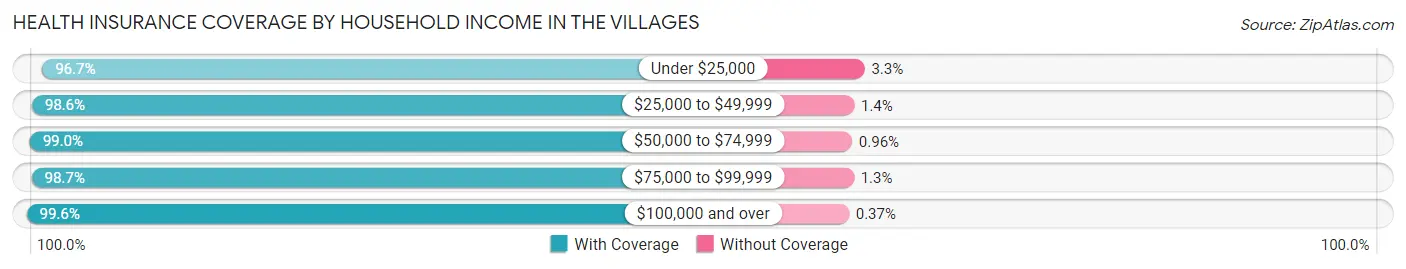
| Household Income | With Coverage | Without Coverage |
| Under $25,000 | 5,756 (96.7%) | 197 (3.3%) |
| $25,000 to $49,999 | 12,670 (98.6%) | 175 (1.4%) |
| $50,000 to $74,999 | 17,161 (99.0%) | 167 (1.0%) |
| $75,000 to $99,999 | 13,750 (98.7%) | 181 (1.3%) |
| $100,000 and over | 28,878 (99.6%) | 107 (0.4%) |
Public vs Private Health Insurance Coverage by Age in The Villages
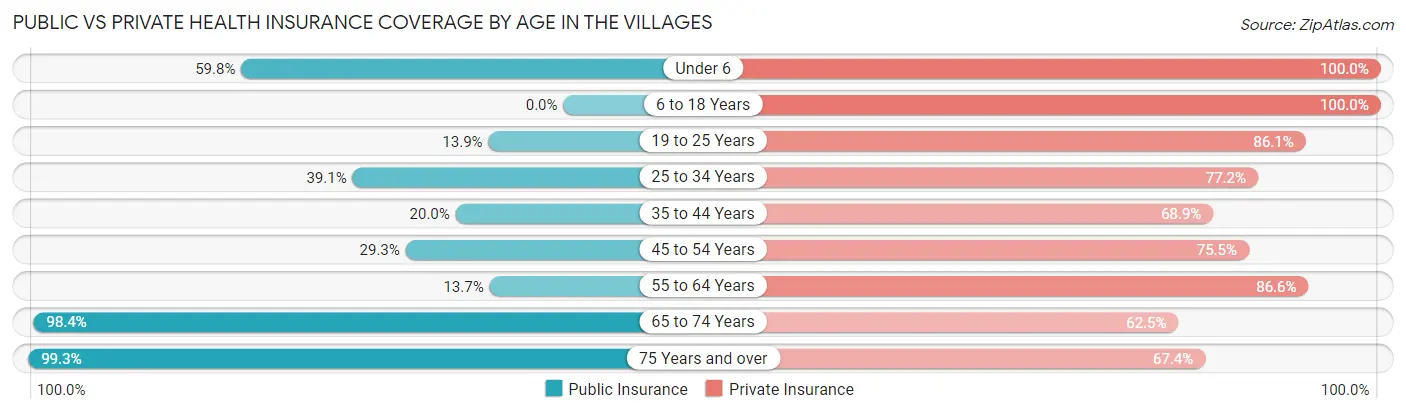
| Age Bracket | Public Insurance | Private Insurance |
| Under 6 | 58 (59.8%) | 97 (100.0%) |
| 6 to 18 Years | 0 (0.0%) | 174 (100.0%) |
| 19 to 25 Years | 16 (13.9%) | 99 (86.1%) |
| 25 to 34 Years | 146 (39.1%) | 288 (77.2%) |
| 35 to 44 Years | 103 (20.0%) | 355 (68.9%) |
| 45 to 54 Years | 431 (29.3%) | 1,112 (75.5%) |
| 55 to 64 Years | 1,153 (13.7%) | 7,280 (86.6%) |
| 65 to 74 Years | 35,157 (98.4%) | 22,328 (62.5%) |
| 75 Years and over | 31,944 (99.3%) | 21,688 (67.4%) |
| Total | 69,008 (87.3%) | 53,421 (67.6%) |
Disability Status by Sex by Age in The Villages
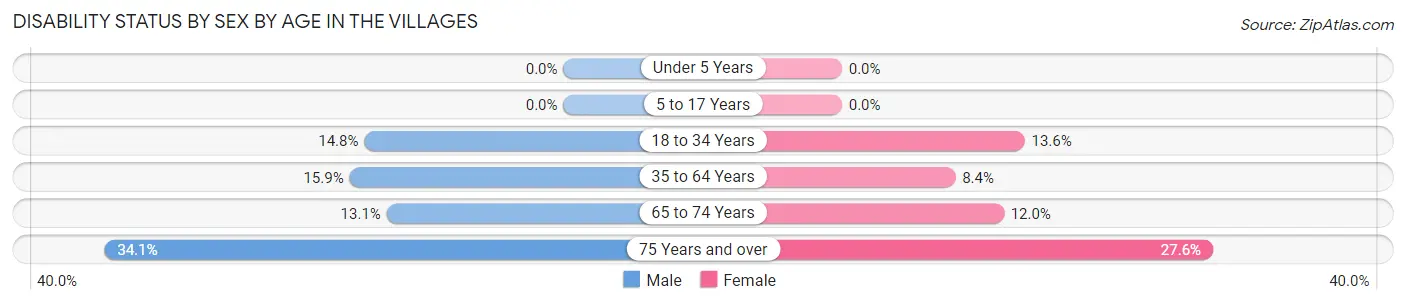
| Age Bracket | Male | Female |
| Under 5 Years | 0 (0.0%) | 0 (0.0%) |
| 5 to 17 Years | 0 (0.0%) | 0 (0.0%) |
| 18 to 34 Years | 34 (14.8%) | 35 (13.6%) |
| 35 to 64 Years | 691 (15.9%) | 509 (8.4%) |
| 65 to 74 Years | 1,992 (13.1%) | 2,470 (12.0%) |
| 75 Years and over | 5,619 (34.1%) | 4,319 (27.6%) |
Disability Class by Sex by Age in The Villages
Disability Class: Hearing Difficulty
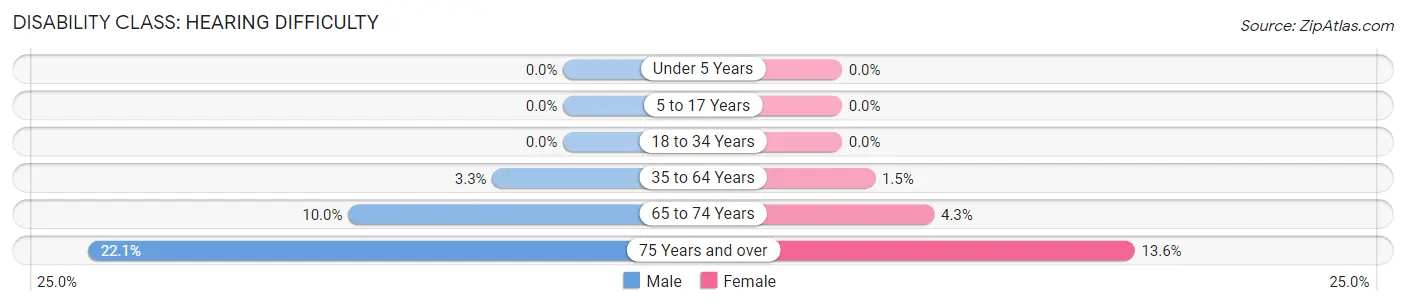
| Age Bracket | Male | Female |
| Under 5 Years | 0 (0.0%) | 0 (0.0%) |
| 5 to 17 Years | 0 (0.0%) | 0 (0.0%) |
| 18 to 34 Years | 0 (0.0%) | 0 (0.0%) |
| 35 to 64 Years | 143 (3.3%) | 93 (1.5%) |
| 65 to 74 Years | 1,515 (10.0%) | 880 (4.3%) |
| 75 Years and over | 3,639 (22.1%) | 2,129 (13.6%) |
Disability Class: Vision Difficulty
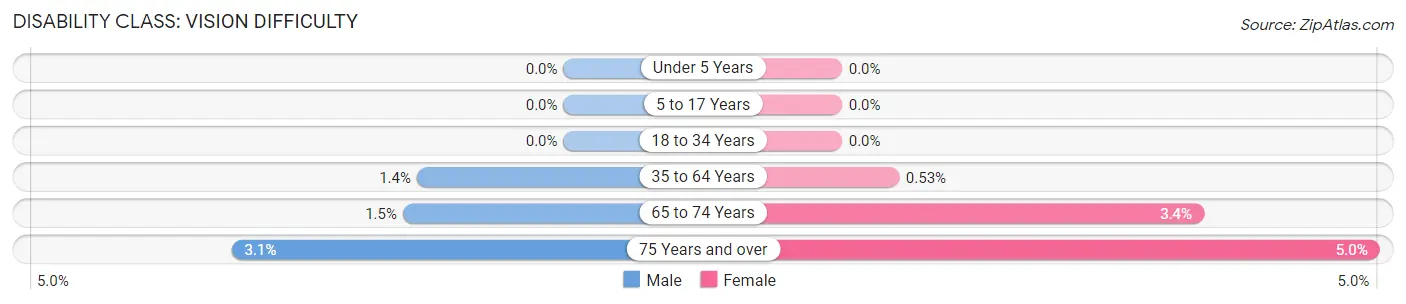
| Age Bracket | Male | Female |
| Under 5 Years | 0 (0.0%) | 0 (0.0%) |
| 5 to 17 Years | 0 (0.0%) | 0 (0.0%) |
| 18 to 34 Years | 0 (0.0%) | 0 (0.0%) |
| 35 to 64 Years | 59 (1.4%) | 32 (0.5%) |
| 65 to 74 Years | 226 (1.5%) | 691 (3.4%) |
| 75 Years and over | 508 (3.1%) | 782 (5.0%) |
Disability Class: Cognitive Difficulty
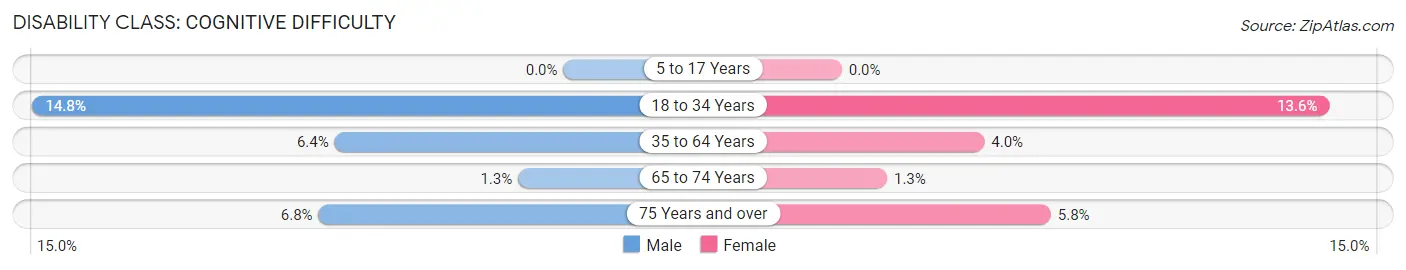
| Age Bracket | Male | Female |
| 5 to 17 Years | 0 (0.0%) | 0 (0.0%) |
| 18 to 34 Years | 34 (14.8%) | 35 (13.6%) |
| 35 to 64 Years | 277 (6.4%) | 240 (4.0%) |
| 65 to 74 Years | 191 (1.3%) | 260 (1.3%) |
| 75 Years and over | 1,124 (6.8%) | 912 (5.8%) |
Disability Class: Ambulatory Difficulty
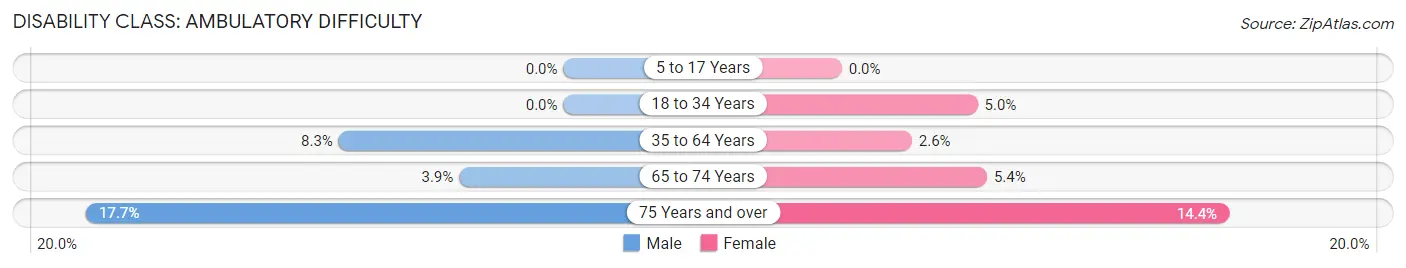
| Age Bracket | Male | Female |
| 5 to 17 Years | 0 (0.0%) | 0 (0.0%) |
| 18 to 34 Years | 0 (0.0%) | 13 (5.0%) |
| 35 to 64 Years | 363 (8.3%) | 157 (2.6%) |
| 65 to 74 Years | 587 (3.9%) | 1,108 (5.4%) |
| 75 Years and over | 2,922 (17.7%) | 2,252 (14.4%) |
Disability Class: Self-Care Difficulty
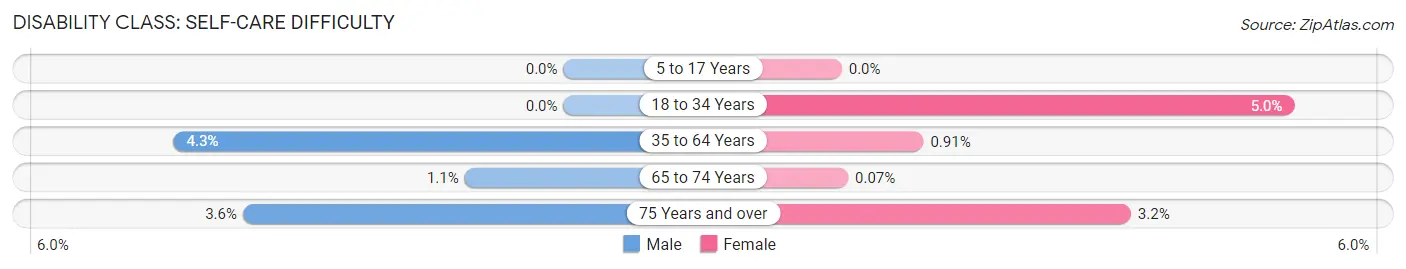
| Age Bracket | Male | Female |
| 5 to 17 Years | 0 (0.0%) | 0 (0.0%) |
| 18 to 34 Years | 0 (0.0%) | 13 (5.0%) |
| 35 to 64 Years | 189 (4.3%) | 55 (0.9%) |
| 65 to 74 Years | 167 (1.1%) | 15 (0.1%) |
| 75 Years and over | 588 (3.6%) | 505 (3.2%) |
Technology Access in The Villages
Computing Device Access in The Villages
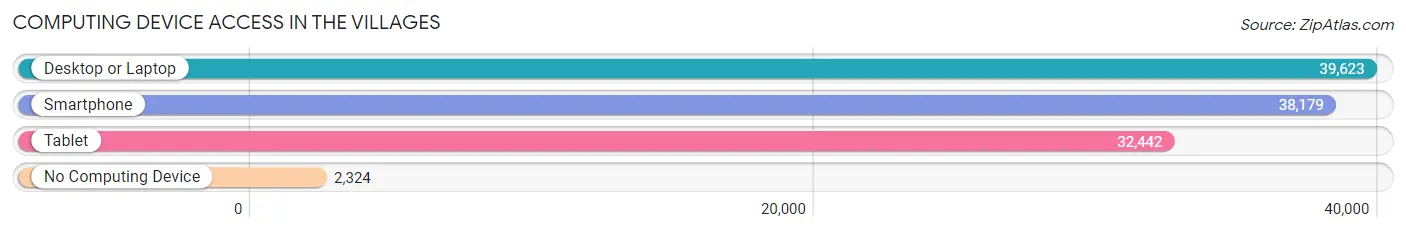
| Device Type | # Households | % Households |
| Desktop or Laptop | 39,623 | 86.1% |
| Smartphone | 38,179 | 83.0% |
| Tablet | 32,442 | 70.5% |
| No Computing Device | 2,324 | 5.1% |
| Total | 46,009 | 100.0% |
Internet Access in The Villages
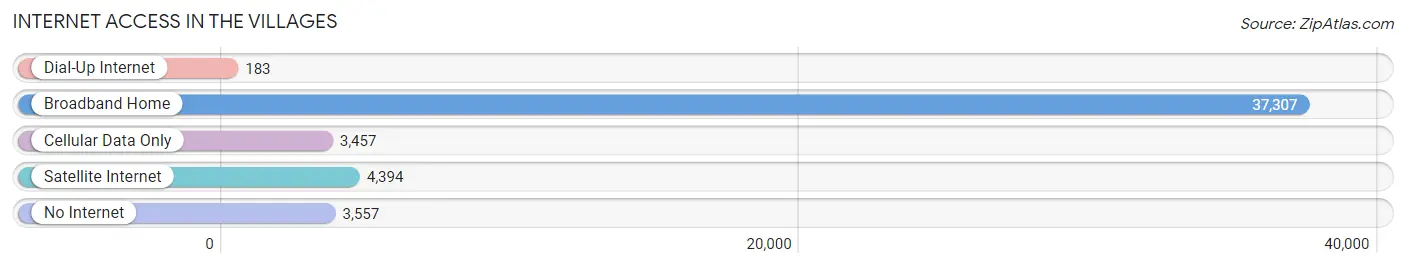
| Internet Type | # Households | % Households |
| Dial-Up Internet | 183 | 0.4% |
| Broadband Home | 37,307 | 81.1% |
| Cellular Data Only | 3,457 | 7.5% |
| Satellite Internet | 4,394 | 9.6% |
| No Internet | 3,557 | 7.7% |
| Total | 46,009 | 100.0% |
The Villages Summary
The Villages is a census-designated place (CDP) located in Sumter County, Florida, United States. It is part of the Orlando–Kissimmee–Sanford Metropolitan Statistical Area. The population was 51,442 at the 2010 census. It is the largest gated over-55 community in the world. It is also the fastest-growing CDP in the United States.
History
The Villages was founded in the late 1960s by Harold Schwartz, a developer from Miami. He purchased the land with the intention of creating a retirement community for seniors. The first homes were built in the early 1970s and the community quickly grew in popularity. By the late 1980s, The Villages had become one of the most popular retirement communities in the United States.
Geography
The Villages is located in central Florida, approximately 25 miles south of Ocala and 50 miles northwest of Orlando. It is situated in Sumter County, which is part of the Central Florida region. The Villages is located on the northern shore of Lake Sumter, a large freshwater lake. The area is characterized by rolling hills and lush vegetation.
Economy
The Villages is a major economic center in Central Florida. The area is home to a variety of businesses, including retail stores, restaurants, and medical facilities. The Villages is also home to several golf courses, which attract visitors from all over the world. The area is also home to a large number of retirement communities, which provide a steady source of income for the local economy.
Demographics
As of the 2010 census, The Villages had a population of 51,442. The racial makeup of the CDP was 94.2% White, 1.3% African American, 0.3% Native American, 1.2% Asian, 0.1% Pacific Islander, 1.7% from other races, and 1.2% from two or more races. Hispanic or Latino of any race were 5.2% of the population.
The median age in The Villages was 68.3 years. About 20.2% of residents were under the age of 18, and 8.2% were 65 years of age or older. The gender makeup of the CDP was 48.7% male and 51.3% female.
Conclusion
The Villages is a census-designated place located in Sumter County, Florida. It is the largest gated over-55 community in the world and is one of the most popular retirement communities in the United States. The area is characterized by rolling hills and lush vegetation, and is home to a variety of businesses, including retail stores, restaurants, and medical facilities. The population of The Villages was 51,442 at the 2010 census, with a median age of 68.3 years. The area is a major economic center in Central Florida and provides a steady source of income for the local economy.
Common Questions
What is Per Capita Income in The Villages?
Per Capita income in The Villages is $53,403.
What is the Median Family Income in The Villages?
Median Family Income in The Villages is $88,649.
What is the Median Household income in The Villages?
Median Household Income in The Villages is $73,415.
What is Income or Wage Gap in The Villages?
Income or Wage Gap in The Villages is 8.5%.
Women in The Villages earn 91.5 cents for every dollar earned by a man.
What is Inequality or Gini Index in The Villages?
Inequality or Gini Index in The Villages is 0.40.
What is the Total Population of The Villages?
Total Population of The Villages is 79,108.
What is the Total Male Population of The Villages?
Total Male Population of The Villages is 36,443.
What is the Total Female Population of The Villages?
Total Female Population of The Villages is 42,665.
What is the Ratio of Males per 100 Females in The Villages?
There are 85.42 Males per 100 Females in The Villages.
What is the Ratio of Females per 100 Males in The Villages?
There are 117.07 Females per 100 Males in The Villages.
What is the Median Population Age in The Villages?
Median Population Age in The Villages is 73.4 Years.
What is the Average Family Size in The Villages
Average Family Size in The Villages is 2.0 People.
What is the Average Household Size in The Villages
Average Household Size in The Villages is 1.7 People.
How Large is the Labor Force in The Villages?
There are 9,145 People in the Labor Forcein in The Villages.
What is the Percentage of People in the Labor Force in The Villages?
11.6% of People are in the Labor Force in The Villages.
What is the Unemployment Rate in The Villages?
Unemployment Rate in The Villages is 2.7%.