Parkland, FL Map & Demographics
Parkland Map
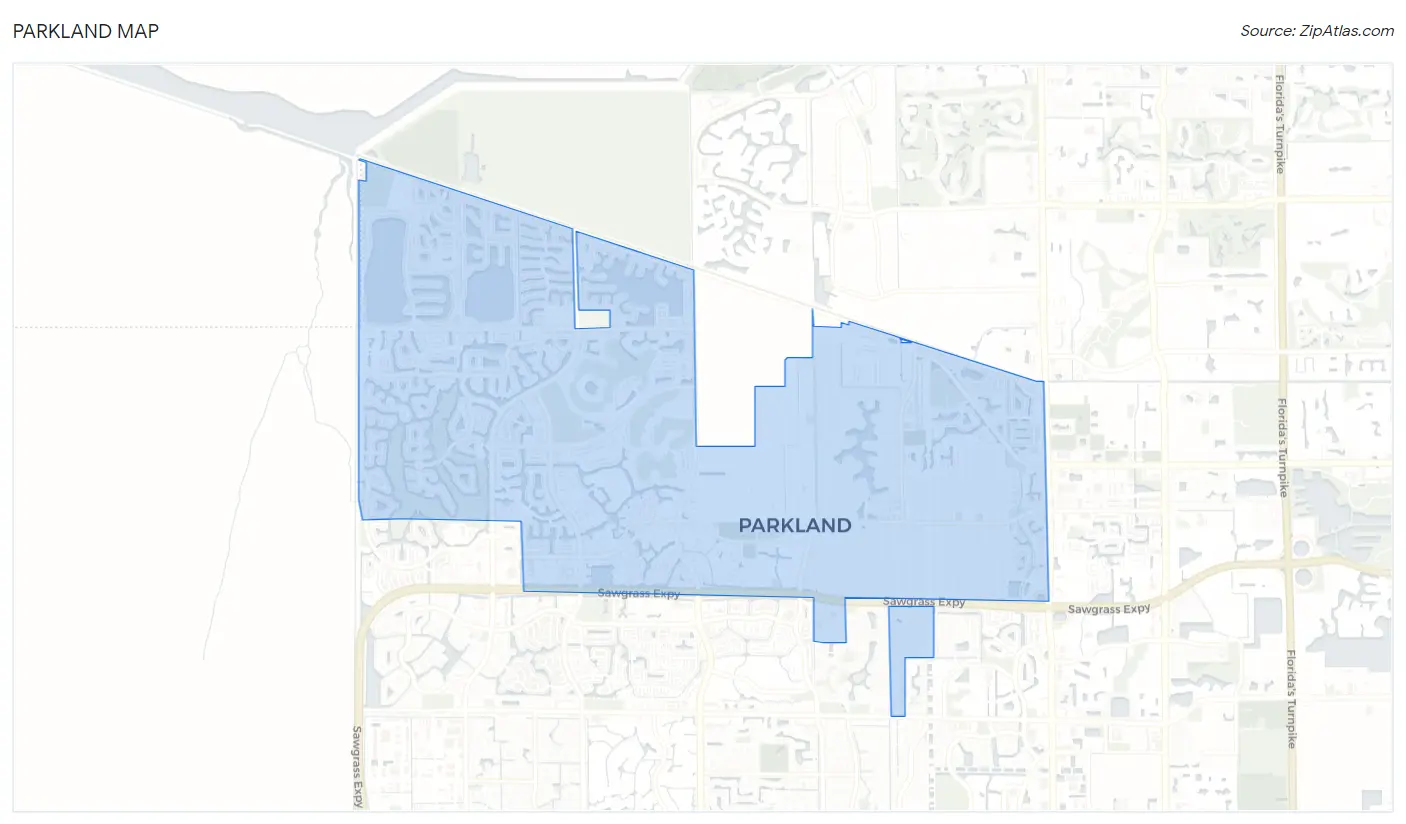
Parkland Overview
$63,915
PER CAPITA INCOME
$197,589
AVG FAMILY INCOME
$188,544
AVG HOUSEHOLD INCOME
38.6%
WAGE / INCOME GAP [ % ]
61.4¢/ $1
WAGE / INCOME GAP [ $ ]
$7,681
FAMILY INCOME DEFICIT
0.40
INEQUALITY / GINI INDEX
34,832
TOTAL POPULATION
18,164
MALE POPULATION
16,668
FEMALE POPULATION
108.98
MALES / 100 FEMALES
91.76
FEMALES / 100 MALES
38.4
MEDIAN AGE
3.7
AVG FAMILY SIZE
3.3
AVG HOUSEHOLD SIZE
16,233
LABOR FORCE [ PEOPLE ]
64.2%
PERCENT IN LABOR FORCE
4.5%
UNEMPLOYMENT RATE
Parkland Area Codes
Income in Parkland
Income Overview in Parkland
Per Capita Income in Parkland is $63,915, while median incomes of families and households are $197,589 and $188,544 respectively.
| Characteristic | Number | Measure |
| Per Capita Income | 34,832 | $63,915 |
| Median Family Income | 8,642 | $197,589 |
| Mean Family Income | 8,642 | $226,353 |
| Median Household Income | 10,408 | $188,544 |
| Mean Household Income | 10,408 | $211,383 |
| Income Deficit | 8,642 | $7,681 |
| Wage / Income Gap (%) | 34,832 | 38.59% |
| Wage / Income Gap ($) | 34,832 | 61.41¢ per $1 |
| Gini / Inequality Index | 34,832 | 0.40 |
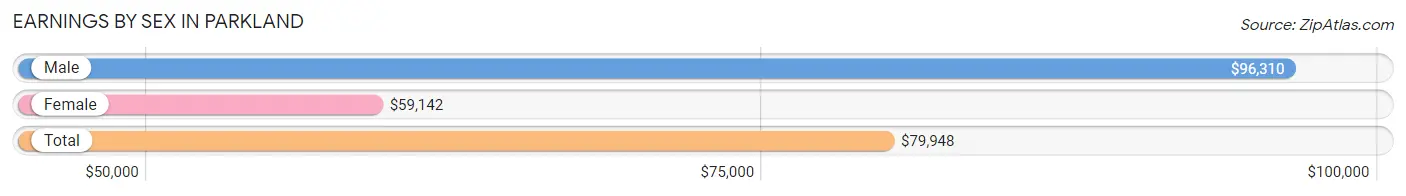
Earnings by Sex in Parkland
Average Earnings in Parkland are $79,948, $96,310 for men and $59,142 for women, a difference of 38.6%.
| Sex | Number | Average Earnings |
| Male | 9,366 (56.3%) | $96,310 |
| Female | 7,277 (43.7%) | $59,142 |
| Total | 16,643 (100.0%) | $79,948 |
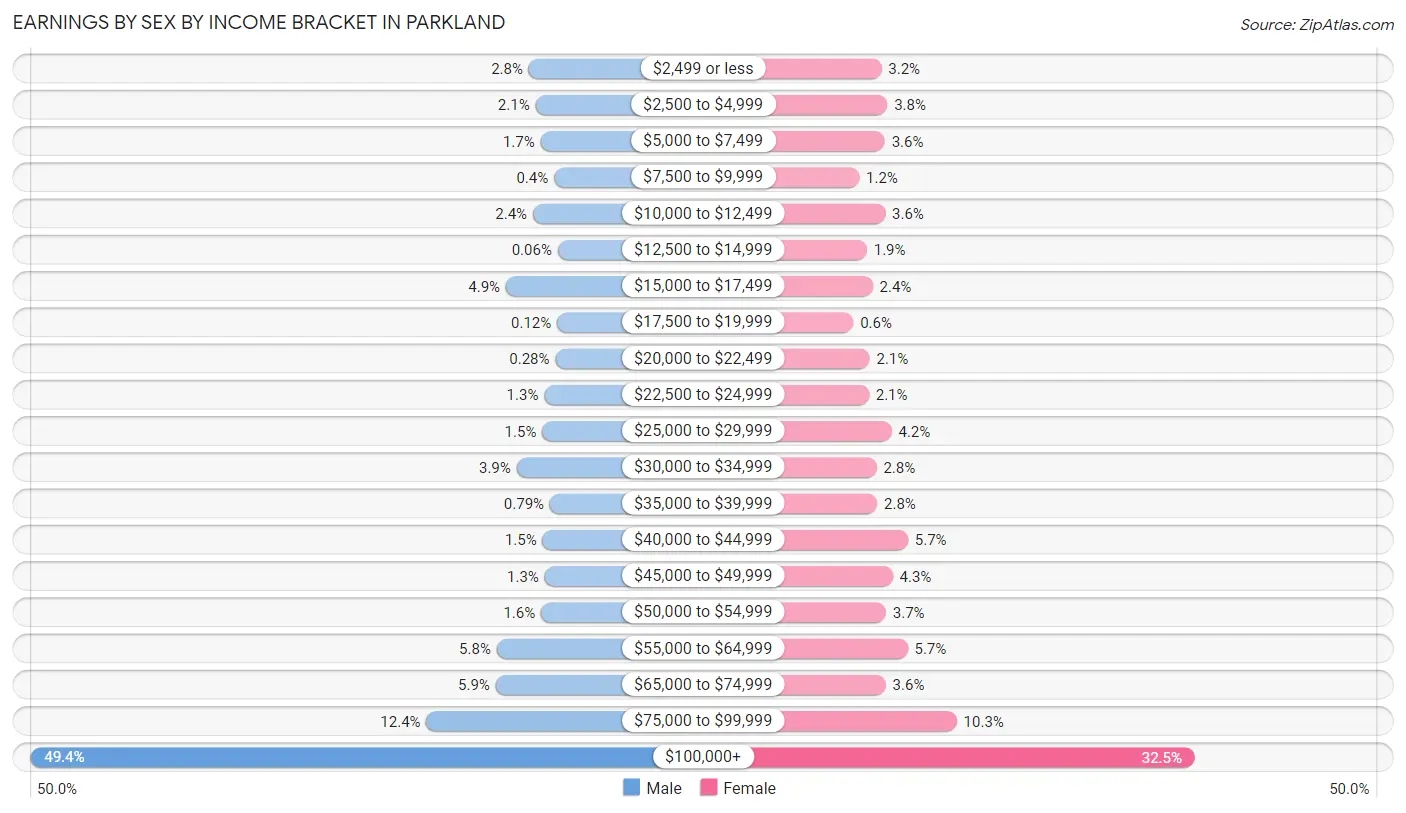
Earnings by Sex by Income Bracket in Parkland
The most common earnings brackets in Parkland are $100,000+ for men (4,624 | 49.4%) and $100,000+ for women (2,365 | 32.5%).
| Income | Male | Female |
| $2,499 or less | 259 (2.8%) | 236 (3.2%) |
| $2,500 to $4,999 | 200 (2.1%) | 276 (3.8%) |
| $5,000 to $7,499 | 156 (1.7%) | 258 (3.5%) |
| $7,500 to $9,999 | 37 (0.4%) | 84 (1.1%) |
| $10,000 to $12,499 | 223 (2.4%) | 261 (3.6%) |
| $12,500 to $14,999 | 6 (0.1%) | 136 (1.9%) |
| $15,000 to $17,499 | 460 (4.9%) | 176 (2.4%) |
| $17,500 to $19,999 | 11 (0.1%) | 44 (0.6%) |
| $20,000 to $22,499 | 26 (0.3%) | 155 (2.1%) |
| $22,500 to $24,999 | 124 (1.3%) | 150 (2.1%) |
| $25,000 to $29,999 | 141 (1.5%) | 305 (4.2%) |
| $30,000 to $34,999 | 366 (3.9%) | 202 (2.8%) |
| $35,000 to $39,999 | 74 (0.8%) | 207 (2.8%) |
| $40,000 to $44,999 | 139 (1.5%) | 416 (5.7%) |
| $45,000 to $49,999 | 120 (1.3%) | 312 (4.3%) |
| $50,000 to $54,999 | 152 (1.6%) | 266 (3.7%) |
| $55,000 to $64,999 | 540 (5.8%) | 414 (5.7%) |
| $65,000 to $74,999 | 550 (5.9%) | 265 (3.6%) |
| $75,000 to $99,999 | 1,158 (12.4%) | 749 (10.3%) |
| $100,000+ | 4,624 (49.4%) | 2,365 (32.5%) |
| Total | 9,366 (100.0%) | 7,277 (100.0%) |
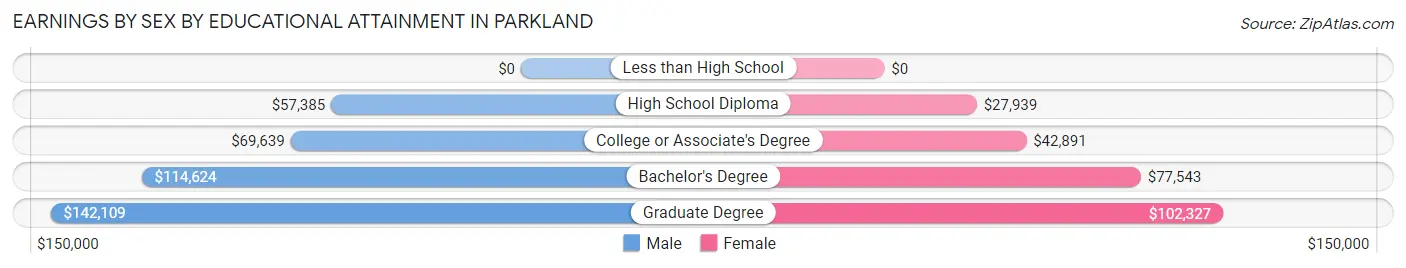
Earnings by Sex by Educational Attainment in Parkland
Average earnings in Parkland are $112,718 for men and $70,243 for women, a difference of 37.7%. Men with an educational attainment of graduate degree enjoy the highest average annual earnings of $142,109, while those with high school diploma education earn the least with $57,385. Women with an educational attainment of graduate degree earn the most with the average annual earnings of $102,327, while those with high school diploma education have the smallest earnings of $27,939.
| Educational Attainment | Male Income | Female Income |
| Less than High School | - | - |
| High School Diploma | $57,385 | $27,939 |
| College or Associate's Degree | $69,639 | $42,891 |
| Bachelor's Degree | $114,624 | $77,543 |
| Graduate Degree | $142,109 | $102,327 |
| Total | $112,718 | $70,243 |
Family Income in Parkland
Family Income Brackets in Parkland
According to the Parkland family income data, there are 4,217 families falling into the $200,000+ income range, which is the most common income bracket and makes up 48.8% of all families. Conversely, the $25,000 to $34,999 income bracket is the least frequent group with only 17 families (0.2%) belonging to this category.
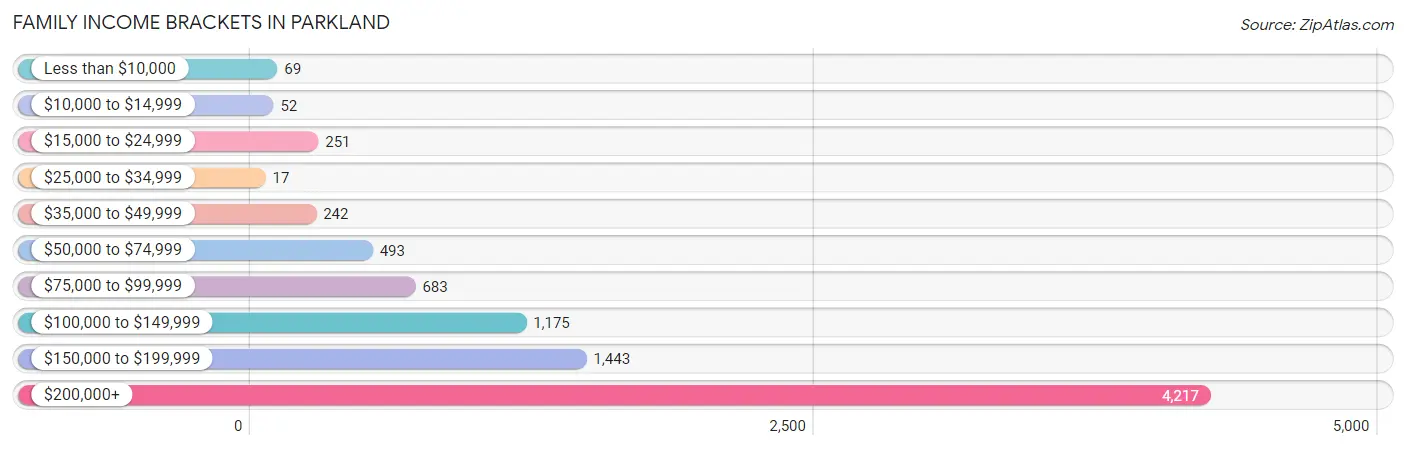
| Income Bracket | # Families | % Families |
| Less than $10,000 | 69 | 0.8% |
| $10,000 to $14,999 | 52 | 0.6% |
| $15,000 to $24,999 | 251 | 2.9% |
| $25,000 to $34,999 | 17 | 0.2% |
| $35,000 to $49,999 | 242 | 2.8% |
| $50,000 to $74,999 | 493 | 5.7% |
| $75,000 to $99,999 | 683 | 7.9% |
| $100,000 to $149,999 | 1,175 | 13.6% |
| $150,000 to $199,999 | 1,443 | 16.7% |
| $200,000+ | 4,217 | 48.8% |
Family Income by Famaliy Size in Parkland
5-person families (1,396 | 16.2%) account for the highest median family income in Parkland with $222,653 per family, while 2-person families (2,348 | 27.2%) have the highest median income of $82,564 per family member.
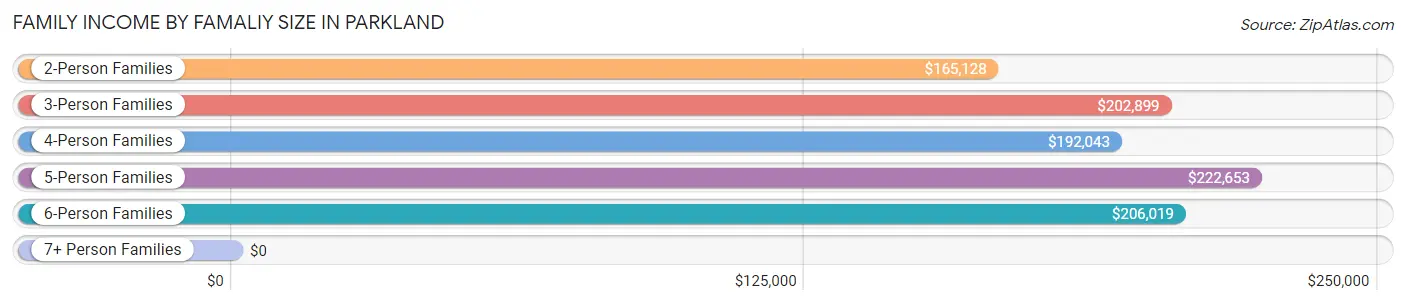
| Income Bracket | # Families | Median Income |
| 2-Person Families | 2,348 (27.2%) | $165,128 |
| 3-Person Families | 2,043 (23.6%) | $202,899 |
| 4-Person Families | 2,323 (26.9%) | $192,043 |
| 5-Person Families | 1,396 (16.2%) | $222,653 |
| 6-Person Families | 479 (5.5%) | $206,019 |
| 7+ Person Families | 53 (0.6%) | $0 |
| Total | 8,642 (100.0%) | $197,589 |
Family Income by Number of Earners in Parkland
The median family income in Parkland is $197,589, with families comprising 2 earners (3,739) having the highest median family income of $227,259, while families with no earners (978) have the lowest median family income of $90,305, accounting for 43.3% and 11.3% of families, respectively.
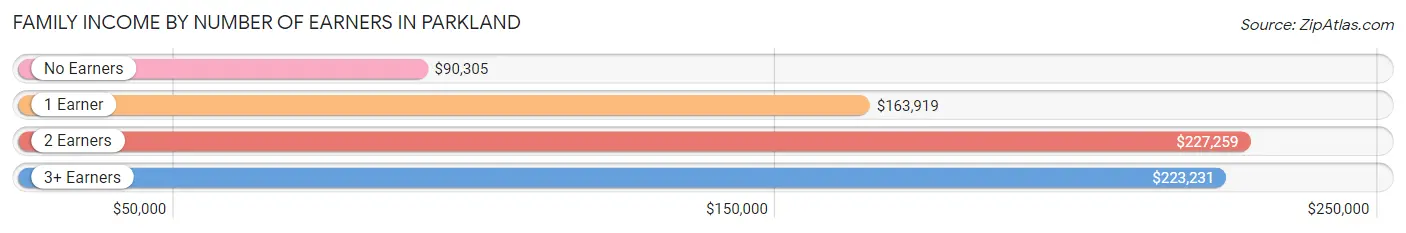
| Number of Earners | # Families | Median Income |
| No Earners | 978 (11.3%) | $90,305 |
| 1 Earner | 2,611 (30.2%) | $163,919 |
| 2 Earners | 3,739 (43.3%) | $227,259 |
| 3+ Earners | 1,314 (15.2%) | $223,231 |
| Total | 8,642 (100.0%) | $197,589 |
Household Income in Parkland
Household Income Brackets in Parkland
With 4,777 households falling in the category, the $200,000+ income range is the most frequent in Parkland, accounting for 45.9% of all households. In contrast, only 52 households (0.5%) fall into the $10,000 to $14,999 income bracket, making it the least populous group.
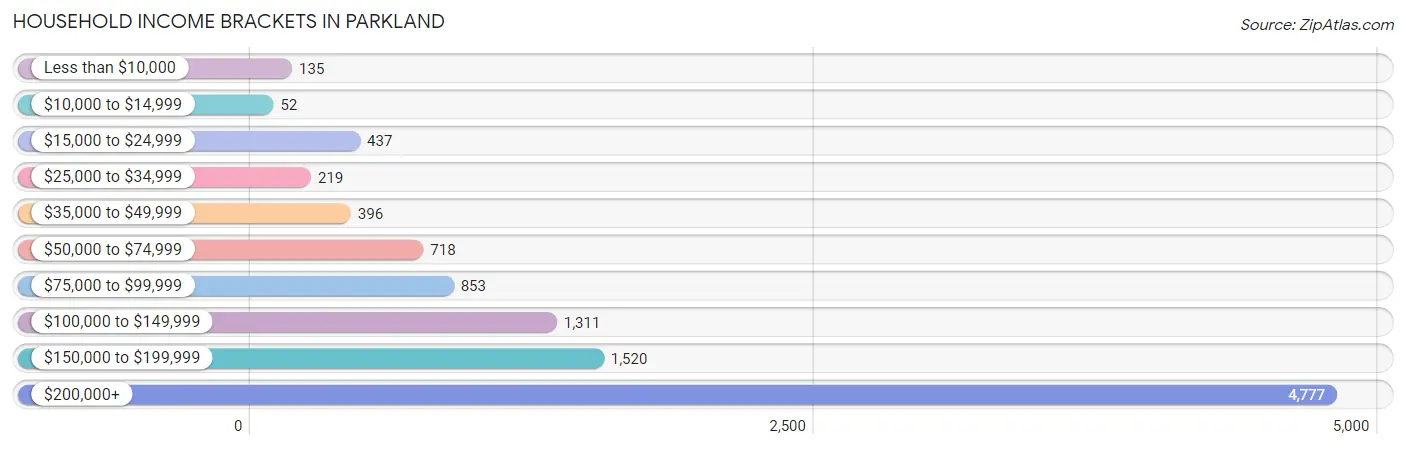
| Income Bracket | # Households | % Households |
| Less than $10,000 | 135 | 1.3% |
| $10,000 to $14,999 | 52 | 0.5% |
| $15,000 to $24,999 | 437 | 4.2% |
| $25,000 to $34,999 | 219 | 2.1% |
| $35,000 to $49,999 | 396 | 3.8% |
| $50,000 to $74,999 | 718 | 6.9% |
| $75,000 to $99,999 | 853 | 8.2% |
| $100,000 to $149,999 | 1,311 | 12.6% |
| $150,000 to $199,999 | 1,520 | 14.6% |
| $200,000+ | 4,777 | 45.9% |
Household Income by Householder Age in Parkland
The median household income in Parkland is $188,544, with the highest median household income of $209,744 found in the 45 to 64 years age bracket for the primary householder. A total of 5,038 households (48.4%) fall into this category.
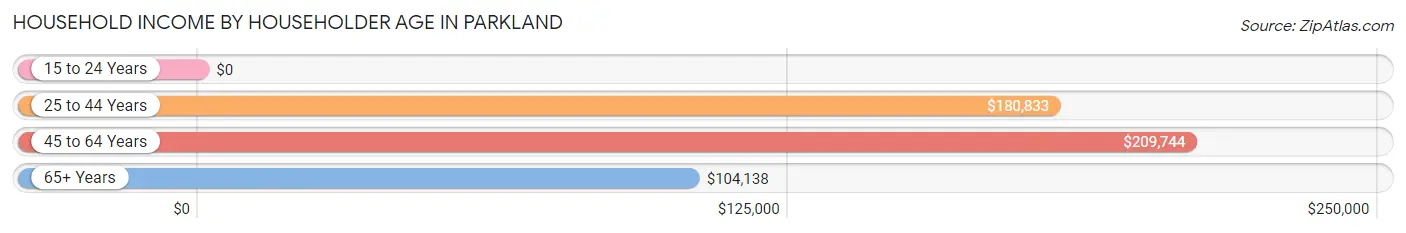
| Income Bracket | # Households | Median Income |
| 15 to 24 Years | 0 (0.0%) | $0 |
| 25 to 44 Years | 3,064 (29.4%) | $180,833 |
| 45 to 64 Years | 5,038 (48.4%) | $209,744 |
| 65+ Years | 2,306 (22.2%) | $104,138 |
| Total | 10,408 (100.0%) | $188,544 |
Poverty in Parkland
Income Below Poverty by Sex and Age in Parkland
With 2.7% poverty level for males and 5.1% for females among the residents of Parkland, 65 to 74 year old males and 15 year old females are the most vulnerable to poverty, with 118 males (10.1%) and 105 females (21.3%) in their respective age groups living below the poverty level.
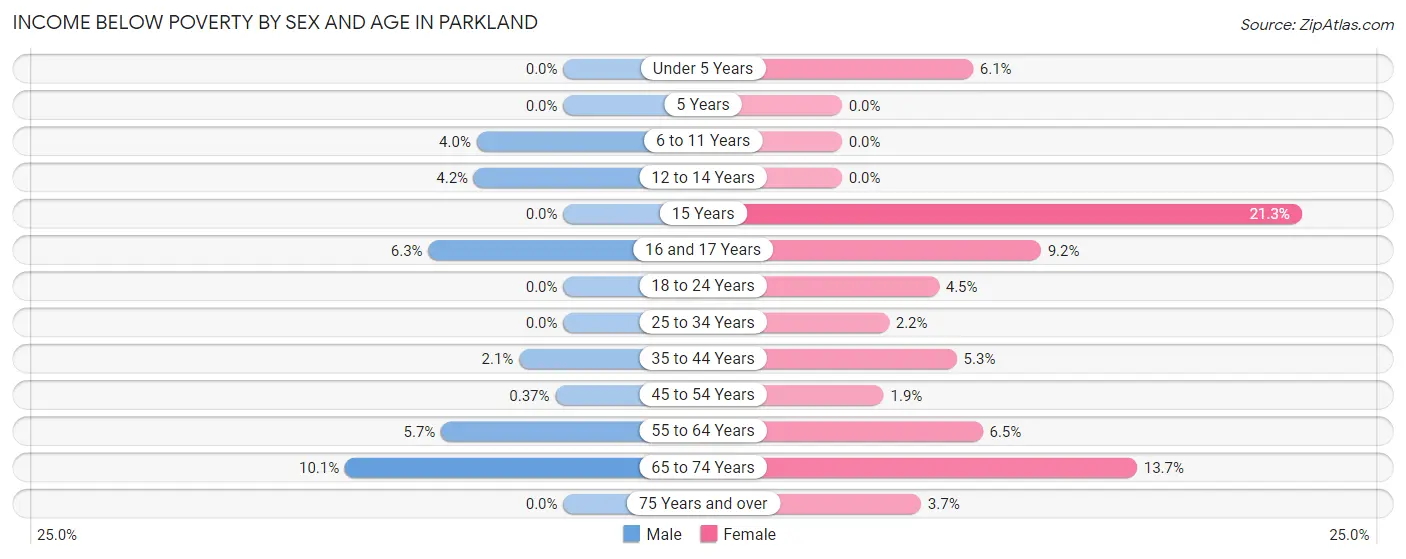
| Age Bracket | Male | Female |
| Under 5 Years | 0 (0.0%) | 50 (6.1%) |
| 5 Years | 0 (0.0%) | 0 (0.0%) |
| 6 to 11 Years | 76 (4.0%) | 0 (0.0%) |
| 12 to 14 Years | 66 (4.2%) | 0 (0.0%) |
| 15 Years | 0 (0.0%) | 105 (21.3%) |
| 16 and 17 Years | 56 (6.3%) | 54 (9.2%) |
| 18 to 24 Years | 0 (0.0%) | 52 (4.5%) |
| 25 to 34 Years | 0 (0.0%) | 25 (2.2%) |
| 35 to 44 Years | 44 (2.1%) | 146 (5.3%) |
| 45 to 54 Years | 11 (0.4%) | 52 (1.9%) |
| 55 to 64 Years | 120 (5.7%) | 126 (6.5%) |
| 65 to 74 Years | 118 (10.1%) | 215 (13.7%) |
| 75 Years and over | 0 (0.0%) | 28 (3.7%) |
| Total | 491 (2.7%) | 853 (5.1%) |
Income Above Poverty by Sex and Age in Parkland
According to the poverty statistics in Parkland, males aged under 5 years and females aged 5 years are the age groups that are most secure financially, with 100.0% of males and 100.0% of females in these age groups living above the poverty line.
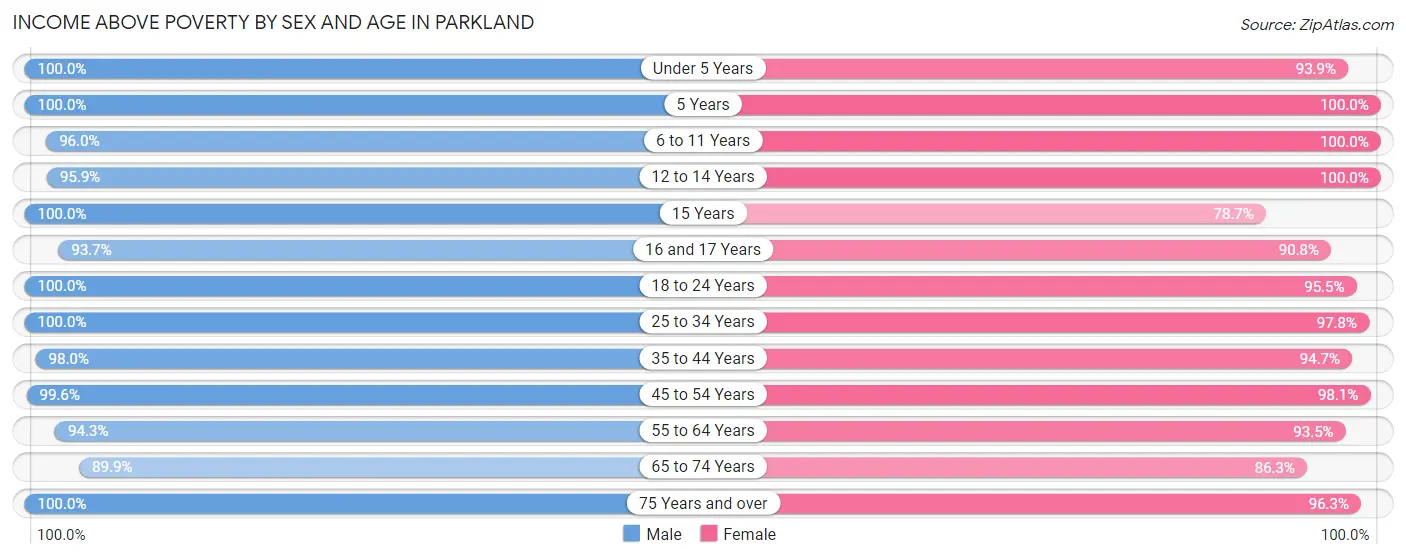
| Age Bracket | Male | Female |
| Under 5 Years | 1,407 (100.0%) | 773 (93.9%) |
| 5 Years | 340 (100.0%) | 219 (100.0%) |
| 6 to 11 Years | 1,814 (96.0%) | 1,511 (100.0%) |
| 12 to 14 Years | 1,526 (95.9%) | 1,009 (100.0%) |
| 15 Years | 227 (100.0%) | 387 (78.7%) |
| 16 and 17 Years | 839 (93.7%) | 531 (90.8%) |
| 18 to 24 Years | 1,257 (100.0%) | 1,104 (95.5%) |
| 25 to 34 Years | 1,279 (100.0%) | 1,124 (97.8%) |
| 35 to 44 Years | 2,103 (98.0%) | 2,593 (94.7%) |
| 45 to 54 Years | 2,981 (99.6%) | 2,631 (98.1%) |
| 55 to 64 Years | 1,997 (94.3%) | 1,803 (93.5%) |
| 65 to 74 Years | 1,047 (89.9%) | 1,355 (86.3%) |
| 75 Years and over | 832 (100.0%) | 735 (96.3%) |
| Total | 17,649 (97.3%) | 15,775 (94.9%) |
Income Below Poverty Among Married-Couple Families in Parkland
The poverty statistics for married-couple families in Parkland show that 3.3% or 260 of the total 7,816 families live below the poverty line. Families with no children have the highest poverty rate of 4.2%, comprising of 141 families. On the other hand, families with 3 or 4 children have the lowest poverty rate of 0.0%, which includes 0 families.
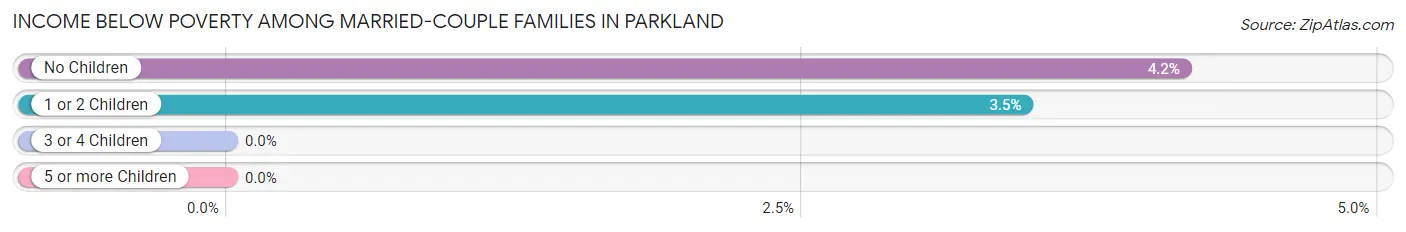
| Children | Above Poverty | Below Poverty |
| No Children | 3,258 (95.9%) | 141 (4.2%) |
| 1 or 2 Children | 3,316 (96.5%) | 119 (3.5%) |
| 3 or 4 Children | 971 (100.0%) | 0 (0.0%) |
| 5 or more Children | 11 (100.0%) | 0 (0.0%) |
| Total | 7,556 (96.7%) | 260 (3.3%) |
Income Below Poverty Among Single-Parent Households in Parkland
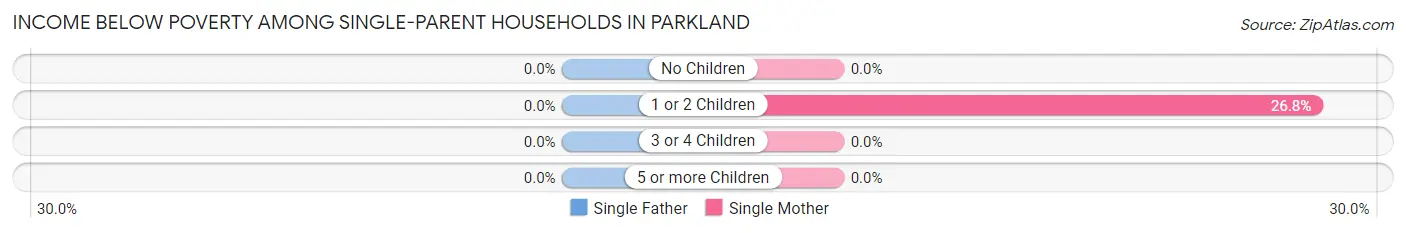
| Children | Single Father | Single Mother |
| No Children | 0 (0.0%) | 0 (0.0%) |
| 1 or 2 Children | 0 (0.0%) | 71 (26.8%) |
| 3 or 4 Children | 0 (0.0%) | 0 (0.0%) |
| 5 or more Children | 0 (0.0%) | 0 (0.0%) |
| Total | 0 (0.0%) | 71 (17.7%) |
Income Below Poverty Among Married-Couple vs Single-Parent Households in Parkland
The poverty data for Parkland shows that 260 of the married-couple family households (3.3%) and 71 of the single-parent households (8.6%) are living below the poverty level. Within the married-couple family households, those with no children have the highest poverty rate, with 141 households (4.2%) falling below the poverty line. Among the single-parent households, those with 1 or 2 children have the highest poverty rate, with 71 household (13.4%) living below poverty.
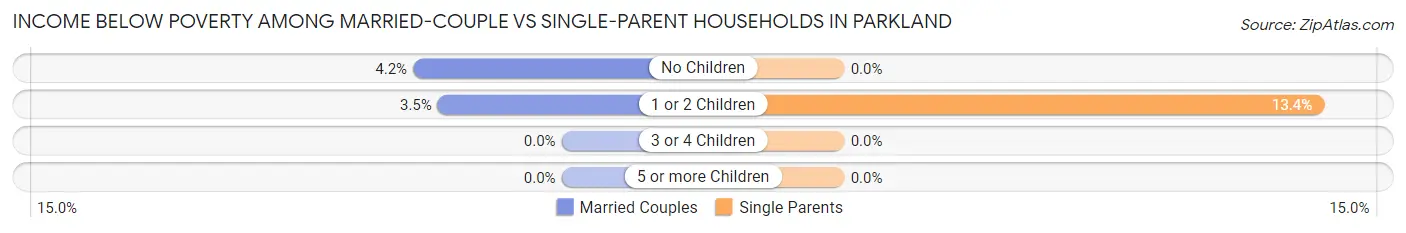
| Children | Married-Couple Families | Single-Parent Households |
| No Children | 141 (4.2%) | 0 (0.0%) |
| 1 or 2 Children | 119 (3.5%) | 71 (13.4%) |
| 3 or 4 Children | 0 (0.0%) | 0 (0.0%) |
| 5 or more Children | 0 (0.0%) | 0 (0.0%) |
| Total | 260 (3.3%) | 71 (8.6%) |
Race in Parkland
The most populous races in Parkland are White / Caucasian (22,770 | 65.4%), Hispanic or Latino (5,124 | 14.7%), and Black / African American (4,765 | 13.7%).
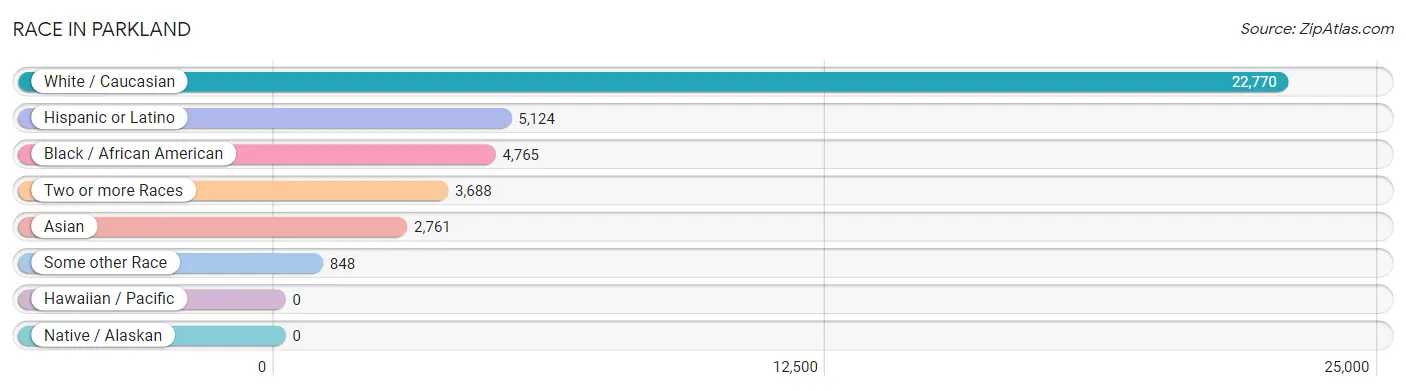
| Race | # Population | % Population |
| Asian | 2,761 | 7.9% |
| Black / African American | 4,765 | 13.7% |
| Hawaiian / Pacific | 0 | 0.0% |
| Hispanic or Latino | 5,124 | 14.7% |
| Native / Alaskan | 0 | 0.0% |
| White / Caucasian | 22,770 | 65.4% |
| Two or more Races | 3,688 | 10.6% |
| Some other Race | 848 | 2.4% |
| Total | 34,832 | 100.0% |
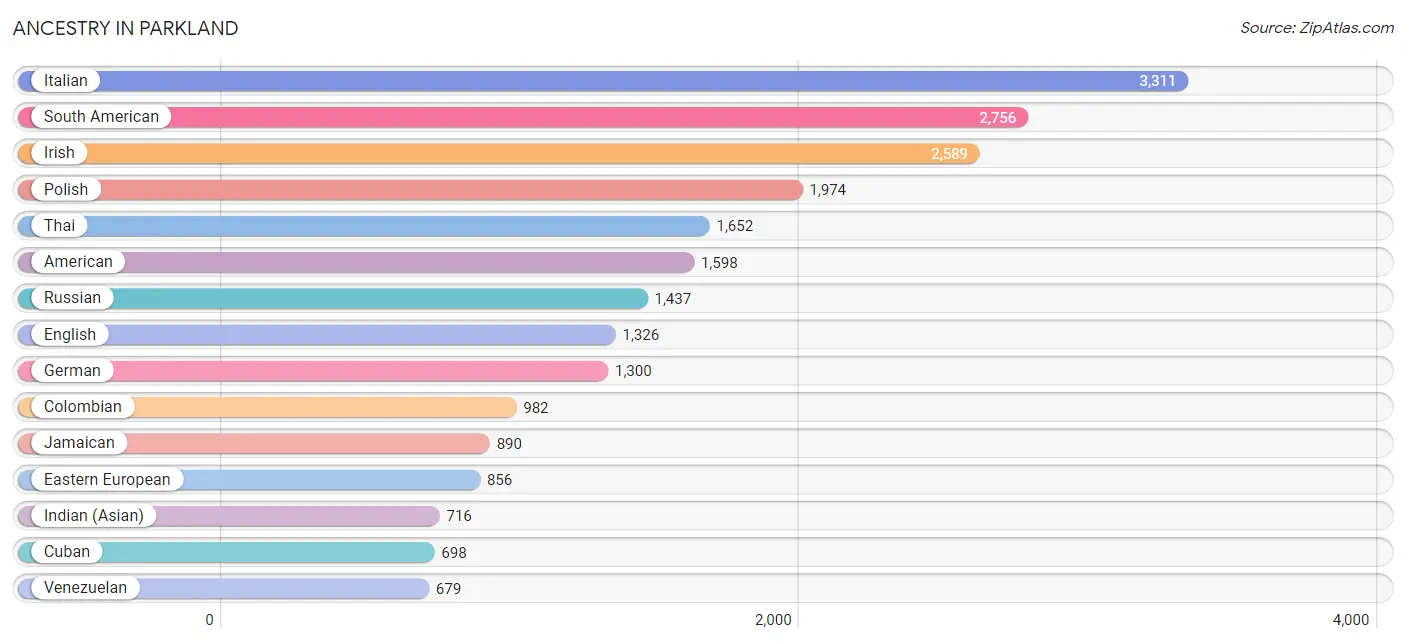
Ancestry in Parkland
The most populous ancestries reported in Parkland are Italian (3,311 | 9.5%), South American (2,756 | 7.9%), Irish (2,589 | 7.4%), Polish (1,974 | 5.7%), and Thai (1,652 | 4.7%), together accounting for 35.3% of all Parkland residents.
| Ancestry | # Population | % Population |
| American | 1,598 | 4.6% |
| Arab | 323 | 0.9% |
| Argentinean | 139 | 0.4% |
| Armenian | 18 | 0.1% |
| Australian | 37 | 0.1% |
| Austrian | 385 | 1.1% |
| Bahamian | 75 | 0.2% |
| Belgian | 11 | 0.0% |
| Bhutanese | 176 | 0.5% |
| Bolivian | 71 | 0.2% |
| Brazilian | 182 | 0.5% |
| British | 357 | 1.0% |
| Burmese | 43 | 0.1% |
| Canadian | 165 | 0.5% |
| Central American | 221 | 0.6% |
| Cherokee | 59 | 0.2% |
| Chilean | 108 | 0.3% |
| Colombian | 982 | 2.8% |
| Costa Rican | 34 | 0.1% |
| Croatian | 30 | 0.1% |
| Cuban | 698 | 2.0% |
| Czech | 65 | 0.2% |
| Czechoslovakian | 6 | 0.0% |
| Dominican | 36 | 0.1% |
| Dutch | 117 | 0.3% |
| Eastern European | 856 | 2.5% |
| Ecuadorian | 276 | 0.8% |
| English | 1,326 | 3.8% |
| European | 281 | 0.8% |
| French | 574 | 1.7% |
| French Canadian | 10 | 0.0% |
| German | 1,300 | 3.7% |
| Greek | 440 | 1.3% |
| Haitian | 568 | 1.6% |
| Hungarian | 315 | 0.9% |
| Indian (Asian) | 716 | 2.1% |
| Iranian | 87 | 0.3% |
| Irish | 2,589 | 7.4% |
| Israeli | 562 | 1.6% |
| Italian | 3,311 | 9.5% |
| Jamaican | 890 | 2.6% |
| Korean | 340 | 1.0% |
| Latvian | 33 | 0.1% |
| Lebanese | 25 | 0.1% |
| Lithuanian | 580 | 1.7% |
| Macedonian | 9 | 0.0% |
| Mexican | 657 | 1.9% |
| Mexican American Indian | 82 | 0.2% |
| Moroccan | 151 | 0.4% |
| Nicaraguan | 72 | 0.2% |
| Nigerian | 36 | 0.1% |
| Norwegian | 39 | 0.1% |
| Panamanian | 42 | 0.1% |
| Peruvian | 493 | 1.4% |
| Polish | 1,974 | 5.7% |
| Portuguese | 396 | 1.1% |
| Puerto Rican | 666 | 1.9% |
| Romanian | 60 | 0.2% |
| Russian | 1,437 | 4.1% |
| Salvadoran | 73 | 0.2% |
| Samoan | 28 | 0.1% |
| Scandinavian | 13 | 0.0% |
| Scotch-Irish | 109 | 0.3% |
| Scottish | 268 | 0.8% |
| Slovak | 99 | 0.3% |
| South African | 289 | 0.8% |
| South American | 2,756 | 7.9% |
| Spanish | 90 | 0.3% |
| Sri Lankan | 181 | 0.5% |
| Subsaharan African | 325 | 0.9% |
| Swedish | 126 | 0.4% |
| Syrian | 57 | 0.2% |
| Thai | 1,652 | 4.7% |
| Turkish | 232 | 0.7% |
| Ukrainian | 374 | 1.1% |
| Uruguayan | 8 | 0.0% |
| Venezuelan | 679 | 1.9% |
| Welsh | 34 | 0.1% |
| West Indian | 85 | 0.2% | View All 79 Rows |
Immigrants in Parkland
The most numerous immigrant groups reported in Parkland came from Latin America (3,874 | 11.1%), Asia (2,709 | 7.8%), South America (2,335 | 6.7%), Caribbean (1,260 | 3.6%), and South Central Asia (1,199 | 3.4%), together accounting for 32.7% of all Parkland residents.
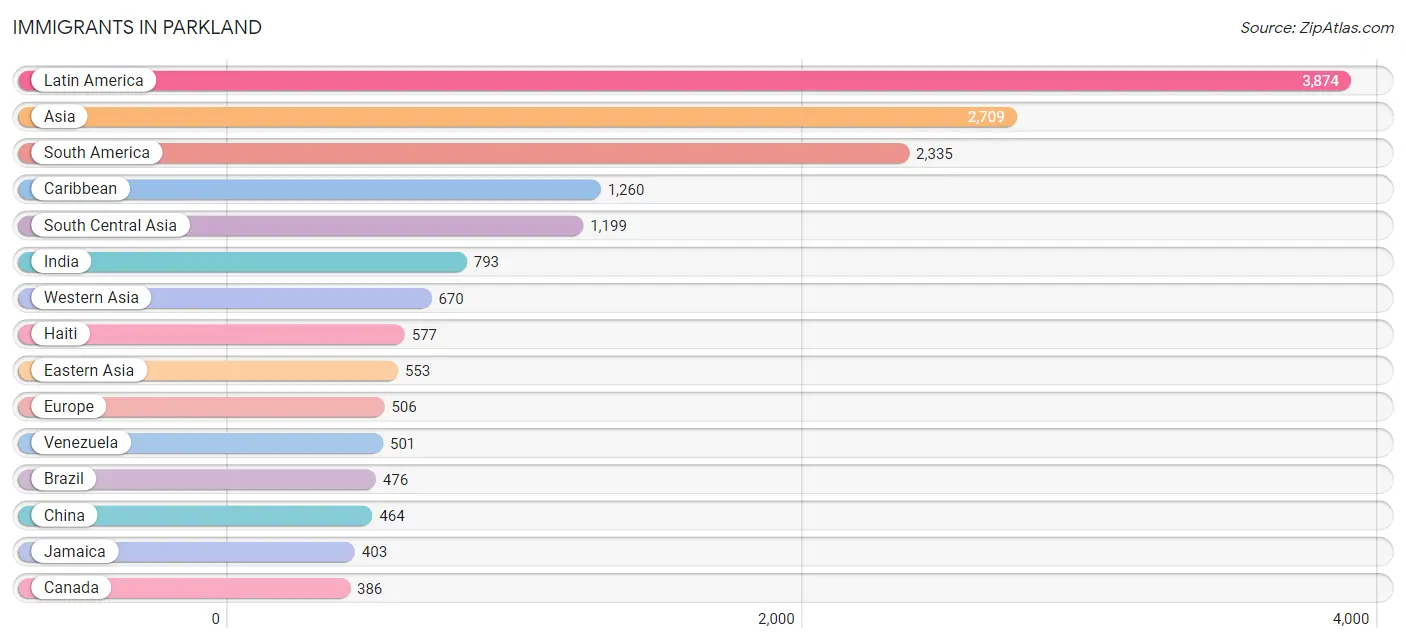
| Immigration Origin | # Population | % Population |
| Africa | 199 | 0.6% |
| Argentina | 240 | 0.7% |
| Asia | 2,709 | 7.8% |
| Bahamas | 27 | 0.1% |
| Bangladesh | 265 | 0.8% |
| Belgium | 49 | 0.1% |
| Bolivia | 25 | 0.1% |
| Brazil | 476 | 1.4% |
| Canada | 386 | 1.1% |
| Caribbean | 1,260 | 3.6% |
| Central America | 279 | 0.8% |
| Chile | 66 | 0.2% |
| China | 464 | 1.3% |
| Colombia | 311 | 0.9% |
| Costa Rica | 34 | 0.1% |
| Cuba | 169 | 0.5% |
| Czechoslovakia | 33 | 0.1% |
| Dominican Republic | 16 | 0.1% |
| Eastern Asia | 553 | 1.6% |
| Eastern Europe | 243 | 0.7% |
| Ecuador | 230 | 0.7% |
| El Salvador | 46 | 0.1% |
| England | 80 | 0.2% |
| Europe | 506 | 1.5% |
| France | 25 | 0.1% |
| Germany | 72 | 0.2% |
| Guyana | 194 | 0.6% |
| Haiti | 577 | 1.7% |
| Hong Kong | 11 | 0.0% |
| India | 793 | 2.3% |
| Iran | 87 | 0.3% |
| Iraq | 78 | 0.2% |
| Israel | 349 | 1.0% |
| Jamaica | 403 | 1.2% |
| Japan | 58 | 0.2% |
| Korea | 31 | 0.1% |
| Latin America | 3,874 | 11.1% |
| Lebanon | 4 | 0.0% |
| Lithuania | 17 | 0.1% |
| Mexico | 125 | 0.4% |
| Moldova | 29 | 0.1% |
| Nicaragua | 46 | 0.1% |
| Northern Europe | 117 | 0.3% |
| Norway | 13 | 0.0% |
| Pakistan | 47 | 0.1% |
| Panama | 28 | 0.1% |
| Peru | 284 | 0.8% |
| Philippines | 132 | 0.4% |
| Poland | 67 | 0.2% |
| South Africa | 199 | 0.6% |
| South America | 2,335 | 6.7% |
| South Central Asia | 1,199 | 3.4% |
| South Eastern Asia | 287 | 0.8% |
| Sweden | 9 | 0.0% |
| Syria | 47 | 0.1% |
| Trinidad and Tobago | 58 | 0.2% |
| Turkey | 110 | 0.3% |
| Ukraine | 58 | 0.2% |
| Uruguay | 8 | 0.0% |
| Uzbekistan | 7 | 0.0% |
| Venezuela | 501 | 1.4% |
| Vietnam | 155 | 0.4% |
| Western Asia | 670 | 1.9% |
| Western Europe | 146 | 0.4% | View All 64 Rows |
Sex and Age in Parkland
Sex and Age in Parkland
The most populous age groups in Parkland are 10 to 14 Years (2,054 | 11.3%) for men and 10 to 14 Years (1,948 | 11.7%) for women.
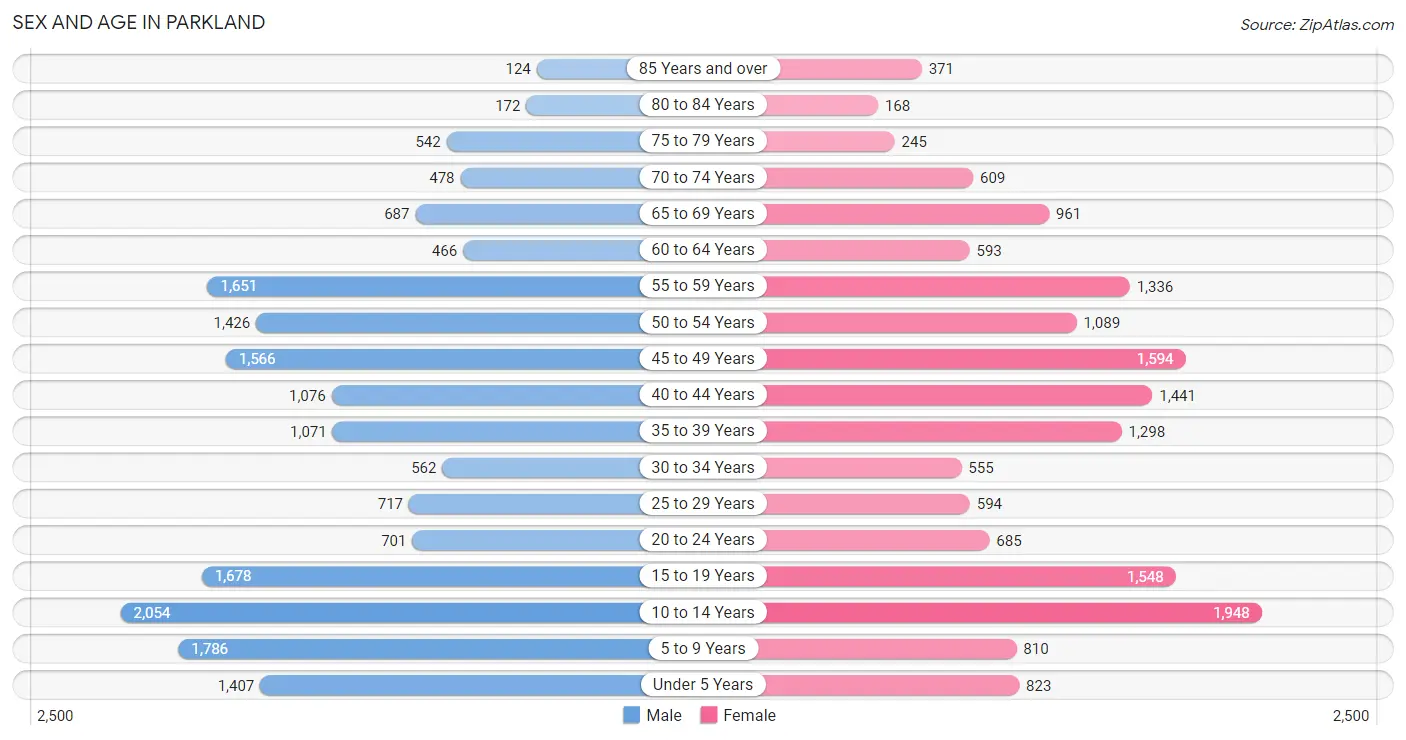
| Age Bracket | Male | Female |
| Under 5 Years | 1,407 (7.7%) | 823 (4.9%) |
| 5 to 9 Years | 1,786 (9.8%) | 810 (4.9%) |
| 10 to 14 Years | 2,054 (11.3%) | 1,948 (11.7%) |
| 15 to 19 Years | 1,678 (9.2%) | 1,548 (9.3%) |
| 20 to 24 Years | 701 (3.9%) | 685 (4.1%) |
| 25 to 29 Years | 717 (4.0%) | 594 (3.6%) |
| 30 to 34 Years | 562 (3.1%) | 555 (3.3%) |
| 35 to 39 Years | 1,071 (5.9%) | 1,298 (7.8%) |
| 40 to 44 Years | 1,076 (5.9%) | 1,441 (8.6%) |
| 45 to 49 Years | 1,566 (8.6%) | 1,594 (9.6%) |
| 50 to 54 Years | 1,426 (7.9%) | 1,089 (6.5%) |
| 55 to 59 Years | 1,651 (9.1%) | 1,336 (8.0%) |
| 60 to 64 Years | 466 (2.6%) | 593 (3.6%) |
| 65 to 69 Years | 687 (3.8%) | 961 (5.8%) |
| 70 to 74 Years | 478 (2.6%) | 609 (3.6%) |
| 75 to 79 Years | 542 (3.0%) | 245 (1.5%) |
| 80 to 84 Years | 172 (0.9%) | 168 (1.0%) |
| 85 Years and over | 124 (0.7%) | 371 (2.2%) |
| Total | 18,164 (100.0%) | 16,668 (100.0%) |
Families and Households in Parkland
Median Family Size in Parkland
The median family size in Parkland is 3.71 persons per family, with married-couple families (7,816 | 90.4%) accounting for the largest median family size of 3.77 persons per family. On the other hand, single female/mother families (402 | 4.6%) represent the smallest median family size with 2.99 persons per family.
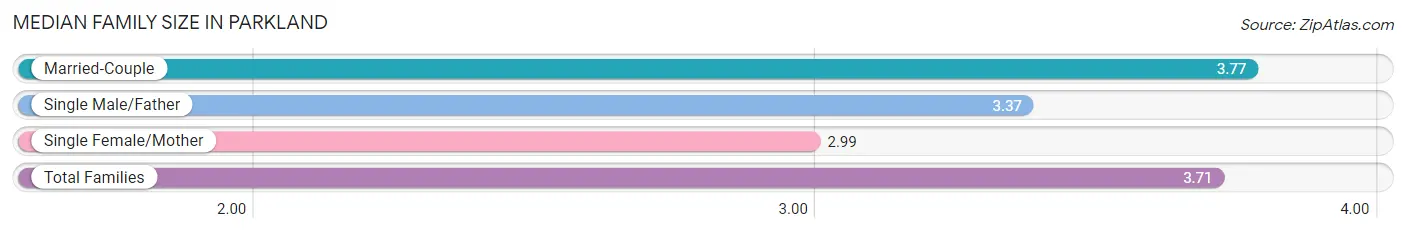
| Family Type | # Families | Family Size |
| Married-Couple | 7,816 (90.4%) | 3.77 |
| Single Male/Father | 424 (4.9%) | 3.37 |
| Single Female/Mother | 402 (4.6%) | 2.99 |
| Total Families | 8,642 (100.0%) | 3.71 |
Median Household Size in Parkland
The median household size in Parkland is 3.34 persons per household, with married-couple households (7,816 | 75.1%) accounting for the largest median household size of 3.78 persons per household. non-family households (1,766 | 17.0%) represent the smallest median household size with 1.38 persons per household.
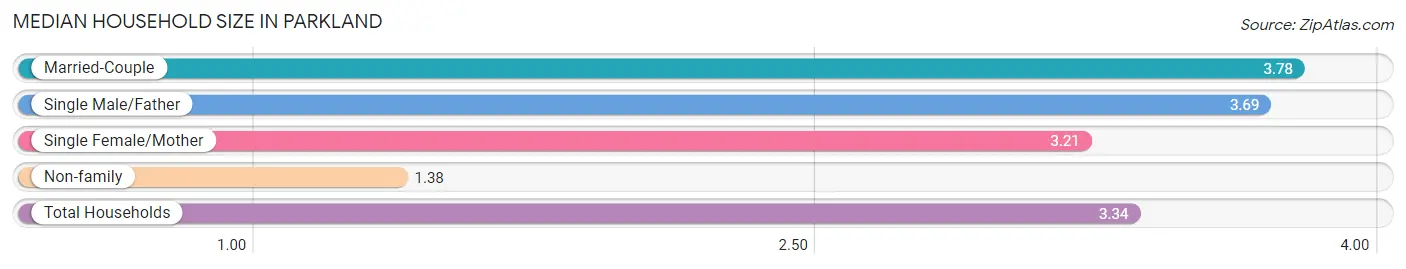
| Household Type | # Households | Household Size |
| Married-Couple | 7,816 (75.1%) | 3.78 |
| Single Male/Father | 424 (4.1%) | 3.69 |
| Single Female/Mother | 402 (3.9%) | 3.21 |
| Non-family | 1,766 (17.0%) | 1.38 |
| Total Households | 10,408 (100.0%) | 3.34 |
Household Size by Marriage Status in Parkland
Out of a total of 10,408 households in Parkland, 8,642 (83.0%) are family households, while 1,766 (17.0%) are nonfamily households. The most numerous type of family households are 4-person households, comprising 2,441, and the most common type of nonfamily households are 1-person households, comprising 1,288.
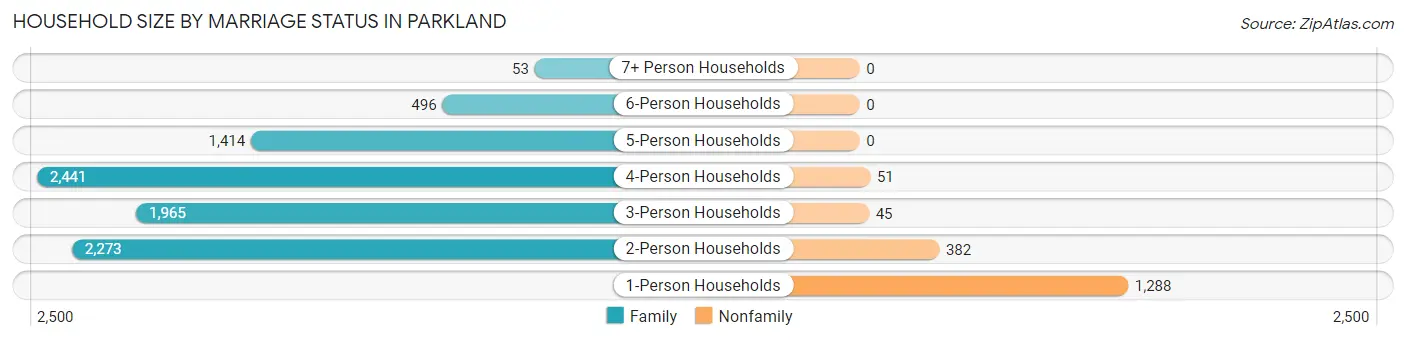
| Household Size | Family Households | Nonfamily Households |
| 1-Person Households | - | 1,288 (12.4%) |
| 2-Person Households | 2,273 (21.8%) | 382 (3.7%) |
| 3-Person Households | 1,965 (18.9%) | 45 (0.4%) |
| 4-Person Households | 2,441 (23.4%) | 51 (0.5%) |
| 5-Person Households | 1,414 (13.6%) | 0 (0.0%) |
| 6-Person Households | 496 (4.8%) | 0 (0.0%) |
| 7+ Person Households | 53 (0.5%) | 0 (0.0%) |
| Total | 8,642 (83.0%) | 1,766 (17.0%) |
Female Fertility in Parkland
Fertility by Age in Parkland
Average fertility rate in Parkland is 52.0 births per 1,000 women. Women in the age bracket of 35 to 50 years have the highest fertility rate with 65.0 births per 1,000 women. Women in the age bracket of 35 to 50 years acount for 71.9% of all women with births.
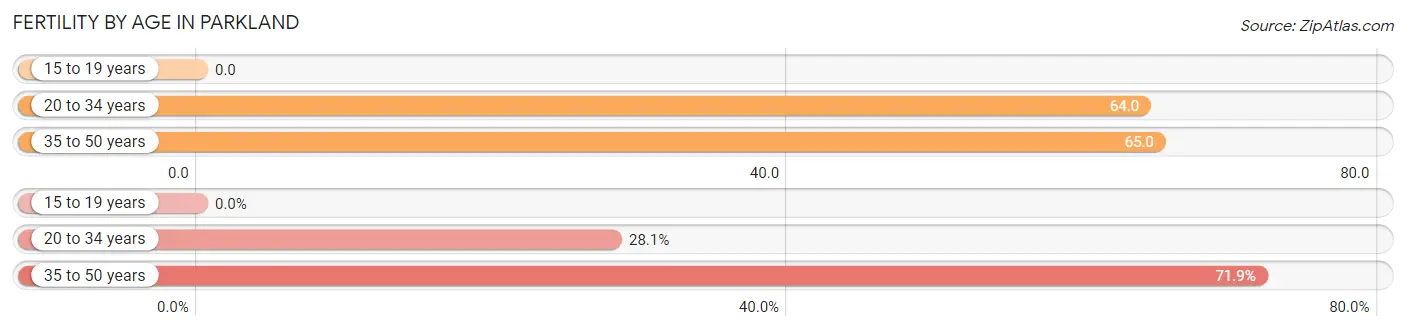
| Age Bracket | Women with Births | Births / 1,000 Women |
| 15 to 19 years | 0 (0.0%) | 0.0 |
| 20 to 34 years | 118 (28.1%) | 64.0 |
| 35 to 50 years | 302 (71.9%) | 65.0 |
| Total | 420 (100.0%) | 52.0 |
Fertility by Age by Marriage Status in Parkland
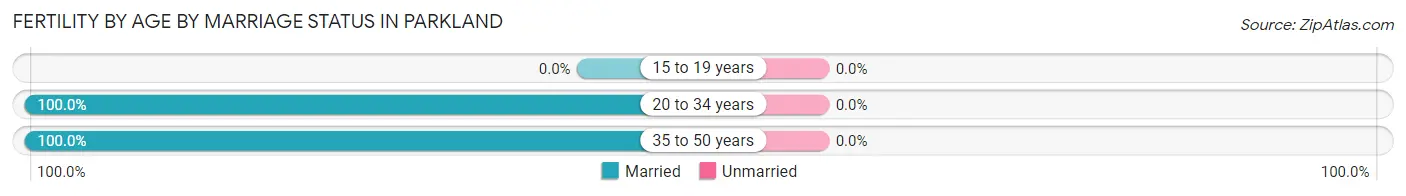
| Age Bracket | Married | Unmarried |
| 15 to 19 years | 0 (0.0%) | 0 (0.0%) |
| 20 to 34 years | 118 (100.0%) | 0 (0.0%) |
| 35 to 50 years | 302 (100.0%) | 0 (0.0%) |
| Total | 420 (100.0%) | 0 (0.0%) |
Fertility by Education in Parkland
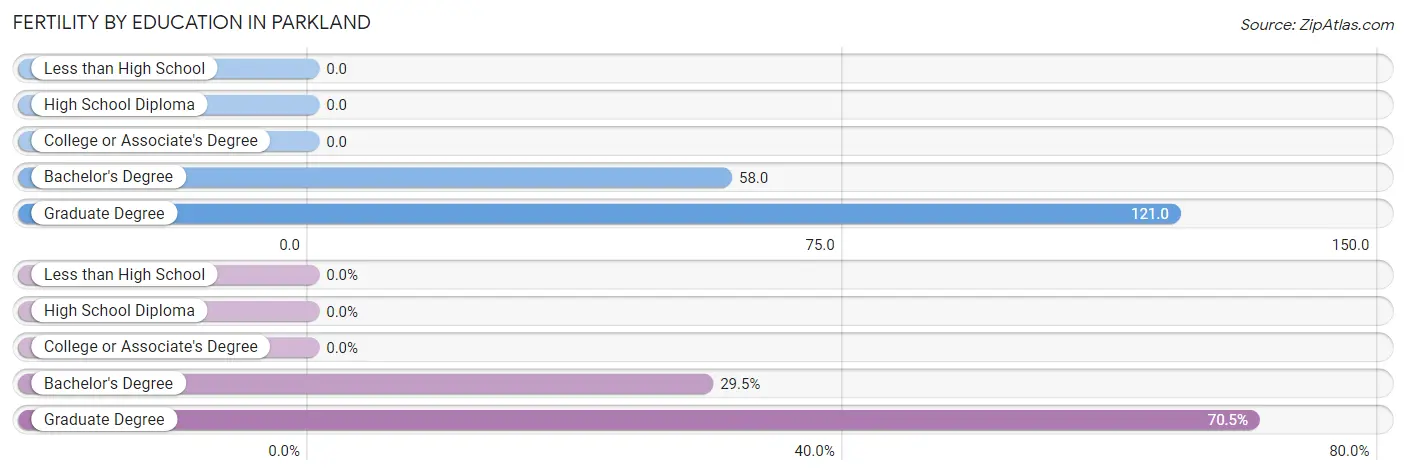
| Educational Attainment | Women with Births | Births / 1,000 Women |
| Less than High School | 0 (0.0%) | 0.0 |
| High School Diploma | 0 (0.0%) | 0.0 |
| College or Associate's Degree | 0 (0.0%) | 0.0 |
| Bachelor's Degree | 124 (29.5%) | 58.0 |
| Graduate Degree | 296 (70.5%) | 121.0 |
| Total | 420 (100.0%) | 52.0 |
Fertility by Education by Marriage Status in Parkland
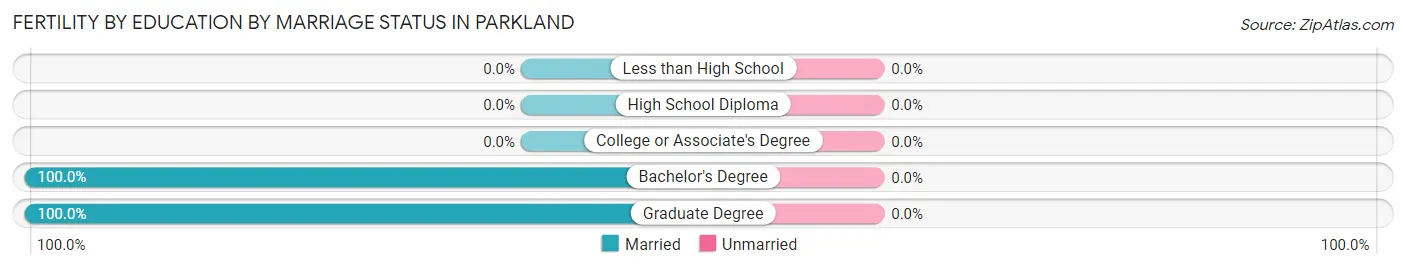
| Educational Attainment | Married | Unmarried |
| Less than High School | 0 (0.0%) | 0 (0.0%) |
| High School Diploma | 0 (0.0%) | 0 (0.0%) |
| College or Associate's Degree | 0 (0.0%) | 0 (0.0%) |
| Bachelor's Degree | 124 (100.0%) | 0 (0.0%) |
| Graduate Degree | 296 (100.0%) | 0 (0.0%) |
| Total | 420 (100.0%) | 0 (0.0%) |
Employment Characteristics in Parkland
Employment by Class of Employer in Parkland
Among the 15,429 employed individuals in Parkland, private company employees (9,754 | 63.2%), self-employed (incorporated) (2,279 | 14.8%), and local government employees (1,423 | 9.2%) make up the most common classes of employment.
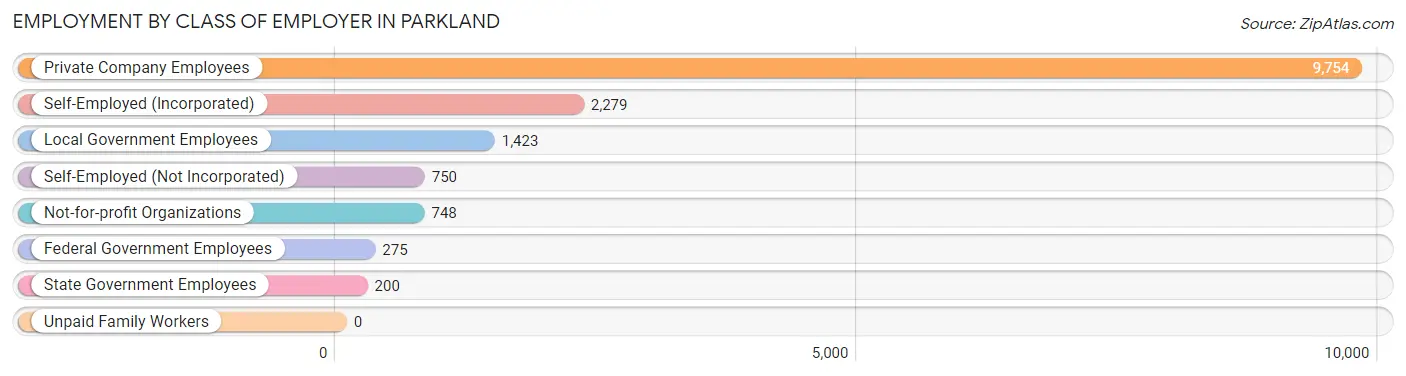
| Employer Class | # Employees | % Employees |
| Private Company Employees | 9,754 | 63.2% |
| Self-Employed (Incorporated) | 2,279 | 14.8% |
| Self-Employed (Not Incorporated) | 750 | 4.9% |
| Not-for-profit Organizations | 748 | 4.9% |
| Local Government Employees | 1,423 | 9.2% |
| State Government Employees | 200 | 1.3% |
| Federal Government Employees | 275 | 1.8% |
| Unpaid Family Workers | 0 | 0.0% |
| Total | 15,429 | 100.0% |
Employment Status by Age in Parkland
According to the labor force statistics for Parkland, out of the total population over 16 years of age (25,285), 64.2% or 16,233 individuals are in the labor force, with 4.5% or 730 of them unemployed. The age group with the highest labor force participation rate is 30 to 34 years, with 92.2% or 1,030 individuals in the labor force. Within the labor force, the 16 to 19 years age range has the highest percentage of unemployed individuals, with 18.2% or 81 of them being unemployed.
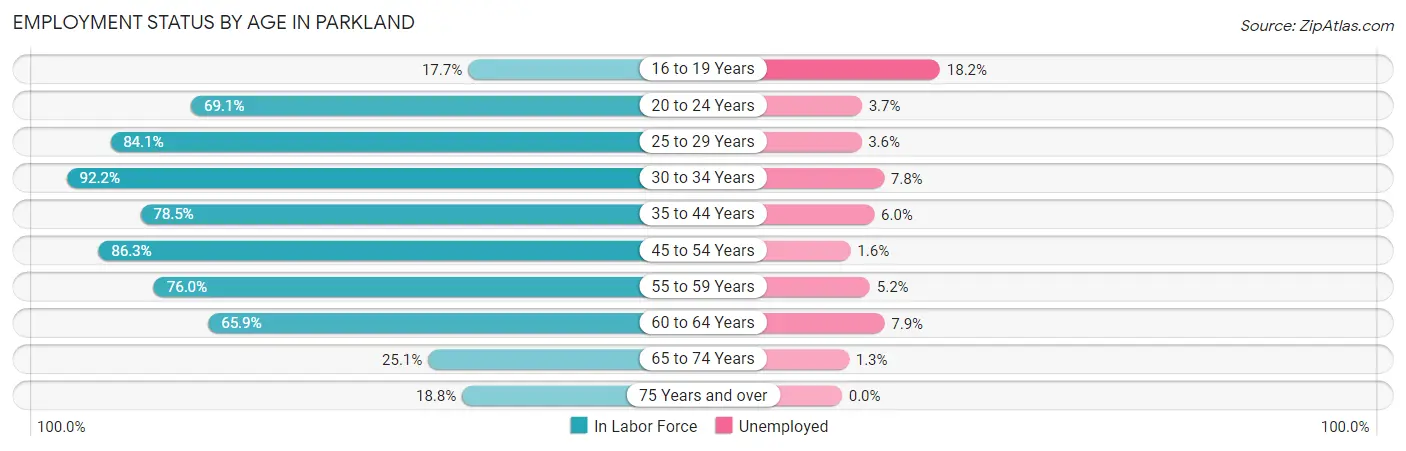
| Age Bracket | In Labor Force | Unemployed |
| 16 to 19 Years | 444 (17.7%) | 81 (18.2%) |
| 20 to 24 Years | 958 (69.1%) | 35 (3.7%) |
| 25 to 29 Years | 1,103 (84.1%) | 40 (3.6%) |
| 30 to 34 Years | 1,030 (92.2%) | 80 (7.8%) |
| 35 to 44 Years | 3,836 (78.5%) | 230 (6.0%) |
| 45 to 54 Years | 4,898 (86.3%) | 78 (1.6%) |
| 55 to 59 Years | 2,270 (76.0%) | 118 (5.2%) |
| 60 to 64 Years | 698 (65.9%) | 55 (7.9%) |
| 65 to 74 Years | 686 (25.1%) | 9 (1.3%) |
| 75 Years and over | 305 (18.8%) | 0 (0.0%) |
| Total | 16,233 (64.2%) | 730 (4.5%) |
Employment Status by Educational Attainment in Parkland
According to labor force statistics for Parkland, 81.2% of individuals (13,832) out of the total population between 25 and 64 years of age (17,035) are in the labor force, with 4.4% or 609 of them being unemployed. The group with the highest labor force participation rate are those with the educational attainment of bachelor's degree or higher, with 83.4% or 9,856 individuals in the labor force. Within the labor force, individuals with less than high school education have the highest percentage of unemployment, with 43.3% or 42 of them being unemployed.
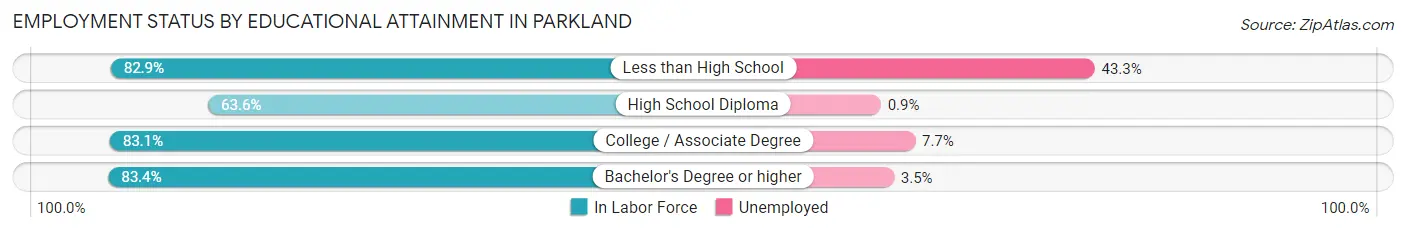
| Educational Attainment | In Labor Force | Unemployed |
| Less than High School | 97 (82.9%) | 51 (43.3%) |
| High School Diploma | 1,184 (63.6%) | 17 (0.9%) |
| College / Associate Degree | 2,691 (83.1%) | 249 (7.7%) |
| Bachelor's Degree or higher | 9,856 (83.4%) | 414 (3.5%) |
| Total | 13,832 (81.2%) | 750 (4.4%) |
Employment Occupations by Sex in Parkland
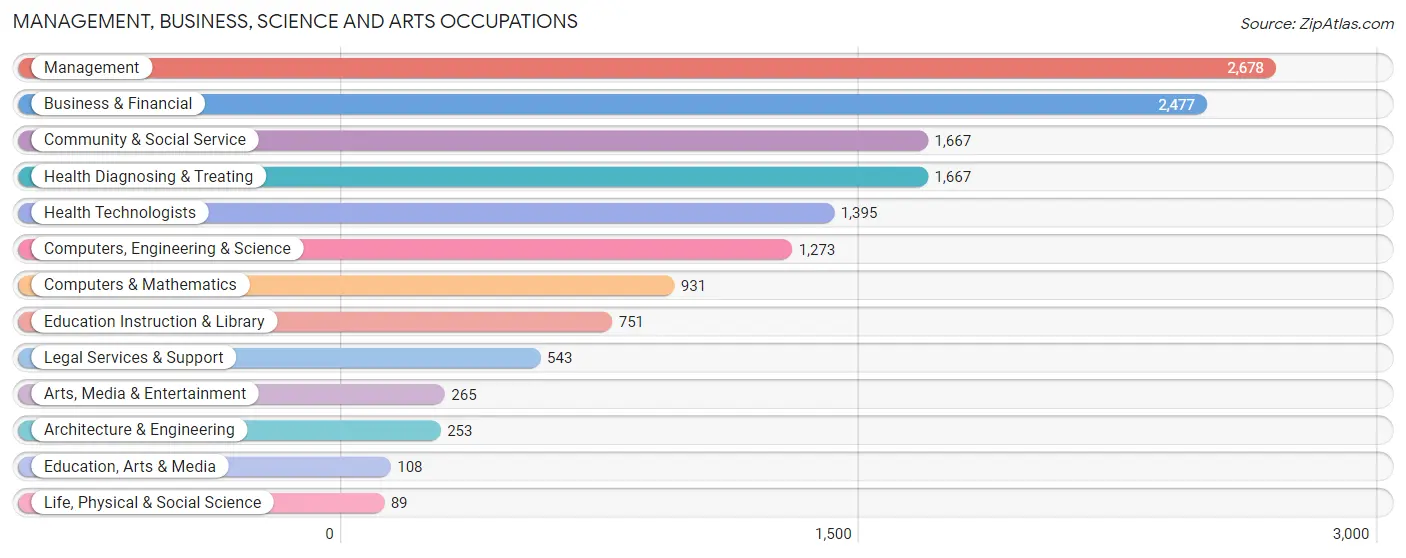
Management, Business, Science and Arts Occupations
The most common Management, Business, Science and Arts occupations in Parkland are Management (2,678 | 17.3%), Business & Financial (2,477 | 16.0%), Community & Social Service (1,667 | 10.8%), Health Diagnosing & Treating (1,667 | 10.8%), and Health Technologists (1,395 | 9.0%).
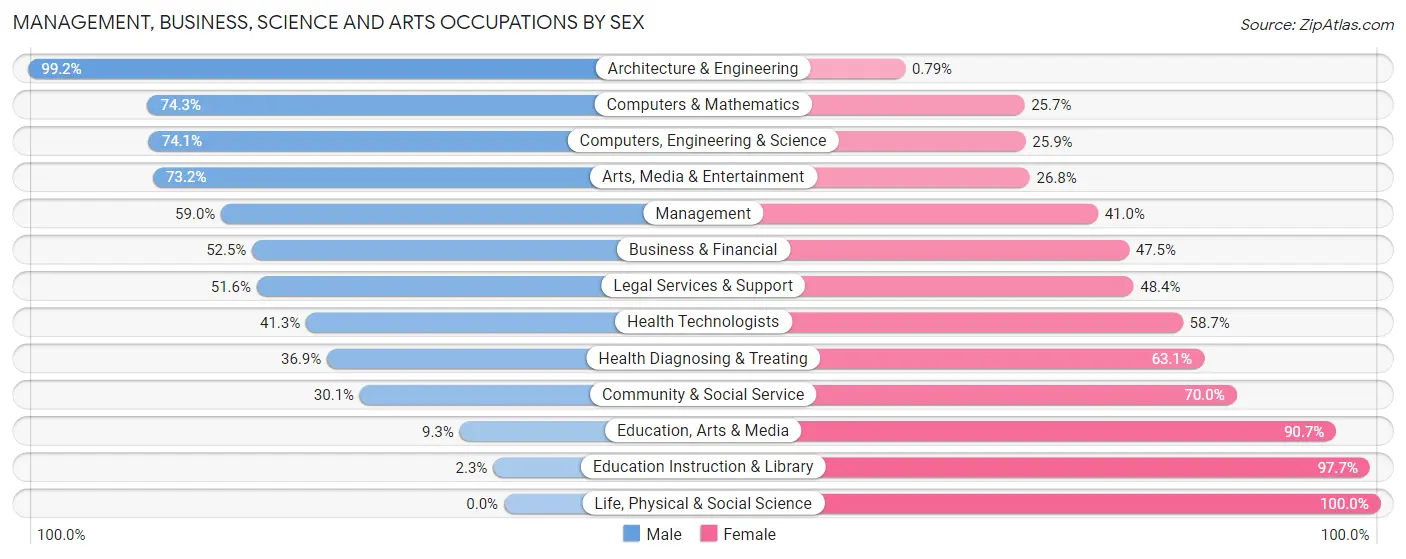
Management, Business, Science and Arts Occupations by Sex
Within the Management, Business, Science and Arts occupations in Parkland, the most male-oriented occupations are Architecture & Engineering (99.2%), Computers & Mathematics (74.3%), and Computers, Engineering & Science (74.1%), while the most female-oriented occupations are Life, Physical & Social Science (100.0%), Education Instruction & Library (97.7%), and Education, Arts & Media (90.7%).
| Occupation | Male | Female |
| Management | 1,580 (59.0%) | 1,098 (41.0%) |
| Business & Financial | 1,301 (52.5%) | 1,176 (47.5%) |
| Computers, Engineering & Science | 943 (74.1%) | 330 (25.9%) |
| Computers & Mathematics | 692 (74.3%) | 239 (25.7%) |
| Architecture & Engineering | 251 (99.2%) | 2 (0.8%) |
| Life, Physical & Social Science | 0 (0.0%) | 89 (100.0%) |
| Community & Social Service | 501 (30.0%) | 1,166 (70.0%) |
| Education, Arts & Media | 10 (9.3%) | 98 (90.7%) |
| Legal Services & Support | 280 (51.6%) | 263 (48.4%) |
| Education Instruction & Library | 17 (2.3%) | 734 (97.7%) |
| Arts, Media & Entertainment | 194 (73.2%) | 71 (26.8%) |
| Health Diagnosing & Treating | 615 (36.9%) | 1,052 (63.1%) |
| Health Technologists | 576 (41.3%) | 819 (58.7%) |
| Total (Category) | 4,940 (50.6%) | 4,822 (49.4%) |
| Total (Overall) | 8,664 (56.0%) | 6,806 (44.0%) |
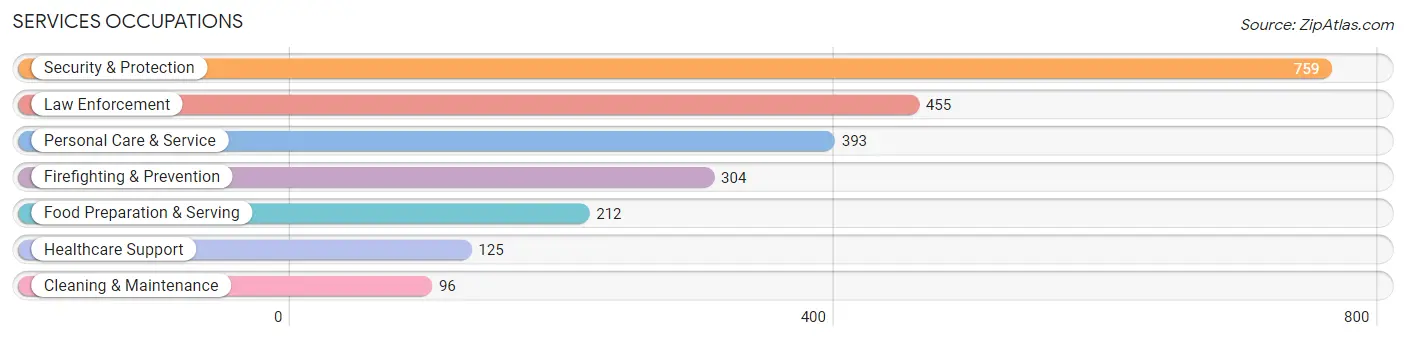
Services Occupations
The most common Services occupations in Parkland are Security & Protection (759 | 4.9%), Law Enforcement (455 | 2.9%), Personal Care & Service (393 | 2.5%), Firefighting & Prevention (304 | 2.0%), and Food Preparation & Serving (212 | 1.4%).
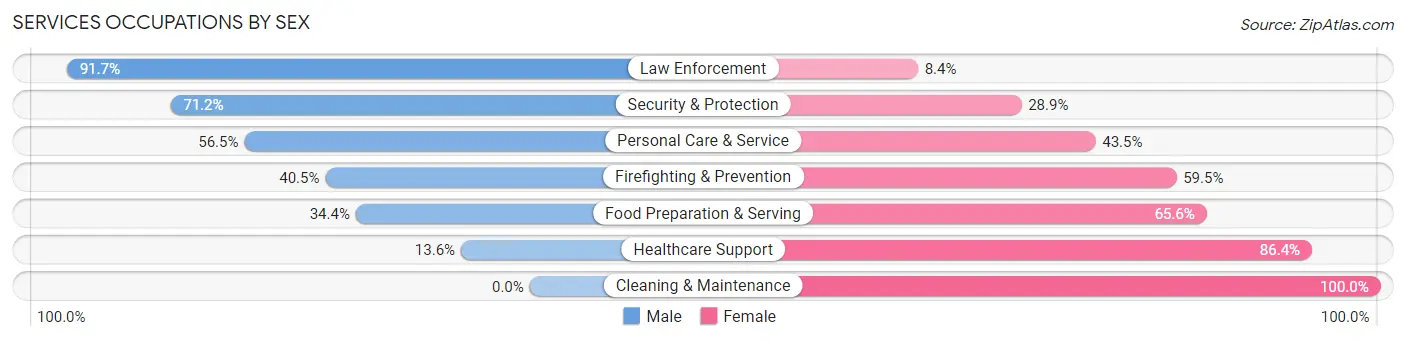
Services Occupations by Sex
Within the Services occupations in Parkland, the most male-oriented occupations are Law Enforcement (91.6%), Security & Protection (71.2%), and Personal Care & Service (56.5%), while the most female-oriented occupations are Cleaning & Maintenance (100.0%), Healthcare Support (86.4%), and Food Preparation & Serving (65.6%).
| Occupation | Male | Female |
| Healthcare Support | 17 (13.6%) | 108 (86.4%) |
| Security & Protection | 540 (71.2%) | 219 (28.8%) |
| Firefighting & Prevention | 123 (40.5%) | 181 (59.5%) |
| Law Enforcement | 417 (91.6%) | 38 (8.4%) |
| Food Preparation & Serving | 73 (34.4%) | 139 (65.6%) |
| Cleaning & Maintenance | 0 (0.0%) | 96 (100.0%) |
| Personal Care & Service | 222 (56.5%) | 171 (43.5%) |
| Total (Category) | 852 (53.7%) | 733 (46.3%) |
| Total (Overall) | 8,664 (56.0%) | 6,806 (44.0%) |
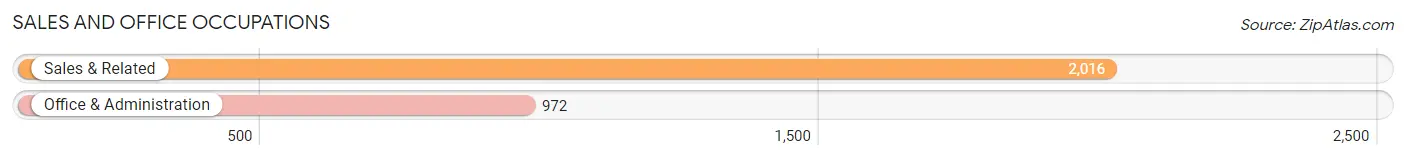
Sales and Office Occupations
The most common Sales and Office occupations in Parkland are Sales & Related (2,016 | 13.0%), and Office & Administration (972 | 6.3%).
Sales and Office Occupations by Sex
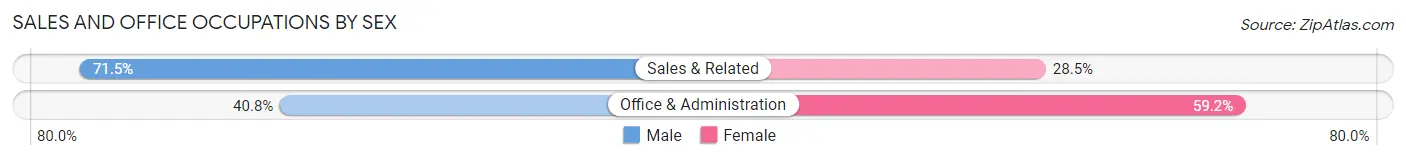
| Occupation | Male | Female |
| Sales & Related | 1,441 (71.5%) | 575 (28.5%) |
| Office & Administration | 397 (40.8%) | 575 (59.2%) |
| Total (Category) | 1,838 (61.5%) | 1,150 (38.5%) |
| Total (Overall) | 8,664 (56.0%) | 6,806 (44.0%) |
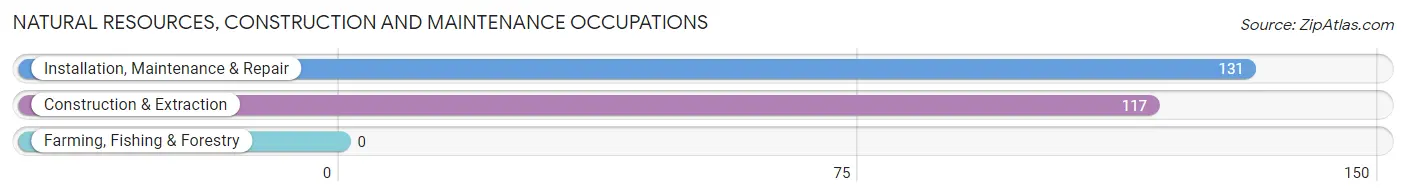
Natural Resources, Construction and Maintenance Occupations
The most common Natural Resources, Construction and Maintenance occupations in Parkland are Installation, Maintenance & Repair (131 | 0.9%), and Construction & Extraction (117 | 0.8%).
Natural Resources, Construction and Maintenance Occupations by Sex
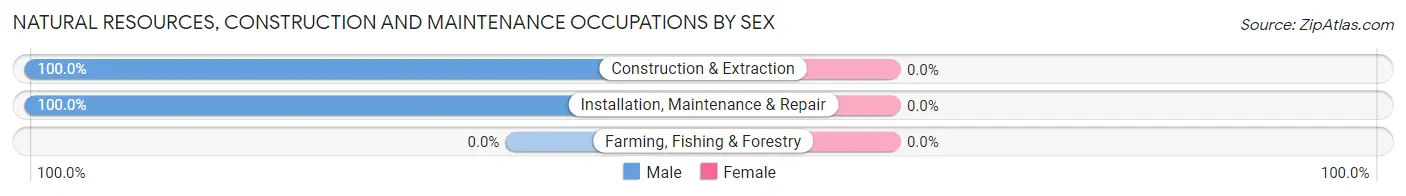
| Occupation | Male | Female |
| Farming, Fishing & Forestry | 0 (0.0%) | 0 (0.0%) |
| Construction & Extraction | 117 (100.0%) | 0 (0.0%) |
| Installation, Maintenance & Repair | 131 (100.0%) | 0 (0.0%) |
| Total (Category) | 248 (100.0%) | 0 (0.0%) |
| Total (Overall) | 8,664 (56.0%) | 6,806 (44.0%) |
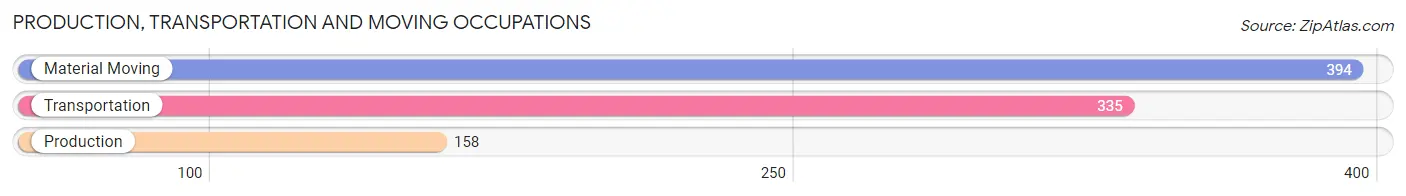
Production, Transportation and Moving Occupations
The most common Production, Transportation and Moving occupations in Parkland are Material Moving (394 | 2.5%), Transportation (335 | 2.2%), and Production (158 | 1.0%).
Production, Transportation and Moving Occupations by Sex
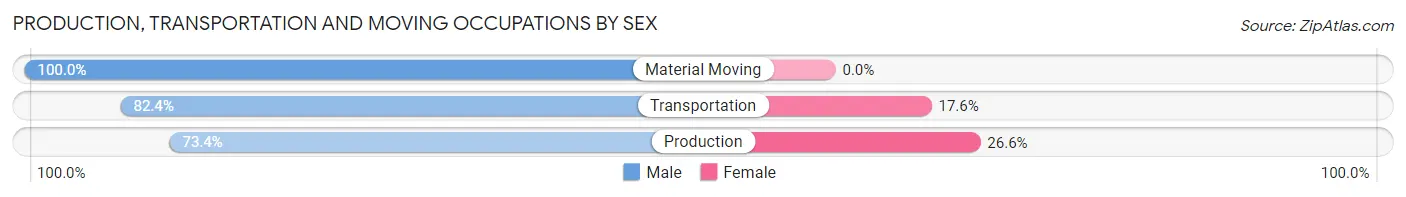
| Occupation | Male | Female |
| Production | 116 (73.4%) | 42 (26.6%) |
| Transportation | 276 (82.4%) | 59 (17.6%) |
| Material Moving | 394 (100.0%) | 0 (0.0%) |
| Total (Category) | 786 (88.6%) | 101 (11.4%) |
| Total (Overall) | 8,664 (56.0%) | 6,806 (44.0%) |
Employment Industries by Sex in Parkland
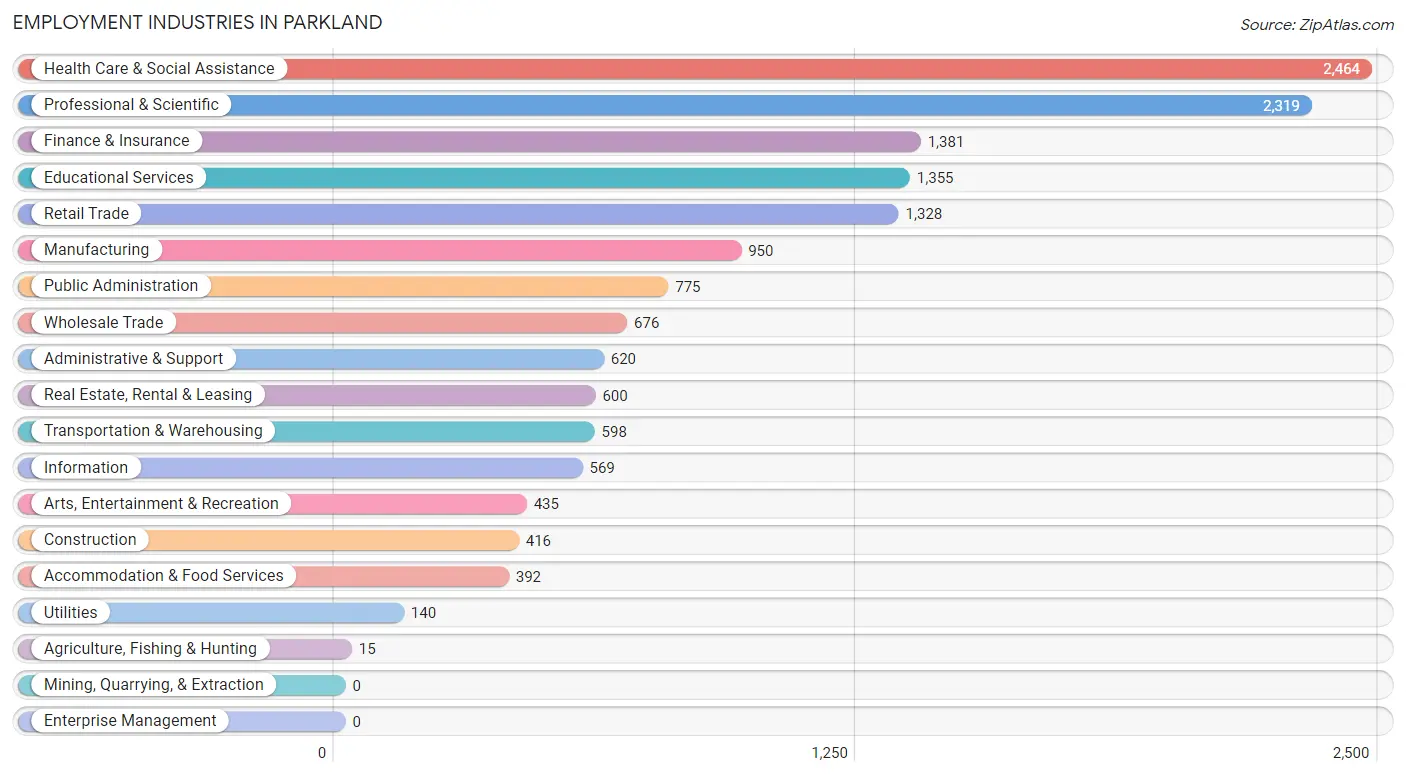
Employment Industries in Parkland
The major employment industries in Parkland include Health Care & Social Assistance (2,464 | 15.9%), Professional & Scientific (2,319 | 15.0%), Finance & Insurance (1,381 | 8.9%), Educational Services (1,355 | 8.8%), and Retail Trade (1,328 | 8.6%).
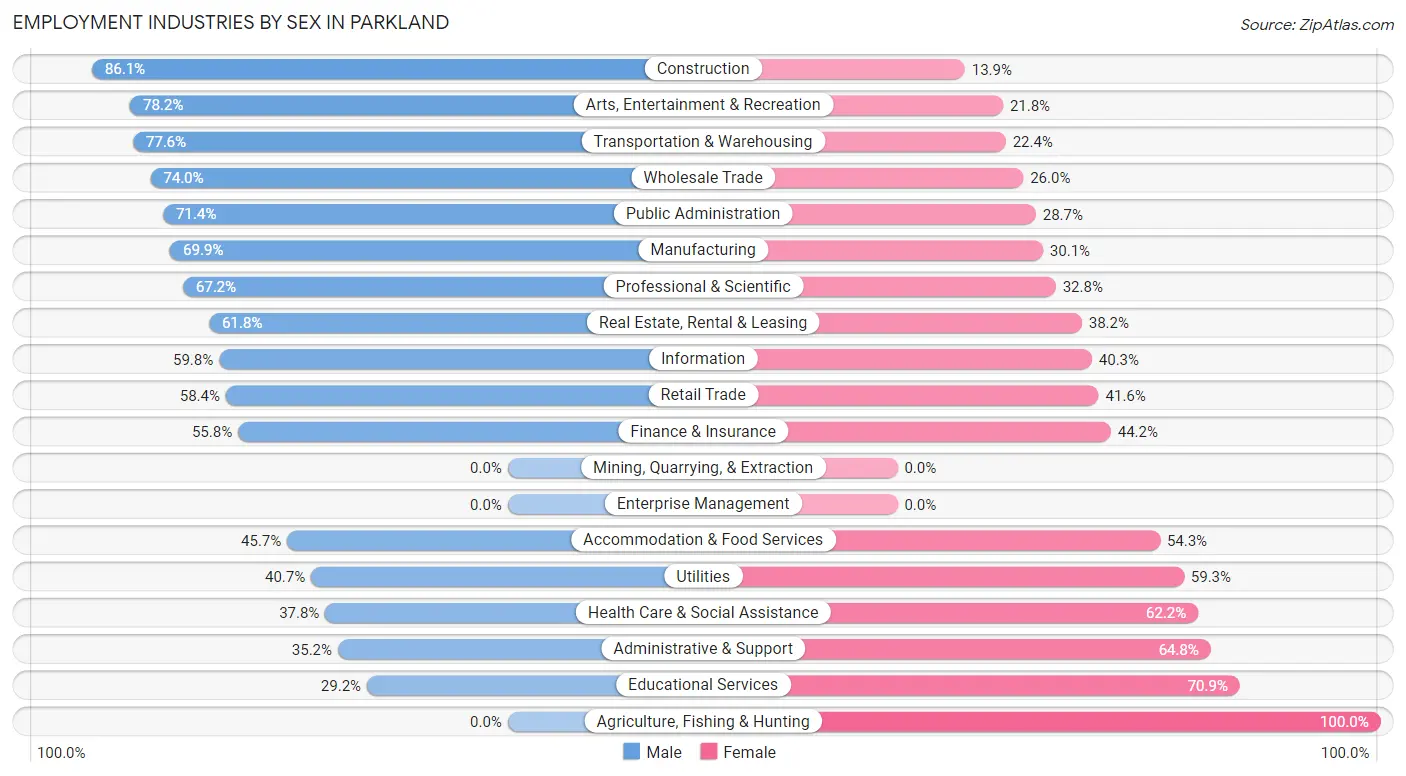
Employment Industries by Sex in Parkland
The Parkland industries that see more men than women are Construction (86.1%), Arts, Entertainment & Recreation (78.2%), and Transportation & Warehousing (77.6%), whereas the industries that tend to have a higher number of women are Agriculture, Fishing & Hunting (100.0%), Educational Services (70.9%), and Administrative & Support (64.8%).
| Industry | Male | Female |
| Agriculture, Fishing & Hunting | 0 (0.0%) | 15 (100.0%) |
| Mining, Quarrying, & Extraction | 0 (0.0%) | 0 (0.0%) |
| Construction | 358 (86.1%) | 58 (13.9%) |
| Manufacturing | 664 (69.9%) | 286 (30.1%) |
| Wholesale Trade | 500 (74.0%) | 176 (26.0%) |
| Retail Trade | 775 (58.4%) | 553 (41.6%) |
| Transportation & Warehousing | 464 (77.6%) | 134 (22.4%) |
| Utilities | 57 (40.7%) | 83 (59.3%) |
| Information | 340 (59.8%) | 229 (40.3%) |
| Finance & Insurance | 771 (55.8%) | 610 (44.2%) |
| Real Estate, Rental & Leasing | 371 (61.8%) | 229 (38.2%) |
| Professional & Scientific | 1,559 (67.2%) | 760 (32.8%) |
| Enterprise Management | 0 (0.0%) | 0 (0.0%) |
| Administrative & Support | 218 (35.2%) | 402 (64.8%) |
| Educational Services | 395 (29.1%) | 960 (70.9%) |
| Health Care & Social Assistance | 931 (37.8%) | 1,533 (62.2%) |
| Arts, Entertainment & Recreation | 340 (78.2%) | 95 (21.8%) |
| Accommodation & Food Services | 179 (45.7%) | 213 (54.3%) |
| Public Administration | 553 (71.4%) | 222 (28.6%) |
| Total | 8,664 (56.0%) | 6,806 (44.0%) |
Education in Parkland
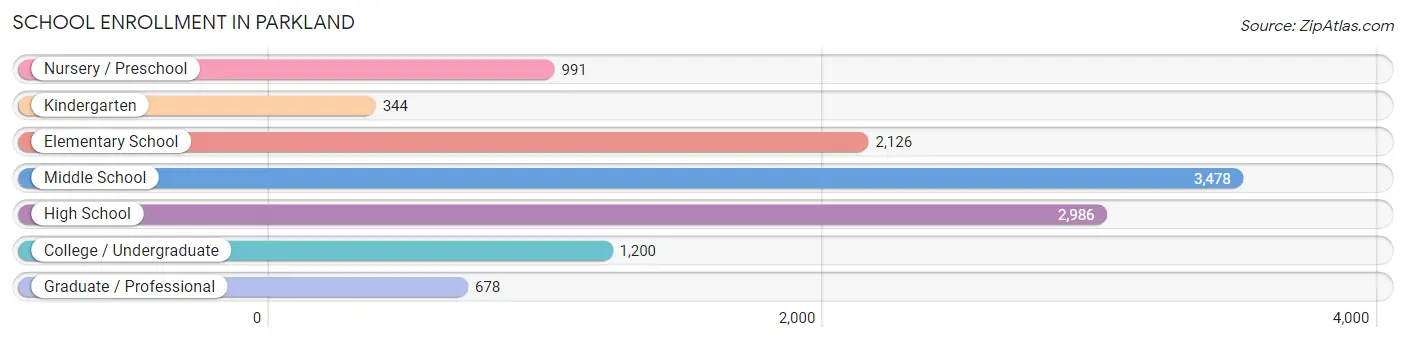
School Enrollment in Parkland
The most common levels of schooling among the 11,803 students in Parkland are middle school (3,478 | 29.5%), high school (2,986 | 25.3%), and elementary school (2,126 | 18.0%).
| School Level | # Students | % Students |
| Nursery / Preschool | 991 | 8.4% |
| Kindergarten | 344 | 2.9% |
| Elementary School | 2,126 | 18.0% |
| Middle School | 3,478 | 29.5% |
| High School | 2,986 | 25.3% |
| College / Undergraduate | 1,200 | 10.2% |
| Graduate / Professional | 678 | 5.7% |
| Total | 11,803 | 100.0% |
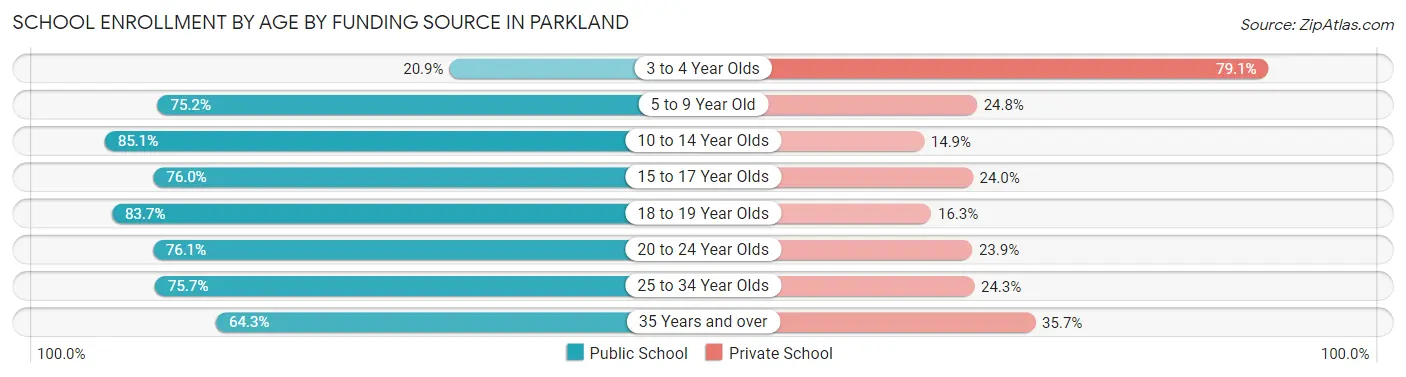
School Enrollment by Age by Funding Source in Parkland
Out of a total of 11,803 students who are enrolled in schools in Parkland, 2,797 (23.7%) attend a private institution, while the remaining 9,006 (76.3%) are enrolled in public schools. The age group of 3 to 4 year olds has the highest likelihood of being enrolled in private schools, with 462 (79.1% in the age bracket) enrolled. Conversely, the age group of 10 to 14 year olds has the lowest likelihood of being enrolled in a private school, with 3,404 (85.1% in the age bracket) attending a public institution.
| Age Bracket | Public School | Private School |
| 3 to 4 Year Olds | 122 (20.9%) | 462 (79.1%) |
| 5 to 9 Year Old | 1,924 (75.2%) | 634 (24.8%) |
| 10 to 14 Year Olds | 3,404 (85.1%) | 598 (14.9%) |
| 15 to 17 Year Olds | 1,640 (76.0%) | 518 (24.0%) |
| 18 to 19 Year Olds | 823 (83.7%) | 160 (16.3%) |
| 20 to 24 Year Olds | 573 (76.1%) | 180 (23.9%) |
| 25 to 34 Year Olds | 212 (75.7%) | 68 (24.3%) |
| 35 Years and over | 312 (64.3%) | 173 (35.7%) |
| Total | 9,006 (76.3%) | 2,797 (23.7%) |
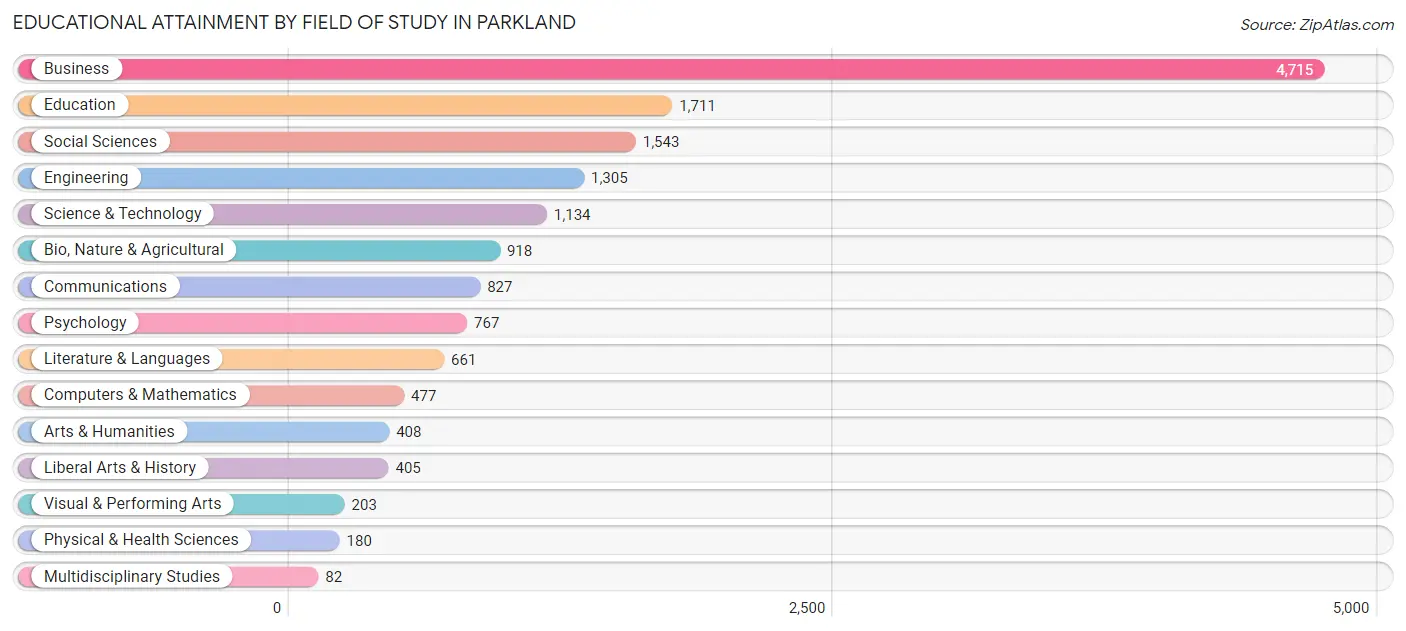
Educational Attainment by Field of Study in Parkland
Business (4,715 | 30.7%), education (1,711 | 11.2%), social sciences (1,543 | 10.1%), engineering (1,305 | 8.5%), and science & technology (1,134 | 7.4%) are the most common fields of study among 15,336 individuals in Parkland who have obtained a bachelor's degree or higher.
| Field of Study | # Graduates | % Graduates |
| Computers & Mathematics | 477 | 3.1% |
| Bio, Nature & Agricultural | 918 | 6.0% |
| Physical & Health Sciences | 180 | 1.2% |
| Psychology | 767 | 5.0% |
| Social Sciences | 1,543 | 10.1% |
| Engineering | 1,305 | 8.5% |
| Multidisciplinary Studies | 82 | 0.5% |
| Science & Technology | 1,134 | 7.4% |
| Business | 4,715 | 30.7% |
| Education | 1,711 | 11.2% |
| Literature & Languages | 661 | 4.3% |
| Liberal Arts & History | 405 | 2.6% |
| Visual & Performing Arts | 203 | 1.3% |
| Communications | 827 | 5.4% |
| Arts & Humanities | 408 | 2.7% |
| Total | 15,336 | 100.0% |
Transportation & Commute in Parkland
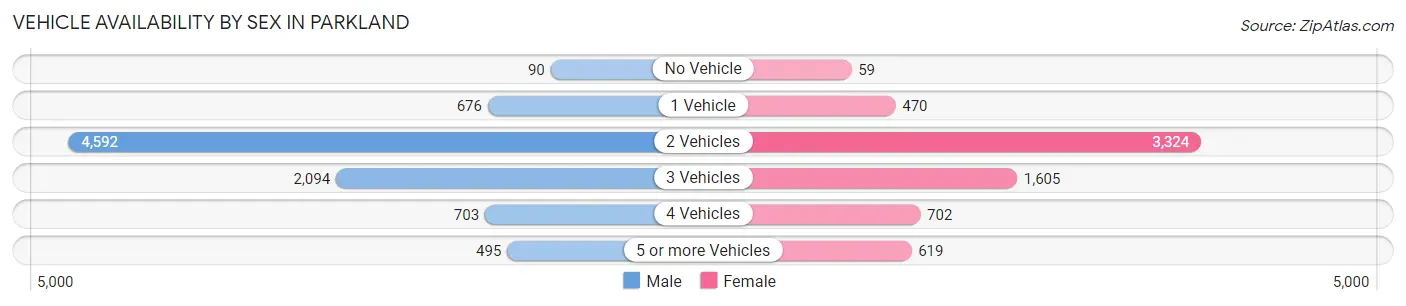
Vehicle Availability by Sex in Parkland
The most prevalent vehicle ownership categories in Parkland are males with 2 vehicles (4,592, accounting for 53.1%) and females with 2 vehicles (3,324, making up 67.7%).
| Vehicles Available | Male | Female |
| No Vehicle | 90 (1.0%) | 59 (0.9%) |
| 1 Vehicle | 676 (7.8%) | 470 (6.9%) |
| 2 Vehicles | 4,592 (53.1%) | 3,324 (49.0%) |
| 3 Vehicles | 2,094 (24.2%) | 1,605 (23.7%) |
| 4 Vehicles | 703 (8.1%) | 702 (10.4%) |
| 5 or more Vehicles | 495 (5.7%) | 619 (9.1%) |
| Total | 8,650 (100.0%) | 6,779 (100.0%) |
Commute Time in Parkland
The most frequently occuring commute durations in Parkland are 30 to 34 minutes (2,566 commuters, 22.8%), 45 to 59 minutes (2,062 commuters, 18.3%), and 20 to 24 minutes (1,757 commuters, 15.6%).
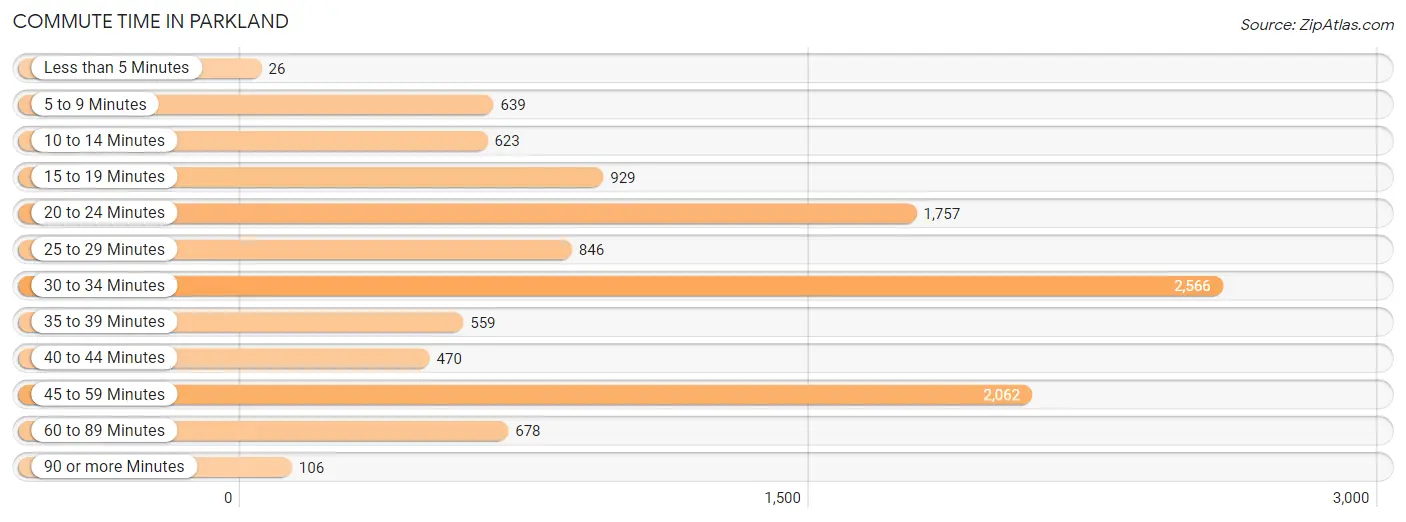
| Commute Time | # Commuters | % Commuters |
| Less than 5 Minutes | 26 | 0.2% |
| 5 to 9 Minutes | 639 | 5.7% |
| 10 to 14 Minutes | 623 | 5.5% |
| 15 to 19 Minutes | 929 | 8.3% |
| 20 to 24 Minutes | 1,757 | 15.6% |
| 25 to 29 Minutes | 846 | 7.5% |
| 30 to 34 Minutes | 2,566 | 22.8% |
| 35 to 39 Minutes | 559 | 5.0% |
| 40 to 44 Minutes | 470 | 4.2% |
| 45 to 59 Minutes | 2,062 | 18.3% |
| 60 to 89 Minutes | 678 | 6.0% |
| 90 or more Minutes | 106 | 0.9% |
Commute Time by Sex in Parkland
The most common commute times in Parkland are 30 to 34 minutes (1,570 commuters, 23.4%) for males and 30 to 34 minutes (996 commuters, 21.9%) for females.
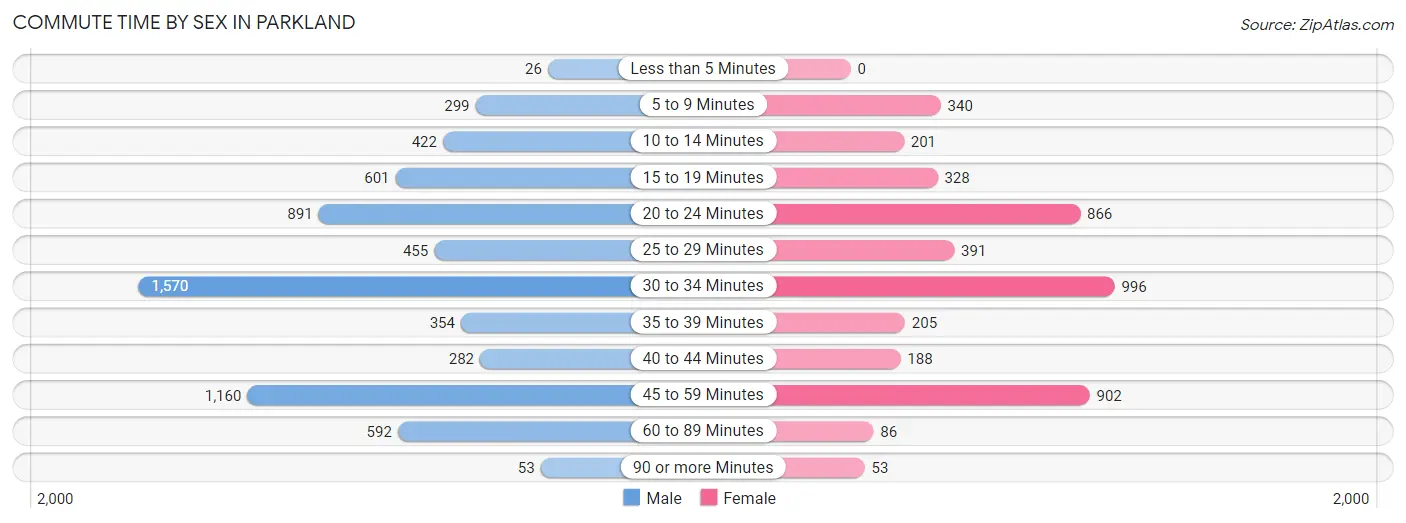
| Commute Time | Male | Female |
| Less than 5 Minutes | 26 (0.4%) | 0 (0.0%) |
| 5 to 9 Minutes | 299 (4.5%) | 340 (7.5%) |
| 10 to 14 Minutes | 422 (6.3%) | 201 (4.4%) |
| 15 to 19 Minutes | 601 (9.0%) | 328 (7.2%) |
| 20 to 24 Minutes | 891 (13.3%) | 866 (19.0%) |
| 25 to 29 Minutes | 455 (6.8%) | 391 (8.6%) |
| 30 to 34 Minutes | 1,570 (23.4%) | 996 (21.9%) |
| 35 to 39 Minutes | 354 (5.3%) | 205 (4.5%) |
| 40 to 44 Minutes | 282 (4.2%) | 188 (4.1%) |
| 45 to 59 Minutes | 1,160 (17.3%) | 902 (19.8%) |
| 60 to 89 Minutes | 592 (8.8%) | 86 (1.9%) |
| 90 or more Minutes | 53 (0.8%) | 53 (1.2%) |
Time of Departure to Work by Sex in Parkland
The most frequent times of departure to work in Parkland are 8:00 AM to 8:29 AM (1,193, 17.8%) for males and 8:00 AM to 8:29 AM (919, 20.2%) for females.
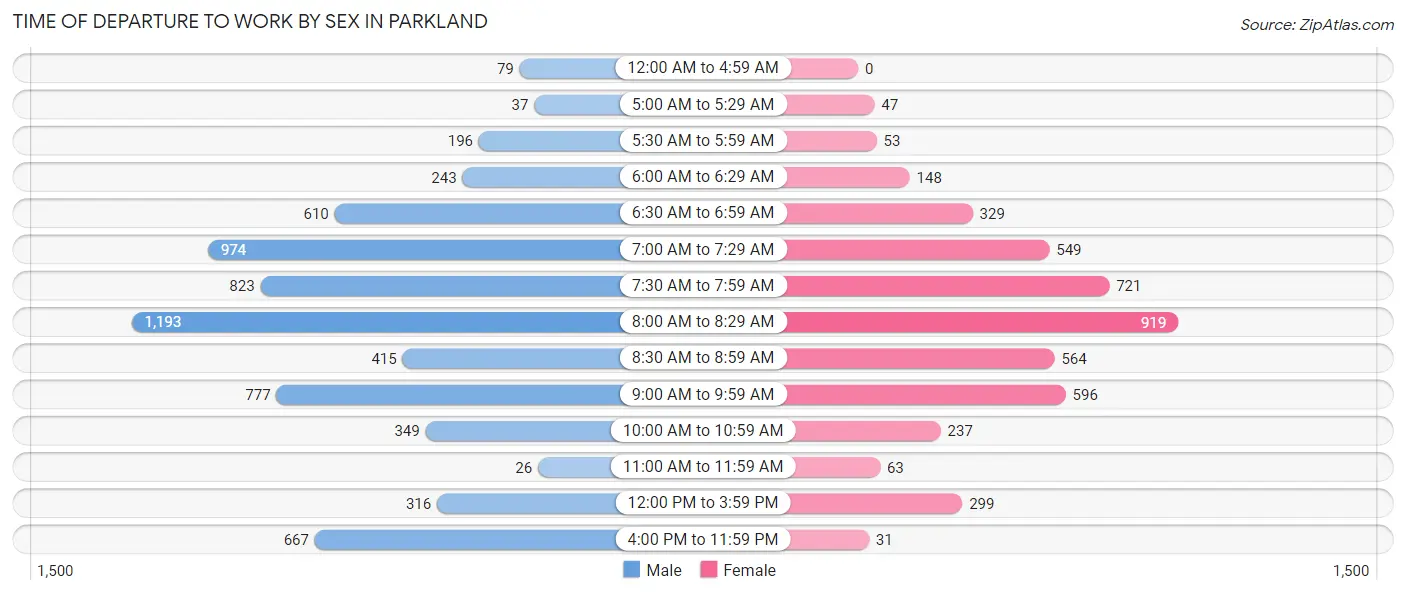
| Time of Departure | Male | Female |
| 12:00 AM to 4:59 AM | 79 (1.2%) | 0 (0.0%) |
| 5:00 AM to 5:29 AM | 37 (0.5%) | 47 (1.0%) |
| 5:30 AM to 5:59 AM | 196 (2.9%) | 53 (1.2%) |
| 6:00 AM to 6:29 AM | 243 (3.6%) | 148 (3.3%) |
| 6:30 AM to 6:59 AM | 610 (9.1%) | 329 (7.2%) |
| 7:00 AM to 7:29 AM | 974 (14.5%) | 549 (12.0%) |
| 7:30 AM to 7:59 AM | 823 (12.3%) | 721 (15.8%) |
| 8:00 AM to 8:29 AM | 1,193 (17.8%) | 919 (20.2%) |
| 8:30 AM to 8:59 AM | 415 (6.2%) | 564 (12.4%) |
| 9:00 AM to 9:59 AM | 777 (11.6%) | 596 (13.1%) |
| 10:00 AM to 10:59 AM | 349 (5.2%) | 237 (5.2%) |
| 11:00 AM to 11:59 AM | 26 (0.4%) | 63 (1.4%) |
| 12:00 PM to 3:59 PM | 316 (4.7%) | 299 (6.6%) |
| 4:00 PM to 11:59 PM | 667 (10.0%) | 31 (0.7%) |
| Total | 6,705 (100.0%) | 4,556 (100.0%) |
Housing Occupancy in Parkland
Occupancy by Ownership in Parkland
Of the total 10,408 dwellings in Parkland, owner-occupied units account for 8,981 (86.3%), while renter-occupied units make up 1,427 (13.7%).
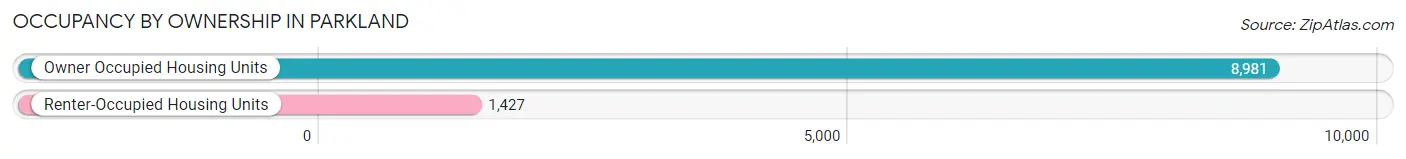
| Occupancy | # Housing Units | % Housing Units |
| Owner Occupied Housing Units | 8,981 | 86.3% |
| Renter-Occupied Housing Units | 1,427 | 13.7% |
| Total Occupied Housing Units | 10,408 | 100.0% |
Occupancy by Household Size in Parkland
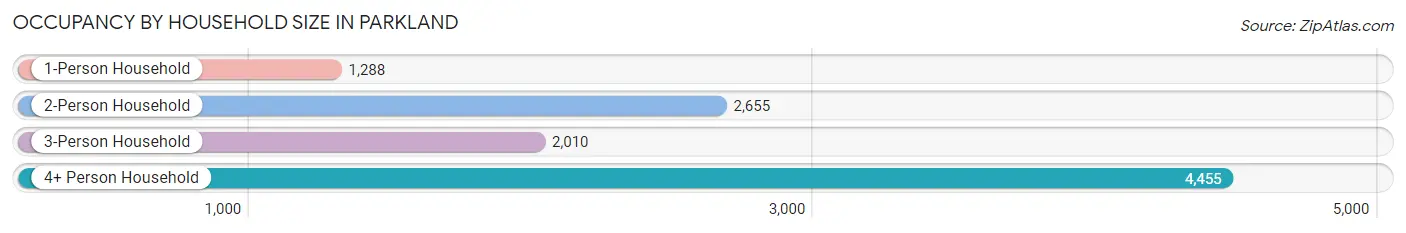
| Household Size | # Housing Units | % Housing Units |
| 1-Person Household | 1,288 | 12.4% |
| 2-Person Household | 2,655 | 25.5% |
| 3-Person Household | 2,010 | 19.3% |
| 4+ Person Household | 4,455 | 42.8% |
| Total Housing Units | 10,408 | 100.0% |
Occupancy by Ownership by Household Size in Parkland
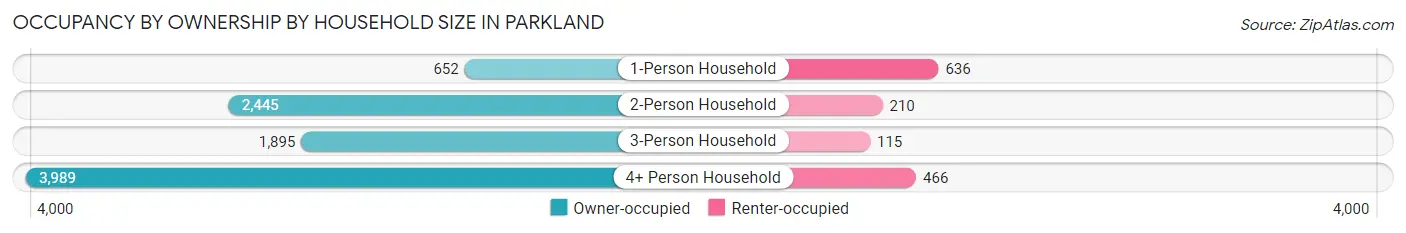
| Household Size | Owner-occupied | Renter-occupied |
| 1-Person Household | 652 (50.6%) | 636 (49.4%) |
| 2-Person Household | 2,445 (92.1%) | 210 (7.9%) |
| 3-Person Household | 1,895 (94.3%) | 115 (5.7%) |
| 4+ Person Household | 3,989 (89.5%) | 466 (10.5%) |
| Total Housing Units | 8,981 (86.3%) | 1,427 (13.7%) |
Occupancy by Educational Attainment in Parkland
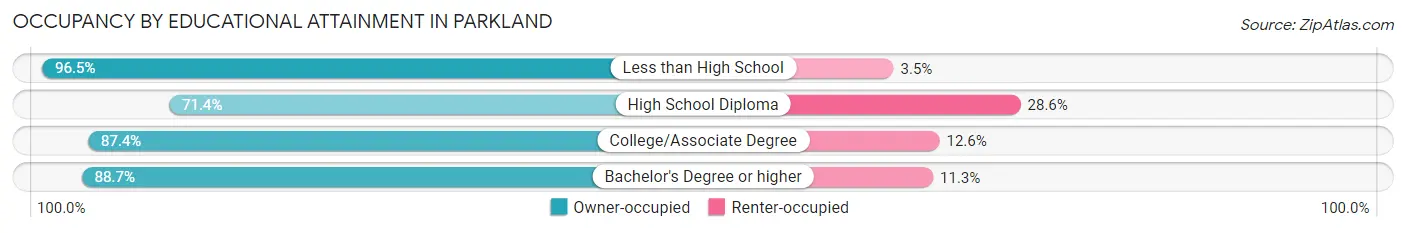
| Household Size | Owner-occupied | Renter-occupied |
| Less than High School | 223 (96.5%) | 8 (3.5%) |
| High School Diploma | 1,029 (71.4%) | 413 (28.6%) |
| College/Associate Degree | 1,351 (87.4%) | 194 (12.6%) |
| Bachelor's Degree or higher | 6,378 (88.7%) | 812 (11.3%) |
Occupancy by Age of Householder in Parkland
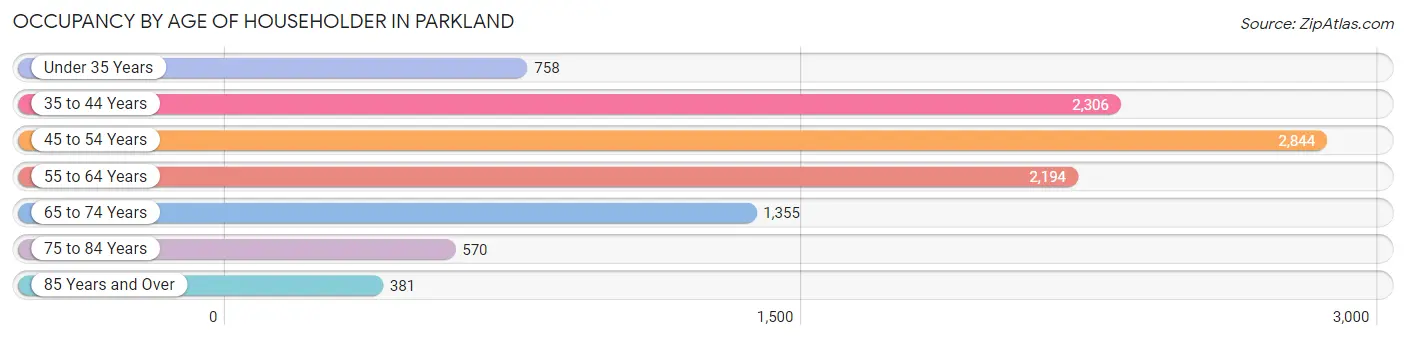
| Age Bracket | # Households | % Households |
| Under 35 Years | 758 | 7.3% |
| 35 to 44 Years | 2,306 | 22.2% |
| 45 to 54 Years | 2,844 | 27.3% |
| 55 to 64 Years | 2,194 | 21.1% |
| 65 to 74 Years | 1,355 | 13.0% |
| 75 to 84 Years | 570 | 5.5% |
| 85 Years and Over | 381 | 3.7% |
| Total | 10,408 | 100.0% |
Housing Finances in Parkland
Median Income by Occupancy in Parkland
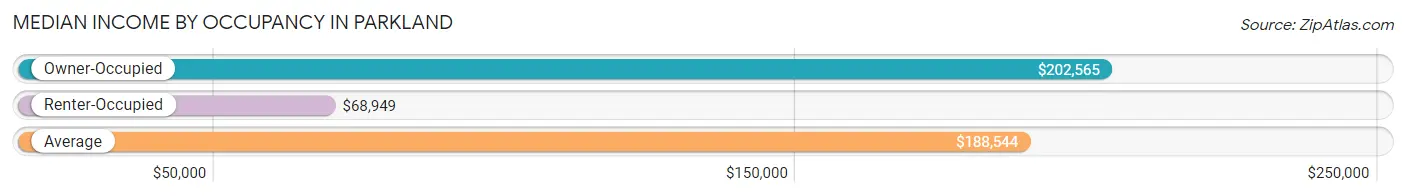
| Occupancy Type | # Households | Median Income |
| Owner-Occupied | 8,981 (86.3%) | $202,565 |
| Renter-Occupied | 1,427 (13.7%) | $68,949 |
| Average | 10,408 (100.0%) | $188,544 |
Occupancy by Householder Income Bracket in Parkland
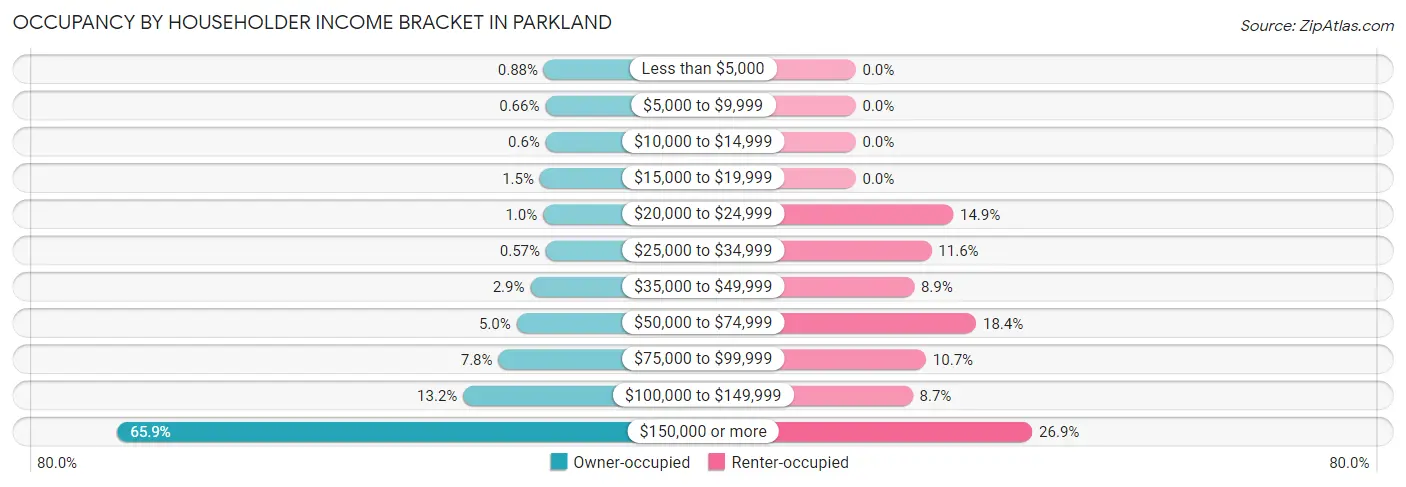
| Income Bracket | Owner-occupied | Renter-occupied |
| Less than $5,000 | 79 (0.9%) | 0 (0.0%) |
| $5,000 to $9,999 | 59 (0.7%) | 0 (0.0%) |
| $10,000 to $14,999 | 54 (0.6%) | 0 (0.0%) |
| $15,000 to $19,999 | 134 (1.5%) | 0 (0.0%) |
| $20,000 to $24,999 | 90 (1.0%) | 212 (14.9%) |
| $25,000 to $34,999 | 51 (0.6%) | 165 (11.6%) |
| $35,000 to $49,999 | 264 (2.9%) | 127 (8.9%) |
| $50,000 to $74,999 | 452 (5.0%) | 262 (18.4%) |
| $75,000 to $99,999 | 701 (7.8%) | 153 (10.7%) |
| $100,000 to $149,999 | 1,183 (13.2%) | 124 (8.7%) |
| $150,000 or more | 5,914 (65.8%) | 384 (26.9%) |
| Total | 8,981 (100.0%) | 1,427 (100.0%) |
Monthly Housing Cost Tiers in Parkland
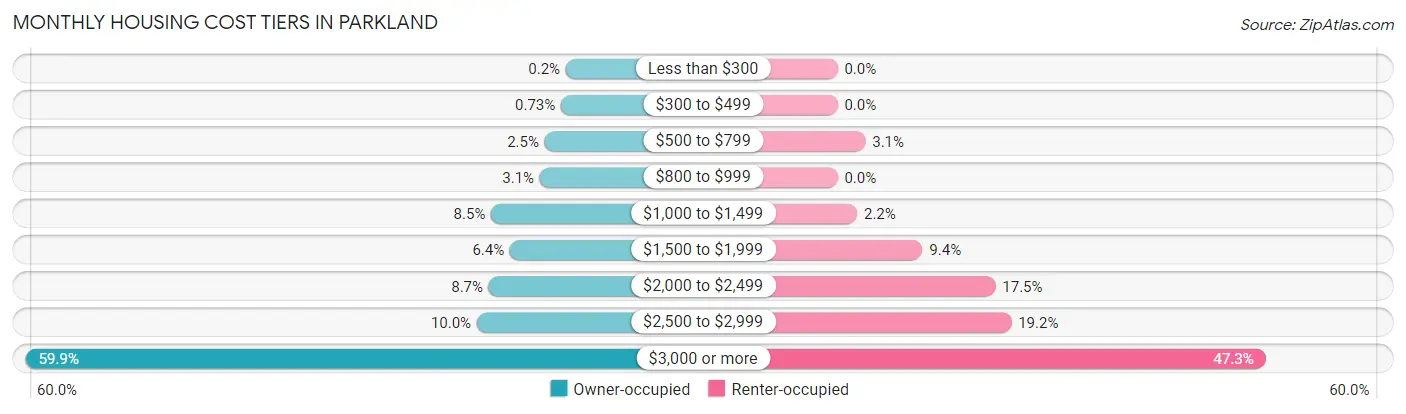
| Monthly Cost | Owner-occupied | Renter-occupied |
| Less than $300 | 18 (0.2%) | 0 (0.0%) |
| $300 to $499 | 66 (0.7%) | 0 (0.0%) |
| $500 to $799 | 227 (2.5%) | 44 (3.1%) |
| $800 to $999 | 276 (3.1%) | 0 (0.0%) |
| $1,000 to $1,499 | 759 (8.5%) | 31 (2.2%) |
| $1,500 to $1,999 | 572 (6.4%) | 134 (9.4%) |
| $2,000 to $2,499 | 782 (8.7%) | 249 (17.4%) |
| $2,500 to $2,999 | 901 (10.0%) | 274 (19.2%) |
| $3,000 or more | 5,380 (59.9%) | 675 (47.3%) |
| Total | 8,981 (100.0%) | 1,427 (100.0%) |
Physical Housing Characteristics in Parkland
Housing Structures in Parkland
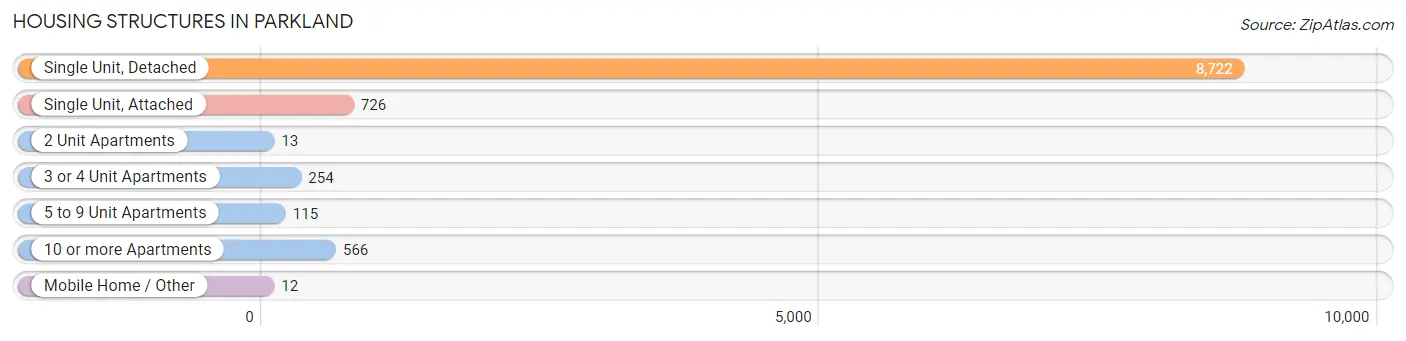
| Structure Type | # Housing Units | % Housing Units |
| Single Unit, Detached | 8,722 | 83.8% |
| Single Unit, Attached | 726 | 7.0% |
| 2 Unit Apartments | 13 | 0.1% |
| 3 or 4 Unit Apartments | 254 | 2.4% |
| 5 to 9 Unit Apartments | 115 | 1.1% |
| 10 or more Apartments | 566 | 5.4% |
| Mobile Home / Other | 12 | 0.1% |
| Total | 10,408 | 100.0% |
Housing Structures by Occupancy in Parkland
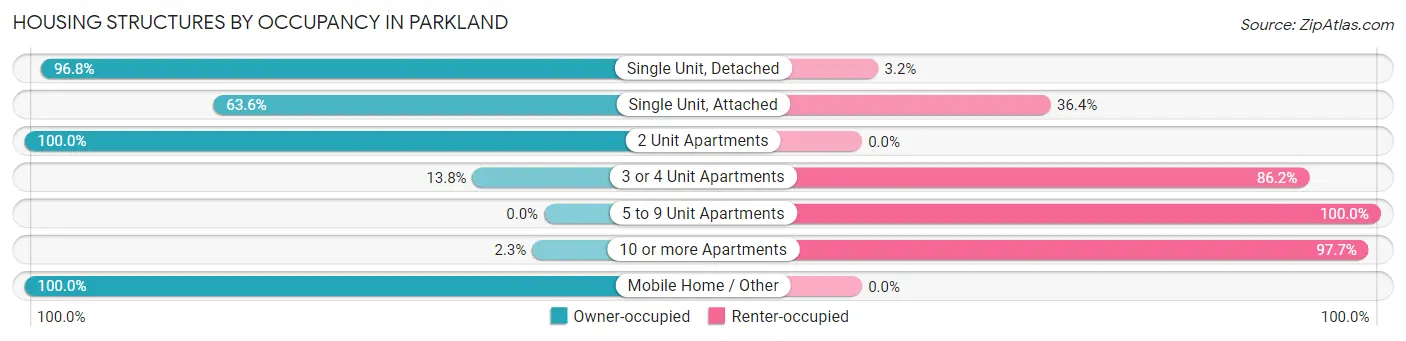
| Structure Type | Owner-occupied | Renter-occupied |
| Single Unit, Detached | 8,446 (96.8%) | 276 (3.2%) |
| Single Unit, Attached | 462 (63.6%) | 264 (36.4%) |
| 2 Unit Apartments | 13 (100.0%) | 0 (0.0%) |
| 3 or 4 Unit Apartments | 35 (13.8%) | 219 (86.2%) |
| 5 to 9 Unit Apartments | 0 (0.0%) | 115 (100.0%) |
| 10 or more Apartments | 13 (2.3%) | 553 (97.7%) |
| Mobile Home / Other | 12 (100.0%) | 0 (0.0%) |
| Total | 8,981 (86.3%) | 1,427 (13.7%) |
Housing Structures by Number of Rooms in Parkland
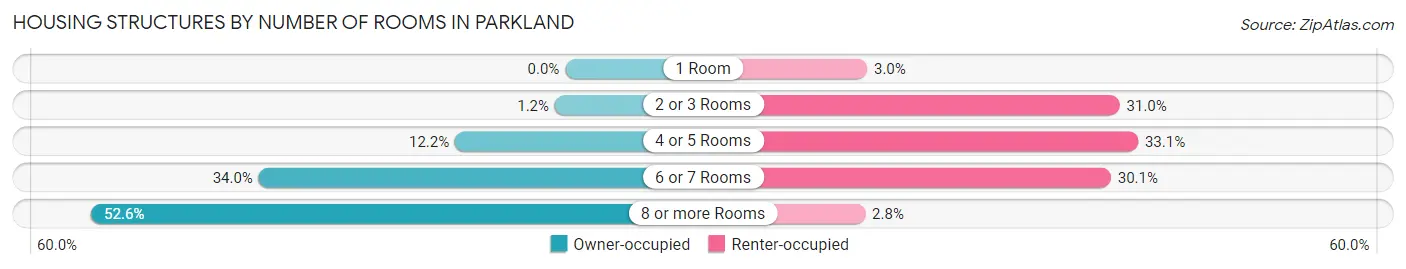
| Number of Rooms | Owner-occupied | Renter-occupied |
| 1 Room | 0 (0.0%) | 43 (3.0%) |
| 2 or 3 Rooms | 103 (1.1%) | 443 (31.0%) |
| 4 or 5 Rooms | 1,098 (12.2%) | 472 (33.1%) |
| 6 or 7 Rooms | 3,055 (34.0%) | 429 (30.1%) |
| 8 or more Rooms | 4,725 (52.6%) | 40 (2.8%) |
| Total | 8,981 (100.0%) | 1,427 (100.0%) |
Housing Structure by Heating Type in Parkland
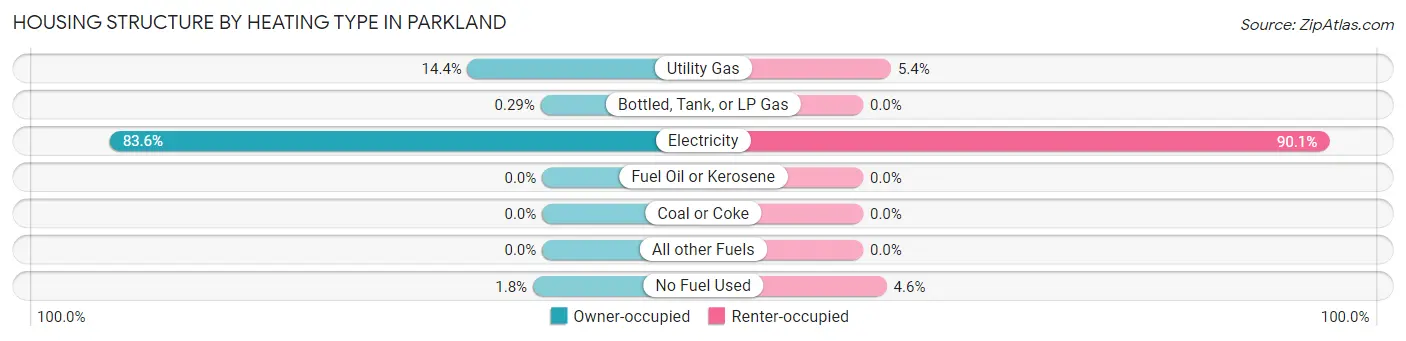
| Heating Type | Owner-occupied | Renter-occupied |
| Utility Gas | 1,292 (14.4%) | 77 (5.4%) |
| Bottled, Tank, or LP Gas | 26 (0.3%) | 0 (0.0%) |
| Electricity | 7,504 (83.6%) | 1,285 (90.0%) |
| Fuel Oil or Kerosene | 0 (0.0%) | 0 (0.0%) |
| Coal or Coke | 0 (0.0%) | 0 (0.0%) |
| All other Fuels | 0 (0.0%) | 0 (0.0%) |
| No Fuel Used | 159 (1.8%) | 65 (4.6%) |
| Total | 8,981 (100.0%) | 1,427 (100.0%) |
Household Vehicle Usage in Parkland
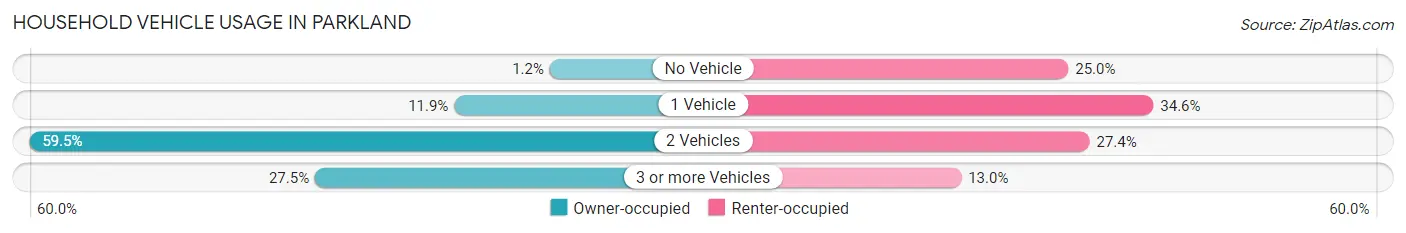
| Vehicles per Household | Owner-occupied | Renter-occupied |
| No Vehicle | 105 (1.2%) | 357 (25.0%) |
| 1 Vehicle | 1,067 (11.9%) | 493 (34.5%) |
| 2 Vehicles | 5,342 (59.5%) | 391 (27.4%) |
| 3 or more Vehicles | 2,467 (27.5%) | 186 (13.0%) |
| Total | 8,981 (100.0%) | 1,427 (100.0%) |
Real Estate & Mortgages in Parkland
Real Estate and Mortgage Overview in Parkland
| Characteristic | Without Mortgage | With Mortgage |
| Housing Units | 2,100 | 6,881 |
| Median Property Value | $749,000 | $807,600 |
| Median Household Income | $148,547 | $4,889 |
| Monthly Housing Costs | $1,378 | $5,307 |
| Real Estate Taxes | $9,364 | $120 |
Property Value by Mortgage Status in Parkland
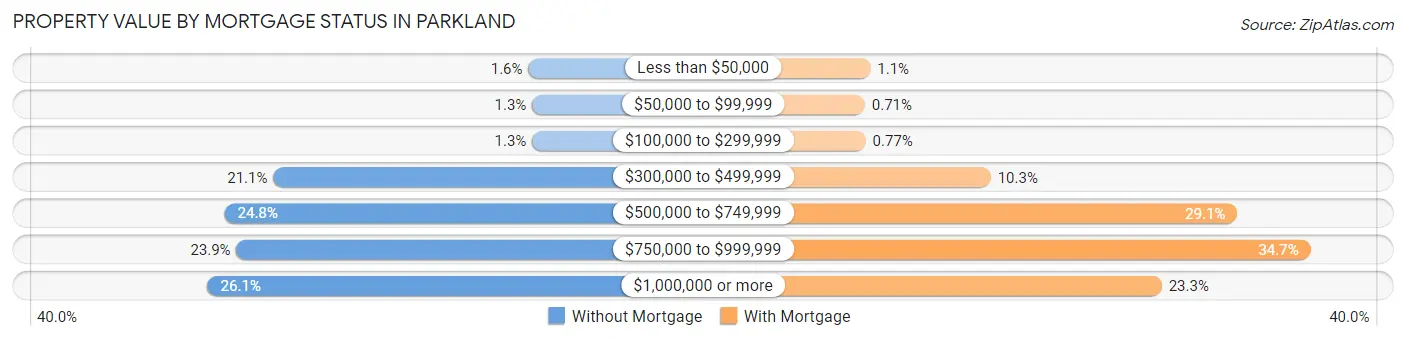
| Property Value | Without Mortgage | With Mortgage |
| Less than $50,000 | 34 (1.6%) | 78 (1.1%) |
| $50,000 to $99,999 | 28 (1.3%) | 49 (0.7%) |
| $100,000 to $299,999 | 28 (1.3%) | 53 (0.8%) |
| $300,000 to $499,999 | 442 (21.0%) | 709 (10.3%) |
| $500,000 to $749,999 | 520 (24.8%) | 2,002 (29.1%) |
| $750,000 to $999,999 | 501 (23.9%) | 2,385 (34.7%) |
| $1,000,000 or more | 547 (26.1%) | 1,605 (23.3%) |
| Total | 2,100 (100.0%) | 6,881 (100.0%) |
Household Income by Mortgage Status in Parkland
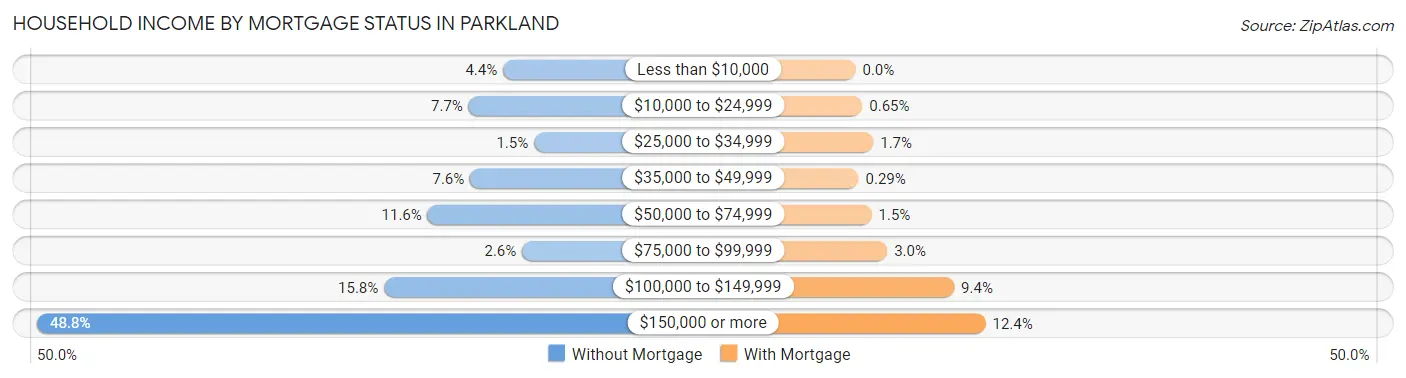
| Household Income | Without Mortgage | With Mortgage |
| Less than $10,000 | 93 (4.4%) | 0 (0.0%) |
| $10,000 to $24,999 | 162 (7.7%) | 45 (0.6%) |
| $25,000 to $34,999 | 31 (1.5%) | 116 (1.7%) |
| $35,000 to $49,999 | 159 (7.6%) | 20 (0.3%) |
| $50,000 to $74,999 | 244 (11.6%) | 105 (1.5%) |
| $75,000 to $99,999 | 55 (2.6%) | 208 (3.0%) |
| $100,000 to $149,999 | 331 (15.8%) | 646 (9.4%) |
| $150,000 or more | 1,025 (48.8%) | 852 (12.4%) |
| Total | 2,100 (100.0%) | 6,881 (100.0%) |
Property Value to Household Income Ratio in Parkland
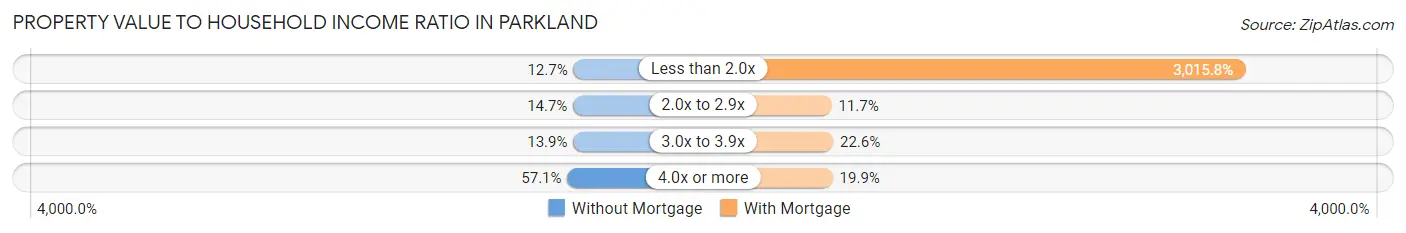
| Value-to-Income Ratio | Without Mortgage | With Mortgage |
| Less than 2.0x | 267 (12.7%) | 207,518 (3,015.8%) |
| 2.0x to 2.9x | 309 (14.7%) | 808 (11.7%) |
| 3.0x to 3.9x | 292 (13.9%) | 1,554 (22.6%) |
| 4.0x or more | 1,198 (57.1%) | 1,372 (19.9%) |
| Total | 2,100 (100.0%) | 6,881 (100.0%) |
Real Estate Taxes by Mortgage Status in Parkland
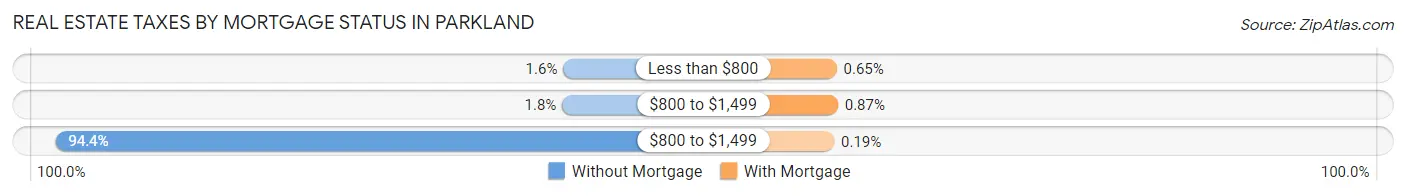
| Property Taxes | Without Mortgage | With Mortgage |
| Less than $800 | 34 (1.6%) | 45 (0.6%) |
| $800 to $1,499 | 38 (1.8%) | 60 (0.9%) |
| $800 to $1,499 | 1,982 (94.4%) | 13 (0.2%) |
| Total | 2,100 (100.0%) | 6,881 (100.0%) |
Health & Disability in Parkland
Health Insurance Coverage by Age in Parkland
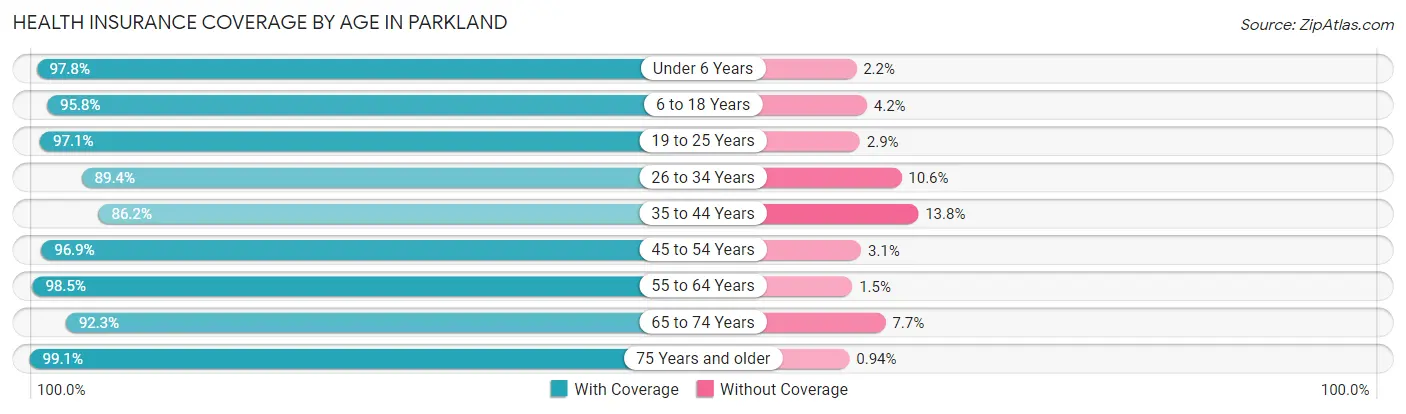
| Age Bracket | With Coverage | Without Coverage |
| Under 6 Years | 2,727 (97.8%) | 62 (2.2%) |
| 6 to 18 Years | 8,616 (95.8%) | 379 (4.2%) |
| 19 to 25 Years | 1,876 (97.1%) | 56 (2.9%) |
| 26 to 34 Years | 1,923 (89.4%) | 229 (10.6%) |
| 35 to 44 Years | 4,212 (86.2%) | 674 (13.8%) |
| 45 to 54 Years | 5,474 (96.9%) | 176 (3.1%) |
| 55 to 64 Years | 3,986 (98.5%) | 60 (1.5%) |
| 65 to 74 Years | 2,525 (92.3%) | 210 (7.7%) |
| 75 Years and older | 1,580 (99.1%) | 15 (0.9%) |
| Total | 32,919 (94.7%) | 1,861 (5.3%) |
Health Insurance Coverage by Citizenship Status in Parkland
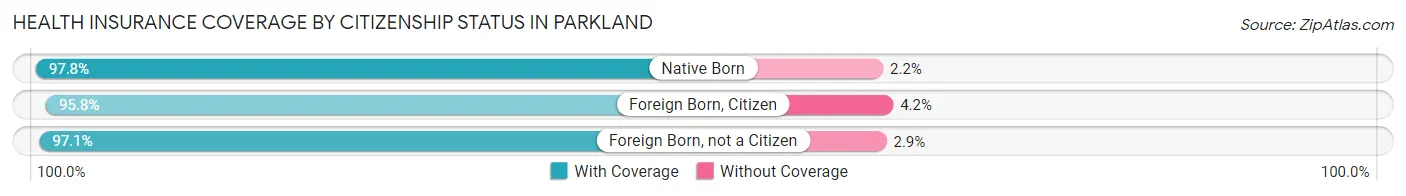
| Citizenship Status | With Coverage | Without Coverage |
| Native Born | 2,727 (97.8%) | 62 (2.2%) |
| Foreign Born, Citizen | 8,616 (95.8%) | 379 (4.2%) |
| Foreign Born, not a Citizen | 1,876 (97.1%) | 56 (2.9%) |
Health Insurance Coverage by Household Income in Parkland
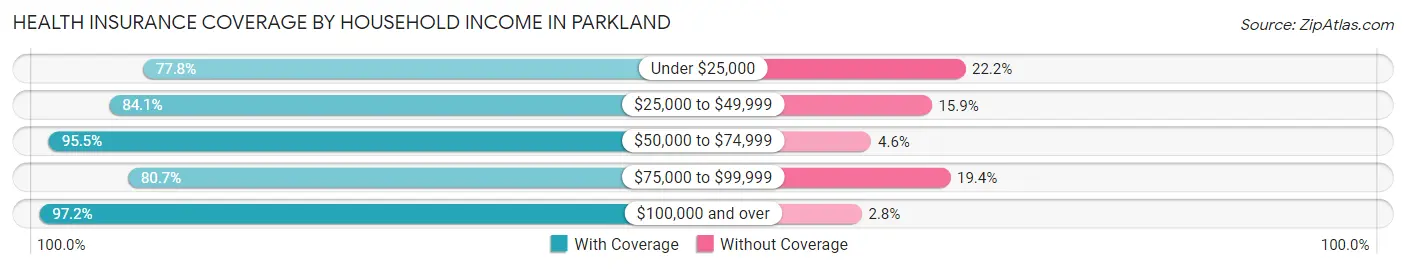
| Household Income | With Coverage | Without Coverage |
| Under $25,000 | 1,089 (77.8%) | 310 (22.2%) |
| $25,000 to $49,999 | 1,034 (84.1%) | 195 (15.9%) |
| $50,000 to $74,999 | 1,911 (95.5%) | 91 (4.5%) |
| $75,000 to $99,999 | 2,100 (80.6%) | 504 (19.4%) |
| $100,000 and over | 26,775 (97.2%) | 761 (2.8%) |
Public vs Private Health Insurance Coverage by Age in Parkland
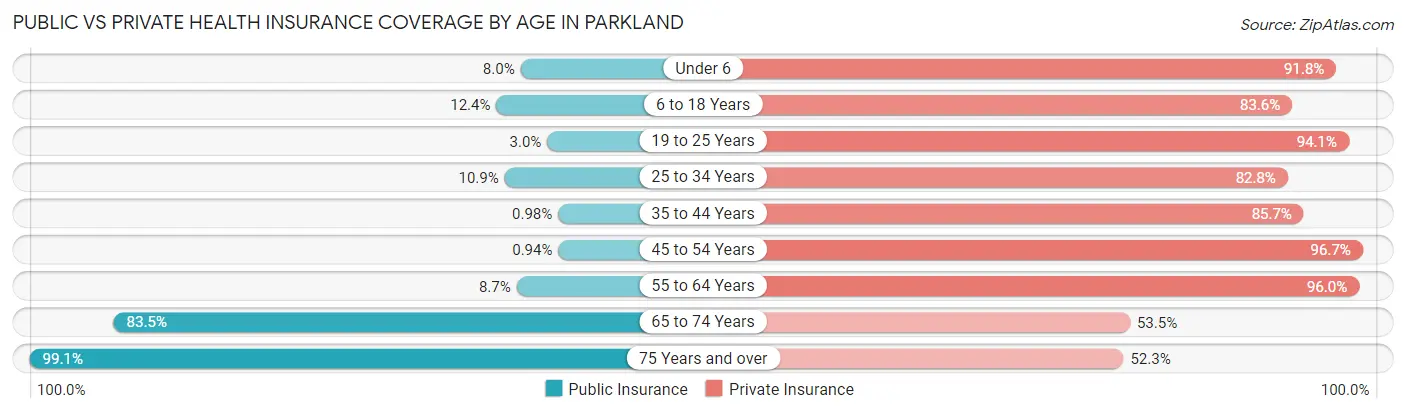
| Age Bracket | Public Insurance | Private Insurance |
| Under 6 | 222 (8.0%) | 2,559 (91.7%) |
| 6 to 18 Years | 1,119 (12.4%) | 7,516 (83.6%) |
| 19 to 25 Years | 58 (3.0%) | 1,818 (94.1%) |
| 25 to 34 Years | 235 (10.9%) | 1,781 (82.8%) |
| 35 to 44 Years | 48 (1.0%) | 4,189 (85.7%) |
| 45 to 54 Years | 53 (0.9%) | 5,462 (96.7%) |
| 55 to 64 Years | 351 (8.7%) | 3,884 (96.0%) |
| 65 to 74 Years | 2,283 (83.5%) | 1,463 (53.5%) |
| 75 Years and over | 1,580 (99.1%) | 834 (52.3%) |
| Total | 5,949 (17.1%) | 29,506 (84.8%) |
Disability Status by Sex by Age in Parkland
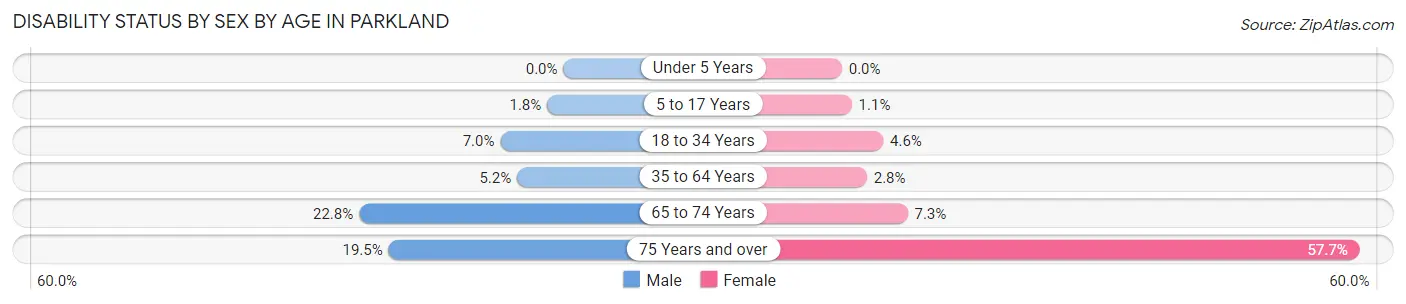
| Age Bracket | Male | Female |
| Under 5 Years | 0 (0.0%) | 0 (0.0%) |
| 5 to 17 Years | 90 (1.8%) | 42 (1.1%) |
| 18 to 34 Years | 178 (7.0%) | 106 (4.6%) |
| 35 to 64 Years | 373 (5.2%) | 204 (2.8%) |
| 65 to 74 Years | 265 (22.8%) | 115 (7.3%) |
| 75 Years and over | 162 (19.5%) | 440 (57.7%) |
Disability Class by Sex by Age in Parkland
Disability Class: Hearing Difficulty
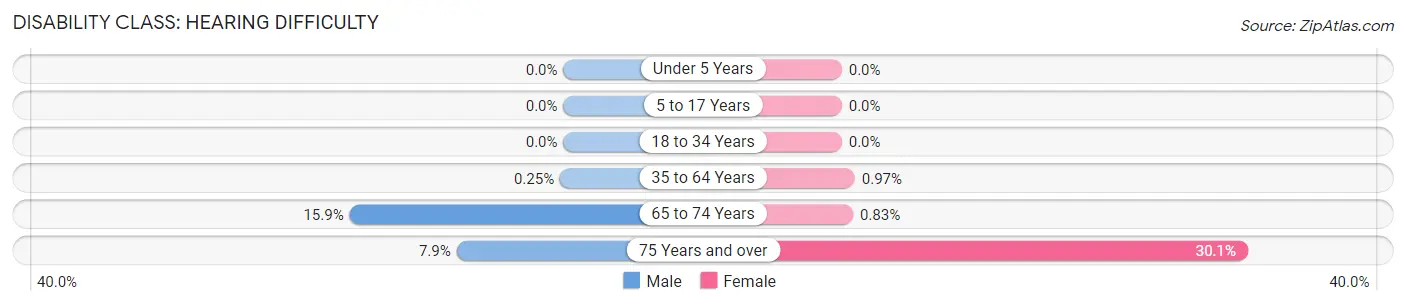
| Age Bracket | Male | Female |
| Under 5 Years | 0 (0.0%) | 0 (0.0%) |
| 5 to 17 Years | 0 (0.0%) | 0 (0.0%) |
| 18 to 34 Years | 0 (0.0%) | 0 (0.0%) |
| 35 to 64 Years | 18 (0.3%) | 71 (1.0%) |
| 65 to 74 Years | 185 (15.9%) | 13 (0.8%) |
| 75 Years and over | 66 (7.9%) | 230 (30.1%) |
Disability Class: Vision Difficulty
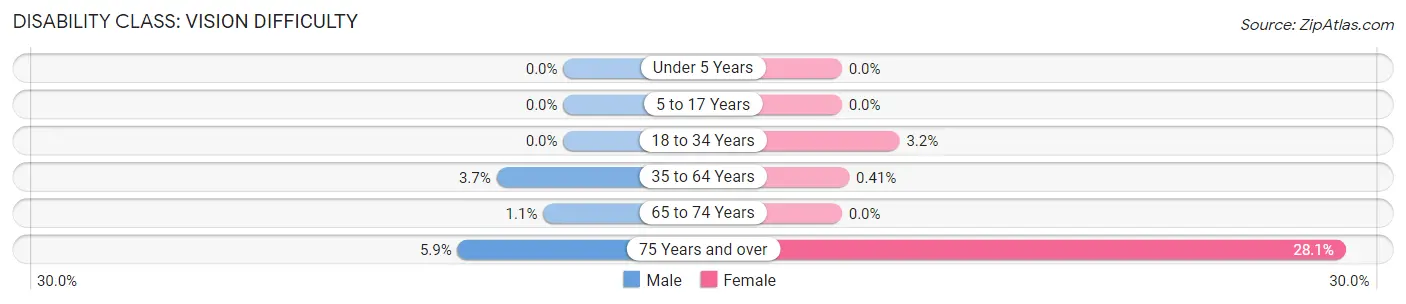
| Age Bracket | Male | Female |
| Under 5 Years | 0 (0.0%) | 0 (0.0%) |
| 5 to 17 Years | 0 (0.0%) | 0 (0.0%) |
| 18 to 34 Years | 0 (0.0%) | 74 (3.2%) |
| 35 to 64 Years | 269 (3.7%) | 30 (0.4%) |
| 65 to 74 Years | 13 (1.1%) | 0 (0.0%) |
| 75 Years and over | 49 (5.9%) | 214 (28.1%) |
Disability Class: Cognitive Difficulty
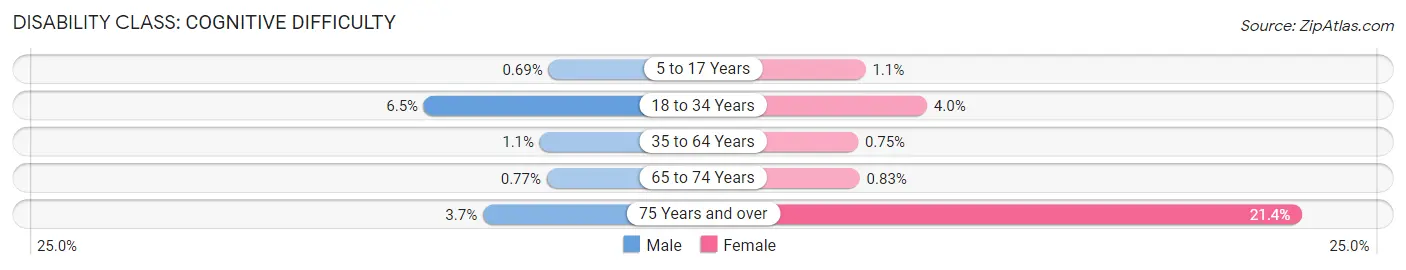
| Age Bracket | Male | Female |
| 5 to 17 Years | 34 (0.7%) | 42 (1.1%) |
| 18 to 34 Years | 164 (6.5%) | 91 (4.0%) |
| 35 to 64 Years | 79 (1.1%) | 55 (0.7%) |
| 65 to 74 Years | 9 (0.8%) | 13 (0.8%) |
| 75 Years and over | 31 (3.7%) | 163 (21.4%) |
Disability Class: Ambulatory Difficulty
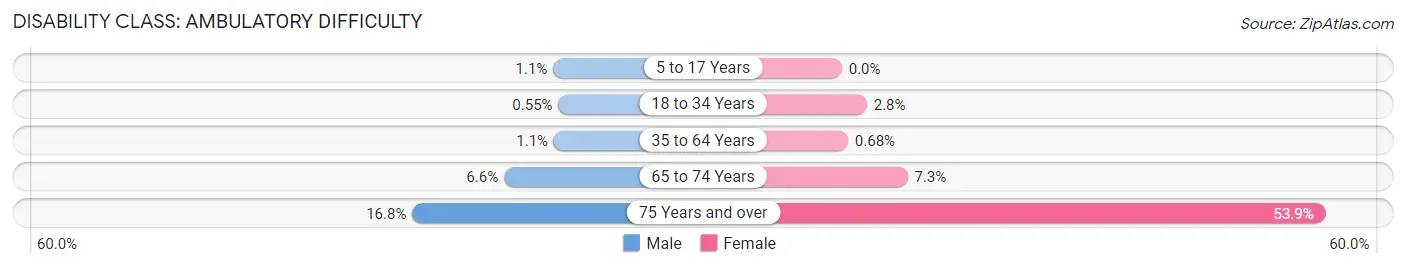
| Age Bracket | Male | Female |
| 5 to 17 Years | 56 (1.1%) | 0 (0.0%) |
| 18 to 34 Years | 14 (0.5%) | 64 (2.8%) |
| 35 to 64 Years | 76 (1.1%) | 50 (0.7%) |
| 65 to 74 Years | 77 (6.6%) | 115 (7.3%) |
| 75 Years and over | 140 (16.8%) | 411 (53.9%) |
Disability Class: Self-Care Difficulty
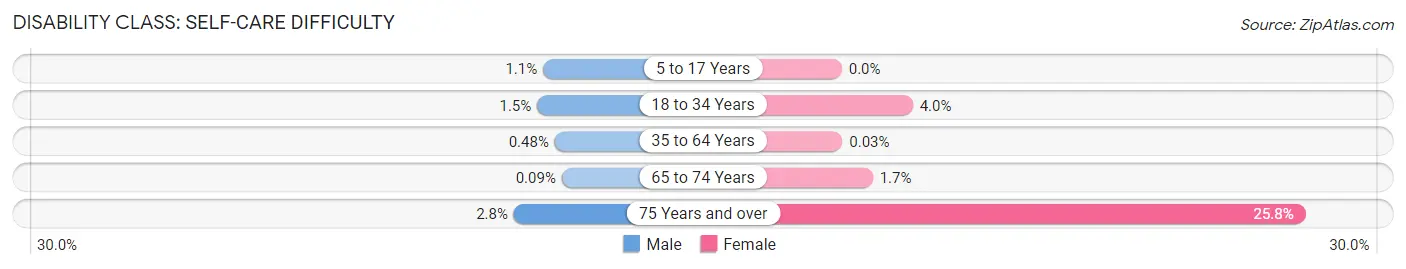
| Age Bracket | Male | Female |
| 5 to 17 Years | 56 (1.1%) | 0 (0.0%) |
| 18 to 34 Years | 37 (1.5%) | 91 (4.0%) |
| 35 to 64 Years | 35 (0.5%) | 2 (0.0%) |
| 65 to 74 Years | 1 (0.1%) | 27 (1.7%) |
| 75 Years and over | 23 (2.8%) | 197 (25.8%) |
Technology Access in Parkland
Computing Device Access in Parkland
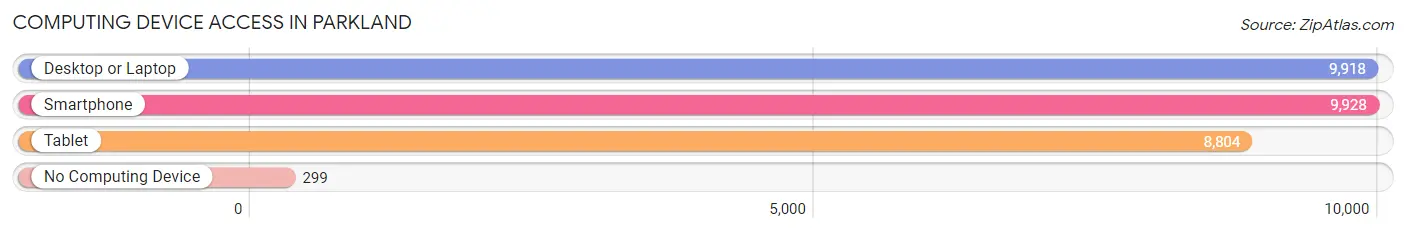
| Device Type | # Households | % Households |
| Desktop or Laptop | 9,918 | 95.3% |
| Smartphone | 9,928 | 95.4% |
| Tablet | 8,804 | 84.6% |
| No Computing Device | 299 | 2.9% |
| Total | 10,408 | 100.0% |
Internet Access in Parkland
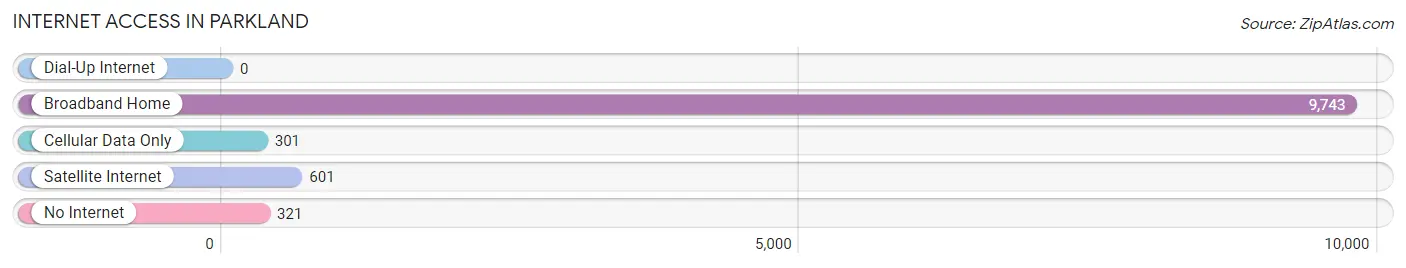
| Internet Type | # Households | % Households |
| Dial-Up Internet | 0 | 0.0% |
| Broadband Home | 9,743 | 93.6% |
| Cellular Data Only | 301 | 2.9% |
| Satellite Internet | 601 | 5.8% |
| No Internet | 321 | 3.1% |
| Total | 10,408 | 100.0% |
Parkland Summary
Parkland, Florida is a city located in Broward County, Florida, United States. It is part of the Miami metropolitan area and is located about 20 miles northwest of Fort Lauderdale. The city was incorporated in 1963 and has a population of approximately 31,000 people.
Geography
Parkland is located in the southeastern part of Broward County, Florida. It is bordered by Coral Springs to the north, Coconut Creek to the east, and Boca Raton to the south. The city is located on the Atlantic Coastal Ridge, which is a series of low hills that run along the eastern coast of Florida. The city is also located near the Everglades, which is a large wetland area located in the southern part of the state.
The city has a total area of 11.7 square miles, of which 11.6 square miles is land and 0.1 square miles is water. The city is located at an elevation of about 20 feet above sea level.
Climate
Parkland has a tropical climate, with hot and humid summers and mild winters. The average temperature in the summer is around 90 degrees Fahrenheit, and the average temperature in the winter is around 70 degrees Fahrenheit. The city receives an average of about 60 inches of rain per year.
Demographics
As of the 2010 census, there were 31,507 people, 10,945 households, and 8,945 families residing in the city. The population density was 2,711.3 people per square mile. The racial makeup of the city was 87.3% White, 4.2% African American, 0.2% Native American, 4.3% Asian, 0.1% Pacific Islander, 1.7% from other races, and 2.2% from two or more races. Hispanic or Latino of any race were 8.3% of the population.
The median income for a household in the city was $107,945, and the median income for a family was $125,945. The per capita income for the city was $50,945. About 2.3% of families and 3.2% of the population were below the poverty line, including 3.7% of those under age 18 and 2.2% of those age 65 or over.
Economy
Parkland is a primarily residential city, and the majority of its economy is based on the service industry. The city is home to several large businesses, including the Parkland Golf and Country Club, the Parkland Medical Center, and the Parkland Mall. The city also has a number of small businesses, including restaurants, retail stores, and professional services.
The city is also home to several large employers, including the Broward County Public Schools, the Broward County Sheriff's Office, and the City of Parkland. The city also has a number of small businesses, including restaurants, retail stores, and professional services.
Conclusion
Parkland, Florida is a city located in Broward County, Florida, United States. It is part of the Miami metropolitan area and is located about 20 miles northwest of Fort Lauderdale. The city was incorporated in 1963 and has a population of approximately 31,000 people. Parkland has a tropical climate, with hot and humid summers and mild winters. The city has a primarily residential economy, with the majority of its economy based on the service industry. The city is home to several large businesses, including the Parkland Golf and Country Club, the Parkland Medical Center, and the Parkland Mall. The city also has a number of small businesses, including restaurants, retail stores, and professional services.
Common Questions
What is Per Capita Income in Parkland?
Per Capita income in Parkland is $63,915.
What is the Median Family Income in Parkland?
Median Family Income in Parkland is $197,589.
What is the Median Household income in Parkland?
Median Household Income in Parkland is $188,544.
What is Income or Wage Gap in Parkland?
Income or Wage Gap in Parkland is 38.6%.
Women in Parkland earn 61.4 cents for every dollar earned by a man.
What is Family Income Deficit in Parkland?
Family Income Deficit in Parkland is $7,681.
Families that are below poverty line in Parkland earn $7,681 less on average than the poverty threshold level.
What is Inequality or Gini Index in Parkland?
Inequality or Gini Index in Parkland is 0.40.
What is the Total Population of Parkland?
Total Population of Parkland is 34,832.
What is the Total Male Population of Parkland?
Total Male Population of Parkland is 18,164.
What is the Total Female Population of Parkland?
Total Female Population of Parkland is 16,668.
What is the Ratio of Males per 100 Females in Parkland?
There are 108.98 Males per 100 Females in Parkland.
What is the Ratio of Females per 100 Males in Parkland?
There are 91.76 Females per 100 Males in Parkland.
What is the Median Population Age in Parkland?
Median Population Age in Parkland is 38.4 Years.
What is the Average Family Size in Parkland
Average Family Size in Parkland is 3.7 People.
What is the Average Household Size in Parkland
Average Household Size in Parkland is 3.3 People.
How Large is the Labor Force in Parkland?
There are 16,233 People in the Labor Forcein in Parkland.
What is the Percentage of People in the Labor Force in Parkland?
64.2% of People are in the Labor Force in Parkland.
What is the Unemployment Rate in Parkland?
Unemployment Rate in Parkland is 4.5%.