Forest City, FL Map & Demographics
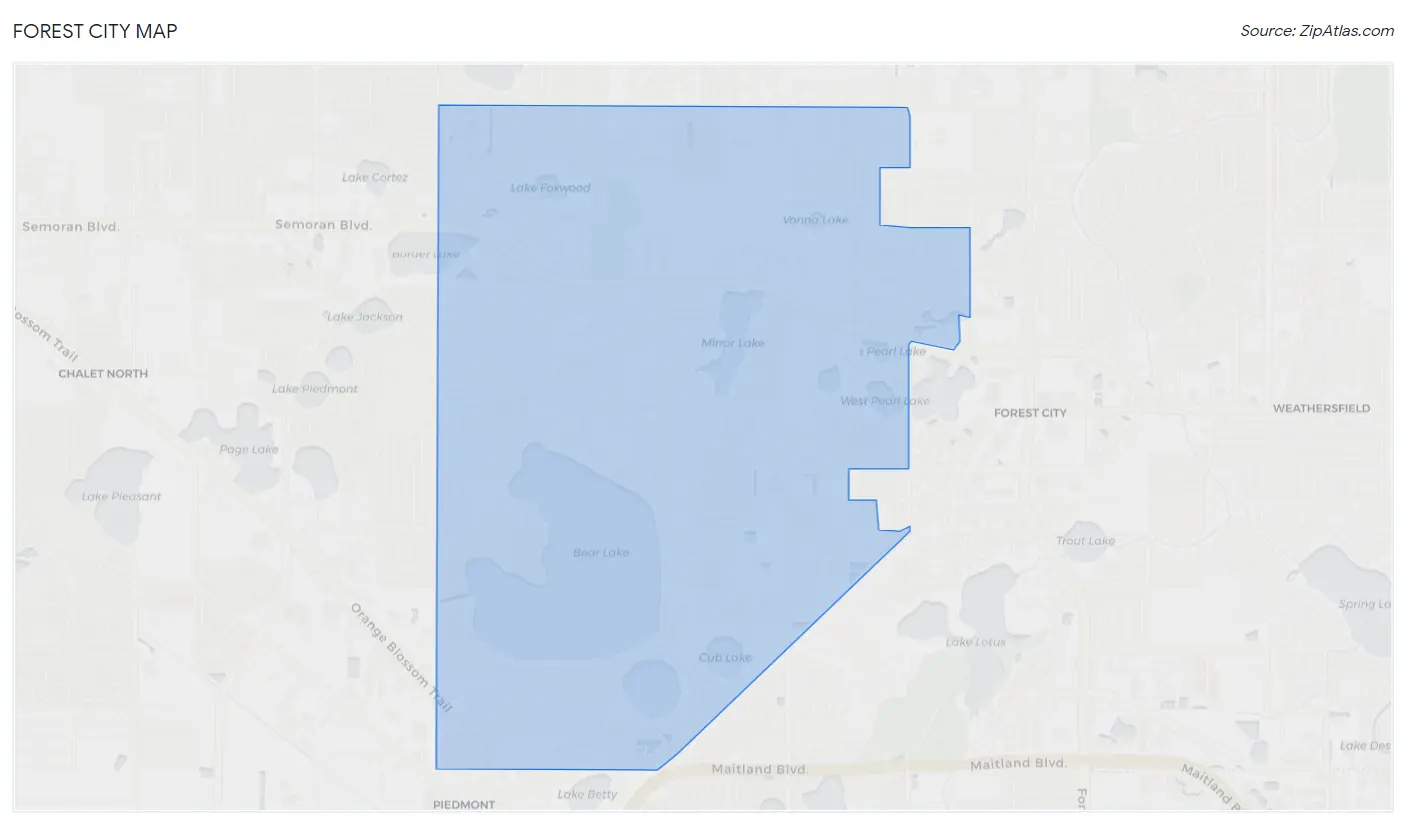
Forest City Map
Forest City Overview
$42,154
PER CAPITA INCOME
$93,664
AVG FAMILY INCOME
$81,928
AVG HOUSEHOLD INCOME
28.8%
WAGE / INCOME GAP [ % ]
71.2¢/ $1
WAGE / INCOME GAP [ $ ]
0.42
INEQUALITY / GINI INDEX
14,851
TOTAL POPULATION
7,121
MALE POPULATION
7,730
FEMALE POPULATION
92.12
MALES / 100 FEMALES
108.55
FEMALES / 100 MALES
41.4
MEDIAN AGE
3.0
AVG FAMILY SIZE
2.7
AVG HOUSEHOLD SIZE
8,036
LABOR FORCE [ PEOPLE ]
65.2%
PERCENT IN LABOR FORCE
3.0%
UNEMPLOYMENT RATE
Income in Forest City
Income Overview in Forest City
Per Capita Income in Forest City is $42,154, while median incomes of families and households are $93,664 and $81,928 respectively.
| Characteristic | Number | Measure |
| Per Capita Income | 14,851 | $42,154 |
| Median Family Income | 3,993 | $93,664 |
| Mean Family Income | 3,993 | $124,691 |
| Median Household Income | 5,416 | $81,928 |
| Mean Household Income | 5,416 | $113,535 |
| Income Deficit | 3,993 | $0 |
| Wage / Income Gap (%) | 14,851 | 28.85% |
| Wage / Income Gap ($) | 14,851 | 71.15¢ per $1 |
| Gini / Inequality Index | 14,851 | 0.42 |
Earnings by Sex in Forest City
Average Earnings in Forest City are $45,053, $52,438 for men and $37,310 for women, a difference of 28.8%.
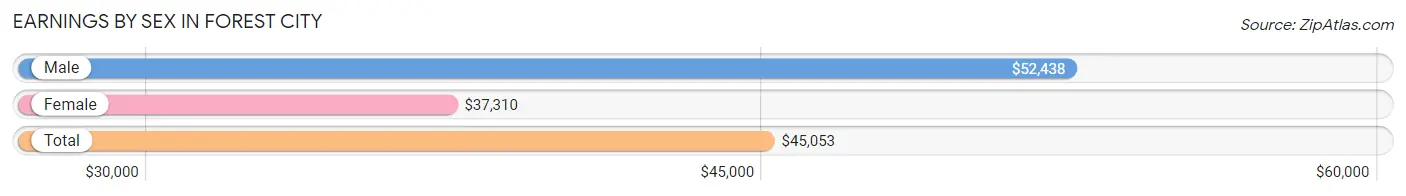
| Sex | Number | Average Earnings |
| Male | 4,034 (48.7%) | $52,438 |
| Female | 4,244 (51.3%) | $37,310 |
| Total | 8,278 (100.0%) | $45,053 |
Earnings by Sex by Income Bracket in Forest City
The most common earnings brackets in Forest City are $100,000+ for men (992 | 24.6%) and $100,000+ for women (403 | 9.5%).
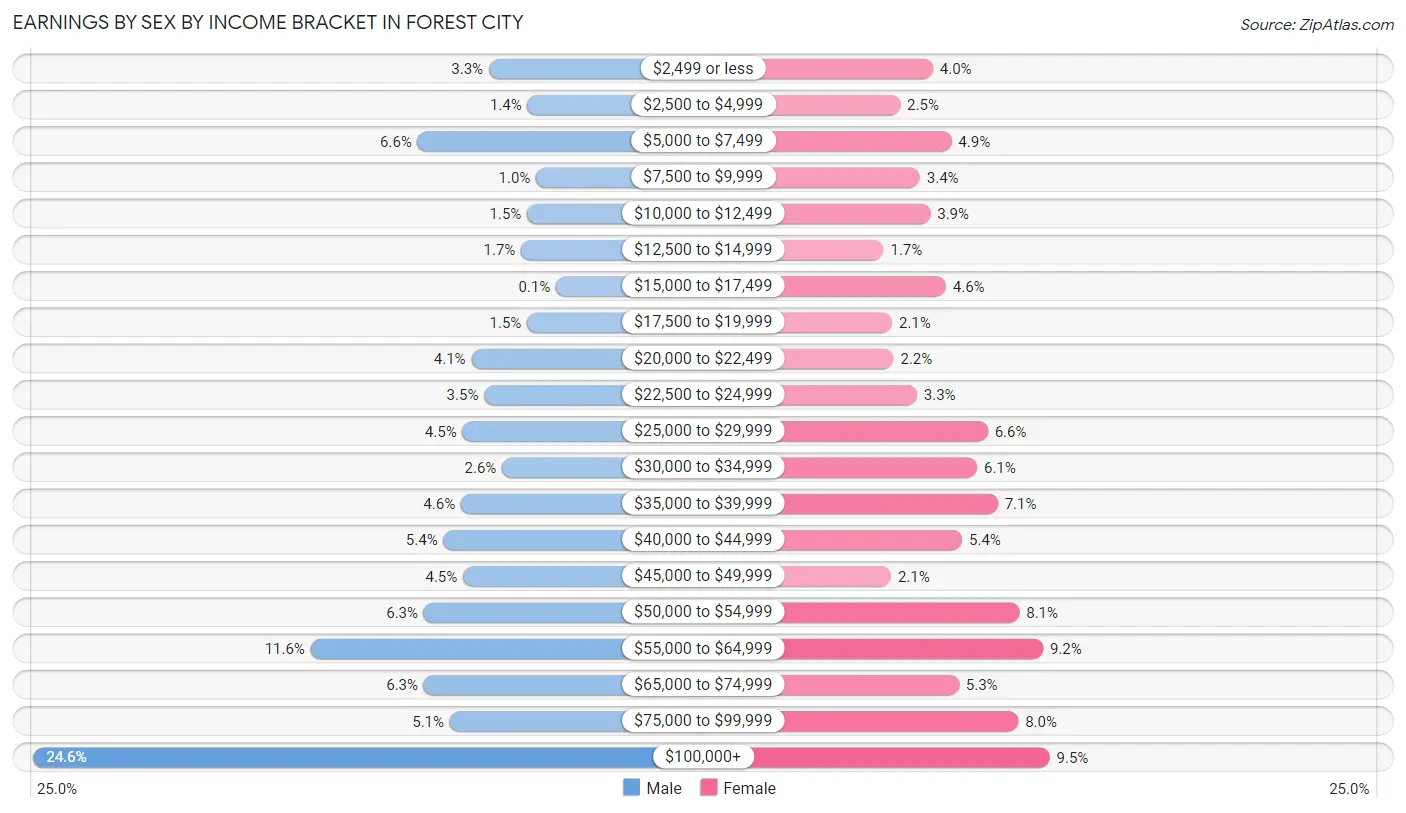
| Income | Male | Female |
| $2,499 or less | 131 (3.3%) | 171 (4.0%) |
| $2,500 to $4,999 | 58 (1.4%) | 106 (2.5%) |
| $5,000 to $7,499 | 266 (6.6%) | 208 (4.9%) |
| $7,500 to $9,999 | 42 (1.0%) | 145 (3.4%) |
| $10,000 to $12,499 | 59 (1.5%) | 166 (3.9%) |
| $12,500 to $14,999 | 70 (1.7%) | 73 (1.7%) |
| $15,000 to $17,499 | 4 (0.1%) | 197 (4.6%) |
| $17,500 to $19,999 | 59 (1.5%) | 90 (2.1%) |
| $20,000 to $22,499 | 164 (4.1%) | 93 (2.2%) |
| $22,500 to $24,999 | 140 (3.5%) | 139 (3.3%) |
| $25,000 to $29,999 | 181 (4.5%) | 280 (6.6%) |
| $30,000 to $34,999 | 106 (2.6%) | 259 (6.1%) |
| $35,000 to $39,999 | 184 (4.6%) | 300 (7.1%) |
| $40,000 to $44,999 | 217 (5.4%) | 229 (5.4%) |
| $45,000 to $49,999 | 180 (4.5%) | 88 (2.1%) |
| $50,000 to $54,999 | 254 (6.3%) | 343 (8.1%) |
| $55,000 to $64,999 | 468 (11.6%) | 390 (9.2%) |
| $65,000 to $74,999 | 254 (6.3%) | 223 (5.2%) |
| $75,000 to $99,999 | 205 (5.1%) | 341 (8.0%) |
| $100,000+ | 992 (24.6%) | 403 (9.5%) |
| Total | 4,034 (100.0%) | 4,244 (100.0%) |
Earnings by Sex by Educational Attainment in Forest City
Average earnings in Forest City are $55,107 for men and $42,444 for women, a difference of 23.0%. Men with an educational attainment of graduate degree enjoy the highest average annual earnings of $115,288, while those with high school diploma education earn the least with $40,348. Women with an educational attainment of graduate degree earn the most with the average annual earnings of $66,734, while those with high school diploma education have the smallest earnings of $33,423.
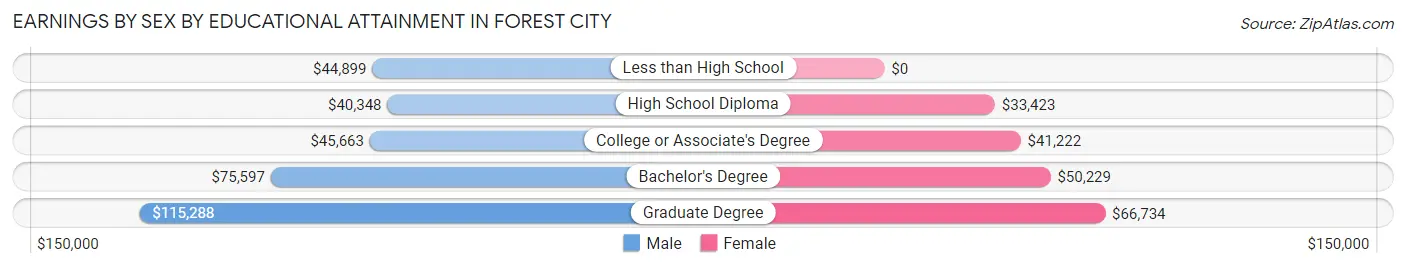
| Educational Attainment | Male Income | Female Income |
| Less than High School | $44,899 | $0 |
| High School Diploma | $40,348 | $33,423 |
| College or Associate's Degree | $45,663 | $41,222 |
| Bachelor's Degree | $75,597 | $50,229 |
| Graduate Degree | $115,288 | $66,734 |
| Total | $55,107 | $42,444 |
Family Income in Forest City
Family Income Brackets in Forest City
According to the Forest City family income data, there are 771 families falling into the $50,000 to $74,999 income range, which is the most common income bracket and makes up 19.3% of all families. Conversely, the $10,000 to $14,999 income bracket is the least frequent group with only 20 families (0.5%) belonging to this category.
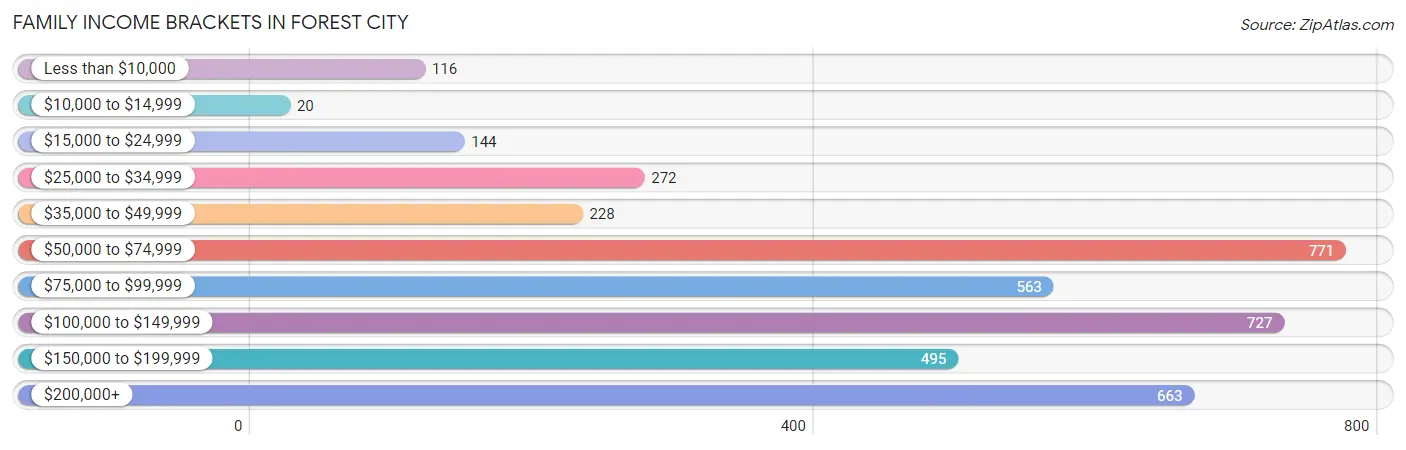
| Income Bracket | # Families | % Families |
| Less than $10,000 | 116 | 2.9% |
| $10,000 to $14,999 | 20 | 0.5% |
| $15,000 to $24,999 | 144 | 3.6% |
| $25,000 to $34,999 | 272 | 6.8% |
| $35,000 to $49,999 | 228 | 5.7% |
| $50,000 to $74,999 | 771 | 19.3% |
| $75,000 to $99,999 | 563 | 14.1% |
| $100,000 to $149,999 | 727 | 18.2% |
| $150,000 to $199,999 | 495 | 12.4% |
| $200,000+ | 663 | 16.6% |
Family Income by Famaliy Size in Forest City
6-person families (97 | 2.4%) account for the highest median family income in Forest City with $162,292 per family, while 4-person families (946 | 23.7%) have the highest median income of $38,203 per family member.
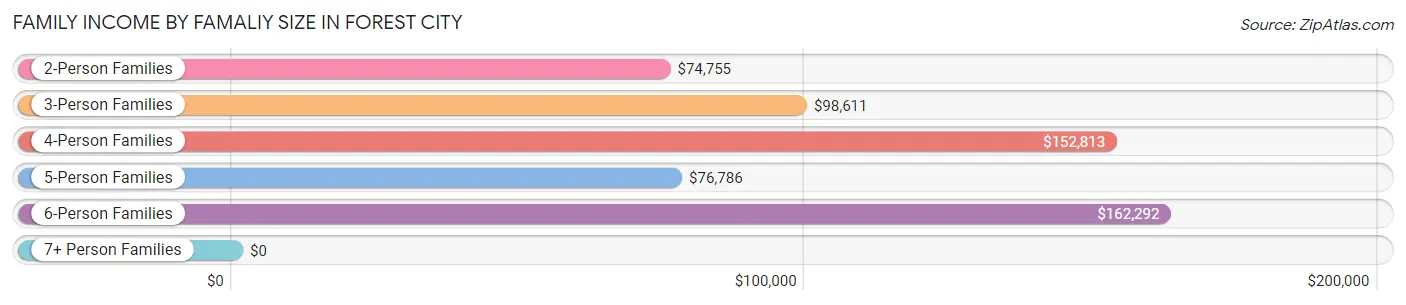
| Income Bracket | # Families | Median Income |
| 2-Person Families | 1,796 (45.0%) | $74,755 |
| 3-Person Families | 788 (19.7%) | $98,611 |
| 4-Person Families | 946 (23.7%) | $152,813 |
| 5-Person Families | 348 (8.7%) | $76,786 |
| 6-Person Families | 97 (2.4%) | $162,292 |
| 7+ Person Families | 18 (0.4%) | $0 |
| Total | 3,993 (100.0%) | $93,664 |
Family Income by Number of Earners in Forest City
The median family income in Forest City is $93,664, with families comprising 3+ earners (539) having the highest median family income of $175,788, while families with 1 earner (1,463) have the lowest median family income of $73,717, accounting for 13.5% and 36.6% of families, respectively.
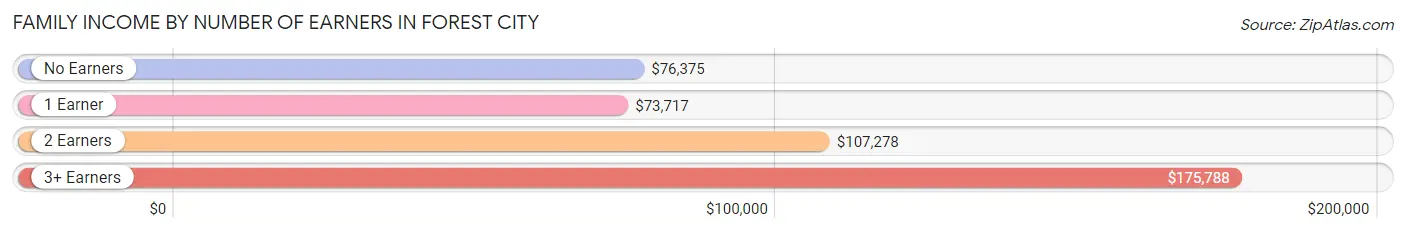
| Number of Earners | # Families | Median Income |
| No Earners | 345 (8.6%) | $76,375 |
| 1 Earner | 1,463 (36.6%) | $73,717 |
| 2 Earners | 1,646 (41.2%) | $107,278 |
| 3+ Earners | 539 (13.5%) | $175,788 |
| Total | 3,993 (100.0%) | $93,664 |
Household Income in Forest City
Household Income Brackets in Forest City
With 1,056 households falling in the category, the $50,000 to $74,999 income range is the most frequent in Forest City, accounting for 19.5% of all households. In contrast, only 11 households (0.2%) fall into the $10,000 to $14,999 income bracket, making it the least populous group.
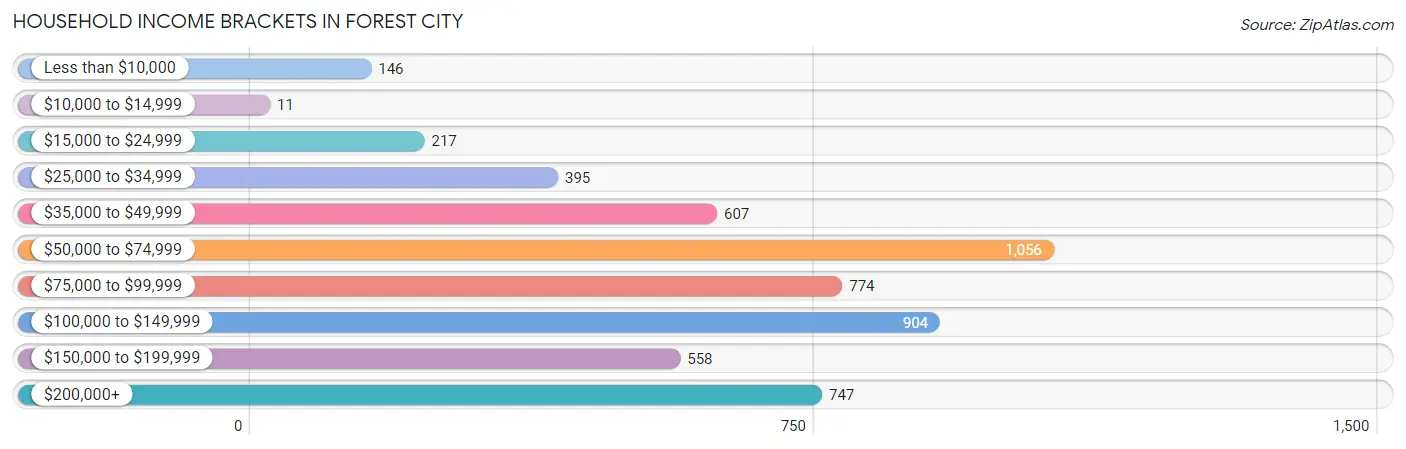
| Income Bracket | # Households | % Households |
| Less than $10,000 | 146 | 2.7% |
| $10,000 to $14,999 | 11 | 0.2% |
| $15,000 to $24,999 | 217 | 4.0% |
| $25,000 to $34,999 | 395 | 7.3% |
| $35,000 to $49,999 | 607 | 11.2% |
| $50,000 to $74,999 | 1,056 | 19.5% |
| $75,000 to $99,999 | 774 | 14.3% |
| $100,000 to $149,999 | 904 | 16.7% |
| $150,000 to $199,999 | 558 | 10.3% |
| $200,000+ | 747 | 13.8% |
Household Income by Householder Age in Forest City
The median household income in Forest City is $81,928, with the highest median household income of $105,417 found in the 45 to 64 years age bracket for the primary householder. A total of 2,064 households (38.1%) fall into this category. Meanwhile, the 15 to 24 years age bracket for the primary householder has the lowest median household income of $52,135, with 178 households (3.3%) in this group.
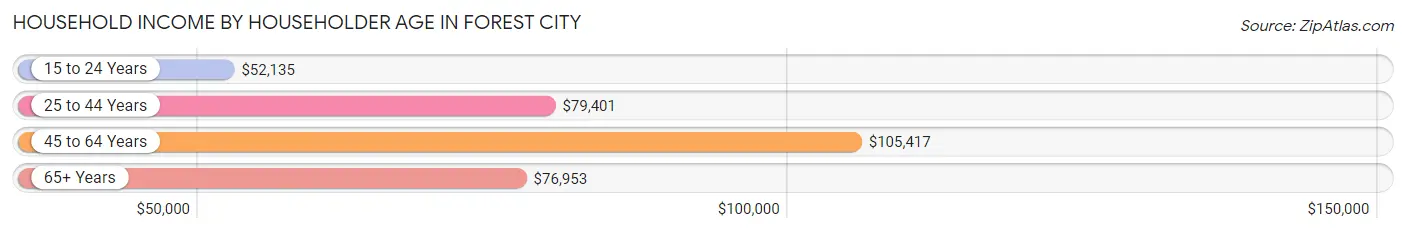
| Income Bracket | # Households | Median Income |
| 15 to 24 Years | 178 (3.3%) | $52,135 |
| 25 to 44 Years | 1,905 (35.2%) | $79,401 |
| 45 to 64 Years | 2,064 (38.1%) | $105,417 |
| 65+ Years | 1,269 (23.4%) | $76,953 |
| Total | 5,416 (100.0%) | $81,928 |
Poverty in Forest City
Income Below Poverty by Sex and Age in Forest City
With 11.3% poverty level for males and 11.7% for females among the residents of Forest City, 5 year old males and under 5 year old females are the most vulnerable to poverty, with 38 males (53.5%) and 50 females (21.6%) in their respective age groups living below the poverty level.
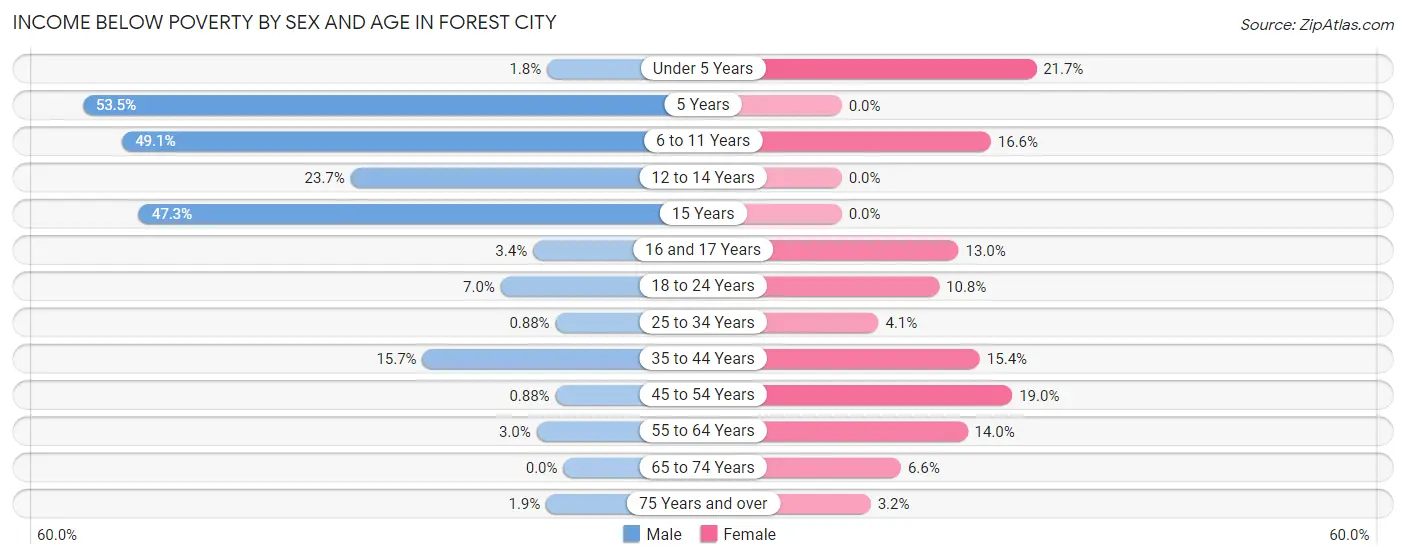
| Age Bracket | Male | Female |
| Under 5 Years | 4 (1.8%) | 50 (21.6%) |
| 5 Years | 38 (53.5%) | 0 (0.0%) |
| 6 to 11 Years | 333 (49.1%) | 79 (16.6%) |
| 12 to 14 Years | 77 (23.7%) | 0 (0.0%) |
| 15 Years | 78 (47.3%) | 0 (0.0%) |
| 16 and 17 Years | 12 (3.4%) | 32 (13.0%) |
| 18 to 24 Years | 24 (7.0%) | 72 (10.8%) |
| 25 to 34 Years | 7 (0.9%) | 46 (4.1%) |
| 35 to 44 Years | 180 (15.7%) | 173 (15.4%) |
| 45 to 54 Years | 9 (0.9%) | 220 (19.0%) |
| 55 to 64 Years | 26 (3.0%) | 131 (14.0%) |
| 65 to 74 Years | 0 (0.0%) | 40 (6.6%) |
| 75 Years and over | 10 (1.9%) | 20 (3.2%) |
| Total | 798 (11.3%) | 863 (11.7%) |
Income Above Poverty by Sex and Age in Forest City
According to the poverty statistics in Forest City, males aged 65 to 74 years and females aged 5 years are the age groups that are most secure financially, with 100.0% of males and 100.0% of females in these age groups living above the poverty line.
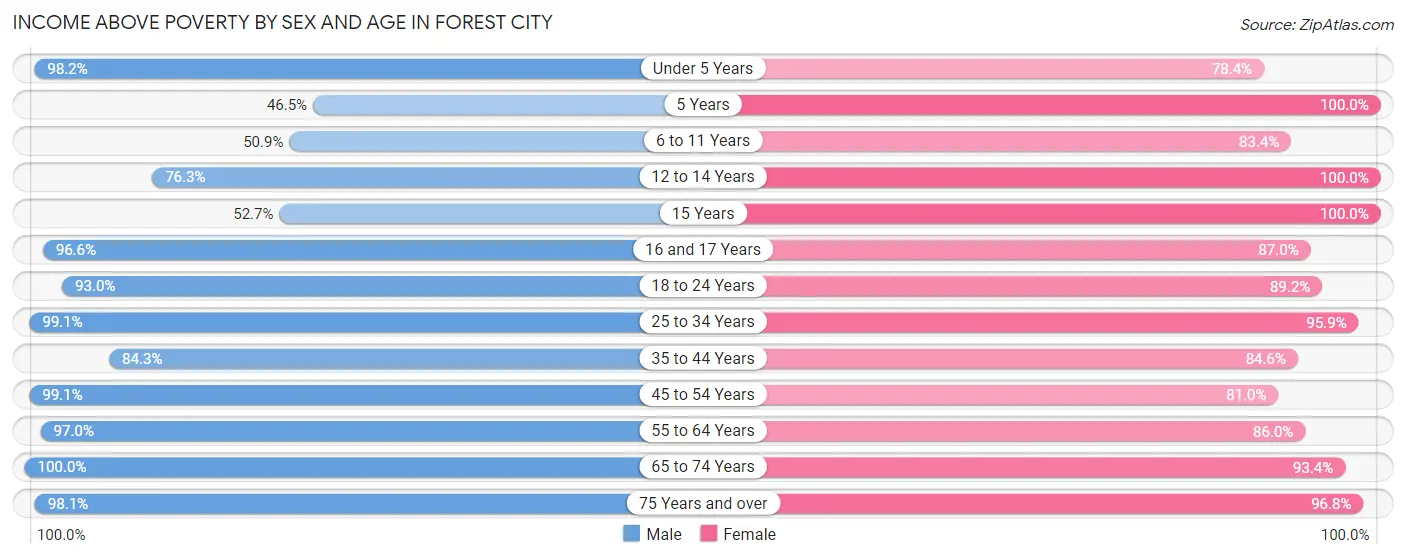
| Age Bracket | Male | Female |
| Under 5 Years | 216 (98.2%) | 181 (78.3%) |
| 5 Years | 33 (46.5%) | 25 (100.0%) |
| 6 to 11 Years | 345 (50.9%) | 397 (83.4%) |
| 12 to 14 Years | 248 (76.3%) | 122 (100.0%) |
| 15 Years | 87 (52.7%) | 67 (100.0%) |
| 16 and 17 Years | 343 (96.6%) | 214 (87.0%) |
| 18 to 24 Years | 320 (93.0%) | 592 (89.2%) |
| 25 to 34 Years | 788 (99.1%) | 1,079 (95.9%) |
| 35 to 44 Years | 967 (84.3%) | 952 (84.6%) |
| 45 to 54 Years | 1,018 (99.1%) | 939 (81.0%) |
| 55 to 64 Years | 847 (97.0%) | 805 (86.0%) |
| 65 to 74 Years | 515 (100.0%) | 567 (93.4%) |
| 75 Years and over | 511 (98.1%) | 602 (96.8%) |
| Total | 6,238 (88.7%) | 6,542 (88.3%) |
Income Below Poverty Among Married-Couple Families in Forest City
The poverty statistics for married-couple families in Forest City show that 5.7% or 164 of the total 2,880 families live below the poverty line. Families with 3 or 4 children have the highest poverty rate of 54.0%, comprising of 80 families. On the other hand, families with no children have the lowest poverty rate of 0.6%, which includes 10 families.
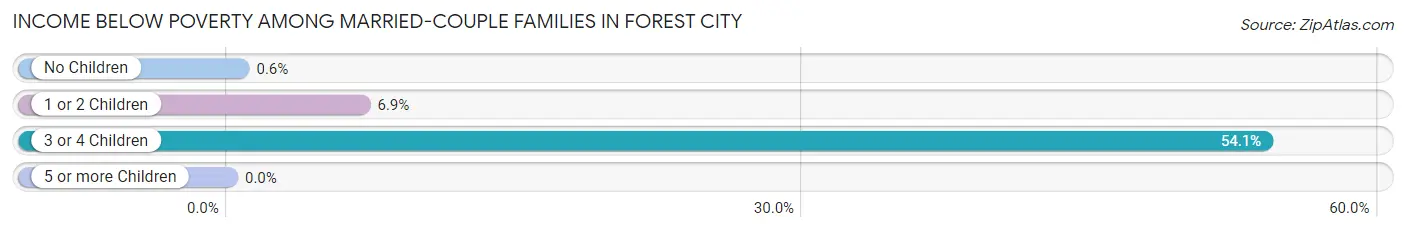
| Children | Above Poverty | Below Poverty |
| No Children | 1,653 (99.4%) | 10 (0.6%) |
| 1 or 2 Children | 995 (93.1%) | 74 (6.9%) |
| 3 or 4 Children | 68 (46.0%) | 80 (54.0%) |
| 5 or more Children | 0 (0.0%) | 0 (0.0%) |
| Total | 2,716 (94.3%) | 164 (5.7%) |
Income Below Poverty Among Single-Parent Households in Forest City
According to the poverty data in Forest City, 6.7% or 22 single-father households and 13.7% or 108 single-mother households are living below the poverty line. Among single-father households, those with 3 or 4 children have the highest poverty rate, with 22 households (100.0%) experiencing poverty. Likewise, among single-mother households, those with 3 or 4 children have the highest poverty rate, with 88 households (100.0%) falling below the poverty line.
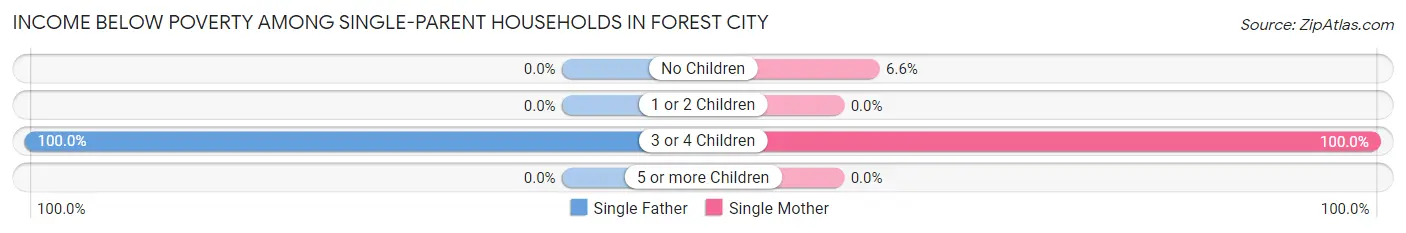
| Children | Single Father | Single Mother |
| No Children | 0 (0.0%) | 20 (6.6%) |
| 1 or 2 Children | 0 (0.0%) | 0 (0.0%) |
| 3 or 4 Children | 22 (100.0%) | 88 (100.0%) |
| 5 or more Children | 0 (0.0%) | 0 (0.0%) |
| Total | 22 (6.7%) | 108 (13.7%) |
Income Below Poverty Among Married-Couple vs Single-Parent Households in Forest City
The poverty data for Forest City shows that 164 of the married-couple family households (5.7%) and 130 of the single-parent households (11.7%) are living below the poverty level. Within the married-couple family households, those with 3 or 4 children have the highest poverty rate, with 80 households (54.0%) falling below the poverty line. Among the single-parent households, those with 3 or 4 children have the highest poverty rate, with 110 household (100.0%) living below poverty.
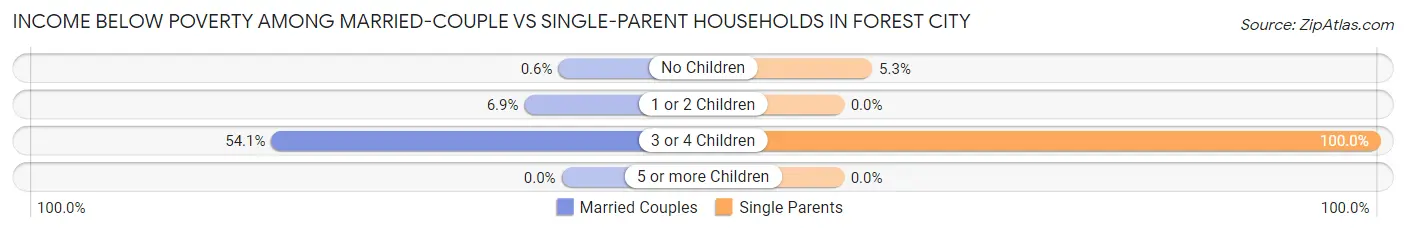
| Children | Married-Couple Families | Single-Parent Households |
| No Children | 10 (0.6%) | 20 (5.3%) |
| 1 or 2 Children | 74 (6.9%) | 0 (0.0%) |
| 3 or 4 Children | 80 (54.0%) | 110 (100.0%) |
| 5 or more Children | 0 (0.0%) | 0 (0.0%) |
| Total | 164 (5.7%) | 130 (11.7%) |
Race in Forest City
The most populous races in Forest City are White / Caucasian (9,627 | 64.8%), Hispanic or Latino (4,194 | 28.2%), and Two or more Races (2,563 | 17.3%).
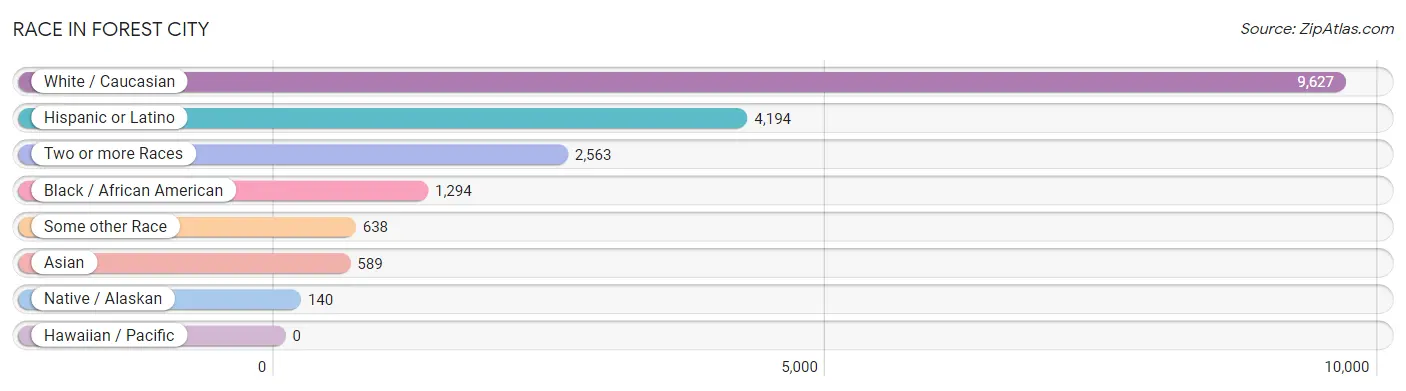
| Race | # Population | % Population |
| Asian | 589 | 4.0% |
| Black / African American | 1,294 | 8.7% |
| Hawaiian / Pacific | 0 | 0.0% |
| Hispanic or Latino | 4,194 | 28.2% |
| Native / Alaskan | 140 | 0.9% |
| White / Caucasian | 9,627 | 64.8% |
| Two or more Races | 2,563 | 17.3% |
| Some other Race | 638 | 4.3% |
| Total | 14,851 | 100.0% |
Ancestry in Forest City
The most populous ancestries reported in Forest City are American (1,793 | 12.1%), Puerto Rican (1,504 | 10.1%), German (1,491 | 10.0%), English (995 | 6.7%), and South American (885 | 6.0%), together accounting for 44.9% of all Forest City residents.
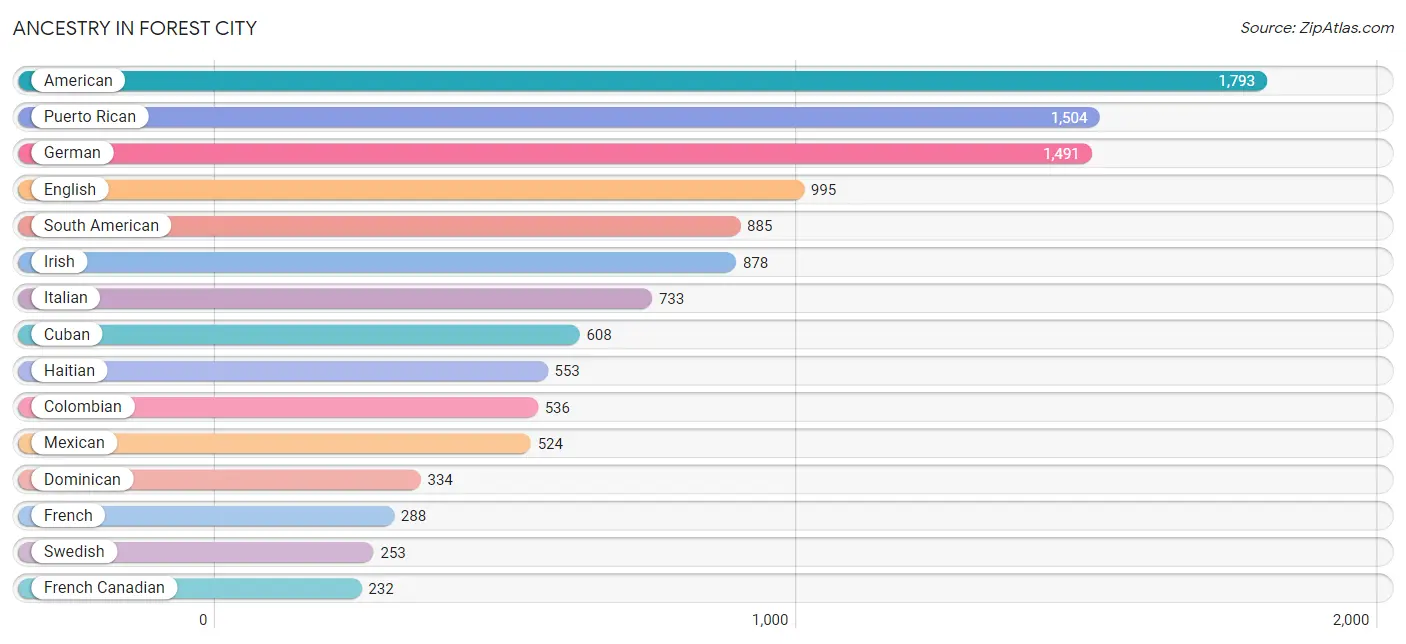
| Ancestry | # Population | % Population |
| American | 1,793 | 12.1% |
| Arab | 99 | 0.7% |
| Argentinean | 72 | 0.5% |
| Armenian | 22 | 0.2% |
| Assyrian / Chaldean / Syriac | 32 | 0.2% |
| Austrian | 5 | 0.0% |
| Bahamian | 30 | 0.2% |
| Barbadian | 13 | 0.1% |
| Brazilian | 32 | 0.2% |
| British | 172 | 1.2% |
| Burmese | 112 | 0.7% |
| Canadian | 43 | 0.3% |
| Central American | 192 | 1.3% |
| Central American Indian | 41 | 0.3% |
| Chilean | 80 | 0.5% |
| Colombian | 536 | 3.6% |
| Cuban | 608 | 4.1% |
| Czech | 53 | 0.4% |
| Czechoslovakian | 7 | 0.1% |
| Danish | 48 | 0.3% |
| Dominican | 334 | 2.2% |
| Dutch | 10 | 0.1% |
| Eastern European | 24 | 0.2% |
| Ecuadorian | 12 | 0.1% |
| Egyptian | 17 | 0.1% |
| English | 995 | 6.7% |
| European | 103 | 0.7% |
| Filipino | 13 | 0.1% |
| Finnish | 30 | 0.2% |
| French | 288 | 1.9% |
| French Canadian | 232 | 1.6% |
| German | 1,491 | 10.0% |
| German Russian | 22 | 0.2% |
| Greek | 36 | 0.2% |
| Haitian | 553 | 3.7% |
| Honduran | 75 | 0.5% |
| Hungarian | 32 | 0.2% |
| Indian (Asian) | 87 | 0.6% |
| Irish | 878 | 5.9% |
| Italian | 733 | 4.9% |
| Jamaican | 113 | 0.8% |
| Korean | 60 | 0.4% |
| Lebanese | 75 | 0.5% |
| Lithuanian | 19 | 0.1% |
| Mexican | 524 | 3.5% |
| Mexican American Indian | 130 | 0.9% |
| Native Hawaiian | 13 | 0.1% |
| Nicaraguan | 78 | 0.5% |
| Norwegian | 119 | 0.8% |
| Peruvian | 123 | 0.8% |
| Polish | 136 | 0.9% |
| Portuguese | 37 | 0.3% |
| Puerto Rican | 1,504 | 10.1% |
| Russian | 133 | 0.9% |
| Salvadoran | 39 | 0.3% |
| Scandinavian | 37 | 0.3% |
| Scotch-Irish | 91 | 0.6% |
| Scottish | 176 | 1.2% |
| Serbian | 7 | 0.1% |
| South American | 885 | 6.0% |
| Spaniard | 21 | 0.1% |
| Spanish | 4 | 0.0% |
| Sri Lankan | 13 | 0.1% |
| Subsaharan African | 11 | 0.1% |
| Swedish | 253 | 1.7% |
| Swiss | 160 | 1.1% |
| Syrian | 7 | 0.1% |
| Thai | 176 | 1.2% |
| Venezuelan | 62 | 0.4% |
| Welsh | 39 | 0.3% |
| West Indian | 64 | 0.4% | View All 71 Rows |
Immigrants in Forest City
The most numerous immigrant groups reported in Forest City came from Latin America (1,764 | 11.9%), Caribbean (944 | 6.4%), South America (621 | 4.2%), Asia (447 | 3.0%), and Cuba (341 | 2.3%), together accounting for 27.7% of all Forest City residents.
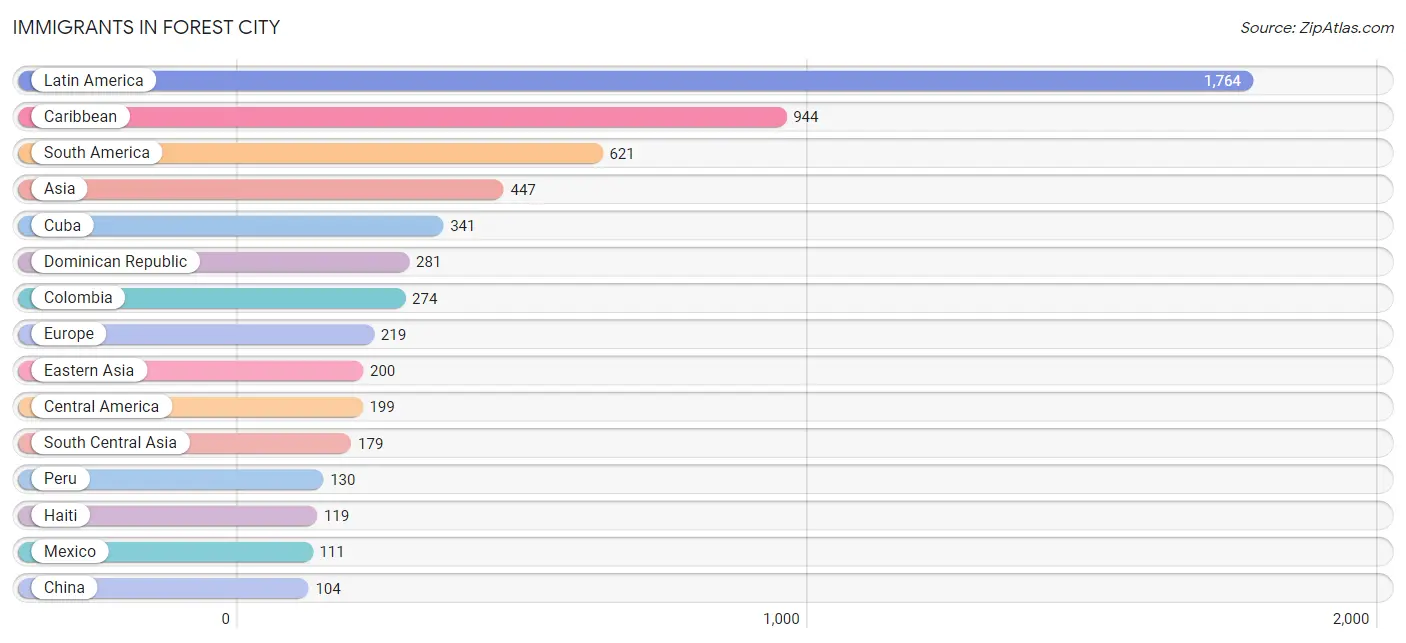
| Immigration Origin | # Population | % Population |
| Argentina | 48 | 0.3% |
| Asia | 447 | 3.0% |
| Bahamas | 25 | 0.2% |
| Barbados | 13 | 0.1% |
| Brazil | 32 | 0.2% |
| Canada | 63 | 0.4% |
| Caribbean | 944 | 6.4% |
| Central America | 199 | 1.3% |
| Chile | 75 | 0.5% |
| China | 104 | 0.7% |
| Colombia | 274 | 1.8% |
| Cuba | 341 | 2.3% |
| Dominica | 30 | 0.2% |
| Dominican Republic | 281 | 1.9% |
| Eastern Asia | 200 | 1.3% |
| Eastern Europe | 22 | 0.2% |
| El Salvador | 19 | 0.1% |
| England | 8 | 0.1% |
| Europe | 219 | 1.5% |
| France | 23 | 0.2% |
| Germany | 30 | 0.2% |
| Greece | 24 | 0.2% |
| Haiti | 119 | 0.8% |
| Honduras | 58 | 0.4% |
| India | 84 | 0.6% |
| Italy | 18 | 0.1% |
| Jamaica | 101 | 0.7% |
| Korea | 96 | 0.6% |
| Latin America | 1,764 | 11.9% |
| Lebanon | 16 | 0.1% |
| Mexico | 111 | 0.7% |
| Nicaragua | 11 | 0.1% |
| Northern Europe | 102 | 0.7% |
| Pakistan | 95 | 0.6% |
| Peru | 130 | 0.9% |
| Philippines | 39 | 0.3% |
| Russia | 22 | 0.2% |
| South America | 621 | 4.2% |
| South Central Asia | 179 | 1.2% |
| South Eastern Asia | 52 | 0.4% |
| Southern Europe | 42 | 0.3% |
| Taiwan | 13 | 0.1% |
| Venezuela | 62 | 0.4% |
| Vietnam | 13 | 0.1% |
| Western Asia | 16 | 0.1% |
| Western Europe | 53 | 0.4% | View All 46 Rows |
Sex and Age in Forest City
Sex and Age in Forest City
The most populous age groups in Forest City are 45 to 49 Years (683 | 9.6%) for men and 40 to 44 Years (650 | 8.4%) for women.
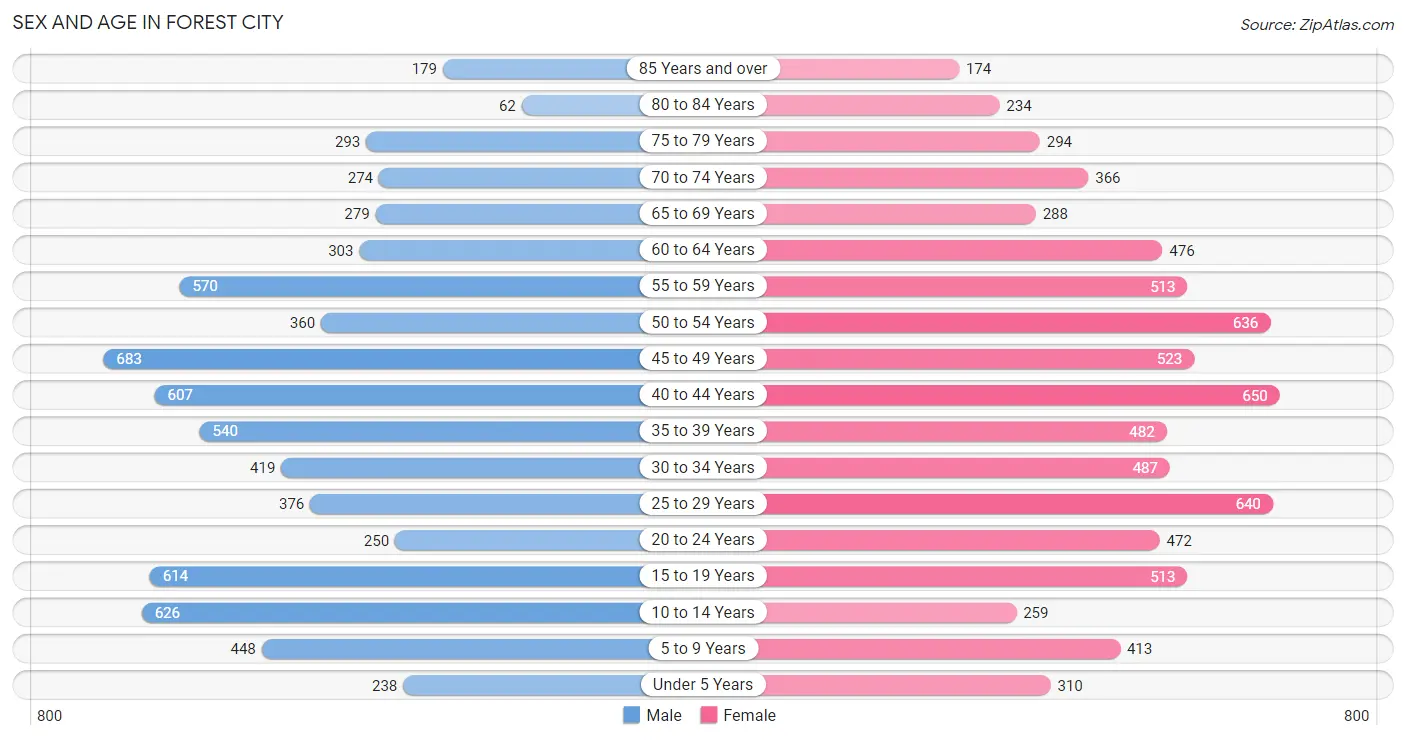
| Age Bracket | Male | Female |
| Under 5 Years | 238 (3.3%) | 310 (4.0%) |
| 5 to 9 Years | 448 (6.3%) | 413 (5.3%) |
| 10 to 14 Years | 626 (8.8%) | 259 (3.4%) |
| 15 to 19 Years | 614 (8.6%) | 513 (6.6%) |
| 20 to 24 Years | 250 (3.5%) | 472 (6.1%) |
| 25 to 29 Years | 376 (5.3%) | 640 (8.3%) |
| 30 to 34 Years | 419 (5.9%) | 487 (6.3%) |
| 35 to 39 Years | 540 (7.6%) | 482 (6.2%) |
| 40 to 44 Years | 607 (8.5%) | 650 (8.4%) |
| 45 to 49 Years | 683 (9.6%) | 523 (6.8%) |
| 50 to 54 Years | 360 (5.1%) | 636 (8.2%) |
| 55 to 59 Years | 570 (8.0%) | 513 (6.6%) |
| 60 to 64 Years | 303 (4.3%) | 476 (6.2%) |
| 65 to 69 Years | 279 (3.9%) | 288 (3.7%) |
| 70 to 74 Years | 274 (3.8%) | 366 (4.7%) |
| 75 to 79 Years | 293 (4.1%) | 294 (3.8%) |
| 80 to 84 Years | 62 (0.9%) | 234 (3.0%) |
| 85 Years and over | 179 (2.5%) | 174 (2.2%) |
| Total | 7,121 (100.0%) | 7,730 (100.0%) |
Families and Households in Forest City
Median Family Size in Forest City
The median family size in Forest City is 3.05 persons per family, with single female/mother families (786 | 19.7%) accounting for the largest median family size of 3.14 persons per family. On the other hand, single male/father families (327 | 8.2%) represent the smallest median family size with 2.46 persons per family.
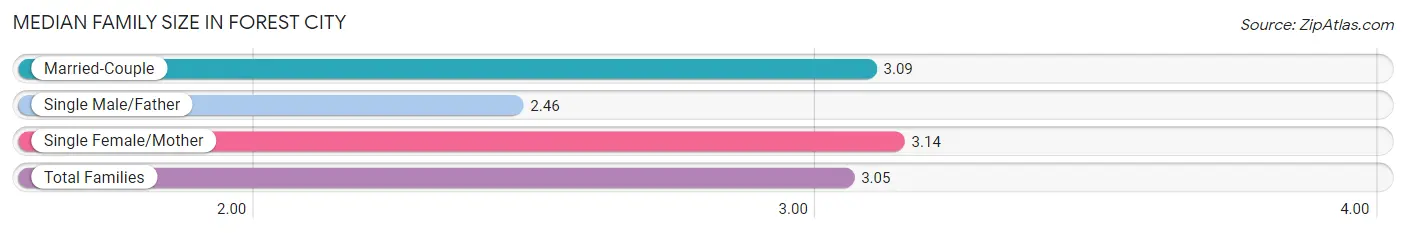
| Family Type | # Families | Family Size |
| Married-Couple | 2,880 (72.1%) | 3.09 |
| Single Male/Father | 327 (8.2%) | 2.46 |
| Single Female/Mother | 786 (19.7%) | 3.14 |
| Total Families | 3,993 (100.0%) | 3.05 |
Median Household Size in Forest City
The median household size in Forest City is 2.69 persons per household, with single female/mother households (786 | 14.5%) accounting for the largest median household size of 3.44 persons per household. non-family households (1,423 | 26.3%) represent the smallest median household size with 1.38 persons per household.
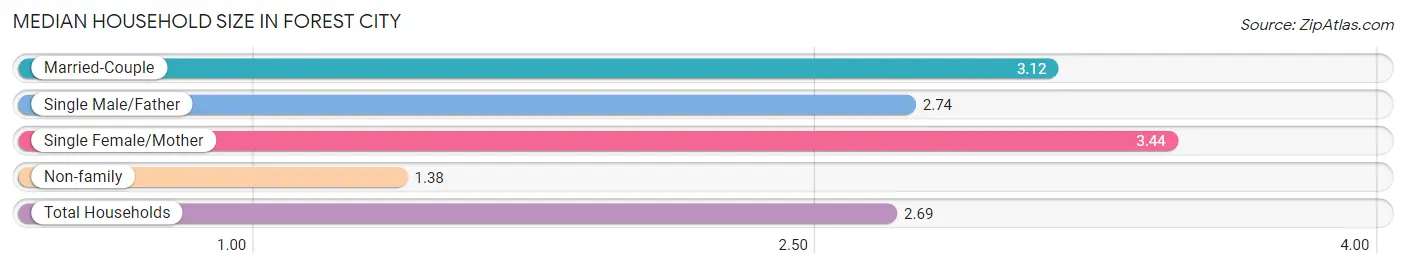
| Household Type | # Households | Household Size |
| Married-Couple | 2,880 (53.2%) | 3.12 |
| Single Male/Father | 327 (6.0%) | 2.74 |
| Single Female/Mother | 786 (14.5%) | 3.44 |
| Non-family | 1,423 (26.3%) | 1.38 |
| Total Households | 5,416 (100.0%) | 2.69 |
Household Size by Marriage Status in Forest City
Out of a total of 5,416 households in Forest City, 3,993 (73.7%) are family households, while 1,423 (26.3%) are nonfamily households. The most numerous type of family households are 2-person households, comprising 1,742, and the most common type of nonfamily households are 1-person households, comprising 1,020.
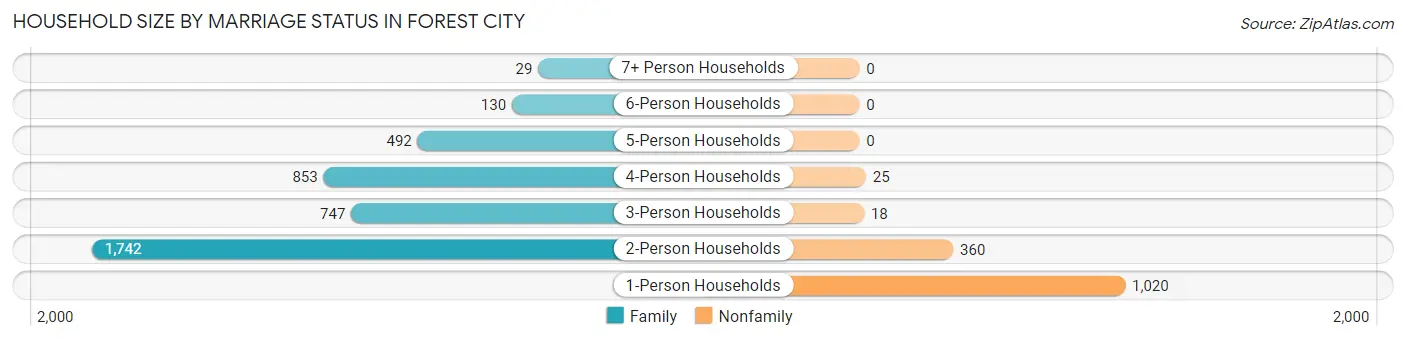
| Household Size | Family Households | Nonfamily Households |
| 1-Person Households | - | 1,020 (18.8%) |
| 2-Person Households | 1,742 (32.2%) | 360 (6.7%) |
| 3-Person Households | 747 (13.8%) | 18 (0.3%) |
| 4-Person Households | 853 (15.8%) | 25 (0.5%) |
| 5-Person Households | 492 (9.1%) | 0 (0.0%) |
| 6-Person Households | 130 (2.4%) | 0 (0.0%) |
| 7+ Person Households | 29 (0.5%) | 0 (0.0%) |
| Total | 3,993 (73.7%) | 1,423 (26.3%) |
Female Fertility in Forest City
Fertility by Age in Forest City
Average fertility rate in Forest City is 30.0 births per 1,000 women. Women in the age bracket of 20 to 34 years have the highest fertility rate with 49.0 births per 1,000 women. Women in the age bracket of 20 to 34 years acount for 65.5% of all women with births.
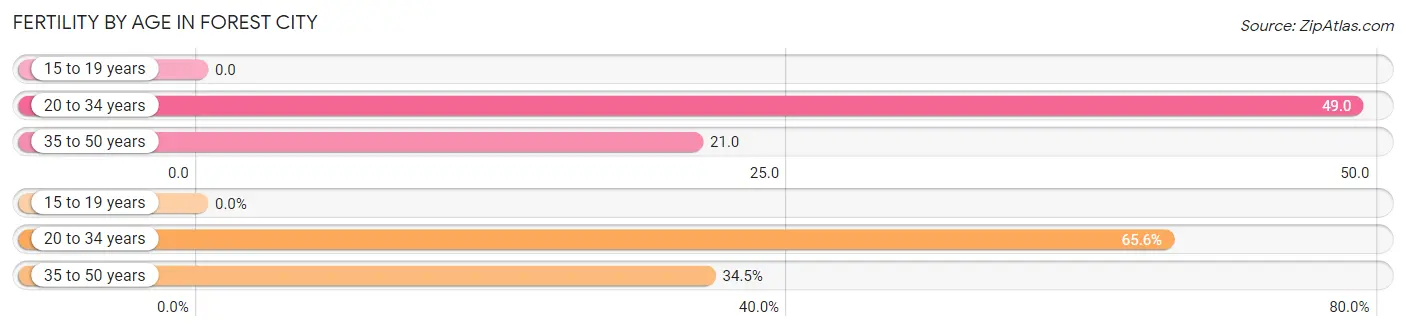
| Age Bracket | Women with Births | Births / 1,000 Women |
| 15 to 19 years | 0 (0.0%) | 0.0 |
| 20 to 34 years | 78 (65.5%) | 49.0 |
| 35 to 50 years | 41 (34.4%) | 21.0 |
| Total | 119 (100.0%) | 30.0 |
Fertility by Age by Marriage Status in Forest City
76.5% of women with births (119) in Forest City are married. The highest percentage of unmarried women with births falls into 35 to 50 years age bracket with 41.5% of them unmarried at the time of birth, while the lowest percentage of unmarried women with births belong to 20 to 34 years age bracket with 14.1% of them unmarried.
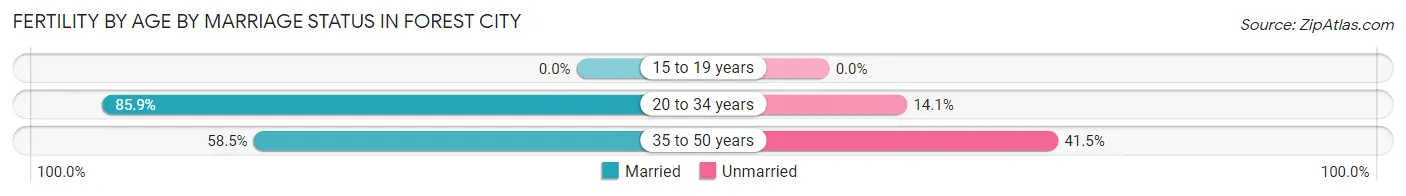
| Age Bracket | Married | Unmarried |
| 15 to 19 years | 0 (0.0%) | 0 (0.0%) |
| 20 to 34 years | 67 (85.9%) | 11 (14.1%) |
| 35 to 50 years | 24 (58.5%) | 17 (41.5%) |
| Total | 91 (76.5%) | 28 (23.5%) |
Fertility by Education in Forest City
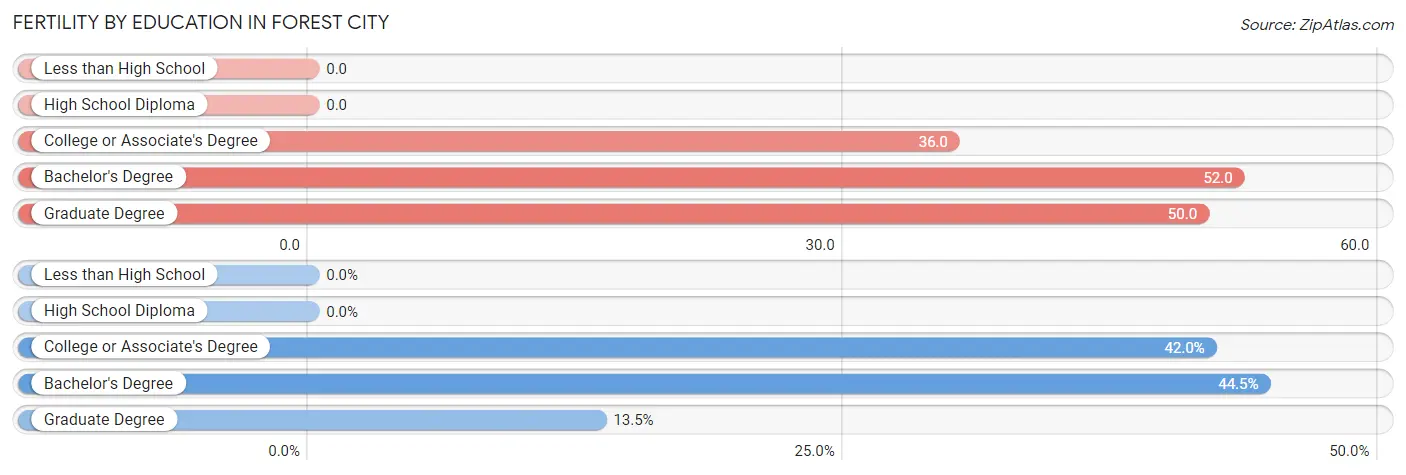
| Educational Attainment | Women with Births | Births / 1,000 Women |
| Less than High School | 0 (0.0%) | 0.0 |
| High School Diploma | 0 (0.0%) | 0.0 |
| College or Associate's Degree | 50 (42.0%) | 36.0 |
| Bachelor's Degree | 53 (44.5%) | 52.0 |
| Graduate Degree | 16 (13.5%) | 50.0 |
| Total | 119 (100.0%) | 30.0 |
Fertility by Education by Marriage Status in Forest City
23.5% of women with births in Forest City are unmarried. Women with the educational attainment of college or associate's degree are most likely to be married with 100.0% of them married at childbirth, while women with the educational attainment of bachelor's degree are least likely to be married with 52.8% of them unmarried at childbirth.
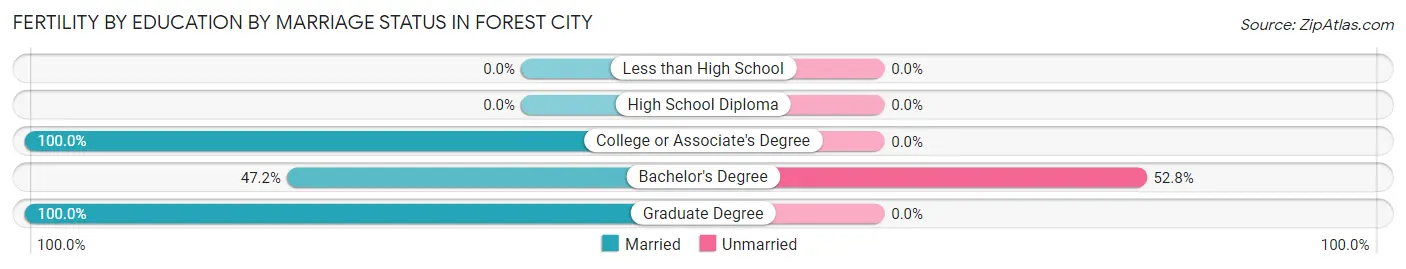
| Educational Attainment | Married | Unmarried |
| Less than High School | 0 (0.0%) | 0 (0.0%) |
| High School Diploma | 0 (0.0%) | 0 (0.0%) |
| College or Associate's Degree | 50 (100.0%) | 0 (0.0%) |
| Bachelor's Degree | 25 (47.2%) | 28 (52.8%) |
| Graduate Degree | 16 (100.0%) | 0 (0.0%) |
| Total | 91 (76.5%) | 28 (23.5%) |
Employment Characteristics in Forest City
Employment by Class of Employer in Forest City
Among the 7,639 employed individuals in Forest City, private company employees (5,565 | 72.9%), self-employed (incorporated) (712 | 9.3%), and not-for-profit organizations (581 | 7.6%) make up the most common classes of employment.
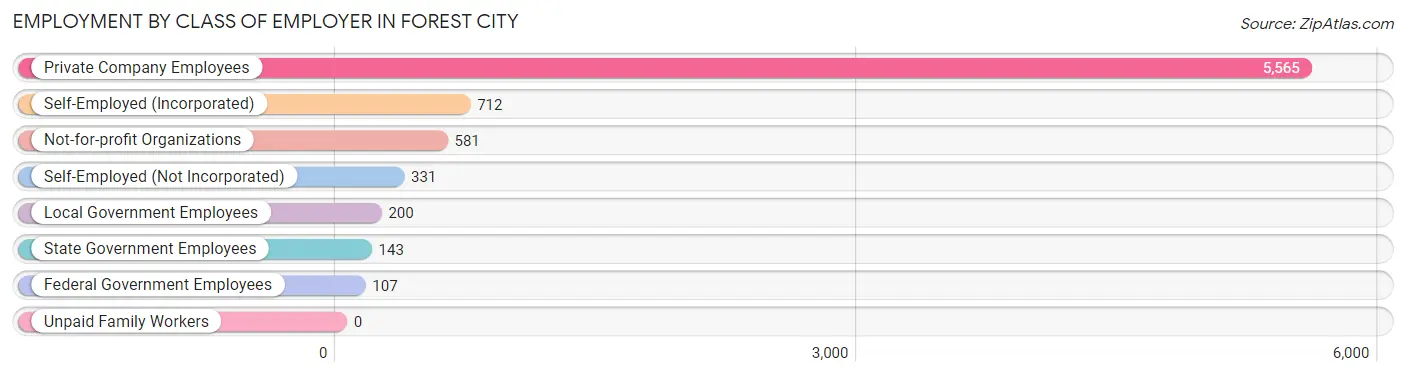
| Employer Class | # Employees | % Employees |
| Private Company Employees | 5,565 | 72.9% |
| Self-Employed (Incorporated) | 712 | 9.3% |
| Self-Employed (Not Incorporated) | 331 | 4.3% |
| Not-for-profit Organizations | 581 | 7.6% |
| Local Government Employees | 200 | 2.6% |
| State Government Employees | 143 | 1.9% |
| Federal Government Employees | 107 | 1.4% |
| Unpaid Family Workers | 0 | 0.0% |
| Total | 7,639 | 100.0% |
Employment Status by Age in Forest City
According to the labor force statistics for Forest City, out of the total population over 16 years of age (12,325), 65.2% or 8,036 individuals are in the labor force, with 3.0% or 241 of them unemployed. The age group with the highest labor force participation rate is 25 to 29 years, with 95.6% or 971 individuals in the labor force. Within the labor force, the 65 to 74 years age range has the highest percentage of unemployed individuals, with 6.3% or 24 of them being unemployed.
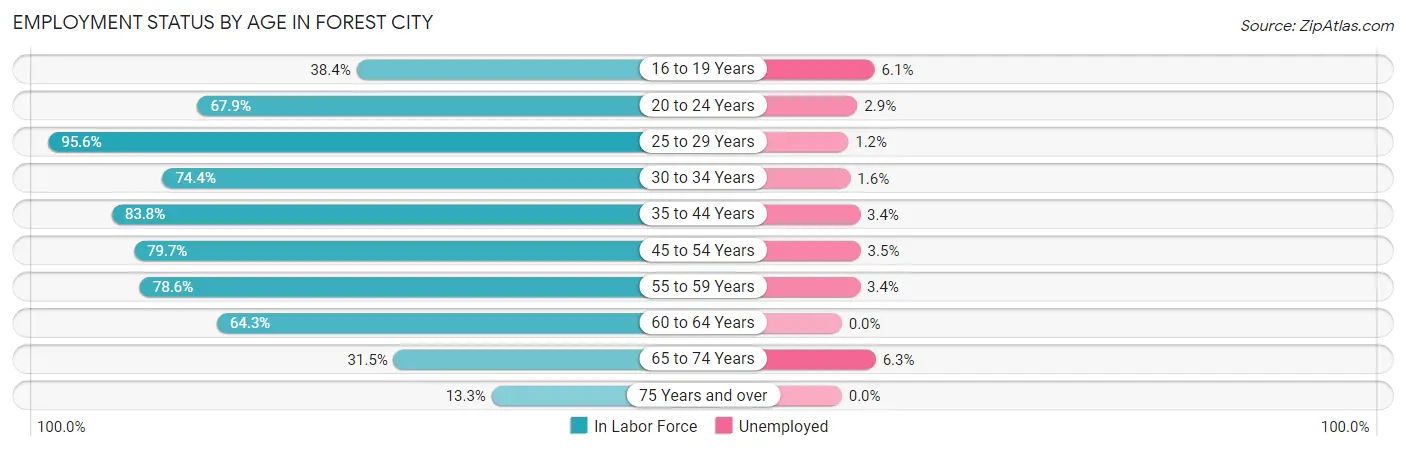
| Age Bracket | In Labor Force | Unemployed |
| 16 to 19 Years | 344 (38.4%) | 21 (6.1%) |
| 20 to 24 Years | 490 (67.9%) | 14 (2.9%) |
| 25 to 29 Years | 971 (95.6%) | 12 (1.2%) |
| 30 to 34 Years | 674 (74.4%) | 11 (1.6%) |
| 35 to 44 Years | 1,910 (83.8%) | 65 (3.4%) |
| 45 to 54 Years | 1,755 (79.7%) | 61 (3.5%) |
| 55 to 59 Years | 851 (78.6%) | 29 (3.4%) |
| 60 to 64 Years | 501 (64.3%) | 0 (0.0%) |
| 65 to 74 Years | 380 (31.5%) | 24 (6.3%) |
| 75 Years and over | 164 (13.3%) | 0 (0.0%) |
| Total | 8,036 (65.2%) | 241 (3.0%) |
Employment Status by Educational Attainment in Forest City
According to labor force statistics for Forest City, 80.6% of individuals (6,662) out of the total population between 25 and 64 years of age (8,265) are in the labor force, with 2.7% or 180 of them being unemployed. The group with the highest labor force participation rate are those with the educational attainment of college / associate degree, with 88.0% or 1,916 individuals in the labor force. Within the labor force, individuals with less than high school education have the highest percentage of unemployment, with 7.0% or 24 of them being unemployed.
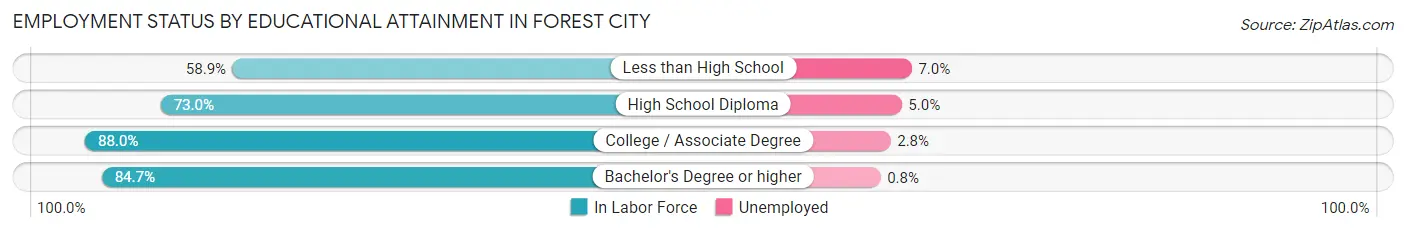
| Educational Attainment | In Labor Force | Unemployed |
| Less than High School | 342 (58.9%) | 41 (7.0%) |
| High School Diploma | 1,613 (73.0%) | 110 (5.0%) |
| College / Associate Degree | 1,916 (88.0%) | 61 (2.8%) |
| Bachelor's Degree or higher | 2,793 (84.7%) | 26 (0.8%) |
| Total | 6,662 (80.6%) | 223 (2.7%) |
Employment Occupations by Sex in Forest City
Management, Business, Science and Arts Occupations
The most common Management, Business, Science and Arts occupations in Forest City are Management (970 | 12.5%), Community & Social Service (835 | 10.8%), Business & Financial (748 | 9.7%), Health Diagnosing & Treating (484 | 6.3%), and Computers, Engineering & Science (467 | 6.0%).
Management, Business, Science and Arts Occupations by Sex
Within the Management, Business, Science and Arts occupations in Forest City, the most male-oriented occupations are Architecture & Engineering (100.0%), Arts, Media & Entertainment (77.9%), and Computers, Engineering & Science (74.5%), while the most female-oriented occupations are Health Diagnosing & Treating (83.3%), Legal Services & Support (83.2%), and Health Technologists (79.9%).
| Occupation | Male | Female |
| Management | 585 (60.3%) | 385 (39.7%) |
| Business & Financial | 347 (46.4%) | 401 (53.6%) |
| Computers, Engineering & Science | 348 (74.5%) | 119 (25.5%) |
| Computers & Mathematics | 149 (65.3%) | 79 (34.6%) |
| Architecture & Engineering | 178 (100.0%) | 0 (0.0%) |
| Life, Physical & Social Science | 21 (34.4%) | 40 (65.6%) |
| Community & Social Service | 301 (36.0%) | 534 (63.9%) |
| Education, Arts & Media | 91 (44.4%) | 114 (55.6%) |
| Legal Services & Support | 21 (16.8%) | 104 (83.2%) |
| Education Instruction & Library | 94 (24.5%) | 289 (75.5%) |
| Arts, Media & Entertainment | 95 (77.9%) | 27 (22.1%) |
| Health Diagnosing & Treating | 81 (16.7%) | 403 (83.3%) |
| Health Technologists | 81 (20.1%) | 322 (79.9%) |
| Total (Category) | 1,662 (47.4%) | 1,842 (52.6%) |
| Total (Overall) | 3,756 (48.6%) | 3,978 (51.4%) |
Services Occupations
The most common Services occupations in Forest City are Personal Care & Service (226 | 2.9%), Food Preparation & Serving (215 | 2.8%), Healthcare Support (198 | 2.6%), Cleaning & Maintenance (169 | 2.2%), and Security & Protection (57 | 0.7%).
Services Occupations by Sex
Within the Services occupations in Forest City, the most male-oriented occupations are Cleaning & Maintenance (80.5%), Food Preparation & Serving (47.0%), and Law Enforcement (38.5%), while the most female-oriented occupations are Healthcare Support (100.0%), Personal Care & Service (88.5%), and Firefighting & Prevention (77.3%).
| Occupation | Male | Female |
| Healthcare Support | 0 (0.0%) | 198 (100.0%) |
| Security & Protection | 15 (26.3%) | 42 (73.7%) |
| Firefighting & Prevention | 10 (22.7%) | 34 (77.3%) |
| Law Enforcement | 5 (38.5%) | 8 (61.5%) |
| Food Preparation & Serving | 101 (47.0%) | 114 (53.0%) |
| Cleaning & Maintenance | 136 (80.5%) | 33 (19.5%) |
| Personal Care & Service | 26 (11.5%) | 200 (88.5%) |
| Total (Category) | 278 (32.1%) | 587 (67.9%) |
| Total (Overall) | 3,756 (48.6%) | 3,978 (51.4%) |
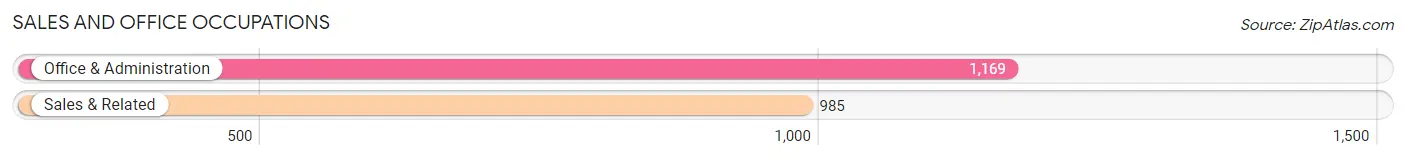
Sales and Office Occupations
The most common Sales and Office occupations in Forest City are Office & Administration (1,169 | 15.1%), and Sales & Related (985 | 12.7%).
Sales and Office Occupations by Sex
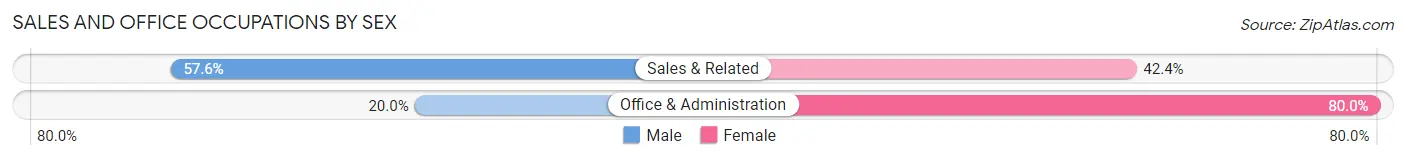
| Occupation | Male | Female |
| Sales & Related | 567 (57.6%) | 418 (42.4%) |
| Office & Administration | 234 (20.0%) | 935 (80.0%) |
| Total (Category) | 801 (37.2%) | 1,353 (62.8%) |
| Total (Overall) | 3,756 (48.6%) | 3,978 (51.4%) |
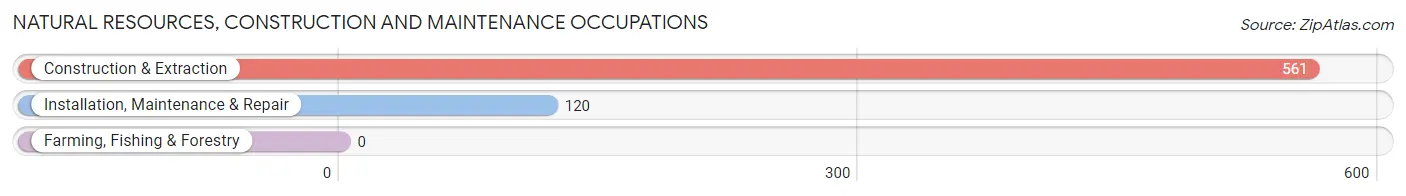
Natural Resources, Construction and Maintenance Occupations
The most common Natural Resources, Construction and Maintenance occupations in Forest City are Construction & Extraction (561 | 7.2%), and Installation, Maintenance & Repair (120 | 1.5%).
Natural Resources, Construction and Maintenance Occupations by Sex
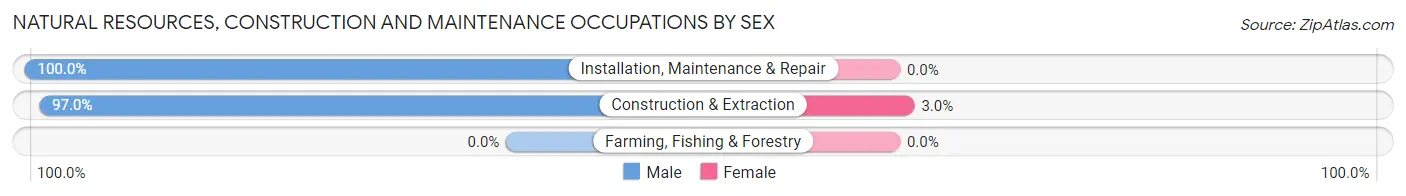
| Occupation | Male | Female |
| Farming, Fishing & Forestry | 0 (0.0%) | 0 (0.0%) |
| Construction & Extraction | 544 (97.0%) | 17 (3.0%) |
| Installation, Maintenance & Repair | 120 (100.0%) | 0 (0.0%) |
| Total (Category) | 664 (97.5%) | 17 (2.5%) |
| Total (Overall) | 3,756 (48.6%) | 3,978 (51.4%) |
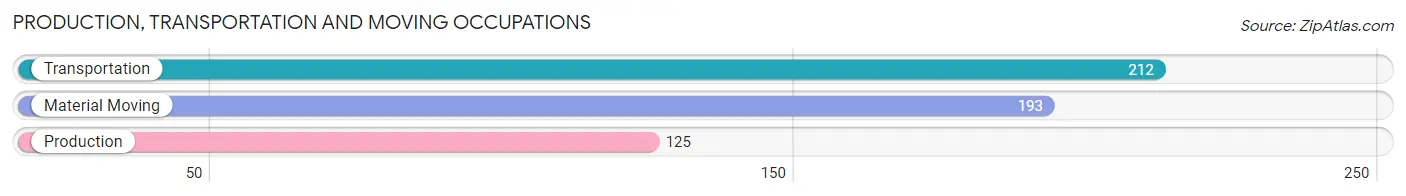
Production, Transportation and Moving Occupations
The most common Production, Transportation and Moving occupations in Forest City are Transportation (212 | 2.7%), Material Moving (193 | 2.5%), and Production (125 | 1.6%).
Production, Transportation and Moving Occupations by Sex
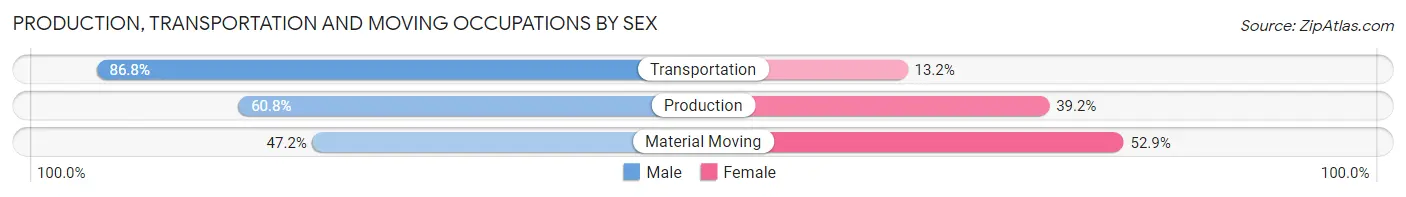
| Occupation | Male | Female |
| Production | 76 (60.8%) | 49 (39.2%) |
| Transportation | 184 (86.8%) | 28 (13.2%) |
| Material Moving | 91 (47.1%) | 102 (52.8%) |
| Total (Category) | 351 (66.2%) | 179 (33.8%) |
| Total (Overall) | 3,756 (48.6%) | 3,978 (51.4%) |
Employment Industries by Sex in Forest City
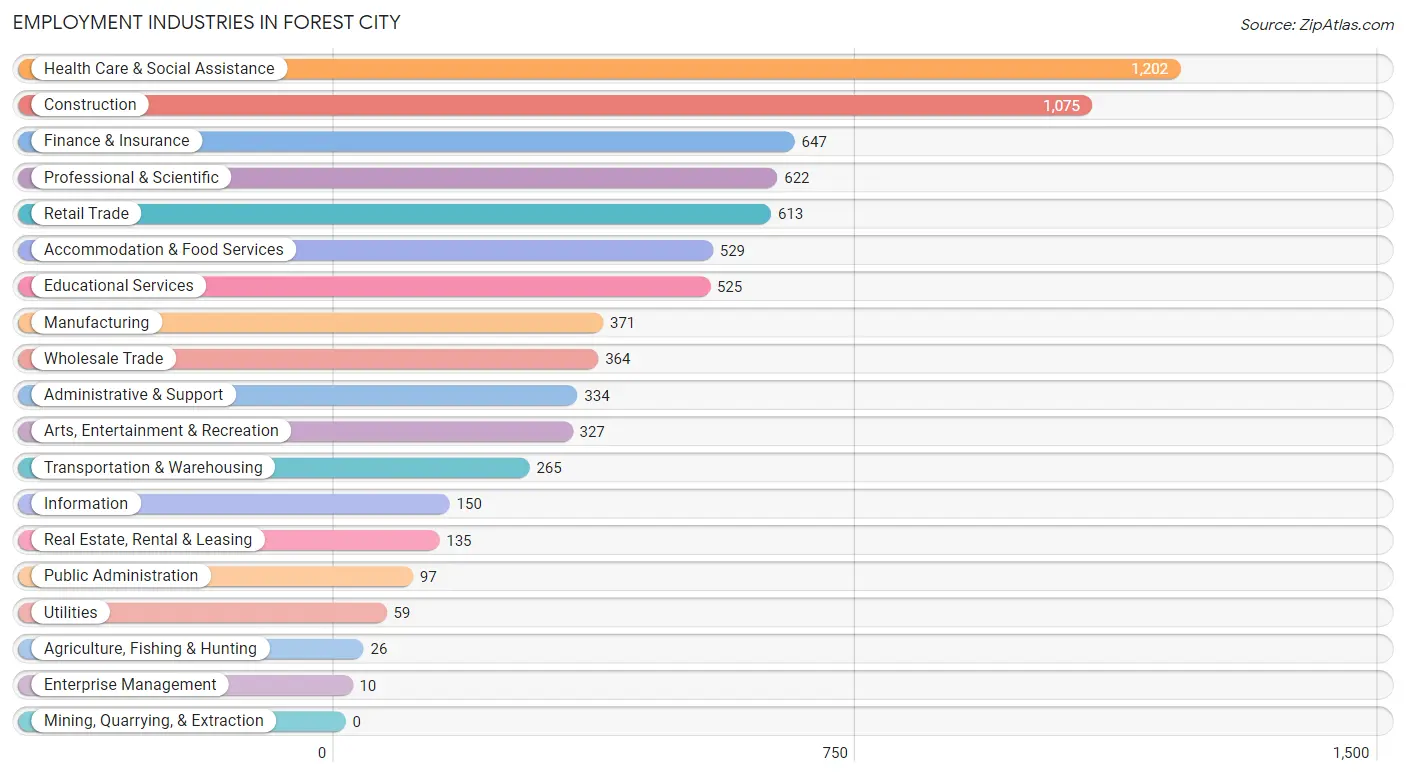
Employment Industries in Forest City
The major employment industries in Forest City include Health Care & Social Assistance (1,202 | 15.5%), Construction (1,075 | 13.9%), Finance & Insurance (647 | 8.4%), Professional & Scientific (622 | 8.0%), and Retail Trade (613 | 7.9%).
Employment Industries by Sex in Forest City
The Forest City industries that see more men than women are Utilities (100.0%), Enterprise Management (100.0%), and Manufacturing (83.8%), whereas the industries that tend to have a higher number of women are Health Care & Social Assistance (84.8%), Educational Services (77.7%), and Administrative & Support (61.1%).
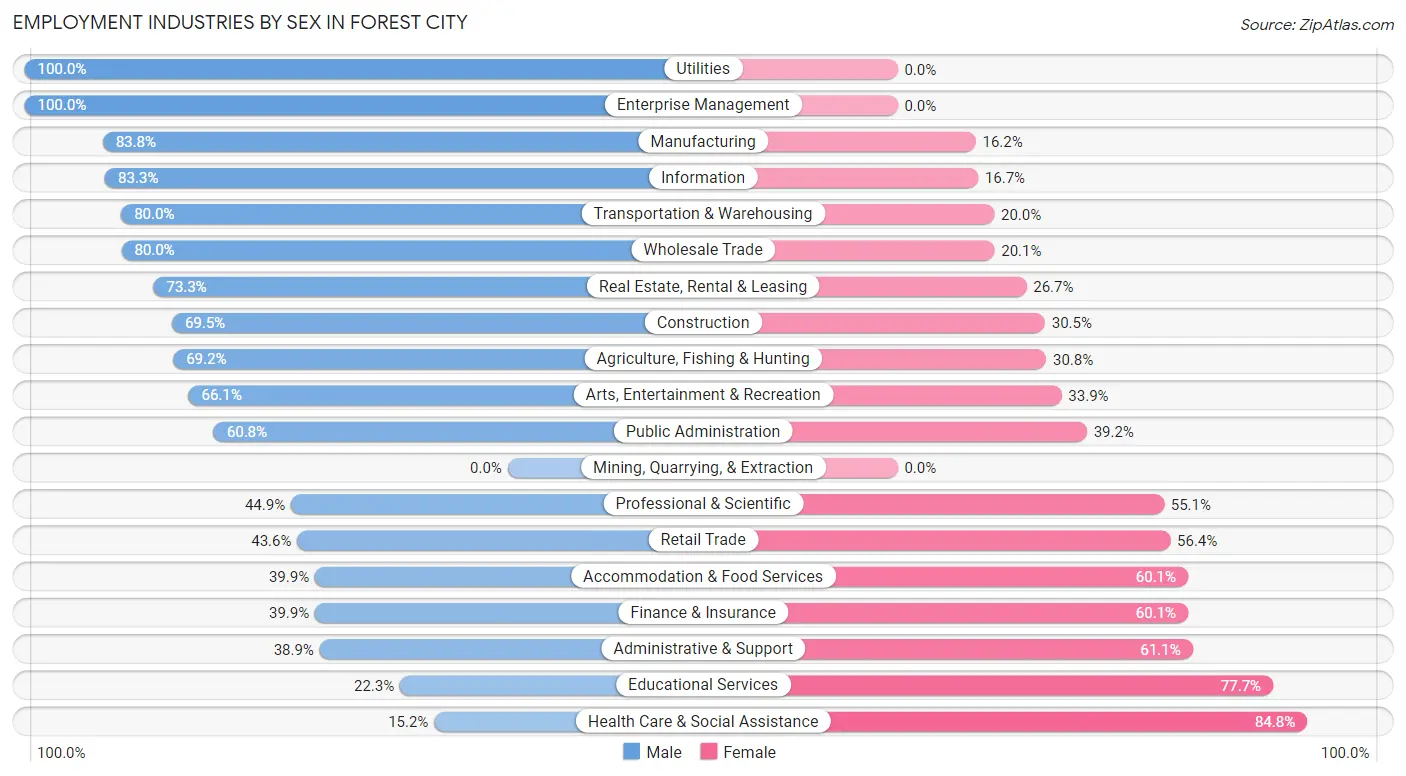
| Industry | Male | Female |
| Agriculture, Fishing & Hunting | 18 (69.2%) | 8 (30.8%) |
| Mining, Quarrying, & Extraction | 0 (0.0%) | 0 (0.0%) |
| Construction | 747 (69.5%) | 328 (30.5%) |
| Manufacturing | 311 (83.8%) | 60 (16.2%) |
| Wholesale Trade | 291 (79.9%) | 73 (20.1%) |
| Retail Trade | 267 (43.6%) | 346 (56.4%) |
| Transportation & Warehousing | 212 (80.0%) | 53 (20.0%) |
| Utilities | 59 (100.0%) | 0 (0.0%) |
| Information | 125 (83.3%) | 25 (16.7%) |
| Finance & Insurance | 258 (39.9%) | 389 (60.1%) |
| Real Estate, Rental & Leasing | 99 (73.3%) | 36 (26.7%) |
| Professional & Scientific | 279 (44.9%) | 343 (55.1%) |
| Enterprise Management | 10 (100.0%) | 0 (0.0%) |
| Administrative & Support | 130 (38.9%) | 204 (61.1%) |
| Educational Services | 117 (22.3%) | 408 (77.7%) |
| Health Care & Social Assistance | 183 (15.2%) | 1,019 (84.8%) |
| Arts, Entertainment & Recreation | 216 (66.1%) | 111 (33.9%) |
| Accommodation & Food Services | 211 (39.9%) | 318 (60.1%) |
| Public Administration | 59 (60.8%) | 38 (39.2%) |
| Total | 3,756 (48.6%) | 3,978 (51.4%) |
Education in Forest City
School Enrollment in Forest City
The most common levels of schooling among the 3,501 students in Forest City are high school (932 | 26.6%), elementary school (795 | 22.7%), and middle school (746 | 21.3%).
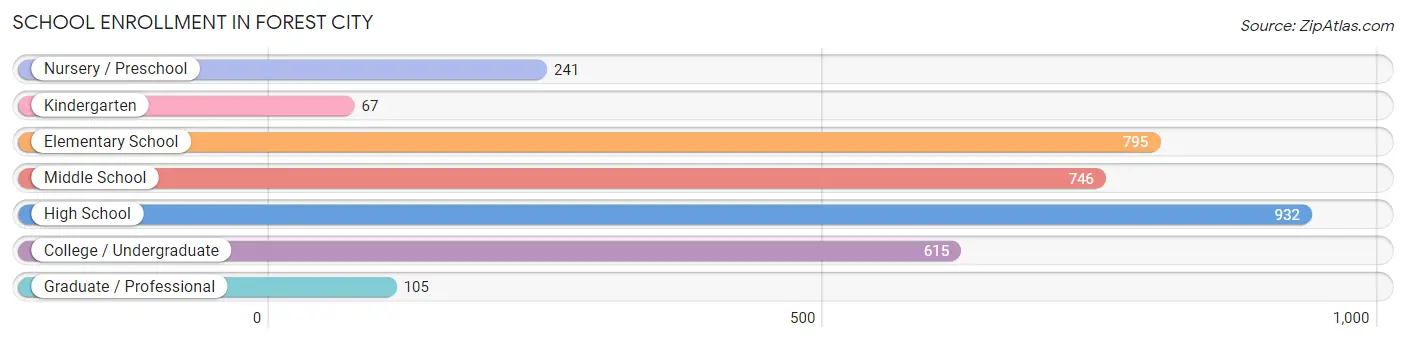
| School Level | # Students | % Students |
| Nursery / Preschool | 241 | 6.9% |
| Kindergarten | 67 | 1.9% |
| Elementary School | 795 | 22.7% |
| Middle School | 746 | 21.3% |
| High School | 932 | 26.6% |
| College / Undergraduate | 615 | 17.6% |
| Graduate / Professional | 105 | 3.0% |
| Total | 3,501 | 100.0% |
School Enrollment by Age by Funding Source in Forest City
Out of a total of 3,501 students who are enrolled in schools in Forest City, 872 (24.9%) attend a private institution, while the remaining 2,629 (75.1%) are enrolled in public schools. The age group of 25 to 34 year olds has the highest likelihood of being enrolled in private schools, with 55 (64.7% in the age bracket) enrolled. Conversely, the age group of 18 to 19 year olds has the lowest likelihood of being enrolled in a private school, with 252 (96.6% in the age bracket) attending a public institution.
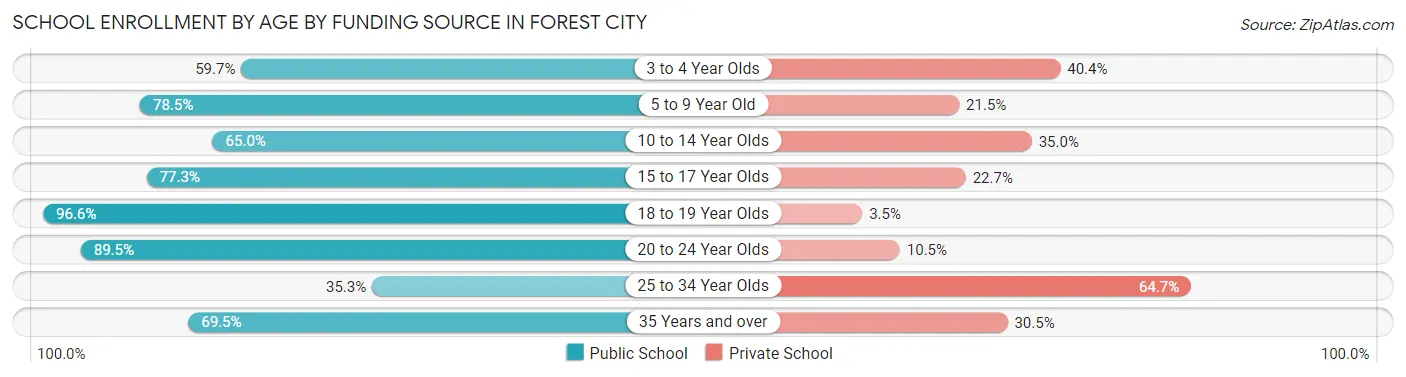
| Age Bracket | Public School | Private School |
| 3 to 4 Year Olds | 102 (59.7%) | 69 (40.4%) |
| 5 to 9 Year Old | 613 (78.5%) | 168 (21.5%) |
| 10 to 14 Year Olds | 575 (65.0%) | 310 (35.0%) |
| 15 to 17 Year Olds | 632 (77.3%) | 186 (22.7%) |
| 18 to 19 Year Olds | 252 (96.6%) | 9 (3.5%) |
| 20 to 24 Year Olds | 342 (89.5%) | 40 (10.5%) |
| 25 to 34 Year Olds | 30 (35.3%) | 55 (64.7%) |
| 35 Years and over | 82 (69.5%) | 36 (30.5%) |
| Total | 2,629 (75.1%) | 872 (24.9%) |
Educational Attainment by Field of Study in Forest City
Business (1,362 | 31.5%), science & technology (605 | 14.0%), education (373 | 8.6%), social sciences (363 | 8.4%), and engineering (280 | 6.5%) are the most common fields of study among 4,327 individuals in Forest City who have obtained a bachelor's degree or higher.
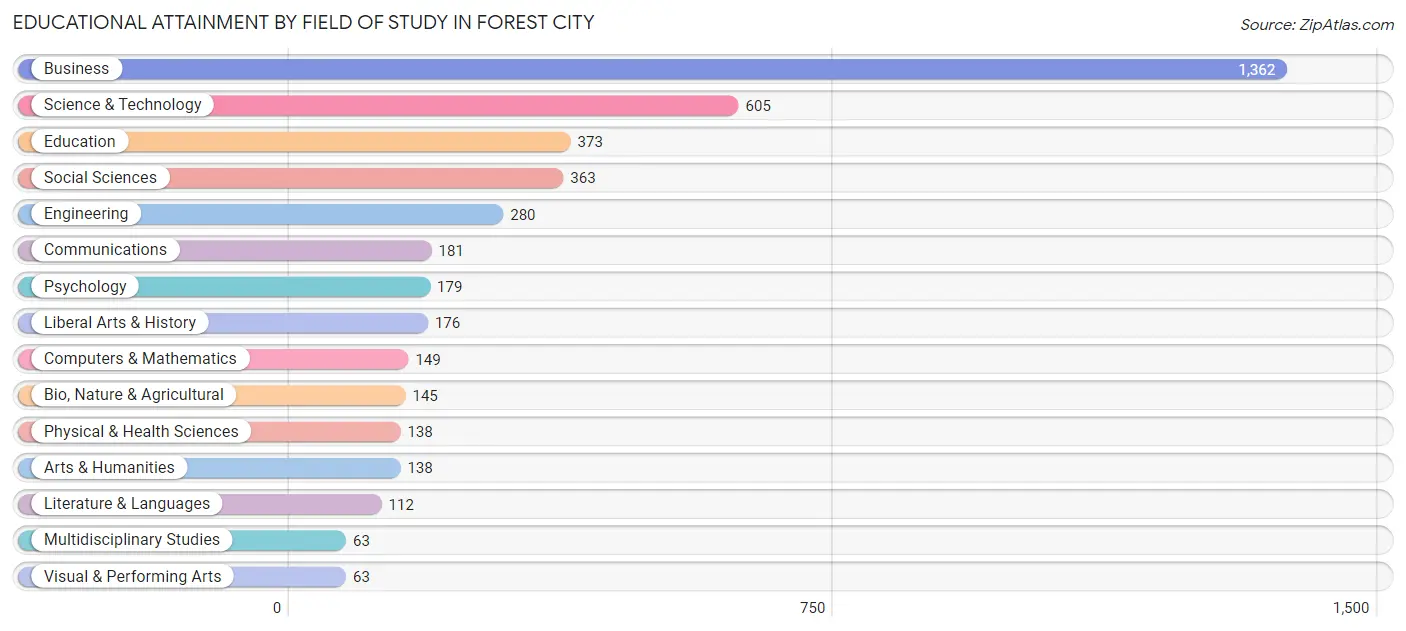
| Field of Study | # Graduates | % Graduates |
| Computers & Mathematics | 149 | 3.4% |
| Bio, Nature & Agricultural | 145 | 3.4% |
| Physical & Health Sciences | 138 | 3.2% |
| Psychology | 179 | 4.1% |
| Social Sciences | 363 | 8.4% |
| Engineering | 280 | 6.5% |
| Multidisciplinary Studies | 63 | 1.5% |
| Science & Technology | 605 | 14.0% |
| Business | 1,362 | 31.5% |
| Education | 373 | 8.6% |
| Literature & Languages | 112 | 2.6% |
| Liberal Arts & History | 176 | 4.1% |
| Visual & Performing Arts | 63 | 1.5% |
| Communications | 181 | 4.2% |
| Arts & Humanities | 138 | 3.2% |
| Total | 4,327 | 100.0% |
Transportation & Commute in Forest City
Vehicle Availability by Sex in Forest City
The most prevalent vehicle ownership categories in Forest City are males with 2 vehicles (1,773, accounting for 47.2%) and females with 2 vehicles (1,476, making up 45.8%).
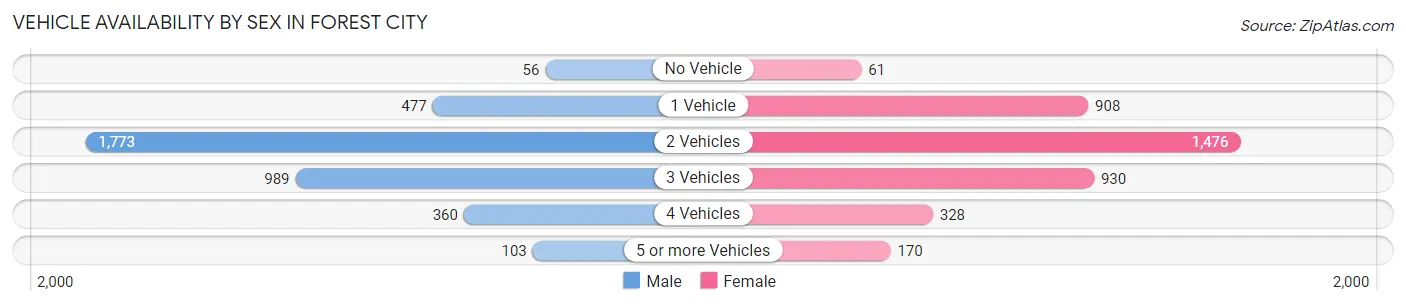
| Vehicles Available | Male | Female |
| No Vehicle | 56 (1.5%) | 61 (1.6%) |
| 1 Vehicle | 477 (12.7%) | 908 (23.4%) |
| 2 Vehicles | 1,773 (47.2%) | 1,476 (38.1%) |
| 3 Vehicles | 989 (26.3%) | 930 (24.0%) |
| 4 Vehicles | 360 (9.6%) | 328 (8.5%) |
| 5 or more Vehicles | 103 (2.7%) | 170 (4.4%) |
| Total | 3,758 (100.0%) | 3,873 (100.0%) |
Commute Time in Forest City
The most frequently occuring commute durations in Forest City are 20 to 24 minutes (1,441 commuters, 21.2%), 30 to 34 minutes (1,182 commuters, 17.4%), and 10 to 14 minutes (846 commuters, 12.5%).
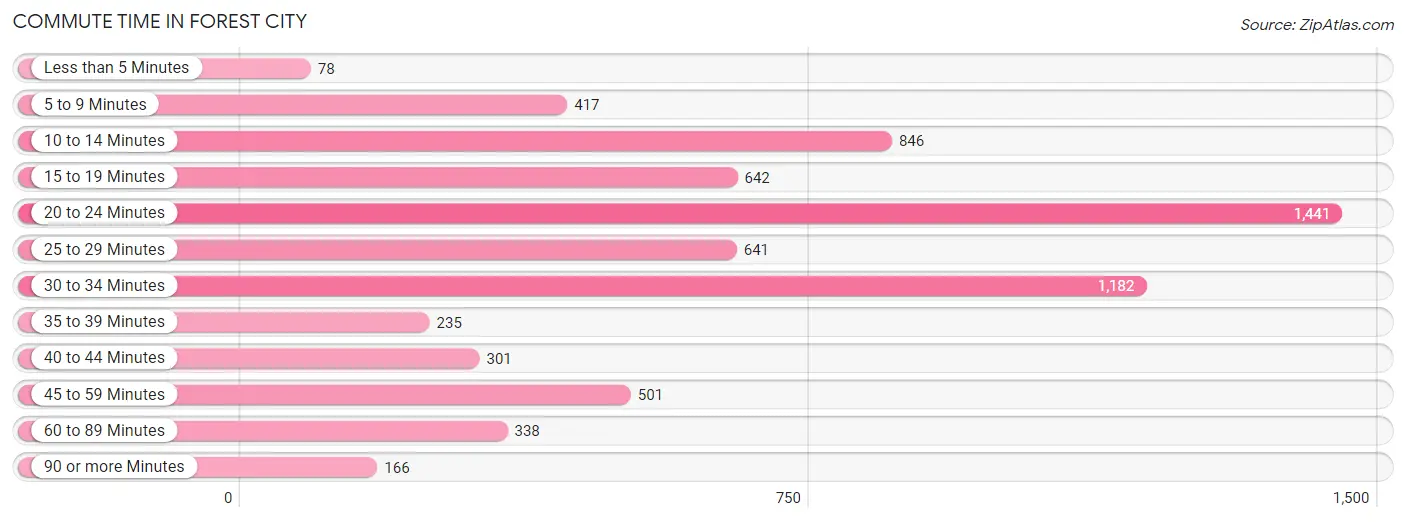
| Commute Time | # Commuters | % Commuters |
| Less than 5 Minutes | 78 | 1.1% |
| 5 to 9 Minutes | 417 | 6.1% |
| 10 to 14 Minutes | 846 | 12.5% |
| 15 to 19 Minutes | 642 | 9.5% |
| 20 to 24 Minutes | 1,441 | 21.2% |
| 25 to 29 Minutes | 641 | 9.4% |
| 30 to 34 Minutes | 1,182 | 17.4% |
| 35 to 39 Minutes | 235 | 3.5% |
| 40 to 44 Minutes | 301 | 4.4% |
| 45 to 59 Minutes | 501 | 7.4% |
| 60 to 89 Minutes | 338 | 5.0% |
| 90 or more Minutes | 166 | 2.5% |
Commute Time by Sex in Forest City
The most common commute times in Forest City are 20 to 24 minutes (825 commuters, 24.7%) for males and 30 to 34 minutes (692 commuters, 20.1%) for females.
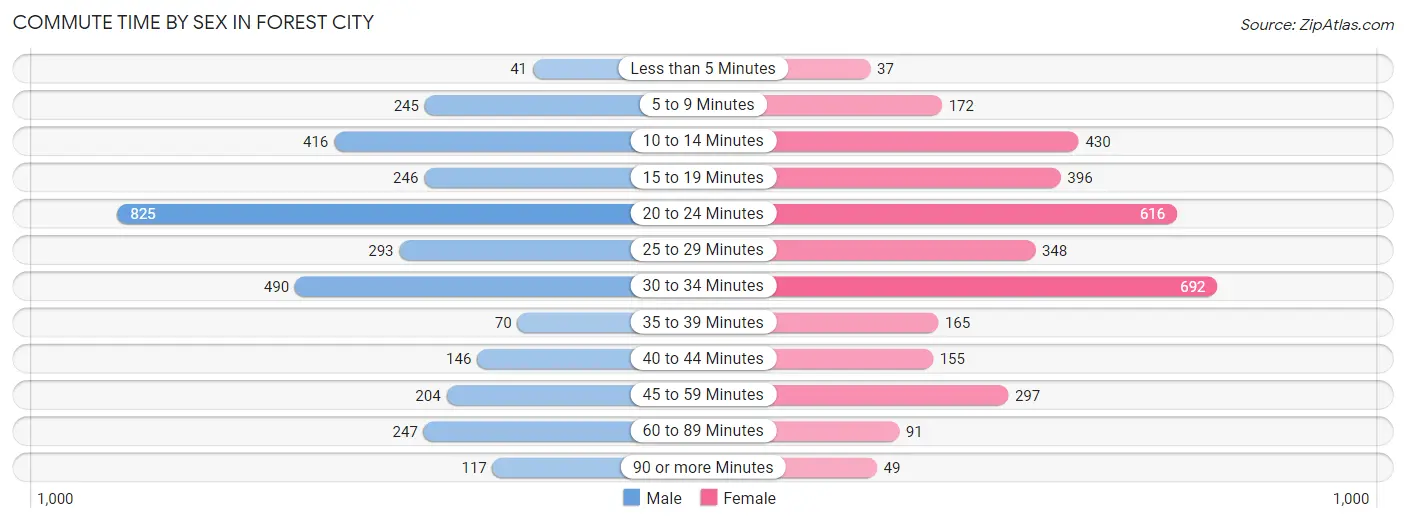
| Commute Time | Male | Female |
| Less than 5 Minutes | 41 (1.2%) | 37 (1.1%) |
| 5 to 9 Minutes | 245 (7.3%) | 172 (5.0%) |
| 10 to 14 Minutes | 416 (12.5%) | 430 (12.5%) |
| 15 to 19 Minutes | 246 (7.4%) | 396 (11.5%) |
| 20 to 24 Minutes | 825 (24.7%) | 616 (17.9%) |
| 25 to 29 Minutes | 293 (8.8%) | 348 (10.1%) |
| 30 to 34 Minutes | 490 (14.7%) | 692 (20.1%) |
| 35 to 39 Minutes | 70 (2.1%) | 165 (4.8%) |
| 40 to 44 Minutes | 146 (4.4%) | 155 (4.5%) |
| 45 to 59 Minutes | 204 (6.1%) | 297 (8.6%) |
| 60 to 89 Minutes | 247 (7.4%) | 91 (2.6%) |
| 90 or more Minutes | 117 (3.5%) | 49 (1.4%) |
Time of Departure to Work by Sex in Forest City
The most frequent times of departure to work in Forest City are 8:00 AM to 8:29 AM (555, 16.6%) for males and 8:00 AM to 8:29 AM (525, 15.2%) for females.
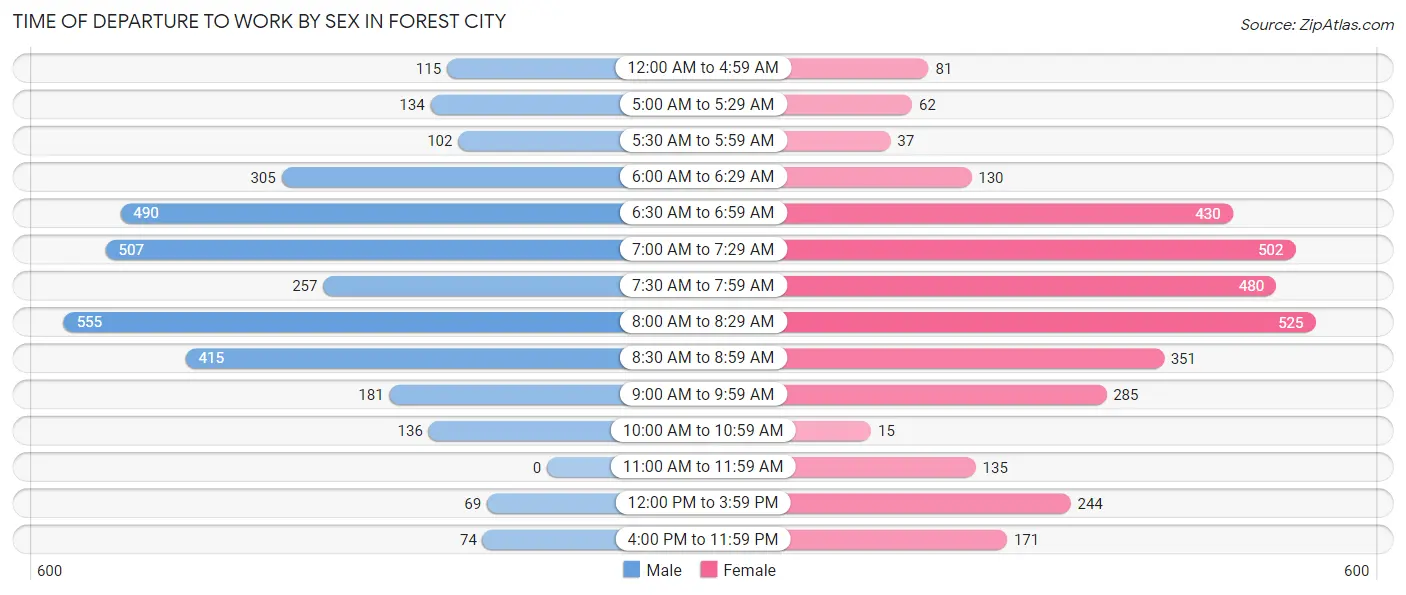
| Time of Departure | Male | Female |
| 12:00 AM to 4:59 AM | 115 (3.4%) | 81 (2.4%) |
| 5:00 AM to 5:29 AM | 134 (4.0%) | 62 (1.8%) |
| 5:30 AM to 5:59 AM | 102 (3.0%) | 37 (1.1%) |
| 6:00 AM to 6:29 AM | 305 (9.1%) | 130 (3.8%) |
| 6:30 AM to 6:59 AM | 490 (14.7%) | 430 (12.5%) |
| 7:00 AM to 7:29 AM | 507 (15.2%) | 502 (14.6%) |
| 7:30 AM to 7:59 AM | 257 (7.7%) | 480 (13.9%) |
| 8:00 AM to 8:29 AM | 555 (16.6%) | 525 (15.2%) |
| 8:30 AM to 8:59 AM | 415 (12.4%) | 351 (10.2%) |
| 9:00 AM to 9:59 AM | 181 (5.4%) | 285 (8.3%) |
| 10:00 AM to 10:59 AM | 136 (4.1%) | 15 (0.4%) |
| 11:00 AM to 11:59 AM | 0 (0.0%) | 135 (3.9%) |
| 12:00 PM to 3:59 PM | 69 (2.1%) | 244 (7.1%) |
| 4:00 PM to 11:59 PM | 74 (2.2%) | 171 (5.0%) |
| Total | 3,340 (100.0%) | 3,448 (100.0%) |
Housing Occupancy in Forest City
Occupancy by Ownership in Forest City
Of the total 5,416 dwellings in Forest City, owner-occupied units account for 3,490 (64.4%), while renter-occupied units make up 1,926 (35.6%).
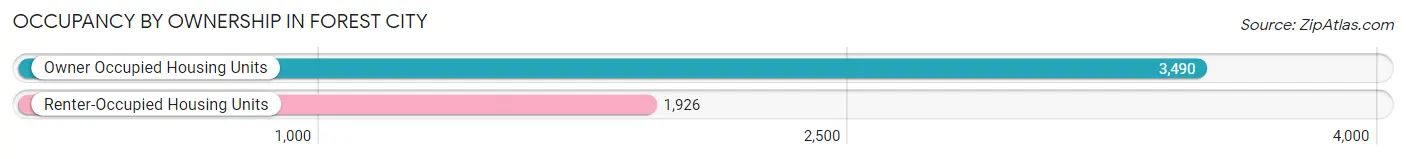
| Occupancy | # Housing Units | % Housing Units |
| Owner Occupied Housing Units | 3,490 | 64.4% |
| Renter-Occupied Housing Units | 1,926 | 35.6% |
| Total Occupied Housing Units | 5,416 | 100.0% |
Occupancy by Household Size in Forest City
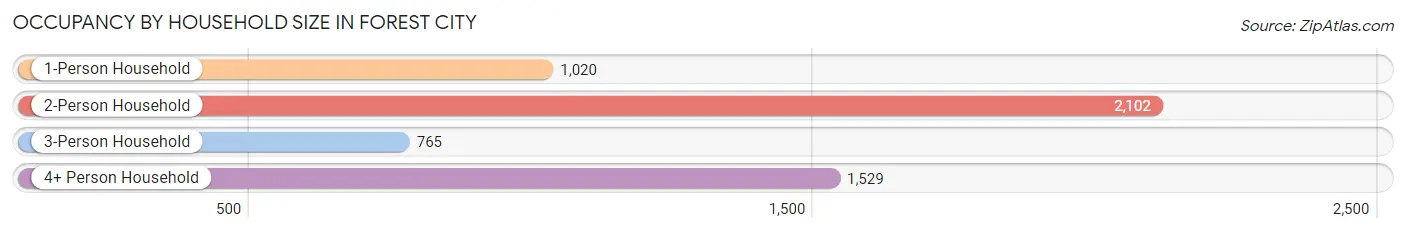
| Household Size | # Housing Units | % Housing Units |
| 1-Person Household | 1,020 | 18.8% |
| 2-Person Household | 2,102 | 38.8% |
| 3-Person Household | 765 | 14.1% |
| 4+ Person Household | 1,529 | 28.2% |
| Total Housing Units | 5,416 | 100.0% |
Occupancy by Ownership by Household Size in Forest City
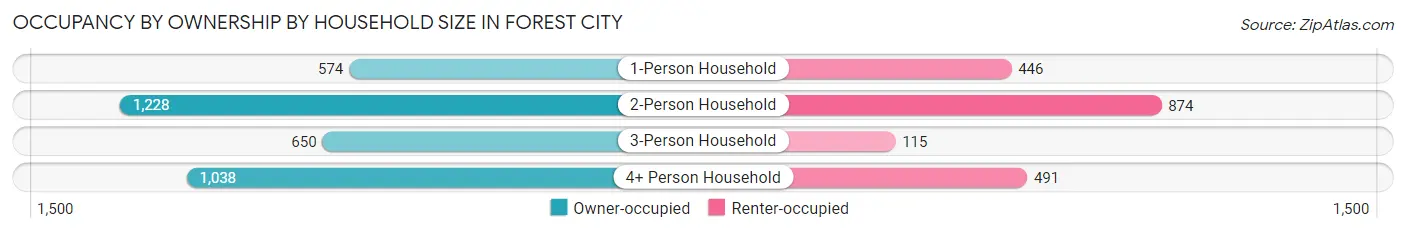
| Household Size | Owner-occupied | Renter-occupied |
| 1-Person Household | 574 (56.3%) | 446 (43.7%) |
| 2-Person Household | 1,228 (58.4%) | 874 (41.6%) |
| 3-Person Household | 650 (85.0%) | 115 (15.0%) |
| 4+ Person Household | 1,038 (67.9%) | 491 (32.1%) |
| Total Housing Units | 3,490 (64.4%) | 1,926 (35.6%) |
Occupancy by Educational Attainment in Forest City
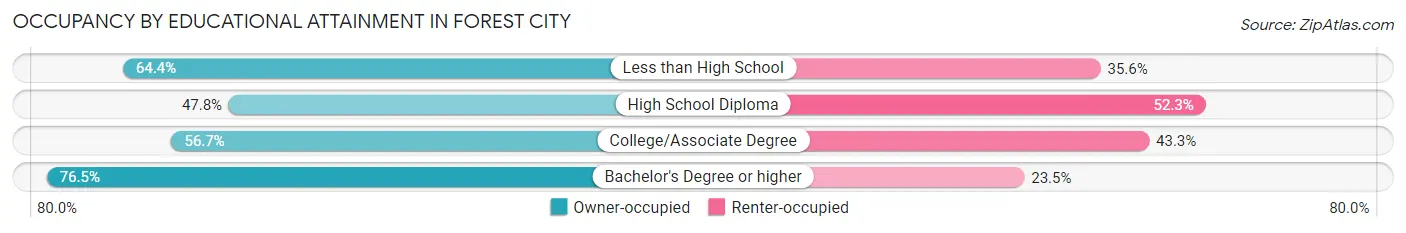
| Household Size | Owner-occupied | Renter-occupied |
| Less than High School | 143 (64.4%) | 79 (35.6%) |
| High School Diploma | 563 (47.7%) | 616 (52.2%) |
| College/Associate Degree | 824 (56.7%) | 629 (43.3%) |
| Bachelor's Degree or higher | 1,960 (76.5%) | 602 (23.5%) |
Occupancy by Age of Householder in Forest City
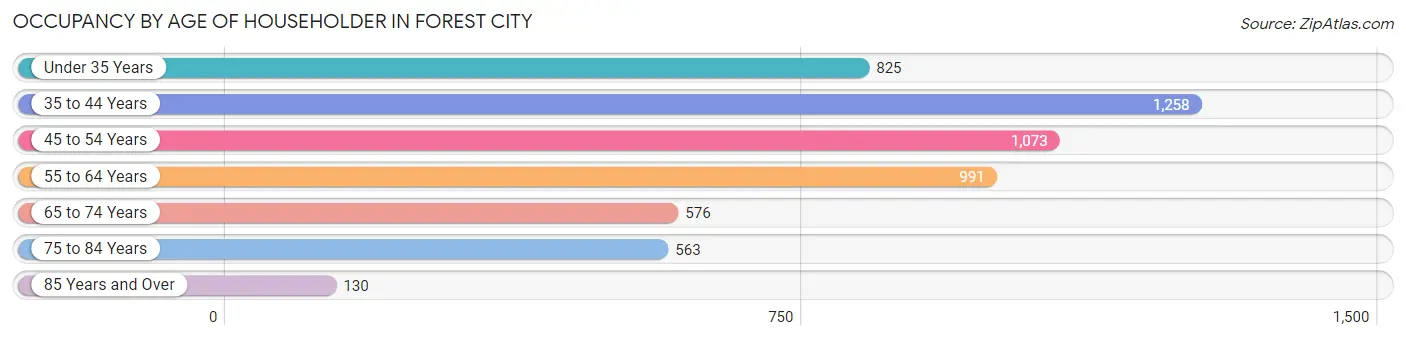
| Age Bracket | # Households | % Households |
| Under 35 Years | 825 | 15.2% |
| 35 to 44 Years | 1,258 | 23.2% |
| 45 to 54 Years | 1,073 | 19.8% |
| 55 to 64 Years | 991 | 18.3% |
| 65 to 74 Years | 576 | 10.6% |
| 75 to 84 Years | 563 | 10.4% |
| 85 Years and Over | 130 | 2.4% |
| Total | 5,416 | 100.0% |
Housing Finances in Forest City
Median Income by Occupancy in Forest City
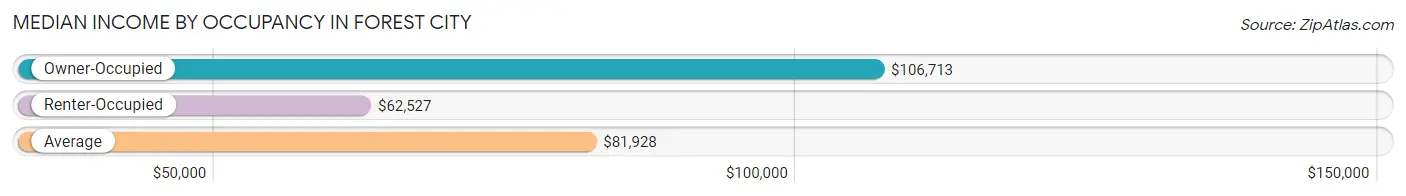
| Occupancy Type | # Households | Median Income |
| Owner-Occupied | 3,490 (64.4%) | $106,713 |
| Renter-Occupied | 1,926 (35.6%) | $62,527 |
| Average | 5,416 (100.0%) | $81,928 |
Occupancy by Householder Income Bracket in Forest City
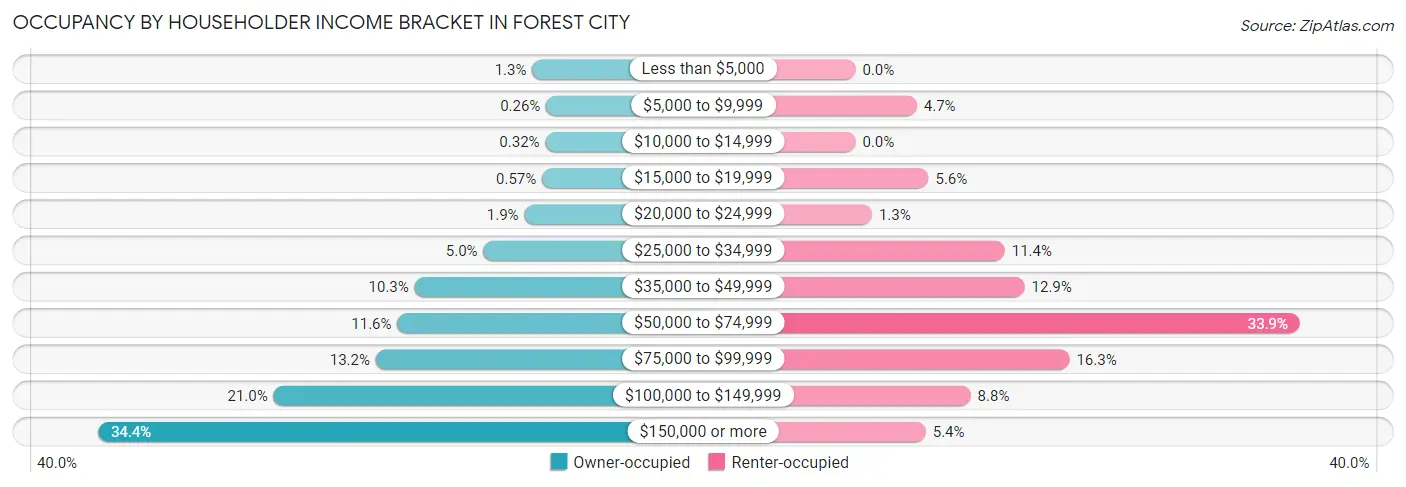
| Income Bracket | Owner-occupied | Renter-occupied |
| Less than $5,000 | 46 (1.3%) | 0 (0.0%) |
| $5,000 to $9,999 | 9 (0.3%) | 90 (4.7%) |
| $10,000 to $14,999 | 11 (0.3%) | 0 (0.0%) |
| $15,000 to $19,999 | 20 (0.6%) | 107 (5.6%) |
| $20,000 to $24,999 | 67 (1.9%) | 24 (1.3%) |
| $25,000 to $34,999 | 176 (5.0%) | 219 (11.4%) |
| $35,000 to $49,999 | 359 (10.3%) | 248 (12.9%) |
| $50,000 to $74,999 | 405 (11.6%) | 652 (33.9%) |
| $75,000 to $99,999 | 462 (13.2%) | 314 (16.3%) |
| $100,000 to $149,999 | 734 (21.0%) | 169 (8.8%) |
| $150,000 or more | 1,201 (34.4%) | 103 (5.3%) |
| Total | 3,490 (100.0%) | 1,926 (100.0%) |
Monthly Housing Cost Tiers in Forest City
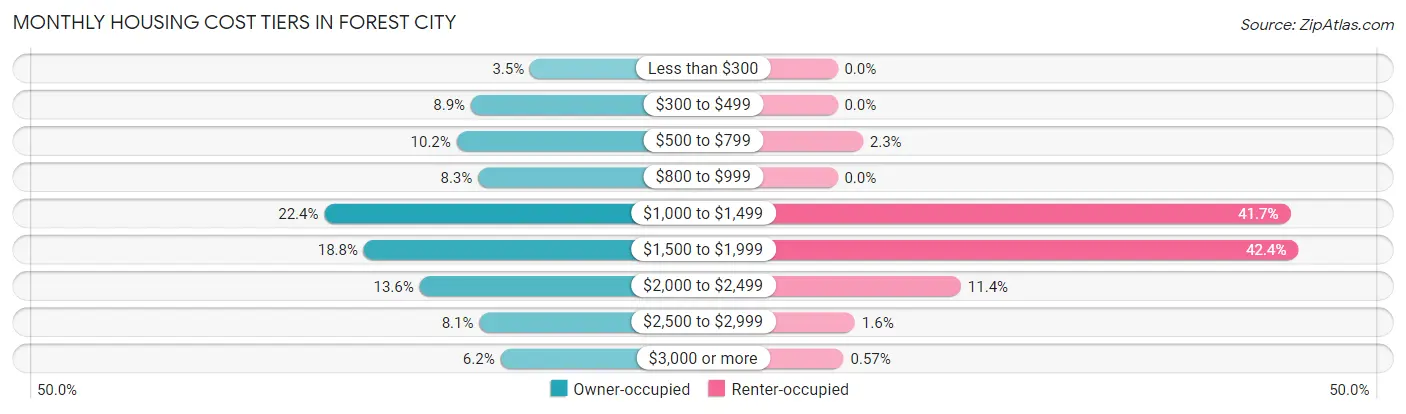
| Monthly Cost | Owner-occupied | Renter-occupied |
| Less than $300 | 121 (3.5%) | 0 (0.0%) |
| $300 to $499 | 311 (8.9%) | 0 (0.0%) |
| $500 to $799 | 357 (10.2%) | 45 (2.3%) |
| $800 to $999 | 288 (8.3%) | 0 (0.0%) |
| $1,000 to $1,499 | 782 (22.4%) | 803 (41.7%) |
| $1,500 to $1,999 | 655 (18.8%) | 817 (42.4%) |
| $2,000 to $2,499 | 476 (13.6%) | 219 (11.4%) |
| $2,500 to $2,999 | 284 (8.1%) | 31 (1.6%) |
| $3,000 or more | 216 (6.2%) | 11 (0.6%) |
| Total | 3,490 (100.0%) | 1,926 (100.0%) |
Physical Housing Characteristics in Forest City
Housing Structures in Forest City
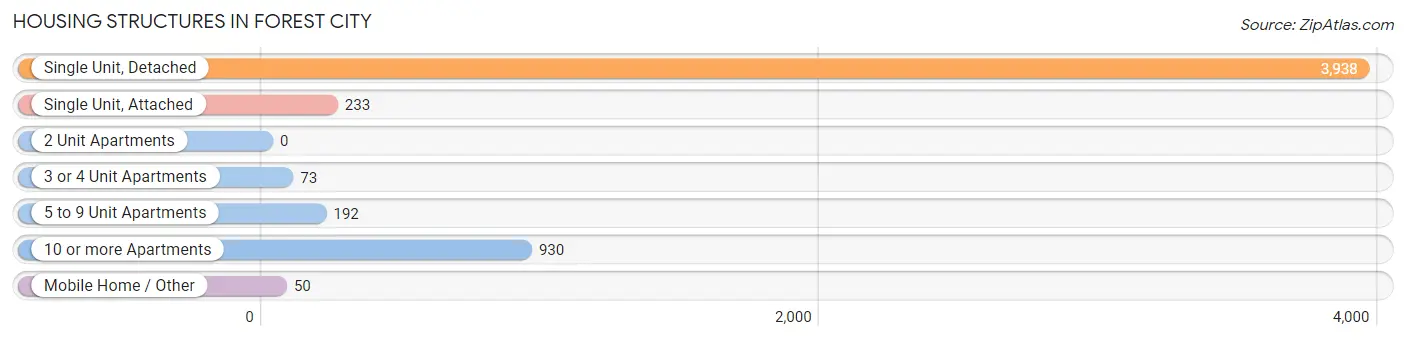
| Structure Type | # Housing Units | % Housing Units |
| Single Unit, Detached | 3,938 | 72.7% |
| Single Unit, Attached | 233 | 4.3% |
| 2 Unit Apartments | 0 | 0.0% |
| 3 or 4 Unit Apartments | 73 | 1.3% |
| 5 to 9 Unit Apartments | 192 | 3.5% |
| 10 or more Apartments | 930 | 17.2% |
| Mobile Home / Other | 50 | 0.9% |
| Total | 5,416 | 100.0% |
Housing Structures by Occupancy in Forest City
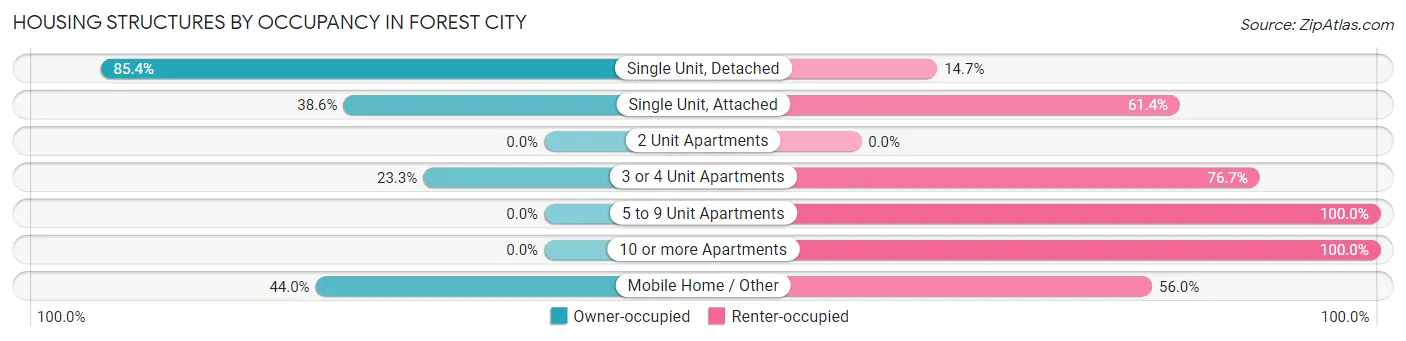
| Structure Type | Owner-occupied | Renter-occupied |
| Single Unit, Detached | 3,361 (85.4%) | 577 (14.6%) |
| Single Unit, Attached | 90 (38.6%) | 143 (61.4%) |
| 2 Unit Apartments | 0 (0.0%) | 0 (0.0%) |
| 3 or 4 Unit Apartments | 17 (23.3%) | 56 (76.7%) |
| 5 to 9 Unit Apartments | 0 (0.0%) | 192 (100.0%) |
| 10 or more Apartments | 0 (0.0%) | 930 (100.0%) |
| Mobile Home / Other | 22 (44.0%) | 28 (56.0%) |
| Total | 3,490 (64.4%) | 1,926 (35.6%) |
Housing Structures by Number of Rooms in Forest City
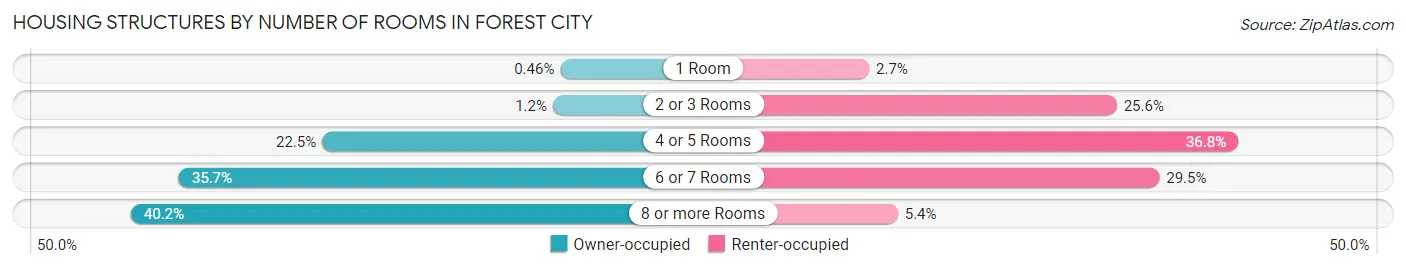
| Number of Rooms | Owner-occupied | Renter-occupied |
| 1 Room | 16 (0.5%) | 52 (2.7%) |
| 2 or 3 Rooms | 40 (1.1%) | 493 (25.6%) |
| 4 or 5 Rooms | 785 (22.5%) | 709 (36.8%) |
| 6 or 7 Rooms | 1,247 (35.7%) | 569 (29.5%) |
| 8 or more Rooms | 1,402 (40.2%) | 103 (5.3%) |
| Total | 3,490 (100.0%) | 1,926 (100.0%) |
Housing Structure by Heating Type in Forest City
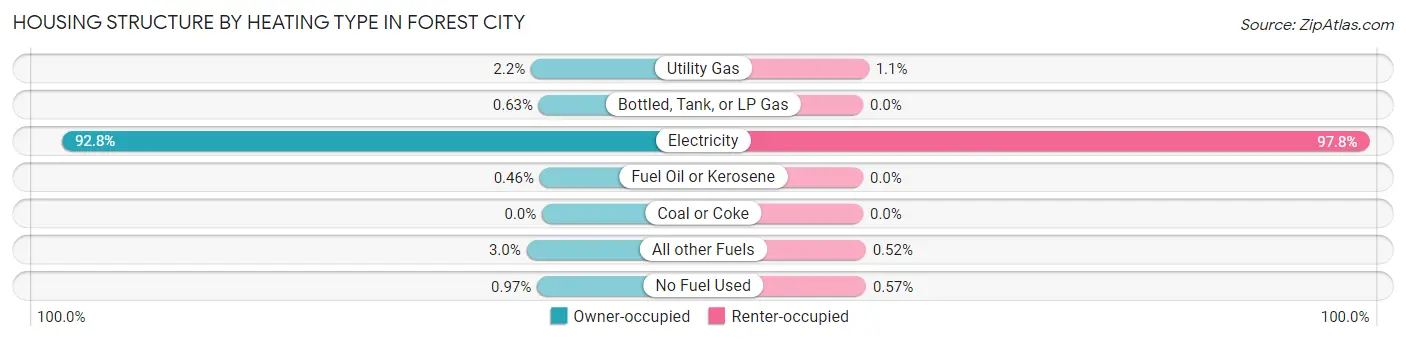
| Heating Type | Owner-occupied | Renter-occupied |
| Utility Gas | 75 (2.1%) | 21 (1.1%) |
| Bottled, Tank, or LP Gas | 22 (0.6%) | 0 (0.0%) |
| Electricity | 3,238 (92.8%) | 1,884 (97.8%) |
| Fuel Oil or Kerosene | 16 (0.5%) | 0 (0.0%) |
| Coal or Coke | 0 (0.0%) | 0 (0.0%) |
| All other Fuels | 105 (3.0%) | 10 (0.5%) |
| No Fuel Used | 34 (1.0%) | 11 (0.6%) |
| Total | 3,490 (100.0%) | 1,926 (100.0%) |
Household Vehicle Usage in Forest City
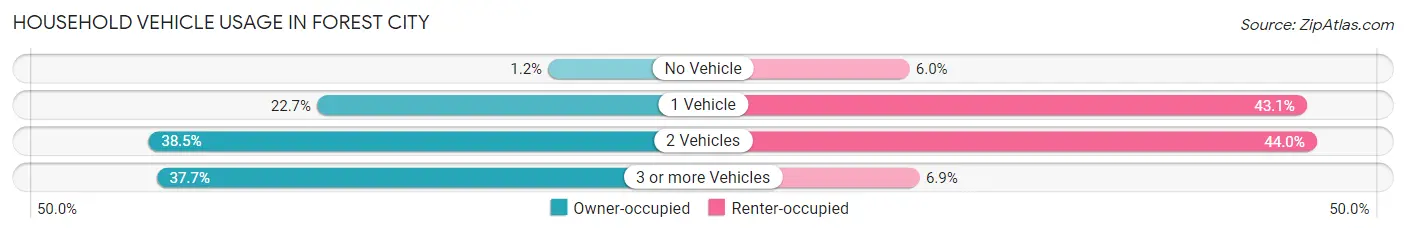
| Vehicles per Household | Owner-occupied | Renter-occupied |
| No Vehicle | 40 (1.1%) | 115 (6.0%) |
| 1 Vehicle | 793 (22.7%) | 830 (43.1%) |
| 2 Vehicles | 1,342 (38.5%) | 848 (44.0%) |
| 3 or more Vehicles | 1,315 (37.7%) | 133 (6.9%) |
| Total | 3,490 (100.0%) | 1,926 (100.0%) |
Real Estate & Mortgages in Forest City
Real Estate and Mortgage Overview in Forest City
| Characteristic | Without Mortgage | With Mortgage |
| Housing Units | 1,111 | 2,379 |
| Median Property Value | $360,400 | $343,900 |
| Median Household Income | $105,045 | $879 |
| Monthly Housing Costs | $725 | $216 |
| Real Estate Taxes | $3,002 | $26 |
Property Value by Mortgage Status in Forest City
| Property Value | Without Mortgage | With Mortgage |
| Less than $50,000 | 22 (2.0%) | 0 (0.0%) |
| $50,000 to $99,999 | 24 (2.2%) | 0 (0.0%) |
| $100,000 to $299,999 | 300 (27.0%) | 947 (39.8%) |
| $300,000 to $499,999 | 518 (46.6%) | 924 (38.8%) |
| $500,000 to $749,999 | 70 (6.3%) | 366 (15.4%) |
| $750,000 to $999,999 | 71 (6.4%) | 118 (5.0%) |
| $1,000,000 or more | 106 (9.5%) | 24 (1.0%) |
| Total | 1,111 (100.0%) | 2,379 (100.0%) |
Household Income by Mortgage Status in Forest City
| Household Income | Without Mortgage | With Mortgage |
| Less than $10,000 | 55 (5.0%) | 7 (0.3%) |
| $10,000 to $24,999 | 80 (7.2%) | 0 (0.0%) |
| $25,000 to $34,999 | 80 (7.2%) | 18 (0.8%) |
| $35,000 to $49,999 | 145 (13.1%) | 96 (4.0%) |
| $50,000 to $74,999 | 51 (4.6%) | 214 (9.0%) |
| $75,000 to $99,999 | 144 (13.0%) | 354 (14.9%) |
| $100,000 to $149,999 | 234 (21.1%) | 318 (13.4%) |
| $150,000 or more | 322 (29.0%) | 500 (21.0%) |
| Total | 1,111 (100.0%) | 2,379 (100.0%) |
Property Value to Household Income Ratio in Forest City
| Value-to-Income Ratio | Without Mortgage | With Mortgage |
| Less than 2.0x | 222 (20.0%) | 108,882 (4,576.8%) |
| 2.0x to 2.9x | 140 (12.6%) | 483 (20.3%) |
| 3.0x to 3.9x | 214 (19.3%) | 698 (29.3%) |
| 4.0x or more | 513 (46.2%) | 404 (17.0%) |
| Total | 1,111 (100.0%) | 2,379 (100.0%) |
Real Estate Taxes by Mortgage Status in Forest City
| Property Taxes | Without Mortgage | With Mortgage |
| Less than $800 | 101 (9.1%) | 0 (0.0%) |
| $800 to $1,499 | 190 (17.1%) | 196 (8.2%) |
| $800 to $1,499 | 802 (72.2%) | 461 (19.4%) |
| Total | 1,111 (100.0%) | 2,379 (100.0%) |
Health & Disability in Forest City
Health Insurance Coverage by Age in Forest City
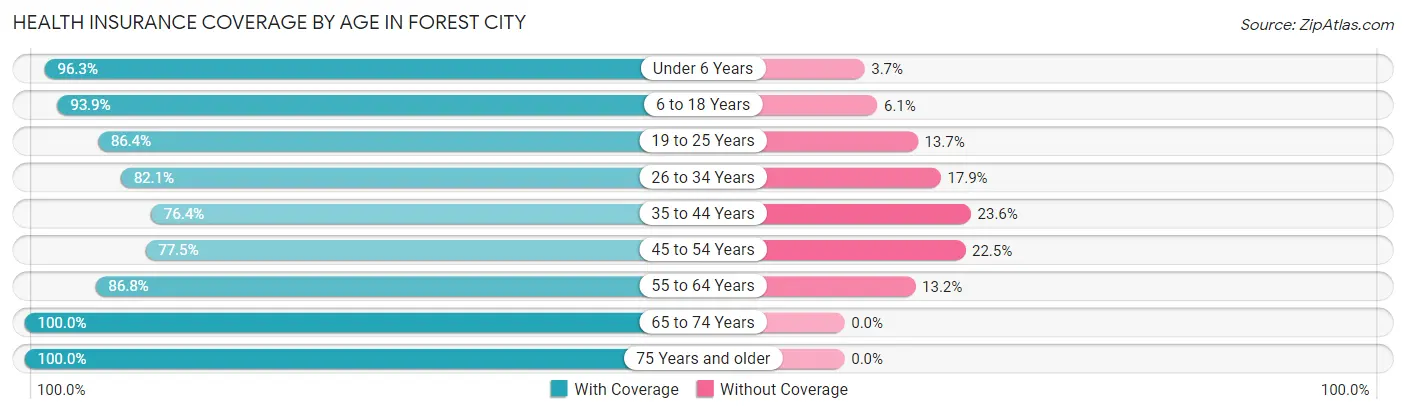
| Age Bracket | With Coverage | Without Coverage |
| Under 6 Years | 620 (96.3%) | 24 (3.7%) |
| 6 to 18 Years | 2,428 (93.9%) | 158 (6.1%) |
| 19 to 25 Years | 905 (86.4%) | 143 (13.7%) |
| 26 to 34 Years | 1,424 (82.1%) | 311 (17.9%) |
| 35 to 44 Years | 1,723 (76.4%) | 531 (23.6%) |
| 45 to 54 Years | 1,694 (77.5%) | 492 (22.5%) |
| 55 to 64 Years | 1,570 (86.8%) | 239 (13.2%) |
| 65 to 74 Years | 1,122 (100.0%) | 0 (0.0%) |
| 75 Years and older | 1,143 (100.0%) | 0 (0.0%) |
| Total | 12,629 (86.9%) | 1,898 (13.1%) |
Health Insurance Coverage by Citizenship Status in Forest City
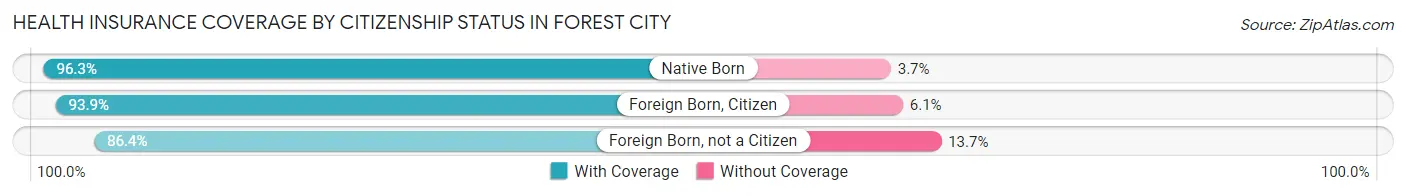
| Citizenship Status | With Coverage | Without Coverage |
| Native Born | 620 (96.3%) | 24 (3.7%) |
| Foreign Born, Citizen | 2,428 (93.9%) | 158 (6.1%) |
| Foreign Born, not a Citizen | 905 (86.4%) | 143 (13.7%) |
Health Insurance Coverage by Household Income in Forest City
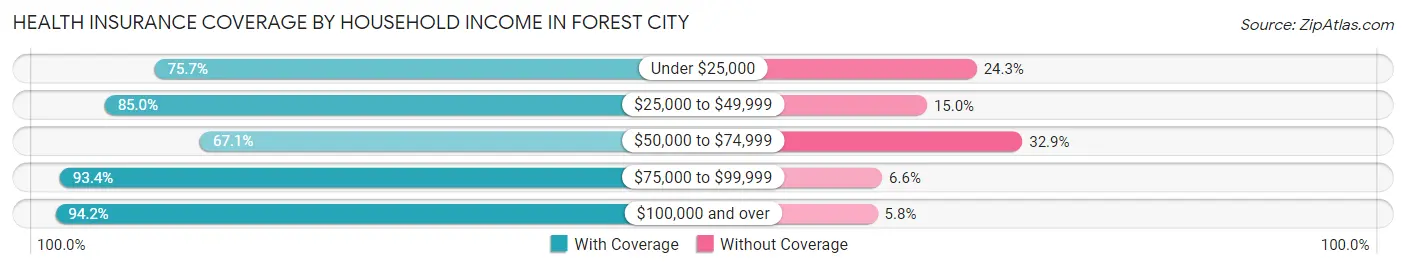
| Household Income | With Coverage | Without Coverage |
| Under $25,000 | 833 (75.7%) | 268 (24.3%) |
| $25,000 to $49,999 | 1,647 (85.0%) | 291 (15.0%) |
| $50,000 to $74,999 | 1,615 (67.1%) | 791 (32.9%) |
| $75,000 to $99,999 | 1,947 (93.4%) | 138 (6.6%) |
| $100,000 and over | 6,548 (94.2%) | 402 (5.8%) |
Public vs Private Health Insurance Coverage by Age in Forest City
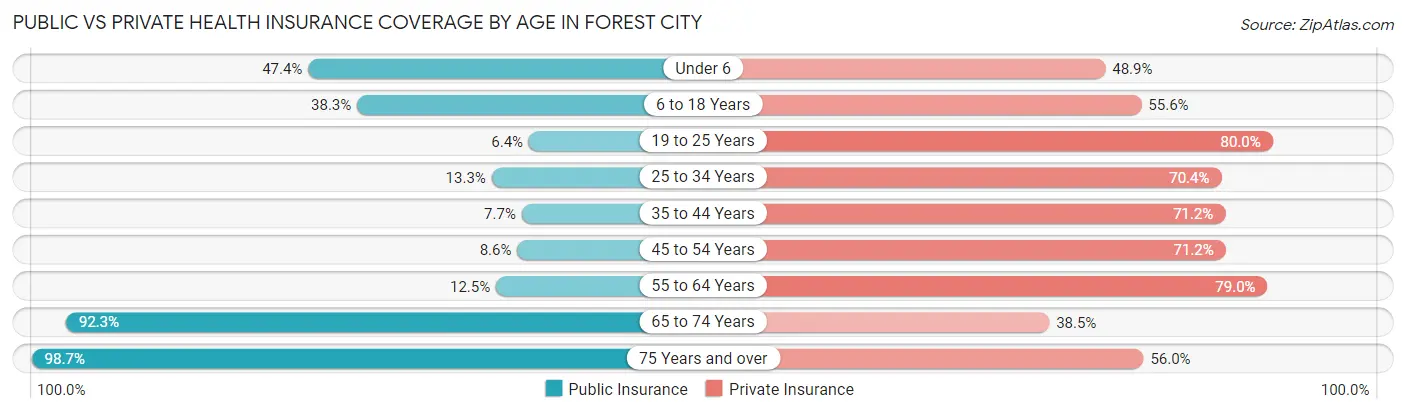
| Age Bracket | Public Insurance | Private Insurance |
| Under 6 | 305 (47.4%) | 315 (48.9%) |
| 6 to 18 Years | 990 (38.3%) | 1,438 (55.6%) |
| 19 to 25 Years | 67 (6.4%) | 838 (80.0%) |
| 25 to 34 Years | 231 (13.3%) | 1,222 (70.4%) |
| 35 to 44 Years | 174 (7.7%) | 1,604 (71.2%) |
| 45 to 54 Years | 187 (8.6%) | 1,557 (71.2%) |
| 55 to 64 Years | 226 (12.5%) | 1,429 (79.0%) |
| 65 to 74 Years | 1,036 (92.3%) | 432 (38.5%) |
| 75 Years and over | 1,128 (98.7%) | 640 (56.0%) |
| Total | 4,344 (29.9%) | 9,475 (65.2%) |
Disability Status by Sex by Age in Forest City
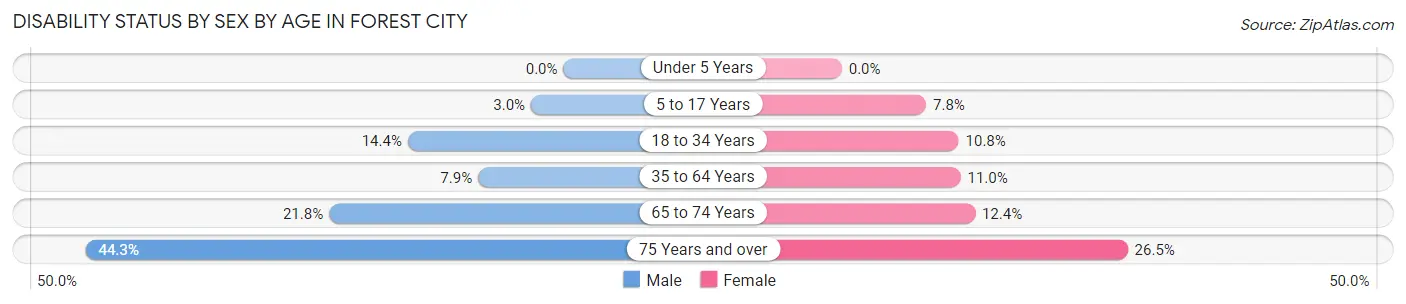
| Age Bracket | Male | Female |
| Under 5 Years | 0 (0.0%) | 0 (0.0%) |
| 5 to 17 Years | 48 (3.0%) | 77 (7.8%) |
| 18 to 34 Years | 157 (14.4%) | 195 (10.8%) |
| 35 to 64 Years | 240 (7.9%) | 355 (11.0%) |
| 65 to 74 Years | 112 (21.7%) | 75 (12.4%) |
| 75 Years and over | 231 (44.3%) | 165 (26.5%) |
Disability Class by Sex by Age in Forest City
Disability Class: Hearing Difficulty
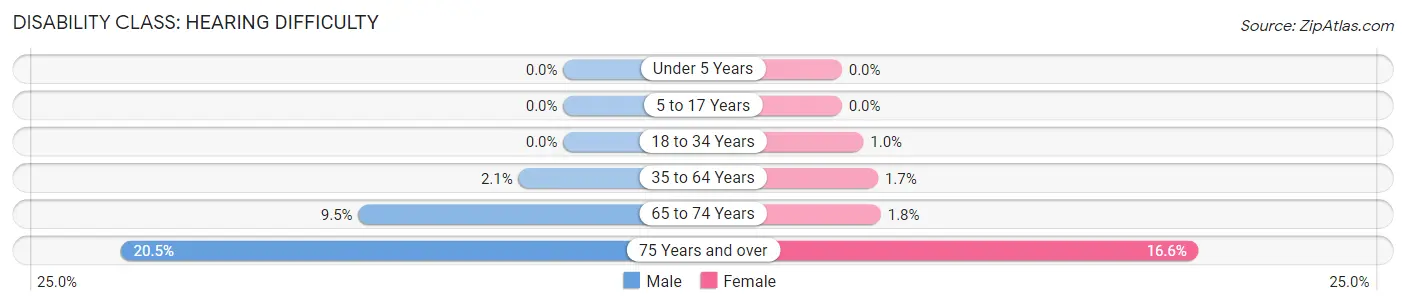
| Age Bracket | Male | Female |
| Under 5 Years | 0 (0.0%) | 0 (0.0%) |
| 5 to 17 Years | 0 (0.0%) | 0 (0.0%) |
| 18 to 34 Years | 0 (0.0%) | 18 (1.0%) |
| 35 to 64 Years | 63 (2.1%) | 54 (1.7%) |
| 65 to 74 Years | 49 (9.5%) | 11 (1.8%) |
| 75 Years and over | 107 (20.5%) | 103 (16.6%) |
Disability Class: Vision Difficulty
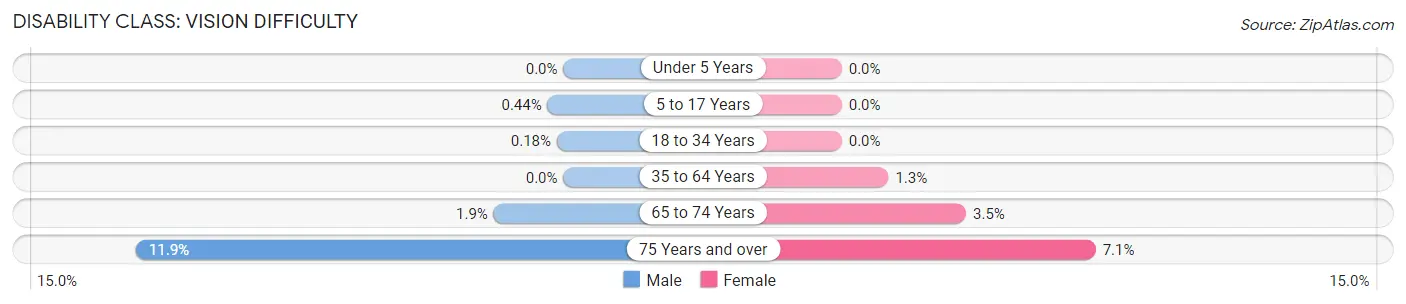
| Age Bracket | Male | Female |
| Under 5 Years | 0 (0.0%) | 0 (0.0%) |
| 5 to 17 Years | 7 (0.4%) | 0 (0.0%) |
| 18 to 34 Years | 2 (0.2%) | 0 (0.0%) |
| 35 to 64 Years | 0 (0.0%) | 42 (1.3%) |
| 65 to 74 Years | 10 (1.9%) | 21 (3.5%) |
| 75 Years and over | 62 (11.9%) | 44 (7.1%) |
Disability Class: Cognitive Difficulty
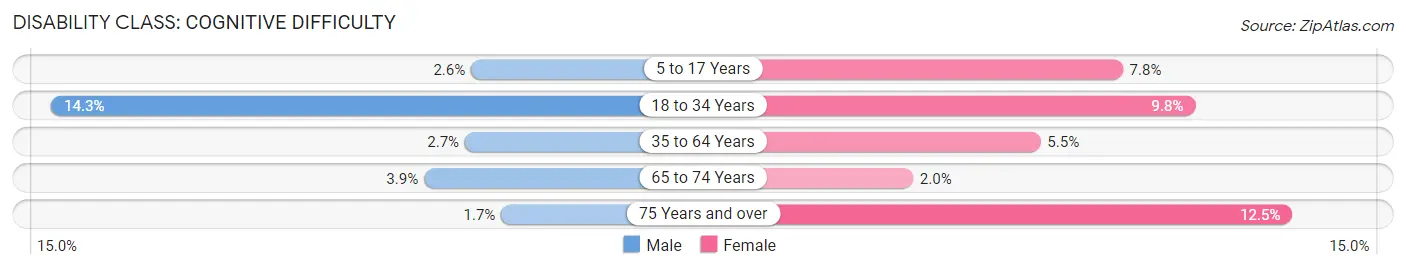
| Age Bracket | Male | Female |
| 5 to 17 Years | 41 (2.6%) | 77 (7.8%) |
| 18 to 34 Years | 155 (14.3%) | 177 (9.8%) |
| 35 to 64 Years | 83 (2.7%) | 178 (5.5%) |
| 65 to 74 Years | 20 (3.9%) | 12 (2.0%) |
| 75 Years and over | 9 (1.7%) | 78 (12.5%) |
Disability Class: Ambulatory Difficulty
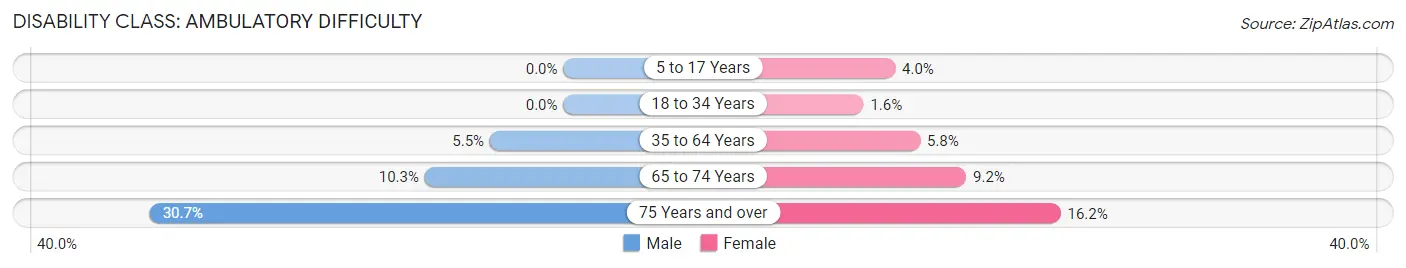
| Age Bracket | Male | Female |
| 5 to 17 Years | 0 (0.0%) | 39 (4.0%) |
| 18 to 34 Years | 0 (0.0%) | 29 (1.6%) |
| 35 to 64 Years | 165 (5.4%) | 187 (5.8%) |
| 65 to 74 Years | 53 (10.3%) | 56 (9.2%) |
| 75 Years and over | 160 (30.7%) | 101 (16.2%) |
Disability Class: Self-Care Difficulty
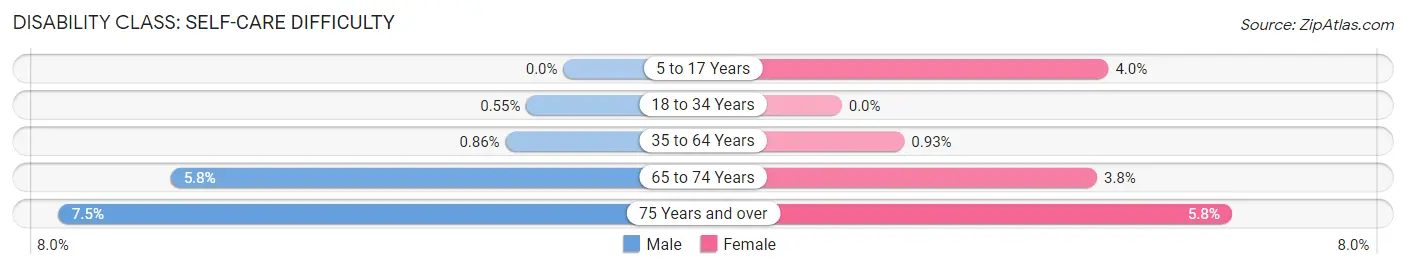
| Age Bracket | Male | Female |
| 5 to 17 Years | 0 (0.0%) | 39 (4.0%) |
| 18 to 34 Years | 6 (0.5%) | 0 (0.0%) |
| 35 to 64 Years | 26 (0.9%) | 30 (0.9%) |
| 65 to 74 Years | 30 (5.8%) | 23 (3.8%) |
| 75 Years and over | 39 (7.5%) | 36 (5.8%) |
Technology Access in Forest City
Computing Device Access in Forest City
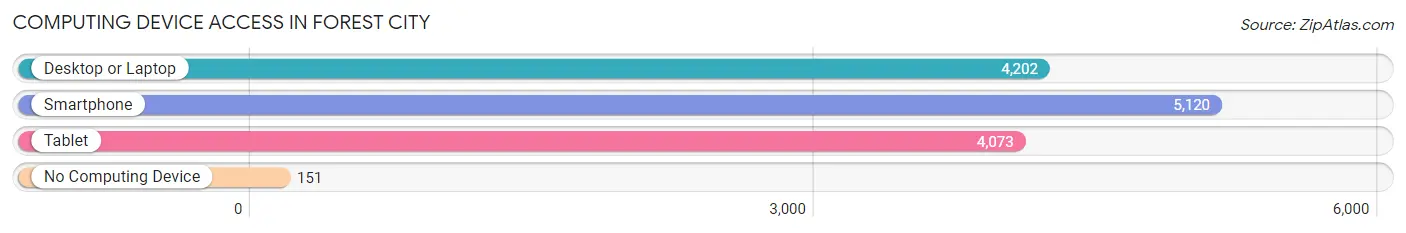
| Device Type | # Households | % Households |
| Desktop or Laptop | 4,202 | 77.6% |
| Smartphone | 5,120 | 94.5% |
| Tablet | 4,073 | 75.2% |
| No Computing Device | 151 | 2.8% |
| Total | 5,416 | 100.0% |
Internet Access in Forest City
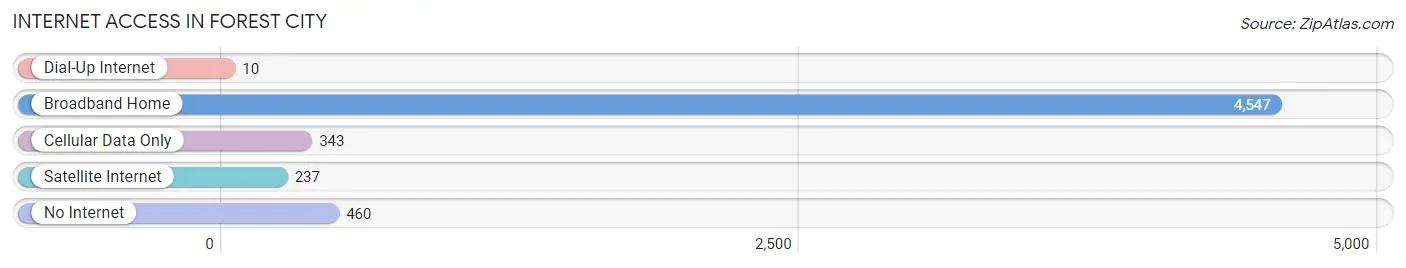
| Internet Type | # Households | % Households |
| Dial-Up Internet | 10 | 0.2% |
| Broadband Home | 4,547 | 84.0% |
| Cellular Data Only | 343 | 6.3% |
| Satellite Internet | 237 | 4.4% |
| No Internet | 460 | 8.5% |
| Total | 5,416 | 100.0% |
Forest City Summary
City of Forest City
Forest City is a small city located in Polk County, Florida. It is situated in the central part of the state, approximately 25 miles east of Tampa. The city is bordered by the cities of Lakeland and Winter Haven, and is part of the Lakeland-Winter Haven Metropolitan Statistical Area. The population of Forest City was estimated to be 2,845 in 2019.
History
The area that is now Forest City was first settled in the late 1800s by a group of settlers from Georgia. The settlement was originally known as “Georgiaville”, and was located near the intersection of what is now State Road 33 and County Road 540. The settlement was later renamed “Forest City” in 1891, after the nearby forest.
In the early 1900s, the city began to grow and develop. The first post office was established in 1906, and the first school was built in 1908. The city was incorporated in 1911, and the first mayor was elected in 1912.
In the 1920s, the city experienced a period of growth and development. The first bank was established in 1921, and the first newspaper was published in 1923. The city also saw the construction of several churches, a library, and a hospital.
In the 1950s, the city experienced a period of decline. The population decreased from 1,500 in 1950 to 1,000 in 1960. The city also experienced a decrease in businesses and industry.
In the 1970s, the city began to experience a period of revitalization. The population increased from 1,000 in 1970 to 2,000 in 1980. The city also saw the construction of several new businesses and industries.
Geography
Forest City is located in central Florida, approximately 25 miles east of Tampa. The city is situated in the Lakeland-Winter Haven Metropolitan Statistical Area. The city is bordered by the cities of Lakeland and Winter Haven.
The city has a total area of 1.3 square miles, all of which is land. The city is located at an elevation of approximately 100 feet above sea level.
Economy
The economy of Forest City is largely based on agriculture and tourism. The city is home to several farms, which produce a variety of crops, including citrus, vegetables, and hay. The city is also home to several tourist attractions, including a wildlife refuge, a state park, and a historic district.
The city is also home to several businesses and industries, including manufacturing, retail, and healthcare. The city is home to several large employers, including Publix Super Markets, Walmart, and Florida Hospital.
Demographics
As of the 2019 census, the population of Forest City was estimated to be 2,845. The population is approximately 50% white, 25% Hispanic, and 25% African American. The median household income is approximately $41,000, and the median home value is approximately $150,000.
Conclusion
Forest City is a small city located in Polk County, Florida. It is situated in the central part of the state, approximately 25 miles east of Tampa. The city is bordered by the cities of Lakeland and Winter Haven, and is part of the Lakeland-Winter Haven Metropolitan Statistical Area. The population of Forest City was estimated to be 2,845 in 2019. The economy of Forest City is largely based on agriculture and tourism, and the city is home to several businesses and industries. The population is approximately 50% white, 25% Hispanic, and 25% African American. The median household income is approximately $41,000, and the median home value is approximately $150,000.
Common Questions
What is Per Capita Income in Forest City?
Per Capita income in Forest City is $42,154.
What is the Median Family Income in Forest City?
Median Family Income in Forest City is $93,664.
What is the Median Household income in Forest City?
Median Household Income in Forest City is $81,928.
What is Income or Wage Gap in Forest City?
Income or Wage Gap in Forest City is 28.8%.
Women in Forest City earn 71.2 cents for every dollar earned by a man.
What is Inequality or Gini Index in Forest City?
Inequality or Gini Index in Forest City is 0.42.
What is the Total Population of Forest City?
Total Population of Forest City is 14,851.
What is the Total Male Population of Forest City?
Total Male Population of Forest City is 7,121.
What is the Total Female Population of Forest City?
Total Female Population of Forest City is 7,730.
What is the Ratio of Males per 100 Females in Forest City?
There are 92.12 Males per 100 Females in Forest City.
What is the Ratio of Females per 100 Males in Forest City?
There are 108.55 Females per 100 Males in Forest City.
What is the Median Population Age in Forest City?
Median Population Age in Forest City is 41.4 Years.
What is the Average Family Size in Forest City
Average Family Size in Forest City is 3.0 People.
What is the Average Household Size in Forest City
Average Household Size in Forest City is 2.7 People.
How Large is the Labor Force in Forest City?
There are 8,036 People in the Labor Forcein in Forest City.
What is the Percentage of People in the Labor Force in Forest City?
65.2% of People are in the Labor Force in Forest City.
What is the Unemployment Rate in Forest City?
Unemployment Rate in Forest City is 3.0%.