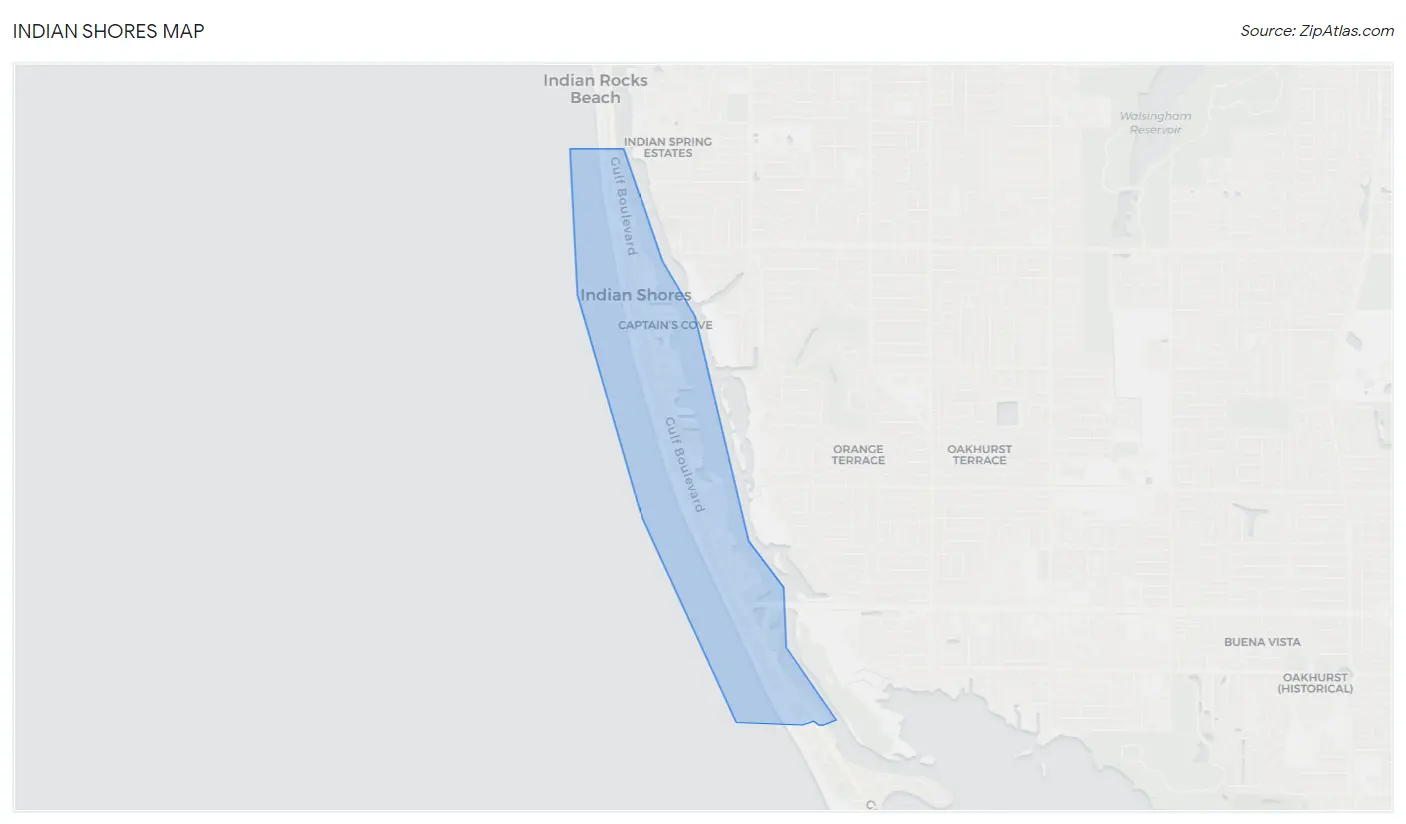
Indian Shores, FL Map & Demographics
Indian Shores Map
Indian Shores Overview
$68,846
PER CAPITA INCOME
$114,961
AVG FAMILY INCOME
$110,163
AVG HOUSEHOLD INCOME
30.7%
WAGE / INCOME GAP [ % ]
69.3¢/ $1
WAGE / INCOME GAP [ $ ]
0.45
INEQUALITY / GINI INDEX
1,182
TOTAL POPULATION
588
MALE POPULATION
594
FEMALE POPULATION
98.99
MALES / 100 FEMALES
101.02
FEMALES / 100 MALES
59.4
MEDIAN AGE
2.5
AVG FAMILY SIZE
2.0
AVG HOUSEHOLD SIZE
500
LABOR FORCE [ PEOPLE ]
44.7%
PERCENT IN LABOR FORCE
Indian Shores Area Codes
Income in Indian Shores
Income Overview in Indian Shores
Per Capita Income in Indian Shores is $68,846, while median incomes of families and households are $114,961 and $110,163 respectively.
| Characteristic | Number | Measure |
| Per Capita Income | 1,182 | $68,846 |
| Median Family Income | 377 | $114,961 |
| Mean Family Income | 377 | $164,509 |
| Median Household Income | 583 | $110,163 |
| Mean Household Income | 583 | $139,426 |
| Income Deficit | 377 | $0 |
| Wage / Income Gap (%) | 1,182 | 30.74% |
| Wage / Income Gap ($) | 1,182 | 69.26¢ per $1 |
| Gini / Inequality Index | 1,182 | 0.45 |
Earnings by Sex in Indian Shores
Average Earnings in Indian Shores are $56,477, $80,139 for men and $55,507 for women, a difference of 30.7%.
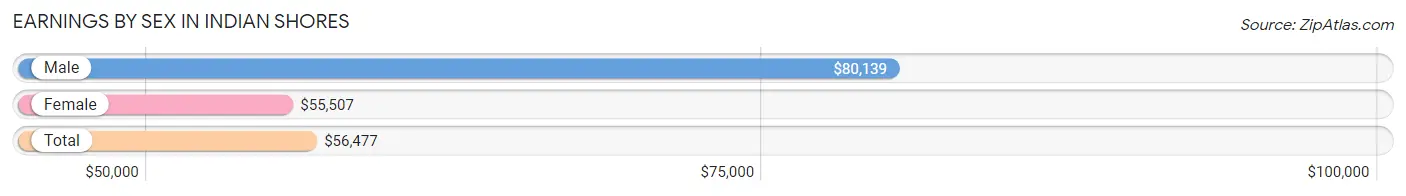
| Sex | Number | Average Earnings |
| Male | 299 (55.0%) | $80,139 |
| Female | 245 (45.0%) | $55,507 |
| Total | 544 (100.0%) | $56,477 |
Earnings by Sex by Income Bracket in Indian Shores
The most common earnings brackets in Indian Shores are $100,000+ for men (125 | 41.8%) and $100,000+ for women (62 | 25.3%).
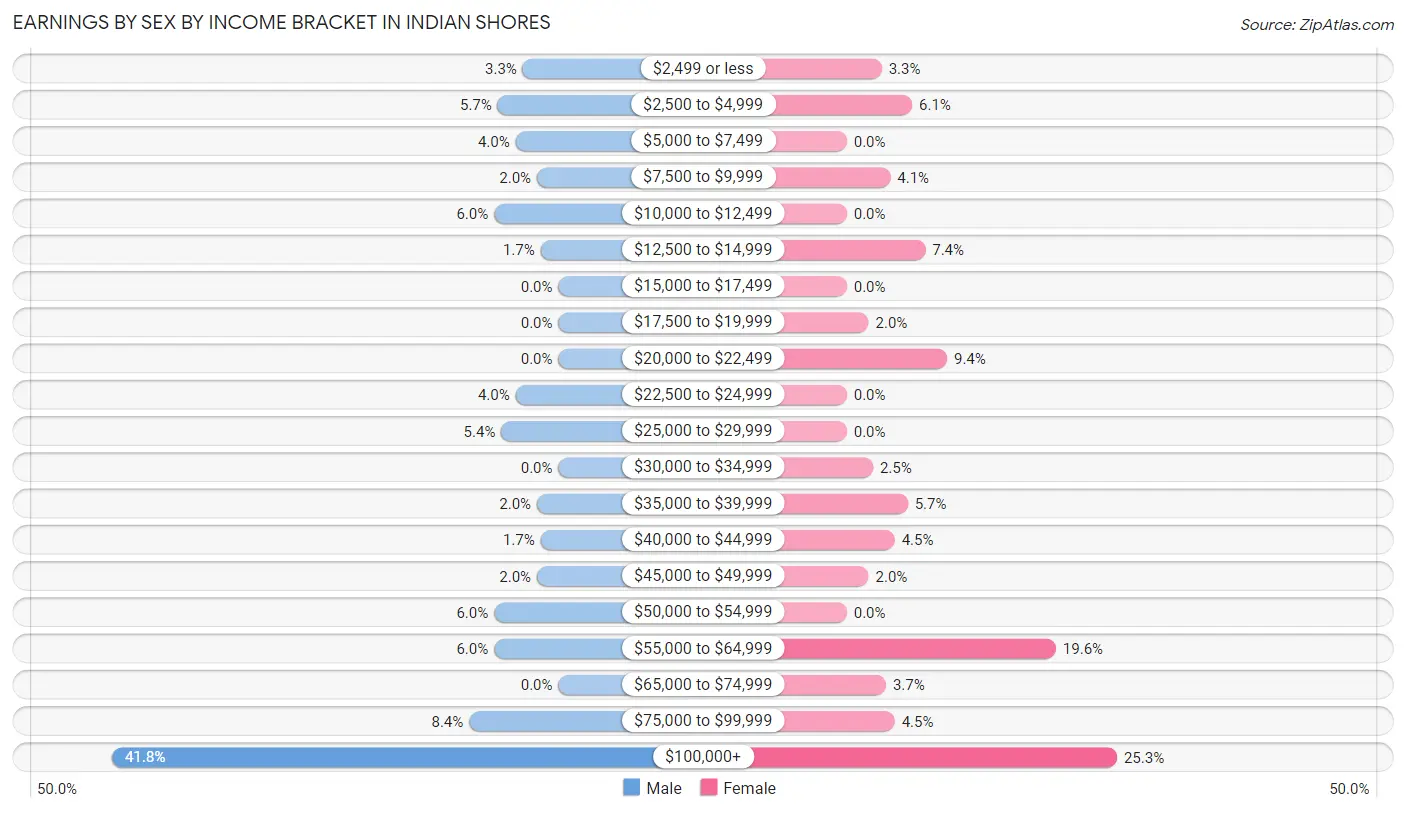
| Income | Male | Female |
| $2,499 or less | 10 (3.3%) | 8 (3.3%) |
| $2,500 to $4,999 | 17 (5.7%) | 15 (6.1%) |
| $5,000 to $7,499 | 12 (4.0%) | 0 (0.0%) |
| $7,500 to $9,999 | 6 (2.0%) | 10 (4.1%) |
| $10,000 to $12,499 | 18 (6.0%) | 0 (0.0%) |
| $12,500 to $14,999 | 5 (1.7%) | 18 (7.3%) |
| $15,000 to $17,499 | 0 (0.0%) | 0 (0.0%) |
| $17,500 to $19,999 | 0 (0.0%) | 5 (2.0%) |
| $20,000 to $22,499 | 0 (0.0%) | 23 (9.4%) |
| $22,500 to $24,999 | 12 (4.0%) | 0 (0.0%) |
| $25,000 to $29,999 | 16 (5.3%) | 0 (0.0%) |
| $30,000 to $34,999 | 0 (0.0%) | 6 (2.5%) |
| $35,000 to $39,999 | 6 (2.0%) | 14 (5.7%) |
| $40,000 to $44,999 | 5 (1.7%) | 11 (4.5%) |
| $45,000 to $49,999 | 6 (2.0%) | 5 (2.0%) |
| $50,000 to $54,999 | 18 (6.0%) | 0 (0.0%) |
| $55,000 to $64,999 | 18 (6.0%) | 48 (19.6%) |
| $65,000 to $74,999 | 0 (0.0%) | 9 (3.7%) |
| $75,000 to $99,999 | 25 (8.4%) | 11 (4.5%) |
| $100,000+ | 125 (41.8%) | 62 (25.3%) |
| Total | 299 (100.0%) | 245 (100.0%) |
Earnings by Sex by Educational Attainment in Indian Shores
Average earnings in Indian Shores are $101,429 for men and $57,000 for women, a difference of 43.8%. Men with an educational attainment of college or associate's degree enjoy the highest average annual earnings of $114,444, while those with bachelor's degree education earn the least with $113,561. Women with an educational attainment of graduate degree earn the most with the average annual earnings of $123,542, while those with college or associate's degree education have the smallest earnings of $43,864.
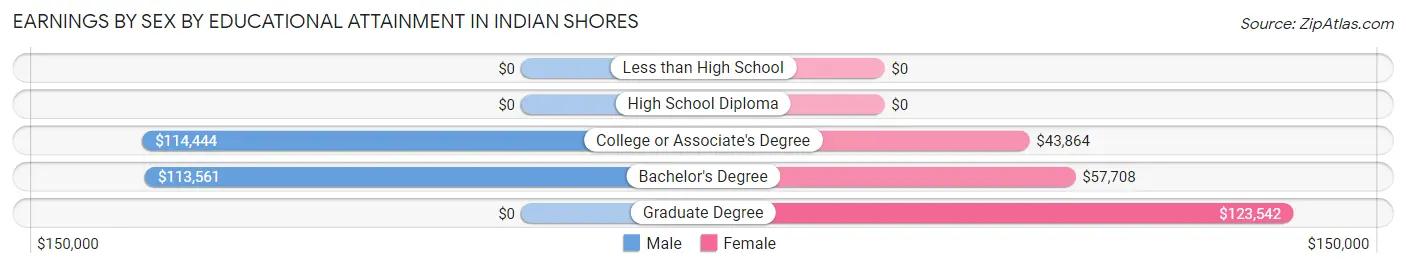
| Educational Attainment | Male Income | Female Income |
| Less than High School | - | - |
| High School Diploma | - | - |
| College or Associate's Degree | $114,444 | $43,864 |
| Bachelor's Degree | $113,561 | $57,708 |
| Graduate Degree | - | - |
| Total | $101,429 | $57,000 |
Family Income in Indian Shores
Family Income Brackets in Indian Shores
According to the Indian Shores family income data, there are 105 families falling into the $200,000+ income range, which is the most common income bracket and makes up 27.9% of all families.
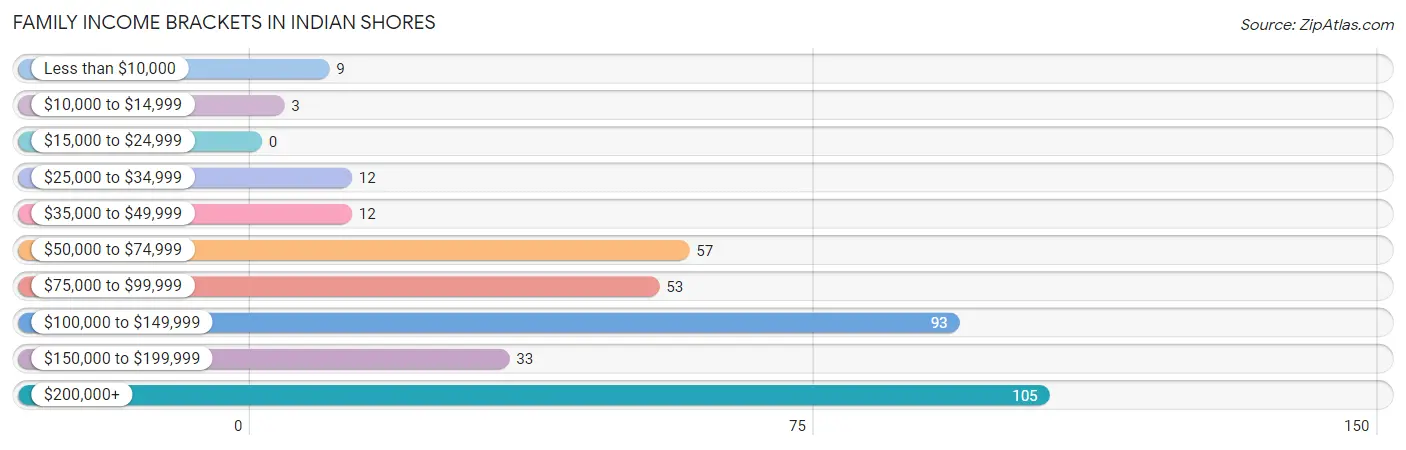
| Income Bracket | # Families | % Families |
| Less than $10,000 | 9 | 2.4% |
| $10,000 to $14,999 | 3 | 0.8% |
| $15,000 to $24,999 | 0 | 0.0% |
| $25,000 to $34,999 | 12 | 3.2% |
| $35,000 to $49,999 | 12 | 3.2% |
| $50,000 to $74,999 | 57 | 15.1% |
| $75,000 to $99,999 | 53 | 14.1% |
| $100,000 to $149,999 | 93 | 24.7% |
| $150,000 to $199,999 | 33 | 8.8% |
| $200,000+ | 105 | 27.9% |
Family Income by Famaliy Size in Indian Shores
4-person families (34 | 9.0%) account for the highest median family income in Indian Shores with $250,001 per family, while 3-person families (51 | 13.5%) have the highest median income of $72,083 per family member.
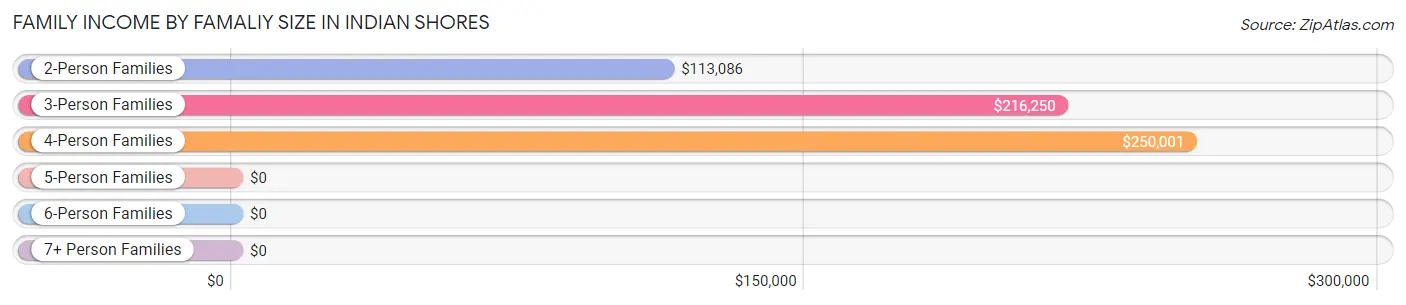
| Income Bracket | # Families | Median Income |
| 2-Person Families | 289 (76.7%) | $113,086 |
| 3-Person Families | 51 (13.5%) | $216,250 |
| 4-Person Families | 34 (9.0%) | $250,001 |
| 5-Person Families | 0 (0.0%) | $0 |
| 6-Person Families | 3 (0.8%) | $0 |
| 7+ Person Families | 0 (0.0%) | $0 |
| Total | 377 (100.0%) | $114,961 |
Family Income by Number of Earners in Indian Shores
The median family income in Indian Shores is $114,961, with families comprising 3+ earners (21) having the highest median family income of $247,813, while families with 1 earner (108) have the lowest median family income of $89,167, accounting for 5.6% and 28.6% of families, respectively.
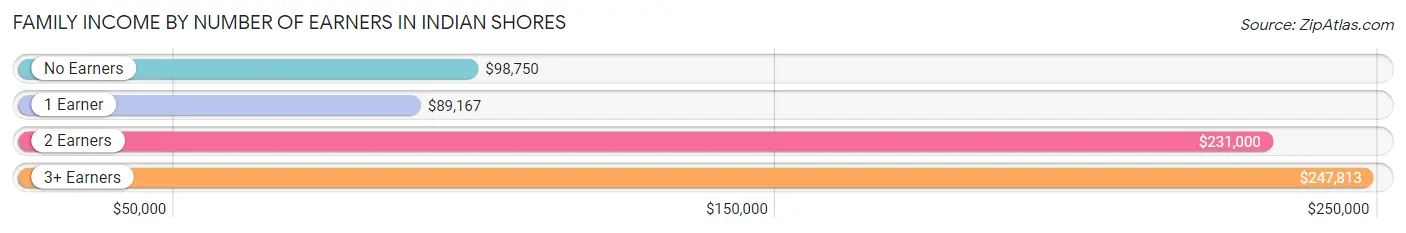
| Number of Earners | # Families | Median Income |
| No Earners | 146 (38.7%) | $98,750 |
| 1 Earner | 108 (28.6%) | $89,167 |
| 2 Earners | 102 (27.1%) | $231,000 |
| 3+ Earners | 21 (5.6%) | $247,813 |
| Total | 377 (100.0%) | $114,961 |
Household Income in Indian Shores
Household Income Brackets in Indian Shores
With 141 households falling in the category, the $100,000 to $149,999 income range is the most frequent in Indian Shores, accounting for 24.2% of all households. In contrast, only 14 households (2.4%) fall into the less than $10,000 income bracket, making it the least populous group.
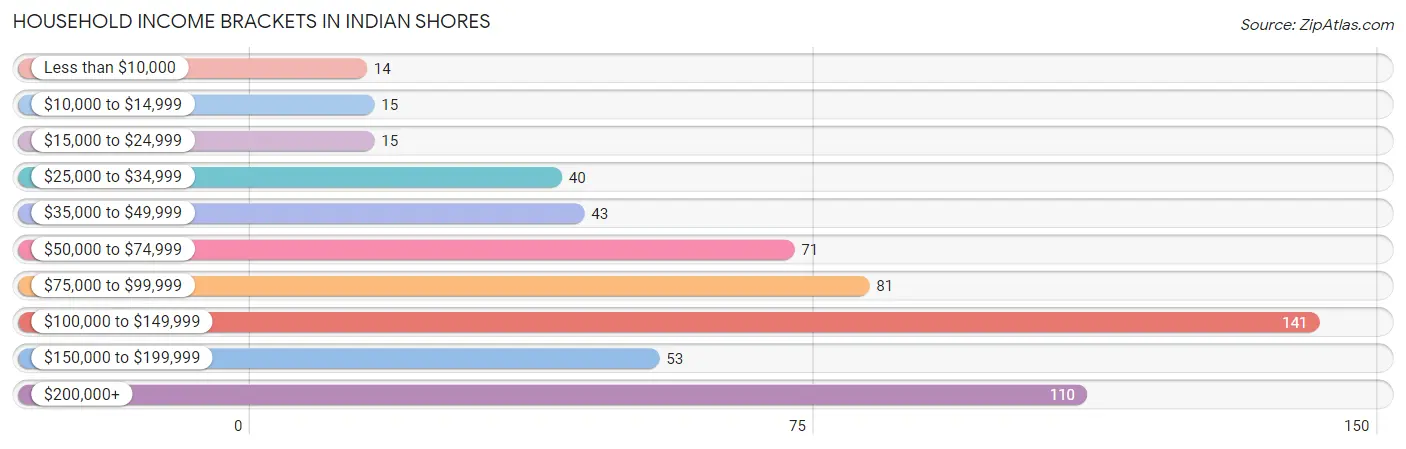
| Income Bracket | # Households | % Households |
| Less than $10,000 | 14 | 2.4% |
| $10,000 to $14,999 | 15 | 2.6% |
| $15,000 to $24,999 | 15 | 2.6% |
| $25,000 to $34,999 | 40 | 6.9% |
| $35,000 to $49,999 | 43 | 7.4% |
| $50,000 to $74,999 | 71 | 12.2% |
| $75,000 to $99,999 | 81 | 13.9% |
| $100,000 to $149,999 | 141 | 24.2% |
| $150,000 to $199,999 | 53 | 9.1% |
| $200,000+ | 110 | 18.9% |
Household Income by Householder Age in Indian Shores
The median household income in Indian Shores is $110,163, with the highest median household income of $128,542 found in the 45 to 64 years age bracket for the primary householder. A total of 269 households (46.1%) fall into this category. Meanwhile, the 15 to 24 years age bracket for the primary householder has the lowest median household income of $0, with 18 households (3.1%) in this group.
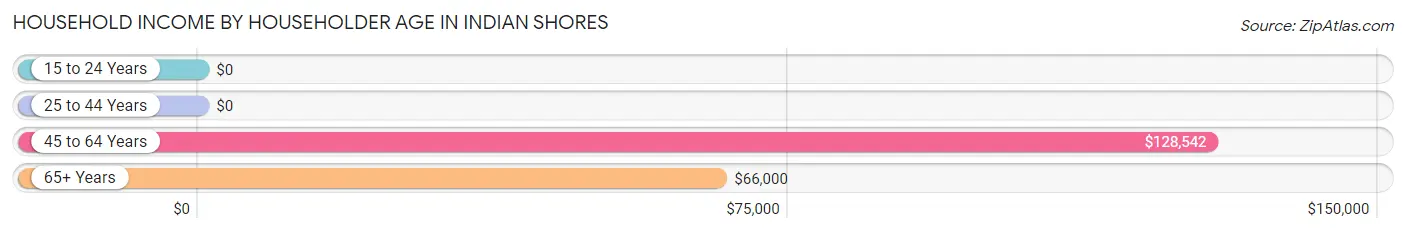
| Income Bracket | # Households | Median Income |
| 15 to 24 Years | 18 (3.1%) | $0 |
| 25 to 44 Years | 12 (2.1%) | $0 |
| 45 to 64 Years | 269 (46.1%) | $128,542 |
| 65+ Years | 284 (48.7%) | $66,000 |
| Total | 583 (100.0%) | $110,163 |
Poverty in Indian Shores
Income Below Poverty by Sex and Age in Indian Shores
With 9.7% poverty level for males and 5.4% for females among the residents of Indian Shores, 6 to 11 year old males and 16 and 17 year old females are the most vulnerable to poverty, with 9 males (56.2%) and 10 females (100.0%) in their respective age groups living below the poverty level.
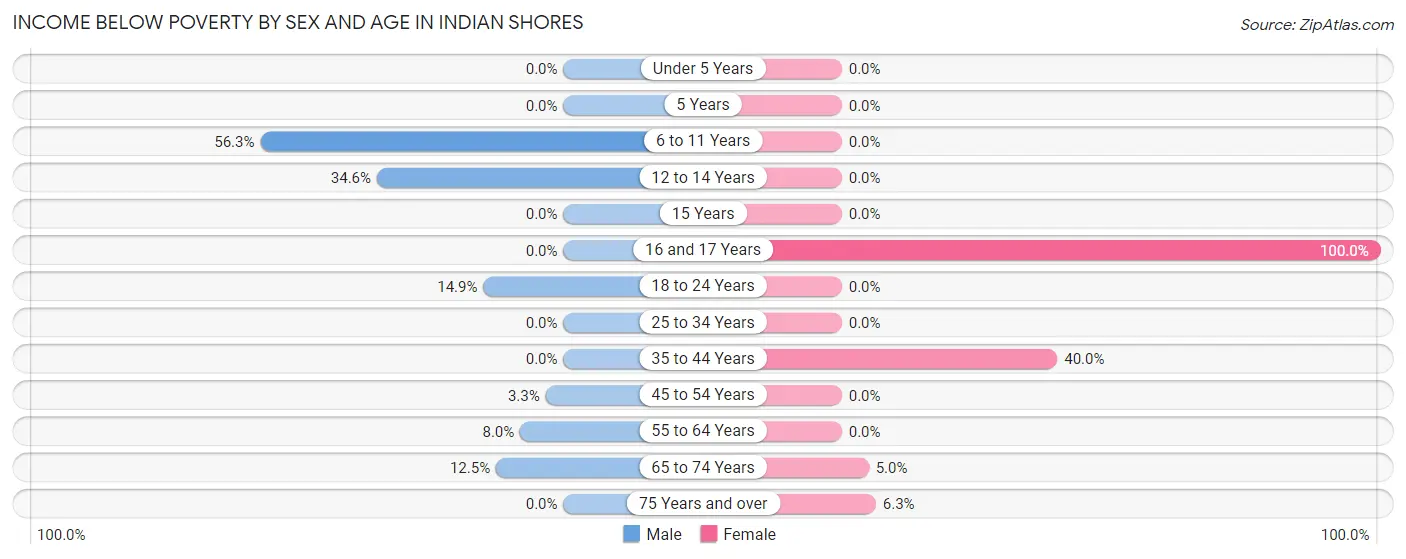
| Age Bracket | Male | Female |
| Under 5 Years | 0 (0.0%) | 0 (0.0%) |
| 5 Years | 0 (0.0%) | 0 (0.0%) |
| 6 to 11 Years | 9 (56.2%) | 0 (0.0%) |
| 12 to 14 Years | 9 (34.6%) | 0 (0.0%) |
| 15 Years | 0 (0.0%) | 0 (0.0%) |
| 16 and 17 Years | 0 (0.0%) | 10 (100.0%) |
| 18 to 24 Years | 11 (14.9%) | 0 (0.0%) |
| 25 to 34 Years | 0 (0.0%) | 0 (0.0%) |
| 35 to 44 Years | 0 (0.0%) | 8 (40.0%) |
| 45 to 54 Years | 3 (3.3%) | 0 (0.0%) |
| 55 to 64 Years | 11 (8.0%) | 0 (0.0%) |
| 65 to 74 Years | 14 (12.5%) | 8 (5.0%) |
| 75 Years and over | 0 (0.0%) | 6 (6.3%) |
| Total | 57 (9.7%) | 32 (5.4%) |
Income Above Poverty by Sex and Age in Indian Shores
According to the poverty statistics in Indian Shores, males aged under 5 years and females aged 6 to 11 years are the age groups that are most secure financially, with 100.0% of males and 100.0% of females in these age groups living above the poverty line.
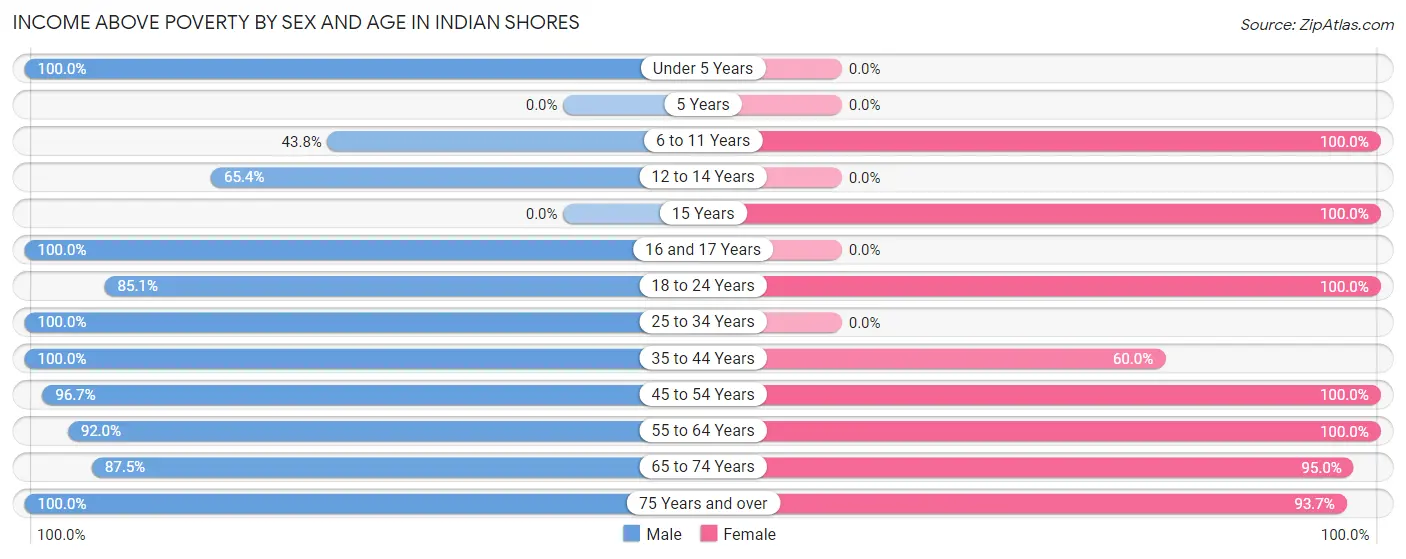
| Age Bracket | Male | Female |
| Under 5 Years | 9 (100.0%) | 0 (0.0%) |
| 5 Years | 0 (0.0%) | 0 (0.0%) |
| 6 to 11 Years | 7 (43.8%) | 6 (100.0%) |
| 12 to 14 Years | 17 (65.4%) | 0 (0.0%) |
| 15 Years | 0 (0.0%) | 7 (100.0%) |
| 16 and 17 Years | 4 (100.0%) | 0 (0.0%) |
| 18 to 24 Years | 63 (85.1%) | 59 (100.0%) |
| 25 to 34 Years | 11 (100.0%) | 0 (0.0%) |
| 35 to 44 Years | 6 (100.0%) | 12 (60.0%) |
| 45 to 54 Years | 88 (96.7%) | 114 (100.0%) |
| 55 to 64 Years | 126 (92.0%) | 123 (100.0%) |
| 65 to 74 Years | 98 (87.5%) | 152 (95.0%) |
| 75 Years and over | 102 (100.0%) | 89 (93.7%) |
| Total | 531 (90.3%) | 562 (94.6%) |
Income Below Poverty Among Married-Couple Families in Indian Shores
The poverty statistics for married-couple families in Indian Shores show that 3.3% or 12 of the total 364 families live below the poverty line. Families with 3 or 4 children have the highest poverty rate of 100.0%, comprising of 3 families. On the other hand, families with 1 or 2 children have the lowest poverty rate of 0.0%, which includes 0 families.
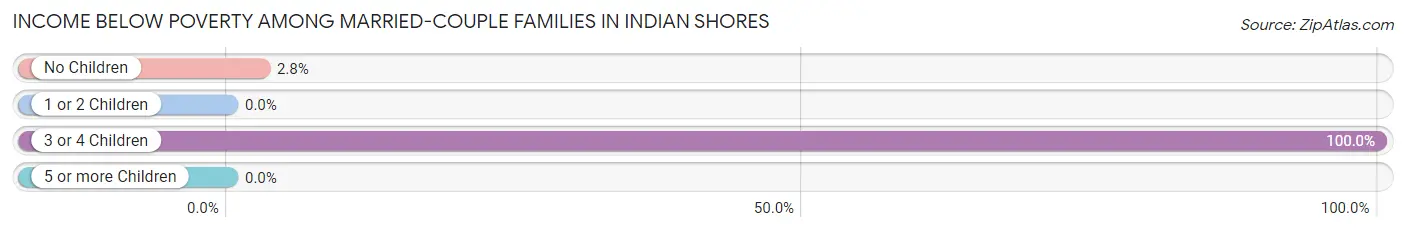
| Children | Above Poverty | Below Poverty |
| No Children | 315 (97.2%) | 9 (2.8%) |
| 1 or 2 Children | 37 (100.0%) | 0 (0.0%) |
| 3 or 4 Children | 0 (0.0%) | 3 (100.0%) |
| 5 or more Children | 0 (0.0%) | 0 (0.0%) |
| Total | 352 (96.7%) | 12 (3.3%) |
Income Below Poverty Among Single-Parent Households in Indian Shores
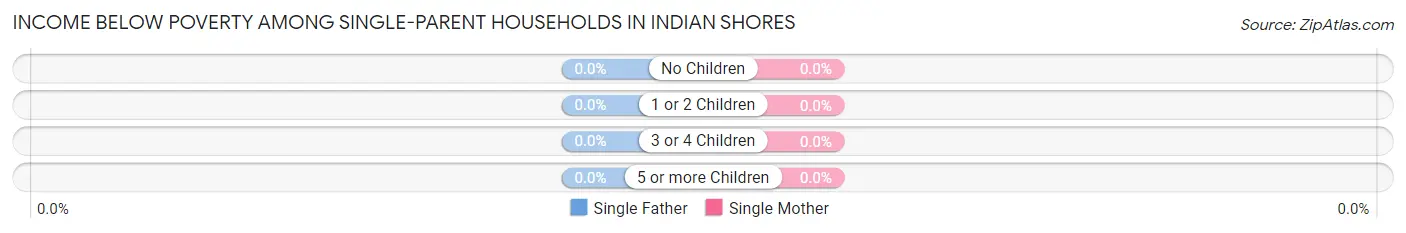
| Children | Single Father | Single Mother |
| No Children | 0 (0.0%) | 0 (0.0%) |
| 1 or 2 Children | 0 (0.0%) | 0 (0.0%) |
| 3 or 4 Children | 0 (0.0%) | 0 (0.0%) |
| 5 or more Children | 0 (0.0%) | 0 (0.0%) |
| Total | 0 (0.0%) | 0 (0.0%) |
Income Below Poverty Among Married-Couple vs Single-Parent Households in Indian Shores
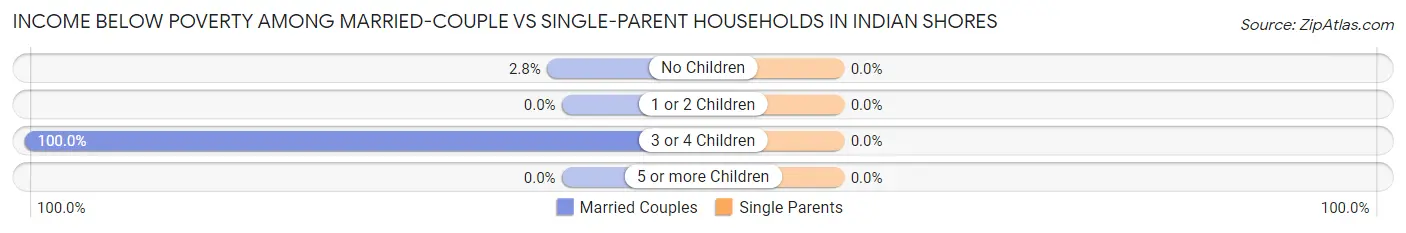
| Children | Married-Couple Families | Single-Parent Households |
| No Children | 9 (2.8%) | 0 (0.0%) |
| 1 or 2 Children | 0 (0.0%) | 0 (0.0%) |
| 3 or 4 Children | 3 (100.0%) | 0 (0.0%) |
| 5 or more Children | 0 (0.0%) | 0 (0.0%) |
| Total | 12 (3.3%) | 0 (0.0%) |
Race in Indian Shores
The most populous races in Indian Shores are White / Caucasian (1,054 | 89.2%), Asian (76 | 6.4%), and Hispanic or Latino (73 | 6.2%).
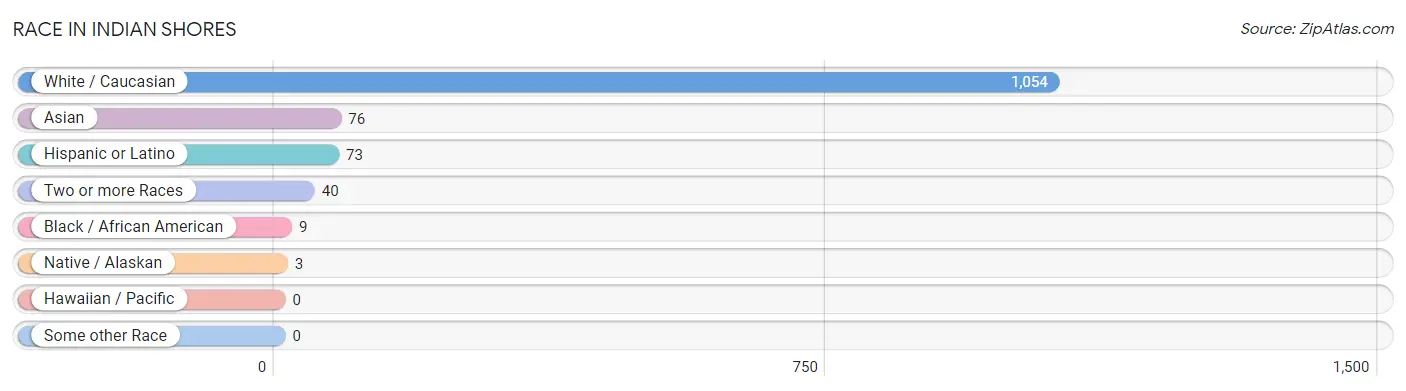
| Race | # Population | % Population |
| Asian | 76 | 6.4% |
| Black / African American | 9 | 0.8% |
| Hawaiian / Pacific | 0 | 0.0% |
| Hispanic or Latino | 73 | 6.2% |
| Native / Alaskan | 3 | 0.3% |
| White / Caucasian | 1,054 | 89.2% |
| Two or more Races | 40 | 3.4% |
| Some other Race | 0 | 0.0% |
| Total | 1,182 | 100.0% |
Ancestry in Indian Shores
The most populous ancestries reported in Indian Shores are German (241 | 20.4%), Irish (169 | 14.3%), Italian (101 | 8.5%), English (95 | 8.0%), and American (82 | 6.9%), together accounting for 58.2% of all Indian Shores residents.
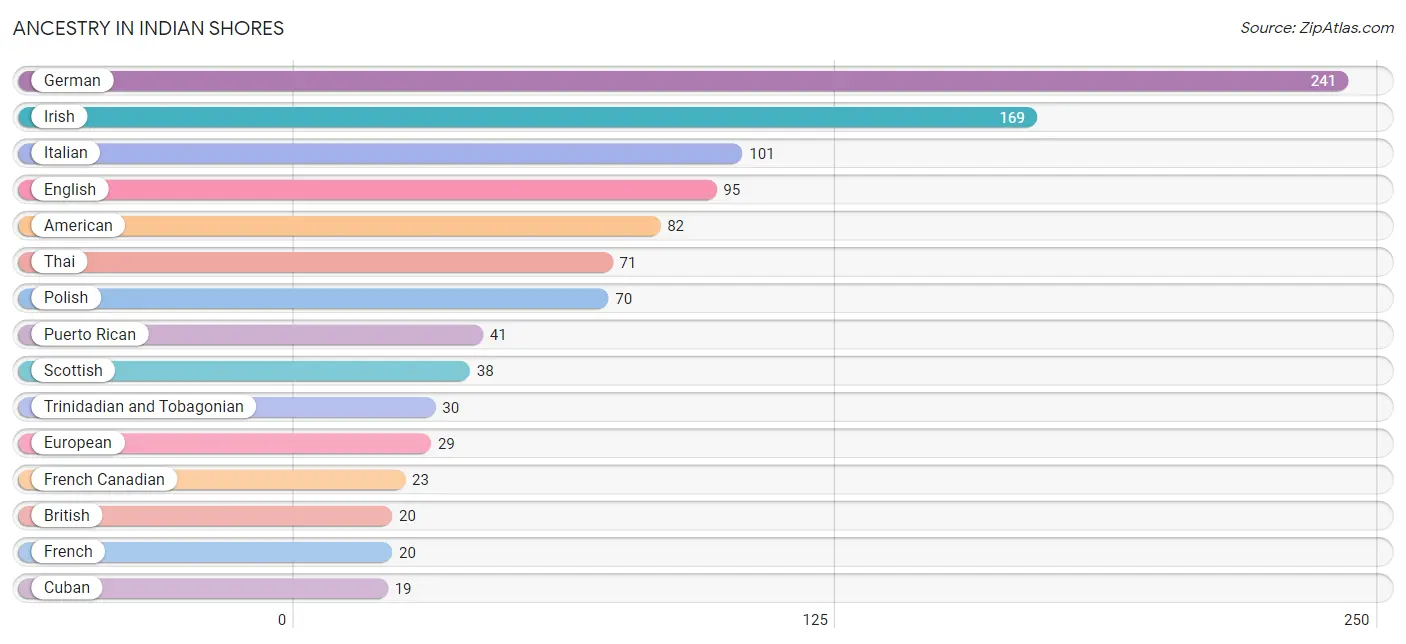
| Ancestry | # Population | % Population |
| American | 82 | 6.9% |
| Austrian | 18 | 1.5% |
| British | 20 | 1.7% |
| Canadian | 17 | 1.4% |
| Cherokee | 3 | 0.3% |
| Cuban | 19 | 1.6% |
| Czech | 5 | 0.4% |
| Danish | 6 | 0.5% |
| Eastern European | 12 | 1.0% |
| English | 95 | 8.0% |
| European | 29 | 2.5% |
| Finnish | 5 | 0.4% |
| French | 20 | 1.7% |
| French Canadian | 23 | 1.9% |
| German | 241 | 20.4% |
| Greek | 9 | 0.8% |
| Hungarian | 12 | 1.0% |
| Irish | 169 | 14.3% |
| Italian | 101 | 8.5% |
| Lithuanian | 5 | 0.4% |
| Norwegian | 6 | 0.5% |
| Polish | 70 | 5.9% |
| Puerto Rican | 41 | 3.5% |
| Russian | 6 | 0.5% |
| Scandinavian | 4 | 0.3% |
| Scotch-Irish | 6 | 0.5% |
| Scottish | 38 | 3.2% |
| Slavic | 5 | 0.4% |
| South American | 7 | 0.6% |
| Spanish | 6 | 0.5% |
| Sri Lankan | 5 | 0.4% |
| Swedish | 5 | 0.4% |
| Thai | 71 | 6.0% |
| Trinidadian and Tobagonian | 30 | 2.5% |
| Ukrainian | 5 | 0.4% |
| Venezuelan | 7 | 0.6% |
| Welsh | 6 | 0.5% |
| West Indian | 15 | 1.3% | View All 38 Rows |
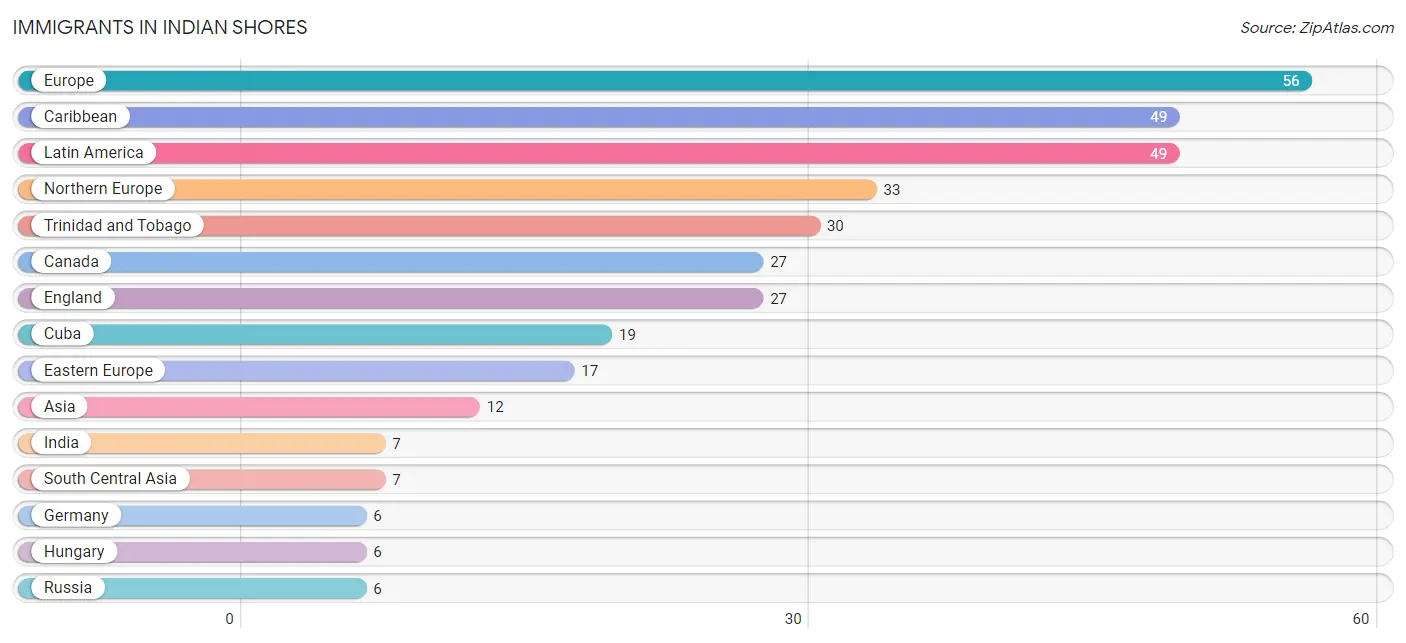
Immigrants in Indian Shores
The most numerous immigrant groups reported in Indian Shores came from Europe (56 | 4.7%), Caribbean (49 | 4.2%), Latin America (49 | 4.2%), Northern Europe (33 | 2.8%), and Trinidad and Tobago (30 | 2.5%), together accounting for 18.4% of all Indian Shores residents.
| Immigration Origin | # Population | % Population |
| Asia | 12 | 1.0% |
| Canada | 27 | 2.3% |
| Caribbean | 49 | 4.2% |
| Cuba | 19 | 1.6% |
| Eastern Europe | 17 | 1.4% |
| England | 27 | 2.3% |
| Europe | 56 | 4.7% |
| Germany | 6 | 0.5% |
| Hungary | 6 | 0.5% |
| India | 7 | 0.6% |
| Latin America | 49 | 4.2% |
| Northern Europe | 33 | 2.8% |
| Poland | 5 | 0.4% |
| Russia | 6 | 0.5% |
| South Central Asia | 7 | 0.6% |
| South Eastern Asia | 5 | 0.4% |
| Trinidad and Tobago | 30 | 2.5% |
| Vietnam | 5 | 0.4% |
| Western Europe | 6 | 0.5% | View All 19 Rows |
Sex and Age in Indian Shores
Sex and Age in Indian Shores
The most populous age groups in Indian Shores are 75 to 79 Years (84 | 14.3%) for men and 65 to 69 Years (95 | 16.0%) for women.
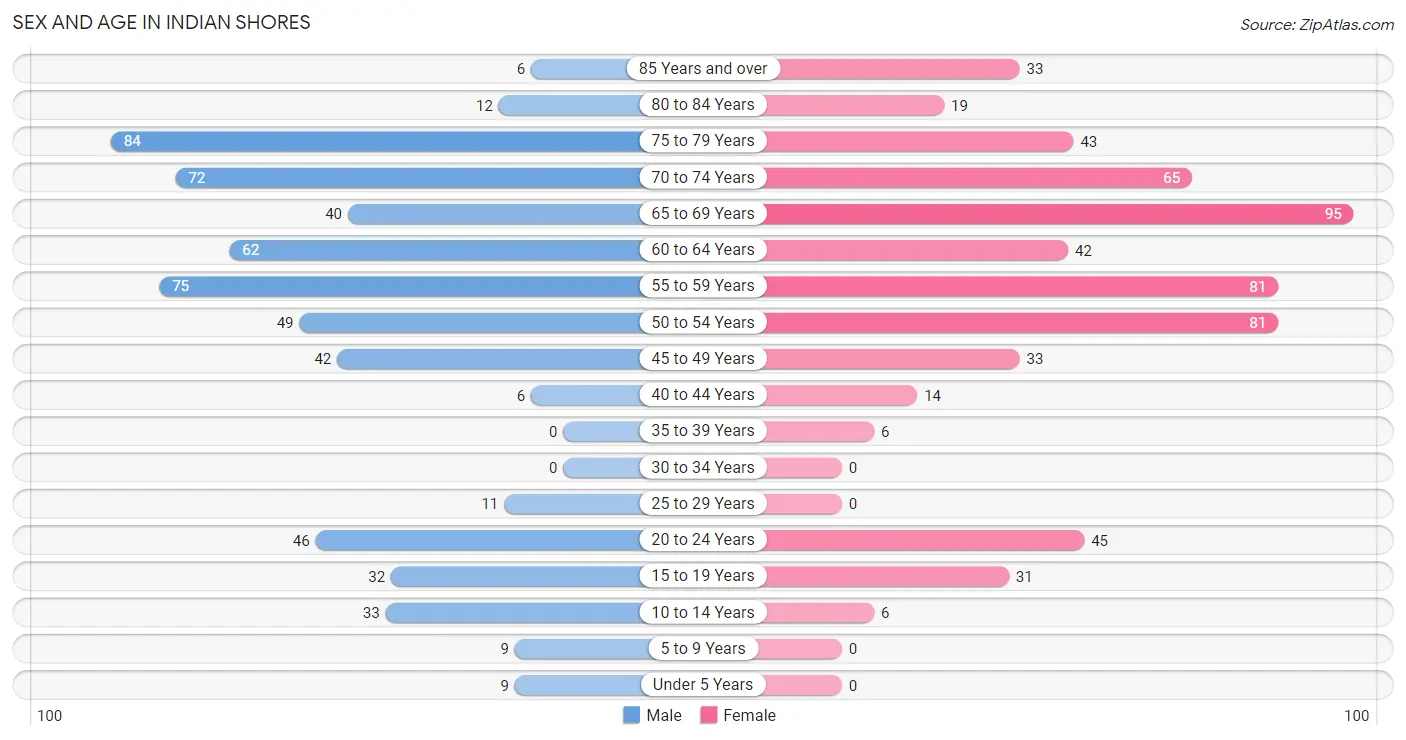
| Age Bracket | Male | Female |
| Under 5 Years | 9 (1.5%) | 0 (0.0%) |
| 5 to 9 Years | 9 (1.5%) | 0 (0.0%) |
| 10 to 14 Years | 33 (5.6%) | 6 (1.0%) |
| 15 to 19 Years | 32 (5.4%) | 31 (5.2%) |
| 20 to 24 Years | 46 (7.8%) | 45 (7.6%) |
| 25 to 29 Years | 11 (1.9%) | 0 (0.0%) |
| 30 to 34 Years | 0 (0.0%) | 0 (0.0%) |
| 35 to 39 Years | 0 (0.0%) | 6 (1.0%) |
| 40 to 44 Years | 6 (1.0%) | 14 (2.4%) |
| 45 to 49 Years | 42 (7.1%) | 33 (5.6%) |
| 50 to 54 Years | 49 (8.3%) | 81 (13.6%) |
| 55 to 59 Years | 75 (12.8%) | 81 (13.6%) |
| 60 to 64 Years | 62 (10.5%) | 42 (7.1%) |
| 65 to 69 Years | 40 (6.8%) | 95 (16.0%) |
| 70 to 74 Years | 72 (12.2%) | 65 (10.9%) |
| 75 to 79 Years | 84 (14.3%) | 43 (7.2%) |
| 80 to 84 Years | 12 (2.0%) | 19 (3.2%) |
| 85 Years and over | 6 (1.0%) | 33 (5.6%) |
| Total | 588 (100.0%) | 594 (100.0%) |
Families and Households in Indian Shores
Median Family Size in Indian Shores
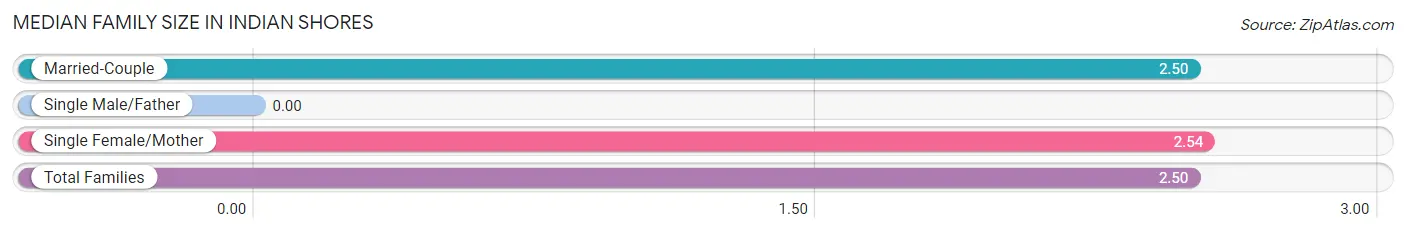
| Family Type | # Families | Family Size |
| Married-Couple | 364 (96.6%) | 2.50 |
| Single Male/Father | 0 (0.0%) | - |
| Single Female/Mother | 13 (3.5%) | 2.54 |
| Total Families | 377 (100.0%) | 2.50 |
Median Household Size in Indian Shores
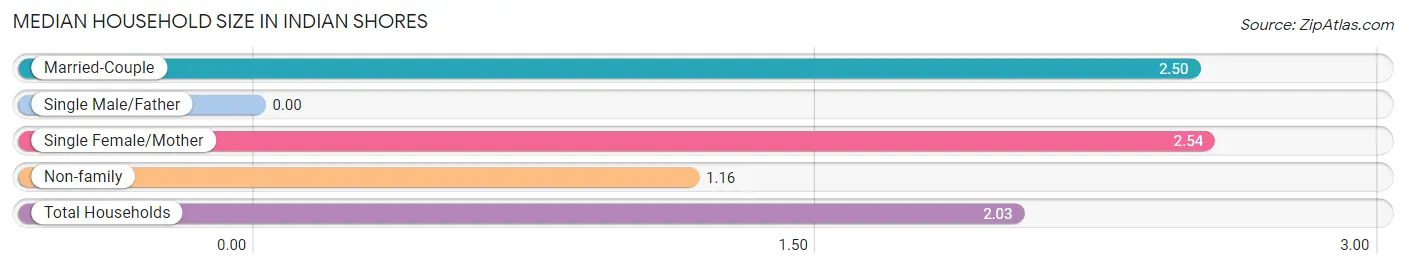
| Household Type | # Households | Household Size |
| Married-Couple | 364 (62.4%) | 2.50 |
| Single Male/Father | 0 (0.0%) | - |
| Single Female/Mother | 13 (2.2%) | 2.54 |
| Non-family | 206 (35.3%) | 1.16 |
| Total Households | 583 (100.0%) | 2.03 |
Household Size by Marriage Status in Indian Shores
Out of a total of 583 households in Indian Shores, 377 (64.7%) are family households, while 206 (35.3%) are nonfamily households. The most numerous type of family households are 2-person households, comprising 289, and the most common type of nonfamily households are 1-person households, comprising 183.
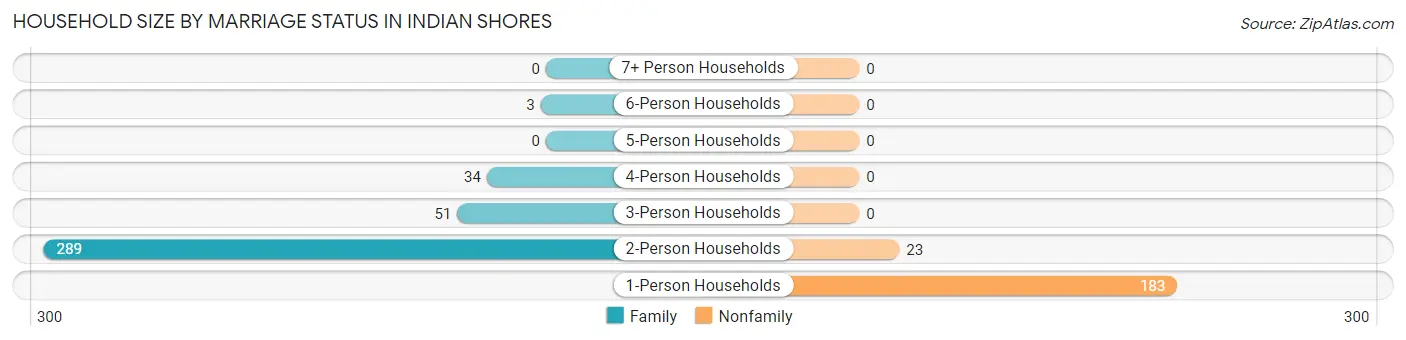
| Household Size | Family Households | Nonfamily Households |
| 1-Person Households | - | 183 (31.4%) |
| 2-Person Households | 289 (49.6%) | 23 (4.0%) |
| 3-Person Households | 51 (8.7%) | 0 (0.0%) |
| 4-Person Households | 34 (5.8%) | 0 (0.0%) |
| 5-Person Households | 0 (0.0%) | 0 (0.0%) |
| 6-Person Households | 3 (0.5%) | 0 (0.0%) |
| 7+ Person Households | 0 (0.0%) | 0 (0.0%) |
| Total | 377 (64.7%) | 206 (35.3%) |
Female Fertility in Indian Shores
Fertility by Age in Indian Shores
| Age Bracket | Women with Births | Births / 1,000 Women |
| 15 to 19 years | 0 (0.0%) | 0.0 |
| 20 to 34 years | 0 (0.0%) | 0.0 |
| 35 to 50 years | 0 (0.0%) | 0.0 |
| Total | 0 (0.0%) | 0.0 |
Fertility by Age by Marriage Status in Indian Shores
| Age Bracket | Married | Unmarried |
| 15 to 19 years | 0 (0.0%) | 0 (0.0%) |
| 20 to 34 years | 0 (0.0%) | 0 (0.0%) |
| 35 to 50 years | 0 (0.0%) | 0 (0.0%) |
| Total | 0 (0.0%) | 0 (0.0%) |
Fertility by Education in Indian Shores
| Educational Attainment | Women with Births | Births / 1,000 Women |
| Less than High School | 0 (0.0%) | 0.0 |
| High School Diploma | 0 (0.0%) | 0.0 |
| College or Associate's Degree | 0 (0.0%) | 0.0 |
| Bachelor's Degree | 0 (0.0%) | 0.0 |
| Graduate Degree | 0 (0.0%) | 0.0 |
| Total | 0 (0.0%) | 0.0 |
Fertility by Education by Marriage Status in Indian Shores
| Educational Attainment | Married | Unmarried |
| Less than High School | 0 (0.0%) | 0 (0.0%) |
| High School Diploma | 0 (0.0%) | 0 (0.0%) |
| College or Associate's Degree | 0 (0.0%) | 0 (0.0%) |
| Bachelor's Degree | 0 (0.0%) | 0 (0.0%) |
| Graduate Degree | 0 (0.0%) | 0 (0.0%) |
| Total | 0 (0.0%) | 0 (0.0%) |
Employment Characteristics in Indian Shores
Employment by Class of Employer in Indian Shores
Among the 494 employed individuals in Indian Shores, private company employees (308 | 62.4%), not-for-profit organizations (45 | 9.1%), and self-employed (not incorporated) (40 | 8.1%) make up the most common classes of employment.
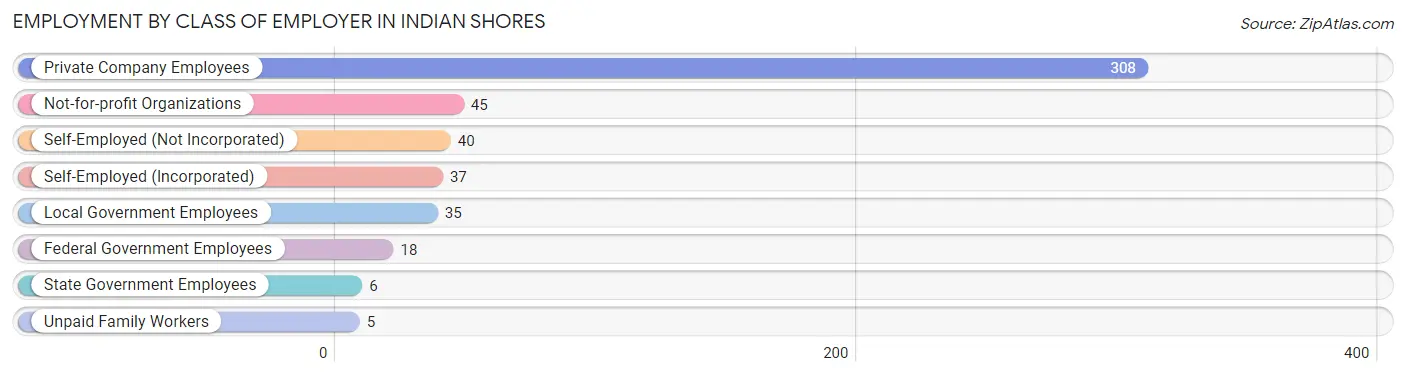
| Employer Class | # Employees | % Employees |
| Private Company Employees | 308 | 62.4% |
| Self-Employed (Incorporated) | 37 | 7.5% |
| Self-Employed (Not Incorporated) | 40 | 8.1% |
| Not-for-profit Organizations | 45 | 9.1% |
| Local Government Employees | 35 | 7.1% |
| State Government Employees | 6 | 1.2% |
| Federal Government Employees | 18 | 3.6% |
| Unpaid Family Workers | 5 | 1.0% |
| Total | 494 | 100.0% |
Employment Status by Age in Indian Shores
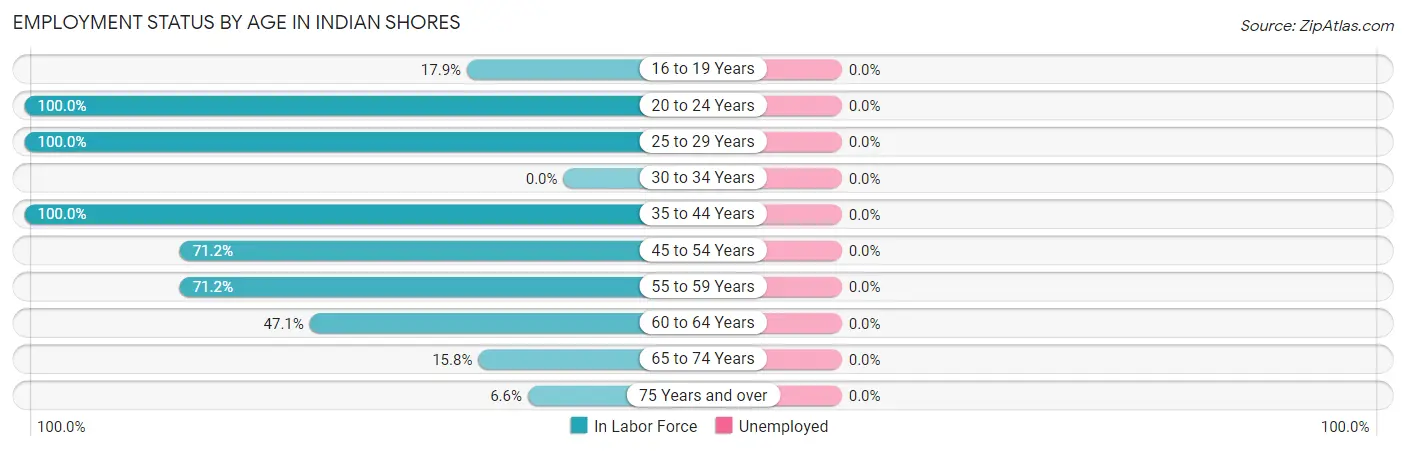
| Age Bracket | In Labor Force | Unemployed |
| 16 to 19 Years | 10 (17.9%) | 0 (0.0%) |
| 20 to 24 Years | 91 (100.0%) | 0 (0.0%) |
| 25 to 29 Years | 11 (100.0%) | 0 (0.0%) |
| 30 to 34 Years | 0 (0.0%) | 0 (0.0%) |
| 35 to 44 Years | 26 (100.0%) | 0 (0.0%) |
| 45 to 54 Years | 146 (71.2%) | 0 (0.0%) |
| 55 to 59 Years | 111 (71.2%) | 0 (0.0%) |
| 60 to 64 Years | 49 (47.1%) | 0 (0.0%) |
| 65 to 74 Years | 43 (15.8%) | 0 (0.0%) |
| 75 Years and over | 13 (6.6%) | 0 (0.0%) |
| Total | 500 (44.7%) | 0 (0.0%) |
Employment Status by Educational Attainment in Indian Shores
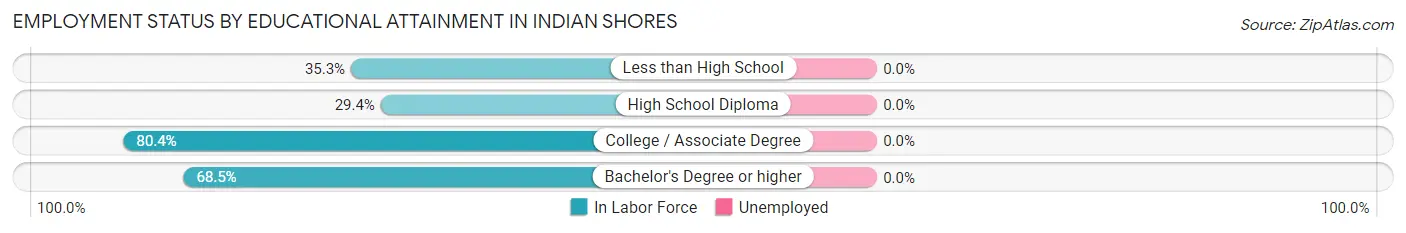
| Educational Attainment | In Labor Force | Unemployed |
| Less than High School | 6 (35.3%) | 0 (0.0%) |
| High School Diploma | 10 (29.4%) | 0 (0.0%) |
| College / Associate Degree | 123 (80.4%) | 0 (0.0%) |
| Bachelor's Degree or higher | 204 (68.5%) | 0 (0.0%) |
| Total | 343 (68.3%) | 0 (0.0%) |
Employment Occupations by Sex in Indian Shores
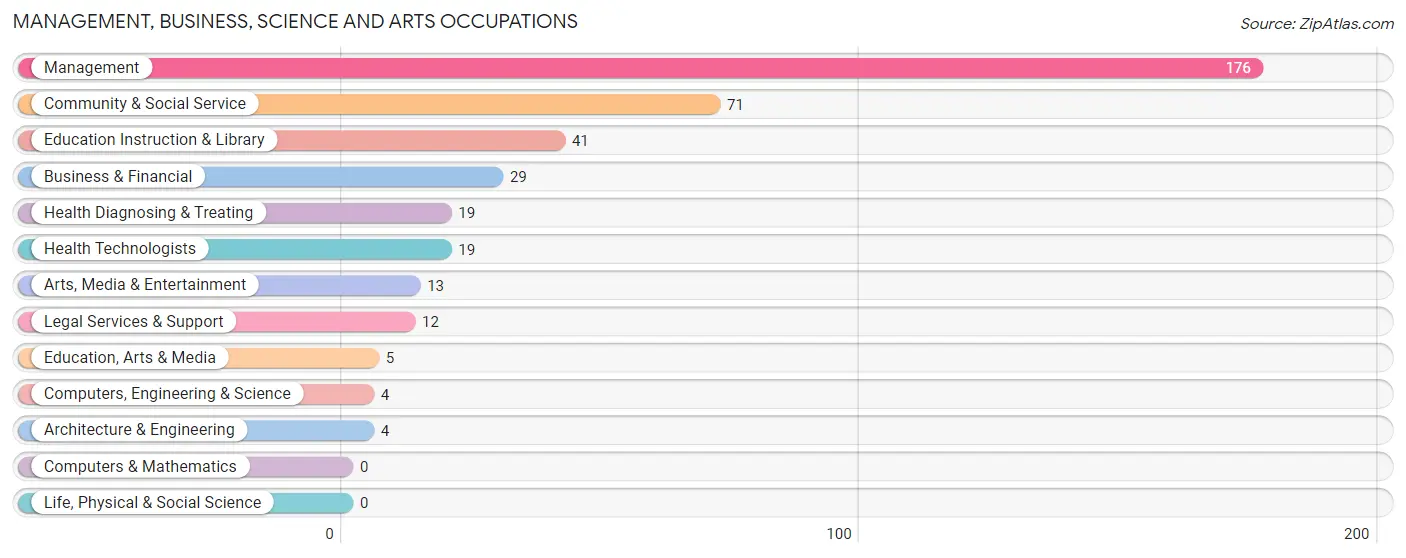
Management, Business, Science and Arts Occupations
The most common Management, Business, Science and Arts occupations in Indian Shores are Management (176 | 35.2%), Community & Social Service (71 | 14.2%), Education Instruction & Library (41 | 8.2%), Business & Financial (29 | 5.8%), and Health Diagnosing & Treating (19 | 3.8%).
Management, Business, Science and Arts Occupations by Sex
Within the Management, Business, Science and Arts occupations in Indian Shores, the most male-oriented occupations are Computers, Engineering & Science (100.0%), Architecture & Engineering (100.0%), and Education, Arts & Media (100.0%), while the most female-oriented occupations are Education Instruction & Library (100.0%), Community & Social Service (57.8%), and Management (47.2%).
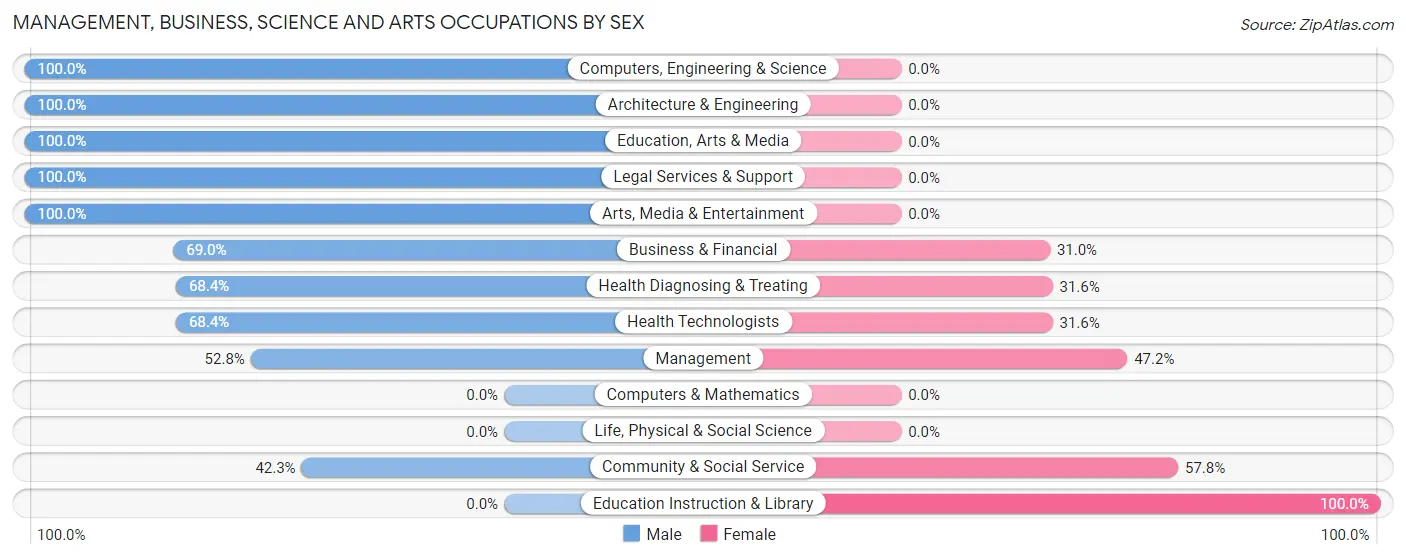
| Occupation | Male | Female |
| Management | 93 (52.8%) | 83 (47.2%) |
| Business & Financial | 20 (69.0%) | 9 (31.0%) |
| Computers, Engineering & Science | 4 (100.0%) | 0 (0.0%) |
| Computers & Mathematics | 0 (0.0%) | 0 (0.0%) |
| Architecture & Engineering | 4 (100.0%) | 0 (0.0%) |
| Life, Physical & Social Science | 0 (0.0%) | 0 (0.0%) |
| Community & Social Service | 30 (42.2%) | 41 (57.8%) |
| Education, Arts & Media | 5 (100.0%) | 0 (0.0%) |
| Legal Services & Support | 12 (100.0%) | 0 (0.0%) |
| Education Instruction & Library | 0 (0.0%) | 41 (100.0%) |
| Arts, Media & Entertainment | 13 (100.0%) | 0 (0.0%) |
| Health Diagnosing & Treating | 13 (68.4%) | 6 (31.6%) |
| Health Technologists | 13 (68.4%) | 6 (31.6%) |
| Total (Category) | 160 (53.5%) | 139 (46.5%) |
| Total (Overall) | 270 (54.0%) | 230 (46.0%) |
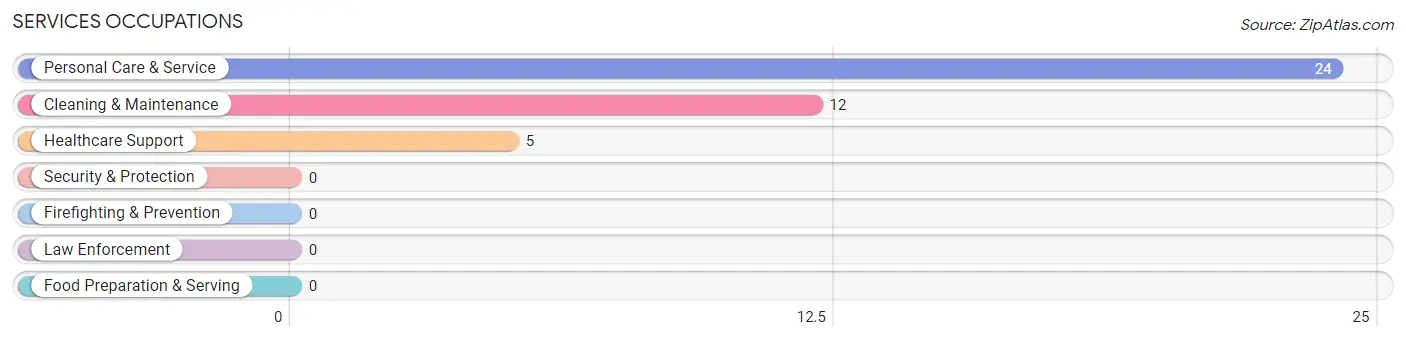
Services Occupations
The most common Services occupations in Indian Shores are Personal Care & Service (24 | 4.8%), Cleaning & Maintenance (12 | 2.4%), and Healthcare Support (5 | 1.0%).
Services Occupations by Sex
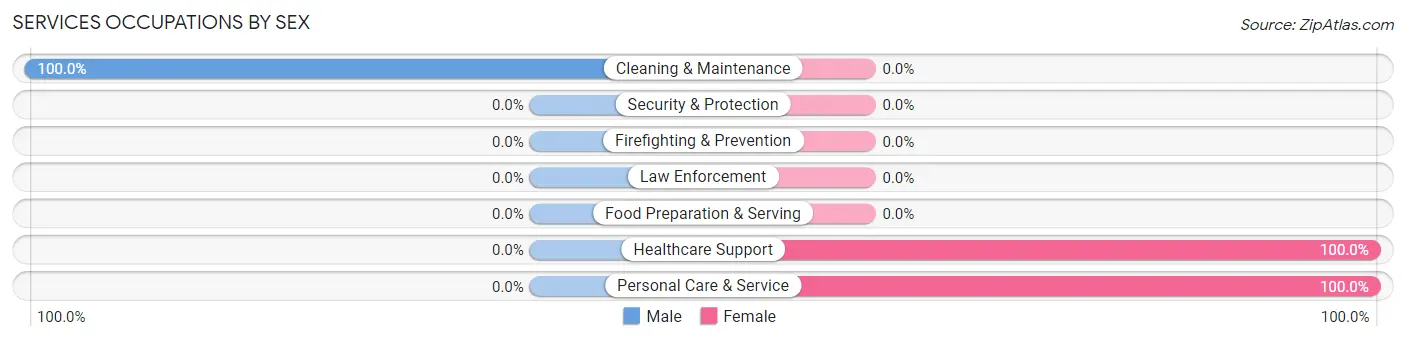
| Occupation | Male | Female |
| Healthcare Support | 0 (0.0%) | 5 (100.0%) |
| Security & Protection | 0 (0.0%) | 0 (0.0%) |
| Firefighting & Prevention | 0 (0.0%) | 0 (0.0%) |
| Law Enforcement | 0 (0.0%) | 0 (0.0%) |
| Food Preparation & Serving | 0 (0.0%) | 0 (0.0%) |
| Cleaning & Maintenance | 12 (100.0%) | 0 (0.0%) |
| Personal Care & Service | 0 (0.0%) | 24 (100.0%) |
| Total (Category) | 12 (29.3%) | 29 (70.7%) |
| Total (Overall) | 270 (54.0%) | 230 (46.0%) |
Sales and Office Occupations
The most common Sales and Office occupations in Indian Shores are Sales & Related (81 | 16.2%), and Office & Administration (50 | 10.0%).
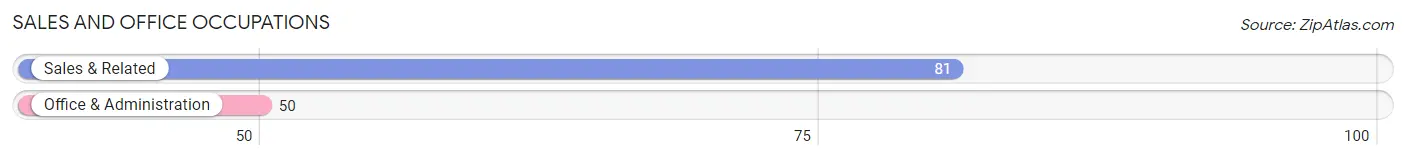
Sales and Office Occupations by Sex
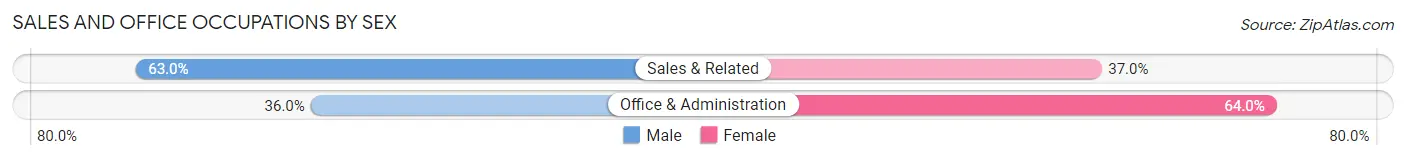
| Occupation | Male | Female |
| Sales & Related | 51 (63.0%) | 30 (37.0%) |
| Office & Administration | 18 (36.0%) | 32 (64.0%) |
| Total (Category) | 69 (52.7%) | 62 (47.3%) |
| Total (Overall) | 270 (54.0%) | 230 (46.0%) |
Natural Resources, Construction and Maintenance Occupations
The most common Natural Resources, Construction and Maintenance occupations in Indian Shores are , and Construction & Extraction (21 | 4.2%).
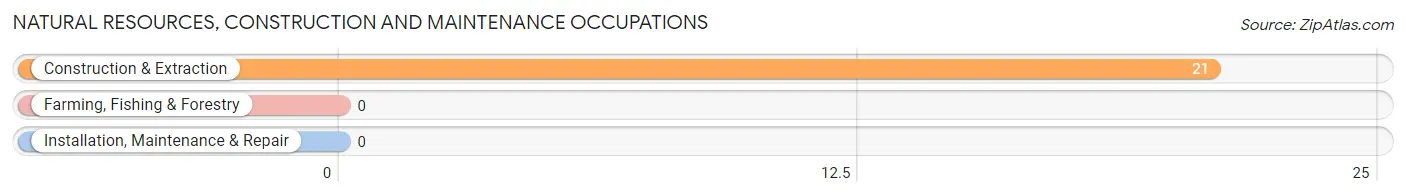
Natural Resources, Construction and Maintenance Occupations by Sex
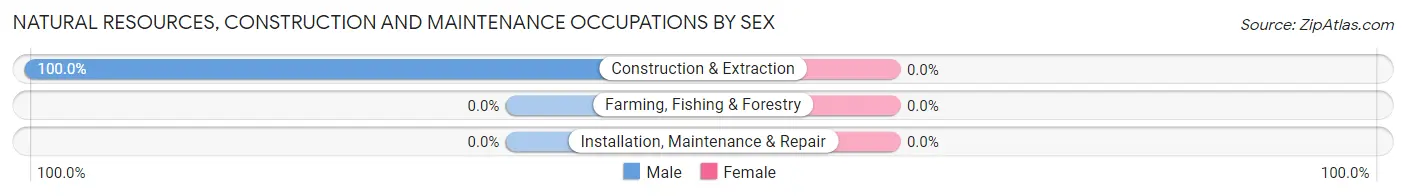
| Occupation | Male | Female |
| Farming, Fishing & Forestry | 0 (0.0%) | 0 (0.0%) |
| Construction & Extraction | 21 (100.0%) | 0 (0.0%) |
| Installation, Maintenance & Repair | 0 (0.0%) | 0 (0.0%) |
| Total (Category) | 21 (100.0%) | 0 (0.0%) |
| Total (Overall) | 270 (54.0%) | 230 (46.0%) |
Production, Transportation and Moving Occupations
The most common Production, Transportation and Moving occupations in Indian Shores are , and Material Moving (8 | 1.6%).
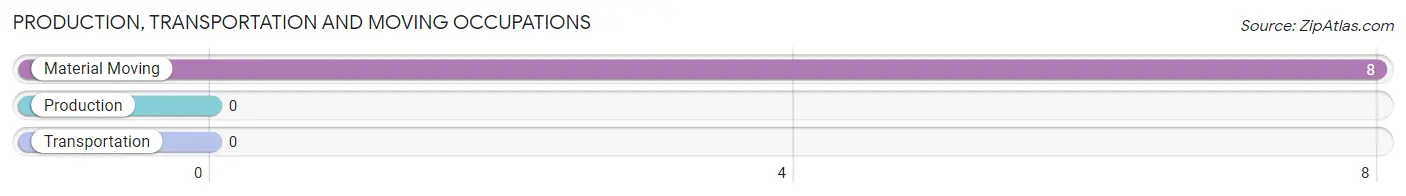
Production, Transportation and Moving Occupations by Sex
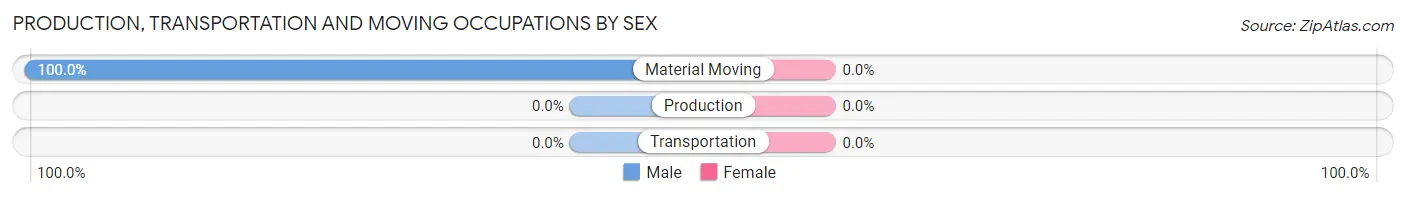
| Occupation | Male | Female |
| Production | 0 (0.0%) | 0 (0.0%) |
| Transportation | 0 (0.0%) | 0 (0.0%) |
| Material Moving | 8 (100.0%) | 0 (0.0%) |
| Total (Category) | 8 (100.0%) | 0 (0.0%) |
| Total (Overall) | 270 (54.0%) | 230 (46.0%) |
Employment Industries by Sex in Indian Shores
Employment Industries in Indian Shores
The major employment industries in Indian Shores include Health Care & Social Assistance (85 | 17.0%), Professional & Scientific (58 | 11.6%), Educational Services (55 | 11.0%), Finance & Insurance (48 | 9.6%), and Construction (35 | 7.0%).
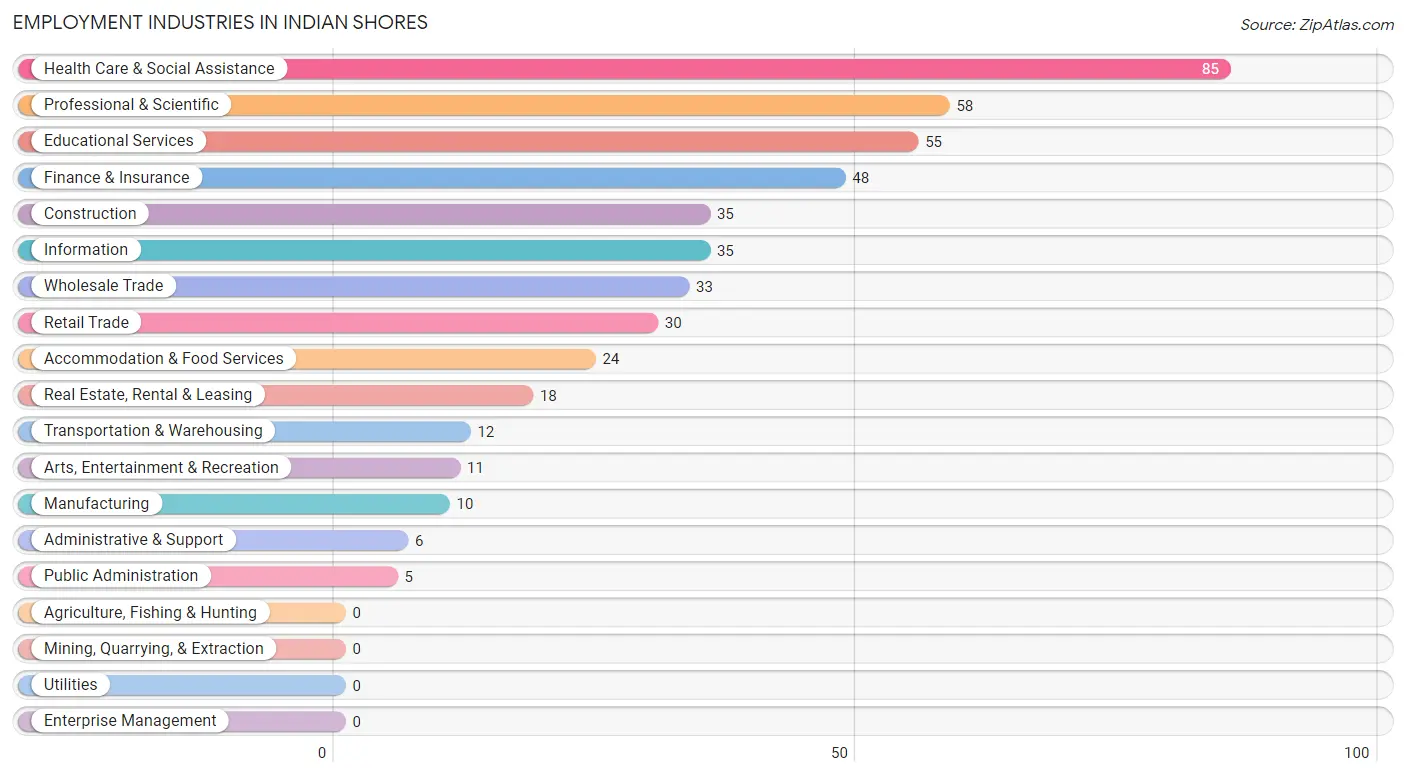
Employment Industries by Sex in Indian Shores
The Indian Shores industries that see more men than women are Construction (100.0%), Transportation & Warehousing (100.0%), and Accommodation & Food Services (100.0%), whereas the industries that tend to have a higher number of women are Administrative & Support (100.0%), Educational Services (87.3%), and Health Care & Social Assistance (60.0%).
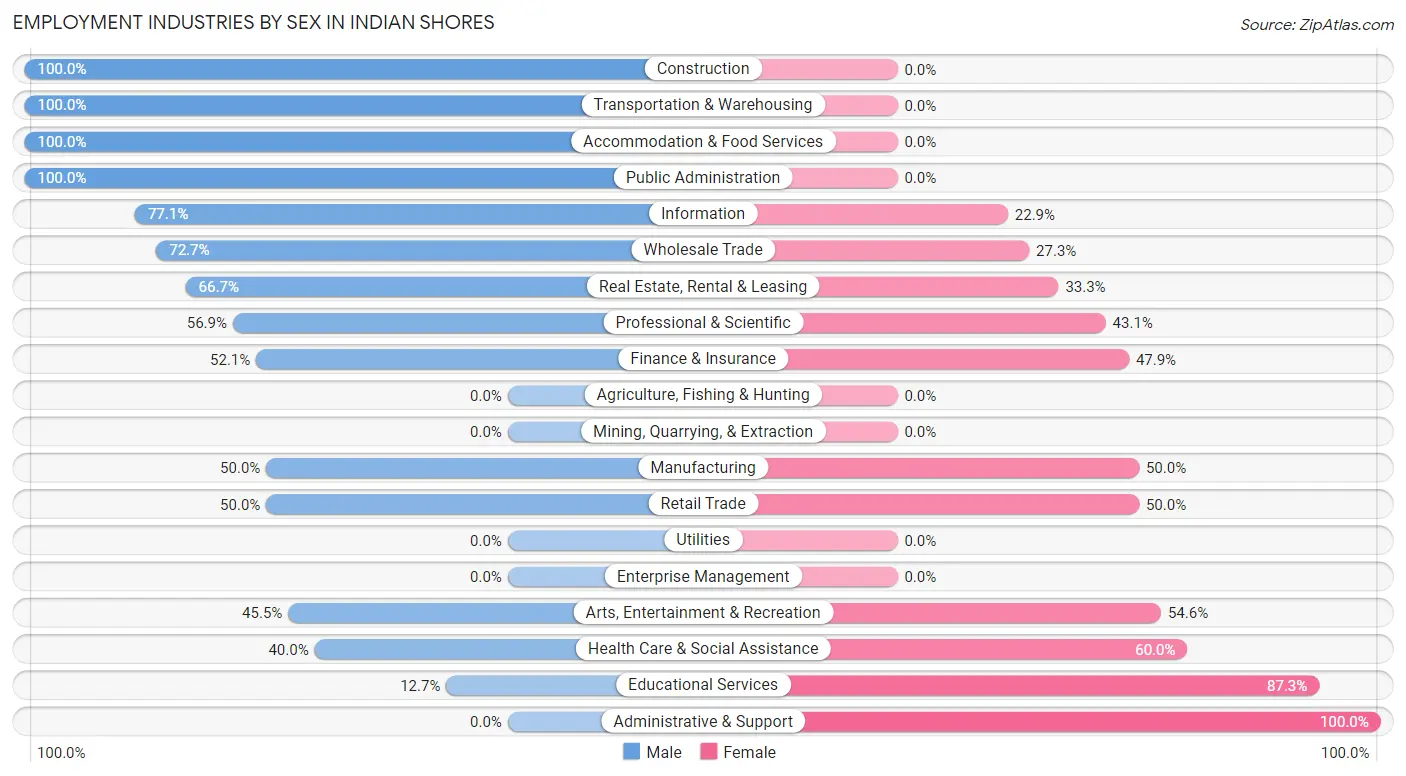
| Industry | Male | Female |
| Agriculture, Fishing & Hunting | 0 (0.0%) | 0 (0.0%) |
| Mining, Quarrying, & Extraction | 0 (0.0%) | 0 (0.0%) |
| Construction | 35 (100.0%) | 0 (0.0%) |
| Manufacturing | 5 (50.0%) | 5 (50.0%) |
| Wholesale Trade | 24 (72.7%) | 9 (27.3%) |
| Retail Trade | 15 (50.0%) | 15 (50.0%) |
| Transportation & Warehousing | 12 (100.0%) | 0 (0.0%) |
| Utilities | 0 (0.0%) | 0 (0.0%) |
| Information | 27 (77.1%) | 8 (22.9%) |
| Finance & Insurance | 25 (52.1%) | 23 (47.9%) |
| Real Estate, Rental & Leasing | 12 (66.7%) | 6 (33.3%) |
| Professional & Scientific | 33 (56.9%) | 25 (43.1%) |
| Enterprise Management | 0 (0.0%) | 0 (0.0%) |
| Administrative & Support | 0 (0.0%) | 6 (100.0%) |
| Educational Services | 7 (12.7%) | 48 (87.3%) |
| Health Care & Social Assistance | 34 (40.0%) | 51 (60.0%) |
| Arts, Entertainment & Recreation | 5 (45.5%) | 6 (54.5%) |
| Accommodation & Food Services | 24 (100.0%) | 0 (0.0%) |
| Public Administration | 5 (100.0%) | 0 (0.0%) |
| Total | 270 (54.0%) | 230 (46.0%) |
Education in Indian Shores
School Enrollment in Indian Shores
The most common levels of schooling among the 159 students in Indian Shores are college / undergraduate (68 | 42.8%), high school (38 | 23.9%), and middle school (32 | 20.1%).
| School Level | # Students | % Students |
| Nursery / Preschool | 0 | 0.0% |
| Kindergarten | 0 | 0.0% |
| Elementary School | 16 | 10.1% |
| Middle School | 32 | 20.1% |
| High School | 38 | 23.9% |
| College / Undergraduate | 68 | 42.8% |
| Graduate / Professional | 5 | 3.1% |
| Total | 159 | 100.0% |
School Enrollment by Age by Funding Source in Indian Shores
Out of a total of 159 students who are enrolled in schools in Indian Shores, 14 (8.8%) attend a private institution, while the remaining 145 (91.2%) are enrolled in public schools. The age group of 15 to 17 year olds has the highest likelihood of being enrolled in private schools, with 7 (33.3% in the age bracket) enrolled. Conversely, the age group of 5 to 9 year old has the lowest likelihood of being enrolled in a private school, with 9 (100.0% in the age bracket) attending a public institution.
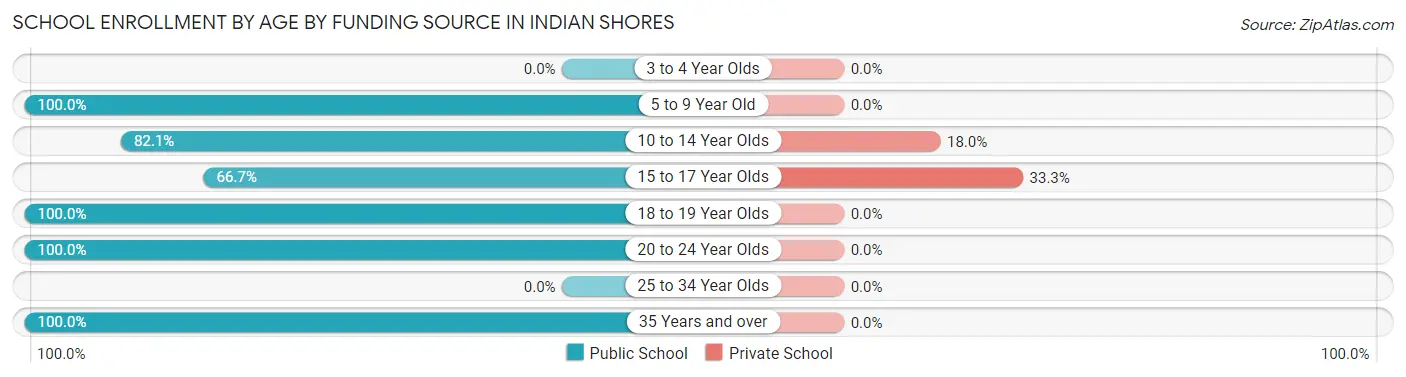
| Age Bracket | Public School | Private School |
| 3 to 4 Year Olds | 0 (0.0%) | 0 (0.0%) |
| 5 to 9 Year Old | 9 (100.0%) | 0 (0.0%) |
| 10 to 14 Year Olds | 32 (82.1%) | 7 (17.9%) |
| 15 to 17 Year Olds | 14 (66.7%) | 7 (33.3%) |
| 18 to 19 Year Olds | 28 (100.0%) | 0 (0.0%) |
| 20 to 24 Year Olds | 57 (100.0%) | 0 (0.0%) |
| 25 to 34 Year Olds | 0 (0.0%) | 0 (0.0%) |
| 35 Years and over | 5 (100.0%) | 0 (0.0%) |
| Total | 145 (91.2%) | 14 (8.8%) |
Educational Attainment by Field of Study in Indian Shores
Business (169 | 31.1%), science & technology (105 | 19.3%), social sciences (61 | 11.2%), education (61 | 11.2%), and psychology (32 | 5.9%) are the most common fields of study among 544 individuals in Indian Shores who have obtained a bachelor's degree or higher.
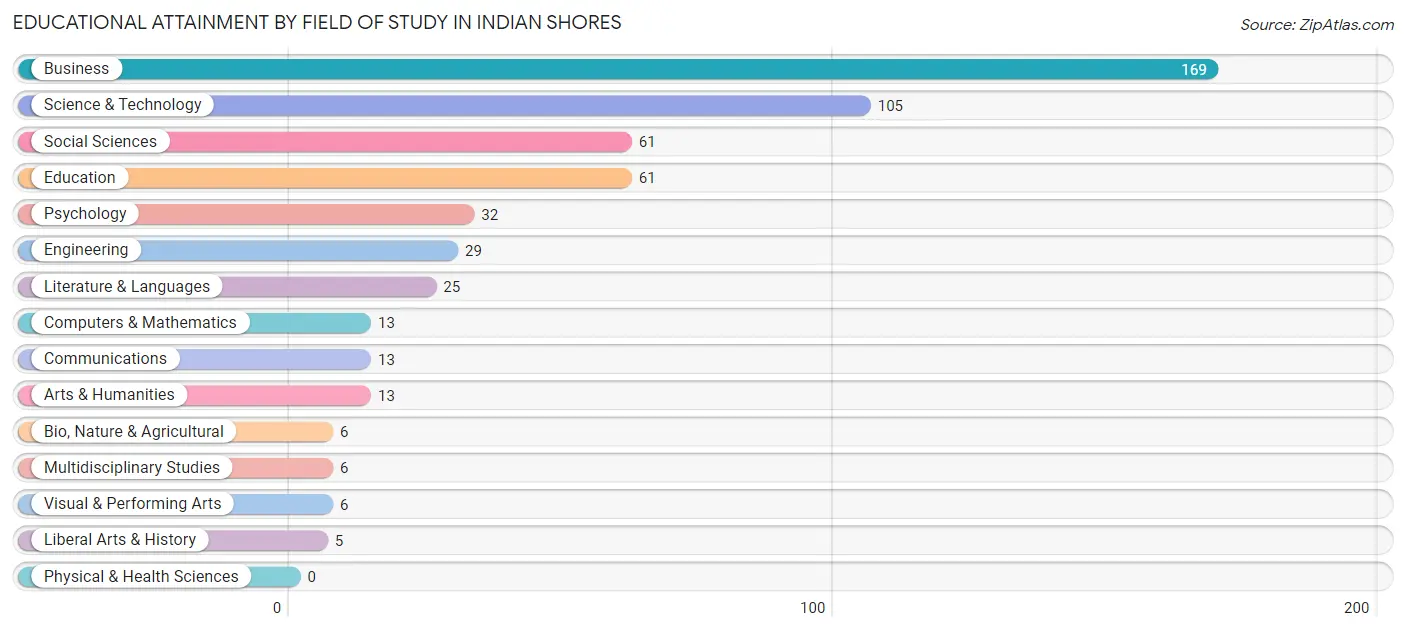
| Field of Study | # Graduates | % Graduates |
| Computers & Mathematics | 13 | 2.4% |
| Bio, Nature & Agricultural | 6 | 1.1% |
| Physical & Health Sciences | 0 | 0.0% |
| Psychology | 32 | 5.9% |
| Social Sciences | 61 | 11.2% |
| Engineering | 29 | 5.3% |
| Multidisciplinary Studies | 6 | 1.1% |
| Science & Technology | 105 | 19.3% |
| Business | 169 | 31.1% |
| Education | 61 | 11.2% |
| Literature & Languages | 25 | 4.6% |
| Liberal Arts & History | 5 | 0.9% |
| Visual & Performing Arts | 6 | 1.1% |
| Communications | 13 | 2.4% |
| Arts & Humanities | 13 | 2.4% |
| Total | 544 | 100.0% |
Transportation & Commute in Indian Shores
Vehicle Availability by Sex in Indian Shores
The most prevalent vehicle ownership categories in Indian Shores are males with 2 vehicles (212, accounting for 78.5%) and females with 2 vehicles (125, making up 94.6%).
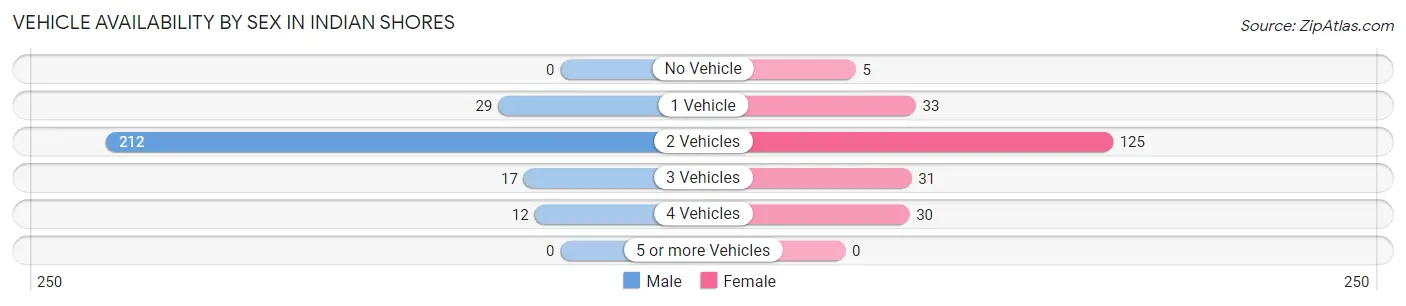
| Vehicles Available | Male | Female |
| No Vehicle | 0 (0.0%) | 5 (2.2%) |
| 1 Vehicle | 29 (10.7%) | 33 (14.7%) |
| 2 Vehicles | 212 (78.5%) | 125 (55.8%) |
| 3 Vehicles | 17 (6.3%) | 31 (13.8%) |
| 4 Vehicles | 12 (4.4%) | 30 (13.4%) |
| 5 or more Vehicles | 0 (0.0%) | 0 (0.0%) |
| Total | 270 (100.0%) | 224 (100.0%) |
Commute Time in Indian Shores
The most frequently occuring commute durations in Indian Shores are 30 to 34 minutes (105 commuters, 26.1%), 15 to 19 minutes (62 commuters, 15.4%), and 45 to 59 minutes (44 commuters, 11.0%).
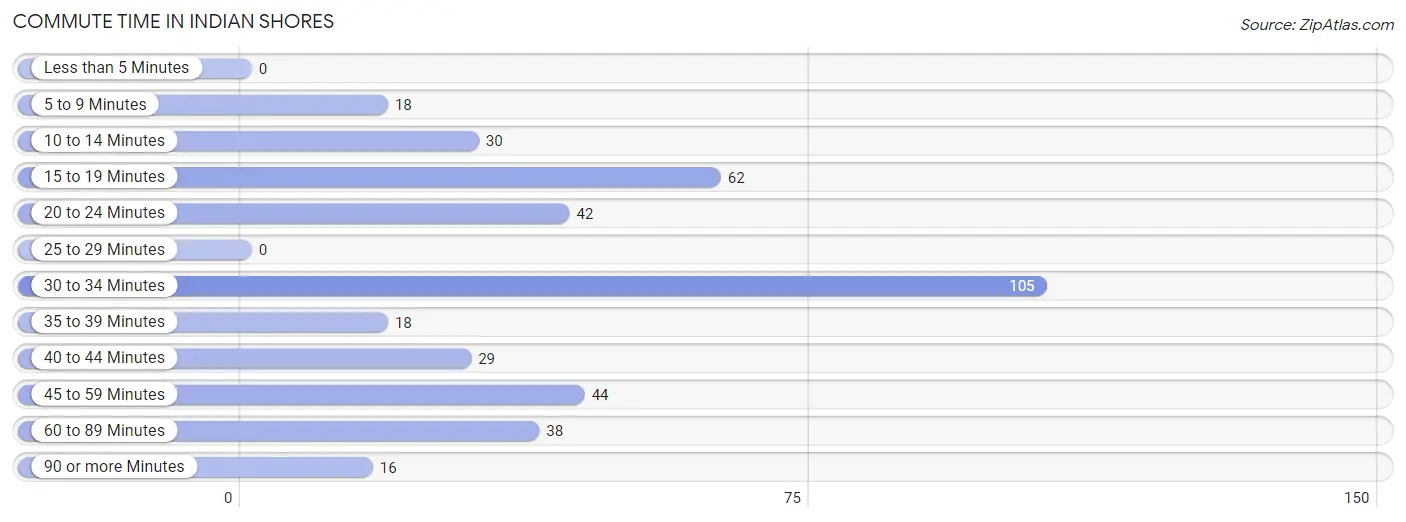
| Commute Time | # Commuters | % Commuters |
| Less than 5 Minutes | 0 | 0.0% |
| 5 to 9 Minutes | 18 | 4.5% |
| 10 to 14 Minutes | 30 | 7.5% |
| 15 to 19 Minutes | 62 | 15.4% |
| 20 to 24 Minutes | 42 | 10.4% |
| 25 to 29 Minutes | 0 | 0.0% |
| 30 to 34 Minutes | 105 | 26.1% |
| 35 to 39 Minutes | 18 | 4.5% |
| 40 to 44 Minutes | 29 | 7.2% |
| 45 to 59 Minutes | 44 | 11.0% |
| 60 to 89 Minutes | 38 | 9.5% |
| 90 or more Minutes | 16 | 4.0% |
Commute Time by Sex in Indian Shores
The most common commute times in Indian Shores are 30 to 34 minutes (69 commuters, 31.2%) for males and 15 to 19 minutes (45 commuters, 24.9%) for females.
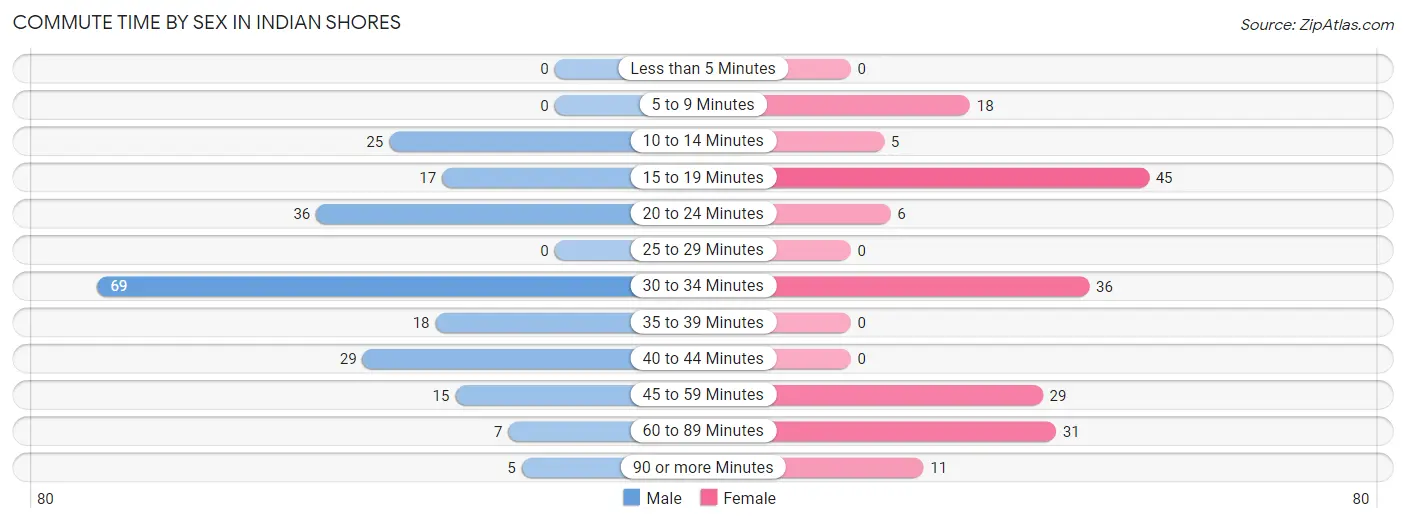
| Commute Time | Male | Female |
| Less than 5 Minutes | 0 (0.0%) | 0 (0.0%) |
| 5 to 9 Minutes | 0 (0.0%) | 18 (9.9%) |
| 10 to 14 Minutes | 25 (11.3%) | 5 (2.8%) |
| 15 to 19 Minutes | 17 (7.7%) | 45 (24.9%) |
| 20 to 24 Minutes | 36 (16.3%) | 6 (3.3%) |
| 25 to 29 Minutes | 0 (0.0%) | 0 (0.0%) |
| 30 to 34 Minutes | 69 (31.2%) | 36 (19.9%) |
| 35 to 39 Minutes | 18 (8.1%) | 0 (0.0%) |
| 40 to 44 Minutes | 29 (13.1%) | 0 (0.0%) |
| 45 to 59 Minutes | 15 (6.8%) | 29 (16.0%) |
| 60 to 89 Minutes | 7 (3.2%) | 31 (17.1%) |
| 90 or more Minutes | 5 (2.3%) | 11 (6.1%) |
Time of Departure to Work by Sex in Indian Shores
The most frequent times of departure to work in Indian Shores are 9:00 AM to 9:59 AM (50, 22.6%) for males and 6:00 AM to 6:29 AM (41, 22.7%) for females.
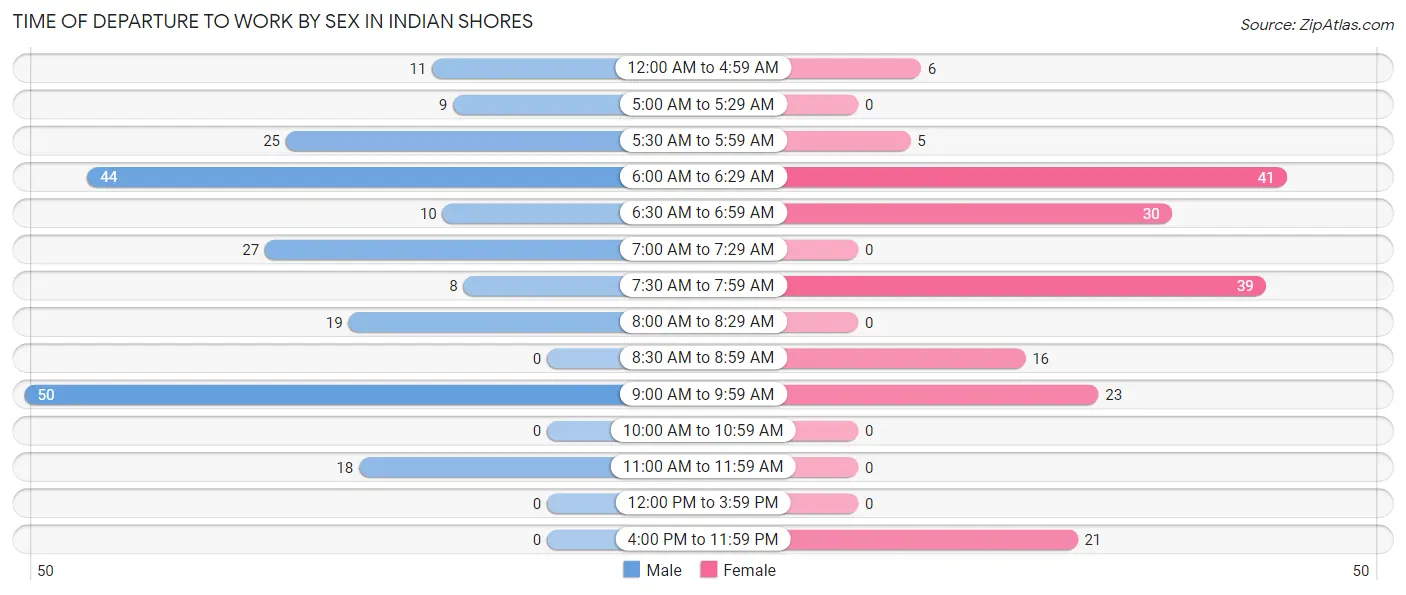
| Time of Departure | Male | Female |
| 12:00 AM to 4:59 AM | 11 (5.0%) | 6 (3.3%) |
| 5:00 AM to 5:29 AM | 9 (4.1%) | 0 (0.0%) |
| 5:30 AM to 5:59 AM | 25 (11.3%) | 5 (2.8%) |
| 6:00 AM to 6:29 AM | 44 (19.9%) | 41 (22.7%) |
| 6:30 AM to 6:59 AM | 10 (4.5%) | 30 (16.6%) |
| 7:00 AM to 7:29 AM | 27 (12.2%) | 0 (0.0%) |
| 7:30 AM to 7:59 AM | 8 (3.6%) | 39 (21.5%) |
| 8:00 AM to 8:29 AM | 19 (8.6%) | 0 (0.0%) |
| 8:30 AM to 8:59 AM | 0 (0.0%) | 16 (8.8%) |
| 9:00 AM to 9:59 AM | 50 (22.6%) | 23 (12.7%) |
| 10:00 AM to 10:59 AM | 0 (0.0%) | 0 (0.0%) |
| 11:00 AM to 11:59 AM | 18 (8.1%) | 0 (0.0%) |
| 12:00 PM to 3:59 PM | 0 (0.0%) | 0 (0.0%) |
| 4:00 PM to 11:59 PM | 0 (0.0%) | 21 (11.6%) |
| Total | 221 (100.0%) | 181 (100.0%) |
Housing Occupancy in Indian Shores
Occupancy by Ownership in Indian Shores
Of the total 583 dwellings in Indian Shores, owner-occupied units account for 532 (91.2%), while renter-occupied units make up 51 (8.7%).
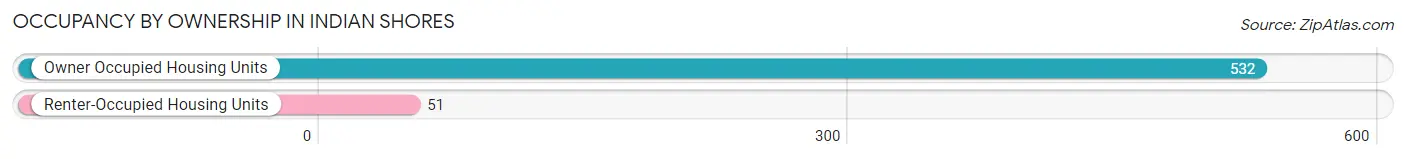
| Occupancy | # Housing Units | % Housing Units |
| Owner Occupied Housing Units | 532 | 91.2% |
| Renter-Occupied Housing Units | 51 | 8.7% |
| Total Occupied Housing Units | 583 | 100.0% |
Occupancy by Household Size in Indian Shores
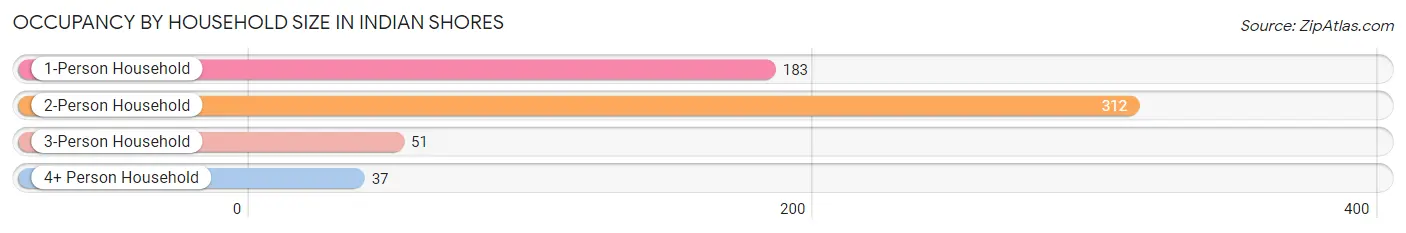
| Household Size | # Housing Units | % Housing Units |
| 1-Person Household | 183 | 31.4% |
| 2-Person Household | 312 | 53.5% |
| 3-Person Household | 51 | 8.7% |
| 4+ Person Household | 37 | 6.4% |
| Total Housing Units | 583 | 100.0% |
Occupancy by Ownership by Household Size in Indian Shores
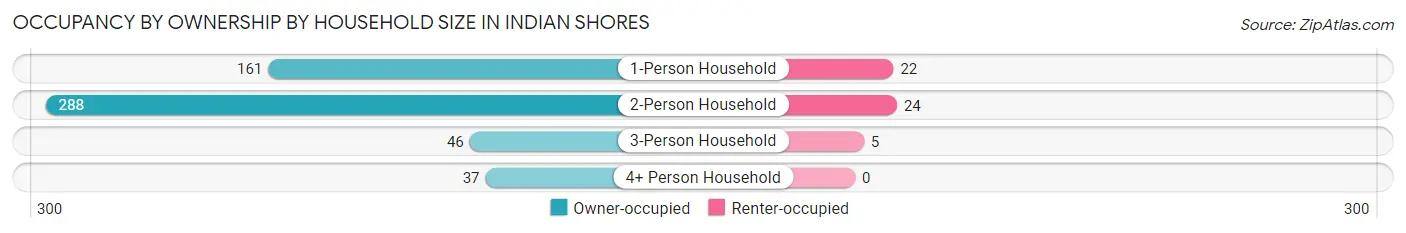
| Household Size | Owner-occupied | Renter-occupied |
| 1-Person Household | 161 (88.0%) | 22 (12.0%) |
| 2-Person Household | 288 (92.3%) | 24 (7.7%) |
| 3-Person Household | 46 (90.2%) | 5 (9.8%) |
| 4+ Person Household | 37 (100.0%) | 0 (0.0%) |
| Total Housing Units | 532 (91.2%) | 51 (8.7%) |
Occupancy by Educational Attainment in Indian Shores
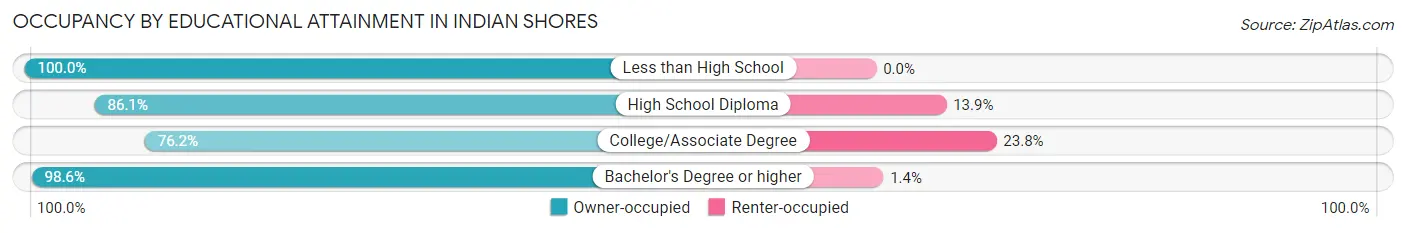
| Household Size | Owner-occupied | Renter-occupied |
| Less than High School | 17 (100.0%) | 0 (0.0%) |
| High School Diploma | 31 (86.1%) | 5 (13.9%) |
| College/Associate Degree | 131 (76.2%) | 41 (23.8%) |
| Bachelor's Degree or higher | 353 (98.6%) | 5 (1.4%) |
Occupancy by Age of Householder in Indian Shores
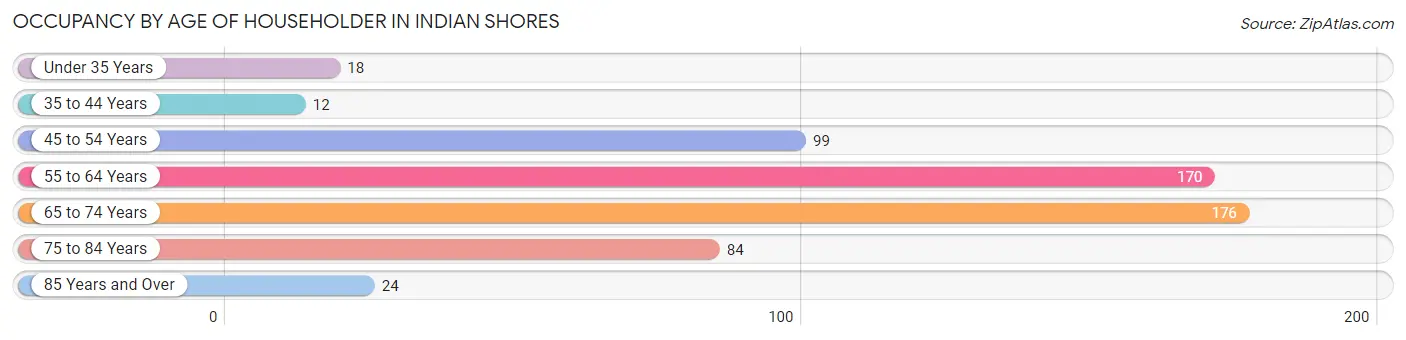
| Age Bracket | # Households | % Households |
| Under 35 Years | 18 | 3.1% |
| 35 to 44 Years | 12 | 2.1% |
| 45 to 54 Years | 99 | 17.0% |
| 55 to 64 Years | 170 | 29.2% |
| 65 to 74 Years | 176 | 30.2% |
| 75 to 84 Years | 84 | 14.4% |
| 85 Years and Over | 24 | 4.1% |
| Total | 583 | 100.0% |
Housing Finances in Indian Shores
Median Income by Occupancy in Indian Shores
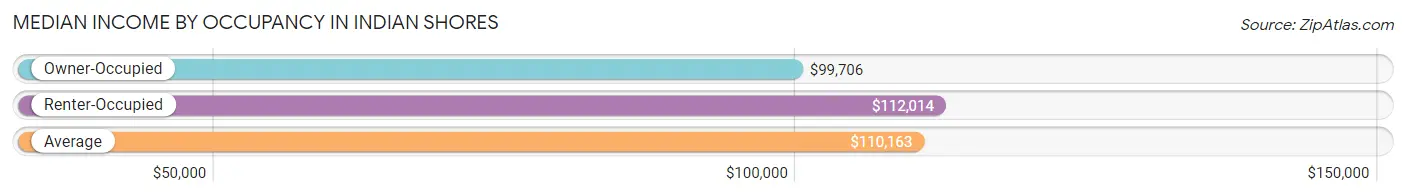
| Occupancy Type | # Households | Median Income |
| Owner-Occupied | 532 (91.2%) | $99,706 |
| Renter-Occupied | 51 (8.7%) | $112,014 |
| Average | 583 (100.0%) | $110,163 |
Occupancy by Householder Income Bracket in Indian Shores
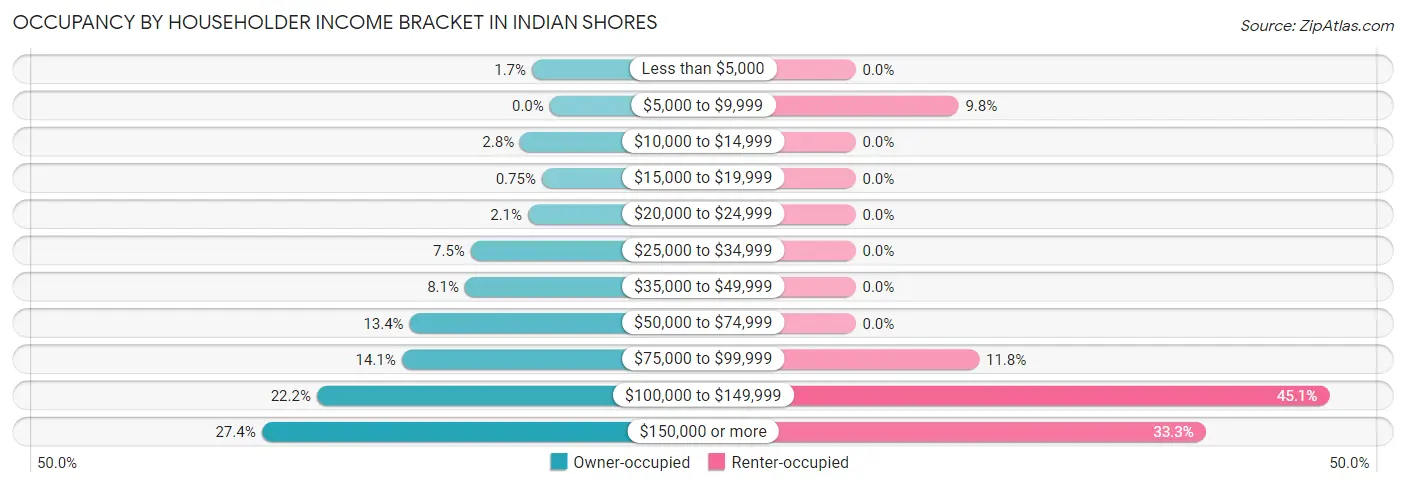
| Income Bracket | Owner-occupied | Renter-occupied |
| Less than $5,000 | 9 (1.7%) | 0 (0.0%) |
| $5,000 to $9,999 | 0 (0.0%) | 5 (9.8%) |
| $10,000 to $14,999 | 15 (2.8%) | 0 (0.0%) |
| $15,000 to $19,999 | 4 (0.7%) | 0 (0.0%) |
| $20,000 to $24,999 | 11 (2.1%) | 0 (0.0%) |
| $25,000 to $34,999 | 40 (7.5%) | 0 (0.0%) |
| $35,000 to $49,999 | 43 (8.1%) | 0 (0.0%) |
| $50,000 to $74,999 | 71 (13.4%) | 0 (0.0%) |
| $75,000 to $99,999 | 75 (14.1%) | 6 (11.8%) |
| $100,000 to $149,999 | 118 (22.2%) | 23 (45.1%) |
| $150,000 or more | 146 (27.4%) | 17 (33.3%) |
| Total | 532 (100.0%) | 51 (100.0%) |
Monthly Housing Cost Tiers in Indian Shores
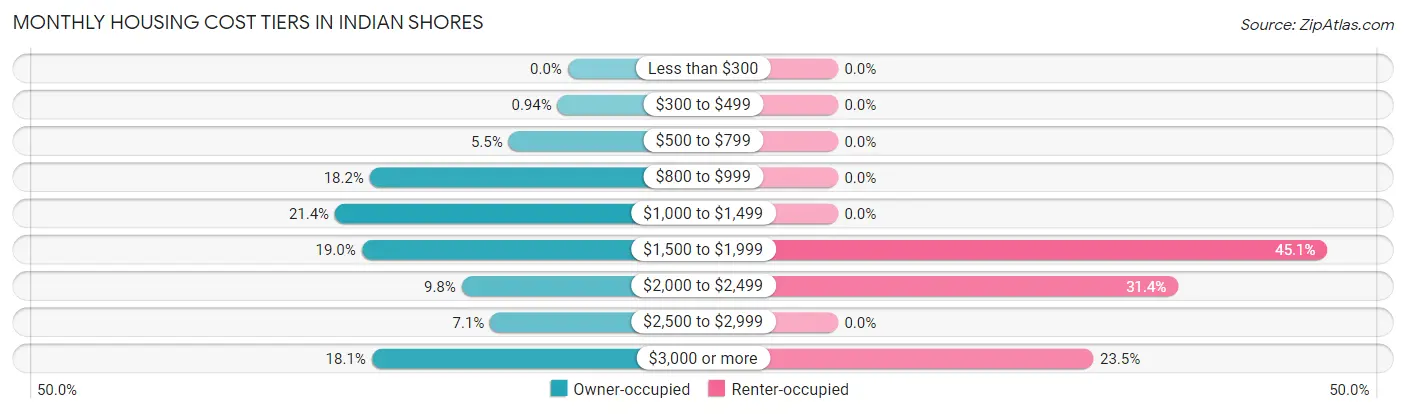
| Monthly Cost | Owner-occupied | Renter-occupied |
| Less than $300 | 0 (0.0%) | 0 (0.0%) |
| $300 to $499 | 5 (0.9%) | 0 (0.0%) |
| $500 to $799 | 29 (5.4%) | 0 (0.0%) |
| $800 to $999 | 97 (18.2%) | 0 (0.0%) |
| $1,000 to $1,499 | 114 (21.4%) | 0 (0.0%) |
| $1,500 to $1,999 | 101 (19.0%) | 23 (45.1%) |
| $2,000 to $2,499 | 52 (9.8%) | 16 (31.4%) |
| $2,500 to $2,999 | 38 (7.1%) | 0 (0.0%) |
| $3,000 or more | 96 (18.0%) | 12 (23.5%) |
| Total | 532 (100.0%) | 51 (100.0%) |
Physical Housing Characteristics in Indian Shores
Housing Structures in Indian Shores
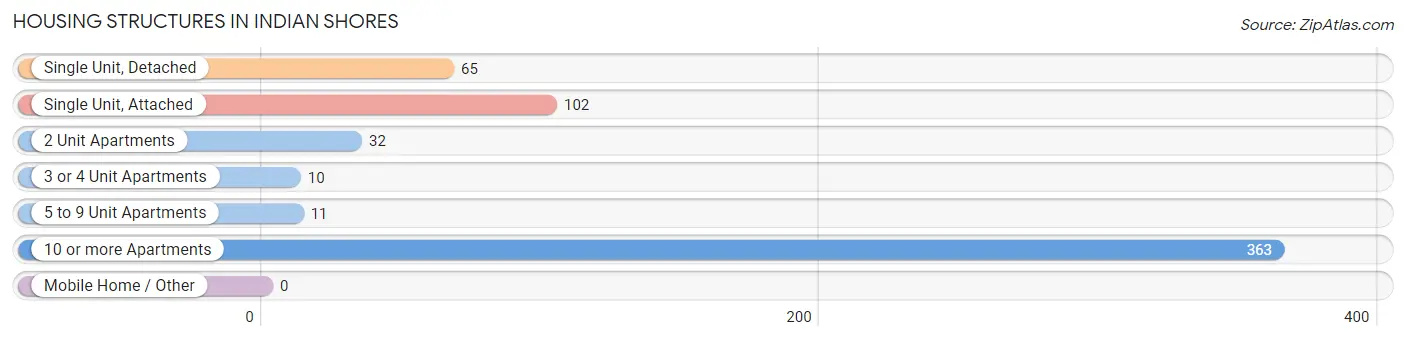
| Structure Type | # Housing Units | % Housing Units |
| Single Unit, Detached | 65 | 11.2% |
| Single Unit, Attached | 102 | 17.5% |
| 2 Unit Apartments | 32 | 5.5% |
| 3 or 4 Unit Apartments | 10 | 1.7% |
| 5 to 9 Unit Apartments | 11 | 1.9% |
| 10 or more Apartments | 363 | 62.3% |
| Mobile Home / Other | 0 | 0.0% |
| Total | 583 | 100.0% |
Housing Structures by Occupancy in Indian Shores
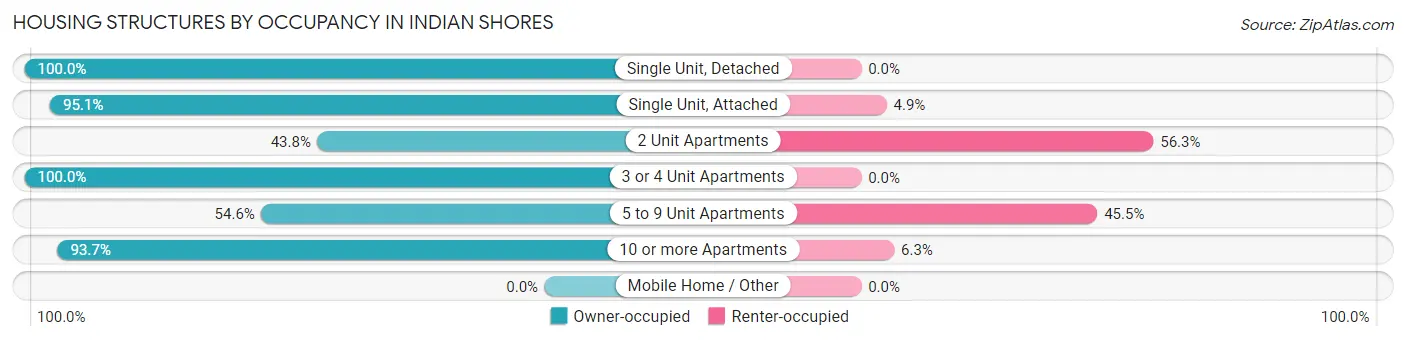
| Structure Type | Owner-occupied | Renter-occupied |
| Single Unit, Detached | 65 (100.0%) | 0 (0.0%) |
| Single Unit, Attached | 97 (95.1%) | 5 (4.9%) |
| 2 Unit Apartments | 14 (43.8%) | 18 (56.2%) |
| 3 or 4 Unit Apartments | 10 (100.0%) | 0 (0.0%) |
| 5 to 9 Unit Apartments | 6 (54.5%) | 5 (45.5%) |
| 10 or more Apartments | 340 (93.7%) | 23 (6.3%) |
| Mobile Home / Other | 0 (0.0%) | 0 (0.0%) |
| Total | 532 (91.2%) | 51 (8.7%) |
Housing Structures by Number of Rooms in Indian Shores
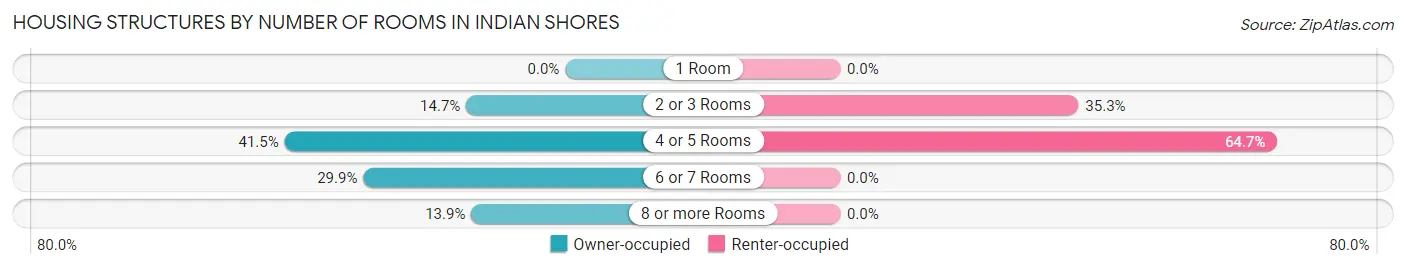
| Number of Rooms | Owner-occupied | Renter-occupied |
| 1 Room | 0 (0.0%) | 0 (0.0%) |
| 2 or 3 Rooms | 78 (14.7%) | 18 (35.3%) |
| 4 or 5 Rooms | 221 (41.5%) | 33 (64.7%) |
| 6 or 7 Rooms | 159 (29.9%) | 0 (0.0%) |
| 8 or more Rooms | 74 (13.9%) | 0 (0.0%) |
| Total | 532 (100.0%) | 51 (100.0%) |
Housing Structure by Heating Type in Indian Shores
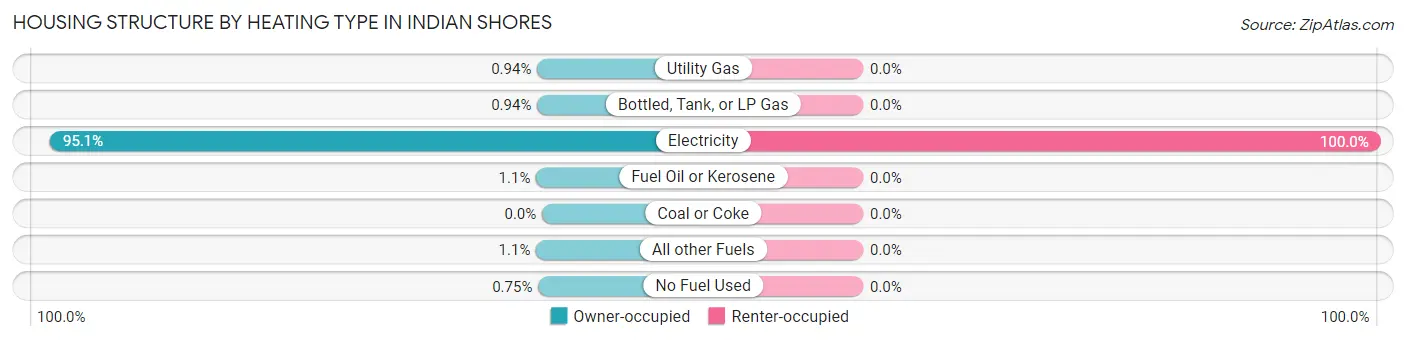
| Heating Type | Owner-occupied | Renter-occupied |
| Utility Gas | 5 (0.9%) | 0 (0.0%) |
| Bottled, Tank, or LP Gas | 5 (0.9%) | 0 (0.0%) |
| Electricity | 506 (95.1%) | 51 (100.0%) |
| Fuel Oil or Kerosene | 6 (1.1%) | 0 (0.0%) |
| Coal or Coke | 0 (0.0%) | 0 (0.0%) |
| All other Fuels | 6 (1.1%) | 0 (0.0%) |
| No Fuel Used | 4 (0.7%) | 0 (0.0%) |
| Total | 532 (100.0%) | 51 (100.0%) |
Household Vehicle Usage in Indian Shores
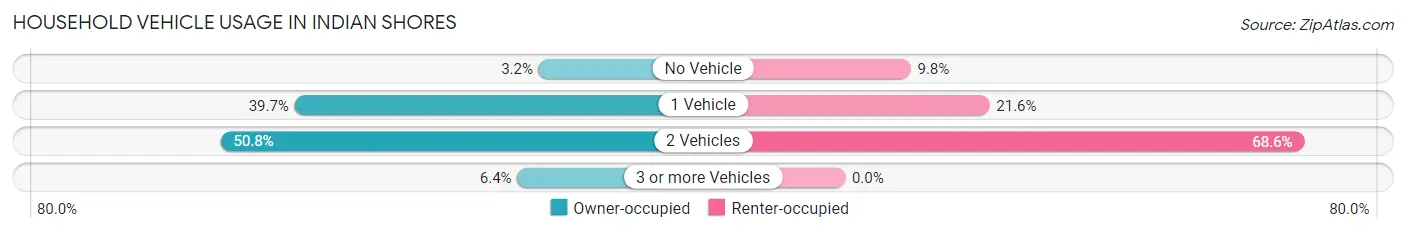
| Vehicles per Household | Owner-occupied | Renter-occupied |
| No Vehicle | 17 (3.2%) | 5 (9.8%) |
| 1 Vehicle | 211 (39.7%) | 11 (21.6%) |
| 2 Vehicles | 270 (50.7%) | 35 (68.6%) |
| 3 or more Vehicles | 34 (6.4%) | 0 (0.0%) |
| Total | 532 (100.0%) | 51 (100.0%) |
Real Estate & Mortgages in Indian Shores
Real Estate and Mortgage Overview in Indian Shores
| Characteristic | Without Mortgage | With Mortgage |
| Housing Units | 307 | 225 |
| Median Property Value | $544,300 | $608,200 |
| Median Household Income | $84,609 | $68 |
| Monthly Housing Costs | $1,177 | $90 |
| Real Estate Taxes | $4,962 | $21 |
Property Value by Mortgage Status in Indian Shores
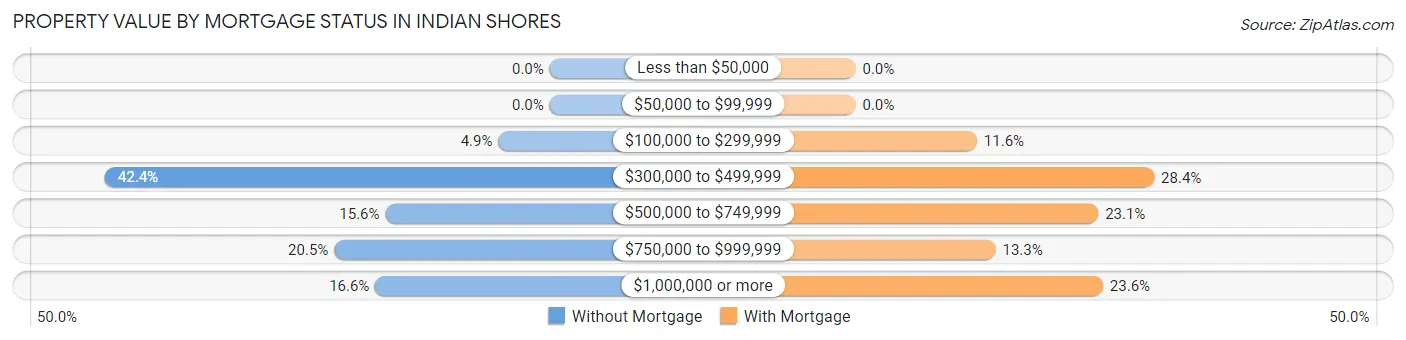
| Property Value | Without Mortgage | With Mortgage |
| Less than $50,000 | 0 (0.0%) | 0 (0.0%) |
| $50,000 to $99,999 | 0 (0.0%) | 0 (0.0%) |
| $100,000 to $299,999 | 15 (4.9%) | 26 (11.6%) |
| $300,000 to $499,999 | 130 (42.3%) | 64 (28.4%) |
| $500,000 to $749,999 | 48 (15.6%) | 52 (23.1%) |
| $750,000 to $999,999 | 63 (20.5%) | 30 (13.3%) |
| $1,000,000 or more | 51 (16.6%) | 53 (23.6%) |
| Total | 307 (100.0%) | 225 (100.0%) |
Household Income by Mortgage Status in Indian Shores
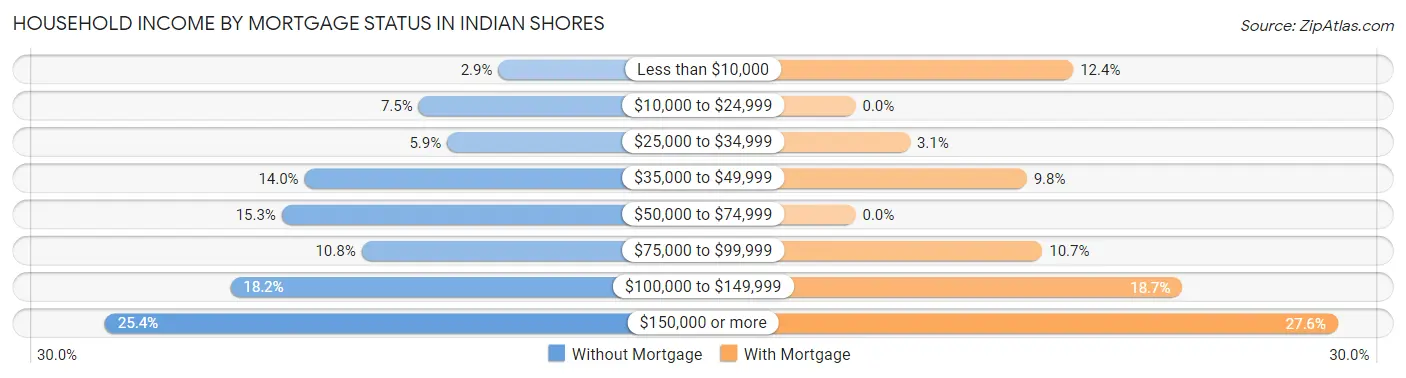
| Household Income | Without Mortgage | With Mortgage |
| Less than $10,000 | 9 (2.9%) | 28 (12.4%) |
| $10,000 to $24,999 | 23 (7.5%) | 0 (0.0%) |
| $25,000 to $34,999 | 18 (5.9%) | 7 (3.1%) |
| $35,000 to $49,999 | 43 (14.0%) | 22 (9.8%) |
| $50,000 to $74,999 | 47 (15.3%) | 0 (0.0%) |
| $75,000 to $99,999 | 33 (10.7%) | 24 (10.7%) |
| $100,000 to $149,999 | 56 (18.2%) | 42 (18.7%) |
| $150,000 or more | 78 (25.4%) | 62 (27.6%) |
| Total | 307 (100.0%) | 225 (100.0%) |
Property Value to Household Income Ratio in Indian Shores
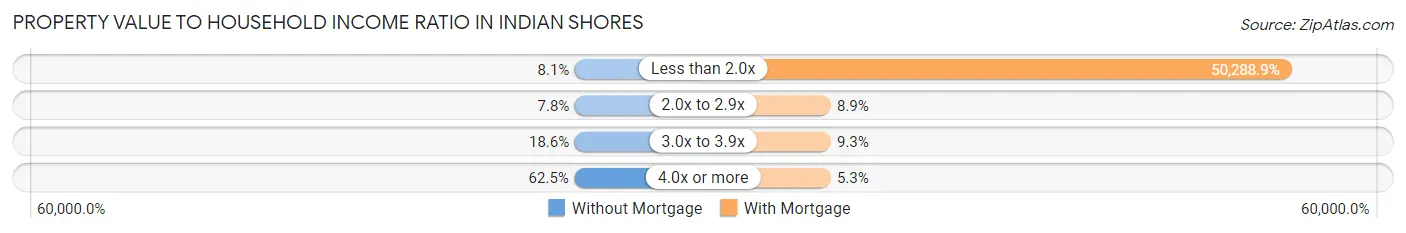
| Value-to-Income Ratio | Without Mortgage | With Mortgage |
| Less than 2.0x | 25 (8.1%) | 113,150 (50,288.9%) |
| 2.0x to 2.9x | 24 (7.8%) | 20 (8.9%) |
| 3.0x to 3.9x | 57 (18.6%) | 21 (9.3%) |
| 4.0x or more | 192 (62.5%) | 12 (5.3%) |
| Total | 307 (100.0%) | 225 (100.0%) |
Real Estate Taxes by Mortgage Status in Indian Shores
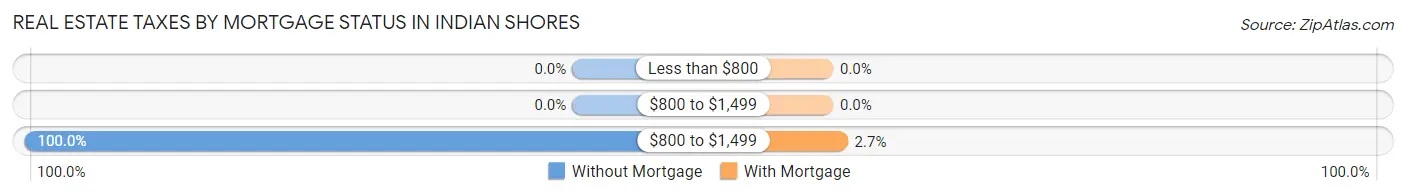
| Property Taxes | Without Mortgage | With Mortgage |
| Less than $800 | 0 (0.0%) | 0 (0.0%) |
| $800 to $1,499 | 0 (0.0%) | 0 (0.0%) |
| $800 to $1,499 | 307 (100.0%) | 6 (2.7%) |
| Total | 307 (100.0%) | 225 (100.0%) |
Health & Disability in Indian Shores
Health Insurance Coverage by Age in Indian Shores
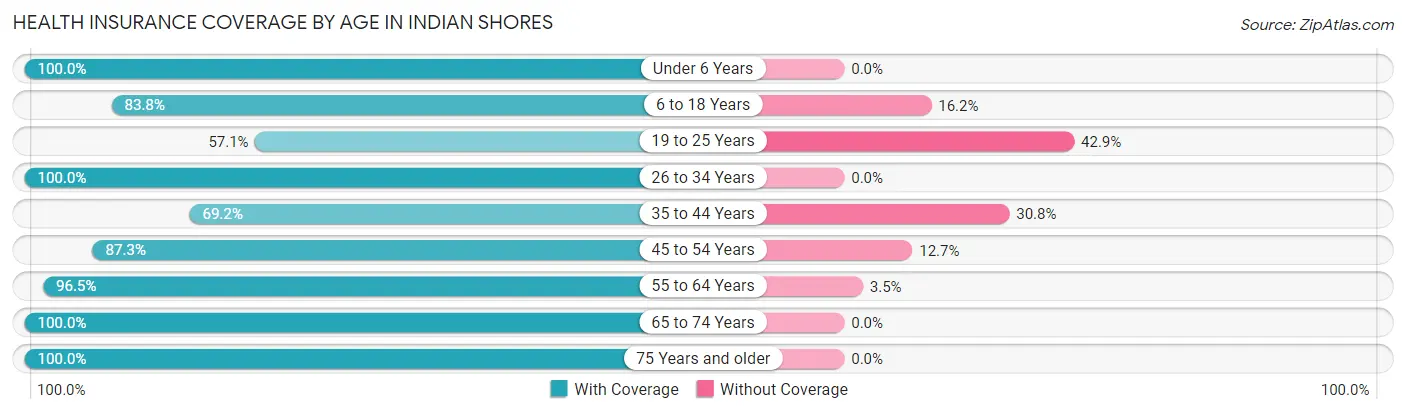
| Age Bracket | With Coverage | Without Coverage |
| Under 6 Years | 9 (100.0%) | 0 (0.0%) |
| 6 to 18 Years | 93 (83.8%) | 18 (16.2%) |
| 19 to 25 Years | 52 (57.1%) | 39 (42.9%) |
| 26 to 34 Years | 11 (100.0%) | 0 (0.0%) |
| 35 to 44 Years | 18 (69.2%) | 8 (30.8%) |
| 45 to 54 Years | 179 (87.3%) | 26 (12.7%) |
| 55 to 64 Years | 251 (96.5%) | 9 (3.5%) |
| 65 to 74 Years | 272 (100.0%) | 0 (0.0%) |
| 75 Years and older | 197 (100.0%) | 0 (0.0%) |
| Total | 1,082 (91.5%) | 100 (8.5%) |
Health Insurance Coverage by Citizenship Status in Indian Shores
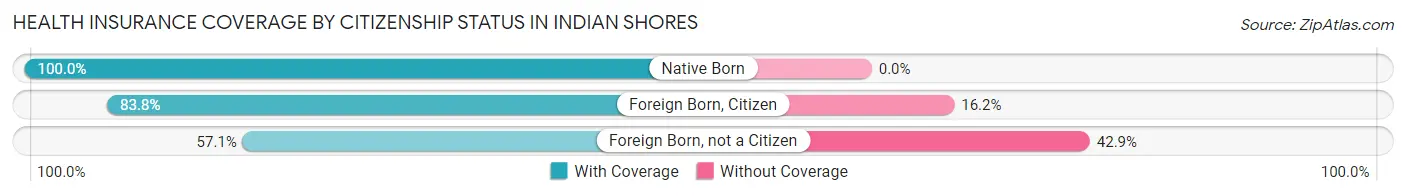
| Citizenship Status | With Coverage | Without Coverage |
| Native Born | 9 (100.0%) | 0 (0.0%) |
| Foreign Born, Citizen | 93 (83.8%) | 18 (16.2%) |
| Foreign Born, not a Citizen | 52 (57.1%) | 39 (42.9%) |
Health Insurance Coverage by Household Income in Indian Shores
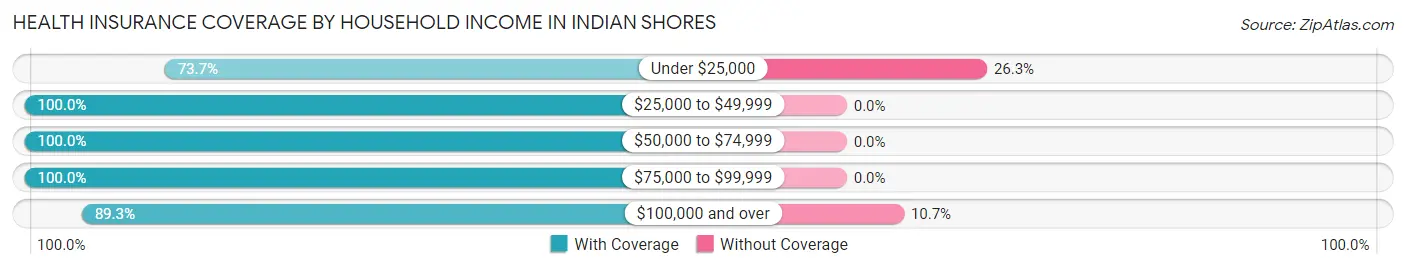
| Household Income | With Coverage | Without Coverage |
| Under $25,000 | 73 (73.7%) | 26 (26.3%) |
| $25,000 to $49,999 | 109 (100.0%) | 0 (0.0%) |
| $50,000 to $74,999 | 139 (100.0%) | 0 (0.0%) |
| $75,000 to $99,999 | 144 (100.0%) | 0 (0.0%) |
| $100,000 and over | 617 (89.3%) | 74 (10.7%) |
Public vs Private Health Insurance Coverage by Age in Indian Shores
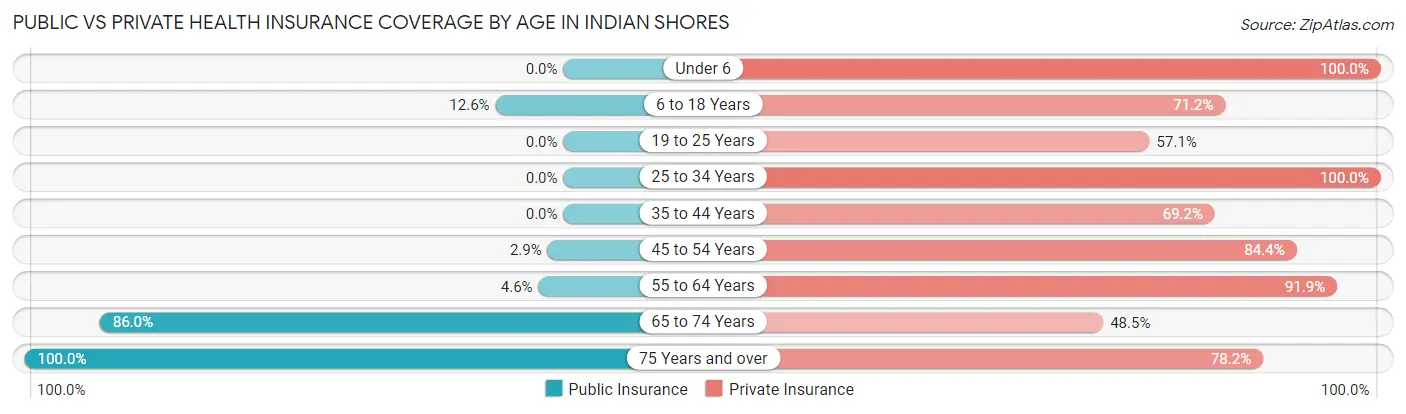
| Age Bracket | Public Insurance | Private Insurance |
| Under 6 | 0 (0.0%) | 9 (100.0%) |
| 6 to 18 Years | 14 (12.6%) | 79 (71.2%) |
| 19 to 25 Years | 0 (0.0%) | 52 (57.1%) |
| 25 to 34 Years | 0 (0.0%) | 11 (100.0%) |
| 35 to 44 Years | 0 (0.0%) | 18 (69.2%) |
| 45 to 54 Years | 6 (2.9%) | 173 (84.4%) |
| 55 to 64 Years | 12 (4.6%) | 239 (91.9%) |
| 65 to 74 Years | 234 (86.0%) | 132 (48.5%) |
| 75 Years and over | 197 (100.0%) | 154 (78.2%) |
| Total | 463 (39.2%) | 867 (73.4%) |
Disability Status by Sex by Age in Indian Shores
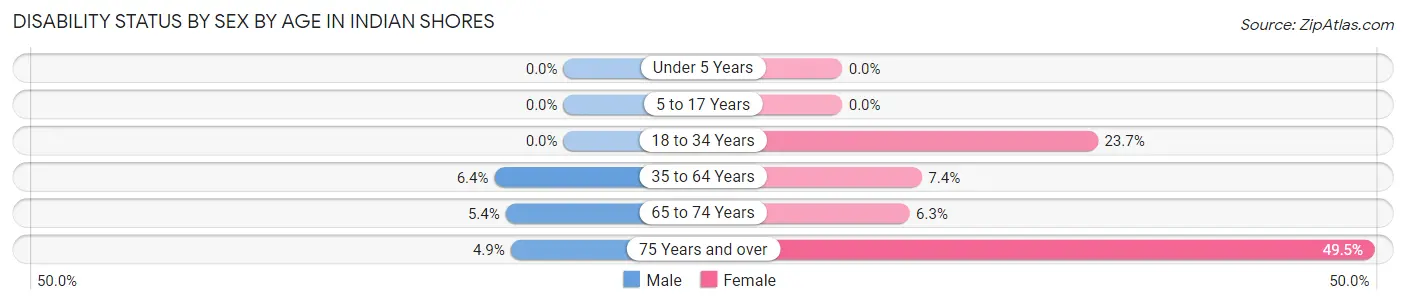
| Age Bracket | Male | Female |
| Under 5 Years | 0 (0.0%) | 0 (0.0%) |
| 5 to 17 Years | 0 (0.0%) | 0 (0.0%) |
| 18 to 34 Years | 0 (0.0%) | 14 (23.7%) |
| 35 to 64 Years | 15 (6.4%) | 19 (7.4%) |
| 65 to 74 Years | 6 (5.4%) | 10 (6.2%) |
| 75 Years and over | 5 (4.9%) | 47 (49.5%) |
Disability Class by Sex by Age in Indian Shores
Disability Class: Hearing Difficulty
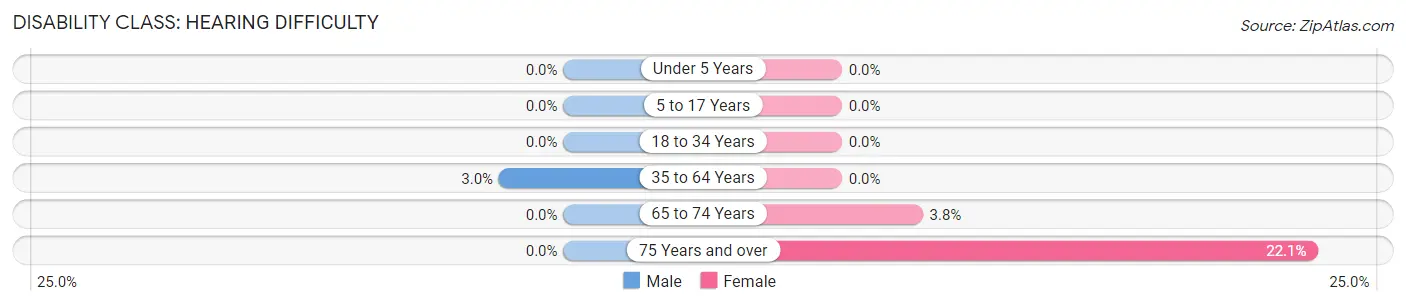
| Age Bracket | Male | Female |
| Under 5 Years | 0 (0.0%) | 0 (0.0%) |
| 5 to 17 Years | 0 (0.0%) | 0 (0.0%) |
| 18 to 34 Years | 0 (0.0%) | 0 (0.0%) |
| 35 to 64 Years | 7 (3.0%) | 0 (0.0%) |
| 65 to 74 Years | 0 (0.0%) | 6 (3.7%) |
| 75 Years and over | 0 (0.0%) | 21 (22.1%) |
Disability Class: Vision Difficulty
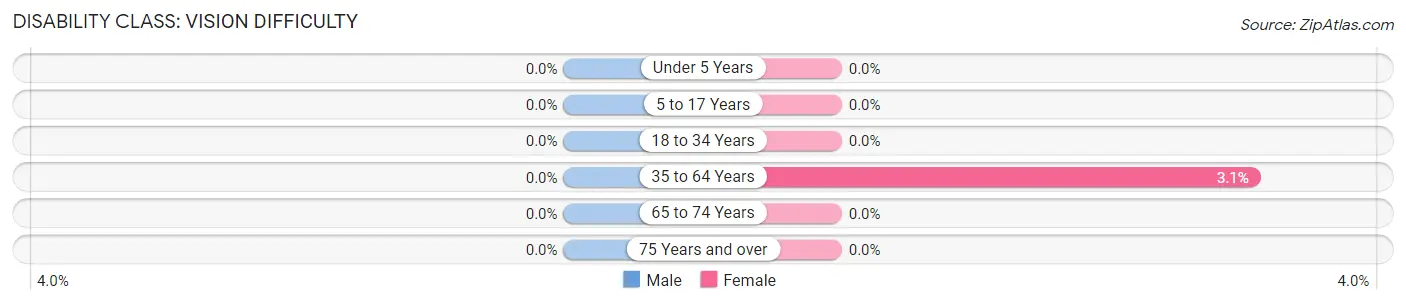
| Age Bracket | Male | Female |
| Under 5 Years | 0 (0.0%) | 0 (0.0%) |
| 5 to 17 Years | 0 (0.0%) | 0 (0.0%) |
| 18 to 34 Years | 0 (0.0%) | 0 (0.0%) |
| 35 to 64 Years | 0 (0.0%) | 8 (3.1%) |
| 65 to 74 Years | 0 (0.0%) | 0 (0.0%) |
| 75 Years and over | 0 (0.0%) | 0 (0.0%) |
Disability Class: Cognitive Difficulty
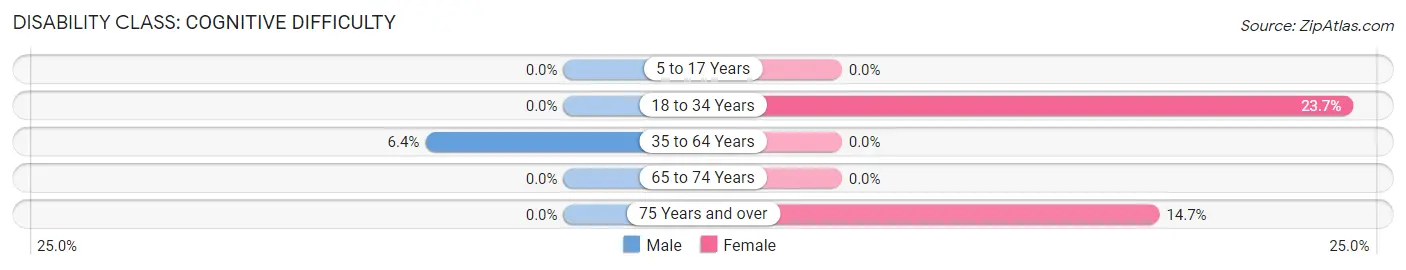
| Age Bracket | Male | Female |
| 5 to 17 Years | 0 (0.0%) | 0 (0.0%) |
| 18 to 34 Years | 0 (0.0%) | 14 (23.7%) |
| 35 to 64 Years | 15 (6.4%) | 0 (0.0%) |
| 65 to 74 Years | 0 (0.0%) | 0 (0.0%) |
| 75 Years and over | 0 (0.0%) | 14 (14.7%) |
Disability Class: Ambulatory Difficulty
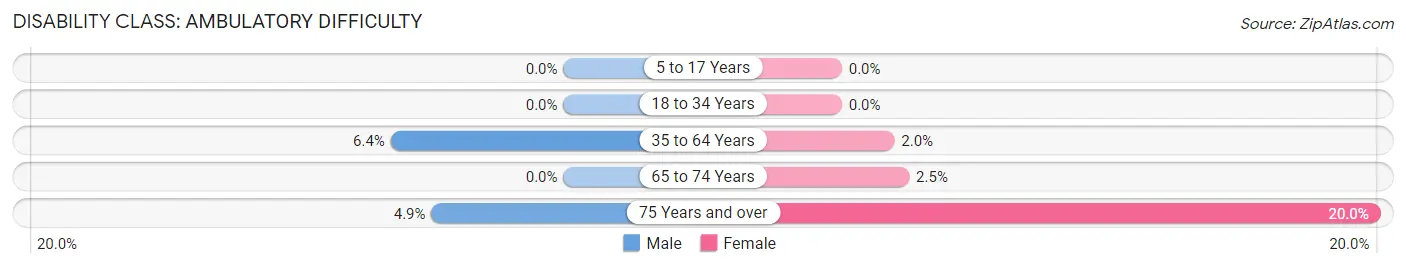
| Age Bracket | Male | Female |
| 5 to 17 Years | 0 (0.0%) | 0 (0.0%) |
| 18 to 34 Years | 0 (0.0%) | 0 (0.0%) |
| 35 to 64 Years | 15 (6.4%) | 5 (1.9%) |
| 65 to 74 Years | 0 (0.0%) | 4 (2.5%) |
| 75 Years and over | 5 (4.9%) | 19 (20.0%) |
Disability Class: Self-Care Difficulty
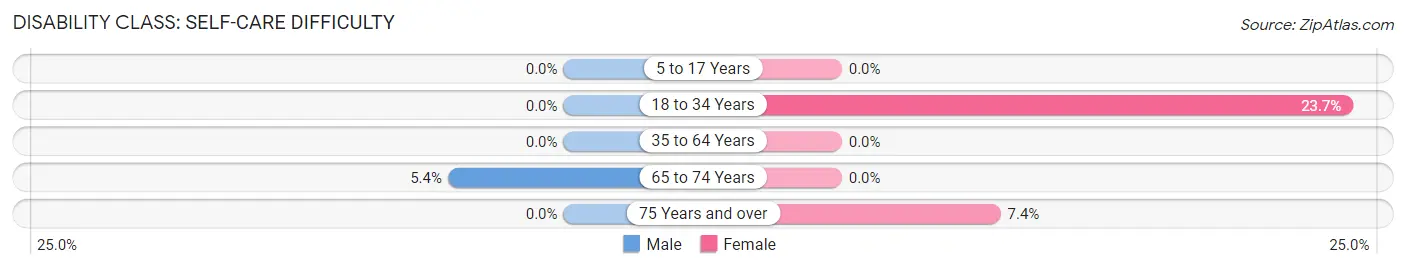
| Age Bracket | Male | Female |
| 5 to 17 Years | 0 (0.0%) | 0 (0.0%) |
| 18 to 34 Years | 0 (0.0%) | 14 (23.7%) |
| 35 to 64 Years | 0 (0.0%) | 0 (0.0%) |
| 65 to 74 Years | 6 (5.4%) | 0 (0.0%) |
| 75 Years and over | 0 (0.0%) | 7 (7.4%) |
Technology Access in Indian Shores
Computing Device Access in Indian Shores
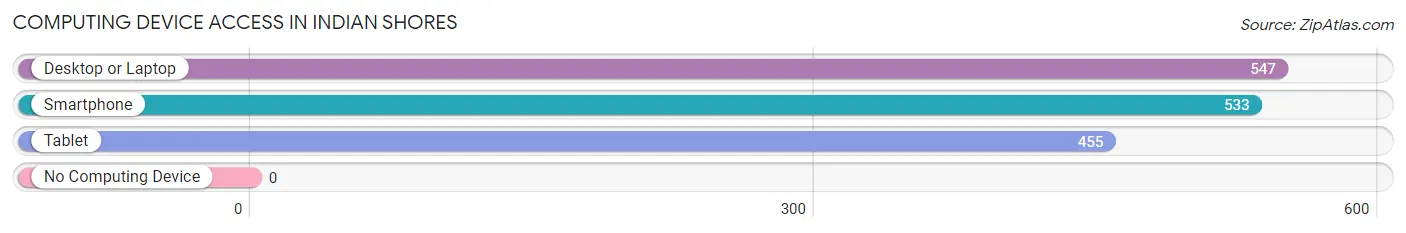
| Device Type | # Households | % Households |
| Desktop or Laptop | 547 | 93.8% |
| Smartphone | 533 | 91.4% |
| Tablet | 455 | 78.0% |
| No Computing Device | 0 | 0.0% |
| Total | 583 | 100.0% |
Internet Access in Indian Shores
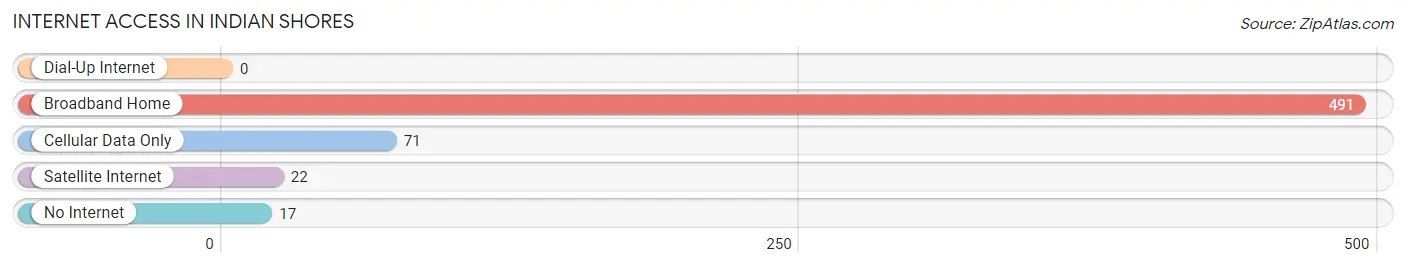
| Internet Type | # Households | % Households |
| Dial-Up Internet | 0 | 0.0% |
| Broadband Home | 491 | 84.2% |
| Cellular Data Only | 71 | 12.2% |
| Satellite Internet | 22 | 3.8% |
| No Internet | 17 | 2.9% |
| Total | 583 | 100.0% |
Indian Shores Summary
Indian Shores, Florida is a small town located on the Gulf of Mexico in Pinellas County, Florida. It is part of the Tampa Bay Area and is situated between the cities of Clearwater and St. Petersburg. The town was incorporated in 1950 and has a population of approximately 2,000 people.
Geography
Indian Shores is located on the Gulf of Mexico in Pinellas County, Florida. It is situated between the cities of Clearwater and St. Petersburg. The town is bordered by the Intracoastal Waterway to the east and the Gulf of Mexico to the west. The town is approximately 2.5 miles long and 0.5 miles wide. The town is made up of a series of small islands connected by bridges and causeways. The town is located on a barrier island and is surrounded by the waters of the Gulf of Mexico and the Intracoastal Waterway.
The town has a total area of 0.9 square miles, all of which is land. The town is located at an elevation of 10 feet above sea level. The town has a humid subtropical climate with hot, humid summers and mild winters. The average temperature in the summer is around 90 degrees Fahrenheit and the average temperature in the winter is around 70 degrees Fahrenheit.
History
The area that is now Indian Shores was originally inhabited by the Tocobaga Indians. The Tocobaga were a Native American tribe that lived in the Tampa Bay area from the late 1500s to the early 1700s. The area was later settled by European settlers in the late 1800s. The town was originally known as Indian Beach and was incorporated in 1950.
The town was originally a small fishing village and was known for its beautiful beaches and fishing. The town was also known for its seafood restaurants and its laid-back atmosphere. In the 1950s, the town began to grow and develop as more people moved to the area. The town was also known for its art galleries and its unique architecture.
Economy
The economy of Indian Shores is largely based on tourism. The town is known for its beautiful beaches and its laid-back atmosphere. The town is also known for its seafood restaurants and its art galleries. The town is also home to several small businesses, including restaurants, shops, and hotels.
The town is also home to several large corporations, including the Clearwater Marine Aquarium, the Clearwater Beach Hotel, and the Clearwater Beach Resort. The town is also home to several marinas and boat docks.
Demographics
As of the 2010 census, the population of Indian Shores was 2,053. The population is made up of a diverse mix of people from all walks of life. The town has a median age of 54.7 years and a median household income of $50,945. The town is predominantly white, with a population that is 94.3% white, 2.2% Hispanic or Latino, 1.2% African American, and 1.2% Asian.
Conclusion
Indian Shores, Florida is a small town located on the Gulf of Mexico in Pinellas County, Florida. It is part of the Tampa Bay Area and is situated between the cities of Clearwater and St. Petersburg. The town was incorporated in 1950 and has a population of approximately 2,000 people. The town is known for its beautiful beaches and its laid-back atmosphere. The economy of Indian Shores is largely based on tourism and the town is home to several small businesses, including restaurants, shops, and hotels. The population of Indian Shores is predominantly white, with a population that is 94.3% white, 2.2% Hispanic or Latino, 1.2% African American, and 1.2% Asian.
Common Questions
What is Per Capita Income in Indian Shores?
Per Capita income in Indian Shores is $68,846.
What is the Median Family Income in Indian Shores?
Median Family Income in Indian Shores is $114,961.
What is the Median Household income in Indian Shores?
Median Household Income in Indian Shores is $110,163.
What is Income or Wage Gap in Indian Shores?
Income or Wage Gap in Indian Shores is 30.7%.
Women in Indian Shores earn 69.3 cents for every dollar earned by a man.
What is Inequality or Gini Index in Indian Shores?
Inequality or Gini Index in Indian Shores is 0.45.
What is the Total Population of Indian Shores?
Total Population of Indian Shores is 1,182.
What is the Total Male Population of Indian Shores?
Total Male Population of Indian Shores is 588.
What is the Total Female Population of Indian Shores?
Total Female Population of Indian Shores is 594.
What is the Ratio of Males per 100 Females in Indian Shores?
There are 98.99 Males per 100 Females in Indian Shores.
What is the Ratio of Females per 100 Males in Indian Shores?
There are 101.02 Females per 100 Males in Indian Shores.
What is the Median Population Age in Indian Shores?
Median Population Age in Indian Shores is 59.4 Years.
What is the Average Family Size in Indian Shores
Average Family Size in Indian Shores is 2.5 People.
What is the Average Household Size in Indian Shores
Average Household Size in Indian Shores is 2.0 People.
How Large is the Labor Force in Indian Shores?
There are 500 People in the Labor Forcein in Indian Shores.
What is the Percentage of People in the Labor Force in Indian Shores?
44.7% of People are in the Labor Force in Indian Shores.