Golf, FL Map & Demographics
Golf Map
Golf Overview
$222,810
PER CAPITA INCOME
$250,001
AVG FAMILY INCOME
$250,001
AVG HOUSEHOLD INCOME
76.5%
WAGE / INCOME GAP [ % ]
23.5¢/ $1
WAGE / INCOME GAP [ $ ]
0.49
INEQUALITY / GINI INDEX
255
TOTAL POPULATION
124
MALE POPULATION
131
FEMALE POPULATION
94.66
MALES / 100 FEMALES
105.65
FEMALES / 100 MALES
70.5
MEDIAN AGE
2.1
AVG FAMILY SIZE
2.0
AVG HOUSEHOLD SIZE
86
LABOR FORCE [ PEOPLE ]
34.1%
PERCENT IN LABOR FORCE
Golf Area Codes
Income in Golf
Income Overview in Golf
Per Capita Income in Golf is $222,810, while median incomes of families and households are $250,001 and $250,001 respectively.
| Characteristic | Number | Measure |
| Per Capita Income | 255 | $222,810 |
| Median Family Income | 100 | $250,001 |
| Mean Family Income | 100 | $533,792 |
| Median Household Income | 127 | $250,001 |
| Mean Household Income | 127 | $454,287 |
| Income Deficit | 100 | $0 |
| Wage / Income Gap (%) | 255 | 76.48% |
| Wage / Income Gap ($) | 255 | 23.52¢ per $1 |
| Gini / Inequality Index | 255 | 0.49 |
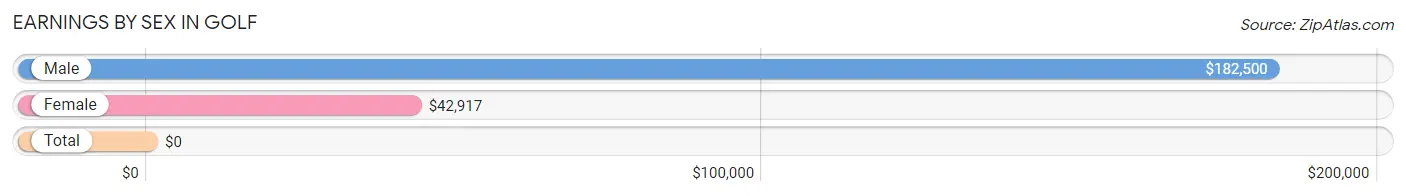
Earnings by Sex in Golf
| Sex | Number | Average Earnings |
| Male | 70 (75.3%) | $182,500 |
| Female | 23 (24.7%) | $42,917 |
| Total | 93 (100.0%) | $0 |
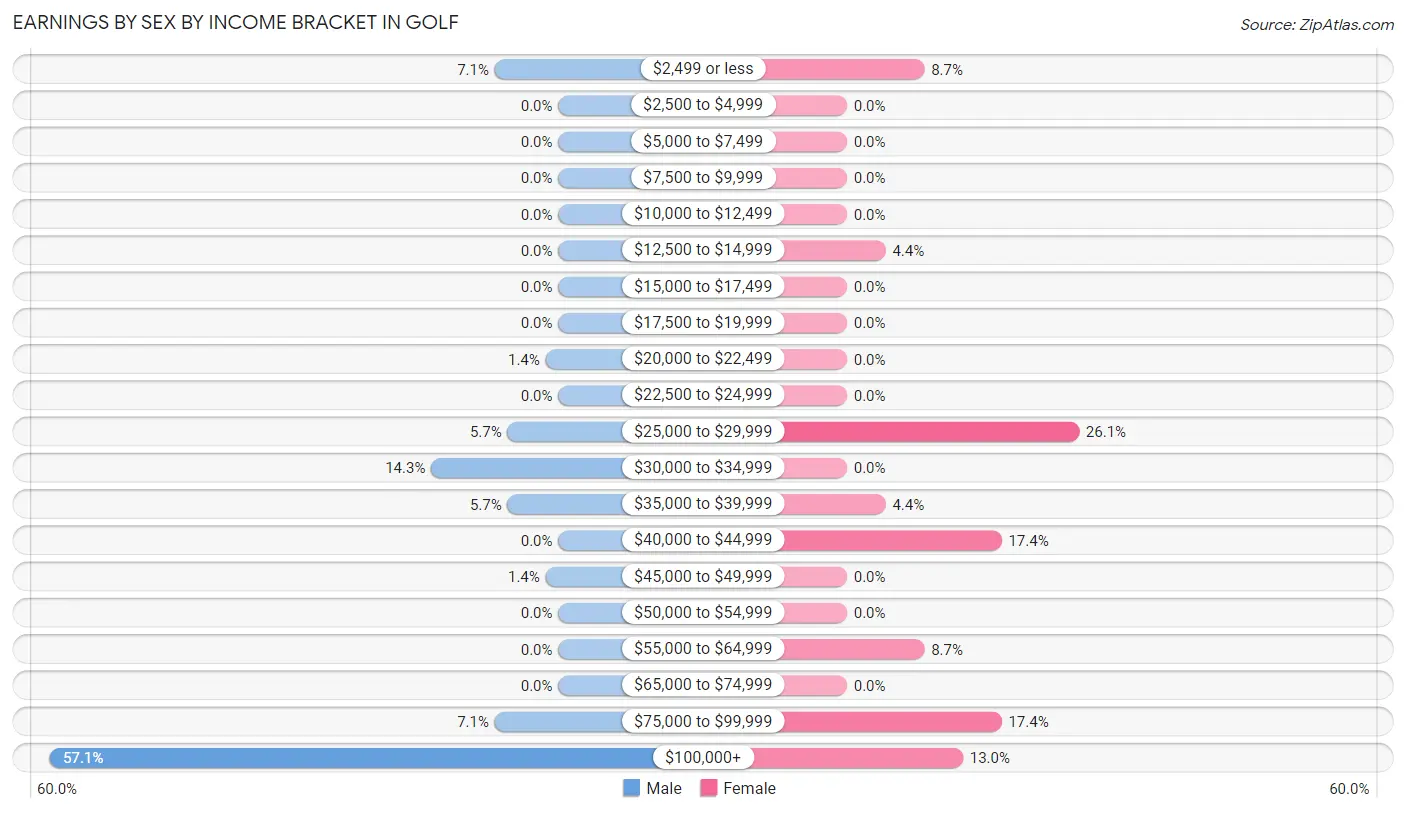
Earnings by Sex by Income Bracket in Golf
The most common earnings brackets in Golf are $100,000+ for men (40 | 57.1%) and $25,000 to $29,999 for women (6 | 26.1%).
| Income | Male | Female |
| $2,499 or less | 5 (7.1%) | 2 (8.7%) |
| $2,500 to $4,999 | 0 (0.0%) | 0 (0.0%) |
| $5,000 to $7,499 | 0 (0.0%) | 0 (0.0%) |
| $7,500 to $9,999 | 0 (0.0%) | 0 (0.0%) |
| $10,000 to $12,499 | 0 (0.0%) | 0 (0.0%) |
| $12,500 to $14,999 | 0 (0.0%) | 1 (4.3%) |
| $15,000 to $17,499 | 0 (0.0%) | 0 (0.0%) |
| $17,500 to $19,999 | 0 (0.0%) | 0 (0.0%) |
| $20,000 to $22,499 | 1 (1.4%) | 0 (0.0%) |
| $22,500 to $24,999 | 0 (0.0%) | 0 (0.0%) |
| $25,000 to $29,999 | 4 (5.7%) | 6 (26.1%) |
| $30,000 to $34,999 | 10 (14.3%) | 0 (0.0%) |
| $35,000 to $39,999 | 4 (5.7%) | 1 (4.3%) |
| $40,000 to $44,999 | 0 (0.0%) | 4 (17.4%) |
| $45,000 to $49,999 | 1 (1.4%) | 0 (0.0%) |
| $50,000 to $54,999 | 0 (0.0%) | 0 (0.0%) |
| $55,000 to $64,999 | 0 (0.0%) | 2 (8.7%) |
| $65,000 to $74,999 | 0 (0.0%) | 0 (0.0%) |
| $75,000 to $99,999 | 5 (7.1%) | 4 (17.4%) |
| $100,000+ | 40 (57.1%) | 3 (13.0%) |
| Total | 70 (100.0%) | 23 (100.0%) |
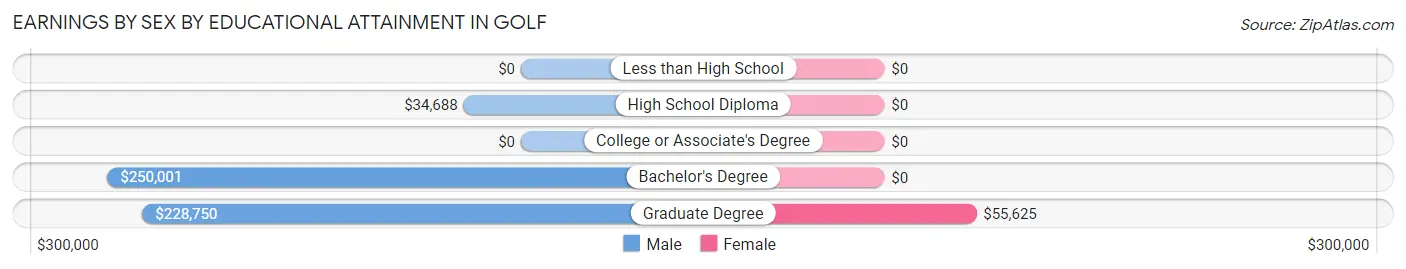
Earnings by Sex by Educational Attainment in Golf
Average earnings in Golf are $182,500 for men and $42,917 for women, a difference of 76.5%. Men with an educational attainment of bachelor's degree enjoy the highest average annual earnings of $250,001, while those with high school diploma education earn the least with $34,688. Women with an educational attainment of graduate degree earn the most with the average annual earnings of $55,625, while those with graduate degree education have the smallest earnings of $55,625.
| Educational Attainment | Male Income | Female Income |
| Less than High School | - | - |
| High School Diploma | $34,688 | $0 |
| College or Associate's Degree | - | - |
| Bachelor's Degree | $250,001 | $0 |
| Graduate Degree | $228,750 | $55,625 |
| Total | $182,500 | $42,917 |
Family Income in Golf
Family Income Brackets in Golf
According to the Golf family income data, there are 72 families falling into the $200,000+ income range, which is the most common income bracket and makes up 72.0% of all families.
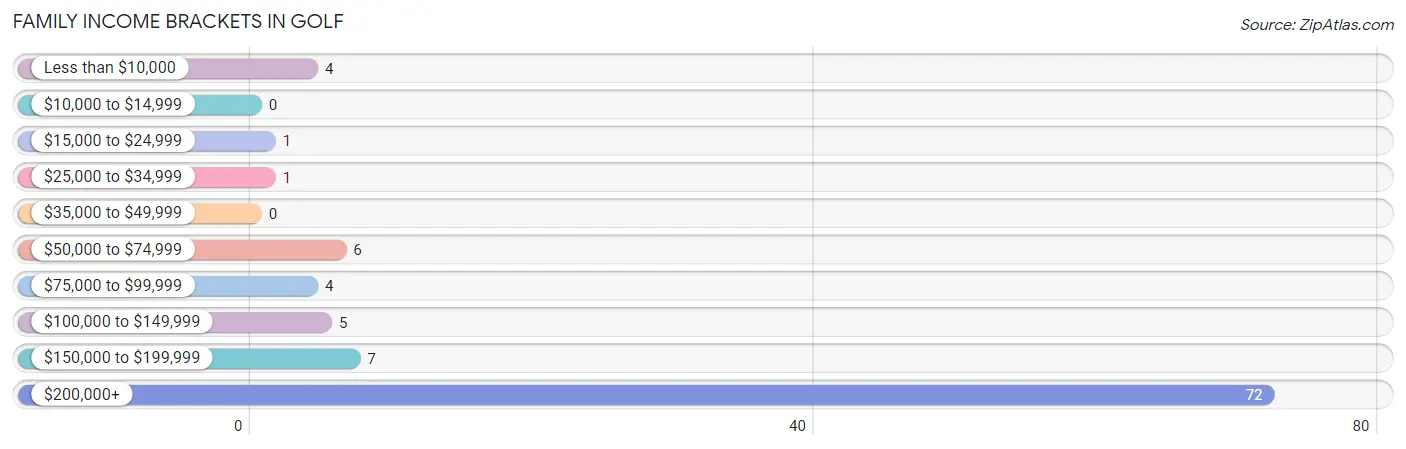
| Income Bracket | # Families | % Families |
| Less than $10,000 | 4 | 4.0% |
| $10,000 to $14,999 | 0 | 0.0% |
| $15,000 to $24,999 | 1 | 1.0% |
| $25,000 to $34,999 | 1 | 1.0% |
| $35,000 to $49,999 | 0 | 0.0% |
| $50,000 to $74,999 | 6 | 6.0% |
| $75,000 to $99,999 | 4 | 4.0% |
| $100,000 to $149,999 | 5 | 5.0% |
| $150,000 to $199,999 | 7 | 7.0% |
| $200,000+ | 72 | 72.0% |
Family Income by Famaliy Size in Golf
2-person families (92 | 92.0%) account for the highest median family income in Golf with $250,001 per family, while 2-person families (92 | 92.0%) have the highest median income of $125,000 per family member.
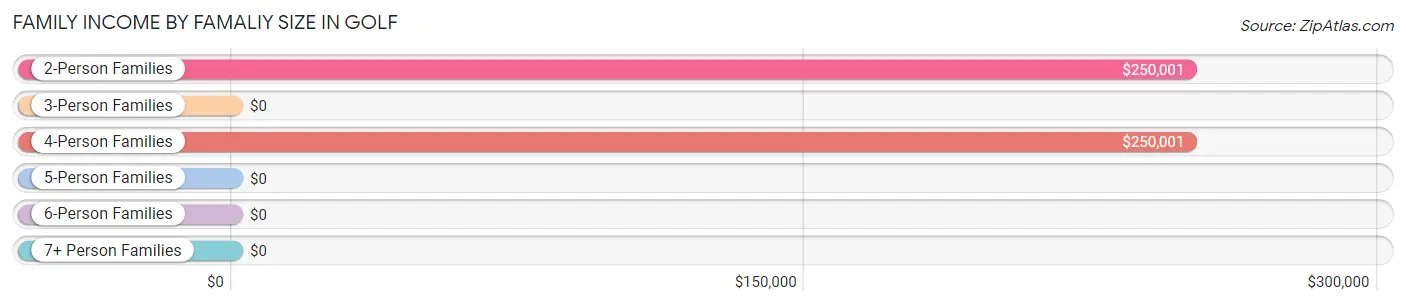
| Income Bracket | # Families | Median Income |
| 2-Person Families | 92 (92.0%) | $250,001 |
| 3-Person Families | 2 (2.0%) | $0 |
| 4-Person Families | 5 (5.0%) | $250,001 |
| 5-Person Families | 1 (1.0%) | $0 |
| 6-Person Families | 0 (0.0%) | $0 |
| 7+ Person Families | 0 (0.0%) | $0 |
| Total | 100 (100.0%) | $250,001 |
Family Income by Number of Earners in Golf
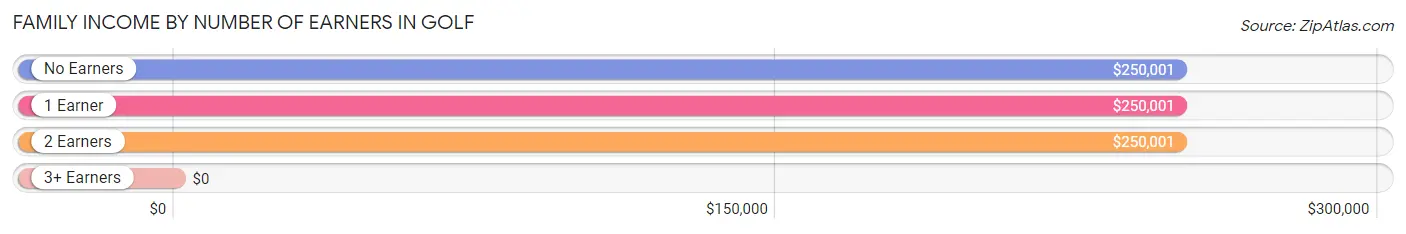
| Number of Earners | # Families | Median Income |
| No Earners | 41 (41.0%) | $250,001 |
| 1 Earner | 43 (43.0%) | $250,001 |
| 2 Earners | 15 (15.0%) | $250,001 |
| 3+ Earners | 1 (1.0%) | $0 |
| Total | 100 (100.0%) | $250,001 |
Household Income in Golf
Household Income Brackets in Golf
With 80 households falling in the category, the $200,000+ income range is the most frequent in Golf, accounting for 63.0% of all households.
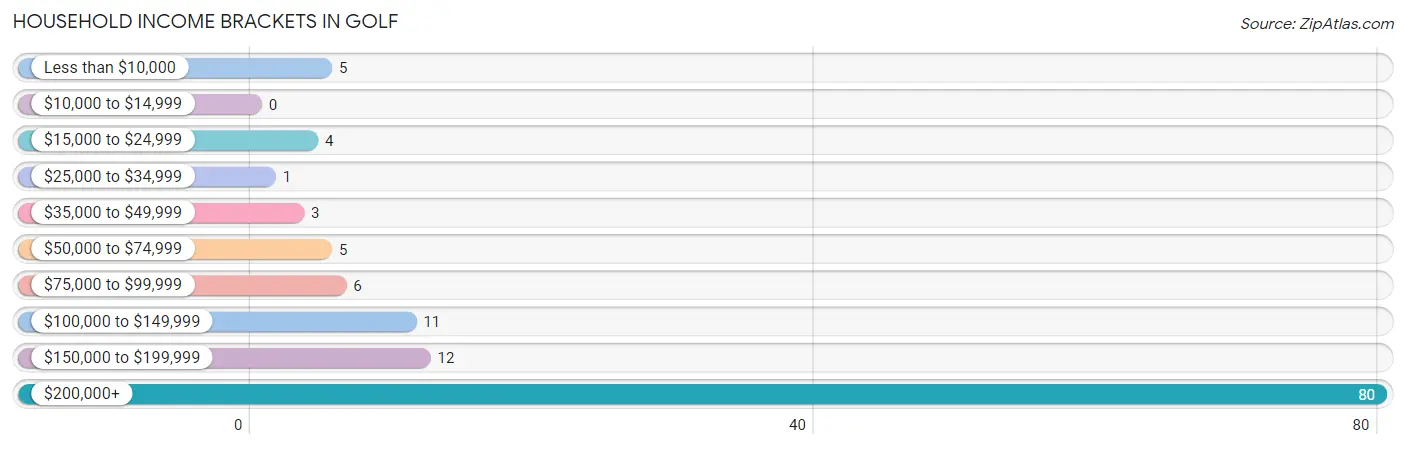
| Income Bracket | # Households | % Households |
| Less than $10,000 | 5 | 3.9% |
| $10,000 to $14,999 | 0 | 0.0% |
| $15,000 to $24,999 | 4 | 3.1% |
| $25,000 to $34,999 | 1 | 0.8% |
| $35,000 to $49,999 | 3 | 2.4% |
| $50,000 to $74,999 | 5 | 3.9% |
| $75,000 to $99,999 | 6 | 4.7% |
| $100,000 to $149,999 | 11 | 8.7% |
| $150,000 to $199,999 | 12 | 9.4% |
| $200,000+ | 80 | 63.0% |
Household Income by Householder Age in Golf
The median household income in Golf is $250,001, with the highest median household income of $250,001 found in the 65+ years age bracket for the primary householder. A total of 91 households (71.7%) fall into this category.
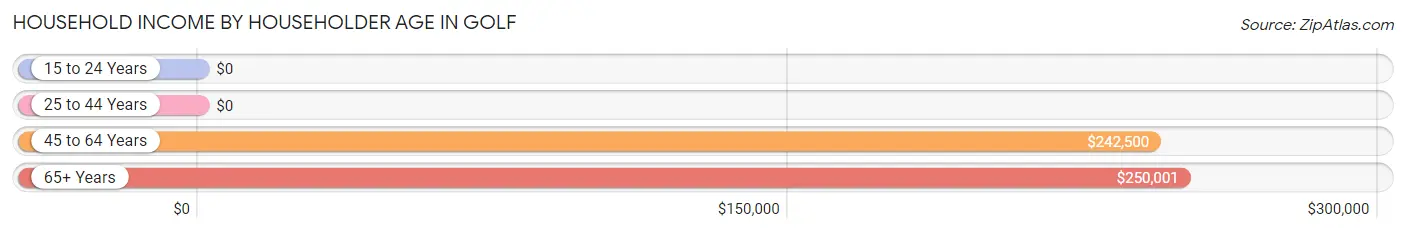
| Income Bracket | # Households | Median Income |
| 15 to 24 Years | 0 (0.0%) | $0 |
| 25 to 44 Years | 0 (0.0%) | $0 |
| 45 to 64 Years | 36 (28.3%) | $242,500 |
| 65+ Years | 91 (71.7%) | $250,001 |
| Total | 127 (100.0%) | $250,001 |
Poverty in Golf
Income Below Poverty by Sex and Age in Golf
With 2.4% poverty level for males and 3.0% for females among the residents of Golf, 55 to 64 year old males and 55 to 64 year old females are the most vulnerable to poverty, with 2 males (6.9%) and 3 females (7.9%) in their respective age groups living below the poverty level.
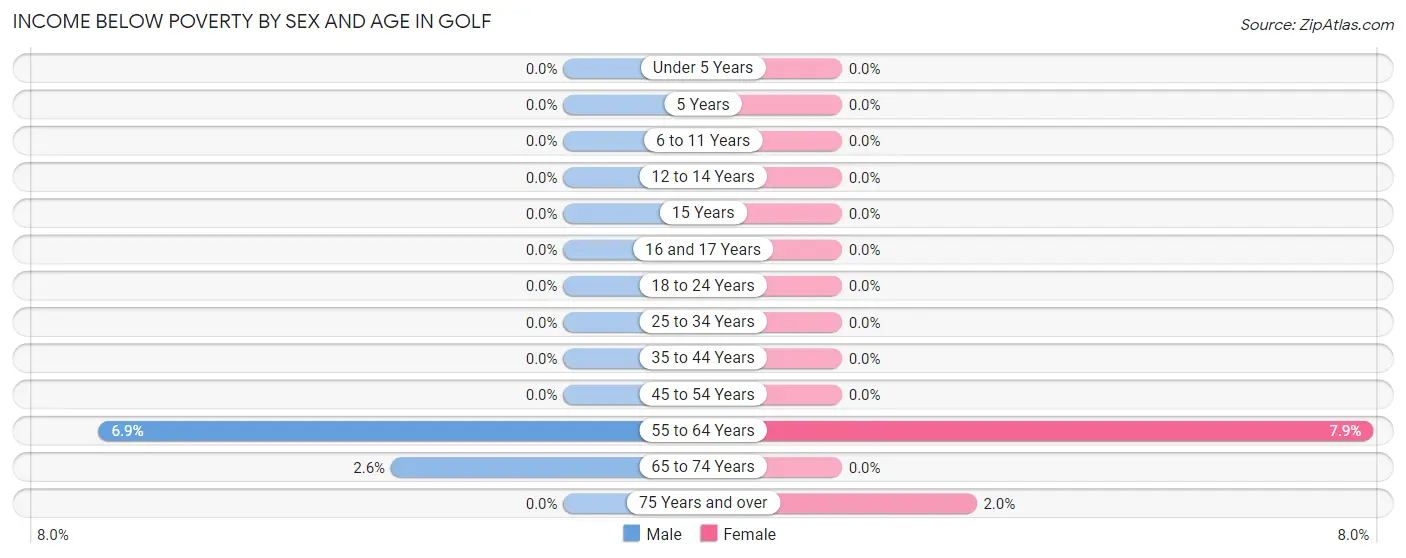
| Age Bracket | Male | Female |
| Under 5 Years | 0 (0.0%) | 0 (0.0%) |
| 5 Years | 0 (0.0%) | 0 (0.0%) |
| 6 to 11 Years | 0 (0.0%) | 0 (0.0%) |
| 12 to 14 Years | 0 (0.0%) | 0 (0.0%) |
| 15 Years | 0 (0.0%) | 0 (0.0%) |
| 16 and 17 Years | 0 (0.0%) | 0 (0.0%) |
| 18 to 24 Years | 0 (0.0%) | 0 (0.0%) |
| 25 to 34 Years | 0 (0.0%) | 0 (0.0%) |
| 35 to 44 Years | 0 (0.0%) | 0 (0.0%) |
| 45 to 54 Years | 0 (0.0%) | 0 (0.0%) |
| 55 to 64 Years | 2 (6.9%) | 3 (7.9%) |
| 65 to 74 Years | 1 (2.6%) | 0 (0.0%) |
| 75 Years and over | 0 (0.0%) | 1 (2.0%) |
| Total | 3 (2.4%) | 4 (3.0%) |
Income Above Poverty by Sex and Age in Golf
According to the poverty statistics in Golf, males aged 6 to 11 years and females aged 6 to 11 years are the age groups that are most secure financially, with 100.0% of males and 100.0% of females in these age groups living above the poverty line.
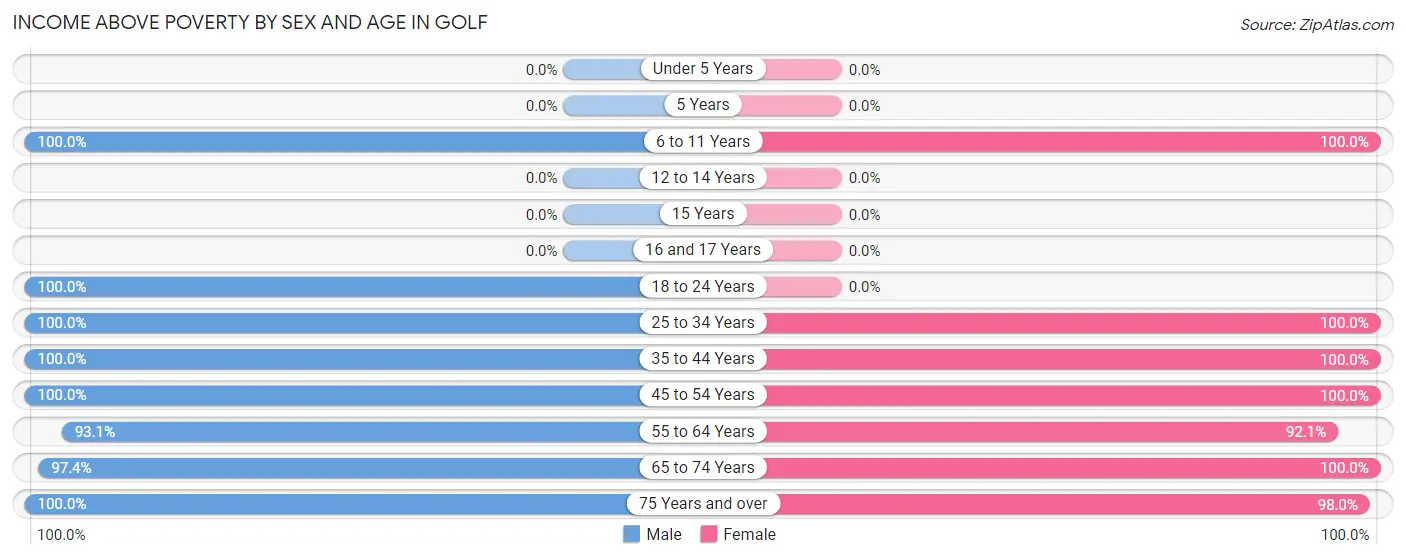
| Age Bracket | Male | Female |
| Under 5 Years | 0 (0.0%) | 0 (0.0%) |
| 5 Years | 0 (0.0%) | 0 (0.0%) |
| 6 to 11 Years | 1 (100.0%) | 2 (100.0%) |
| 12 to 14 Years | 0 (0.0%) | 0 (0.0%) |
| 15 Years | 0 (0.0%) | 0 (0.0%) |
| 16 and 17 Years | 0 (0.0%) | 0 (0.0%) |
| 18 to 24 Years | 4 (100.0%) | 0 (0.0%) |
| 25 to 34 Years | 1 (100.0%) | 2 (100.0%) |
| 35 to 44 Years | 6 (100.0%) | 4 (100.0%) |
| 45 to 54 Years | 4 (100.0%) | 5 (100.0%) |
| 55 to 64 Years | 27 (93.1%) | 35 (92.1%) |
| 65 to 74 Years | 38 (97.4%) | 30 (100.0%) |
| 75 Years and over | 40 (100.0%) | 49 (98.0%) |
| Total | 121 (97.6%) | 127 (97.0%) |
Income Below Poverty Among Married-Couple Families in Golf
The poverty statistics for married-couple families in Golf show that 4.2% or 4 of the total 96 families live below the poverty line. Families with no children have the highest poverty rate of 4.2%, comprising of 4 families. On the other hand, families with 1 or 2 children have the lowest poverty rate of 0.0%, which includes 0 families.
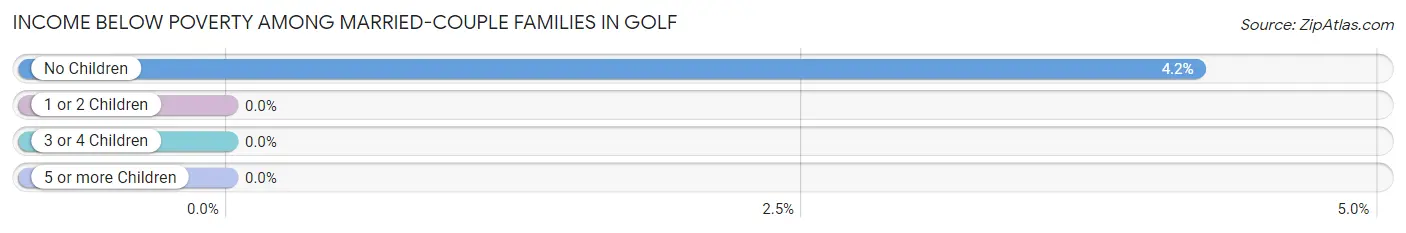
| Children | Above Poverty | Below Poverty |
| No Children | 91 (95.8%) | 4 (4.2%) |
| 1 or 2 Children | 1 (100.0%) | 0 (0.0%) |
| 3 or 4 Children | 0 (0.0%) | 0 (0.0%) |
| 5 or more Children | 0 (0.0%) | 0 (0.0%) |
| Total | 92 (95.8%) | 4 (4.2%) |
Income Below Poverty Among Single-Parent Households in Golf
| Children | Single Father | Single Mother |
| No Children | 0 (0.0%) | 0 (0.0%) |
| 1 or 2 Children | 0 (0.0%) | 0 (0.0%) |
| 3 or 4 Children | 0 (0.0%) | 0 (0.0%) |
| 5 or more Children | 0 (0.0%) | 0 (0.0%) |
| Total | 0 (0.0%) | 0 (0.0%) |
Income Below Poverty Among Married-Couple vs Single-Parent Households in Golf
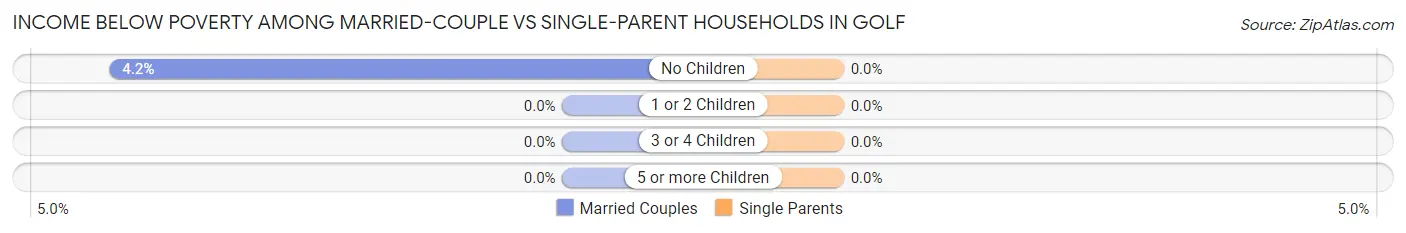
| Children | Married-Couple Families | Single-Parent Households |
| No Children | 4 (4.2%) | 0 (0.0%) |
| 1 or 2 Children | 0 (0.0%) | 0 (0.0%) |
| 3 or 4 Children | 0 (0.0%) | 0 (0.0%) |
| 5 or more Children | 0 (0.0%) | 0 (0.0%) |
| Total | 4 (4.2%) | 0 (0.0%) |
Race in Golf
The most populous races in Golf are White / Caucasian (251 | 98.4%), Asian (2 | 0.8%), and Two or more Races (2 | 0.8%).
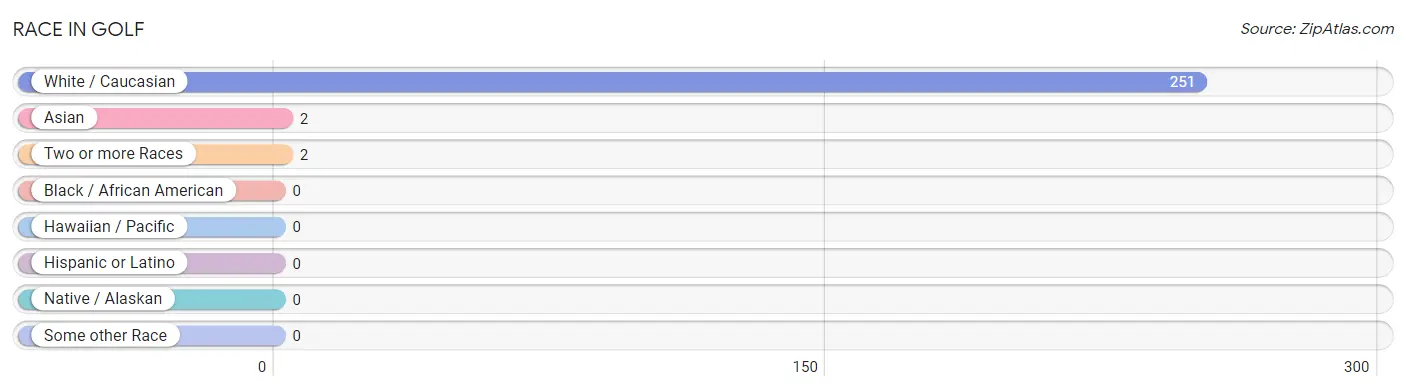
| Race | # Population | % Population |
| Asian | 2 | 0.8% |
| Black / African American | 0 | 0.0% |
| Hawaiian / Pacific | 0 | 0.0% |
| Hispanic or Latino | 0 | 0.0% |
| Native / Alaskan | 0 | 0.0% |
| White / Caucasian | 251 | 98.4% |
| Two or more Races | 2 | 0.8% |
| Some other Race | 0 | 0.0% |
| Total | 255 | 100.0% |
Ancestry in Golf
The most populous ancestries reported in Golf are English (55 | 21.6%), German (51 | 20.0%), Irish (50 | 19.6%), Scottish (27 | 10.6%), and European (21 | 8.2%), together accounting for 80.0% of all Golf residents.
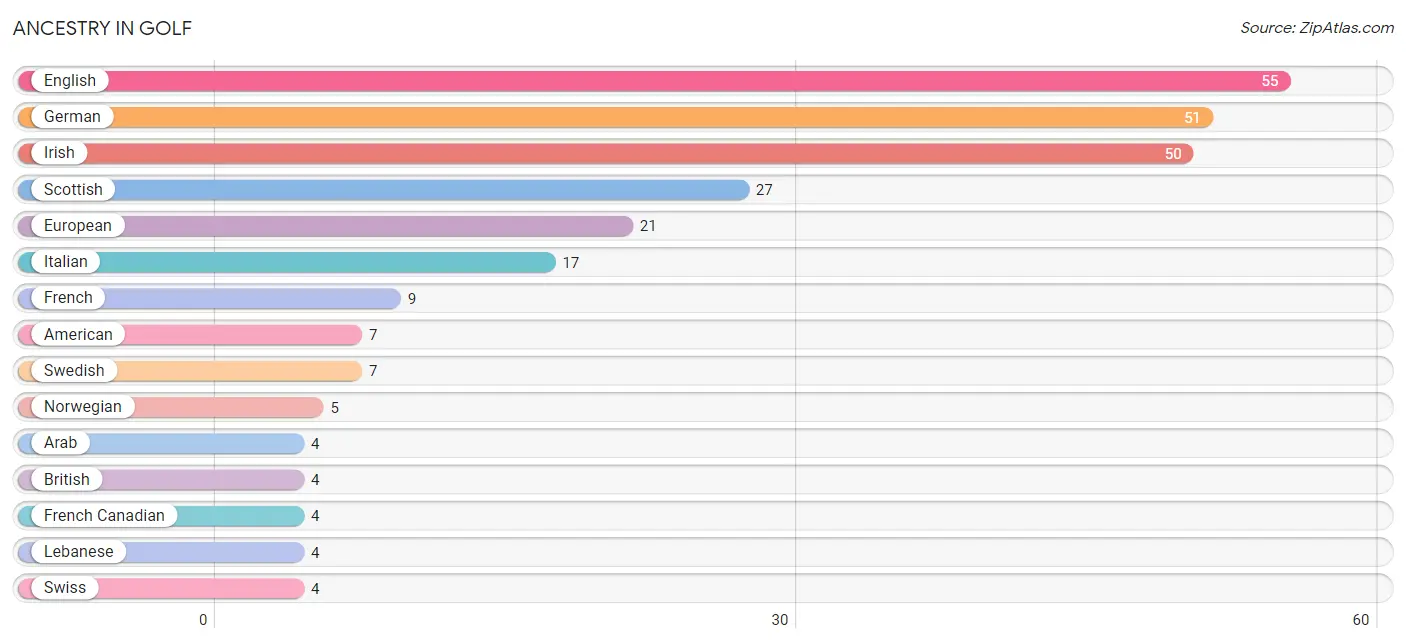
| Ancestry | # Population | % Population |
| American | 7 | 2.8% |
| Arab | 4 | 1.6% |
| Bhutanese | 1 | 0.4% |
| British | 4 | 1.6% |
| Canadian | 1 | 0.4% |
| Czech | 2 | 0.8% |
| Danish | 2 | 0.8% |
| Dutch | 3 | 1.2% |
| English | 55 | 21.6% |
| European | 21 | 8.2% |
| Finnish | 2 | 0.8% |
| French | 9 | 3.5% |
| French Canadian | 4 | 1.6% |
| German | 51 | 20.0% |
| Irish | 50 | 19.6% |
| Italian | 17 | 6.7% |
| Lebanese | 4 | 1.6% |
| Norwegian | 5 | 2.0% |
| Polish | 3 | 1.2% |
| Russian | 1 | 0.4% |
| Scandinavian | 1 | 0.4% |
| Scotch-Irish | 3 | 1.2% |
| Scottish | 27 | 10.6% |
| Slovak | 1 | 0.4% |
| Swedish | 7 | 2.8% |
| Swiss | 4 | 1.6% | View All 26 Rows |
Immigrants in Golf
The most numerous immigrant groups reported in Golf came from Canada (18 | 7.1%), Asia (6 | 2.4%), Europe (6 | 2.4%), Lebanon (4 | 1.6%), and Western Asia (4 | 1.6%), together accounting for 14.9% of all Golf residents.
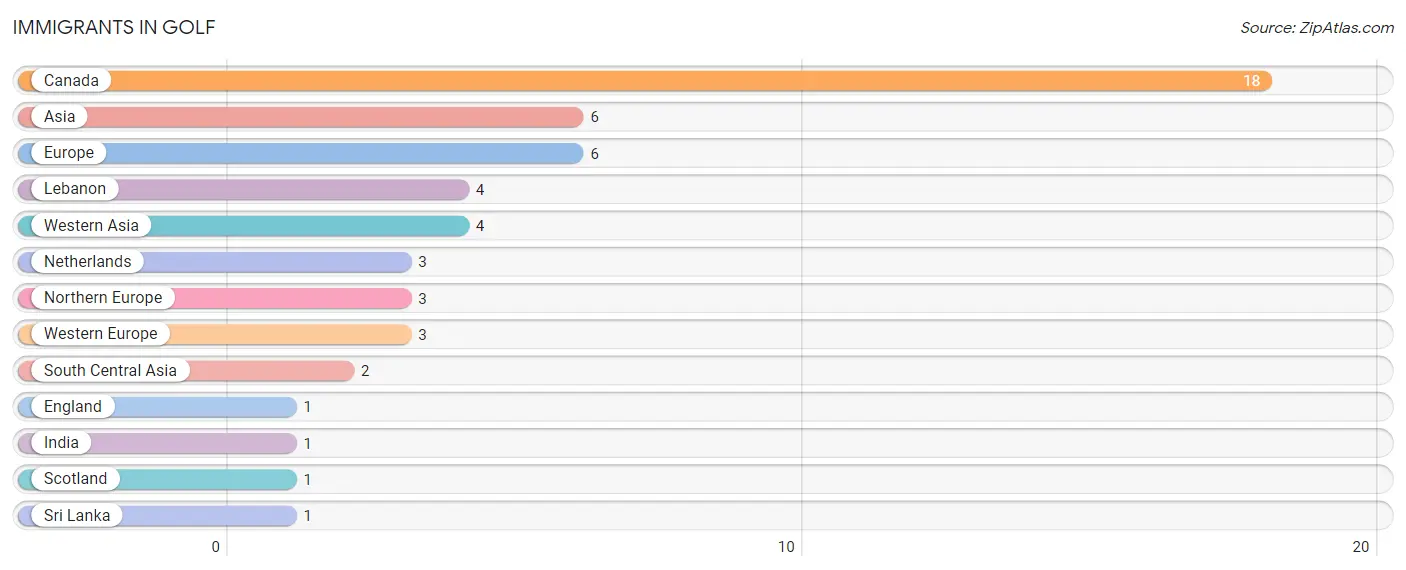
| Immigration Origin | # Population | % Population |
| Asia | 6 | 2.4% |
| Canada | 18 | 7.1% |
| England | 1 | 0.4% |
| Europe | 6 | 2.4% |
| India | 1 | 0.4% |
| Lebanon | 4 | 1.6% |
| Netherlands | 3 | 1.2% |
| Northern Europe | 3 | 1.2% |
| Scotland | 1 | 0.4% |
| South Central Asia | 2 | 0.8% |
| Sri Lanka | 1 | 0.4% |
| Western Asia | 4 | 1.6% |
| Western Europe | 3 | 1.2% | View All 13 Rows |
Sex and Age in Golf
Sex and Age in Golf
The most populous age groups in Golf are 70 to 74 Years (26 | 21.0%) for men and 60 to 64 Years (20 | 15.3%) for women.
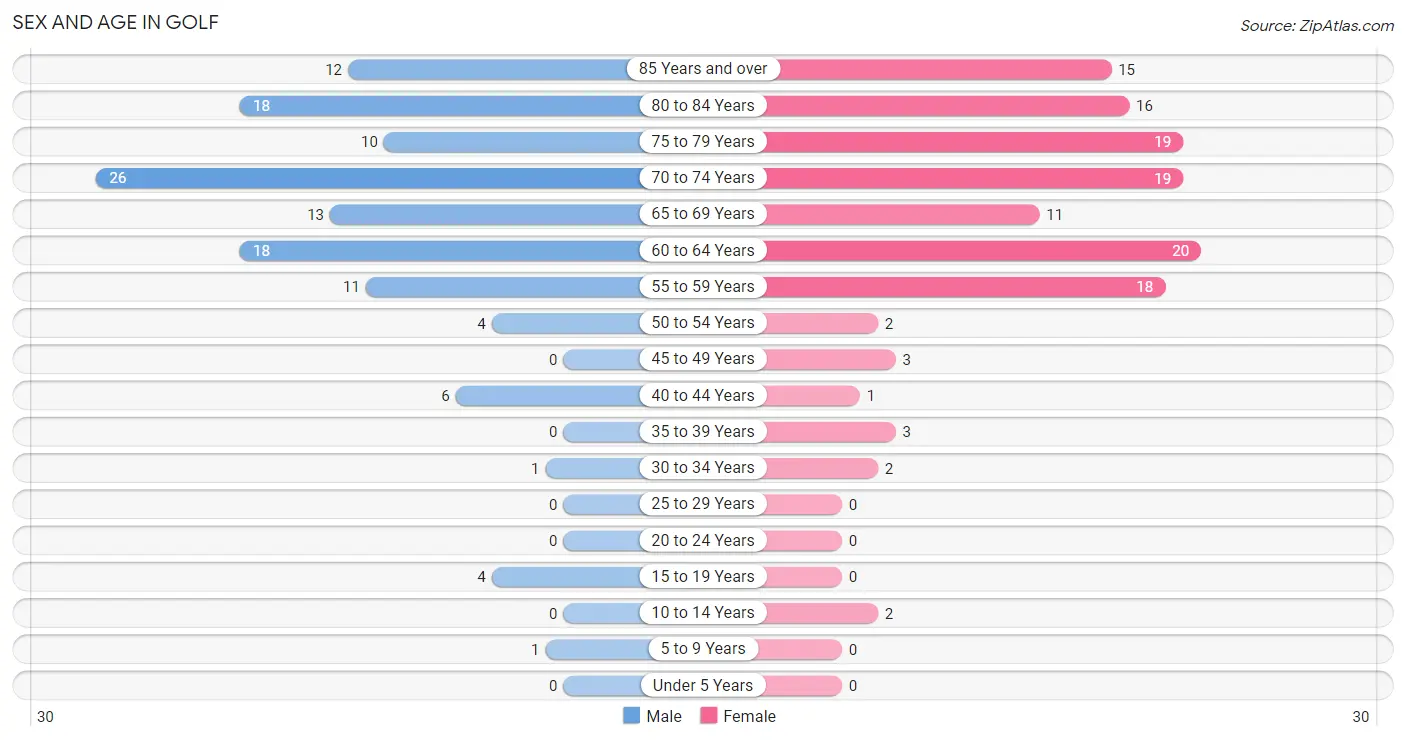
| Age Bracket | Male | Female |
| Under 5 Years | 0 (0.0%) | 0 (0.0%) |
| 5 to 9 Years | 1 (0.8%) | 0 (0.0%) |
| 10 to 14 Years | 0 (0.0%) | 2 (1.5%) |
| 15 to 19 Years | 4 (3.2%) | 0 (0.0%) |
| 20 to 24 Years | 0 (0.0%) | 0 (0.0%) |
| 25 to 29 Years | 0 (0.0%) | 0 (0.0%) |
| 30 to 34 Years | 1 (0.8%) | 2 (1.5%) |
| 35 to 39 Years | 0 (0.0%) | 3 (2.3%) |
| 40 to 44 Years | 6 (4.8%) | 1 (0.8%) |
| 45 to 49 Years | 0 (0.0%) | 3 (2.3%) |
| 50 to 54 Years | 4 (3.2%) | 2 (1.5%) |
| 55 to 59 Years | 11 (8.9%) | 18 (13.7%) |
| 60 to 64 Years | 18 (14.5%) | 20 (15.3%) |
| 65 to 69 Years | 13 (10.5%) | 11 (8.4%) |
| 70 to 74 Years | 26 (21.0%) | 19 (14.5%) |
| 75 to 79 Years | 10 (8.1%) | 19 (14.5%) |
| 80 to 84 Years | 18 (14.5%) | 16 (12.2%) |
| 85 Years and over | 12 (9.7%) | 15 (11.5%) |
| Total | 124 (100.0%) | 131 (100.0%) |
Families and Households in Golf
Median Family Size in Golf
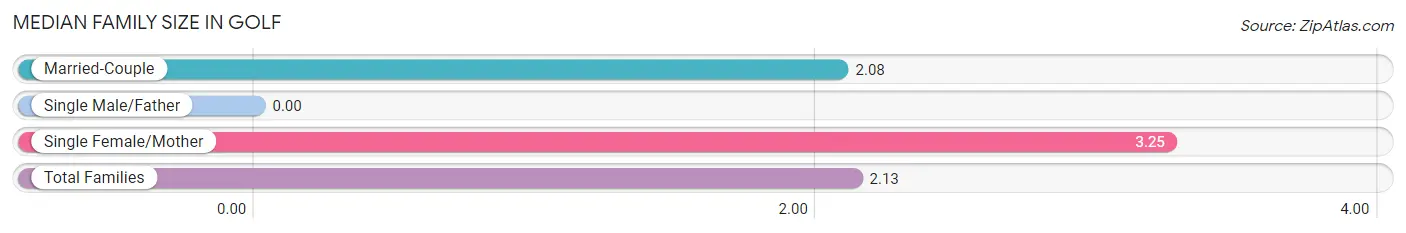
| Family Type | # Families | Family Size |
| Married-Couple | 96 (96.0%) | 2.08 |
| Single Male/Father | 0 (0.0%) | - |
| Single Female/Mother | 4 (4.0%) | 3.25 |
| Total Families | 100 (100.0%) | 2.13 |
Median Household Size in Golf
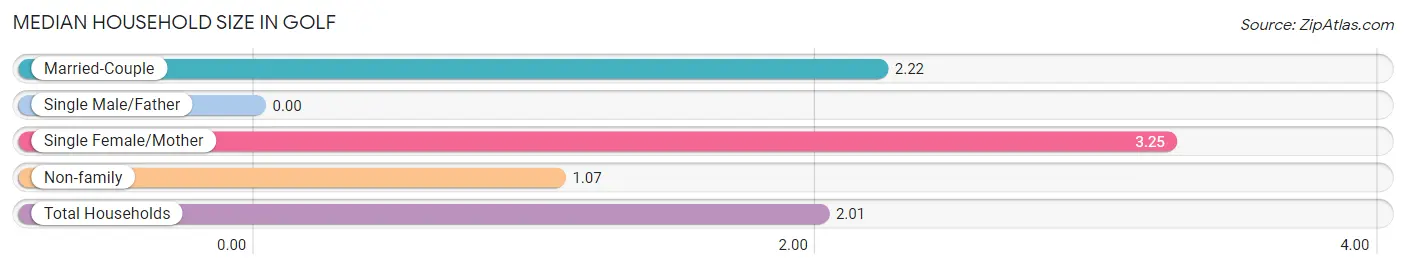
| Household Type | # Households | Household Size |
| Married-Couple | 96 (75.6%) | 2.22 |
| Single Male/Father | 0 (0.0%) | - |
| Single Female/Mother | 4 (3.2%) | 3.25 |
| Non-family | 27 (21.3%) | 1.07 |
| Total Households | 127 (100.0%) | 2.01 |
Household Size by Marriage Status in Golf
Out of a total of 127 households in Golf, 100 (78.7%) are family households, while 27 (21.3%) are nonfamily households. The most numerous type of family households are 2-person households, comprising 89, and the most common type of nonfamily households are 1-person households, comprising 25.
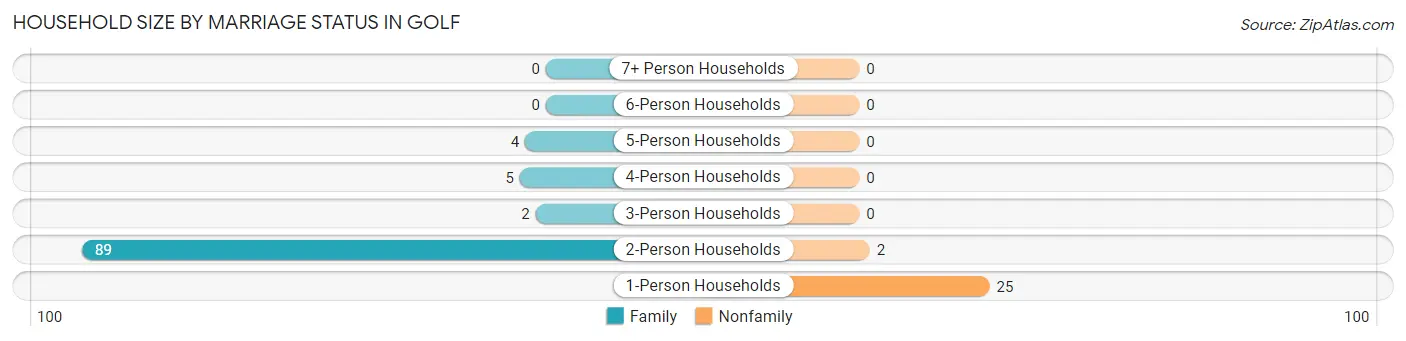
| Household Size | Family Households | Nonfamily Households |
| 1-Person Households | - | 25 (19.7%) |
| 2-Person Households | 89 (70.1%) | 2 (1.6%) |
| 3-Person Households | 2 (1.6%) | 0 (0.0%) |
| 4-Person Households | 5 (3.9%) | 0 (0.0%) |
| 5-Person Households | 4 (3.2%) | 0 (0.0%) |
| 6-Person Households | 0 (0.0%) | 0 (0.0%) |
| 7+ Person Households | 0 (0.0%) | 0 (0.0%) |
| Total | 100 (78.7%) | 27 (21.3%) |
Female Fertility in Golf
Fertility by Age in Golf
| Age Bracket | Women with Births | Births / 1,000 Women |
| 15 to 19 years | 0 (0.0%) | 0.0 |
| 20 to 34 years | 0 (0.0%) | 0.0 |
| 35 to 50 years | 0 (0.0%) | 0.0 |
| Total | 0 (0.0%) | 0.0 |
Fertility by Age by Marriage Status in Golf
| Age Bracket | Married | Unmarried |
| 15 to 19 years | 0 (0.0%) | 0 (0.0%) |
| 20 to 34 years | 0 (0.0%) | 0 (0.0%) |
| 35 to 50 years | 0 (0.0%) | 0 (0.0%) |
| Total | 0 (0.0%) | 0 (0.0%) |
Fertility by Education in Golf
| Educational Attainment | Women with Births | Births / 1,000 Women |
| Less than High School | 0 (0.0%) | 0.0 |
| High School Diploma | 0 (0.0%) | 0.0 |
| College or Associate's Degree | 0 (0.0%) | 0.0 |
| Bachelor's Degree | 0 (0.0%) | 0.0 |
| Graduate Degree | 0 (0.0%) | 0.0 |
| Total | 0 (0.0%) | 0.0 |
Fertility by Education by Marriage Status in Golf
| Educational Attainment | Married | Unmarried |
| Less than High School | 0 (0.0%) | 0 (0.0%) |
| High School Diploma | 0 (0.0%) | 0 (0.0%) |
| College or Associate's Degree | 0 (0.0%) | 0 (0.0%) |
| Bachelor's Degree | 0 (0.0%) | 0 (0.0%) |
| Graduate Degree | 0 (0.0%) | 0 (0.0%) |
| Total | 0 (0.0%) | 0 (0.0%) |
Employment Characteristics in Golf
Employment by Class of Employer in Golf
Among the 86 employed individuals in Golf, private company employees (49 | 57.0%), not-for-profit organizations (21 | 24.4%), and self-employed (incorporated) (10 | 11.6%) make up the most common classes of employment.
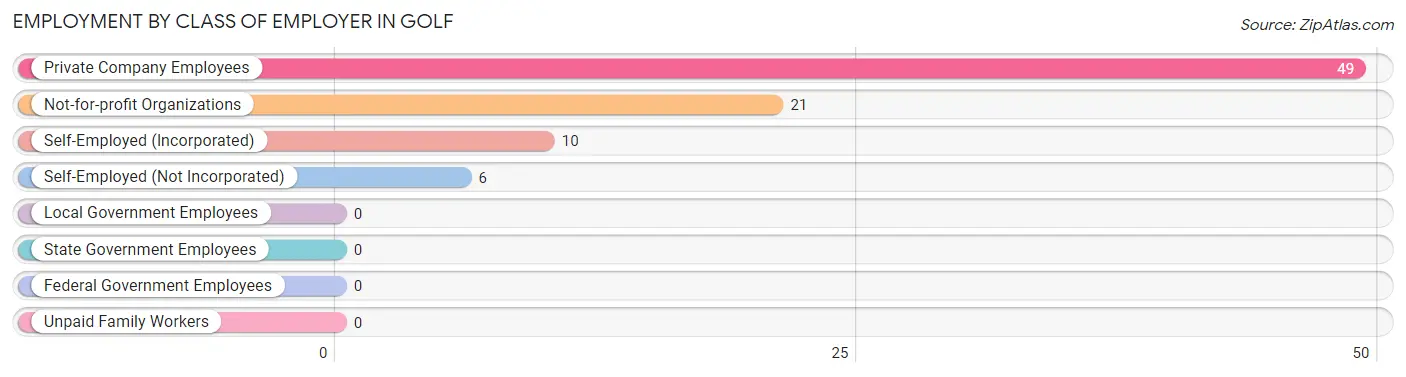
| Employer Class | # Employees | % Employees |
| Private Company Employees | 49 | 57.0% |
| Self-Employed (Incorporated) | 10 | 11.6% |
| Self-Employed (Not Incorporated) | 6 | 7.0% |
| Not-for-profit Organizations | 21 | 24.4% |
| Local Government Employees | 0 | 0.0% |
| State Government Employees | 0 | 0.0% |
| Federal Government Employees | 0 | 0.0% |
| Unpaid Family Workers | 0 | 0.0% |
| Total | 86 | 100.0% |
Employment Status by Age in Golf
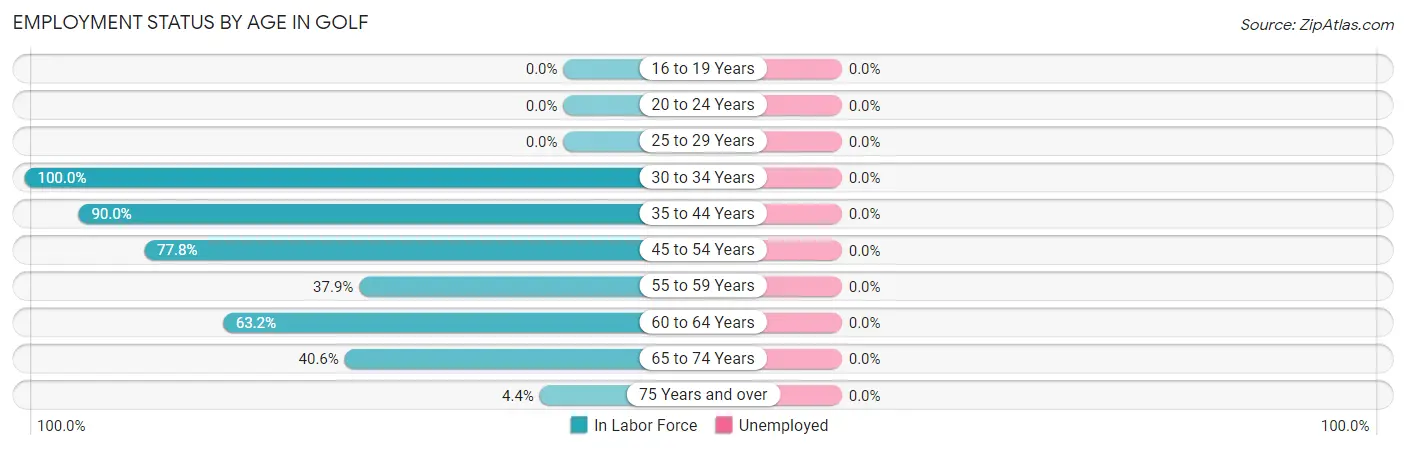
| Age Bracket | In Labor Force | Unemployed |
| 16 to 19 Years | 0 (0.0%) | 0 (0.0%) |
| 20 to 24 Years | 0 (0.0%) | 0 (0.0%) |
| 25 to 29 Years | 0 (0.0%) | 0 (0.0%) |
| 30 to 34 Years | 3 (100.0%) | 0 (0.0%) |
| 35 to 44 Years | 9 (90.0%) | 0 (0.0%) |
| 45 to 54 Years | 7 (77.8%) | 0 (0.0%) |
| 55 to 59 Years | 11 (37.9%) | 0 (0.0%) |
| 60 to 64 Years | 24 (63.2%) | 0 (0.0%) |
| 65 to 74 Years | 28 (40.6%) | 0 (0.0%) |
| 75 Years and over | 4 (4.4%) | 0 (0.0%) |
| Total | 86 (34.1%) | 0 (0.0%) |
Employment Status by Educational Attainment in Golf
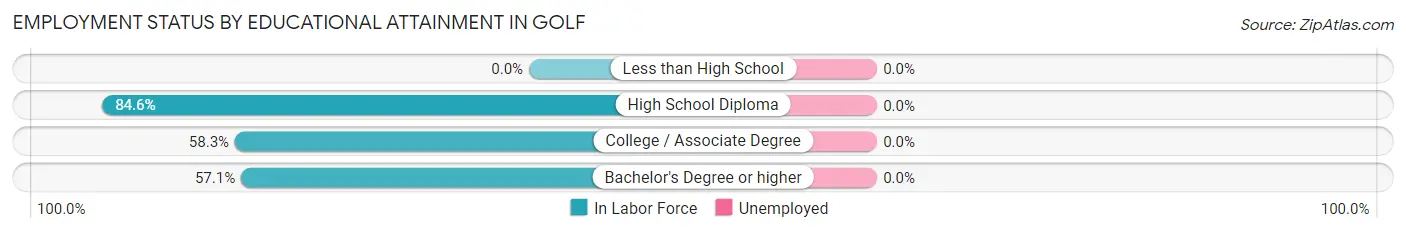
| Educational Attainment | In Labor Force | Unemployed |
| Less than High School | 0 (0.0%) | 0 (0.0%) |
| High School Diploma | 11 (84.6%) | 0 (0.0%) |
| College / Associate Degree | 7 (58.3%) | 0 (0.0%) |
| Bachelor's Degree or higher | 36 (57.1%) | 0 (0.0%) |
| Total | 54 (60.7%) | 0 (0.0%) |
Employment Occupations by Sex in Golf
Management, Business, Science and Arts Occupations
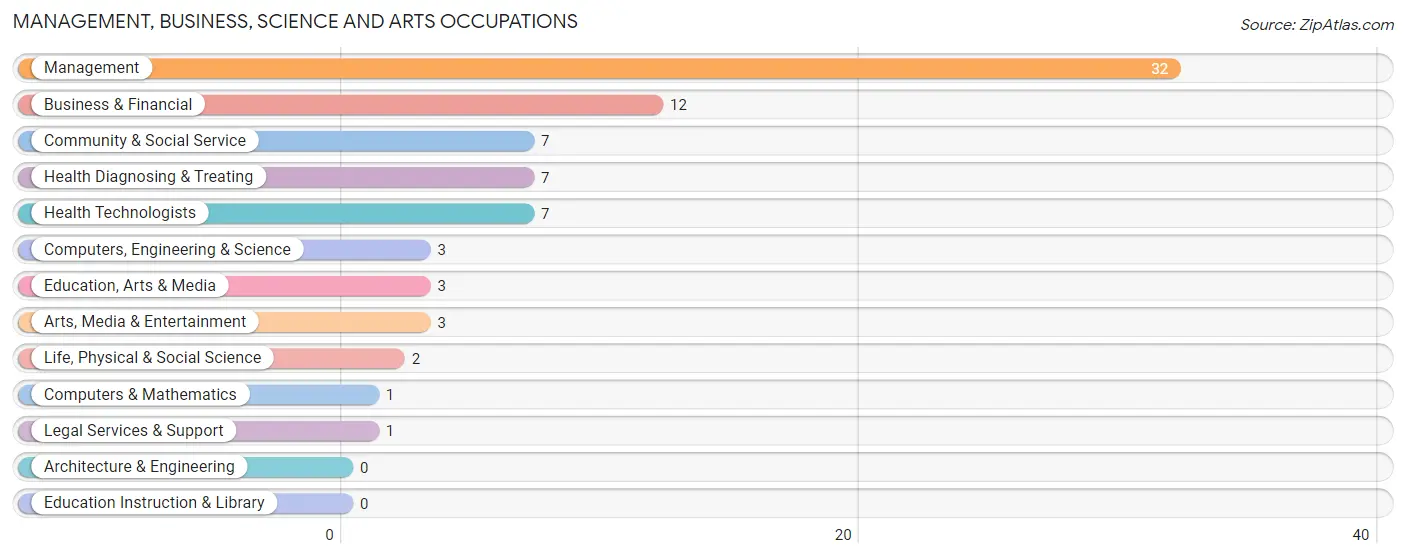
The most common Management, Business, Science and Arts occupations in Golf are Management (32 | 37.2%), Business & Financial (12 | 14.0%), Community & Social Service (7 | 8.1%), Health Diagnosing & Treating (7 | 8.1%), and Health Technologists (7 | 8.1%).
Management, Business, Science and Arts Occupations by Sex
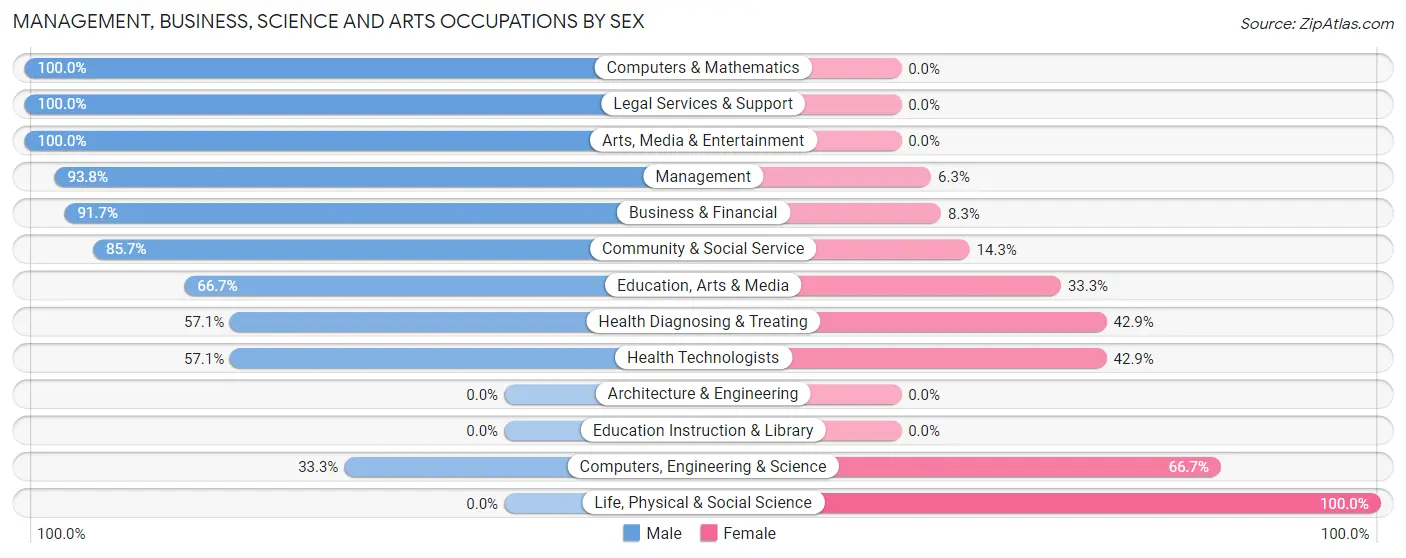
Within the Management, Business, Science and Arts occupations in Golf, the most male-oriented occupations are Computers & Mathematics (100.0%), Legal Services & Support (100.0%), and Arts, Media & Entertainment (100.0%), while the most female-oriented occupations are Life, Physical & Social Science (100.0%), Computers, Engineering & Science (66.7%), and Health Diagnosing & Treating (42.9%).
| Occupation | Male | Female |
| Management | 30 (93.8%) | 2 (6.2%) |
| Business & Financial | 11 (91.7%) | 1 (8.3%) |
| Computers, Engineering & Science | 1 (33.3%) | 2 (66.7%) |
| Computers & Mathematics | 1 (100.0%) | 0 (0.0%) |
| Architecture & Engineering | 0 (0.0%) | 0 (0.0%) |
| Life, Physical & Social Science | 0 (0.0%) | 2 (100.0%) |
| Community & Social Service | 6 (85.7%) | 1 (14.3%) |
| Education, Arts & Media | 2 (66.7%) | 1 (33.3%) |
| Legal Services & Support | 1 (100.0%) | 0 (0.0%) |
| Education Instruction & Library | 0 (0.0%) | 0 (0.0%) |
| Arts, Media & Entertainment | 3 (100.0%) | 0 (0.0%) |
| Health Diagnosing & Treating | 4 (57.1%) | 3 (42.9%) |
| Health Technologists | 4 (57.1%) | 3 (42.9%) |
| Total (Category) | 52 (85.3%) | 9 (14.7%) |
| Total (Overall) | 66 (76.7%) | 20 (23.3%) |
Services Occupations
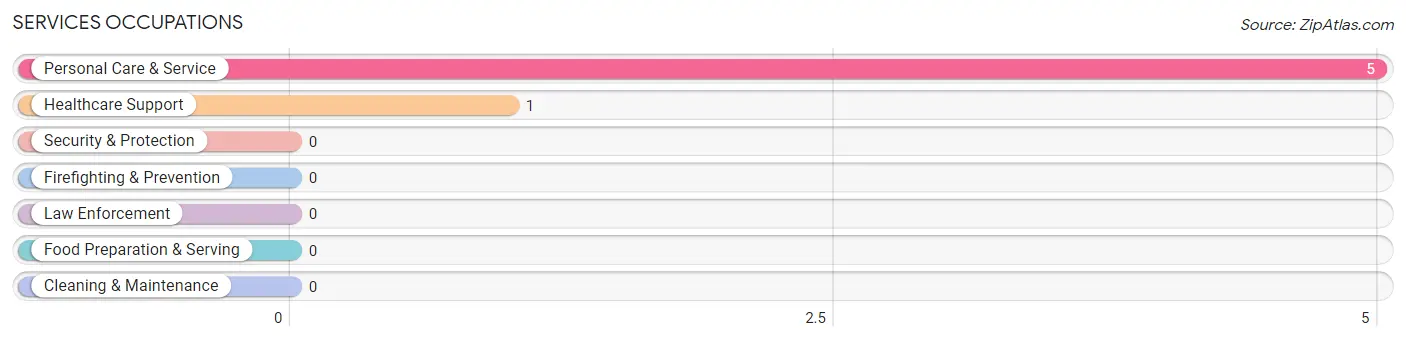
The most common Services occupations in Golf are Personal Care & Service (5 | 5.8%), and Healthcare Support (1 | 1.2%).
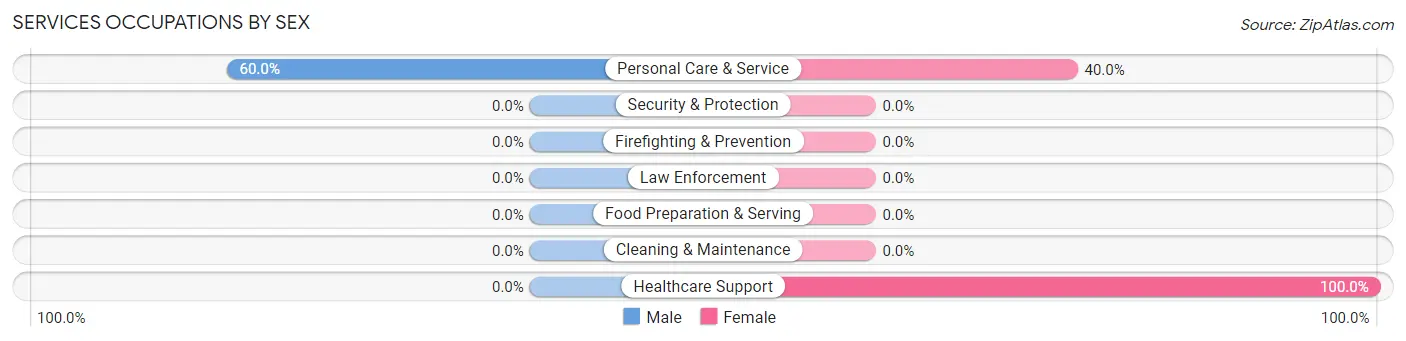
Services Occupations by Sex
| Occupation | Male | Female |
| Healthcare Support | 0 (0.0%) | 1 (100.0%) |
| Security & Protection | 0 (0.0%) | 0 (0.0%) |
| Firefighting & Prevention | 0 (0.0%) | 0 (0.0%) |
| Law Enforcement | 0 (0.0%) | 0 (0.0%) |
| Food Preparation & Serving | 0 (0.0%) | 0 (0.0%) |
| Cleaning & Maintenance | 0 (0.0%) | 0 (0.0%) |
| Personal Care & Service | 3 (60.0%) | 2 (40.0%) |
| Total (Category) | 3 (50.0%) | 3 (50.0%) |
| Total (Overall) | 66 (76.7%) | 20 (23.3%) |
Sales and Office Occupations
The most common Sales and Office occupations in Golf are Sales & Related (6 | 7.0%), and Office & Administration (3 | 3.5%).
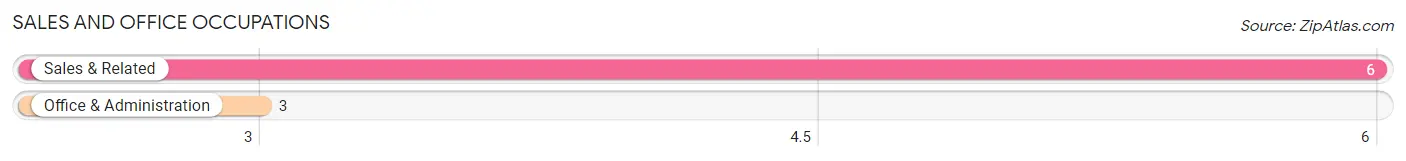
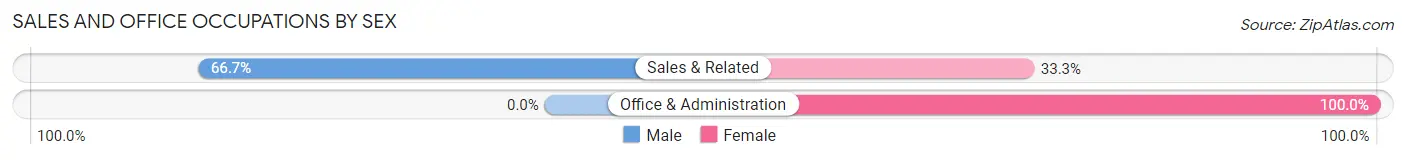
Sales and Office Occupations by Sex
| Occupation | Male | Female |
| Sales & Related | 4 (66.7%) | 2 (33.3%) |
| Office & Administration | 0 (0.0%) | 3 (100.0%) |
| Total (Category) | 4 (44.4%) | 5 (55.6%) |
| Total (Overall) | 66 (76.7%) | 20 (23.3%) |
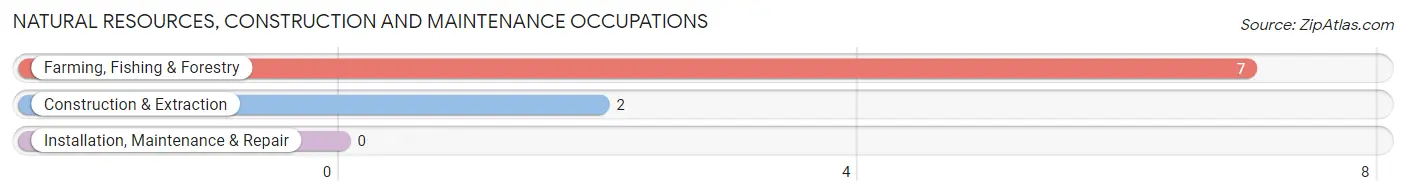
Natural Resources, Construction and Maintenance Occupations
The most common Natural Resources, Construction and Maintenance occupations in Golf are Farming, Fishing & Forestry (7 | 8.1%), and Construction & Extraction (2 | 2.3%).
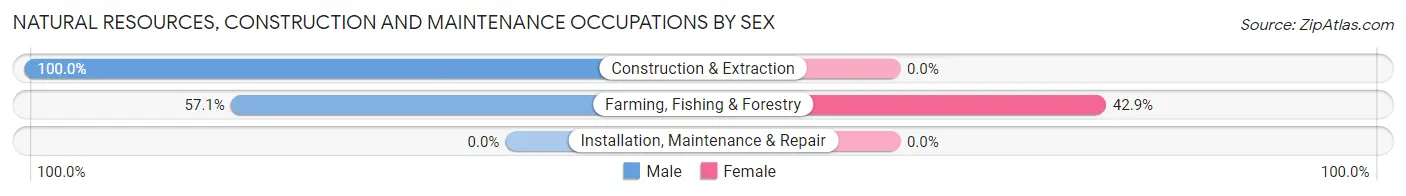
Natural Resources, Construction and Maintenance Occupations by Sex
| Occupation | Male | Female |
| Farming, Fishing & Forestry | 4 (57.1%) | 3 (42.9%) |
| Construction & Extraction | 2 (100.0%) | 0 (0.0%) |
| Installation, Maintenance & Repair | 0 (0.0%) | 0 (0.0%) |
| Total (Category) | 6 (66.7%) | 3 (33.3%) |
| Total (Overall) | 66 (76.7%) | 20 (23.3%) |
Production, Transportation and Moving Occupations
The most common Production, Transportation and Moving occupations in Golf are , and Production (1 | 1.2%).
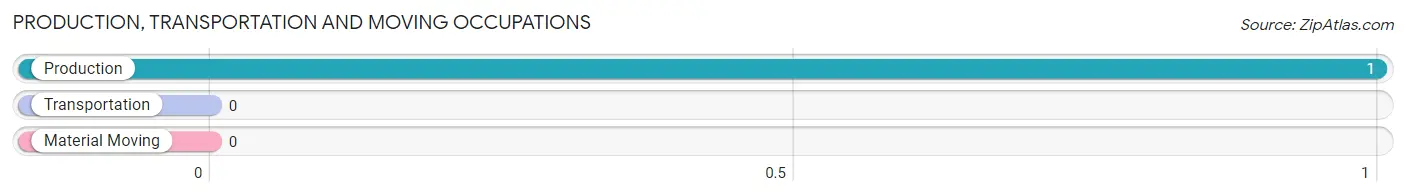
Production, Transportation and Moving Occupations by Sex
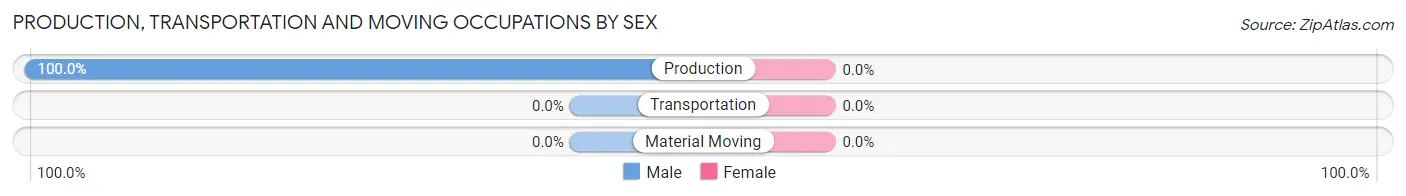
| Occupation | Male | Female |
| Production | 1 (100.0%) | 0 (0.0%) |
| Transportation | 0 (0.0%) | 0 (0.0%) |
| Material Moving | 0 (0.0%) | 0 (0.0%) |
| Total (Category) | 1 (100.0%) | 0 (0.0%) |
| Total (Overall) | 66 (76.7%) | 20 (23.3%) |
Employment Industries by Sex in Golf
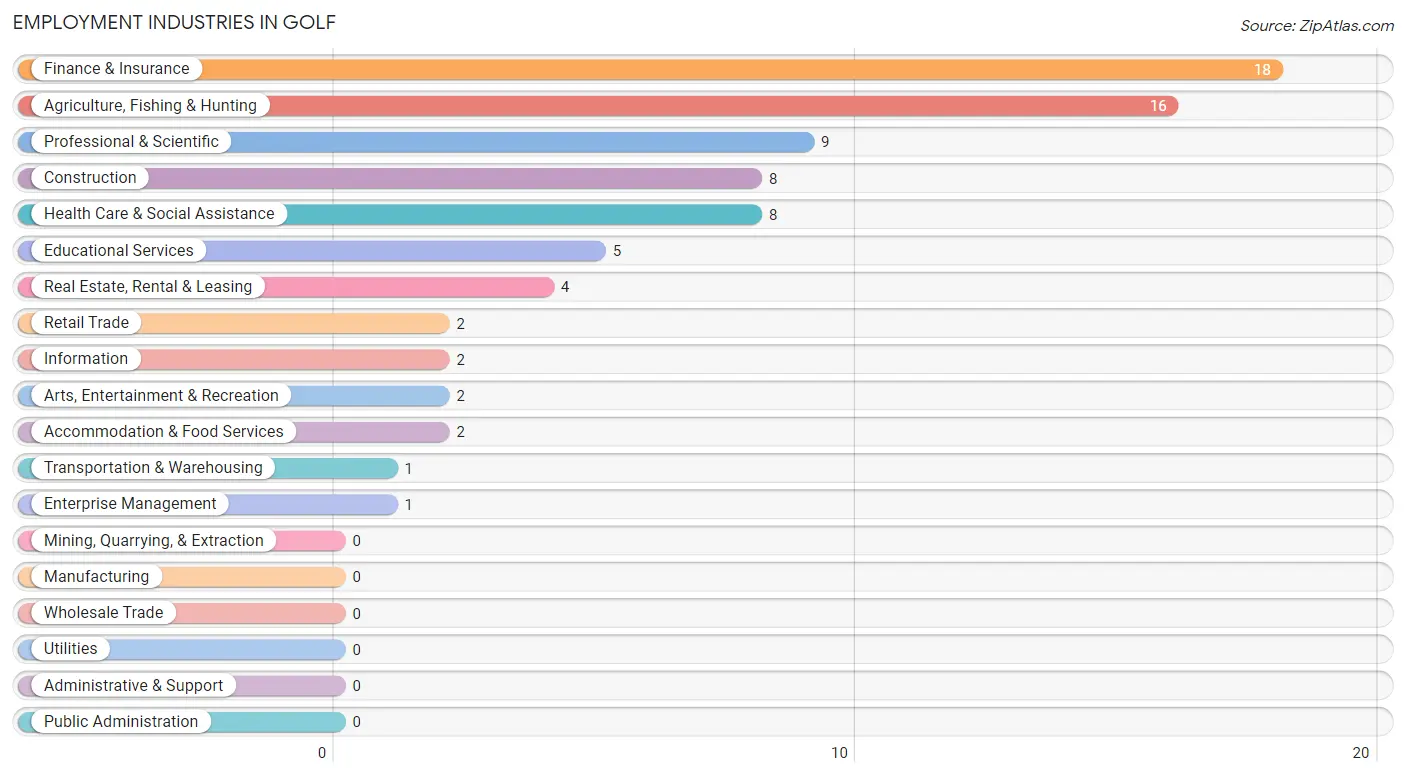
Employment Industries in Golf
The major employment industries in Golf include Finance & Insurance (18 | 20.9%), Agriculture, Fishing & Hunting (16 | 18.6%), Professional & Scientific (9 | 10.5%), Construction (8 | 9.3%), and Health Care & Social Assistance (8 | 9.3%).
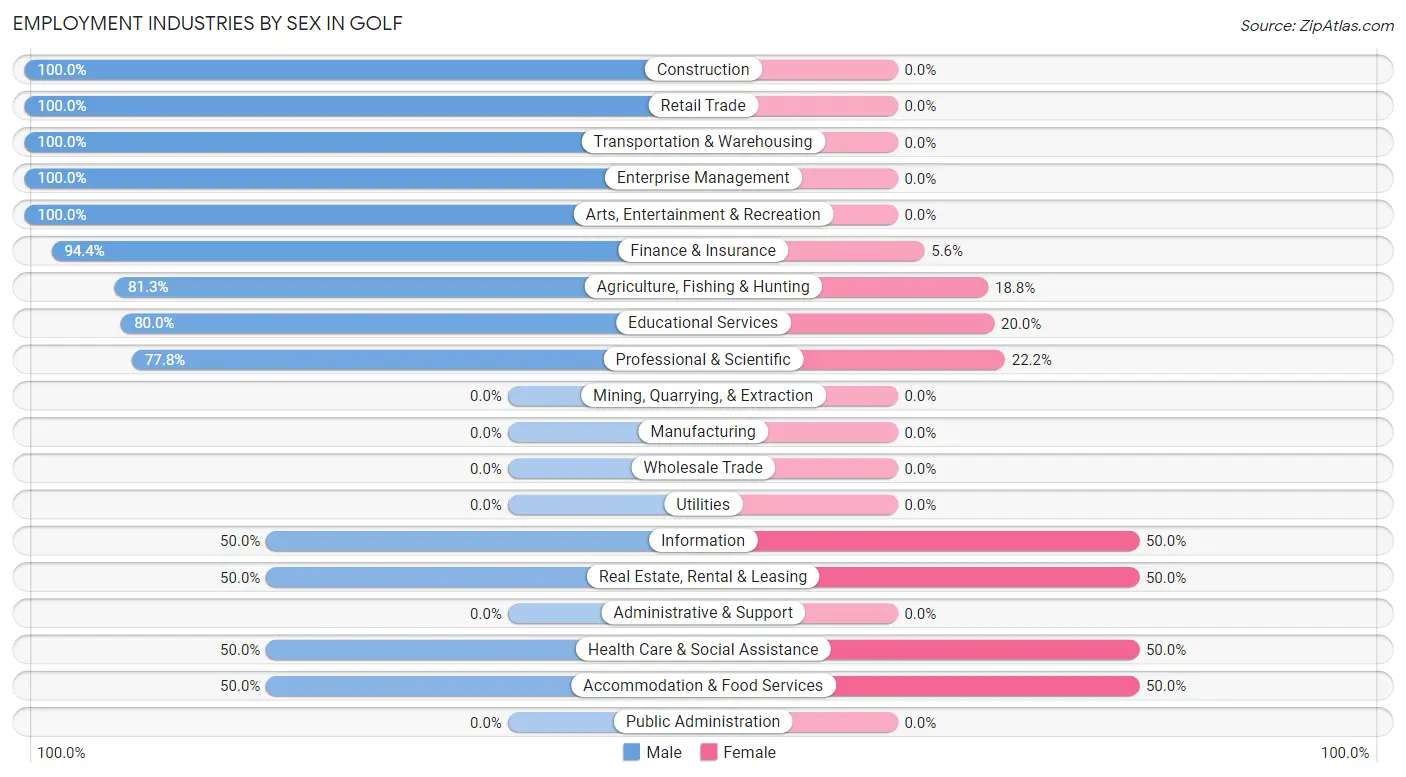
Employment Industries by Sex in Golf
The Golf industries that see more men than women are Construction (100.0%), Retail Trade (100.0%), and Transportation & Warehousing (100.0%), whereas the industries that tend to have a higher number of women are Information (50.0%), Real Estate, Rental & Leasing (50.0%), and Health Care & Social Assistance (50.0%).
| Industry | Male | Female |
| Agriculture, Fishing & Hunting | 13 (81.2%) | 3 (18.8%) |
| Mining, Quarrying, & Extraction | 0 (0.0%) | 0 (0.0%) |
| Construction | 8 (100.0%) | 0 (0.0%) |
| Manufacturing | 0 (0.0%) | 0 (0.0%) |
| Wholesale Trade | 0 (0.0%) | 0 (0.0%) |
| Retail Trade | 2 (100.0%) | 0 (0.0%) |
| Transportation & Warehousing | 1 (100.0%) | 0 (0.0%) |
| Utilities | 0 (0.0%) | 0 (0.0%) |
| Information | 1 (50.0%) | 1 (50.0%) |
| Finance & Insurance | 17 (94.4%) | 1 (5.6%) |
| Real Estate, Rental & Leasing | 2 (50.0%) | 2 (50.0%) |
| Professional & Scientific | 7 (77.8%) | 2 (22.2%) |
| Enterprise Management | 1 (100.0%) | 0 (0.0%) |
| Administrative & Support | 0 (0.0%) | 0 (0.0%) |
| Educational Services | 4 (80.0%) | 1 (20.0%) |
| Health Care & Social Assistance | 4 (50.0%) | 4 (50.0%) |
| Arts, Entertainment & Recreation | 2 (100.0%) | 0 (0.0%) |
| Accommodation & Food Services | 1 (50.0%) | 1 (50.0%) |
| Public Administration | 0 (0.0%) | 0 (0.0%) |
| Total | 66 (76.7%) | 20 (23.3%) |
Education in Golf
School Enrollment in Golf
The most common levels of schooling among the 7 students in Golf are high school (4 | 57.1%), middle school (2 | 28.6%), and elementary school (1 | 14.3%).
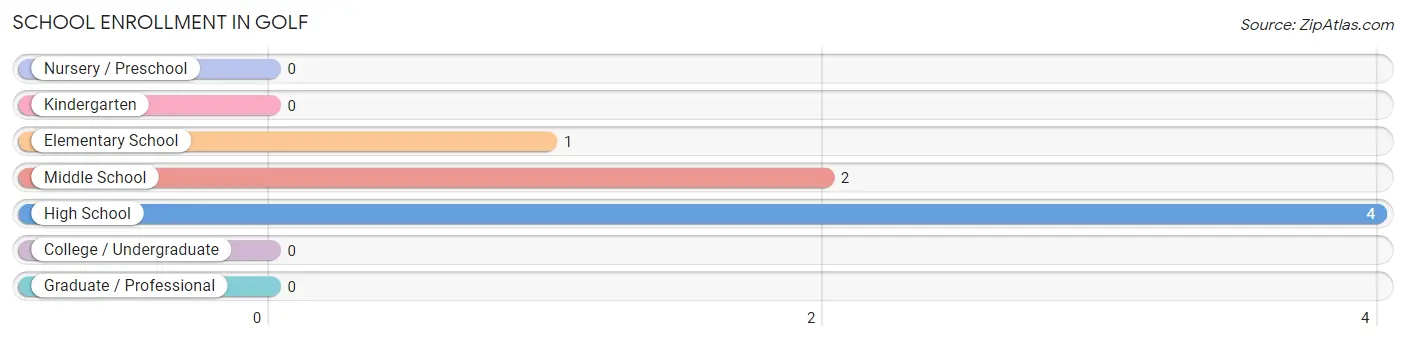
| School Level | # Students | % Students |
| Nursery / Preschool | 0 | 0.0% |
| Kindergarten | 0 | 0.0% |
| Elementary School | 1 | 14.3% |
| Middle School | 2 | 28.6% |
| High School | 4 | 57.1% |
| College / Undergraduate | 0 | 0.0% |
| Graduate / Professional | 0 | 0.0% |
| Total | 7 | 100.0% |
School Enrollment by Age by Funding Source in Golf
Out of a total of 7 students who are enrolled in schools in Golf, 6 (85.7%) attend a private institution, while the remaining 1 (14.3%) are enrolled in public schools. The age group of 10 to 14 year olds has the highest likelihood of being enrolled in private schools, with 2 (100.0% in the age bracket) enrolled. Conversely, the age group of 5 to 9 year old has the lowest likelihood of being enrolled in a private school, with 1 (100.0% in the age bracket) attending a public institution.
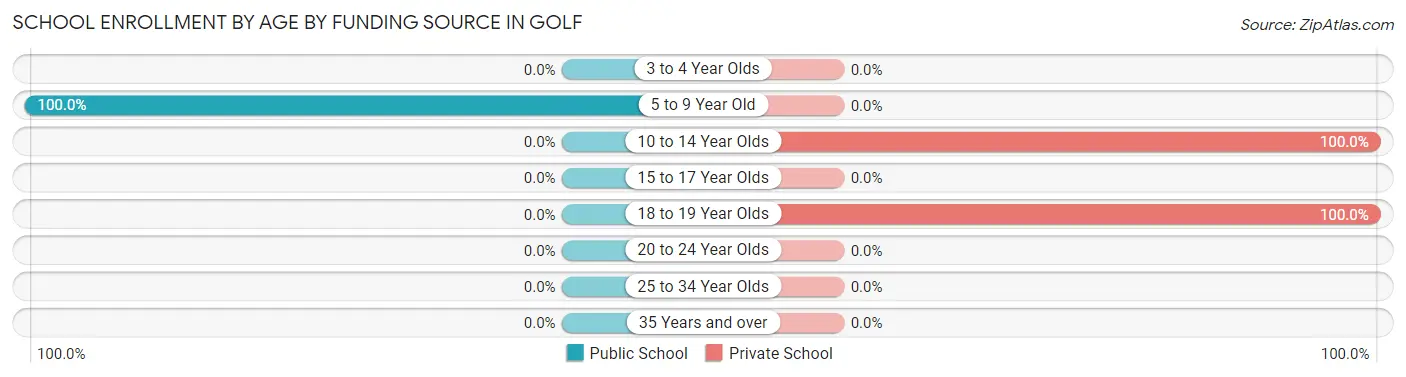
| Age Bracket | Public School | Private School |
| 3 to 4 Year Olds | 0 (0.0%) | 0 (0.0%) |
| 5 to 9 Year Old | 1 (100.0%) | 0 (0.0%) |
| 10 to 14 Year Olds | 0 (0.0%) | 2 (100.0%) |
| 15 to 17 Year Olds | 0 (0.0%) | 0 (0.0%) |
| 18 to 19 Year Olds | 0 (0.0%) | 4 (100.0%) |
| 20 to 24 Year Olds | 0 (0.0%) | 0 (0.0%) |
| 25 to 34 Year Olds | 0 (0.0%) | 0 (0.0%) |
| 35 Years and over | 0 (0.0%) | 0 (0.0%) |
| Total | 1 (14.3%) | 6 (85.7%) |
Educational Attainment by Field of Study in Golf
Business (50 | 24.4%), social sciences (34 | 16.6%), education (24 | 11.7%), communications (19 | 9.3%), and liberal arts & history (16 | 7.8%) are the most common fields of study among 205 individuals in Golf who have obtained a bachelor's degree or higher.
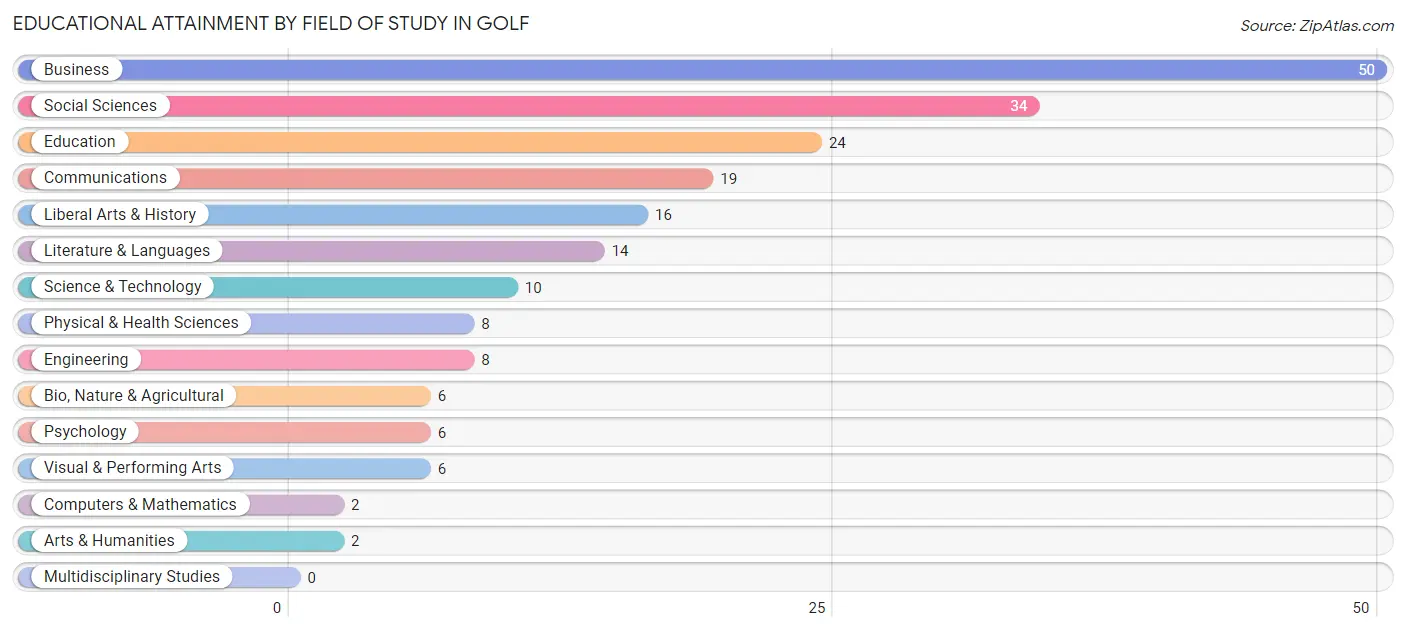
| Field of Study | # Graduates | % Graduates |
| Computers & Mathematics | 2 | 1.0% |
| Bio, Nature & Agricultural | 6 | 2.9% |
| Physical & Health Sciences | 8 | 3.9% |
| Psychology | 6 | 2.9% |
| Social Sciences | 34 | 16.6% |
| Engineering | 8 | 3.9% |
| Multidisciplinary Studies | 0 | 0.0% |
| Science & Technology | 10 | 4.9% |
| Business | 50 | 24.4% |
| Education | 24 | 11.7% |
| Literature & Languages | 14 | 6.8% |
| Liberal Arts & History | 16 | 7.8% |
| Visual & Performing Arts | 6 | 2.9% |
| Communications | 19 | 9.3% |
| Arts & Humanities | 2 | 1.0% |
| Total | 205 | 100.0% |
Transportation & Commute in Golf
Vehicle Availability by Sex in Golf
The most prevalent vehicle ownership categories in Golf are males with 2 vehicles (51, accounting for 77.3%) and females with 2 vehicles (15, making up 255.0%).
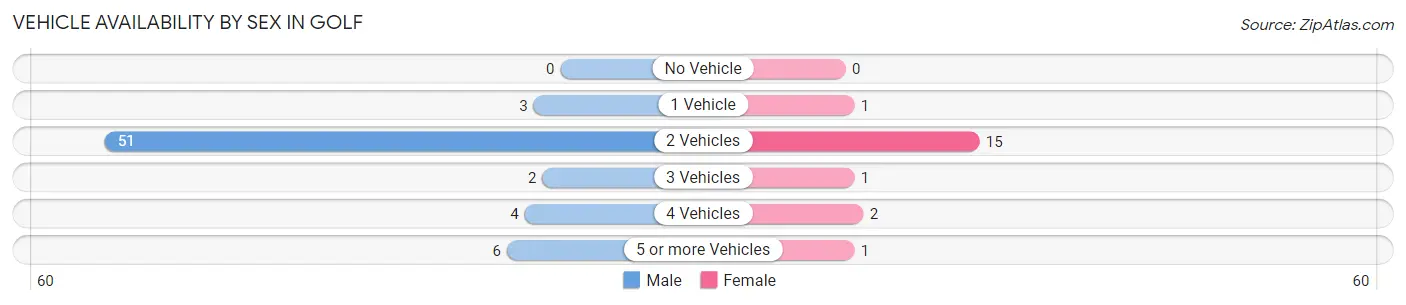
| Vehicles Available | Male | Female |
| No Vehicle | 0 (0.0%) | 0 (0.0%) |
| 1 Vehicle | 3 (4.5%) | 1 (5.0%) |
| 2 Vehicles | 51 (77.3%) | 15 (75.0%) |
| 3 Vehicles | 2 (3.0%) | 1 (5.0%) |
| 4 Vehicles | 4 (6.1%) | 2 (10.0%) |
| 5 or more Vehicles | 6 (9.1%) | 1 (5.0%) |
| Total | 66 (100.0%) | 20 (100.0%) |
Commute Time in Golf
The most frequently occuring commute durations in Golf are 10 to 14 minutes (19 commuters, 28.8%), less than 5 minutes (17 commuters, 25.8%), and 20 to 24 minutes (9 commuters, 13.6%).
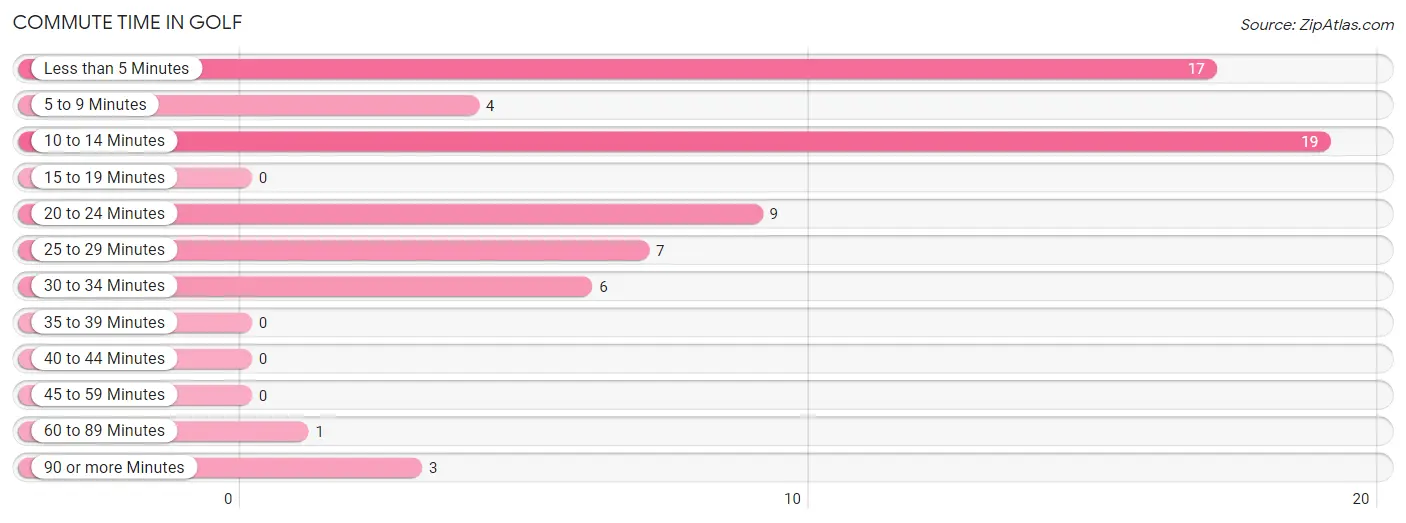
| Commute Time | # Commuters | % Commuters |
| Less than 5 Minutes | 17 | 25.8% |
| 5 to 9 Minutes | 4 | 6.1% |
| 10 to 14 Minutes | 19 | 28.8% |
| 15 to 19 Minutes | 0 | 0.0% |
| 20 to 24 Minutes | 9 | 13.6% |
| 25 to 29 Minutes | 7 | 10.6% |
| 30 to 34 Minutes | 6 | 9.1% |
| 35 to 39 Minutes | 0 | 0.0% |
| 40 to 44 Minutes | 0 | 0.0% |
| 45 to 59 Minutes | 0 | 0.0% |
| 60 to 89 Minutes | 1 | 1.5% |
| 90 or more Minutes | 3 | 4.5% |
Commute Time by Sex in Golf
The most common commute times in Golf are 10 to 14 minutes (14 commuters, 25.5%) for males and 10 to 14 minutes (5 commuters, 45.5%) for females.
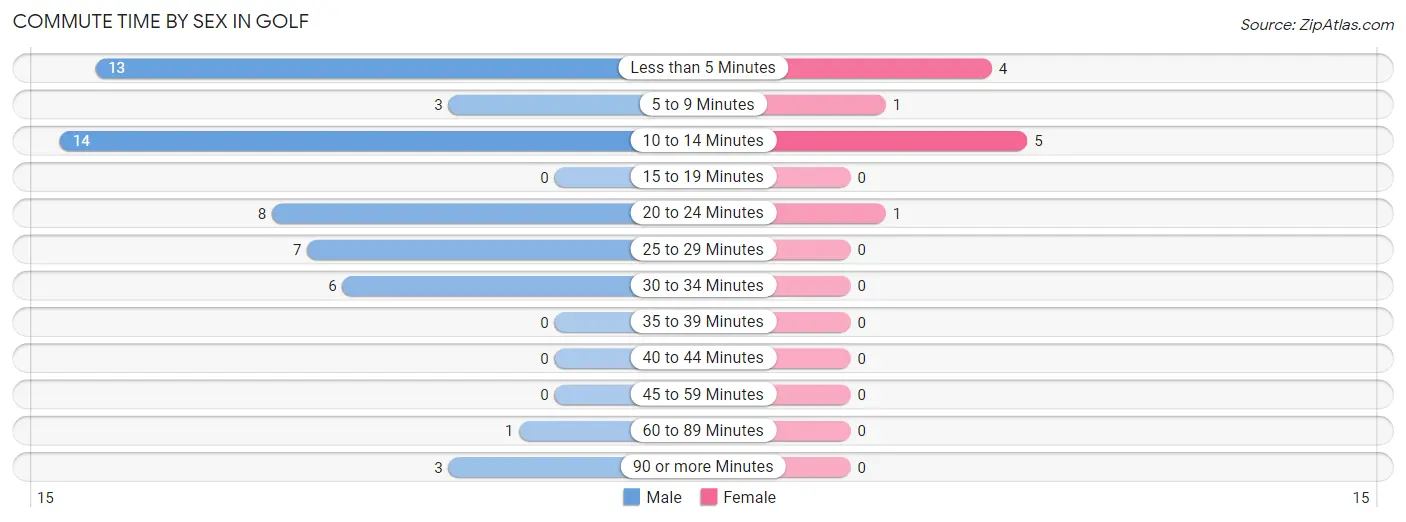
| Commute Time | Male | Female |
| Less than 5 Minutes | 13 (23.6%) | 4 (36.4%) |
| 5 to 9 Minutes | 3 (5.4%) | 1 (9.1%) |
| 10 to 14 Minutes | 14 (25.5%) | 5 (45.5%) |
| 15 to 19 Minutes | 0 (0.0%) | 0 (0.0%) |
| 20 to 24 Minutes | 8 (14.5%) | 1 (9.1%) |
| 25 to 29 Minutes | 7 (12.7%) | 0 (0.0%) |
| 30 to 34 Minutes | 6 (10.9%) | 0 (0.0%) |
| 35 to 39 Minutes | 0 (0.0%) | 0 (0.0%) |
| 40 to 44 Minutes | 0 (0.0%) | 0 (0.0%) |
| 45 to 59 Minutes | 0 (0.0%) | 0 (0.0%) |
| 60 to 89 Minutes | 1 (1.8%) | 0 (0.0%) |
| 90 or more Minutes | 3 (5.4%) | 0 (0.0%) |
Time of Departure to Work by Sex in Golf
The most frequent times of departure to work in Golf are 6:30 AM to 6:59 AM (14, 25.5%) for males and 6:30 AM to 6:59 AM (4, 36.4%) for females.
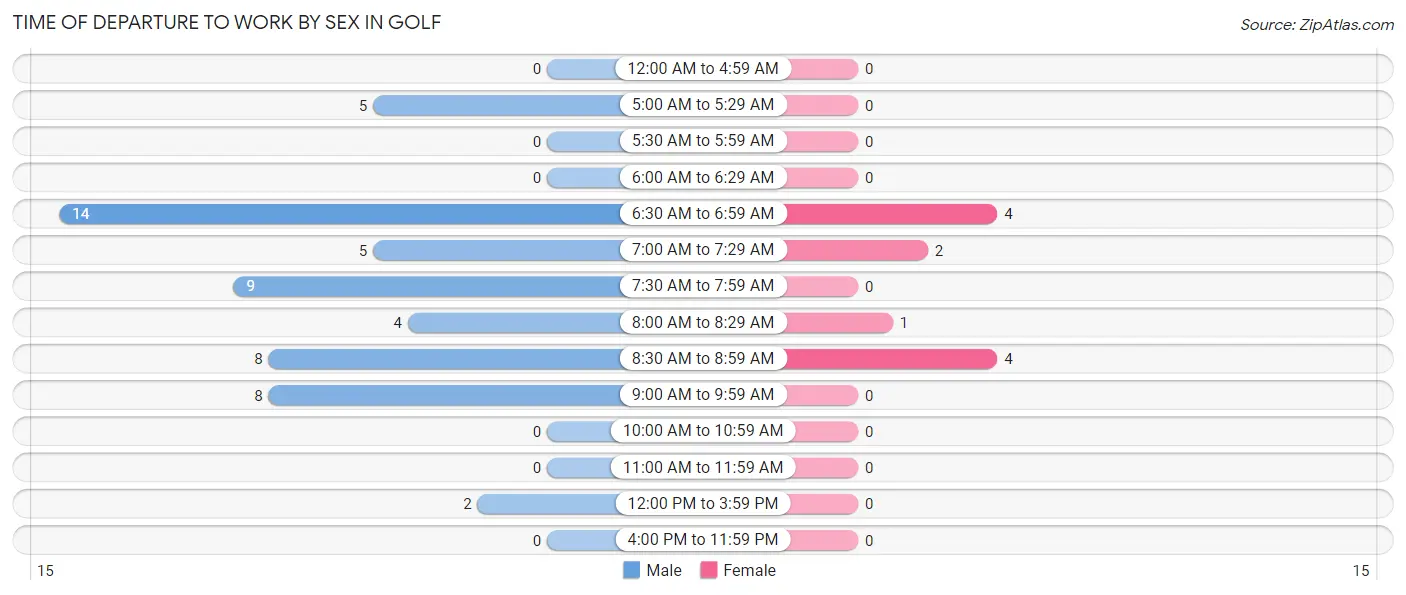
| Time of Departure | Male | Female |
| 12:00 AM to 4:59 AM | 0 (0.0%) | 0 (0.0%) |
| 5:00 AM to 5:29 AM | 5 (9.1%) | 0 (0.0%) |
| 5:30 AM to 5:59 AM | 0 (0.0%) | 0 (0.0%) |
| 6:00 AM to 6:29 AM | 0 (0.0%) | 0 (0.0%) |
| 6:30 AM to 6:59 AM | 14 (25.5%) | 4 (36.4%) |
| 7:00 AM to 7:29 AM | 5 (9.1%) | 2 (18.2%) |
| 7:30 AM to 7:59 AM | 9 (16.4%) | 0 (0.0%) |
| 8:00 AM to 8:29 AM | 4 (7.3%) | 1 (9.1%) |
| 8:30 AM to 8:59 AM | 8 (14.5%) | 4 (36.4%) |
| 9:00 AM to 9:59 AM | 8 (14.5%) | 0 (0.0%) |
| 10:00 AM to 10:59 AM | 0 (0.0%) | 0 (0.0%) |
| 11:00 AM to 11:59 AM | 0 (0.0%) | 0 (0.0%) |
| 12:00 PM to 3:59 PM | 2 (3.6%) | 0 (0.0%) |
| 4:00 PM to 11:59 PM | 0 (0.0%) | 0 (0.0%) |
| Total | 55 (100.0%) | 11 (100.0%) |
Housing Occupancy in Golf
Occupancy by Ownership in Golf
Of the total 127 dwellings in Golf, owner-occupied units account for 122 (96.1%), while renter-occupied units make up 5 (3.9%).
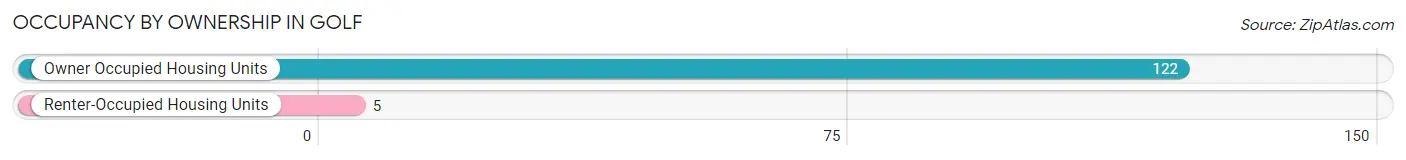
| Occupancy | # Housing Units | % Housing Units |
| Owner Occupied Housing Units | 122 | 96.1% |
| Renter-Occupied Housing Units | 5 | 3.9% |
| Total Occupied Housing Units | 127 | 100.0% |
Occupancy by Household Size in Golf
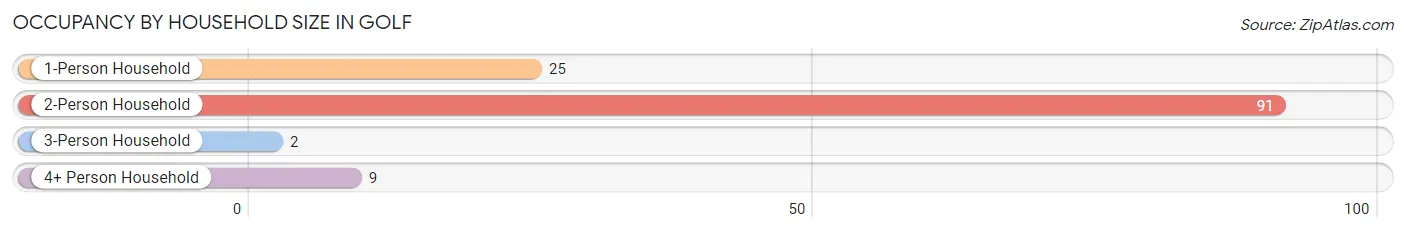
| Household Size | # Housing Units | % Housing Units |
| 1-Person Household | 25 | 19.7% |
| 2-Person Household | 91 | 71.7% |
| 3-Person Household | 2 | 1.6% |
| 4+ Person Household | 9 | 7.1% |
| Total Housing Units | 127 | 100.0% |
Occupancy by Ownership by Household Size in Golf
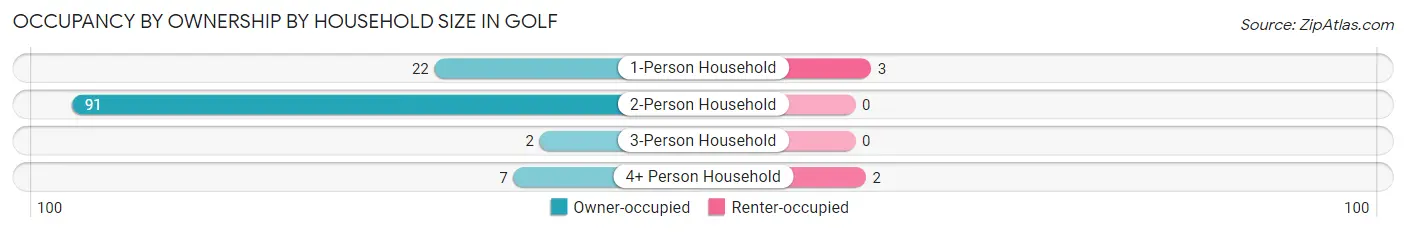
| Household Size | Owner-occupied | Renter-occupied |
| 1-Person Household | 22 (88.0%) | 3 (12.0%) |
| 2-Person Household | 91 (100.0%) | 0 (0.0%) |
| 3-Person Household | 2 (100.0%) | 0 (0.0%) |
| 4+ Person Household | 7 (77.8%) | 2 (22.2%) |
| Total Housing Units | 122 (96.1%) | 5 (3.9%) |
Occupancy by Educational Attainment in Golf
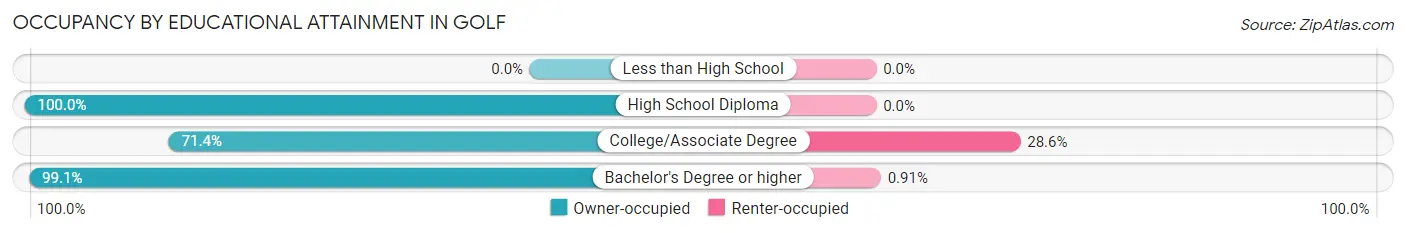
| Household Size | Owner-occupied | Renter-occupied |
| Less than High School | 0 (0.0%) | 0 (0.0%) |
| High School Diploma | 3 (100.0%) | 0 (0.0%) |
| College/Associate Degree | 10 (71.4%) | 4 (28.6%) |
| Bachelor's Degree or higher | 109 (99.1%) | 1 (0.9%) |
Occupancy by Age of Householder in Golf
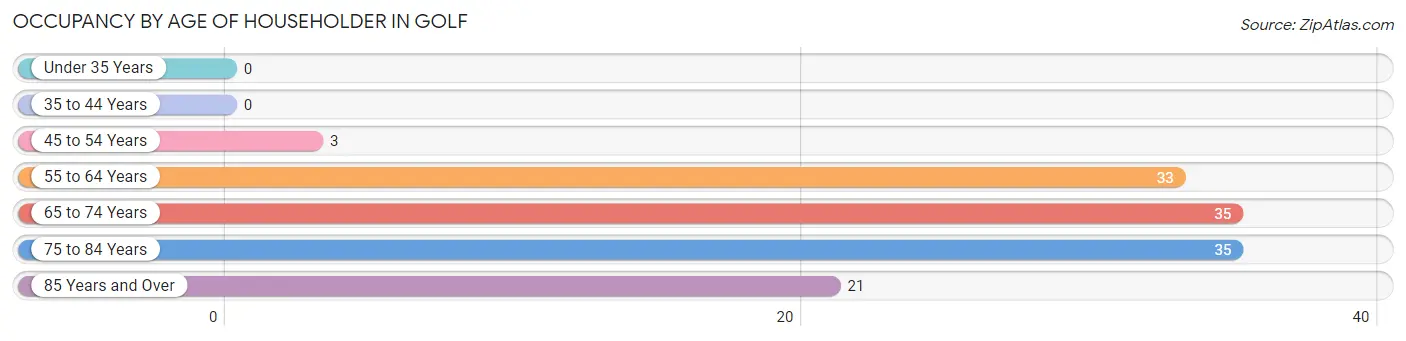
| Age Bracket | # Households | % Households |
| Under 35 Years | 0 | 0.0% |
| 35 to 44 Years | 0 | 0.0% |
| 45 to 54 Years | 3 | 2.4% |
| 55 to 64 Years | 33 | 26.0% |
| 65 to 74 Years | 35 | 27.6% |
| 75 to 84 Years | 35 | 27.6% |
| 85 Years and Over | 21 | 16.5% |
| Total | 127 | 100.0% |
Housing Finances in Golf
Median Income by Occupancy in Golf
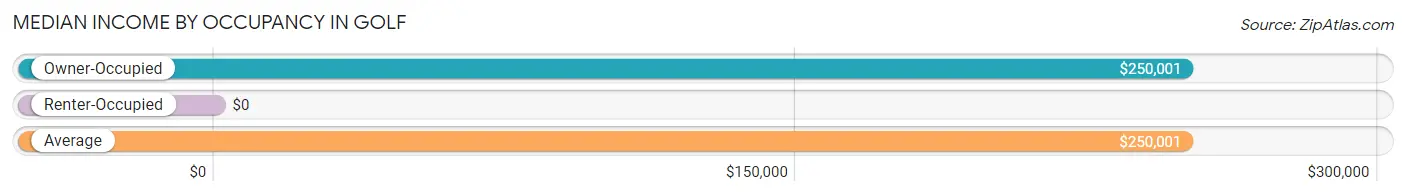
| Occupancy Type | # Households | Median Income |
| Owner-Occupied | 122 (96.1%) | $250,001 |
| Renter-Occupied | 5 (3.9%) | $0 |
| Average | 127 (100.0%) | $250,001 |
Occupancy by Householder Income Bracket in Golf
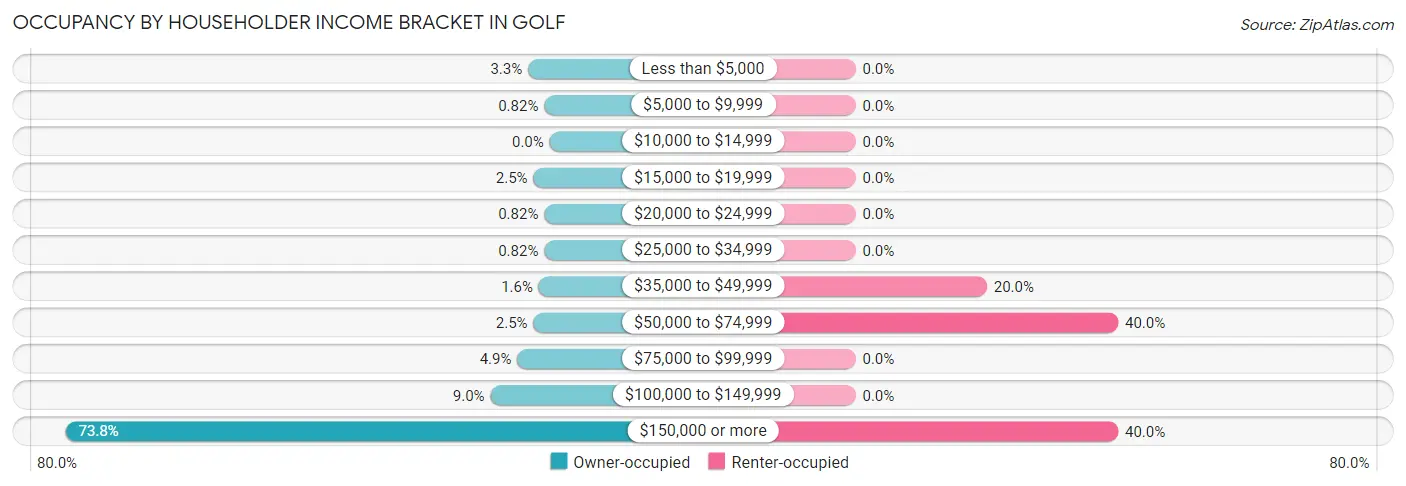
| Income Bracket | Owner-occupied | Renter-occupied |
| Less than $5,000 | 4 (3.3%) | 0 (0.0%) |
| $5,000 to $9,999 | 1 (0.8%) | 0 (0.0%) |
| $10,000 to $14,999 | 0 (0.0%) | 0 (0.0%) |
| $15,000 to $19,999 | 3 (2.5%) | 0 (0.0%) |
| $20,000 to $24,999 | 1 (0.8%) | 0 (0.0%) |
| $25,000 to $34,999 | 1 (0.8%) | 0 (0.0%) |
| $35,000 to $49,999 | 2 (1.6%) | 1 (20.0%) |
| $50,000 to $74,999 | 3 (2.5%) | 2 (40.0%) |
| $75,000 to $99,999 | 6 (4.9%) | 0 (0.0%) |
| $100,000 to $149,999 | 11 (9.0%) | 0 (0.0%) |
| $150,000 or more | 90 (73.8%) | 2 (40.0%) |
| Total | 122 (100.0%) | 5 (100.0%) |
Monthly Housing Cost Tiers in Golf
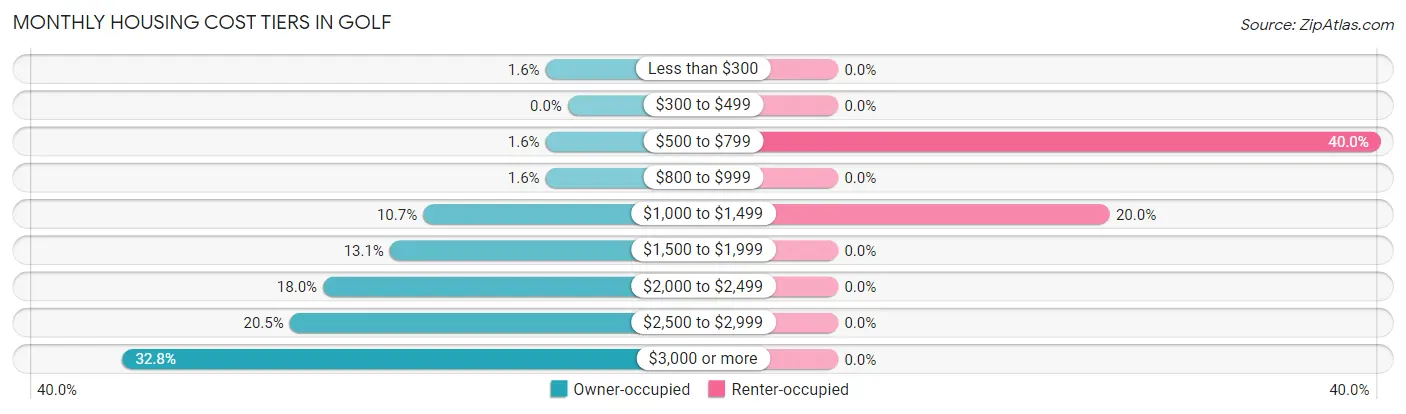
| Monthly Cost | Owner-occupied | Renter-occupied |
| Less than $300 | 2 (1.6%) | 0 (0.0%) |
| $300 to $499 | 0 (0.0%) | 0 (0.0%) |
| $500 to $799 | 2 (1.6%) | 2 (40.0%) |
| $800 to $999 | 2 (1.6%) | 0 (0.0%) |
| $1,000 to $1,499 | 13 (10.7%) | 1 (20.0%) |
| $1,500 to $1,999 | 16 (13.1%) | 0 (0.0%) |
| $2,000 to $2,499 | 22 (18.0%) | 0 (0.0%) |
| $2,500 to $2,999 | 25 (20.5%) | 0 (0.0%) |
| $3,000 or more | 40 (32.8%) | 0 (0.0%) |
| Total | 122 (100.0%) | 5 (100.0%) |
Physical Housing Characteristics in Golf
Housing Structures in Golf
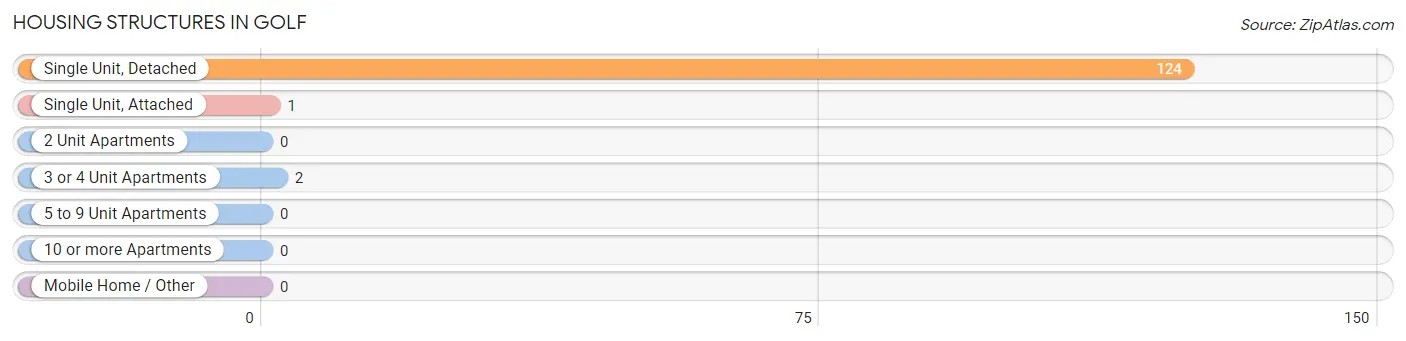
| Structure Type | # Housing Units | % Housing Units |
| Single Unit, Detached | 124 | 97.6% |
| Single Unit, Attached | 1 | 0.8% |
| 2 Unit Apartments | 0 | 0.0% |
| 3 or 4 Unit Apartments | 2 | 1.6% |
| 5 to 9 Unit Apartments | 0 | 0.0% |
| 10 or more Apartments | 0 | 0.0% |
| Mobile Home / Other | 0 | 0.0% |
| Total | 127 | 100.0% |
Housing Structures by Occupancy in Golf
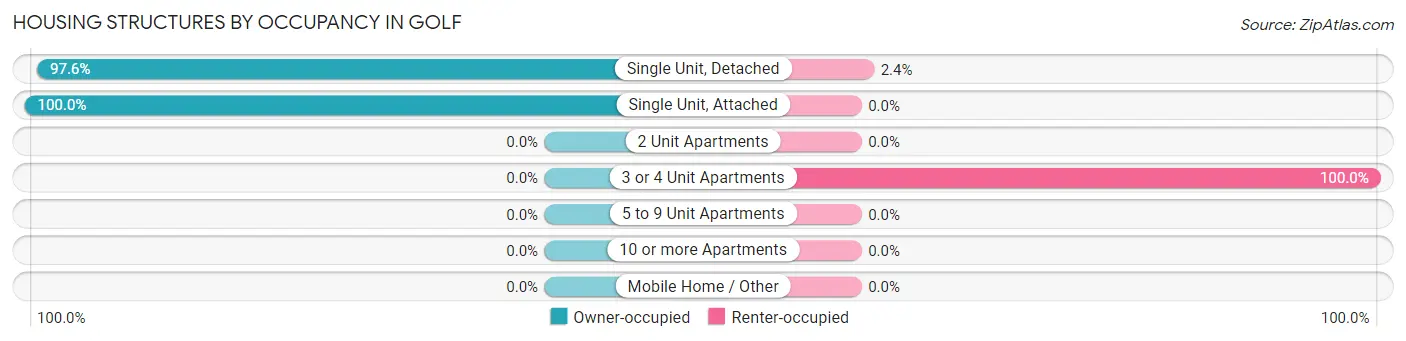
| Structure Type | Owner-occupied | Renter-occupied |
| Single Unit, Detached | 121 (97.6%) | 3 (2.4%) |
| Single Unit, Attached | 1 (100.0%) | 0 (0.0%) |
| 2 Unit Apartments | 0 (0.0%) | 0 (0.0%) |
| 3 or 4 Unit Apartments | 0 (0.0%) | 2 (100.0%) |
| 5 to 9 Unit Apartments | 0 (0.0%) | 0 (0.0%) |
| 10 or more Apartments | 0 (0.0%) | 0 (0.0%) |
| Mobile Home / Other | 0 (0.0%) | 0 (0.0%) |
| Total | 122 (96.1%) | 5 (3.9%) |
Housing Structures by Number of Rooms in Golf
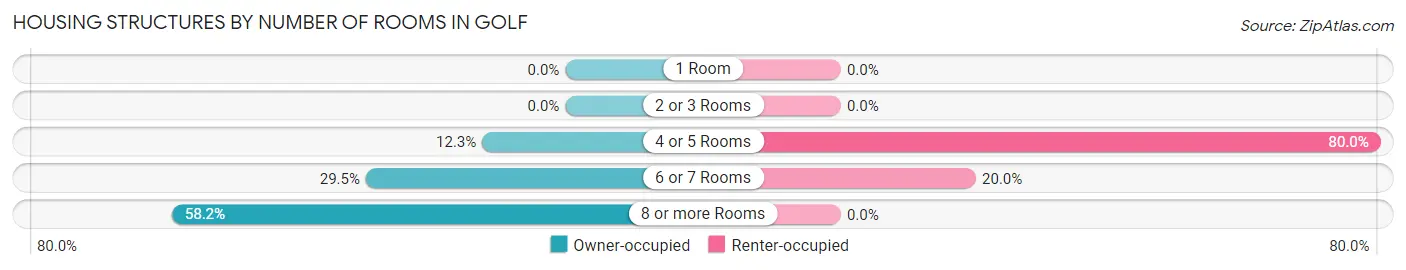
| Number of Rooms | Owner-occupied | Renter-occupied |
| 1 Room | 0 (0.0%) | 0 (0.0%) |
| 2 or 3 Rooms | 0 (0.0%) | 0 (0.0%) |
| 4 or 5 Rooms | 15 (12.3%) | 4 (80.0%) |
| 6 or 7 Rooms | 36 (29.5%) | 1 (20.0%) |
| 8 or more Rooms | 71 (58.2%) | 0 (0.0%) |
| Total | 122 (100.0%) | 5 (100.0%) |
Housing Structure by Heating Type in Golf
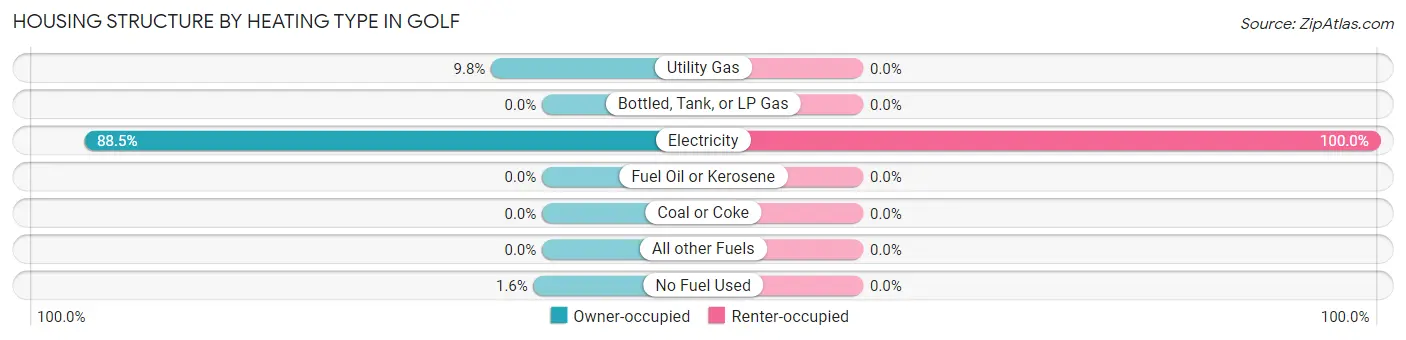
| Heating Type | Owner-occupied | Renter-occupied |
| Utility Gas | 12 (9.8%) | 0 (0.0%) |
| Bottled, Tank, or LP Gas | 0 (0.0%) | 0 (0.0%) |
| Electricity | 108 (88.5%) | 5 (100.0%) |
| Fuel Oil or Kerosene | 0 (0.0%) | 0 (0.0%) |
| Coal or Coke | 0 (0.0%) | 0 (0.0%) |
| All other Fuels | 0 (0.0%) | 0 (0.0%) |
| No Fuel Used | 2 (1.6%) | 0 (0.0%) |
| Total | 122 (100.0%) | 5 (100.0%) |
Household Vehicle Usage in Golf
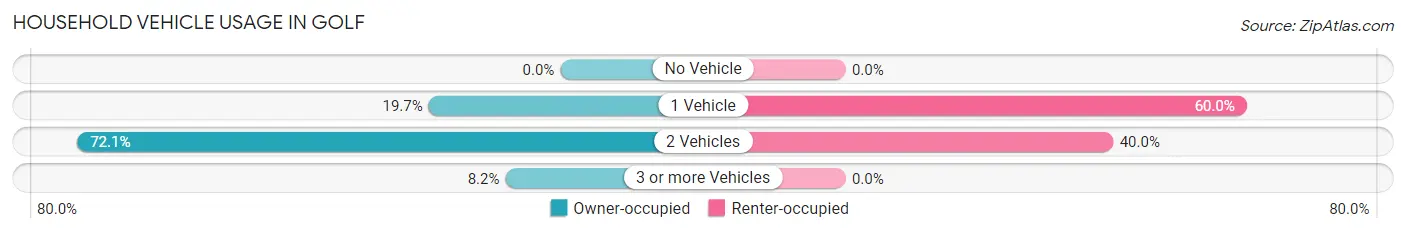
| Vehicles per Household | Owner-occupied | Renter-occupied |
| No Vehicle | 0 (0.0%) | 0 (0.0%) |
| 1 Vehicle | 24 (19.7%) | 3 (60.0%) |
| 2 Vehicles | 88 (72.1%) | 2 (40.0%) |
| 3 or more Vehicles | 10 (8.2%) | 0 (0.0%) |
| Total | 122 (100.0%) | 5 (100.0%) |
Real Estate & Mortgages in Golf
Real Estate and Mortgage Overview in Golf
| Characteristic | Without Mortgage | With Mortgage |
| Housing Units | 99 | 23 |
| Median Property Value | $1,546,900 | $1,375,000 |
| Median Household Income | $250,001 | $18 |
| Monthly Housing Costs | $1,501 | $18 |
| Real Estate Taxes | $10,001 | $0 |
Property Value by Mortgage Status in Golf
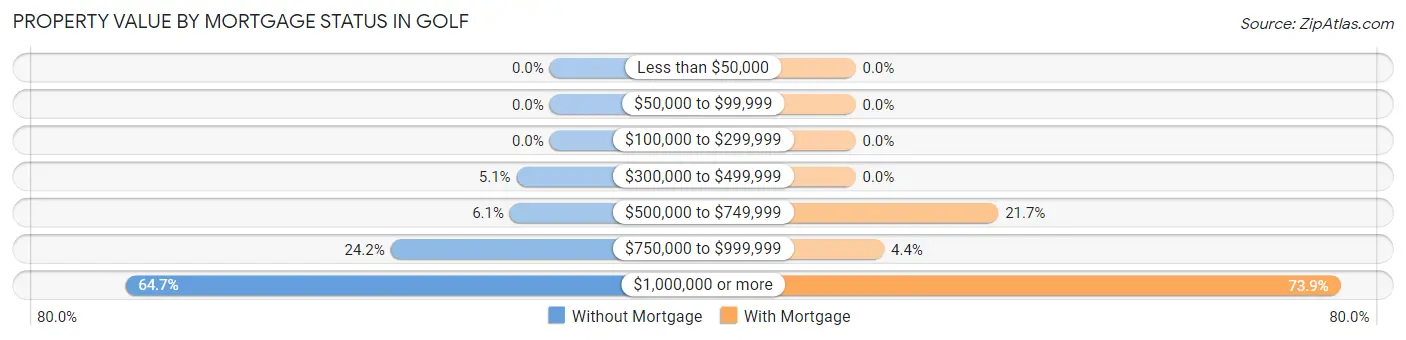
| Property Value | Without Mortgage | With Mortgage |
| Less than $50,000 | 0 (0.0%) | 0 (0.0%) |
| $50,000 to $99,999 | 0 (0.0%) | 0 (0.0%) |
| $100,000 to $299,999 | 0 (0.0%) | 0 (0.0%) |
| $300,000 to $499,999 | 5 (5.1%) | 0 (0.0%) |
| $500,000 to $749,999 | 6 (6.1%) | 5 (21.7%) |
| $750,000 to $999,999 | 24 (24.2%) | 1 (4.3%) |
| $1,000,000 or more | 64 (64.6%) | 17 (73.9%) |
| Total | 99 (100.0%) | 23 (100.0%) |
Household Income by Mortgage Status in Golf
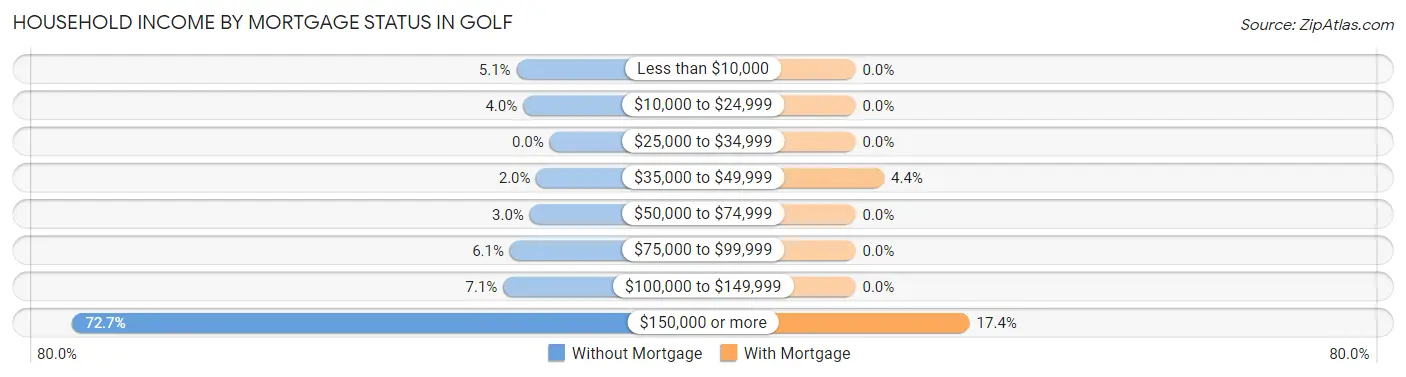
| Household Income | Without Mortgage | With Mortgage |
| Less than $10,000 | 5 (5.1%) | 0 (0.0%) |
| $10,000 to $24,999 | 4 (4.0%) | 0 (0.0%) |
| $25,000 to $34,999 | 0 (0.0%) | 0 (0.0%) |
| $35,000 to $49,999 | 2 (2.0%) | 1 (4.3%) |
| $50,000 to $74,999 | 3 (3.0%) | 0 (0.0%) |
| $75,000 to $99,999 | 6 (6.1%) | 0 (0.0%) |
| $100,000 to $149,999 | 7 (7.1%) | 0 (0.0%) |
| $150,000 or more | 72 (72.7%) | 4 (17.4%) |
| Total | 99 (100.0%) | 23 (100.0%) |
Property Value to Household Income Ratio in Golf
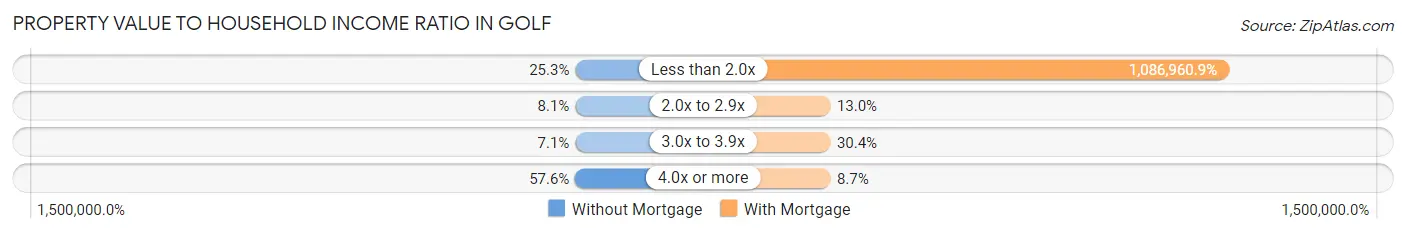
| Value-to-Income Ratio | Without Mortgage | With Mortgage |
| Less than 2.0x | 25 (25.3%) | 250,001 (1,086,960.9%) |
| 2.0x to 2.9x | 8 (8.1%) | 3 (13.0%) |
| 3.0x to 3.9x | 7 (7.1%) | 7 (30.4%) |
| 4.0x or more | 57 (57.6%) | 2 (8.7%) |
| Total | 99 (100.0%) | 23 (100.0%) |
Real Estate Taxes by Mortgage Status in Golf
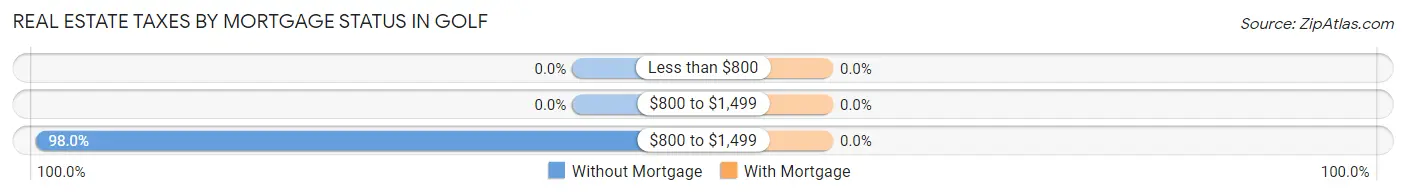
| Property Taxes | Without Mortgage | With Mortgage |
| Less than $800 | 0 (0.0%) | 0 (0.0%) |
| $800 to $1,499 | 0 (0.0%) | 0 (0.0%) |
| $800 to $1,499 | 97 (98.0%) | 0 (0.0%) |
| Total | 99 (100.0%) | 23 (100.0%) |
Health & Disability in Golf
Health Insurance Coverage by Age in Golf
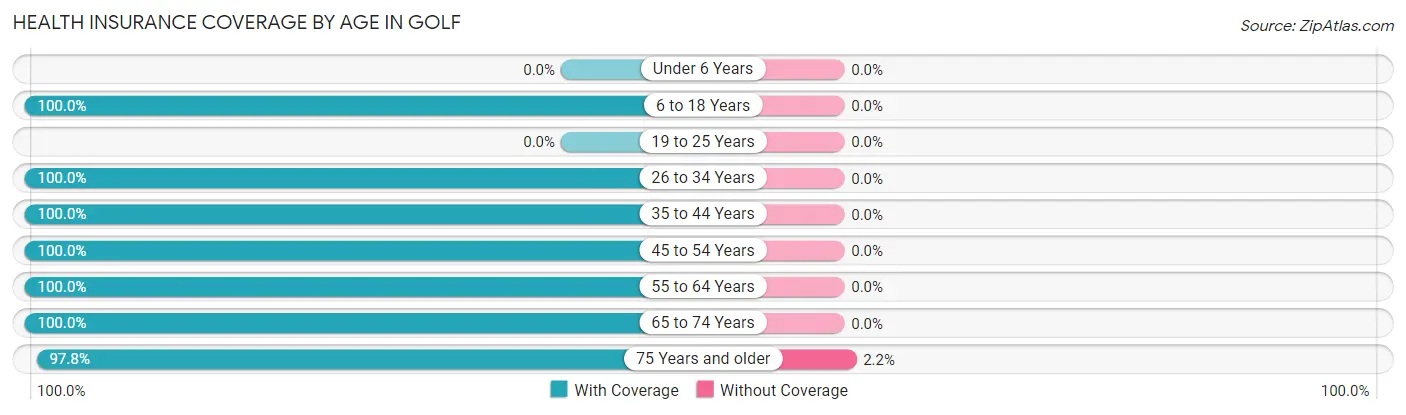
| Age Bracket | With Coverage | Without Coverage |
| Under 6 Years | 0 (0.0%) | 0 (0.0%) |
| 6 to 18 Years | 7 (100.0%) | 0 (0.0%) |
| 19 to 25 Years | 0 (0.0%) | 0 (0.0%) |
| 26 to 34 Years | 3 (100.0%) | 0 (0.0%) |
| 35 to 44 Years | 10 (100.0%) | 0 (0.0%) |
| 45 to 54 Years | 9 (100.0%) | 0 (0.0%) |
| 55 to 64 Years | 67 (100.0%) | 0 (0.0%) |
| 65 to 74 Years | 69 (100.0%) | 0 (0.0%) |
| 75 Years and older | 88 (97.8%) | 2 (2.2%) |
| Total | 253 (99.2%) | 2 (0.8%) |
Health Insurance Coverage by Citizenship Status in Golf
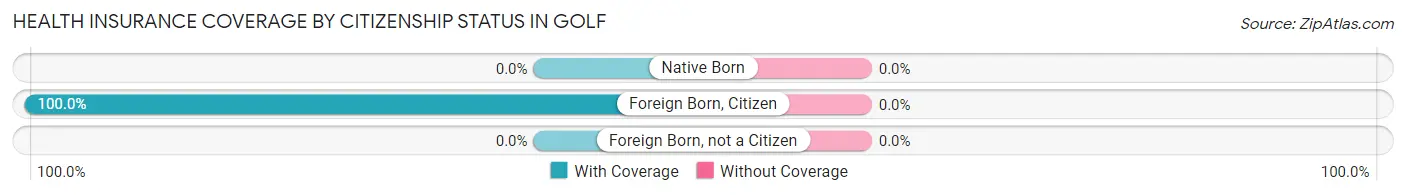
| Citizenship Status | With Coverage | Without Coverage |
| Native Born | 0 (0.0%) | 0 (0.0%) |
| Foreign Born, Citizen | 7 (100.0%) | 0 (0.0%) |
| Foreign Born, not a Citizen | 0 (0.0%) | 0 (0.0%) |
Health Insurance Coverage by Household Income in Golf
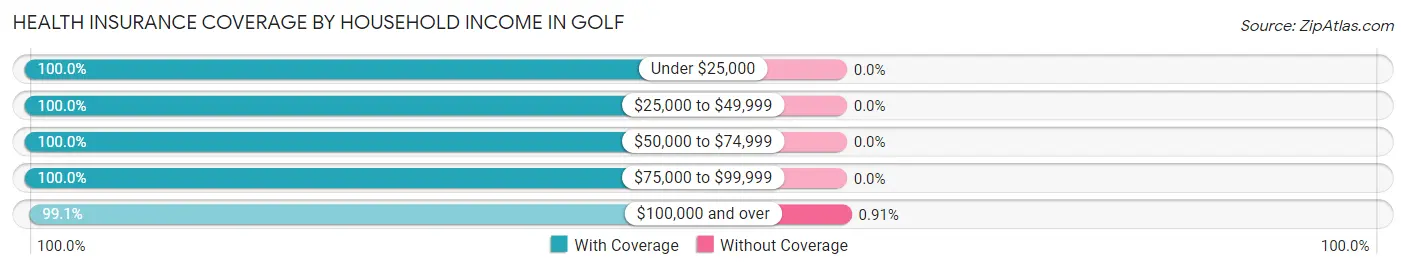
| Household Income | With Coverage | Without Coverage |
| Under $25,000 | 12 (100.0%) | 0 (0.0%) |
| $25,000 to $49,999 | 5 (100.0%) | 0 (0.0%) |
| $50,000 to $74,999 | 8 (100.0%) | 0 (0.0%) |
| $75,000 to $99,999 | 10 (100.0%) | 0 (0.0%) |
| $100,000 and over | 218 (99.1%) | 2 (0.9%) |
Public vs Private Health Insurance Coverage by Age in Golf
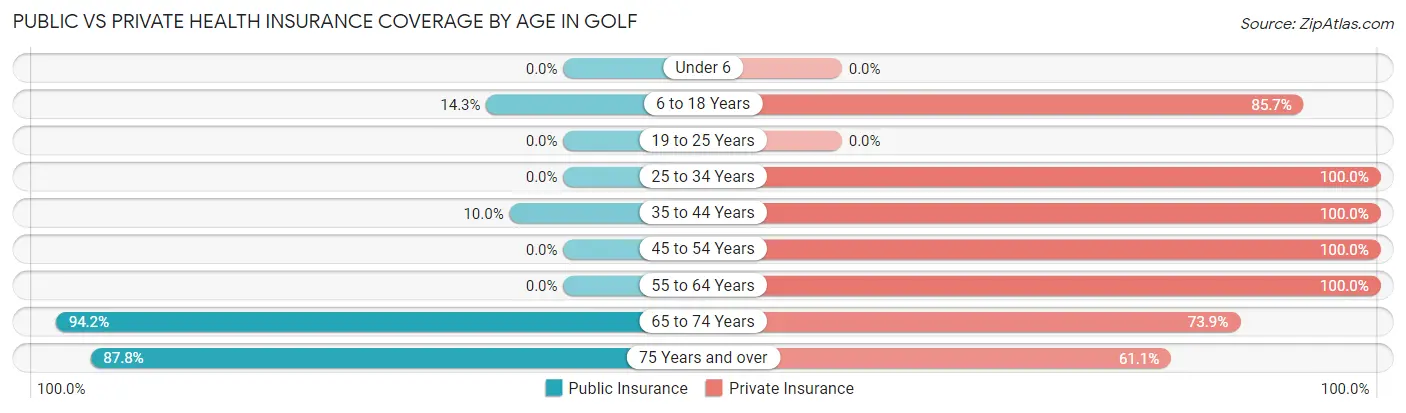
| Age Bracket | Public Insurance | Private Insurance |
| Under 6 | 0 (0.0%) | 0 (0.0%) |
| 6 to 18 Years | 1 (14.3%) | 6 (85.7%) |
| 19 to 25 Years | 0 (0.0%) | 0 (0.0%) |
| 25 to 34 Years | 0 (0.0%) | 3 (100.0%) |
| 35 to 44 Years | 1 (10.0%) | 10 (100.0%) |
| 45 to 54 Years | 0 (0.0%) | 9 (100.0%) |
| 55 to 64 Years | 0 (0.0%) | 67 (100.0%) |
| 65 to 74 Years | 65 (94.2%) | 51 (73.9%) |
| 75 Years and over | 79 (87.8%) | 55 (61.1%) |
| Total | 146 (57.3%) | 201 (78.8%) |
Disability Status by Sex by Age in Golf
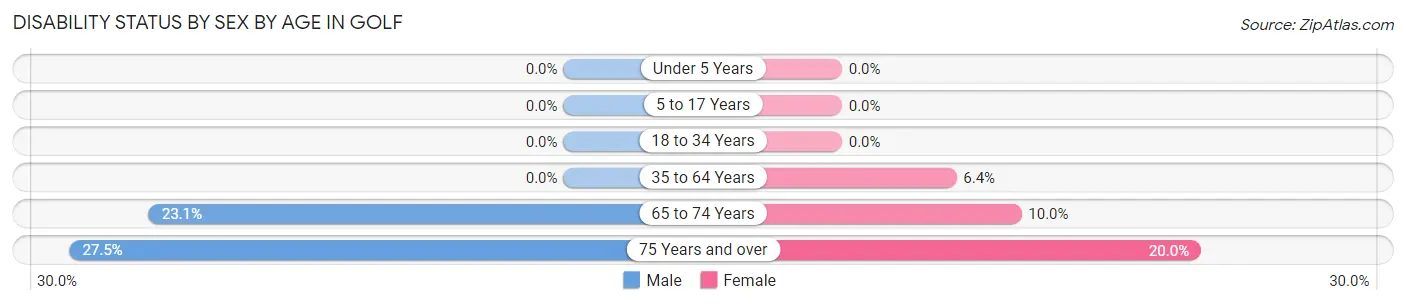
| Age Bracket | Male | Female |
| Under 5 Years | 0 (0.0%) | 0 (0.0%) |
| 5 to 17 Years | 0 (0.0%) | 0 (0.0%) |
| 18 to 34 Years | 0 (0.0%) | 0 (0.0%) |
| 35 to 64 Years | 0 (0.0%) | 3 (6.4%) |
| 65 to 74 Years | 9 (23.1%) | 3 (10.0%) |
| 75 Years and over | 11 (27.5%) | 10 (20.0%) |
Disability Class by Sex by Age in Golf
Disability Class: Hearing Difficulty
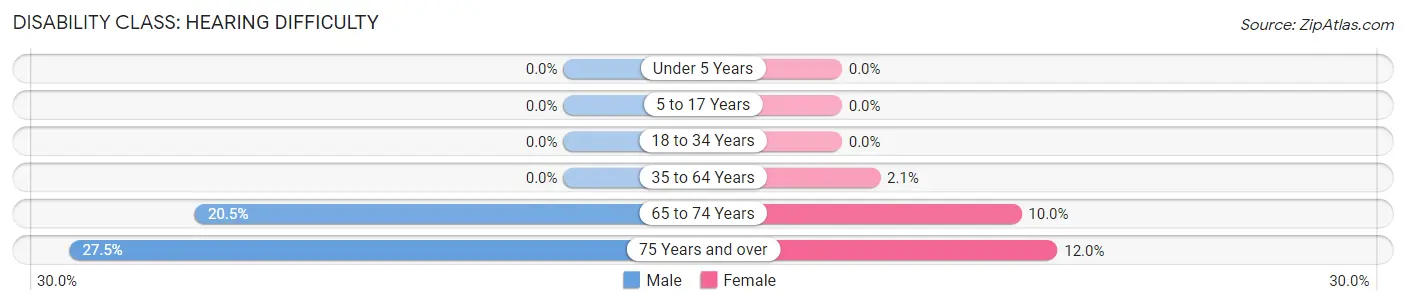
| Age Bracket | Male | Female |
| Under 5 Years | 0 (0.0%) | 0 (0.0%) |
| 5 to 17 Years | 0 (0.0%) | 0 (0.0%) |
| 18 to 34 Years | 0 (0.0%) | 0 (0.0%) |
| 35 to 64 Years | 0 (0.0%) | 1 (2.1%) |
| 65 to 74 Years | 8 (20.5%) | 3 (10.0%) |
| 75 Years and over | 11 (27.5%) | 6 (12.0%) |
Disability Class: Vision Difficulty
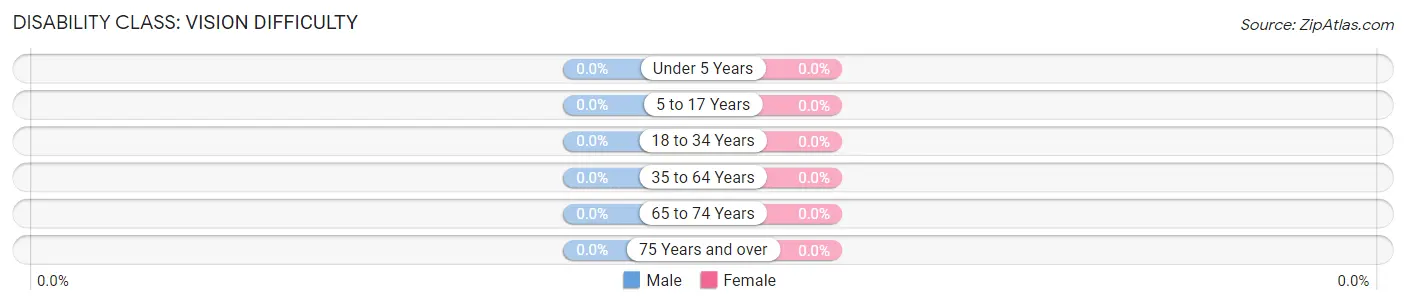
| Age Bracket | Male | Female |
| Under 5 Years | 0 (0.0%) | 0 (0.0%) |
| 5 to 17 Years | 0 (0.0%) | 0 (0.0%) |
| 18 to 34 Years | 0 (0.0%) | 0 (0.0%) |
| 35 to 64 Years | 0 (0.0%) | 0 (0.0%) |
| 65 to 74 Years | 0 (0.0%) | 0 (0.0%) |
| 75 Years and over | 0 (0.0%) | 0 (0.0%) |
Disability Class: Cognitive Difficulty
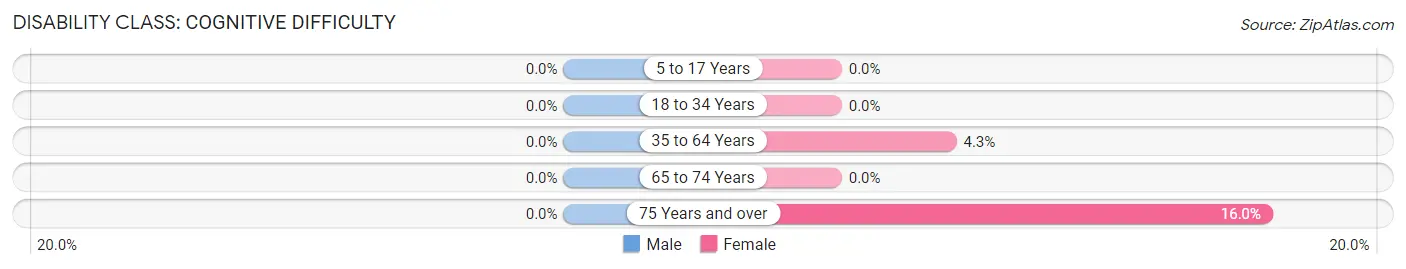
| Age Bracket | Male | Female |
| 5 to 17 Years | 0 (0.0%) | 0 (0.0%) |
| 18 to 34 Years | 0 (0.0%) | 0 (0.0%) |
| 35 to 64 Years | 0 (0.0%) | 2 (4.3%) |
| 65 to 74 Years | 0 (0.0%) | 0 (0.0%) |
| 75 Years and over | 0 (0.0%) | 8 (16.0%) |
Disability Class: Ambulatory Difficulty
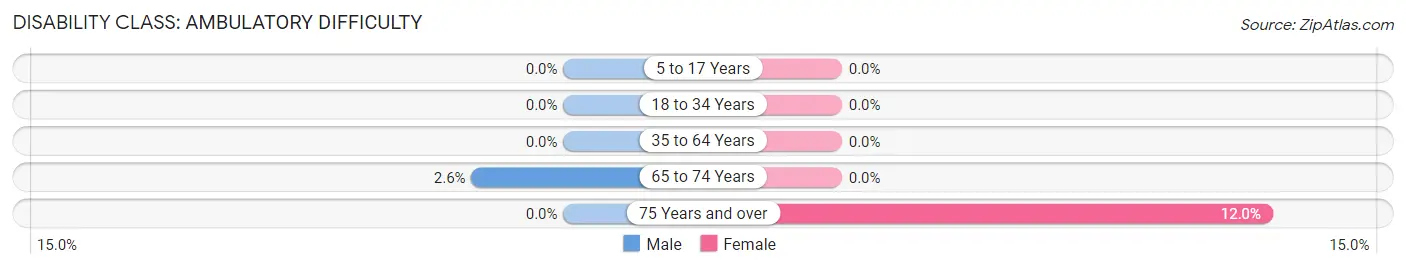
| Age Bracket | Male | Female |
| 5 to 17 Years | 0 (0.0%) | 0 (0.0%) |
| 18 to 34 Years | 0 (0.0%) | 0 (0.0%) |
| 35 to 64 Years | 0 (0.0%) | 0 (0.0%) |
| 65 to 74 Years | 1 (2.6%) | 0 (0.0%) |
| 75 Years and over | 0 (0.0%) | 6 (12.0%) |
Disability Class: Self-Care Difficulty
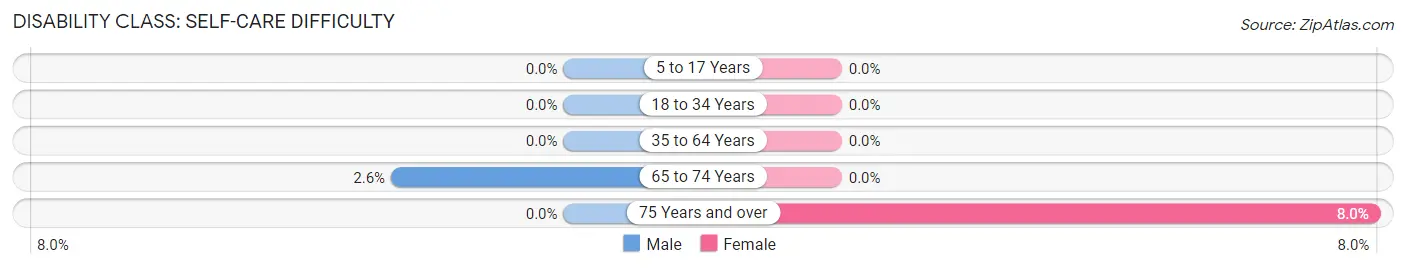
| Age Bracket | Male | Female |
| 5 to 17 Years | 0 (0.0%) | 0 (0.0%) |
| 18 to 34 Years | 0 (0.0%) | 0 (0.0%) |
| 35 to 64 Years | 0 (0.0%) | 0 (0.0%) |
| 65 to 74 Years | 1 (2.6%) | 0 (0.0%) |
| 75 Years and over | 0 (0.0%) | 4 (8.0%) |
Technology Access in Golf
Computing Device Access in Golf
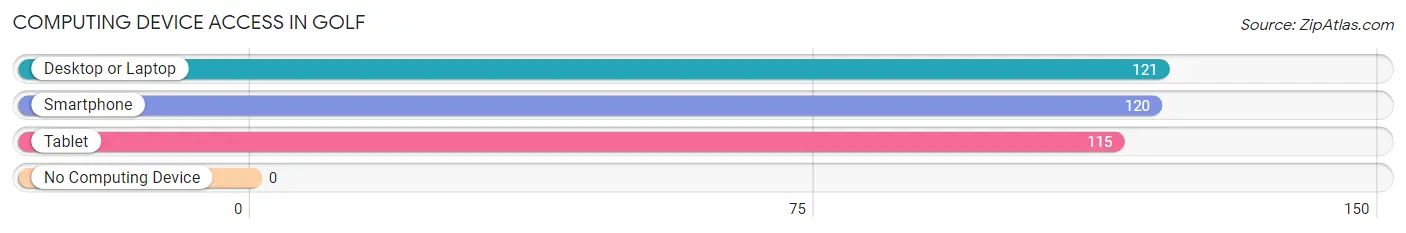
| Device Type | # Households | % Households |
| Desktop or Laptop | 121 | 95.3% |
| Smartphone | 120 | 94.5% |
| Tablet | 115 | 90.5% |
| No Computing Device | 0 | 0.0% |
| Total | 127 | 100.0% |
Internet Access in Golf
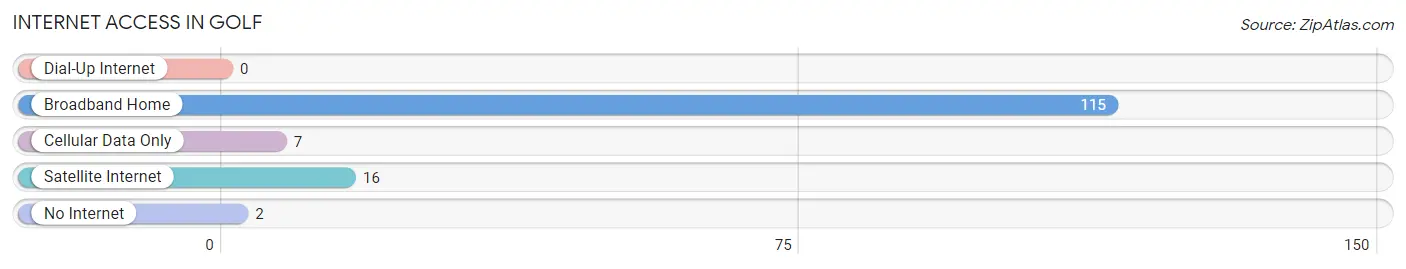
| Internet Type | # Households | % Households |
| Dial-Up Internet | 0 | 0.0% |
| Broadband Home | 115 | 90.5% |
| Cellular Data Only | 7 | 5.5% |
| Satellite Internet | 16 | 12.6% |
| No Internet | 2 | 1.6% |
| Total | 127 | 100.0% |
Golf Summary
Golf is a sport that has been around for centuries, and it has a long and interesting history in the state of Florida. The game of golf was first introduced to the state in the late 19th century, and it quickly became a popular pastime for many Floridians. The first golf course in the state was built in St. Augustine in 1895, and it was followed by many more courses in the years that followed. By the early 20th century, golf had become a major part of the state’s culture and economy.
Geographically, Florida is a peninsula located in the southeastern United States. It is bordered by the Gulf of Mexico to the west, the Atlantic Ocean to the east, and the Straits of Florida to the south. The state is divided into three distinct regions: the Panhandle, the Atlantic Coast, and the Gulf Coast. The Panhandle is the northernmost region of the state and is home to some of the most popular golf courses in the state. The Atlantic Coast is the easternmost region of the state and is home to some of the most beautiful beaches in the world. The Gulf Coast is the southernmost region of the state and is home to some of the most popular golf courses in the state.
The economy of Florida is largely driven by tourism, agriculture, and manufacturing. Tourism is the largest industry in the state, and it is responsible for generating billions of dollars in revenue each year. Agriculture is also a major contributor to the state’s economy, and it is responsible for producing a variety of crops, including citrus fruits, vegetables, and sugarcane. Manufacturing is also an important part of the state’s economy, and it is responsible for producing a variety of products, including electronics, automobiles, and aerospace components.
The demographics of Florida are diverse and varied. The state is home to a large number of immigrants from all over the world, and it is also home to a large number of African Americans, Hispanics, and Native Americans. The population of the state is estimated to be around 21 million people, and the median age is around 40 years old. The state is also home to a large number of retirees, and it is estimated that around 20% of the population is over the age of 65.
Golf has been an important part of the state of Florida for many years, and it continues to be a popular pastime for many Floridians. The game has a long and interesting history in the state, and it has had a major impact on the state’s economy, culture, and demographics. The game of golf has been a major part of the state’s economy for many years, and it continues to be an important part of the state’s culture and economy.
Common Questions
What is Per Capita Income in Golf?
Per Capita income in Golf is $222,810.
What is the Median Family Income in Golf?
Median Family Income in Golf is $250,001.
What is the Median Household income in Golf?
Median Household Income in Golf is $250,001.
What is Income or Wage Gap in Golf?
Income or Wage Gap in Golf is 76.5%.
Women in Golf earn 23.5 cents for every dollar earned by a man.
What is Inequality or Gini Index in Golf?
Inequality or Gini Index in Golf is 0.49.
What is the Total Population of Golf?
Total Population of Golf is 255.
What is the Total Male Population of Golf?
Total Male Population of Golf is 124.
What is the Total Female Population of Golf?
Total Female Population of Golf is 131.
What is the Ratio of Males per 100 Females in Golf?
There are 94.66 Males per 100 Females in Golf.
What is the Ratio of Females per 100 Males in Golf?
There are 105.65 Females per 100 Males in Golf.
What is the Median Population Age in Golf?
Median Population Age in Golf is 70.5 Years.
What is the Average Family Size in Golf
Average Family Size in Golf is 2.1 People.
What is the Average Household Size in Golf
Average Household Size in Golf is 2.0 People.
How Large is the Labor Force in Golf?
There are 86 People in the Labor Forcein in Golf.
What is the Percentage of People in the Labor Force in Golf?
34.1% of People are in the Labor Force in Golf.