Rio Pinar, FL Map & Demographics
Rio Pinar Map
Rio Pinar Overview
$36,904
PER CAPITA INCOME
$95,476
AVG FAMILY INCOME
$97,060
AVG HOUSEHOLD INCOME
29.7%
WAGE / INCOME GAP [ % ]
70.3¢/ $1
WAGE / INCOME GAP [ $ ]
0.35
INEQUALITY / GINI INDEX
5,663
TOTAL POPULATION
2,721
MALE POPULATION
2,942
FEMALE POPULATION
92.49
MALES / 100 FEMALES
108.12
FEMALES / 100 MALES
44.9
MEDIAN AGE
3.5
AVG FAMILY SIZE
3.2
AVG HOUSEHOLD SIZE
2,843
LABOR FORCE [ PEOPLE ]
58.7%
PERCENT IN LABOR FORCE
4.7%
UNEMPLOYMENT RATE
Income in Rio Pinar
Income Overview in Rio Pinar
Per Capita Income in Rio Pinar is $36,904, while median incomes of families and households are $95,476 and $97,060 respectively.
| Characteristic | Number | Measure |
| Per Capita Income | 5,663 | $36,904 |
| Median Family Income | 1,396 | $95,476 |
| Mean Family Income | 1,396 | $117,889 |
| Median Household Income | 1,747 | $97,060 |
| Mean Household Income | 1,747 | $113,188 |
| Income Deficit | 1,396 | $0 |
| Wage / Income Gap (%) | 5,663 | 29.67% |
| Wage / Income Gap ($) | 5,663 | 70.33¢ per $1 |
| Gini / Inequality Index | 5,663 | 0.35 |
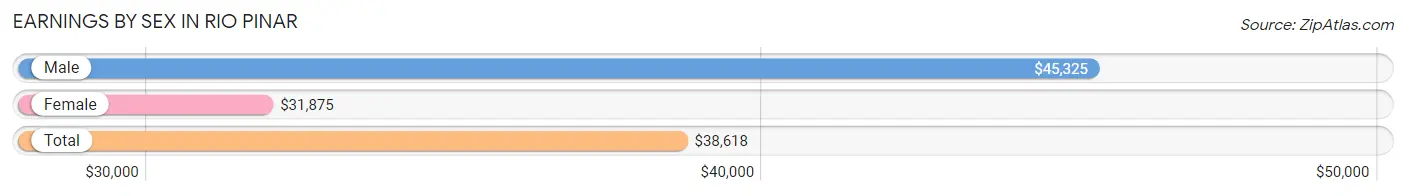
Earnings by Sex in Rio Pinar
Average Earnings in Rio Pinar are $38,618, $45,325 for men and $31,875 for women, a difference of 29.7%.
| Sex | Number | Average Earnings |
| Male | 1,619 (56.0%) | $45,325 |
| Female | 1,273 (44.0%) | $31,875 |
| Total | 2,892 (100.0%) | $38,618 |
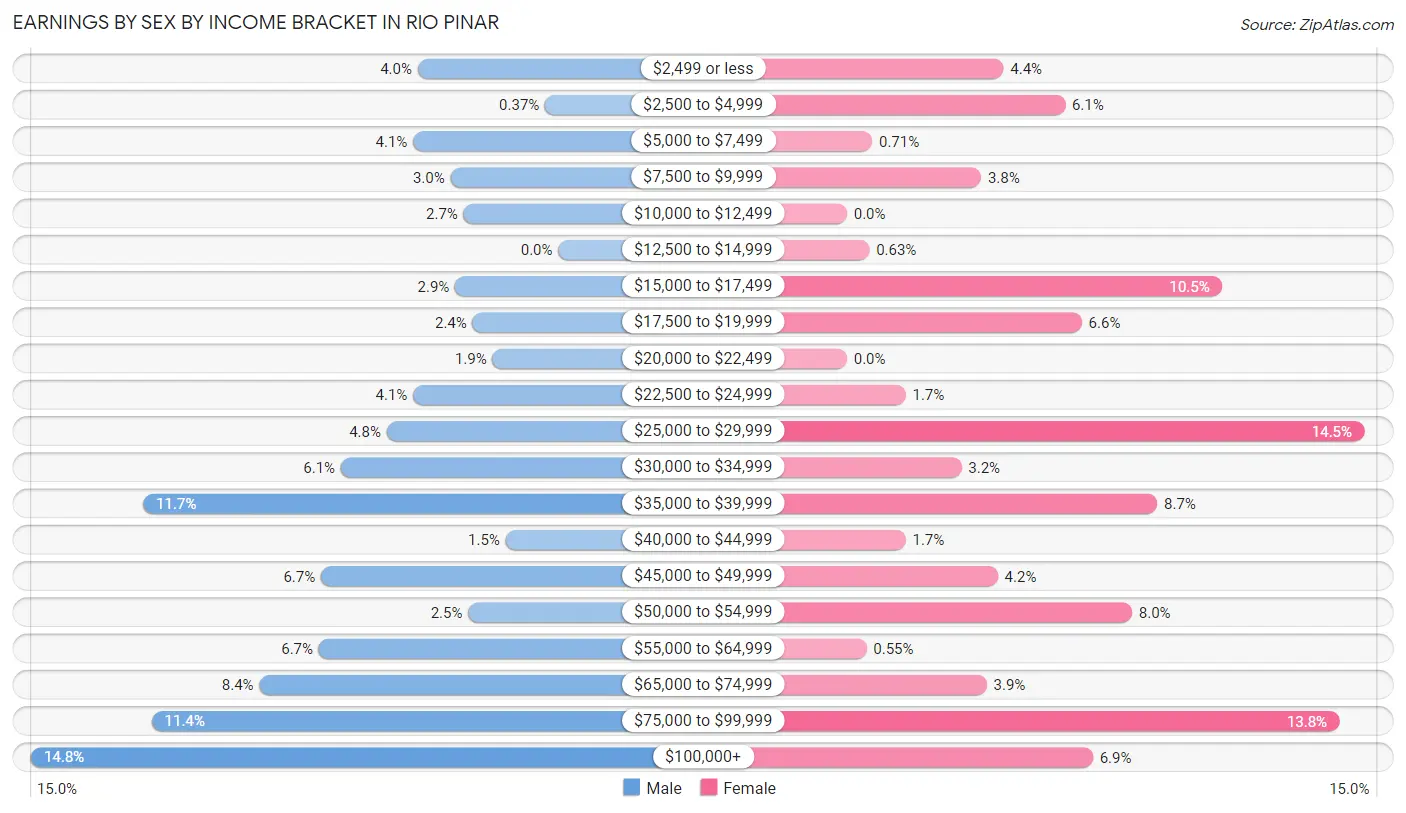
Earnings by Sex by Income Bracket in Rio Pinar
The most common earnings brackets in Rio Pinar are $100,000+ for men (240 | 14.8%) and $25,000 to $29,999 for women (185 | 14.5%).
| Income | Male | Female |
| $2,499 or less | 64 (4.0%) | 56 (4.4%) |
| $2,500 to $4,999 | 6 (0.4%) | 78 (6.1%) |
| $5,000 to $7,499 | 66 (4.1%) | 9 (0.7%) |
| $7,500 to $9,999 | 49 (3.0%) | 48 (3.8%) |
| $10,000 to $12,499 | 43 (2.7%) | 0 (0.0%) |
| $12,500 to $14,999 | 0 (0.0%) | 8 (0.6%) |
| $15,000 to $17,499 | 47 (2.9%) | 134 (10.5%) |
| $17,500 to $19,999 | 39 (2.4%) | 84 (6.6%) |
| $20,000 to $22,499 | 30 (1.8%) | 0 (0.0%) |
| $22,500 to $24,999 | 66 (4.1%) | 21 (1.7%) |
| $25,000 to $29,999 | 78 (4.8%) | 185 (14.5%) |
| $30,000 to $34,999 | 99 (6.1%) | 41 (3.2%) |
| $35,000 to $39,999 | 189 (11.7%) | 111 (8.7%) |
| $40,000 to $44,999 | 24 (1.5%) | 21 (1.7%) |
| $45,000 to $49,999 | 108 (6.7%) | 54 (4.2%) |
| $50,000 to $54,999 | 41 (2.5%) | 102 (8.0%) |
| $55,000 to $64,999 | 109 (6.7%) | 7 (0.5%) |
| $65,000 to $74,999 | 136 (8.4%) | 50 (3.9%) |
| $75,000 to $99,999 | 185 (11.4%) | 176 (13.8%) |
| $100,000+ | 240 (14.8%) | 88 (6.9%) |
| Total | 1,619 (100.0%) | 1,273 (100.0%) |
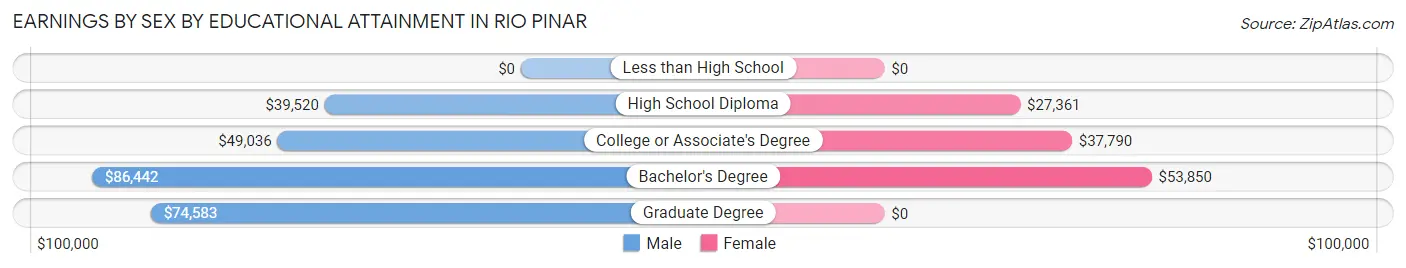
Earnings by Sex by Educational Attainment in Rio Pinar
Average earnings in Rio Pinar are $54,531 for men and $36,932 for women, a difference of 32.3%. Men with an educational attainment of bachelor's degree enjoy the highest average annual earnings of $86,442, while those with high school diploma education earn the least with $39,520. Women with an educational attainment of bachelor's degree earn the most with the average annual earnings of $53,850, while those with high school diploma education have the smallest earnings of $27,361.
| Educational Attainment | Male Income | Female Income |
| Less than High School | - | - |
| High School Diploma | $39,520 | $27,361 |
| College or Associate's Degree | $49,036 | $37,790 |
| Bachelor's Degree | $86,442 | $53,850 |
| Graduate Degree | $74,583 | $0 |
| Total | $54,531 | $36,932 |
Family Income in Rio Pinar
Family Income Brackets in Rio Pinar
According to the Rio Pinar family income data, there are 377 families falling into the $100,000 to $149,999 income range, which is the most common income bracket and makes up 27.0% of all families.
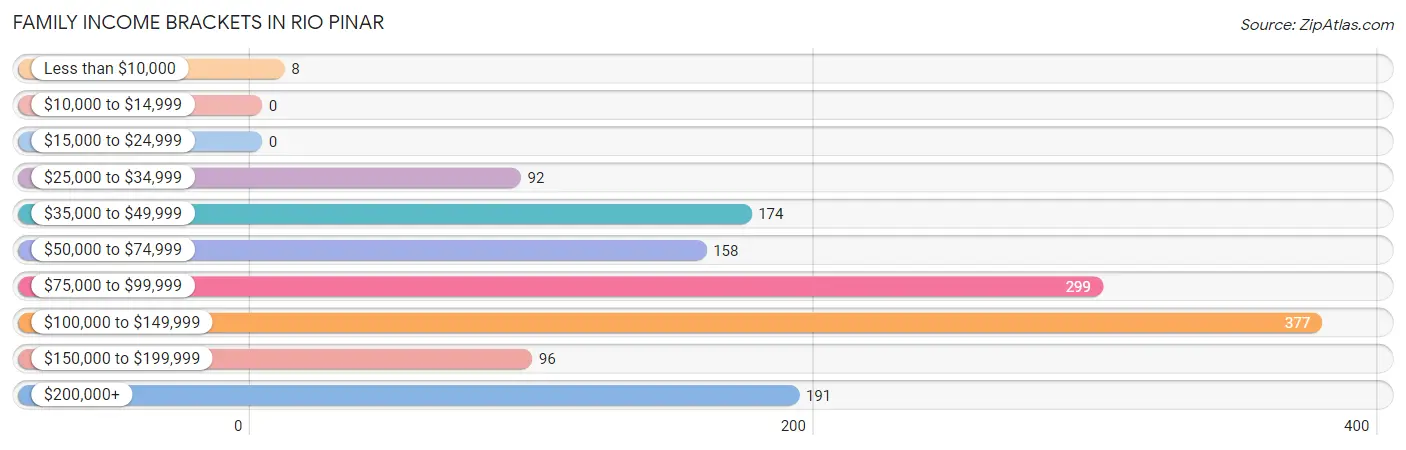
| Income Bracket | # Families | % Families |
| Less than $10,000 | 8 | 0.6% |
| $10,000 to $14,999 | 0 | 0.0% |
| $15,000 to $24,999 | 0 | 0.0% |
| $25,000 to $34,999 | 92 | 6.6% |
| $35,000 to $49,999 | 174 | 12.5% |
| $50,000 to $74,999 | 158 | 11.3% |
| $75,000 to $99,999 | 299 | 21.4% |
| $100,000 to $149,999 | 377 | 27.0% |
| $150,000 to $199,999 | 96 | 6.9% |
| $200,000+ | 191 | 13.7% |
Family Income by Famaliy Size in Rio Pinar
6-person families (29 | 2.1%) account for the highest median family income in Rio Pinar with $132,292 per family, while 2-person families (587 | 42.0%) have the highest median income of $55,364 per family member.
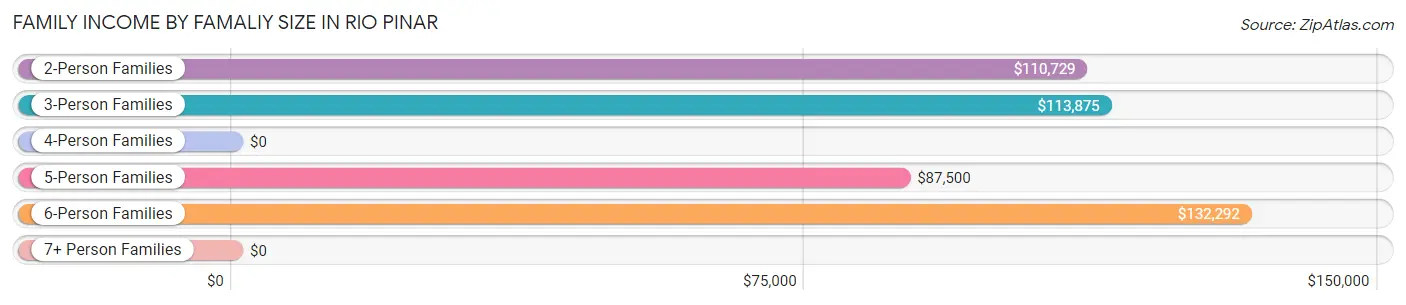
| Income Bracket | # Families | Median Income |
| 2-Person Families | 587 (42.0%) | $110,729 |
| 3-Person Families | 351 (25.1%) | $113,875 |
| 4-Person Families | 158 (11.3%) | $0 |
| 5-Person Families | 256 (18.3%) | $87,500 |
| 6-Person Families | 29 (2.1%) | $132,292 |
| 7+ Person Families | 15 (1.1%) | $0 |
| Total | 1,396 (100.0%) | $95,476 |
Family Income by Number of Earners in Rio Pinar
The median family income in Rio Pinar is $95,476, with families comprising 2 earners (637) having the highest median family income of $114,236, while families with 1 earner (318) have the lowest median family income of $66,071, accounting for 45.6% and 22.8% of families, respectively.
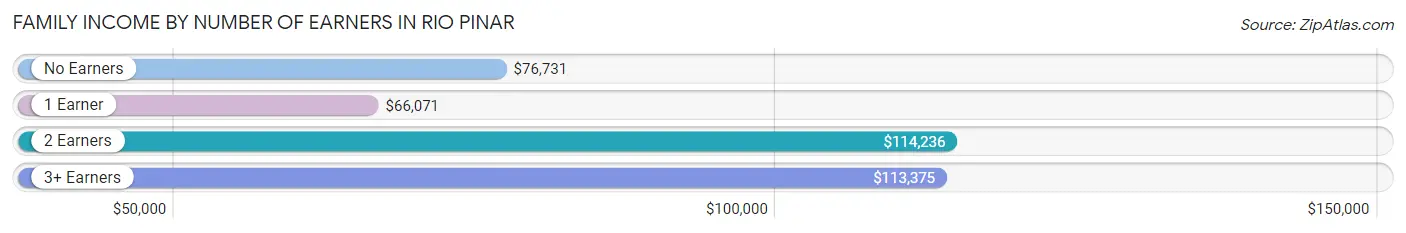
| Number of Earners | # Families | Median Income |
| No Earners | 254 (18.2%) | $76,731 |
| 1 Earner | 318 (22.8%) | $66,071 |
| 2 Earners | 637 (45.6%) | $114,236 |
| 3+ Earners | 187 (13.4%) | $113,375 |
| Total | 1,396 (100.0%) | $95,476 |
Household Income in Rio Pinar
Household Income Brackets in Rio Pinar
With 522 households falling in the category, the $100,000 to $149,999 income range is the most frequent in Rio Pinar, accounting for 29.9% of all households. In contrast, only 16 households (0.9%) fall into the less than $10,000 income bracket, making it the least populous group.
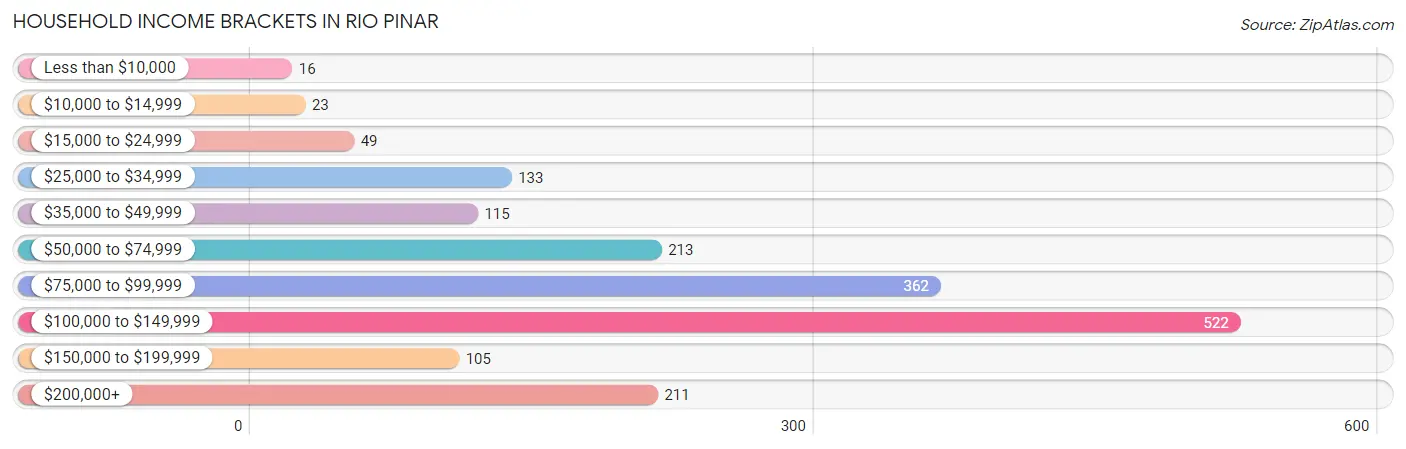
| Income Bracket | # Households | % Households |
| Less than $10,000 | 16 | 0.9% |
| $10,000 to $14,999 | 23 | 1.3% |
| $15,000 to $24,999 | 49 | 2.8% |
| $25,000 to $34,999 | 133 | 7.6% |
| $35,000 to $49,999 | 115 | 6.6% |
| $50,000 to $74,999 | 213 | 12.2% |
| $75,000 to $99,999 | 362 | 20.7% |
| $100,000 to $149,999 | 522 | 29.9% |
| $150,000 to $199,999 | 105 | 6.0% |
| $200,000+ | 211 | 12.1% |
Household Income by Householder Age in Rio Pinar
The median household income in Rio Pinar is $97,060, with the highest median household income of $115,625 found in the 45 to 64 years age bracket for the primary householder. A total of 762 households (43.6%) fall into this category.
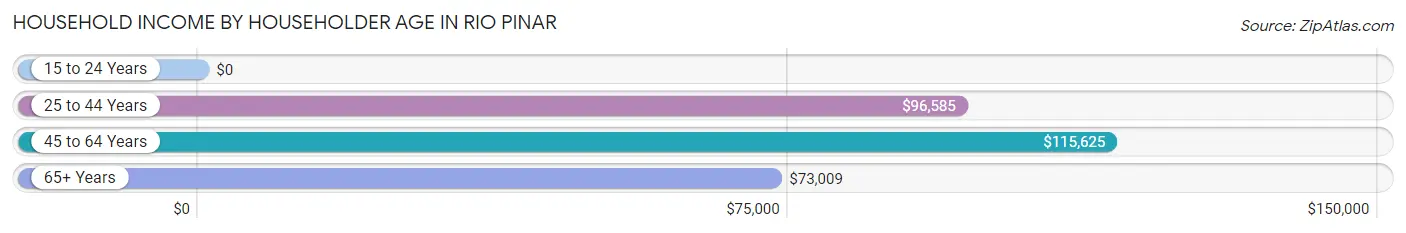
| Income Bracket | # Households | Median Income |
| 15 to 24 Years | 0 (0.0%) | $0 |
| 25 to 44 Years | 348 (19.9%) | $96,585 |
| 45 to 64 Years | 762 (43.6%) | $115,625 |
| 65+ Years | 637 (36.5%) | $73,009 |
| Total | 1,747 (100.0%) | $97,060 |
Poverty in Rio Pinar
Income Below Poverty by Sex and Age in Rio Pinar
With 2.1% poverty level for males and 8.4% for females among the residents of Rio Pinar, under 5 year old males and 18 to 24 year old females are the most vulnerable to poverty, with 9 males (10.2%) and 60 females (26.9%) in their respective age groups living below the poverty level.
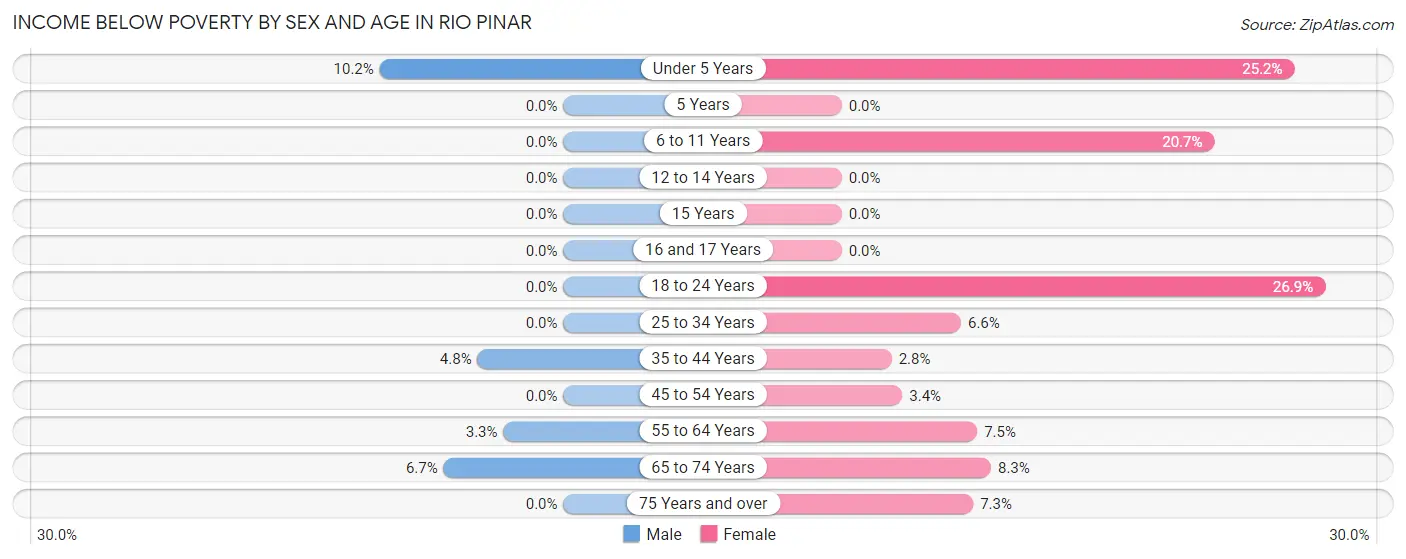
| Age Bracket | Male | Female |
| Under 5 Years | 9 (10.2%) | 31 (25.2%) |
| 5 Years | 0 (0.0%) | 0 (0.0%) |
| 6 to 11 Years | 0 (0.0%) | 28 (20.7%) |
| 12 to 14 Years | 0 (0.0%) | 0 (0.0%) |
| 15 Years | 0 (0.0%) | 0 (0.0%) |
| 16 and 17 Years | 0 (0.0%) | 0 (0.0%) |
| 18 to 24 Years | 0 (0.0%) | 60 (26.9%) |
| 25 to 34 Years | 0 (0.0%) | 16 (6.6%) |
| 35 to 44 Years | 17 (4.8%) | 11 (2.8%) |
| 45 to 54 Years | 0 (0.0%) | 14 (3.4%) |
| 55 to 64 Years | 13 (3.3%) | 30 (7.5%) |
| 65 to 74 Years | 17 (6.7%) | 37 (8.3%) |
| 75 Years and over | 0 (0.0%) | 21 (7.3%) |
| Total | 56 (2.1%) | 248 (8.4%) |
Income Above Poverty by Sex and Age in Rio Pinar
According to the poverty statistics in Rio Pinar, males aged 5 years and females aged 12 to 14 years are the age groups that are most secure financially, with 100.0% of males and 100.0% of females in these age groups living above the poverty line.
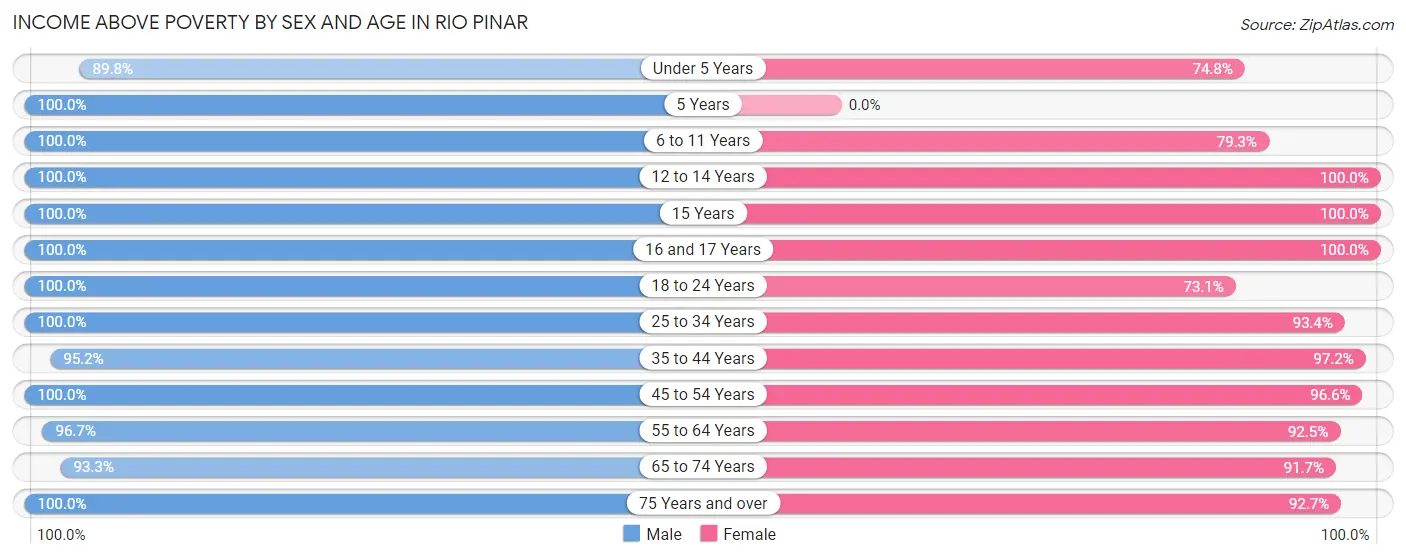
| Age Bracket | Male | Female |
| Under 5 Years | 79 (89.8%) | 92 (74.8%) |
| 5 Years | 16 (100.0%) | 0 (0.0%) |
| 6 to 11 Years | 119 (100.0%) | 107 (79.3%) |
| 12 to 14 Years | 148 (100.0%) | 102 (100.0%) |
| 15 Years | 31 (100.0%) | 57 (100.0%) |
| 16 and 17 Years | 165 (100.0%) | 120 (100.0%) |
| 18 to 24 Years | 365 (100.0%) | 163 (73.1%) |
| 25 to 34 Years | 152 (100.0%) | 225 (93.4%) |
| 35 to 44 Years | 339 (95.2%) | 385 (97.2%) |
| 45 to 54 Years | 413 (100.0%) | 401 (96.6%) |
| 55 to 64 Years | 376 (96.7%) | 368 (92.5%) |
| 65 to 74 Years | 238 (93.3%) | 408 (91.7%) |
| 75 Years and over | 224 (100.0%) | 266 (92.7%) |
| Total | 2,665 (97.9%) | 2,694 (91.6%) |
Income Below Poverty Among Married-Couple Families in Rio Pinar
The poverty statistics for married-couple families in Rio Pinar show that 1.5% or 17 of the total 1,172 families live below the poverty line. Families with 3 or 4 children have the highest poverty rate of 29.3%, comprising of 17 families. On the other hand, families with no children have the lowest poverty rate of 0.0%, which includes 0 families.
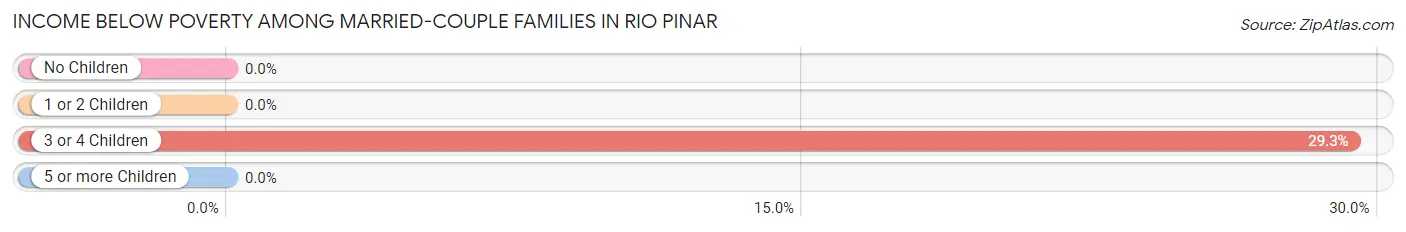
| Children | Above Poverty | Below Poverty |
| No Children | 678 (100.0%) | 0 (0.0%) |
| 1 or 2 Children | 436 (100.0%) | 0 (0.0%) |
| 3 or 4 Children | 41 (70.7%) | 17 (29.3%) |
| 5 or more Children | 0 (0.0%) | 0 (0.0%) |
| Total | 1,155 (98.6%) | 17 (1.5%) |
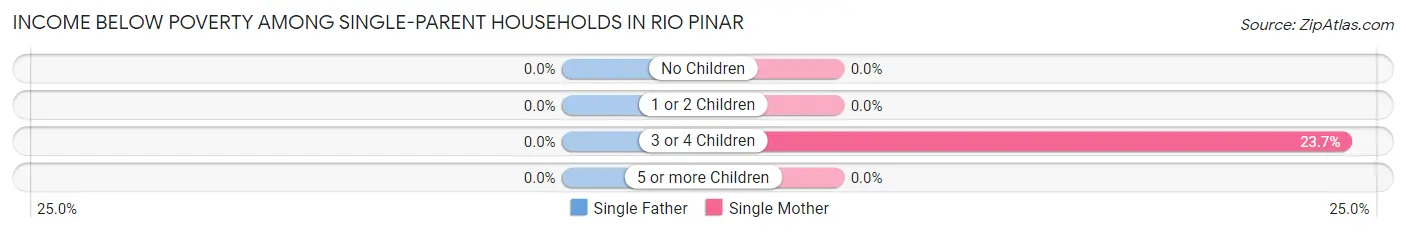
Income Below Poverty Among Single-Parent Households in Rio Pinar
| Children | Single Father | Single Mother |
| No Children | 0 (0.0%) | 0 (0.0%) |
| 1 or 2 Children | 0 (0.0%) | 0 (0.0%) |
| 3 or 4 Children | 0 (0.0%) | 9 (23.7%) |
| 5 or more Children | 0 (0.0%) | 0 (0.0%) |
| Total | 0 (0.0%) | 9 (6.6%) |
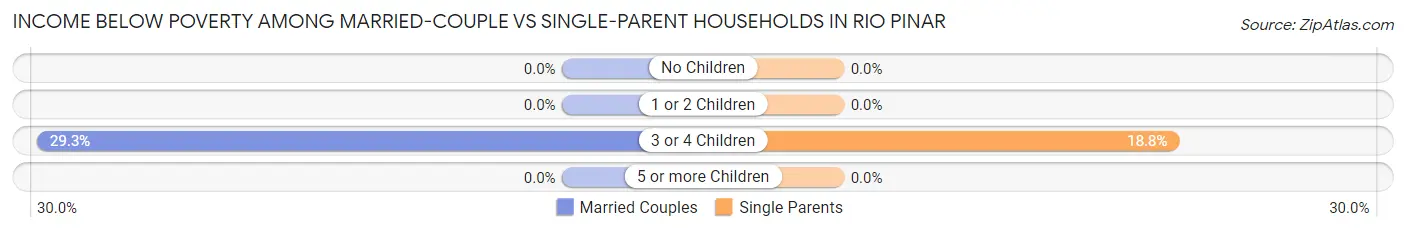
Income Below Poverty Among Married-Couple vs Single-Parent Households in Rio Pinar
The poverty data for Rio Pinar shows that 17 of the married-couple family households (1.5%) and 9 of the single-parent households (4.0%) are living below the poverty level. Within the married-couple family households, those with 3 or 4 children have the highest poverty rate, with 17 households (29.3%) falling below the poverty line. Among the single-parent households, those with 3 or 4 children have the highest poverty rate, with 9 household (18.8%) living below poverty.
| Children | Married-Couple Families | Single-Parent Households |
| No Children | 0 (0.0%) | 0 (0.0%) |
| 1 or 2 Children | 0 (0.0%) | 0 (0.0%) |
| 3 or 4 Children | 17 (29.3%) | 9 (18.8%) |
| 5 or more Children | 0 (0.0%) | 0 (0.0%) |
| Total | 17 (1.5%) | 9 (4.0%) |
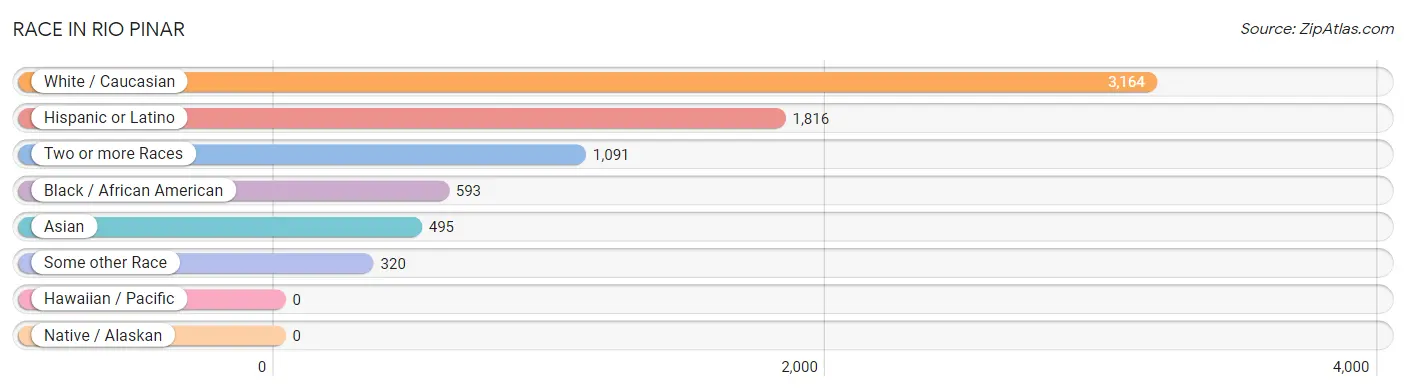
Race in Rio Pinar
The most populous races in Rio Pinar are White / Caucasian (3,164 | 55.9%), Hispanic or Latino (1,816 | 32.1%), and Two or more Races (1,091 | 19.3%).
| Race | # Population | % Population |
| Asian | 495 | 8.7% |
| Black / African American | 593 | 10.5% |
| Hawaiian / Pacific | 0 | 0.0% |
| Hispanic or Latino | 1,816 | 32.1% |
| Native / Alaskan | 0 | 0.0% |
| White / Caucasian | 3,164 | 55.9% |
| Two or more Races | 1,091 | 19.3% |
| Some other Race | 320 | 5.7% |
| Total | 5,663 | 100.0% |
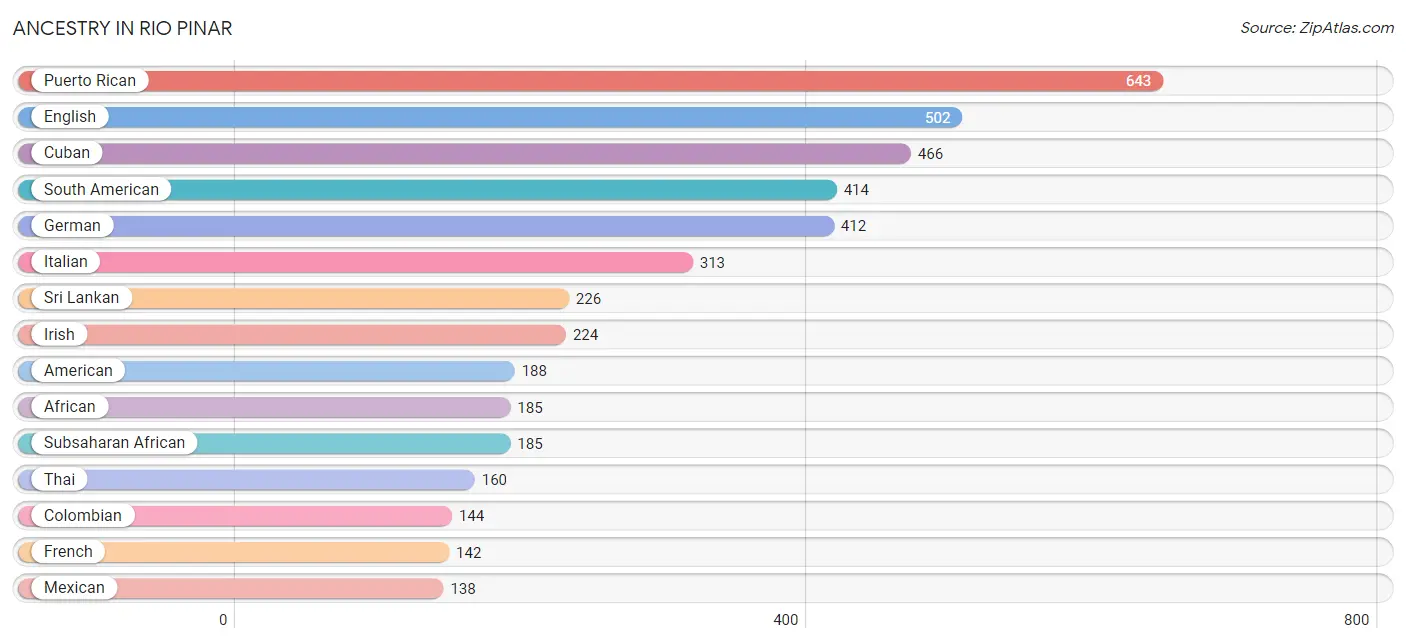
Ancestry in Rio Pinar
The most populous ancestries reported in Rio Pinar are Puerto Rican (643 | 11.4%), English (502 | 8.9%), Cuban (466 | 8.2%), South American (414 | 7.3%), and German (412 | 7.3%), together accounting for 43.0% of all Rio Pinar residents.
| Ancestry | # Population | % Population |
| African | 185 | 3.3% |
| American | 188 | 3.3% |
| Arab | 131 | 2.3% |
| Argentinean | 28 | 0.5% |
| Australian | 10 | 0.2% |
| Belgian | 9 | 0.2% |
| Bolivian | 76 | 1.3% |
| Brazilian | 28 | 0.5% |
| British | 53 | 0.9% |
| Burmese | 17 | 0.3% |
| Central American | 32 | 0.6% |
| Cherokee | 34 | 0.6% |
| Colombian | 144 | 2.5% |
| Cuban | 466 | 8.2% |
| Danish | 8 | 0.1% |
| Dominican | 123 | 2.2% |
| Dutch | 48 | 0.9% |
| Eastern European | 11 | 0.2% |
| Ecuadorian | 11 | 0.2% |
| English | 502 | 8.9% |
| European | 52 | 0.9% |
| French | 142 | 2.5% |
| German | 412 | 7.3% |
| Greek | 30 | 0.5% |
| Honduran | 3 | 0.1% |
| Hungarian | 11 | 0.2% |
| Indian (Asian) | 33 | 0.6% |
| Irish | 224 | 4.0% |
| Italian | 313 | 5.5% |
| Jamaican | 94 | 1.7% |
| Jordanian | 40 | 0.7% |
| Korean | 49 | 0.9% |
| Lebanese | 79 | 1.4% |
| Mexican | 138 | 2.4% |
| Norwegian | 17 | 0.3% |
| Pakistani | 22 | 0.4% |
| Panamanian | 29 | 0.5% |
| Peruvian | 58 | 1.0% |
| Polish | 44 | 0.8% |
| Puerto Rican | 643 | 11.4% |
| Russian | 21 | 0.4% |
| Scandinavian | 13 | 0.2% |
| Scotch-Irish | 52 | 0.9% |
| Scottish | 35 | 0.6% |
| South American | 414 | 7.3% |
| South American Indian | 47 | 0.8% |
| Sri Lankan | 226 | 4.0% |
| Subsaharan African | 185 | 3.3% |
| Swedish | 44 | 0.8% |
| Syrian | 4 | 0.1% |
| Thai | 160 | 2.8% |
| Uruguayan | 31 | 0.5% |
| Venezuelan | 66 | 1.2% |
| Welsh | 19 | 0.3% |
| West Indian | 28 | 0.5% | View All 55 Rows |
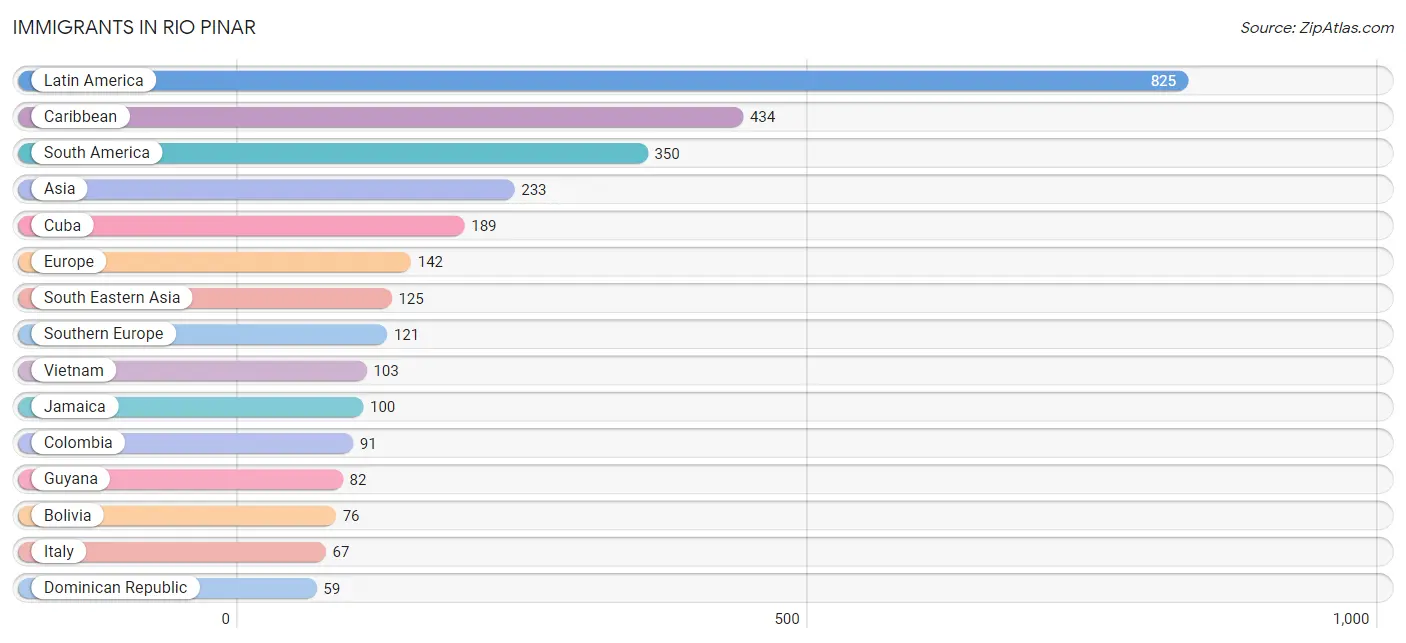
Immigrants in Rio Pinar
The most numerous immigrant groups reported in Rio Pinar came from Latin America (825 | 14.6%), Caribbean (434 | 7.7%), South America (350 | 6.2%), Asia (233 | 4.1%), and Cuba (189 | 3.3%), together accounting for 35.9% of all Rio Pinar residents.
| Immigration Origin | # Population | % Population |
| Africa | 23 | 0.4% |
| Argentina | 8 | 0.1% |
| Asia | 233 | 4.1% |
| Australia | 10 | 0.2% |
| Bolivia | 76 | 1.3% |
| Brazil | 7 | 0.1% |
| Canada | 9 | 0.2% |
| Caribbean | 434 | 7.7% |
| Central America | 41 | 0.7% |
| China | 14 | 0.3% |
| Colombia | 91 | 1.6% |
| Cuba | 189 | 3.3% |
| Dominican Republic | 59 | 1.0% |
| Eastern Asia | 14 | 0.3% |
| England | 11 | 0.2% |
| Europe | 142 | 2.5% |
| Germany | 10 | 0.2% |
| Greece | 46 | 0.8% |
| Guyana | 82 | 1.5% |
| Honduras | 3 | 0.1% |
| India | 28 | 0.5% |
| Israel | 25 | 0.4% |
| Italy | 67 | 1.2% |
| Jamaica | 100 | 1.8% |
| Kuwait | 13 | 0.2% |
| Latin America | 825 | 14.6% |
| Lebanon | 14 | 0.3% |
| Mexico | 12 | 0.2% |
| Morocco | 23 | 0.4% |
| Northern Africa | 23 | 0.4% |
| Northern Europe | 11 | 0.2% |
| Oceania | 10 | 0.2% |
| Panama | 26 | 0.5% |
| Peru | 25 | 0.4% |
| Philippines | 8 | 0.1% |
| South America | 350 | 6.2% |
| South Central Asia | 28 | 0.5% |
| South Eastern Asia | 125 | 2.2% |
| Southern Europe | 121 | 2.1% |
| Spain | 8 | 0.1% |
| Thailand | 14 | 0.3% |
| Trinidad and Tobago | 9 | 0.2% |
| Uruguay | 31 | 0.5% |
| Venezuela | 30 | 0.5% |
| Vietnam | 103 | 1.8% |
| Western Asia | 52 | 0.9% |
| Western Europe | 10 | 0.2% | View All 47 Rows |
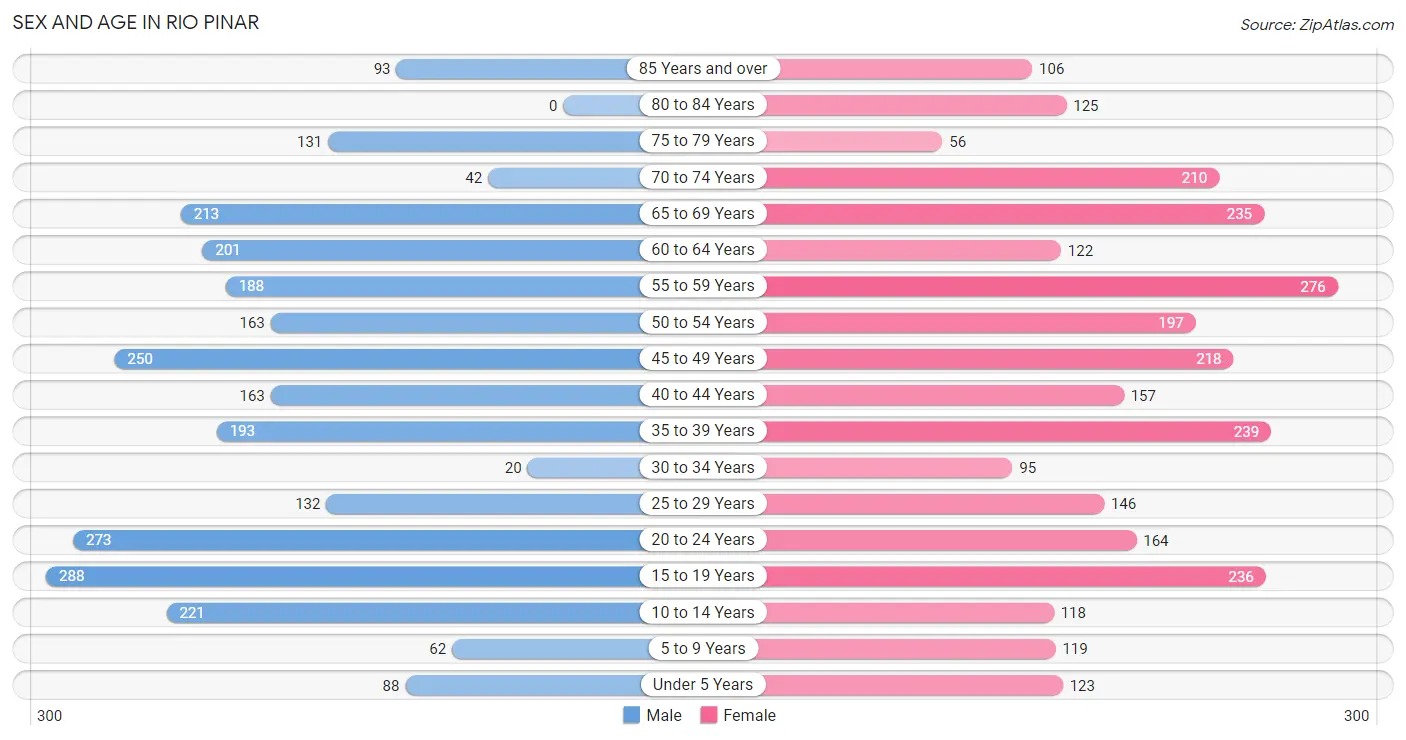
Sex and Age in Rio Pinar
Sex and Age in Rio Pinar
The most populous age groups in Rio Pinar are 15 to 19 Years (288 | 10.6%) for men and 55 to 59 Years (276 | 9.4%) for women.
| Age Bracket | Male | Female |
| Under 5 Years | 88 (3.2%) | 123 (4.2%) |
| 5 to 9 Years | 62 (2.3%) | 119 (4.0%) |
| 10 to 14 Years | 221 (8.1%) | 118 (4.0%) |
| 15 to 19 Years | 288 (10.6%) | 236 (8.0%) |
| 20 to 24 Years | 273 (10.0%) | 164 (5.6%) |
| 25 to 29 Years | 132 (4.9%) | 146 (5.0%) |
| 30 to 34 Years | 20 (0.7%) | 95 (3.2%) |
| 35 to 39 Years | 193 (7.1%) | 239 (8.1%) |
| 40 to 44 Years | 163 (6.0%) | 157 (5.3%) |
| 45 to 49 Years | 250 (9.2%) | 218 (7.4%) |
| 50 to 54 Years | 163 (6.0%) | 197 (6.7%) |
| 55 to 59 Years | 188 (6.9%) | 276 (9.4%) |
| 60 to 64 Years | 201 (7.4%) | 122 (4.2%) |
| 65 to 69 Years | 213 (7.8%) | 235 (8.0%) |
| 70 to 74 Years | 42 (1.5%) | 210 (7.1%) |
| 75 to 79 Years | 131 (4.8%) | 56 (1.9%) |
| 80 to 84 Years | 0 (0.0%) | 125 (4.3%) |
| 85 Years and over | 93 (3.4%) | 106 (3.6%) |
| Total | 2,721 (100.0%) | 2,942 (100.0%) |
Families and Households in Rio Pinar
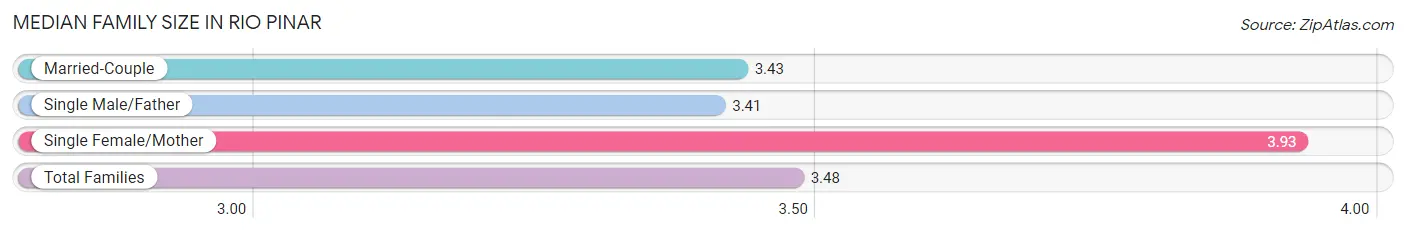
Median Family Size in Rio Pinar
The median family size in Rio Pinar is 3.48 persons per family, with single female/mother families (137 | 9.8%) accounting for the largest median family size of 3.93 persons per family. On the other hand, single male/father families (87 | 6.2%) represent the smallest median family size with 3.41 persons per family.
| Family Type | # Families | Family Size |
| Married-Couple | 1,172 (84.0%) | 3.43 |
| Single Male/Father | 87 (6.2%) | 3.41 |
| Single Female/Mother | 137 (9.8%) | 3.93 |
| Total Families | 1,396 (100.0%) | 3.48 |
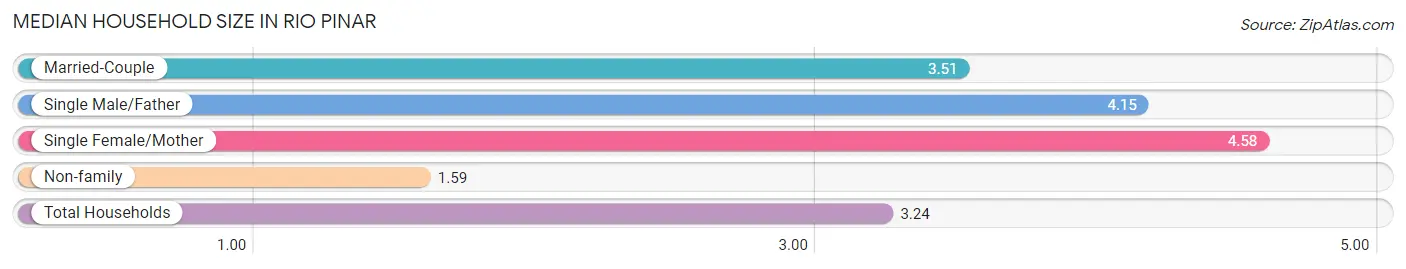
Median Household Size in Rio Pinar
The median household size in Rio Pinar is 3.24 persons per household, with single female/mother households (137 | 7.8%) accounting for the largest median household size of 4.58 persons per household. non-family households (351 | 20.1%) represent the smallest median household size with 1.59 persons per household.
| Household Type | # Households | Household Size |
| Married-Couple | 1,172 (67.1%) | 3.51 |
| Single Male/Father | 87 (5.0%) | 4.15 |
| Single Female/Mother | 137 (7.8%) | 4.58 |
| Non-family | 351 (20.1%) | 1.59 |
| Total Households | 1,747 (100.0%) | 3.24 |
Household Size by Marriage Status in Rio Pinar
Out of a total of 1,747 households in Rio Pinar, 1,396 (79.9%) are family households, while 351 (20.1%) are nonfamily households. The most numerous type of family households are 2-person households, comprising 554, and the most common type of nonfamily households are 1-person households, comprising 245.
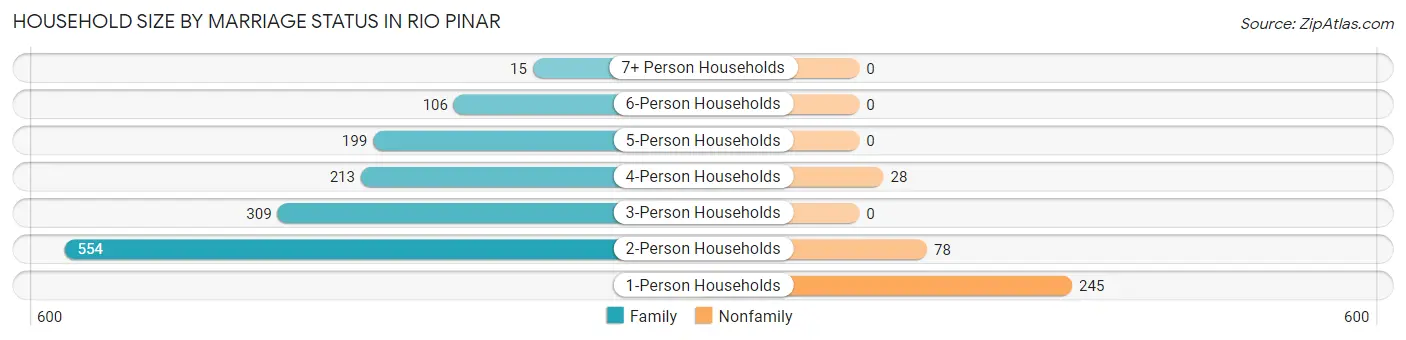
| Household Size | Family Households | Nonfamily Households |
| 1-Person Households | - | 245 (14.0%) |
| 2-Person Households | 554 (31.7%) | 78 (4.5%) |
| 3-Person Households | 309 (17.7%) | 0 (0.0%) |
| 4-Person Households | 213 (12.2%) | 28 (1.6%) |
| 5-Person Households | 199 (11.4%) | 0 (0.0%) |
| 6-Person Households | 106 (6.1%) | 0 (0.0%) |
| 7+ Person Households | 15 (0.9%) | 0 (0.0%) |
| Total | 1,396 (79.9%) | 351 (20.1%) |
Female Fertility in Rio Pinar
Fertility by Age in Rio Pinar
Average fertility rate in Rio Pinar is 12.0 births per 1,000 women. Women in the age bracket of 20 to 34 years have the highest fertility rate with 40.0 births per 1,000 women. Women in the age bracket of 20 to 34 years acount for 100.0% of all women with births.
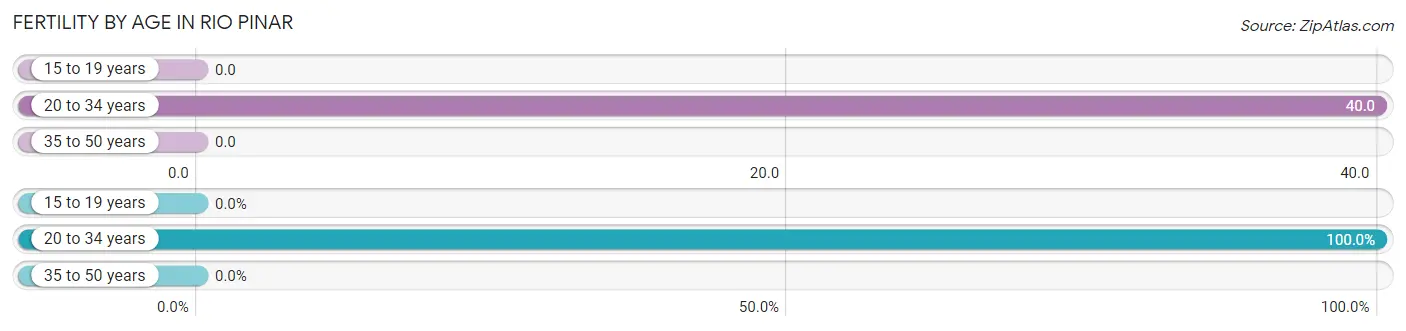
| Age Bracket | Women with Births | Births / 1,000 Women |
| 15 to 19 years | 0 (0.0%) | 0.0 |
| 20 to 34 years | 16 (100.0%) | 40.0 |
| 35 to 50 years | 0 (0.0%) | 0.0 |
| Total | 16 (100.0%) | 12.0 |
Fertility by Age by Marriage Status in Rio Pinar
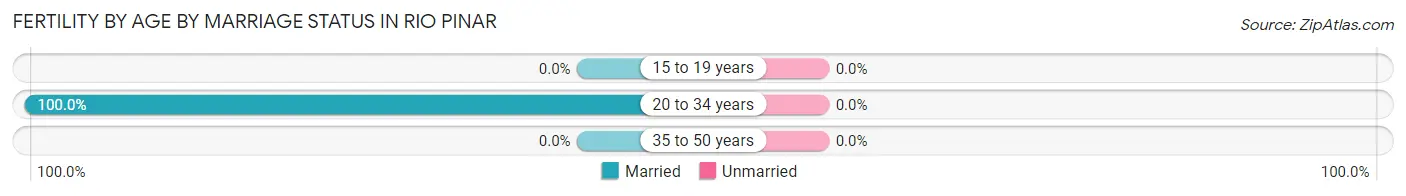
| Age Bracket | Married | Unmarried |
| 15 to 19 years | 0 (0.0%) | 0 (0.0%) |
| 20 to 34 years | 16 (100.0%) | 0 (0.0%) |
| 35 to 50 years | 0 (0.0%) | 0 (0.0%) |
| Total | 16 (100.0%) | 0 (0.0%) |
Fertility by Education in Rio Pinar
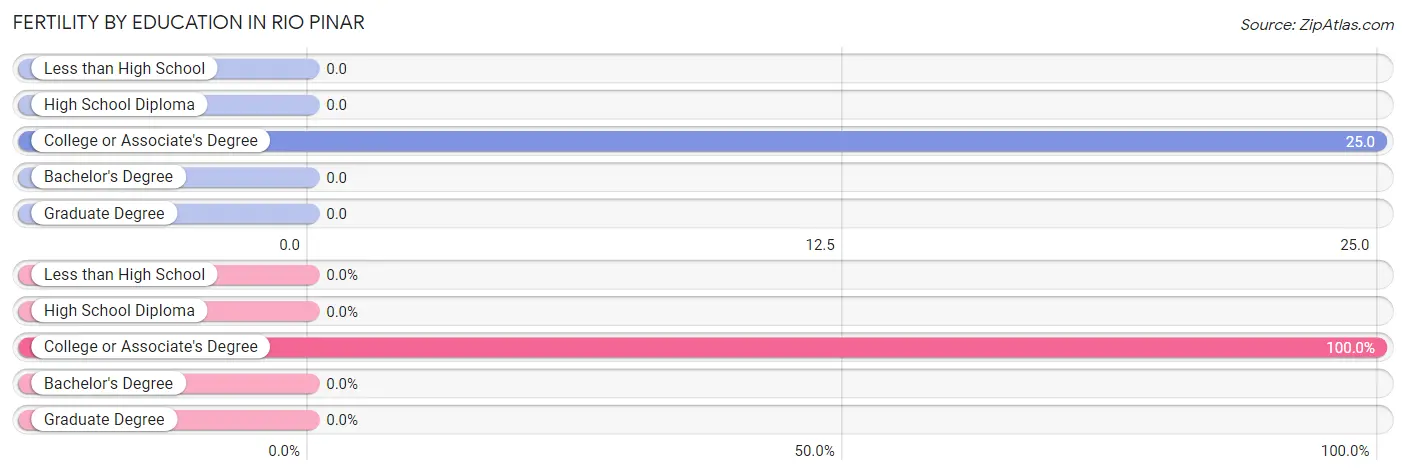
| Educational Attainment | Women with Births | Births / 1,000 Women |
| Less than High School | 0 (0.0%) | 0.0 |
| High School Diploma | 0 (0.0%) | 0.0 |
| College or Associate's Degree | 16 (100.0%) | 25.0 |
| Bachelor's Degree | 0 (0.0%) | 0.0 |
| Graduate Degree | 0 (0.0%) | 0.0 |
| Total | 16 (100.0%) | 12.0 |
Fertility by Education by Marriage Status in Rio Pinar
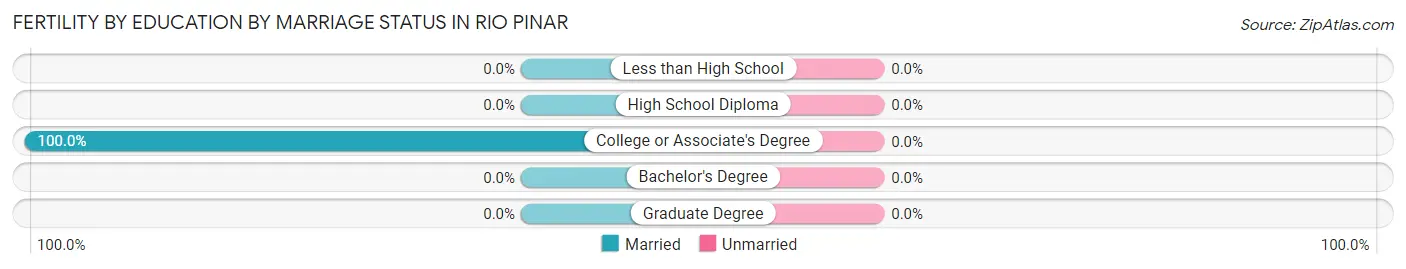
| Educational Attainment | Married | Unmarried |
| Less than High School | 0 (0.0%) | 0 (0.0%) |
| High School Diploma | 0 (0.0%) | 0 (0.0%) |
| College or Associate's Degree | 16 (100.0%) | 0 (0.0%) |
| Bachelor's Degree | 0 (0.0%) | 0 (0.0%) |
| Graduate Degree | 0 (0.0%) | 0 (0.0%) |
| Total | 16 (100.0%) | 0 (0.0%) |
Employment Characteristics in Rio Pinar
Employment by Class of Employer in Rio Pinar
Among the 2,634 employed individuals in Rio Pinar, private company employees (1,574 | 59.8%), self-employed (not incorporated) (293 | 11.1%), and self-employed (incorporated) (227 | 8.6%) make up the most common classes of employment.
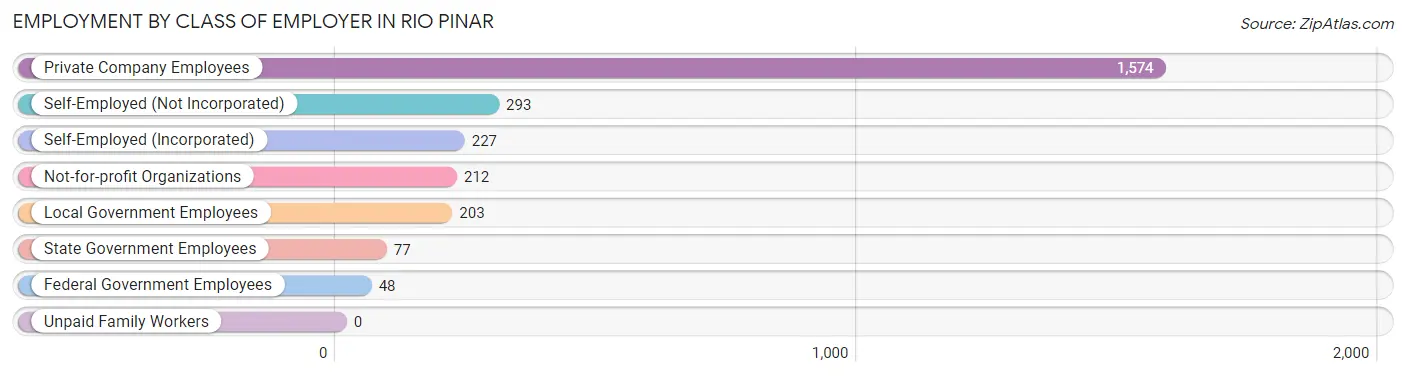
| Employer Class | # Employees | % Employees |
| Private Company Employees | 1,574 | 59.8% |
| Self-Employed (Incorporated) | 227 | 8.6% |
| Self-Employed (Not Incorporated) | 293 | 11.1% |
| Not-for-profit Organizations | 212 | 8.1% |
| Local Government Employees | 203 | 7.7% |
| State Government Employees | 77 | 2.9% |
| Federal Government Employees | 48 | 1.8% |
| Unpaid Family Workers | 0 | 0.0% |
| Total | 2,634 | 100.0% |
Employment Status by Age in Rio Pinar
According to the labor force statistics for Rio Pinar, out of the total population over 16 years of age (4,844), 58.7% or 2,843 individuals are in the labor force, with 4.7% or 134 of them unemployed. The age group with the highest labor force participation rate is 45 to 54 years, with 87.2% or 722 individuals in the labor force. Within the labor force, the 16 to 19 years age range has the highest percentage of unemployed individuals, with 51.4% or 54 of them being unemployed.
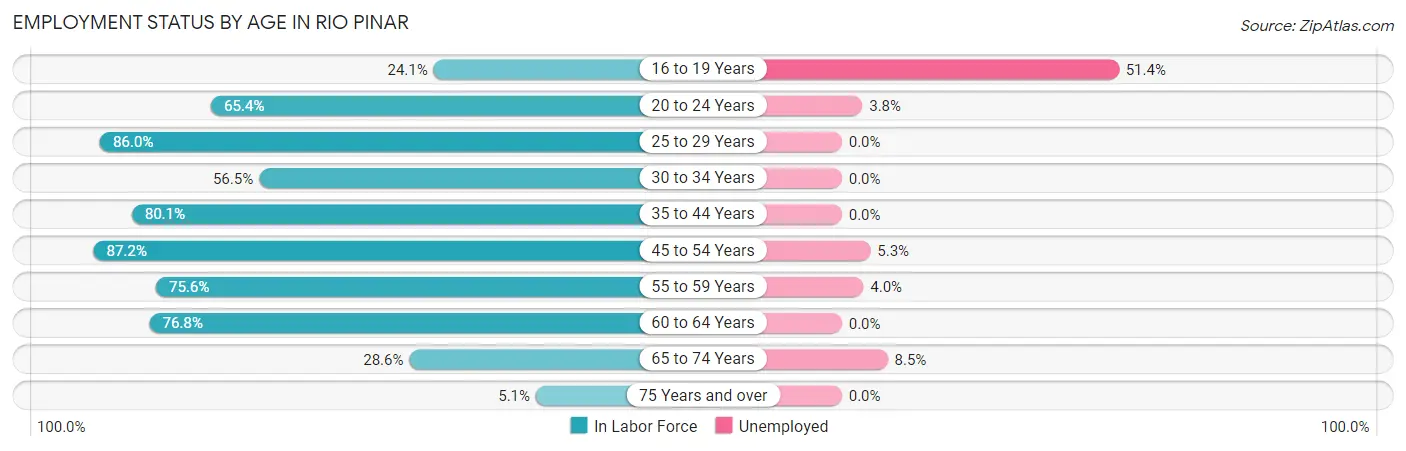
| Age Bracket | In Labor Force | Unemployed |
| 16 to 19 Years | 105 (24.1%) | 54 (51.4%) |
| 20 to 24 Years | 286 (65.4%) | 11 (3.8%) |
| 25 to 29 Years | 239 (86.0%) | 0 (0.0%) |
| 30 to 34 Years | 65 (56.5%) | 0 (0.0%) |
| 35 to 44 Years | 602 (80.1%) | 0 (0.0%) |
| 45 to 54 Years | 722 (87.2%) | 38 (5.3%) |
| 55 to 59 Years | 351 (75.6%) | 14 (4.0%) |
| 60 to 64 Years | 248 (76.8%) | 0 (0.0%) |
| 65 to 74 Years | 200 (28.6%) | 17 (8.5%) |
| 75 Years and over | 26 (5.1%) | 0 (0.0%) |
| Total | 2,843 (58.7%) | 134 (4.7%) |
Employment Status by Educational Attainment in Rio Pinar
According to labor force statistics for Rio Pinar, 80.7% of individuals (2,227) out of the total population between 25 and 64 years of age (2,760) are in the labor force, with 2.3% or 51 of them being unemployed. The group with the highest labor force participation rate are those with the educational attainment of bachelor's degree or higher, with 83.5% or 752 individuals in the labor force. Within the labor force, individuals with bachelor's degree or higher education have the highest percentage of unemployment, with 4.4% or 33 of them being unemployed.
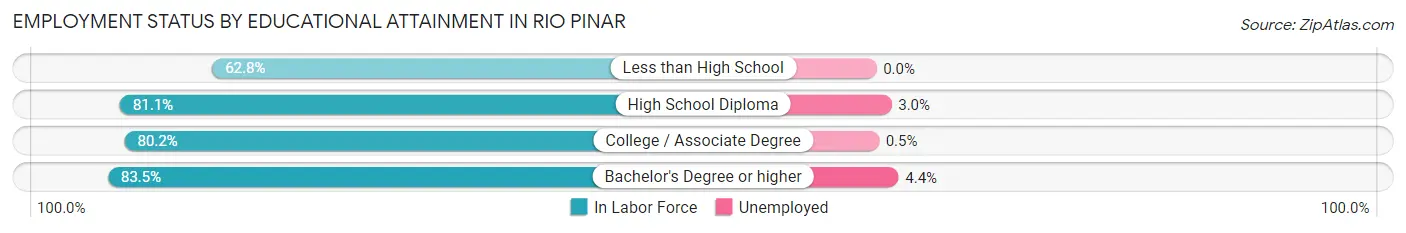
| Educational Attainment | In Labor Force | Unemployed |
| Less than High School | 76 (62.8%) | 0 (0.0%) |
| High School Diploma | 473 (81.1%) | 17 (3.0%) |
| College / Associate Degree | 926 (80.2%) | 6 (0.5%) |
| Bachelor's Degree or higher | 752 (83.5%) | 40 (4.4%) |
| Total | 2,227 (80.7%) | 63 (2.3%) |
Employment Occupations by Sex in Rio Pinar
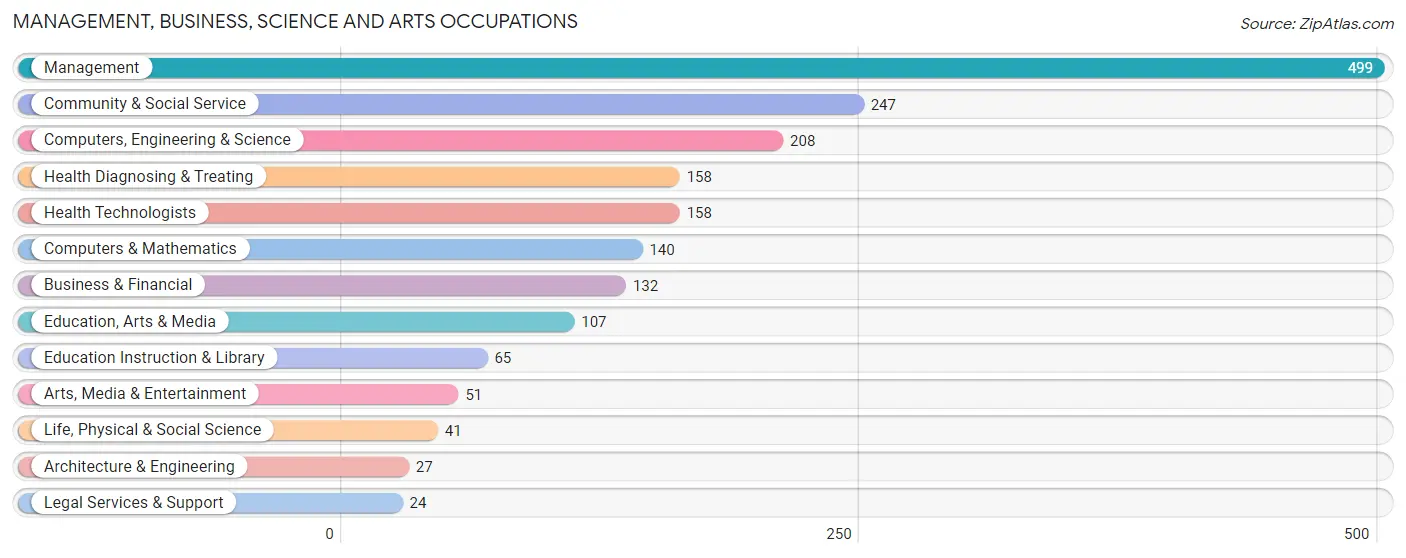
Management, Business, Science and Arts Occupations
The most common Management, Business, Science and Arts occupations in Rio Pinar are Management (499 | 18.4%), Community & Social Service (247 | 9.1%), Computers, Engineering & Science (208 | 7.7%), Health Diagnosing & Treating (158 | 5.8%), and Health Technologists (158 | 5.8%).
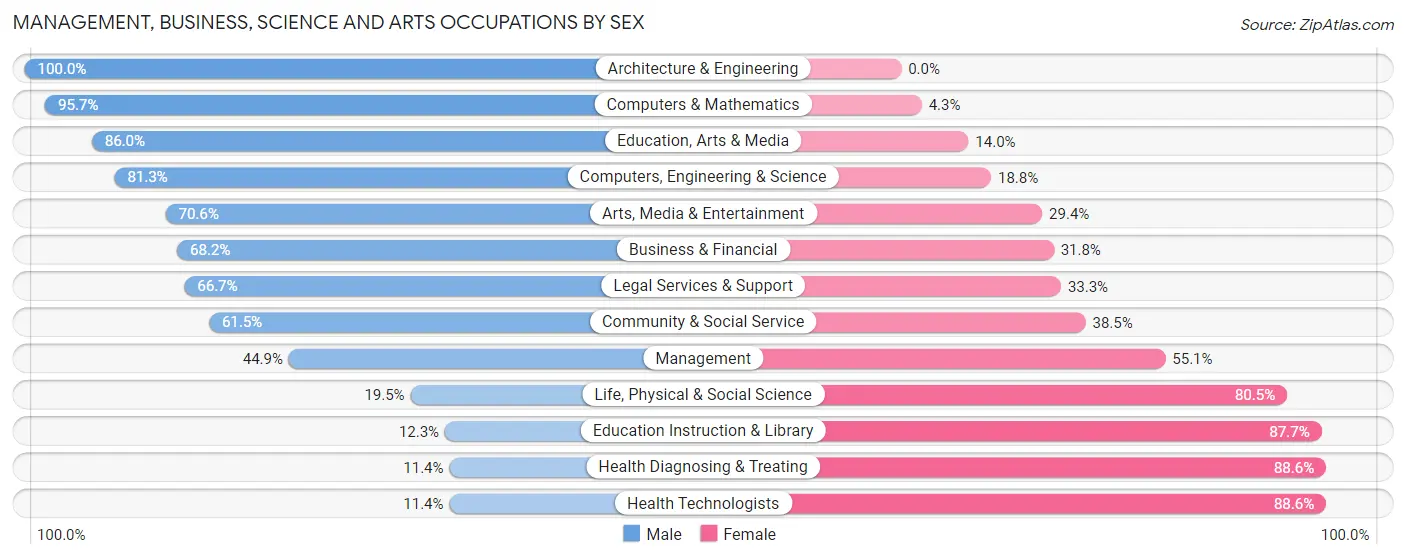
Management, Business, Science and Arts Occupations by Sex
Within the Management, Business, Science and Arts occupations in Rio Pinar, the most male-oriented occupations are Architecture & Engineering (100.0%), Computers & Mathematics (95.7%), and Education, Arts & Media (86.0%), while the most female-oriented occupations are Health Diagnosing & Treating (88.6%), Health Technologists (88.6%), and Education Instruction & Library (87.7%).
| Occupation | Male | Female |
| Management | 224 (44.9%) | 275 (55.1%) |
| Business & Financial | 90 (68.2%) | 42 (31.8%) |
| Computers, Engineering & Science | 169 (81.2%) | 39 (18.8%) |
| Computers & Mathematics | 134 (95.7%) | 6 (4.3%) |
| Architecture & Engineering | 27 (100.0%) | 0 (0.0%) |
| Life, Physical & Social Science | 8 (19.5%) | 33 (80.5%) |
| Community & Social Service | 152 (61.5%) | 95 (38.5%) |
| Education, Arts & Media | 92 (86.0%) | 15 (14.0%) |
| Legal Services & Support | 16 (66.7%) | 8 (33.3%) |
| Education Instruction & Library | 8 (12.3%) | 57 (87.7%) |
| Arts, Media & Entertainment | 36 (70.6%) | 15 (29.4%) |
| Health Diagnosing & Treating | 18 (11.4%) | 140 (88.6%) |
| Health Technologists | 18 (11.4%) | 140 (88.6%) |
| Total (Category) | 653 (52.5%) | 591 (47.5%) |
| Total (Overall) | 1,537 (56.7%) | 1,173 (43.3%) |
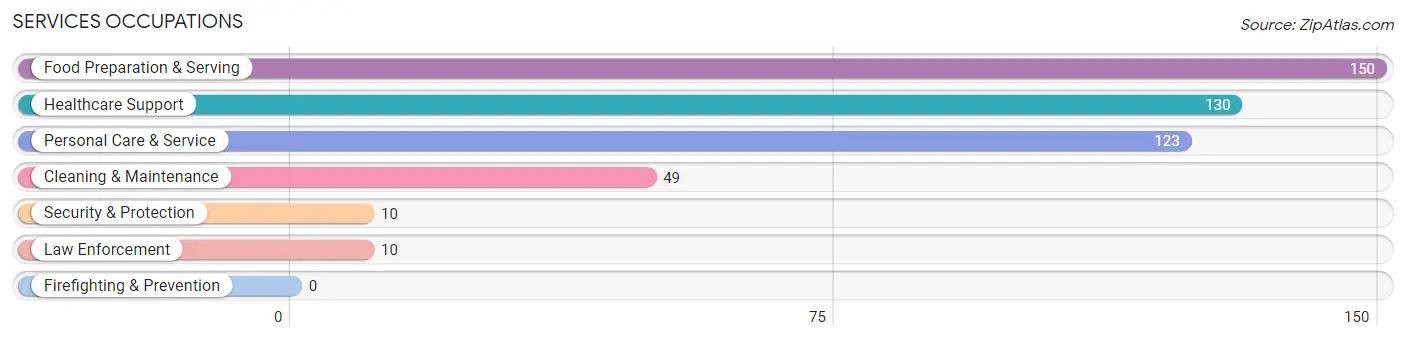
Services Occupations
The most common Services occupations in Rio Pinar are Food Preparation & Serving (150 | 5.5%), Healthcare Support (130 | 4.8%), Personal Care & Service (123 | 4.5%), Cleaning & Maintenance (49 | 1.8%), and Security & Protection (10 | 0.4%).
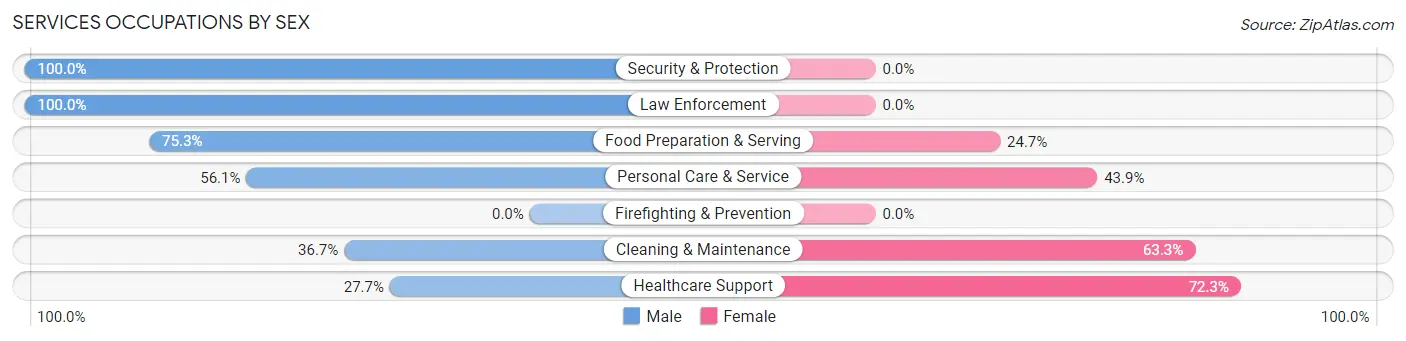
Services Occupations by Sex
Within the Services occupations in Rio Pinar, the most male-oriented occupations are Security & Protection (100.0%), Law Enforcement (100.0%), and Food Preparation & Serving (75.3%), while the most female-oriented occupations are Healthcare Support (72.3%), Cleaning & Maintenance (63.3%), and Personal Care & Service (43.9%).
| Occupation | Male | Female |
| Healthcare Support | 36 (27.7%) | 94 (72.3%) |
| Security & Protection | 10 (100.0%) | 0 (0.0%) |
| Firefighting & Prevention | 0 (0.0%) | 0 (0.0%) |
| Law Enforcement | 10 (100.0%) | 0 (0.0%) |
| Food Preparation & Serving | 113 (75.3%) | 37 (24.7%) |
| Cleaning & Maintenance | 18 (36.7%) | 31 (63.3%) |
| Personal Care & Service | 69 (56.1%) | 54 (43.9%) |
| Total (Category) | 246 (53.2%) | 216 (46.8%) |
| Total (Overall) | 1,537 (56.7%) | 1,173 (43.3%) |
Sales and Office Occupations
The most common Sales and Office occupations in Rio Pinar are Office & Administration (362 | 13.4%), and Sales & Related (292 | 10.8%).

Sales and Office Occupations by Sex

| Occupation | Male | Female |
| Sales & Related | 140 (47.9%) | 152 (52.0%) |
| Office & Administration | 157 (43.4%) | 205 (56.6%) |
| Total (Category) | 297 (45.4%) | 357 (54.6%) |
| Total (Overall) | 1,537 (56.7%) | 1,173 (43.3%) |
Natural Resources, Construction and Maintenance Occupations
The most common Natural Resources, Construction and Maintenance occupations in Rio Pinar are Installation, Maintenance & Repair (132 | 4.9%), and Construction & Extraction (98 | 3.6%).
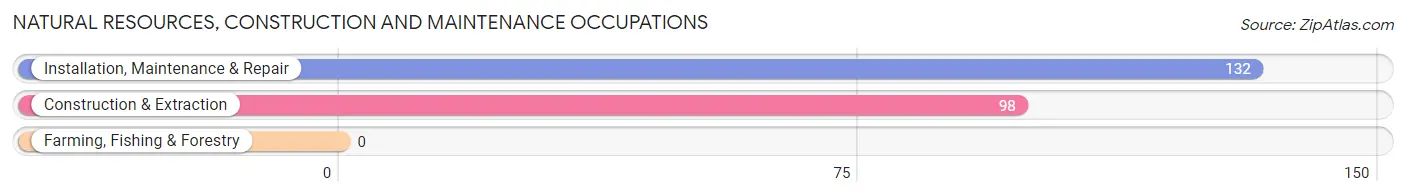
Natural Resources, Construction and Maintenance Occupations by Sex

| Occupation | Male | Female |
| Farming, Fishing & Forestry | 0 (0.0%) | 0 (0.0%) |
| Construction & Extraction | 98 (100.0%) | 0 (0.0%) |
| Installation, Maintenance & Repair | 132 (100.0%) | 0 (0.0%) |
| Total (Category) | 230 (100.0%) | 0 (0.0%) |
| Total (Overall) | 1,537 (56.7%) | 1,173 (43.3%) |
Production, Transportation and Moving Occupations
The most common Production, Transportation and Moving occupations in Rio Pinar are Transportation (73 | 2.7%), and Material Moving (47 | 1.7%).
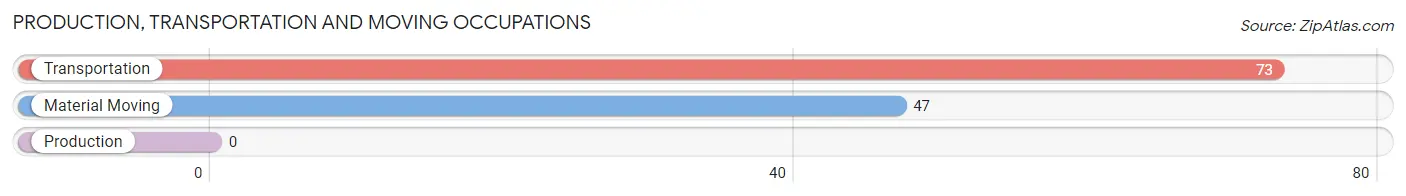
Production, Transportation and Moving Occupations by Sex
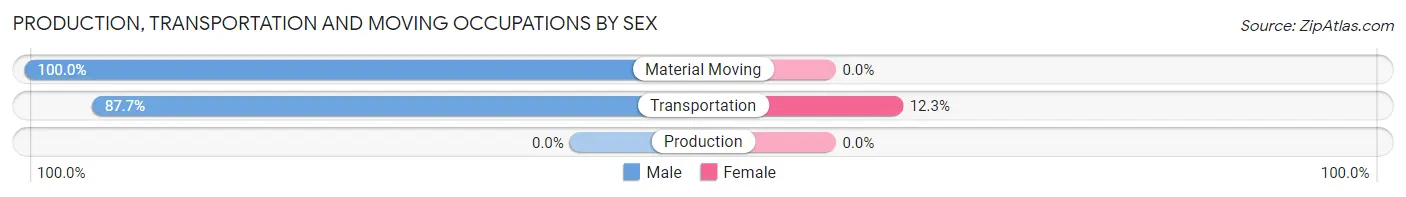
| Occupation | Male | Female |
| Production | 0 (0.0%) | 0 (0.0%) |
| Transportation | 64 (87.7%) | 9 (12.3%) |
| Material Moving | 47 (100.0%) | 0 (0.0%) |
| Total (Category) | 111 (92.5%) | 9 (7.5%) |
| Total (Overall) | 1,537 (56.7%) | 1,173 (43.3%) |
Employment Industries by Sex in Rio Pinar
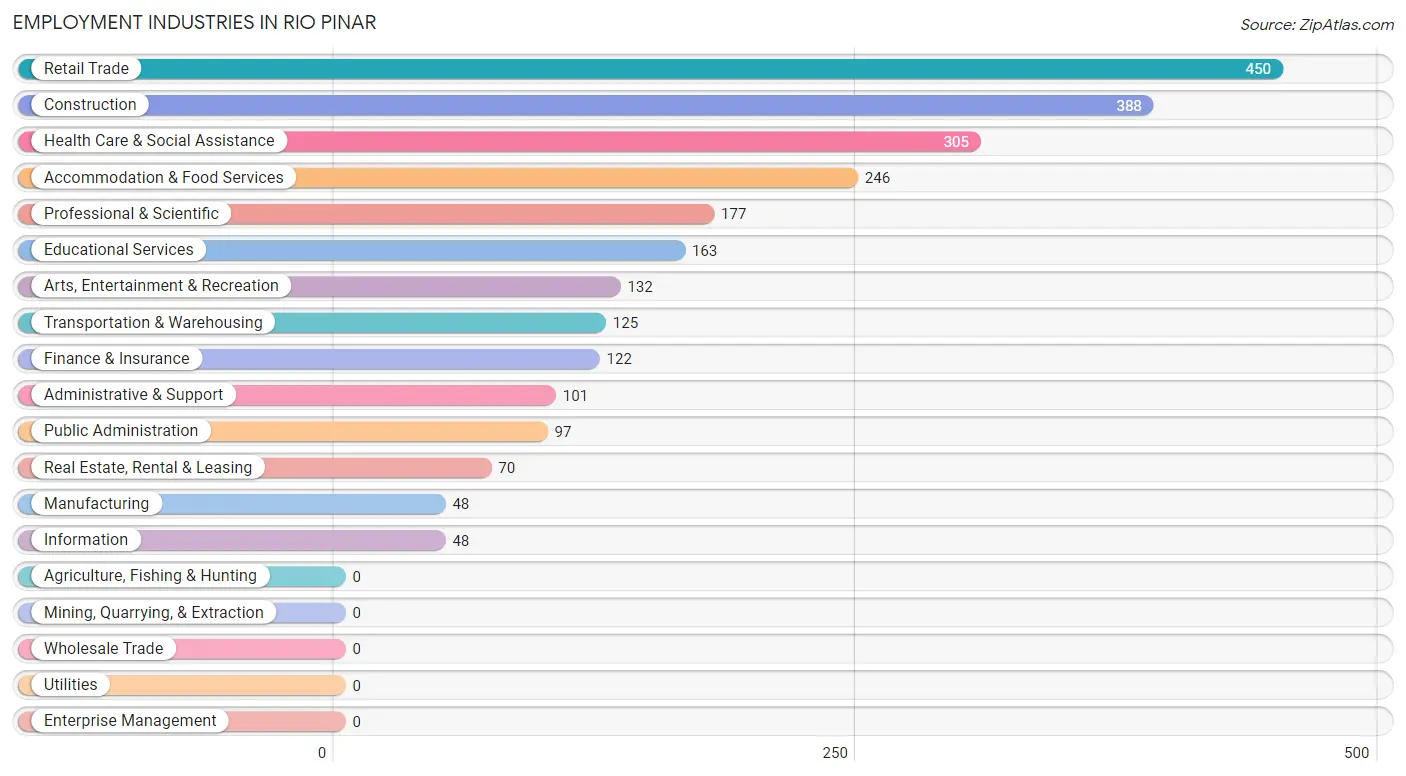
Employment Industries in Rio Pinar
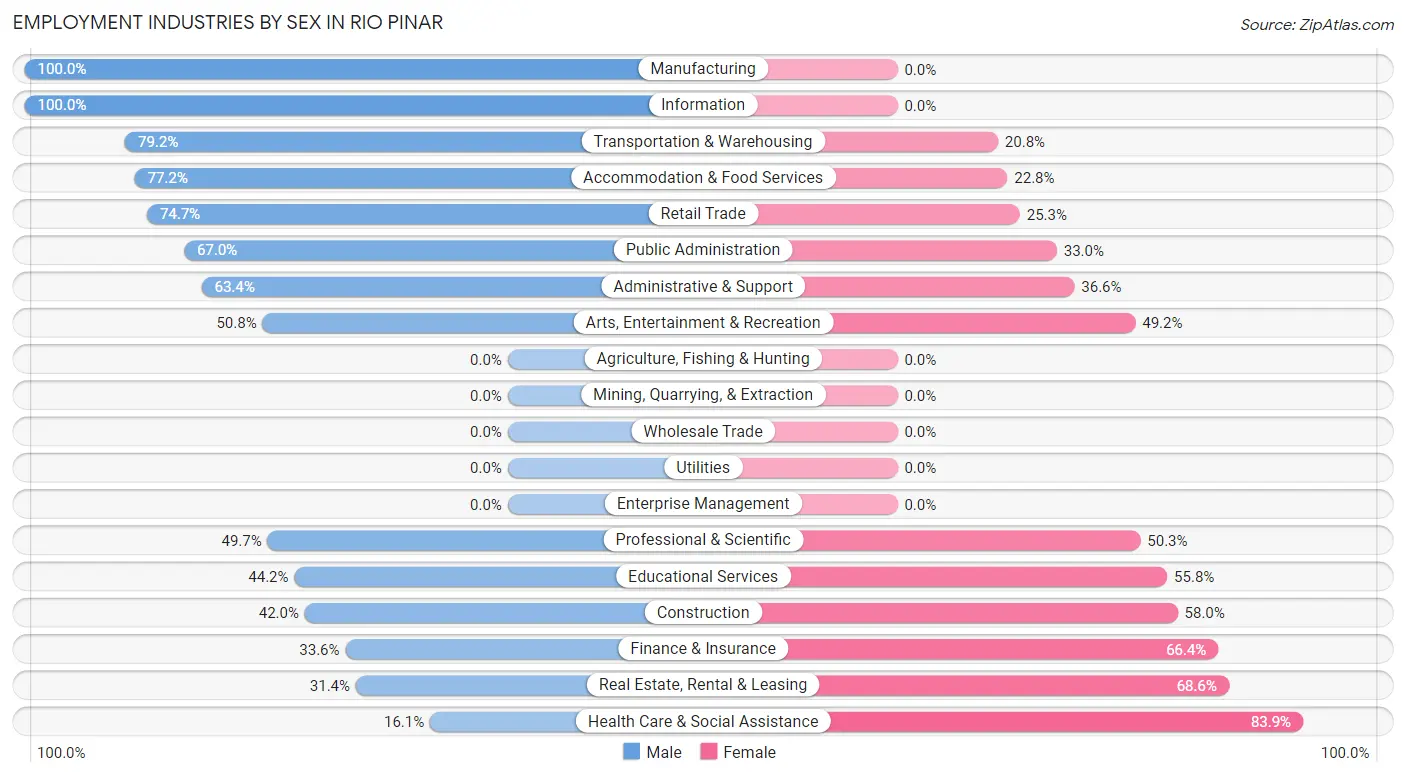
The major employment industries in Rio Pinar include Retail Trade (450 | 16.6%), Construction (388 | 14.3%), Health Care & Social Assistance (305 | 11.3%), Accommodation & Food Services (246 | 9.1%), and Professional & Scientific (177 | 6.5%).
Employment Industries by Sex in Rio Pinar
The Rio Pinar industries that see more men than women are Manufacturing (100.0%), Information (100.0%), and Transportation & Warehousing (79.2%), whereas the industries that tend to have a higher number of women are Health Care & Social Assistance (83.9%), Real Estate, Rental & Leasing (68.6%), and Finance & Insurance (66.4%).
| Industry | Male | Female |
| Agriculture, Fishing & Hunting | 0 (0.0%) | 0 (0.0%) |
| Mining, Quarrying, & Extraction | 0 (0.0%) | 0 (0.0%) |
| Construction | 163 (42.0%) | 225 (58.0%) |
| Manufacturing | 48 (100.0%) | 0 (0.0%) |
| Wholesale Trade | 0 (0.0%) | 0 (0.0%) |
| Retail Trade | 336 (74.7%) | 114 (25.3%) |
| Transportation & Warehousing | 99 (79.2%) | 26 (20.8%) |
| Utilities | 0 (0.0%) | 0 (0.0%) |
| Information | 48 (100.0%) | 0 (0.0%) |
| Finance & Insurance | 41 (33.6%) | 81 (66.4%) |
| Real Estate, Rental & Leasing | 22 (31.4%) | 48 (68.6%) |
| Professional & Scientific | 88 (49.7%) | 89 (50.3%) |
| Enterprise Management | 0 (0.0%) | 0 (0.0%) |
| Administrative & Support | 64 (63.4%) | 37 (36.6%) |
| Educational Services | 72 (44.2%) | 91 (55.8%) |
| Health Care & Social Assistance | 49 (16.1%) | 256 (83.9%) |
| Arts, Entertainment & Recreation | 67 (50.8%) | 65 (49.2%) |
| Accommodation & Food Services | 190 (77.2%) | 56 (22.8%) |
| Public Administration | 65 (67.0%) | 32 (33.0%) |
| Total | 1,537 (56.7%) | 1,173 (43.3%) |
Education in Rio Pinar
School Enrollment in Rio Pinar
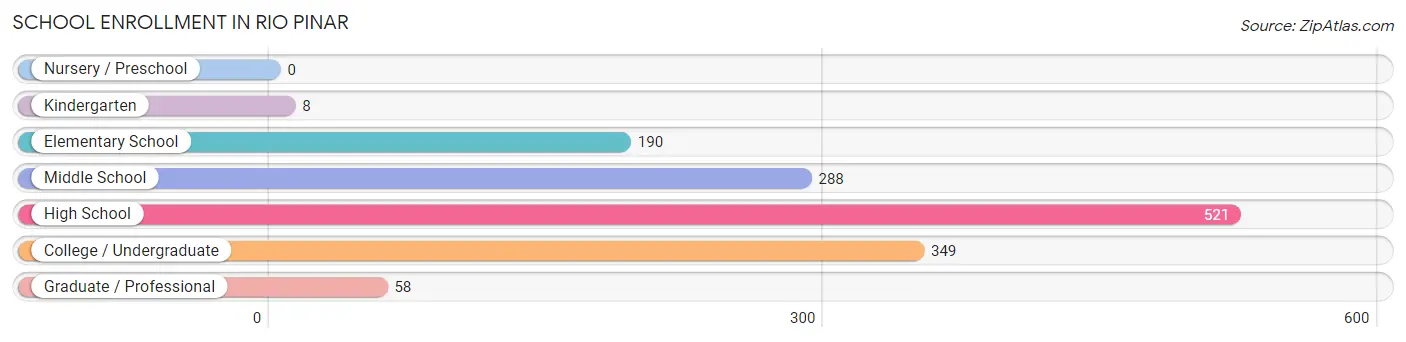
The most common levels of schooling among the 1,414 students in Rio Pinar are high school (521 | 36.8%), college / undergraduate (349 | 24.7%), and middle school (288 | 20.4%).
| School Level | # Students | % Students |
| Nursery / Preschool | 0 | 0.0% |
| Kindergarten | 8 | 0.6% |
| Elementary School | 190 | 13.4% |
| Middle School | 288 | 20.4% |
| High School | 521 | 36.8% |
| College / Undergraduate | 349 | 24.7% |
| Graduate / Professional | 58 | 4.1% |
| Total | 1,414 | 100.0% |
School Enrollment by Age by Funding Source in Rio Pinar
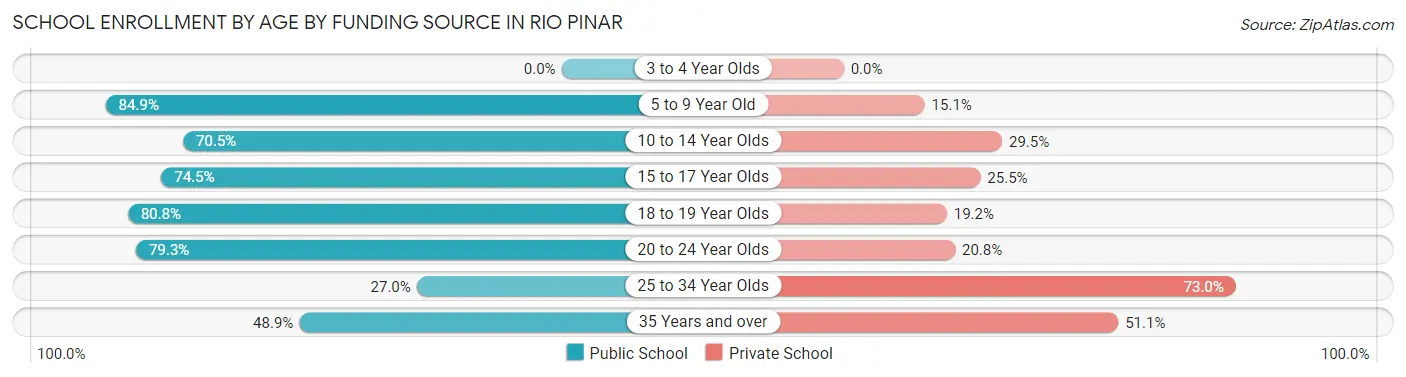
Out of a total of 1,414 students who are enrolled in schools in Rio Pinar, 389 (27.5%) attend a private institution, while the remaining 1,025 (72.5%) are enrolled in public schools. The age group of 25 to 34 year olds has the highest likelihood of being enrolled in private schools, with 46 (73.0% in the age bracket) enrolled. Conversely, the age group of 5 to 9 year old has the lowest likelihood of being enrolled in a private school, with 135 (84.9% in the age bracket) attending a public institution.
| Age Bracket | Public School | Private School |
| 3 to 4 Year Olds | 0 (0.0%) | 0 (0.0%) |
| 5 to 9 Year Old | 135 (84.9%) | 24 (15.1%) |
| 10 to 14 Year Olds | 239 (70.5%) | 100 (29.5%) |
| 15 to 17 Year Olds | 278 (74.5%) | 95 (25.5%) |
| 18 to 19 Year Olds | 122 (80.8%) | 29 (19.2%) |
| 20 to 24 Year Olds | 191 (79.2%) | 50 (20.7%) |
| 25 to 34 Year Olds | 17 (27.0%) | 46 (73.0%) |
| 35 Years and over | 43 (48.9%) | 45 (51.1%) |
| Total | 1,025 (72.5%) | 389 (27.5%) |
Educational Attainment by Field of Study in Rio Pinar
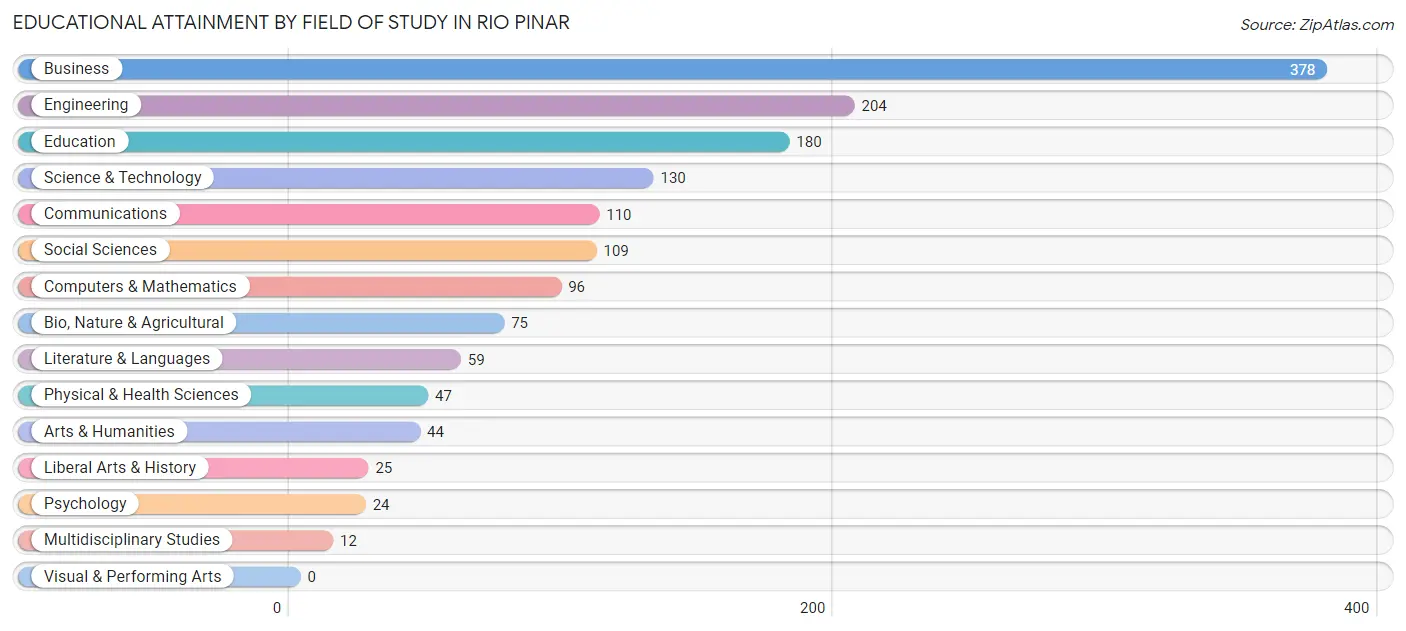
Business (378 | 25.3%), engineering (204 | 13.7%), education (180 | 12.1%), science & technology (130 | 8.7%), and communications (110 | 7.4%) are the most common fields of study among 1,493 individuals in Rio Pinar who have obtained a bachelor's degree or higher.
| Field of Study | # Graduates | % Graduates |
| Computers & Mathematics | 96 | 6.4% |
| Bio, Nature & Agricultural | 75 | 5.0% |
| Physical & Health Sciences | 47 | 3.2% |
| Psychology | 24 | 1.6% |
| Social Sciences | 109 | 7.3% |
| Engineering | 204 | 13.7% |
| Multidisciplinary Studies | 12 | 0.8% |
| Science & Technology | 130 | 8.7% |
| Business | 378 | 25.3% |
| Education | 180 | 12.1% |
| Literature & Languages | 59 | 4.0% |
| Liberal Arts & History | 25 | 1.7% |
| Visual & Performing Arts | 0 | 0.0% |
| Communications | 110 | 7.4% |
| Arts & Humanities | 44 | 2.9% |
| Total | 1,493 | 100.0% |
Transportation & Commute in Rio Pinar
Vehicle Availability by Sex in Rio Pinar
The most prevalent vehicle ownership categories in Rio Pinar are males with 2 vehicles (643, accounting for 43.7%) and females with 2 vehicles (575, making up 55.2%).
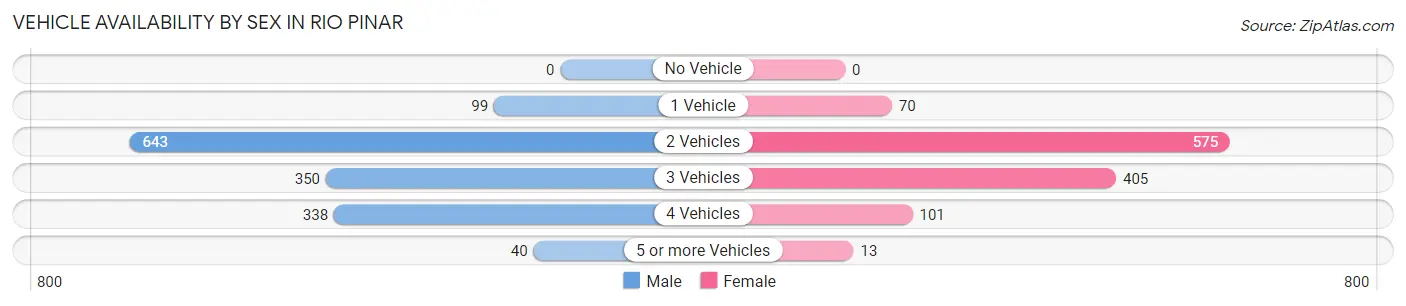
| Vehicles Available | Male | Female |
| No Vehicle | 0 (0.0%) | 0 (0.0%) |
| 1 Vehicle | 99 (6.7%) | 70 (6.0%) |
| 2 Vehicles | 643 (43.7%) | 575 (49.4%) |
| 3 Vehicles | 350 (23.8%) | 405 (34.8%) |
| 4 Vehicles | 338 (23.0%) | 101 (8.7%) |
| 5 or more Vehicles | 40 (2.7%) | 13 (1.1%) |
| Total | 1,470 (100.0%) | 1,164 (100.0%) |
Commute Time in Rio Pinar
The most frequently occuring commute durations in Rio Pinar are 20 to 24 minutes (548 commuters, 22.8%), 15 to 19 minutes (410 commuters, 17.1%), and 30 to 34 minutes (406 commuters, 16.9%).
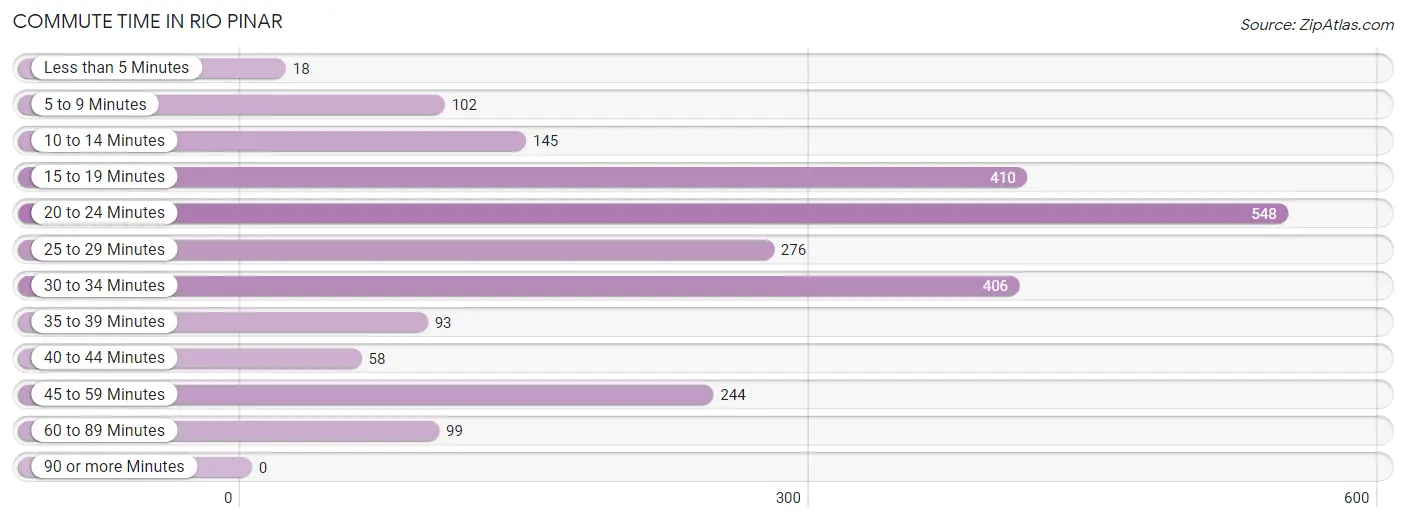
| Commute Time | # Commuters | % Commuters |
| Less than 5 Minutes | 18 | 0.7% |
| 5 to 9 Minutes | 102 | 4.3% |
| 10 to 14 Minutes | 145 | 6.0% |
| 15 to 19 Minutes | 410 | 17.1% |
| 20 to 24 Minutes | 548 | 22.8% |
| 25 to 29 Minutes | 276 | 11.5% |
| 30 to 34 Minutes | 406 | 16.9% |
| 35 to 39 Minutes | 93 | 3.9% |
| 40 to 44 Minutes | 58 | 2.4% |
| 45 to 59 Minutes | 244 | 10.2% |
| 60 to 89 Minutes | 99 | 4.1% |
| 90 or more Minutes | 0 | 0.0% |
Commute Time by Sex in Rio Pinar
The most common commute times in Rio Pinar are 20 to 24 minutes (334 commuters, 25.2%) for males and 15 to 19 minutes (251 commuters, 23.4%) for females.
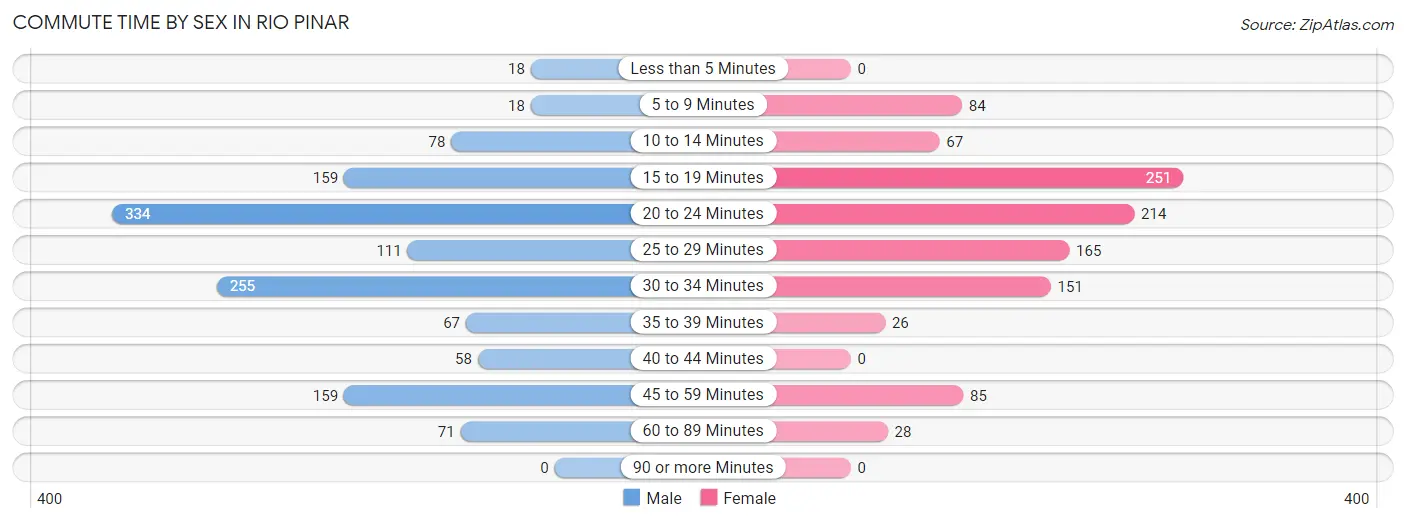
| Commute Time | Male | Female |
| Less than 5 Minutes | 18 (1.4%) | 0 (0.0%) |
| 5 to 9 Minutes | 18 (1.4%) | 84 (7.8%) |
| 10 to 14 Minutes | 78 (5.9%) | 67 (6.3%) |
| 15 to 19 Minutes | 159 (12.0%) | 251 (23.4%) |
| 20 to 24 Minutes | 334 (25.2%) | 214 (20.0%) |
| 25 to 29 Minutes | 111 (8.4%) | 165 (15.4%) |
| 30 to 34 Minutes | 255 (19.2%) | 151 (14.1%) |
| 35 to 39 Minutes | 67 (5.1%) | 26 (2.4%) |
| 40 to 44 Minutes | 58 (4.4%) | 0 (0.0%) |
| 45 to 59 Minutes | 159 (12.0%) | 85 (7.9%) |
| 60 to 89 Minutes | 71 (5.3%) | 28 (2.6%) |
| 90 or more Minutes | 0 (0.0%) | 0 (0.0%) |
Time of Departure to Work by Sex in Rio Pinar
The most frequent times of departure to work in Rio Pinar are 7:00 AM to 7:29 AM (231, 17.4%) for males and 8:00 AM to 8:29 AM (271, 25.3%) for females.
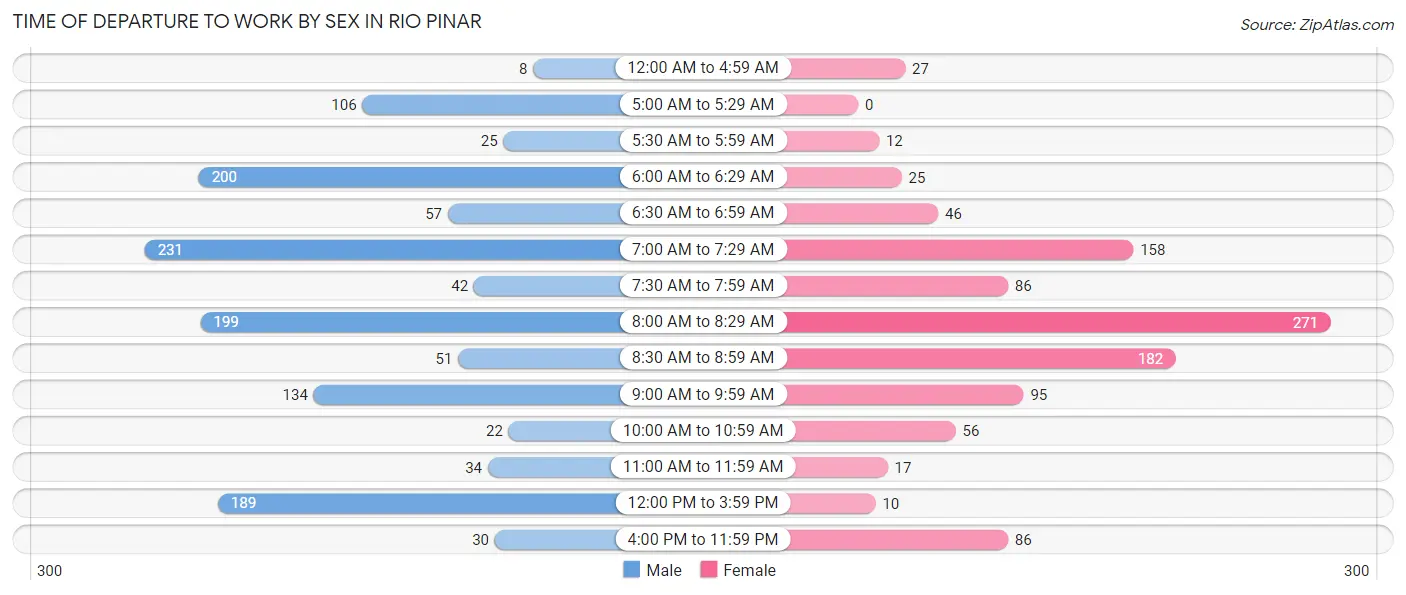
| Time of Departure | Male | Female |
| 12:00 AM to 4:59 AM | 8 (0.6%) | 27 (2.5%) |
| 5:00 AM to 5:29 AM | 106 (8.0%) | 0 (0.0%) |
| 5:30 AM to 5:59 AM | 25 (1.9%) | 12 (1.1%) |
| 6:00 AM to 6:29 AM | 200 (15.1%) | 25 (2.3%) |
| 6:30 AM to 6:59 AM | 57 (4.3%) | 46 (4.3%) |
| 7:00 AM to 7:29 AM | 231 (17.4%) | 158 (14.7%) |
| 7:30 AM to 7:59 AM | 42 (3.2%) | 86 (8.0%) |
| 8:00 AM to 8:29 AM | 199 (15.0%) | 271 (25.3%) |
| 8:30 AM to 8:59 AM | 51 (3.8%) | 182 (17.0%) |
| 9:00 AM to 9:59 AM | 134 (10.1%) | 95 (8.9%) |
| 10:00 AM to 10:59 AM | 22 (1.7%) | 56 (5.2%) |
| 11:00 AM to 11:59 AM | 34 (2.6%) | 17 (1.6%) |
| 12:00 PM to 3:59 PM | 189 (14.2%) | 10 (0.9%) |
| 4:00 PM to 11:59 PM | 30 (2.3%) | 86 (8.0%) |
| Total | 1,328 (100.0%) | 1,071 (100.0%) |
Housing Occupancy in Rio Pinar
Occupancy by Ownership in Rio Pinar
Of the total 1,747 dwellings in Rio Pinar, owner-occupied units account for 1,514 (86.7%), while renter-occupied units make up 233 (13.3%).
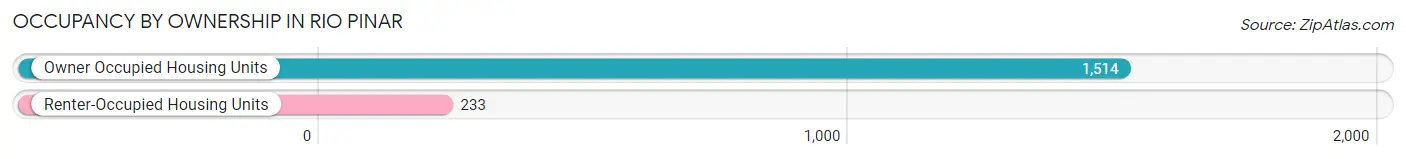
| Occupancy | # Housing Units | % Housing Units |
| Owner Occupied Housing Units | 1,514 | 86.7% |
| Renter-Occupied Housing Units | 233 | 13.3% |
| Total Occupied Housing Units | 1,747 | 100.0% |
Occupancy by Household Size in Rio Pinar
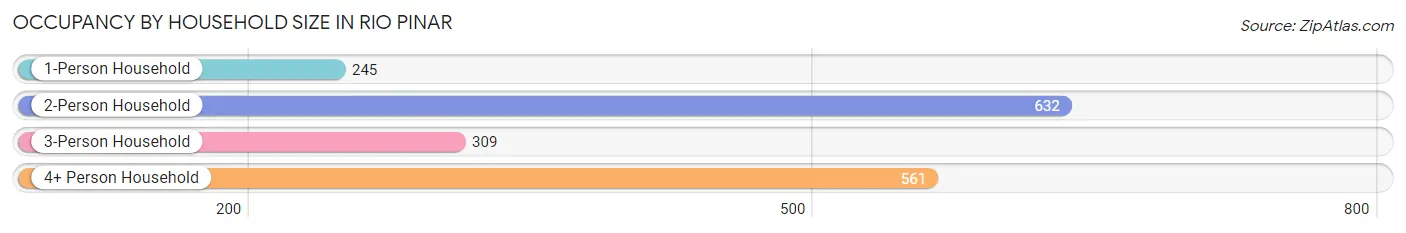
| Household Size | # Housing Units | % Housing Units |
| 1-Person Household | 245 | 14.0% |
| 2-Person Household | 632 | 36.2% |
| 3-Person Household | 309 | 17.7% |
| 4+ Person Household | 561 | 32.1% |
| Total Housing Units | 1,747 | 100.0% |
Occupancy by Ownership by Household Size in Rio Pinar
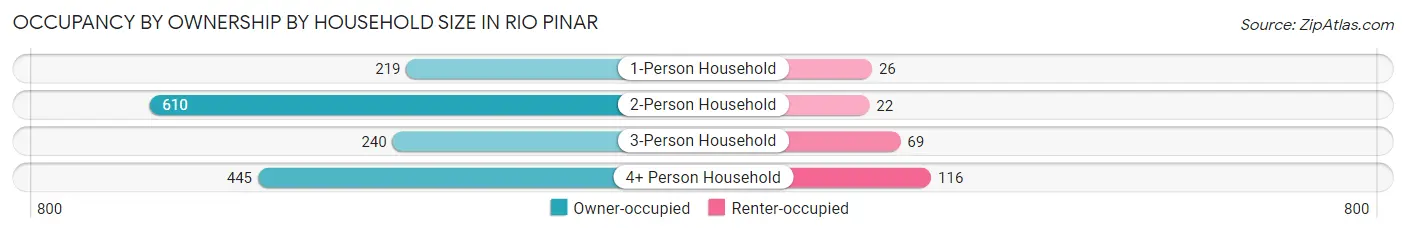
| Household Size | Owner-occupied | Renter-occupied |
| 1-Person Household | 219 (89.4%) | 26 (10.6%) |
| 2-Person Household | 610 (96.5%) | 22 (3.5%) |
| 3-Person Household | 240 (77.7%) | 69 (22.3%) |
| 4+ Person Household | 445 (79.3%) | 116 (20.7%) |
| Total Housing Units | 1,514 (86.7%) | 233 (13.3%) |
Occupancy by Educational Attainment in Rio Pinar
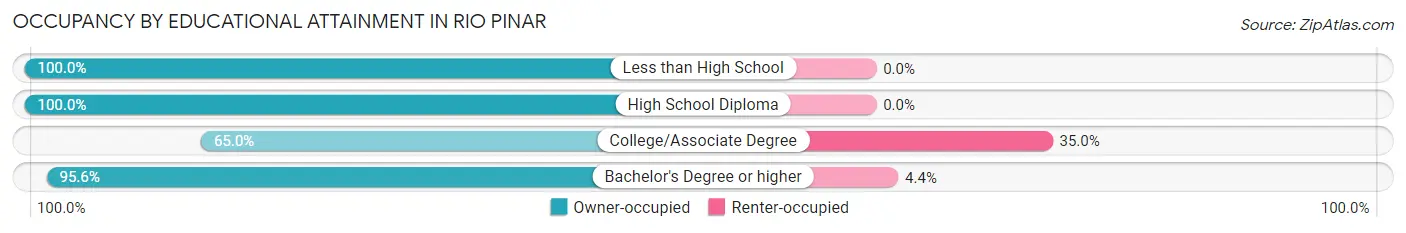
| Household Size | Owner-occupied | Renter-occupied |
| Less than High School | 153 (100.0%) | 0 (0.0%) |
| High School Diploma | 265 (100.0%) | 0 (0.0%) |
| College/Associate Degree | 372 (65.0%) | 200 (35.0%) |
| Bachelor's Degree or higher | 724 (95.6%) | 33 (4.4%) |
Occupancy by Age of Householder in Rio Pinar
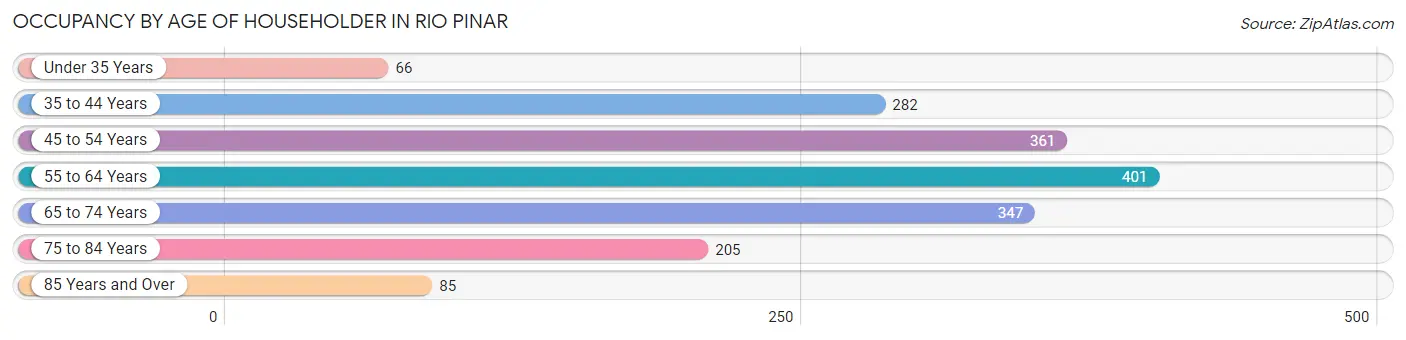
| Age Bracket | # Households | % Households |
| Under 35 Years | 66 | 3.8% |
| 35 to 44 Years | 282 | 16.1% |
| 45 to 54 Years | 361 | 20.7% |
| 55 to 64 Years | 401 | 23.0% |
| 65 to 74 Years | 347 | 19.9% |
| 75 to 84 Years | 205 | 11.7% |
| 85 Years and Over | 85 | 4.9% |
| Total | 1,747 | 100.0% |
Housing Finances in Rio Pinar
Median Income by Occupancy in Rio Pinar
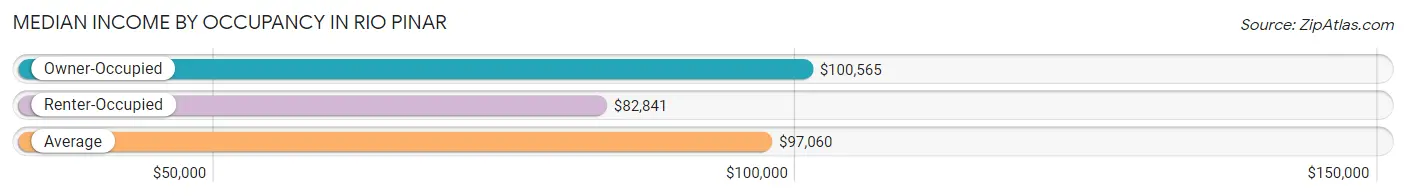
| Occupancy Type | # Households | Median Income |
| Owner-Occupied | 1,514 (86.7%) | $100,565 |
| Renter-Occupied | 233 (13.3%) | $82,841 |
| Average | 1,747 (100.0%) | $97,060 |
Occupancy by Householder Income Bracket in Rio Pinar
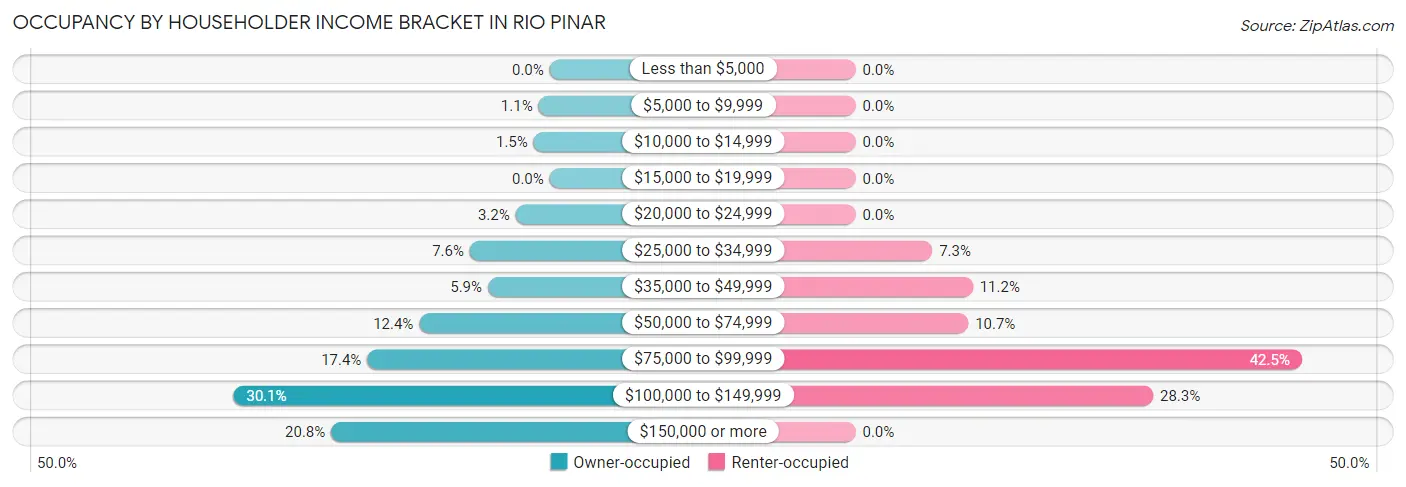
| Income Bracket | Owner-occupied | Renter-occupied |
| Less than $5,000 | 0 (0.0%) | 0 (0.0%) |
| $5,000 to $9,999 | 16 (1.1%) | 0 (0.0%) |
| $10,000 to $14,999 | 23 (1.5%) | 0 (0.0%) |
| $15,000 to $19,999 | 0 (0.0%) | 0 (0.0%) |
| $20,000 to $24,999 | 49 (3.2%) | 0 (0.0%) |
| $25,000 to $34,999 | 115 (7.6%) | 17 (7.3%) |
| $35,000 to $49,999 | 89 (5.9%) | 26 (11.2%) |
| $50,000 to $74,999 | 188 (12.4%) | 25 (10.7%) |
| $75,000 to $99,999 | 263 (17.4%) | 99 (42.5%) |
| $100,000 to $149,999 | 456 (30.1%) | 66 (28.3%) |
| $150,000 or more | 315 (20.8%) | 0 (0.0%) |
| Total | 1,514 (100.0%) | 233 (100.0%) |
Monthly Housing Cost Tiers in Rio Pinar
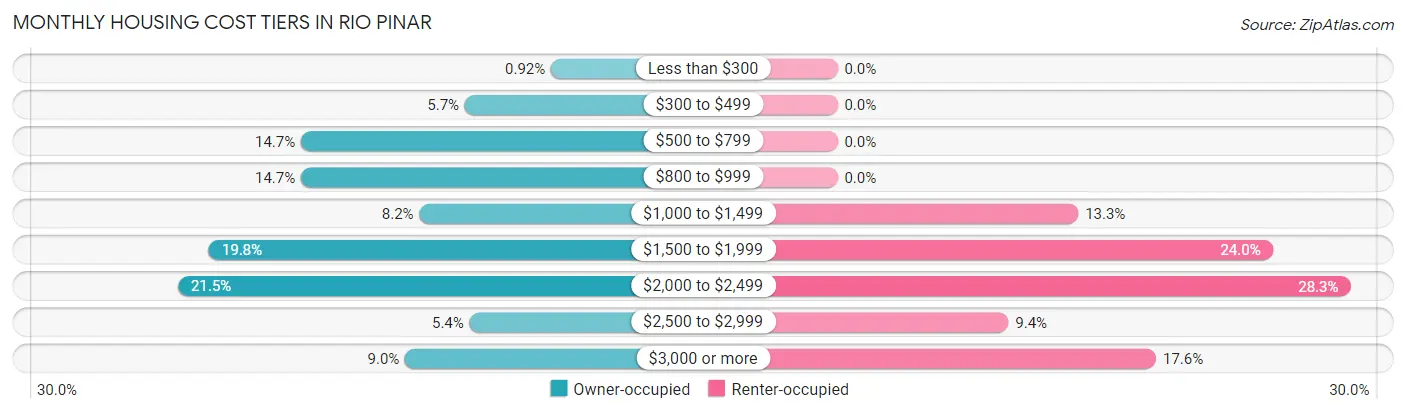
| Monthly Cost | Owner-occupied | Renter-occupied |
| Less than $300 | 14 (0.9%) | 0 (0.0%) |
| $300 to $499 | 86 (5.7%) | 0 (0.0%) |
| $500 to $799 | 223 (14.7%) | 0 (0.0%) |
| $800 to $999 | 223 (14.7%) | 0 (0.0%) |
| $1,000 to $1,499 | 124 (8.2%) | 31 (13.3%) |
| $1,500 to $1,999 | 300 (19.8%) | 56 (24.0%) |
| $2,000 to $2,499 | 326 (21.5%) | 66 (28.3%) |
| $2,500 to $2,999 | 82 (5.4%) | 22 (9.4%) |
| $3,000 or more | 136 (9.0%) | 41 (17.6%) |
| Total | 1,514 (100.0%) | 233 (100.0%) |
Physical Housing Characteristics in Rio Pinar
Housing Structures in Rio Pinar
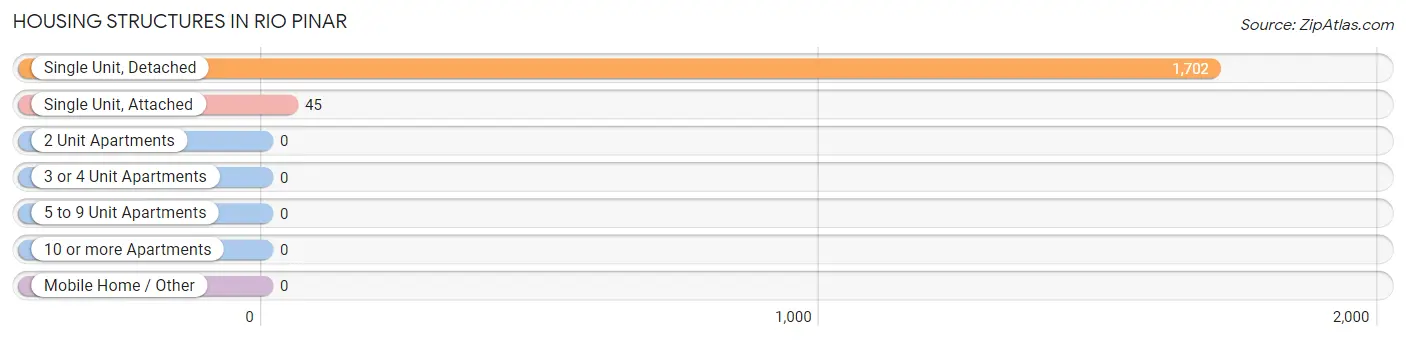
| Structure Type | # Housing Units | % Housing Units |
| Single Unit, Detached | 1,702 | 97.4% |
| Single Unit, Attached | 45 | 2.6% |
| 2 Unit Apartments | 0 | 0.0% |
| 3 or 4 Unit Apartments | 0 | 0.0% |
| 5 to 9 Unit Apartments | 0 | 0.0% |
| 10 or more Apartments | 0 | 0.0% |
| Mobile Home / Other | 0 | 0.0% |
| Total | 1,747 | 100.0% |
Housing Structures by Occupancy in Rio Pinar
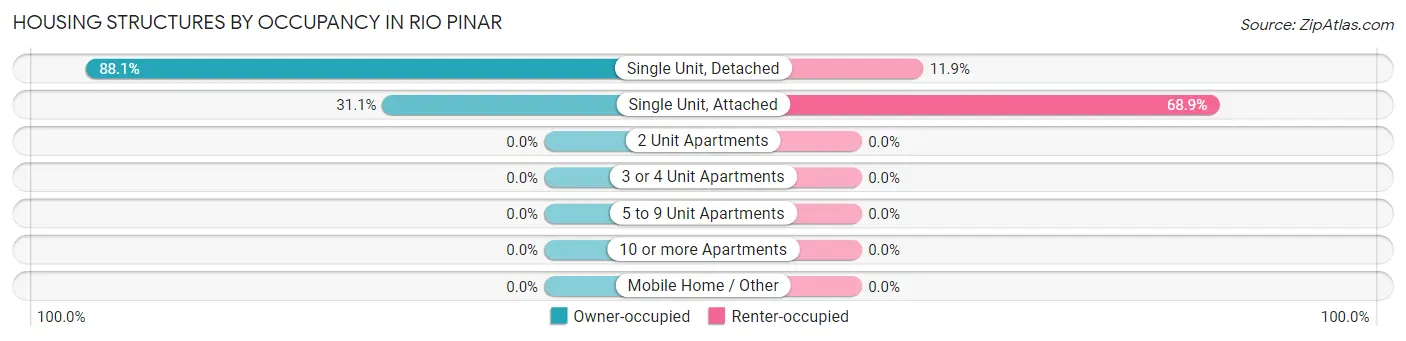
| Structure Type | Owner-occupied | Renter-occupied |
| Single Unit, Detached | 1,500 (88.1%) | 202 (11.9%) |
| Single Unit, Attached | 14 (31.1%) | 31 (68.9%) |
| 2 Unit Apartments | 0 (0.0%) | 0 (0.0%) |
| 3 or 4 Unit Apartments | 0 (0.0%) | 0 (0.0%) |
| 5 to 9 Unit Apartments | 0 (0.0%) | 0 (0.0%) |
| 10 or more Apartments | 0 (0.0%) | 0 (0.0%) |
| Mobile Home / Other | 0 (0.0%) | 0 (0.0%) |
| Total | 1,514 (86.7%) | 233 (13.3%) |
Housing Structures by Number of Rooms in Rio Pinar
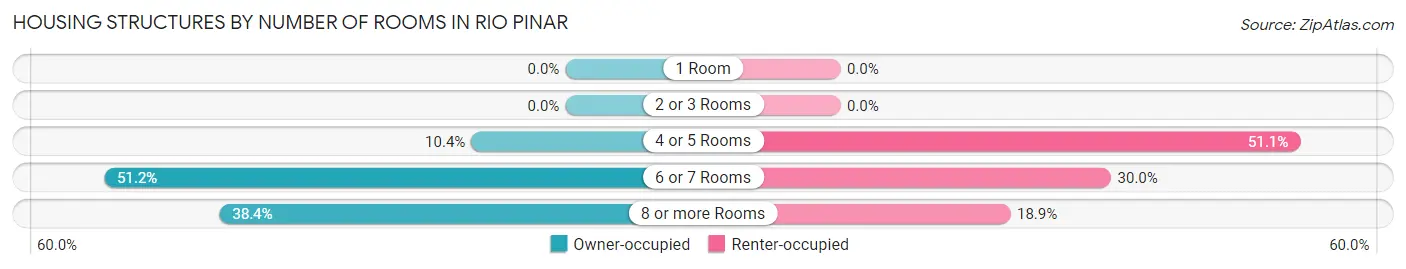
| Number of Rooms | Owner-occupied | Renter-occupied |
| 1 Room | 0 (0.0%) | 0 (0.0%) |
| 2 or 3 Rooms | 0 (0.0%) | 0 (0.0%) |
| 4 or 5 Rooms | 158 (10.4%) | 119 (51.1%) |
| 6 or 7 Rooms | 775 (51.2%) | 70 (30.0%) |
| 8 or more Rooms | 581 (38.4%) | 44 (18.9%) |
| Total | 1,514 (100.0%) | 233 (100.0%) |
Housing Structure by Heating Type in Rio Pinar
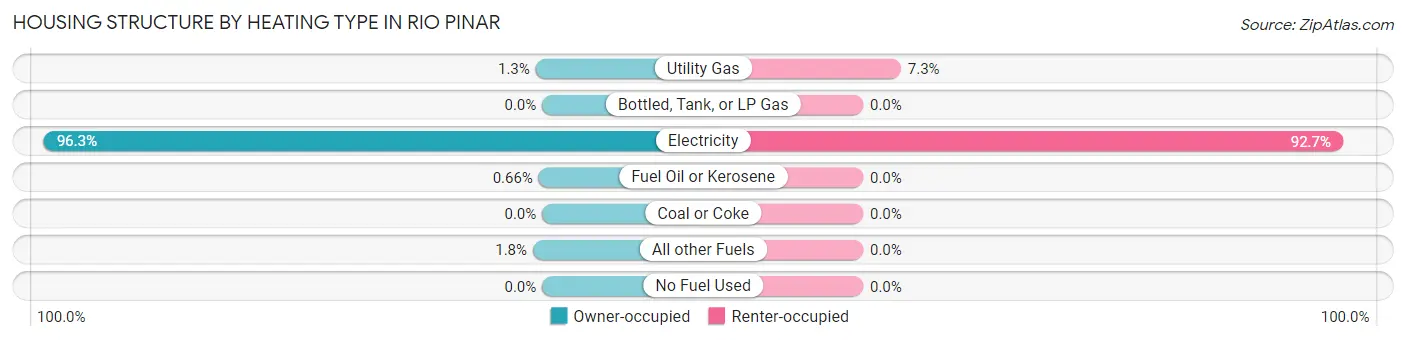
| Heating Type | Owner-occupied | Renter-occupied |
| Utility Gas | 19 (1.3%) | 17 (7.3%) |
| Bottled, Tank, or LP Gas | 0 (0.0%) | 0 (0.0%) |
| Electricity | 1,458 (96.3%) | 216 (92.7%) |
| Fuel Oil or Kerosene | 10 (0.7%) | 0 (0.0%) |
| Coal or Coke | 0 (0.0%) | 0 (0.0%) |
| All other Fuels | 27 (1.8%) | 0 (0.0%) |
| No Fuel Used | 0 (0.0%) | 0 (0.0%) |
| Total | 1,514 (100.0%) | 233 (100.0%) |
Household Vehicle Usage in Rio Pinar
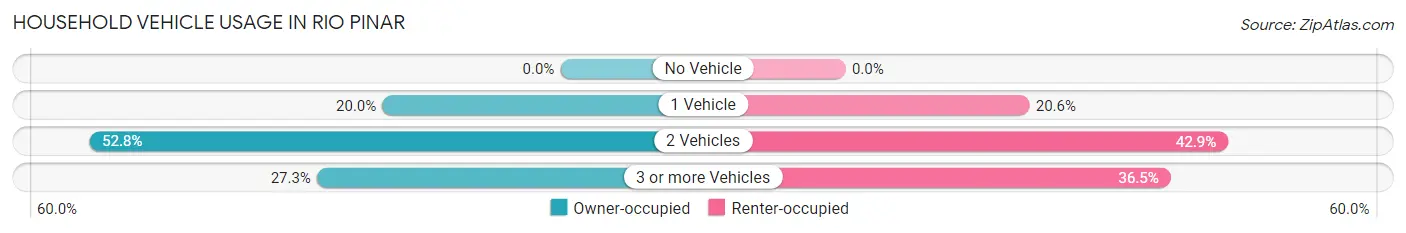
| Vehicles per Household | Owner-occupied | Renter-occupied |
| No Vehicle | 0 (0.0%) | 0 (0.0%) |
| 1 Vehicle | 302 (20.0%) | 48 (20.6%) |
| 2 Vehicles | 799 (52.8%) | 100 (42.9%) |
| 3 or more Vehicles | 413 (27.3%) | 85 (36.5%) |
| Total | 1,514 (100.0%) | 233 (100.0%) |
Real Estate & Mortgages in Rio Pinar
Real Estate and Mortgage Overview in Rio Pinar
| Characteristic | Without Mortgage | With Mortgage |
| Housing Units | 487 | 1,027 |
| Median Property Value | $329,900 | $377,900 |
| Median Household Income | $75,982 | $269 |
| Monthly Housing Costs | $656 | $136 |
| Real Estate Taxes | $2,502 | $9 |
Property Value by Mortgage Status in Rio Pinar
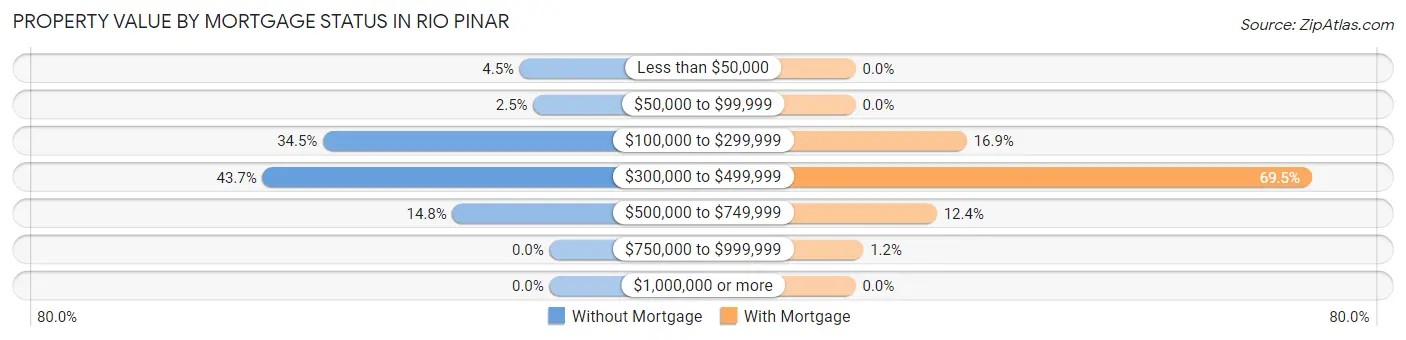
| Property Value | Without Mortgage | With Mortgage |
| Less than $50,000 | 22 (4.5%) | 0 (0.0%) |
| $50,000 to $99,999 | 12 (2.5%) | 0 (0.0%) |
| $100,000 to $299,999 | 168 (34.5%) | 174 (16.9%) |
| $300,000 to $499,999 | 213 (43.7%) | 714 (69.5%) |
| $500,000 to $749,999 | 72 (14.8%) | 127 (12.4%) |
| $750,000 to $999,999 | 0 (0.0%) | 12 (1.2%) |
| $1,000,000 or more | 0 (0.0%) | 0 (0.0%) |
| Total | 487 (100.0%) | 1,027 (100.0%) |
Household Income by Mortgage Status in Rio Pinar
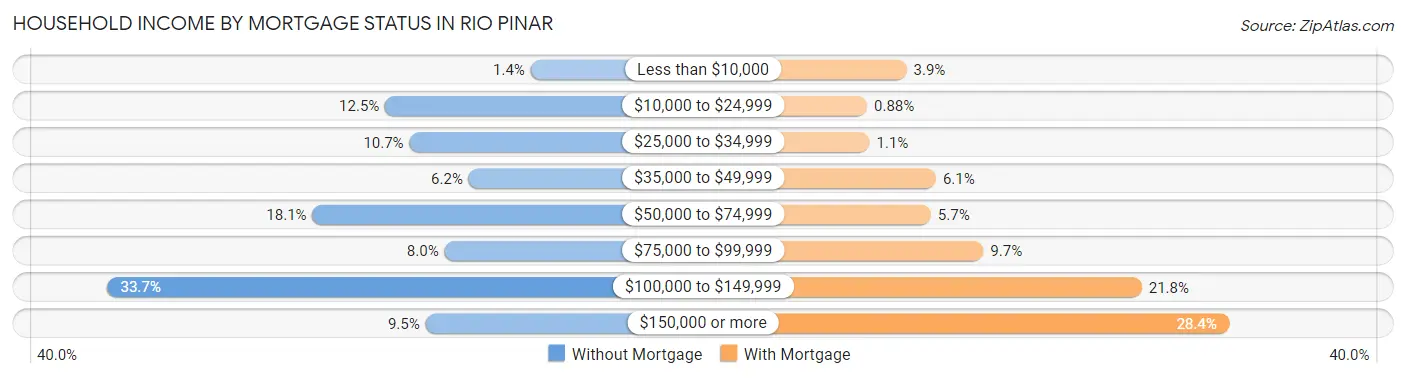
| Household Income | Without Mortgage | With Mortgage |
| Less than $10,000 | 7 (1.4%) | 40 (3.9%) |
| $10,000 to $24,999 | 61 (12.5%) | 9 (0.9%) |
| $25,000 to $34,999 | 52 (10.7%) | 11 (1.1%) |
| $35,000 to $49,999 | 30 (6.2%) | 63 (6.1%) |
| $50,000 to $74,999 | 88 (18.1%) | 59 (5.7%) |
| $75,000 to $99,999 | 39 (8.0%) | 100 (9.7%) |
| $100,000 to $149,999 | 164 (33.7%) | 224 (21.8%) |
| $150,000 or more | 46 (9.5%) | 292 (28.4%) |
| Total | 487 (100.0%) | 1,027 (100.0%) |
Property Value to Household Income Ratio in Rio Pinar
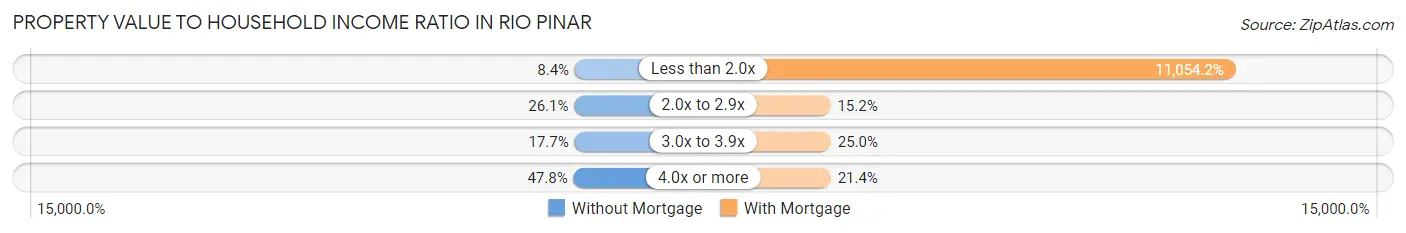
| Value-to-Income Ratio | Without Mortgage | With Mortgage |
| Less than 2.0x | 41 (8.4%) | 113,527 (11,054.2%) |
| 2.0x to 2.9x | 127 (26.1%) | 156 (15.2%) |
| 3.0x to 3.9x | 86 (17.7%) | 257 (25.0%) |
| 4.0x or more | 233 (47.8%) | 220 (21.4%) |
| Total | 487 (100.0%) | 1,027 (100.0%) |
Real Estate Taxes by Mortgage Status in Rio Pinar

| Property Taxes | Without Mortgage | With Mortgage |
| Less than $800 | 13 (2.7%) | 0 (0.0%) |
| $800 to $1,499 | 65 (13.4%) | 0 (0.0%) |
| $800 to $1,499 | 409 (84.0%) | 36 (3.5%) |
| Total | 487 (100.0%) | 1,027 (100.0%) |
Health & Disability in Rio Pinar
Health Insurance Coverage by Age in Rio Pinar
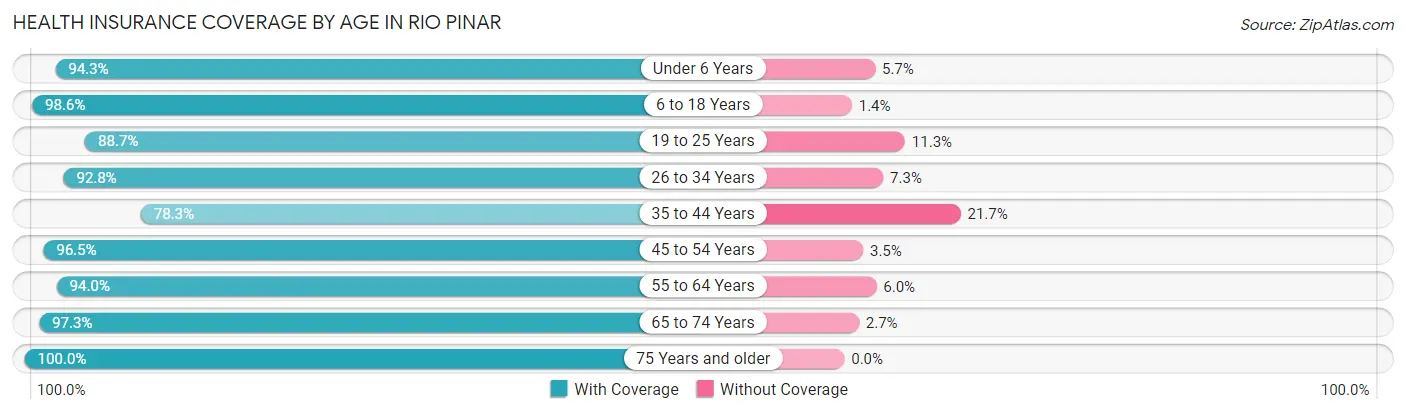
| Age Bracket | With Coverage | Without Coverage |
| Under 6 Years | 214 (94.3%) | 13 (5.7%) |
| 6 to 18 Years | 989 (98.6%) | 14 (1.4%) |
| 19 to 25 Years | 526 (88.7%) | 67 (11.3%) |
| 26 to 34 Years | 243 (92.7%) | 19 (7.2%) |
| 35 to 44 Years | 589 (78.3%) | 163 (21.7%) |
| 45 to 54 Years | 799 (96.5%) | 29 (3.5%) |
| 55 to 64 Years | 740 (94.0%) | 47 (6.0%) |
| 65 to 74 Years | 681 (97.3%) | 19 (2.7%) |
| 75 Years and older | 511 (100.0%) | 0 (0.0%) |
| Total | 5,292 (93.4%) | 371 (6.6%) |
Health Insurance Coverage by Citizenship Status in Rio Pinar

| Citizenship Status | With Coverage | Without Coverage |
| Native Born | 214 (94.3%) | 13 (5.7%) |
| Foreign Born, Citizen | 989 (98.6%) | 14 (1.4%) |
| Foreign Born, not a Citizen | 526 (88.7%) | 67 (11.3%) |
Health Insurance Coverage by Household Income in Rio Pinar
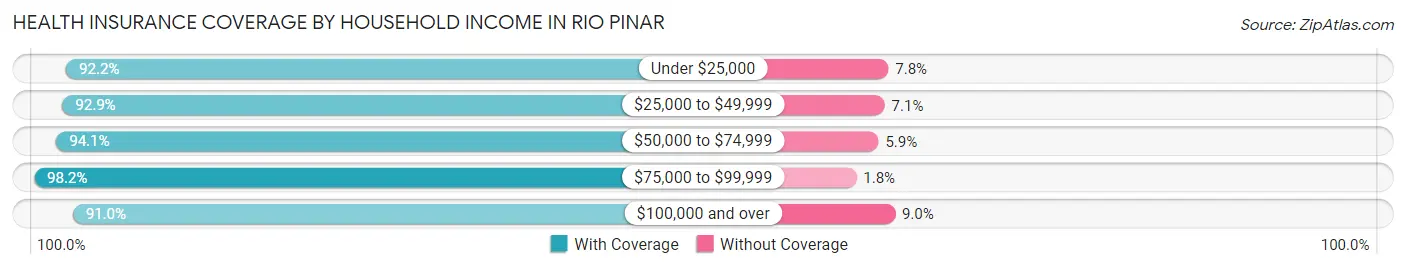
| Household Income | With Coverage | Without Coverage |
| Under $25,000 | 142 (92.2%) | 12 (7.8%) |
| $25,000 to $49,999 | 537 (92.9%) | 41 (7.1%) |
| $50,000 to $74,999 | 475 (94.1%) | 30 (5.9%) |
| $75,000 to $99,999 | 1,540 (98.2%) | 28 (1.8%) |
| $100,000 and over | 2,598 (91.0%) | 258 (9.0%) |
Public vs Private Health Insurance Coverage by Age in Rio Pinar
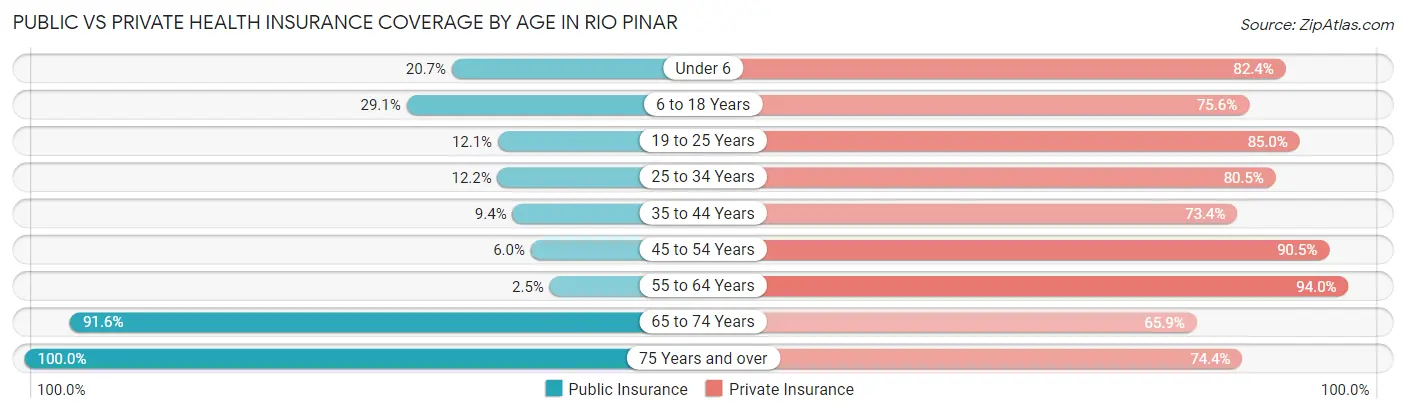
| Age Bracket | Public Insurance | Private Insurance |
| Under 6 | 47 (20.7%) | 187 (82.4%) |
| 6 to 18 Years | 292 (29.1%) | 758 (75.6%) |
| 19 to 25 Years | 72 (12.1%) | 504 (85.0%) |
| 25 to 34 Years | 32 (12.2%) | 211 (80.5%) |
| 35 to 44 Years | 71 (9.4%) | 552 (73.4%) |
| 45 to 54 Years | 50 (6.0%) | 749 (90.5%) |
| 55 to 64 Years | 20 (2.5%) | 740 (94.0%) |
| 65 to 74 Years | 641 (91.6%) | 461 (65.9%) |
| 75 Years and over | 511 (100.0%) | 380 (74.4%) |
| Total | 1,736 (30.7%) | 4,542 (80.2%) |
Disability Status by Sex by Age in Rio Pinar
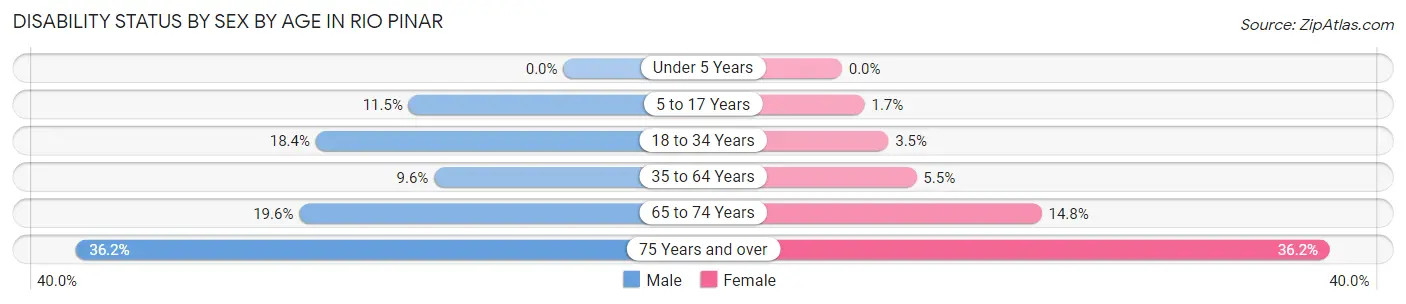
| Age Bracket | Male | Female |
| Under 5 Years | 0 (0.0%) | 0 (0.0%) |
| 5 to 17 Years | 55 (11.5%) | 7 (1.7%) |
| 18 to 34 Years | 95 (18.4%) | 16 (3.5%) |
| 35 to 64 Years | 111 (9.6%) | 67 (5.5%) |
| 65 to 74 Years | 50 (19.6%) | 66 (14.8%) |
| 75 Years and over | 81 (36.2%) | 104 (36.2%) |
Disability Class by Sex by Age in Rio Pinar
Disability Class: Hearing Difficulty
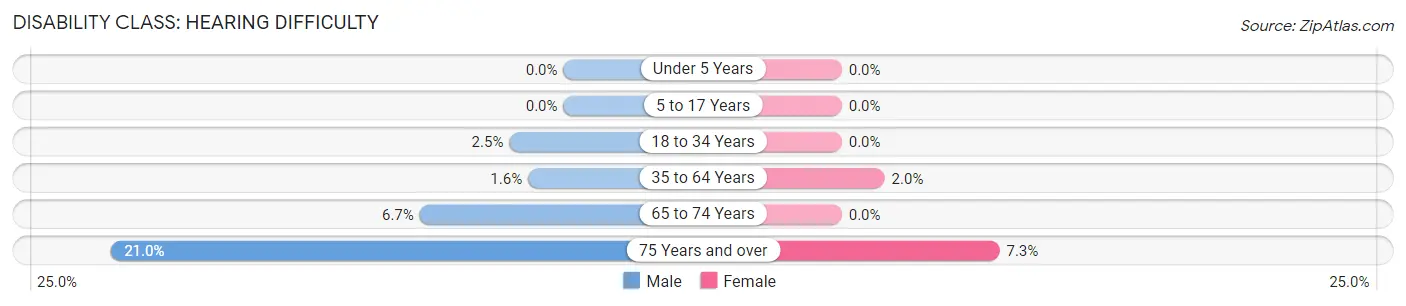
| Age Bracket | Male | Female |
| Under 5 Years | 0 (0.0%) | 0 (0.0%) |
| 5 to 17 Years | 0 (0.0%) | 0 (0.0%) |
| 18 to 34 Years | 13 (2.5%) | 0 (0.0%) |
| 35 to 64 Years | 19 (1.6%) | 24 (2.0%) |
| 65 to 74 Years | 17 (6.7%) | 0 (0.0%) |
| 75 Years and over | 47 (21.0%) | 21 (7.3%) |
Disability Class: Vision Difficulty
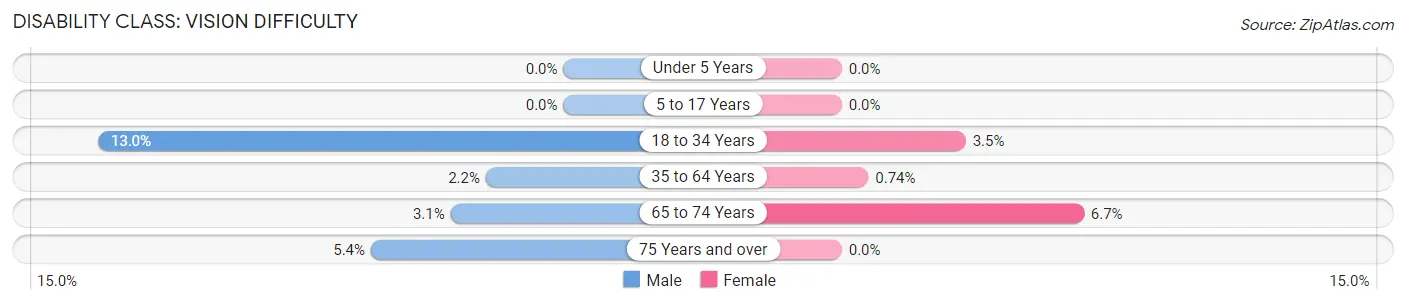
| Age Bracket | Male | Female |
| Under 5 Years | 0 (0.0%) | 0 (0.0%) |
| 5 to 17 Years | 0 (0.0%) | 0 (0.0%) |
| 18 to 34 Years | 67 (13.0%) | 16 (3.5%) |
| 35 to 64 Years | 25 (2.2%) | 9 (0.7%) |
| 65 to 74 Years | 8 (3.1%) | 30 (6.7%) |
| 75 Years and over | 12 (5.4%) | 0 (0.0%) |
Disability Class: Cognitive Difficulty
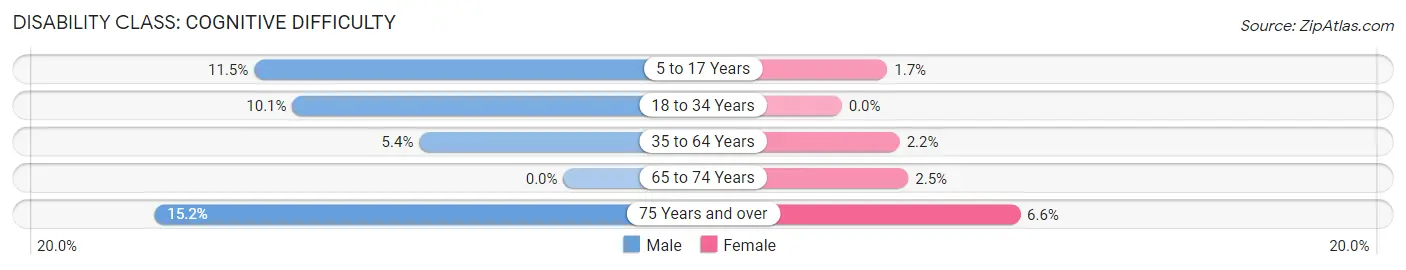
| Age Bracket | Male | Female |
| 5 to 17 Years | 55 (11.5%) | 7 (1.7%) |
| 18 to 34 Years | 52 (10.1%) | 0 (0.0%) |
| 35 to 64 Years | 62 (5.3%) | 26 (2.1%) |
| 65 to 74 Years | 0 (0.0%) | 11 (2.5%) |
| 75 Years and over | 34 (15.2%) | 19 (6.6%) |
Disability Class: Ambulatory Difficulty
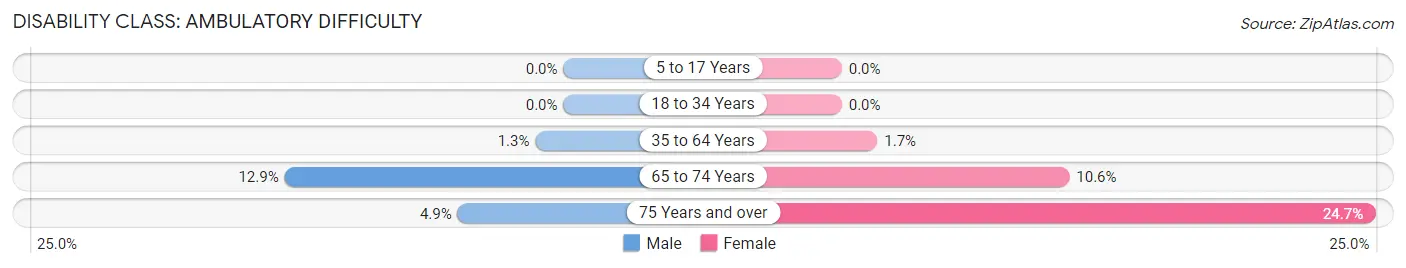
| Age Bracket | Male | Female |
| 5 to 17 Years | 0 (0.0%) | 0 (0.0%) |
| 18 to 34 Years | 0 (0.0%) | 0 (0.0%) |
| 35 to 64 Years | 15 (1.3%) | 20 (1.7%) |
| 65 to 74 Years | 33 (12.9%) | 47 (10.6%) |
| 75 Years and over | 11 (4.9%) | 71 (24.7%) |
Disability Class: Self-Care Difficulty
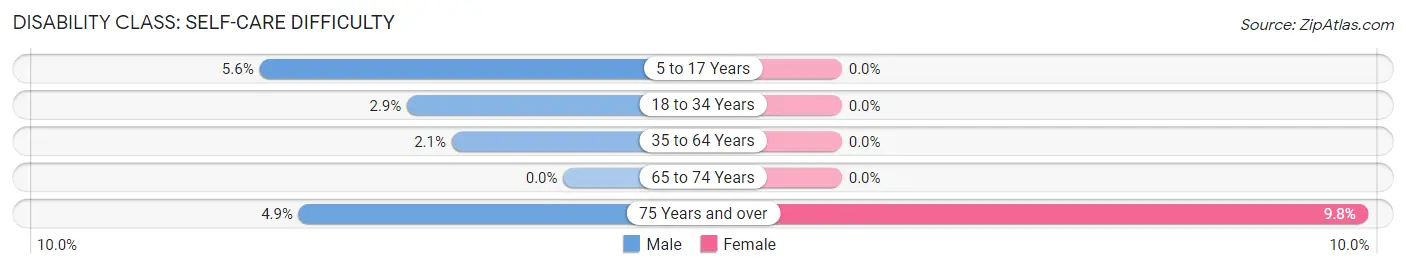
| Age Bracket | Male | Female |
| 5 to 17 Years | 27 (5.6%) | 0 (0.0%) |
| 18 to 34 Years | 15 (2.9%) | 0 (0.0%) |
| 35 to 64 Years | 24 (2.1%) | 0 (0.0%) |
| 65 to 74 Years | 0 (0.0%) | 0 (0.0%) |
| 75 Years and over | 11 (4.9%) | 28 (9.8%) |
Technology Access in Rio Pinar
Computing Device Access in Rio Pinar
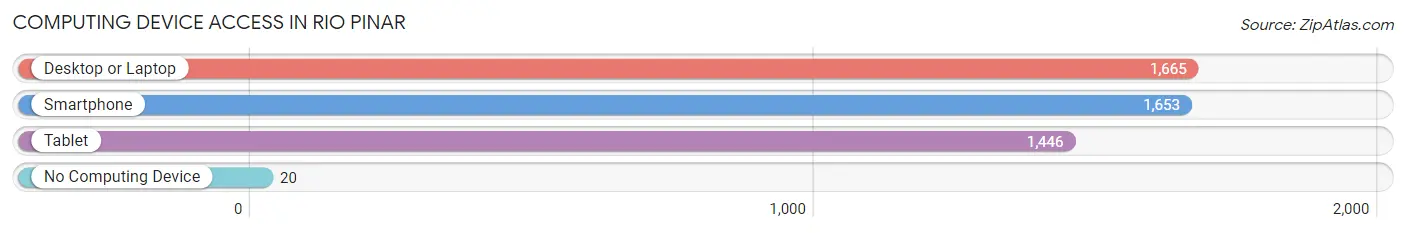
| Device Type | # Households | % Households |
| Desktop or Laptop | 1,665 | 95.3% |
| Smartphone | 1,653 | 94.6% |
| Tablet | 1,446 | 82.8% |
| No Computing Device | 20 | 1.1% |
| Total | 1,747 | 100.0% |
Internet Access in Rio Pinar
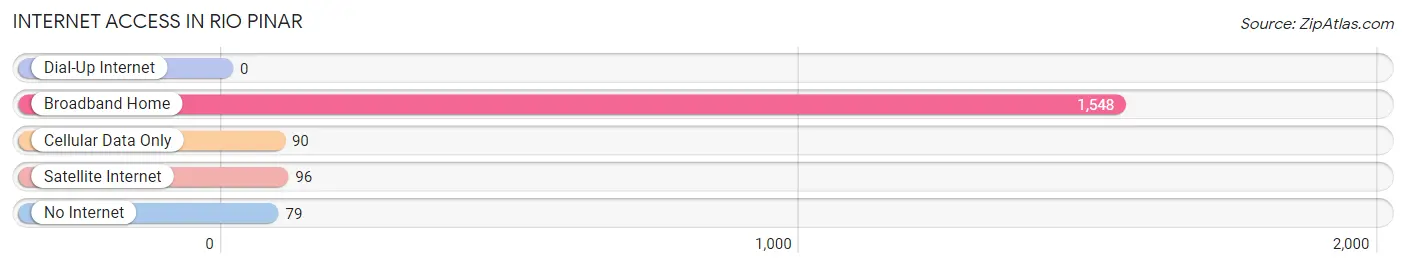
| Internet Type | # Households | % Households |
| Dial-Up Internet | 0 | 0.0% |
| Broadband Home | 1,548 | 88.6% |
| Cellular Data Only | 90 | 5.1% |
| Satellite Internet | 96 | 5.5% |
| No Internet | 79 | 4.5% |
| Total | 1,747 | 100.0% |
Rio Pinar Summary
Rio Pinar is a census-designated place (CDP) located in Orange County, Florida, United States. It is part of the Orlando–Kissimmee–Sanford Metropolitan Statistical Area. The population was 8,845 at the 2010 census.
History
Rio Pinar was originally part of the large tract of land known as the Rio Pinar Plantation, which was owned by the prominent Orlando family of the same name. The plantation was established in the late 19th century and was used for cattle ranching and citrus production. In the 1950s, the land was subdivided and developed into a residential community.
Geography
Rio Pinar is located at 28°33'25" North, 81°17'45" West (28.556944, -81.295833). According to the United States Census Bureau, the CDP has a total area of 4.2 square miles (10.8 km2), all land.
Economy
Rio Pinar is home to a variety of businesses, including retail stores, restaurants, and professional services. The area is also home to several medical facilities, including the Orlando Health Rio Pinar Medical Center.
Demographics
As of the census of 2000, there were 8,845 people, 3,717 households, and 2,541 families residing in the CDP. The population density was 2,097.3 people per square mile (809.7/km2). There were 3,945 housing units at an average density of 930.2/sq mi (358.7/km2). The racial makeup of the CDP was 87.2% White, 5.2% African American, 0.3% Native American, 2.7% Asian, 0.1% Pacific Islander, 2.2% from other races, and 2.3% from two or more races. Hispanic or Latino of any race were 8.7% of the population.
There were 3,717 households, out of which 28.2% had children under the age of 18 living with them, 54.2% were married couples living together, 10.3% had a female householder with no husband present, and 31.2% were non-families. 24.2% of all households were made up of individuals, and 8.2% had someone living alone who was 65 years of age or older. The average household size was 2.38 and the average family size was 2.83.
In the CDP, the population was spread out, with 21.2% under the age of 18, 6.2% from 18 to 24, 28.7% from 25 to 44, 27.2% from 45 to 64, and 16.7% who were 65 years of age or older. The median age was 41 years. For every 100 females, there were 93.2 males. For every 100 females age 18 and over, there were 90.2 males.
The median income for a household in the CDP was $50,945, and the median income for a family was $58,945. Males had a median income of $41,945 versus $30,945 for females. The per capita income for the CDP was $25,945. About 4.2% of families and 5.2% of the population were below the poverty line, including 6.2% of those under age 18 and 4.2% of those age 65 or over.
Common Questions
What is Per Capita Income in Rio Pinar?
Per Capita income in Rio Pinar is $36,904.
What is the Median Family Income in Rio Pinar?
Median Family Income in Rio Pinar is $95,476.
What is the Median Household income in Rio Pinar?
Median Household Income in Rio Pinar is $97,060.
What is Income or Wage Gap in Rio Pinar?
Income or Wage Gap in Rio Pinar is 29.7%.
Women in Rio Pinar earn 70.3 cents for every dollar earned by a man.
What is Inequality or Gini Index in Rio Pinar?
Inequality or Gini Index in Rio Pinar is 0.35.
What is the Total Population of Rio Pinar?
Total Population of Rio Pinar is 5,663.
What is the Total Male Population of Rio Pinar?
Total Male Population of Rio Pinar is 2,721.
What is the Total Female Population of Rio Pinar?
Total Female Population of Rio Pinar is 2,942.
What is the Ratio of Males per 100 Females in Rio Pinar?
There are 92.49 Males per 100 Females in Rio Pinar.
What is the Ratio of Females per 100 Males in Rio Pinar?
There are 108.12 Females per 100 Males in Rio Pinar.
What is the Median Population Age in Rio Pinar?
Median Population Age in Rio Pinar is 44.9 Years.
What is the Average Family Size in Rio Pinar
Average Family Size in Rio Pinar is 3.5 People.
What is the Average Household Size in Rio Pinar
Average Household Size in Rio Pinar is 3.2 People.
How Large is the Labor Force in Rio Pinar?
There are 2,843 People in the Labor Forcein in Rio Pinar.
What is the Percentage of People in the Labor Force in Rio Pinar?
58.7% of People are in the Labor Force in Rio Pinar.
What is the Unemployment Rate in Rio Pinar?
Unemployment Rate in Rio Pinar is 4.7%.