Sharpes, FL Map & Demographics
Sharpes Map
Sharpes Overview
$33,796
PER CAPITA INCOME
$68,625
AVG FAMILY INCOME
$64,777
AVG HOUSEHOLD INCOME
22.1%
WAGE / INCOME GAP [ % ]
77.9¢/ $1
WAGE / INCOME GAP [ $ ]
0.41
INEQUALITY / GINI INDEX
2,812
TOTAL POPULATION
1,367
MALE POPULATION
1,445
FEMALE POPULATION
94.60
MALES / 100 FEMALES
105.71
FEMALES / 100 MALES
51.5
MEDIAN AGE
3.0
AVG FAMILY SIZE
2.5
AVG HOUSEHOLD SIZE
1,469
LABOR FORCE [ PEOPLE ]
58.2%
PERCENT IN LABOR FORCE
5.6%
UNEMPLOYMENT RATE
Income in Sharpes
Income Overview in Sharpes
Per Capita Income in Sharpes is $33,796, while median incomes of families and households are $68,625 and $64,777 respectively.
| Characteristic | Number | Measure |
| Per Capita Income | 2,812 | $33,796 |
| Median Family Income | 657 | $68,625 |
| Mean Family Income | 657 | $85,621 |
| Median Household Income | 1,149 | $64,777 |
| Mean Household Income | 1,149 | $78,658 |
| Income Deficit | 657 | $0 |
| Wage / Income Gap (%) | 2,812 | 22.06% |
| Wage / Income Gap ($) | 2,812 | 77.94¢ per $1 |
| Gini / Inequality Index | 2,812 | 0.41 |
Earnings by Sex in Sharpes
Average Earnings in Sharpes are $33,387, $39,583 for men and $30,850 for women, a difference of 22.1%.
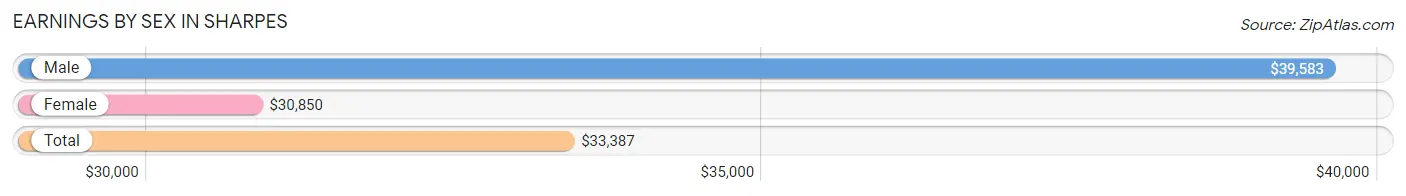
| Sex | Number | Average Earnings |
| Male | 796 (53.3%) | $39,583 |
| Female | 697 (46.7%) | $30,850 |
| Total | 1,493 (100.0%) | $33,387 |
Earnings by Sex by Income Bracket in Sharpes
The most common earnings brackets in Sharpes are $100,000+ for men (113 | 14.2%) and $30,000 to $34,999 for women (85 | 12.2%).
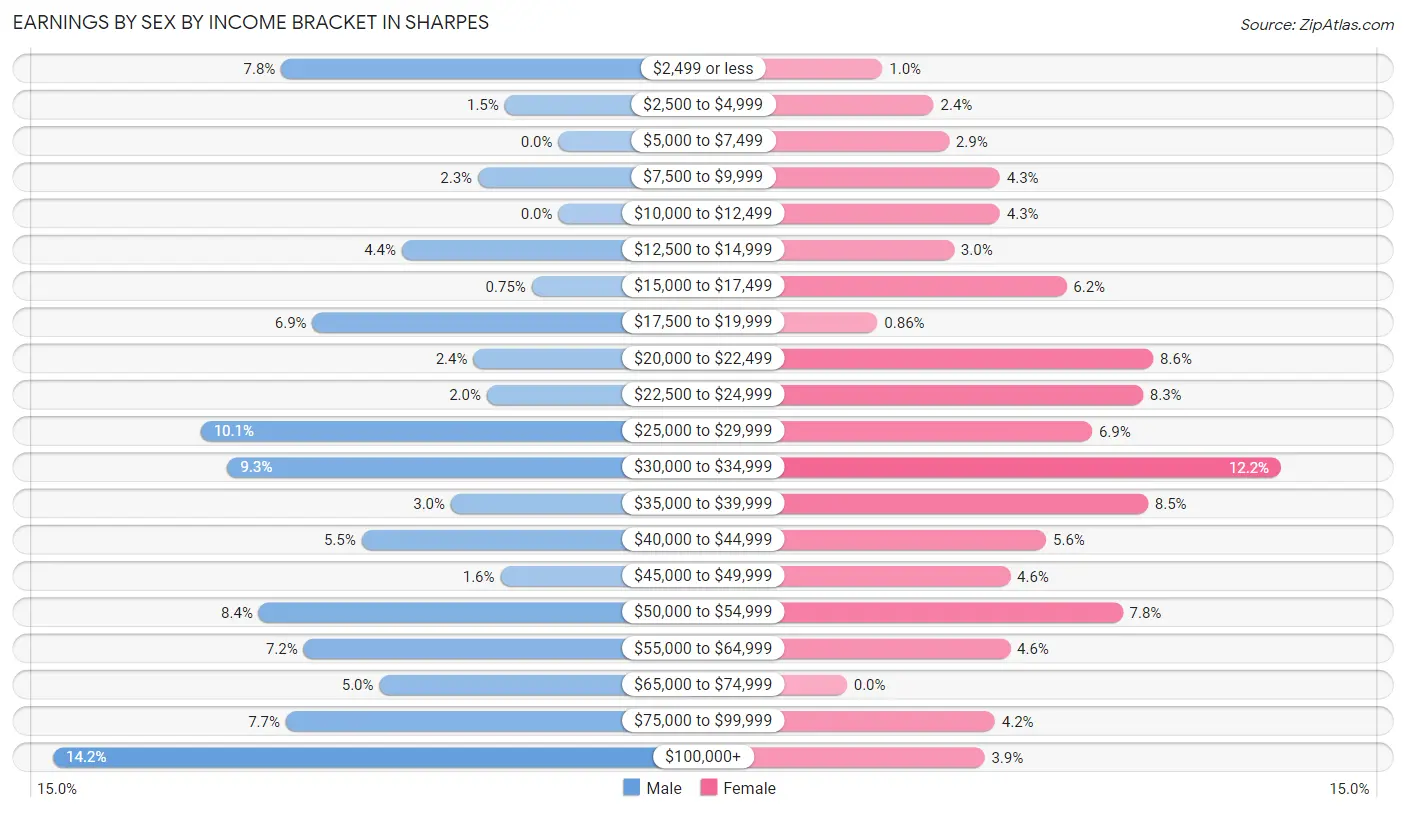
| Income | Male | Female |
| $2,499 or less | 62 (7.8%) | 7 (1.0%) |
| $2,500 to $4,999 | 12 (1.5%) | 17 (2.4%) |
| $5,000 to $7,499 | 0 (0.0%) | 20 (2.9%) |
| $7,500 to $9,999 | 18 (2.3%) | 30 (4.3%) |
| $10,000 to $12,499 | 0 (0.0%) | 30 (4.3%) |
| $12,500 to $14,999 | 35 (4.4%) | 21 (3.0%) |
| $15,000 to $17,499 | 6 (0.7%) | 43 (6.2%) |
| $17,500 to $19,999 | 55 (6.9%) | 6 (0.9%) |
| $20,000 to $22,499 | 19 (2.4%) | 60 (8.6%) |
| $22,500 to $24,999 | 16 (2.0%) | 58 (8.3%) |
| $25,000 to $29,999 | 80 (10.1%) | 48 (6.9%) |
| $30,000 to $34,999 | 74 (9.3%) | 85 (12.2%) |
| $35,000 to $39,999 | 24 (3.0%) | 59 (8.5%) |
| $40,000 to $44,999 | 44 (5.5%) | 39 (5.6%) |
| $45,000 to $49,999 | 13 (1.6%) | 32 (4.6%) |
| $50,000 to $54,999 | 67 (8.4%) | 54 (7.7%) |
| $55,000 to $64,999 | 57 (7.2%) | 32 (4.6%) |
| $65,000 to $74,999 | 40 (5.0%) | 0 (0.0%) |
| $75,000 to $99,999 | 61 (7.7%) | 29 (4.2%) |
| $100,000+ | 113 (14.2%) | 27 (3.9%) |
| Total | 796 (100.0%) | 697 (100.0%) |
Earnings by Sex by Educational Attainment in Sharpes
Average earnings in Sharpes are $43,125 for men and $33,250 for women, a difference of 22.9%. Men with an educational attainment of bachelor's degree enjoy the highest average annual earnings of $103,750, while those with high school diploma education earn the least with $30,781. Women with an educational attainment of bachelor's degree earn the most with the average annual earnings of $39,919, while those with less than high school education have the smallest earnings of $20,208.
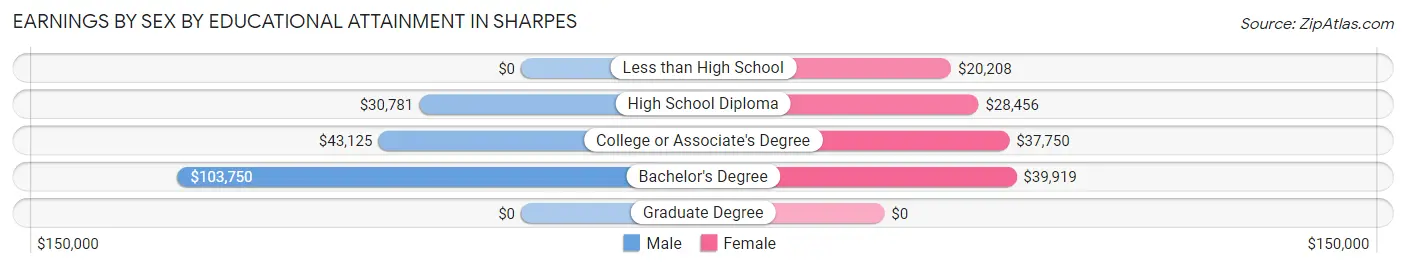
| Educational Attainment | Male Income | Female Income |
| Less than High School | - | - |
| High School Diploma | $30,781 | $28,456 |
| College or Associate's Degree | $43,125 | $37,750 |
| Bachelor's Degree | $103,750 | $39,919 |
| Graduate Degree | - | - |
| Total | $43,125 | $33,250 |
Family Income in Sharpes
Family Income Brackets in Sharpes
According to the Sharpes family income data, there are 149 families falling into the $100,000 to $149,999 income range, which is the most common income bracket and makes up 22.7% of all families. Conversely, the $15,000 to $24,999 income bracket is the least frequent group with only 29 families (4.4%) belonging to this category.
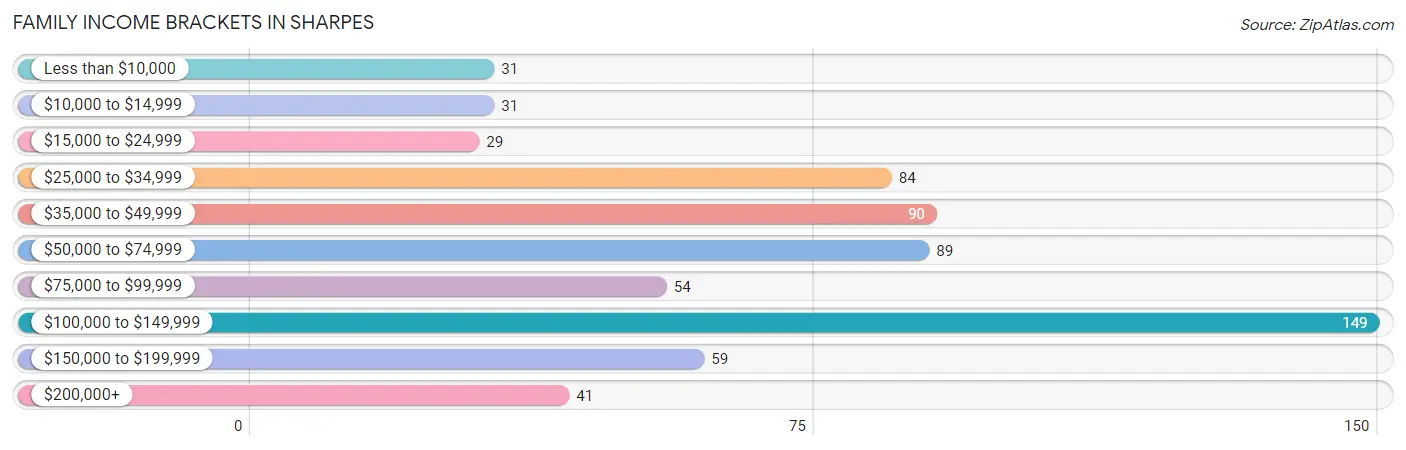
| Income Bracket | # Families | % Families |
| Less than $10,000 | 31 | 4.7% |
| $10,000 to $14,999 | 31 | 4.7% |
| $15,000 to $24,999 | 29 | 4.4% |
| $25,000 to $34,999 | 84 | 12.8% |
| $35,000 to $49,999 | 90 | 13.7% |
| $50,000 to $74,999 | 89 | 13.5% |
| $75,000 to $99,999 | 54 | 8.2% |
| $100,000 to $149,999 | 149 | 22.7% |
| $150,000 to $199,999 | 59 | 9.0% |
| $200,000+ | 41 | 6.2% |
Family Income by Famaliy Size in Sharpes
4-person families (134 | 20.4%) account for the highest median family income in Sharpes with $70,455 per family, while 2-person families (364 | 55.4%) have the highest median income of $32,212 per family member.
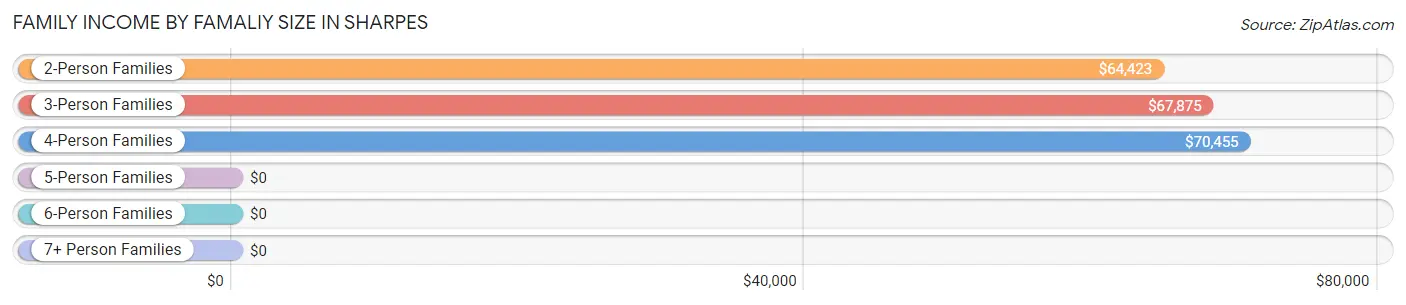
| Income Bracket | # Families | Median Income |
| 2-Person Families | 364 (55.4%) | $64,423 |
| 3-Person Families | 151 (23.0%) | $67,875 |
| 4-Person Families | 134 (20.4%) | $70,455 |
| 5-Person Families | 8 (1.2%) | $0 |
| 6-Person Families | 0 (0.0%) | $0 |
| 7+ Person Families | 0 (0.0%) | $0 |
| Total | 657 (100.0%) | $68,625 |
Family Income by Number of Earners in Sharpes
The median family income in Sharpes is $68,625, with families comprising 3+ earners (76) having the highest median family income of $172,059, while families with 1 earner (260) have the lowest median family income of $36,591, accounting for 11.6% and 39.6% of families, respectively.
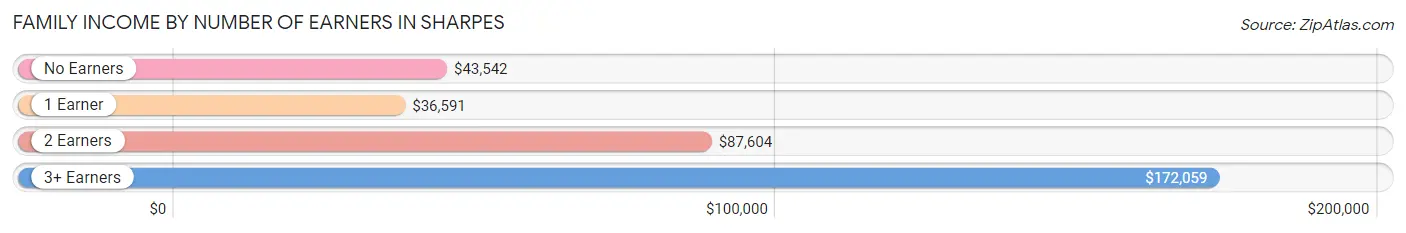
| Number of Earners | # Families | Median Income |
| No Earners | 150 (22.8%) | $43,542 |
| 1 Earner | 260 (39.6%) | $36,591 |
| 2 Earners | 171 (26.0%) | $87,604 |
| 3+ Earners | 76 (11.6%) | $172,059 |
| Total | 657 (100.0%) | $68,625 |
Household Income in Sharpes
Household Income Brackets in Sharpes
With 210 households falling in the category, the $100,000 to $149,999 income range is the most frequent in Sharpes, accounting for 18.3% of all households. In contrast, only 15 households (1.3%) fall into the $10,000 to $14,999 income bracket, making it the least populous group.
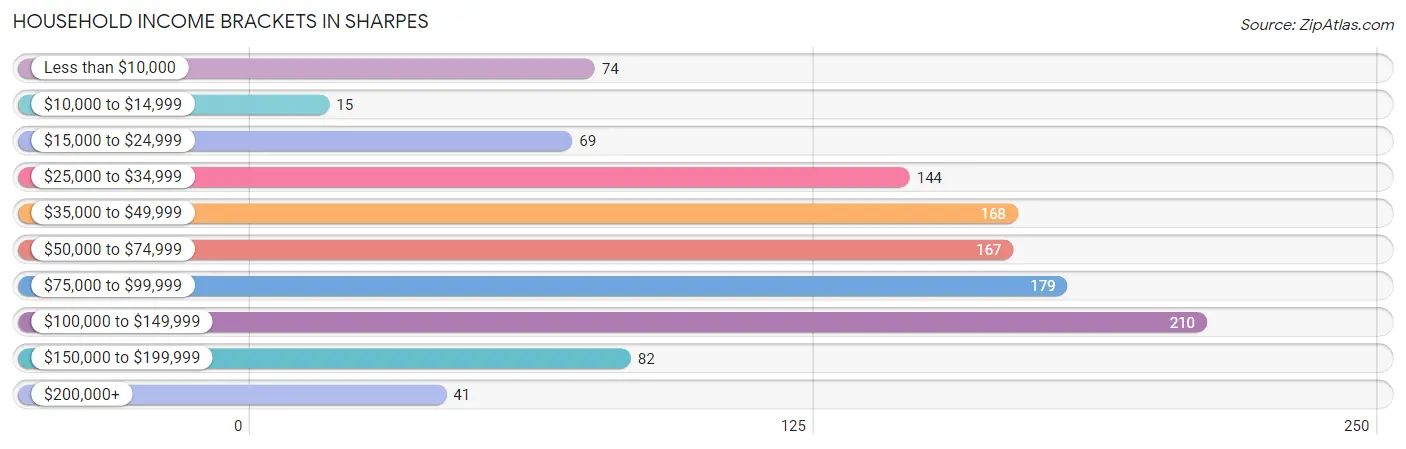
| Income Bracket | # Households | % Households |
| Less than $10,000 | 74 | 6.4% |
| $10,000 to $14,999 | 15 | 1.3% |
| $15,000 to $24,999 | 69 | 6.0% |
| $25,000 to $34,999 | 144 | 12.5% |
| $35,000 to $49,999 | 168 | 14.6% |
| $50,000 to $74,999 | 167 | 14.5% |
| $75,000 to $99,999 | 179 | 15.6% |
| $100,000 to $149,999 | 210 | 18.3% |
| $150,000 to $199,999 | 82 | 7.1% |
| $200,000+ | 41 | 3.6% |
Household Income by Householder Age in Sharpes
The median household income in Sharpes is $64,777, with the highest median household income of $84,375 found in the 65+ years age bracket for the primary householder. A total of 295 households (25.7%) fall into this category. Meanwhile, the 15 to 24 years age bracket for the primary householder has the lowest median household income of $0, with 11 households (1.0%) in this group.
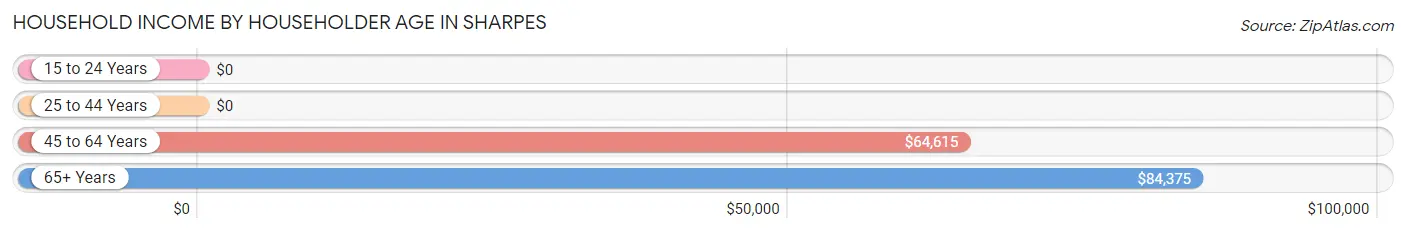
| Income Bracket | # Households | Median Income |
| 15 to 24 Years | 11 (1.0%) | $0 |
| 25 to 44 Years | 265 (23.1%) | $0 |
| 45 to 64 Years | 578 (50.3%) | $64,615 |
| 65+ Years | 295 (25.7%) | $84,375 |
| Total | 1,149 (100.0%) | $64,777 |
Poverty in Sharpes
Income Below Poverty by Sex and Age in Sharpes
With 14.6% poverty level for males and 21.7% for females among the residents of Sharpes, 18 to 24 year old males and 16 and 17 year old females are the most vulnerable to poverty, with 40 males (44.9%) and 43 females (81.1%) in their respective age groups living below the poverty level.
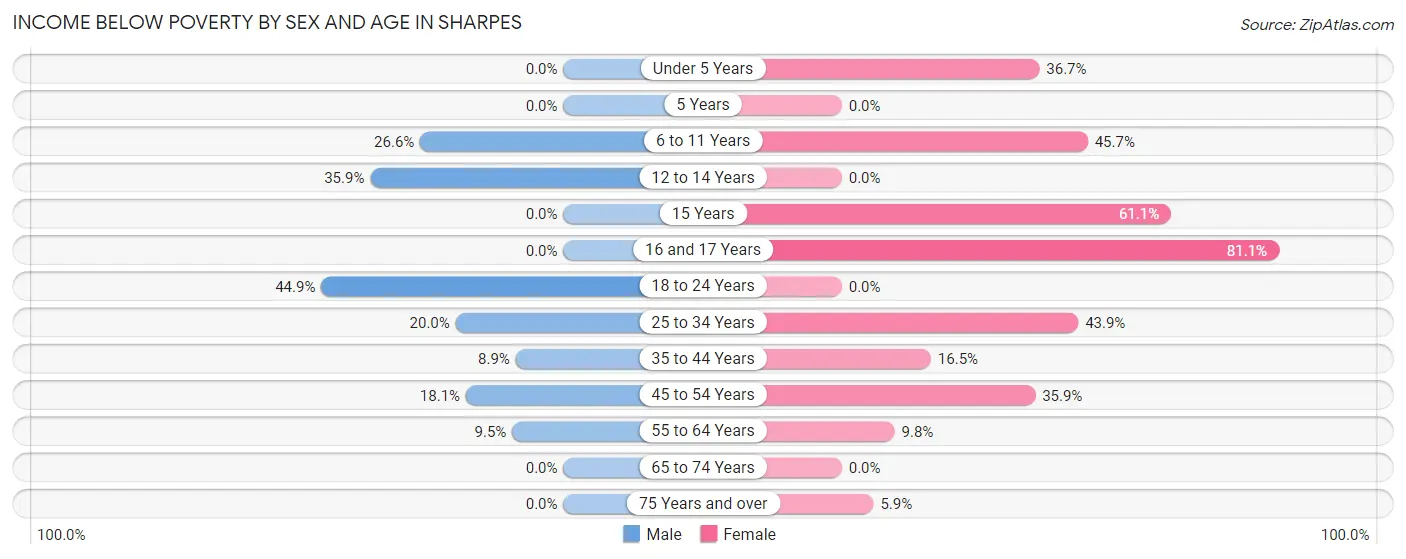
| Age Bracket | Male | Female |
| Under 5 Years | 0 (0.0%) | 11 (36.7%) |
| 5 Years | 0 (0.0%) | 0 (0.0%) |
| 6 to 11 Years | 21 (26.6%) | 21 (45.7%) |
| 12 to 14 Years | 19 (35.8%) | 0 (0.0%) |
| 15 Years | 0 (0.0%) | 11 (61.1%) |
| 16 and 17 Years | 0 (0.0%) | 43 (81.1%) |
| 18 to 24 Years | 40 (44.9%) | 0 (0.0%) |
| 25 to 34 Years | 27 (20.0%) | 104 (43.9%) |
| 35 to 44 Years | 17 (8.8%) | 21 (16.5%) |
| 45 to 54 Years | 51 (18.1%) | 56 (35.9%) |
| 55 to 64 Years | 23 (9.5%) | 40 (9.8%) |
| 65 to 74 Years | 0 (0.0%) | 0 (0.0%) |
| 75 Years and over | 0 (0.0%) | 7 (5.9%) |
| Total | 198 (14.6%) | 314 (21.7%) |
Income Above Poverty by Sex and Age in Sharpes
According to the poverty statistics in Sharpes, males aged under 5 years and females aged 12 to 14 years are the age groups that are most secure financially, with 100.0% of males and 100.0% of females in these age groups living above the poverty line.
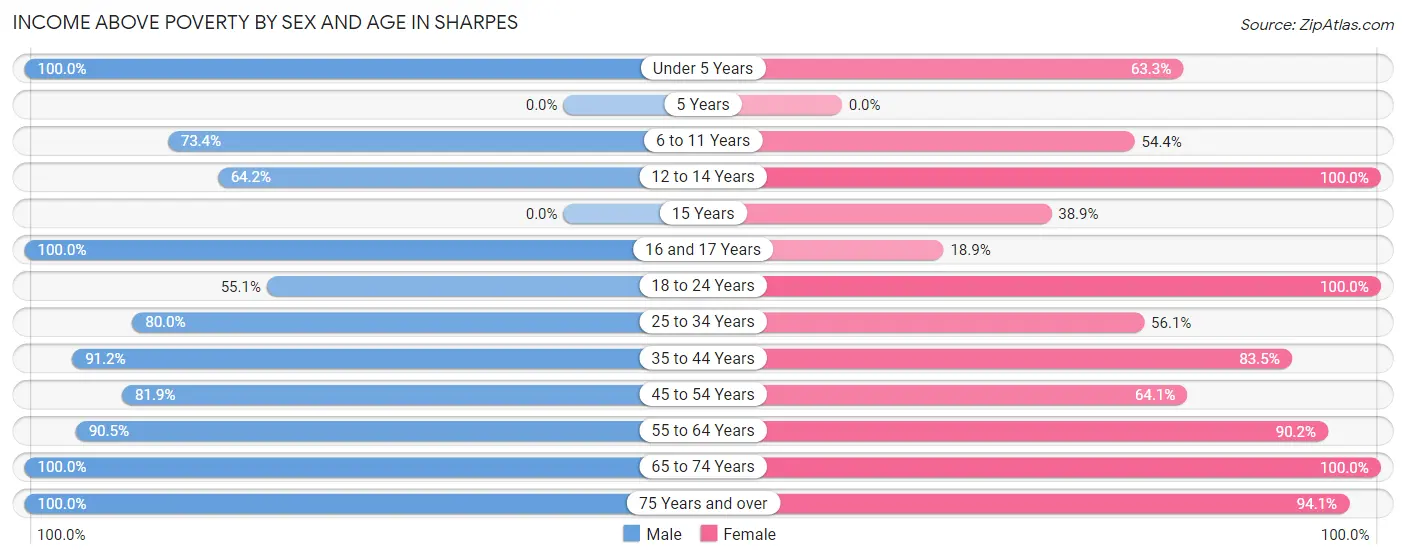
| Age Bracket | Male | Female |
| Under 5 Years | 6 (100.0%) | 19 (63.3%) |
| 5 Years | 0 (0.0%) | 0 (0.0%) |
| 6 to 11 Years | 58 (73.4%) | 25 (54.3%) |
| 12 to 14 Years | 34 (64.1%) | 47 (100.0%) |
| 15 Years | 0 (0.0%) | 7 (38.9%) |
| 16 and 17 Years | 20 (100.0%) | 10 (18.9%) |
| 18 to 24 Years | 49 (55.1%) | 64 (100.0%) |
| 25 to 34 Years | 108 (80.0%) | 133 (56.1%) |
| 35 to 44 Years | 175 (91.1%) | 106 (83.5%) |
| 45 to 54 Years | 231 (81.9%) | 100 (64.1%) |
| 55 to 64 Years | 219 (90.5%) | 368 (90.2%) |
| 65 to 74 Years | 122 (100.0%) | 140 (100.0%) |
| 75 Years and over | 138 (100.0%) | 112 (94.1%) |
| Total | 1,160 (85.4%) | 1,131 (78.3%) |
Income Below Poverty Among Married-Couple Families in Sharpes
The poverty statistics for married-couple families in Sharpes show that 9.3% or 41 of the total 443 families live below the poverty line. Families with 1 or 2 children have the highest poverty rate of 22.6%, comprising of 30 families. On the other hand, families with no children have the lowest poverty rate of 3.5%, which includes 11 families.
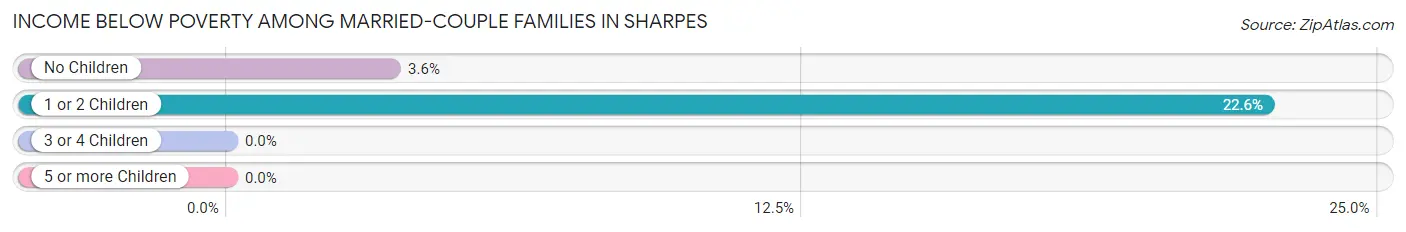
| Children | Above Poverty | Below Poverty |
| No Children | 299 (96.5%) | 11 (3.5%) |
| 1 or 2 Children | 103 (77.4%) | 30 (22.6%) |
| 3 or 4 Children | 0 (0.0%) | 0 (0.0%) |
| 5 or more Children | 0 (0.0%) | 0 (0.0%) |
| Total | 402 (90.7%) | 41 (9.3%) |
Income Below Poverty Among Single-Parent Households in Sharpes
According to the poverty data in Sharpes, 29.6% or 21 single-father households and 28.7% or 41 single-mother households are living below the poverty line. Among single-father households, those with 1 or 2 children have the highest poverty rate, with 21 households (50.0%) experiencing poverty. Likewise, among single-mother households, those with 1 or 2 children have the highest poverty rate, with 10 households (34.5%) falling below the poverty line.
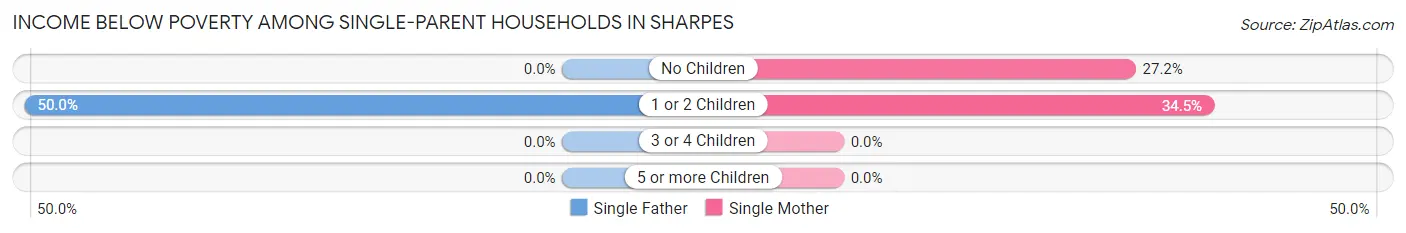
| Children | Single Father | Single Mother |
| No Children | 0 (0.0%) | 31 (27.2%) |
| 1 or 2 Children | 21 (50.0%) | 10 (34.5%) |
| 3 or 4 Children | 0 (0.0%) | 0 (0.0%) |
| 5 or more Children | 0 (0.0%) | 0 (0.0%) |
| Total | 21 (29.6%) | 41 (28.7%) |
Income Below Poverty Among Married-Couple vs Single-Parent Households in Sharpes
The poverty data for Sharpes shows that 41 of the married-couple family households (9.3%) and 62 of the single-parent households (29.0%) are living below the poverty level. Within the married-couple family households, those with 1 or 2 children have the highest poverty rate, with 30 households (22.6%) falling below the poverty line. Among the single-parent households, those with 1 or 2 children have the highest poverty rate, with 31 household (43.7%) living below poverty.
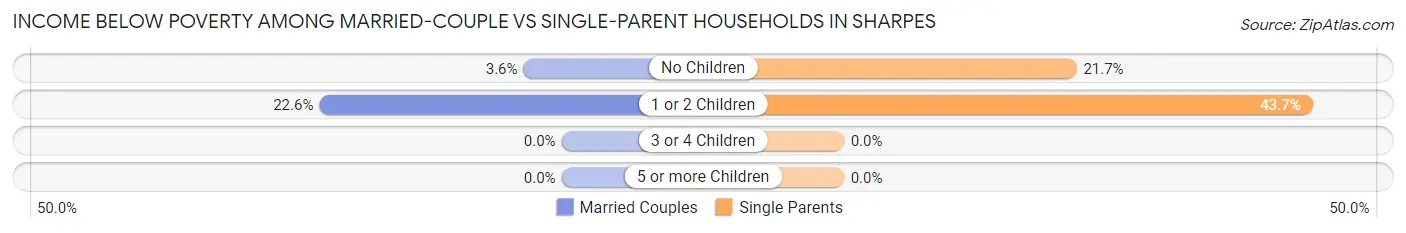
| Children | Married-Couple Families | Single-Parent Households |
| No Children | 11 (3.5%) | 31 (21.7%) |
| 1 or 2 Children | 30 (22.6%) | 31 (43.7%) |
| 3 or 4 Children | 0 (0.0%) | 0 (0.0%) |
| 5 or more Children | 0 (0.0%) | 0 (0.0%) |
| Total | 41 (9.3%) | 62 (29.0%) |
Race in Sharpes
The most populous races in Sharpes are White / Caucasian (2,452 | 87.2%), Hispanic or Latino (189 | 6.7%), and Two or more Races (153 | 5.4%).
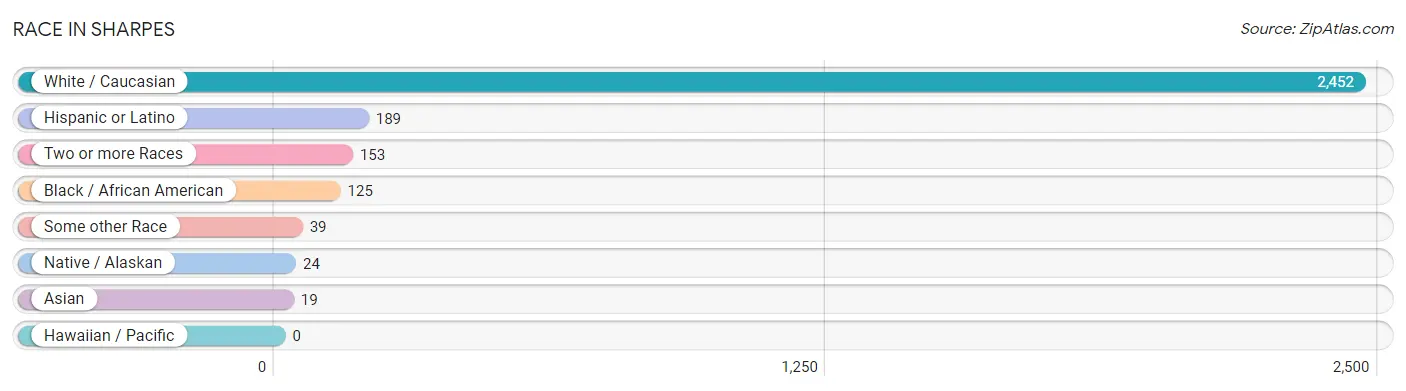
| Race | # Population | % Population |
| Asian | 19 | 0.7% |
| Black / African American | 125 | 4.4% |
| Hawaiian / Pacific | 0 | 0.0% |
| Hispanic or Latino | 189 | 6.7% |
| Native / Alaskan | 24 | 0.9% |
| White / Caucasian | 2,452 | 87.2% |
| Two or more Races | 153 | 5.4% |
| Some other Race | 39 | 1.4% |
| Total | 2,812 | 100.0% |
Ancestry in Sharpes
The most populous ancestries reported in Sharpes are English (512 | 18.2%), German (445 | 15.8%), Irish (372 | 13.2%), Italian (168 | 6.0%), and French (105 | 3.7%), together accounting for 57.0% of all Sharpes residents.
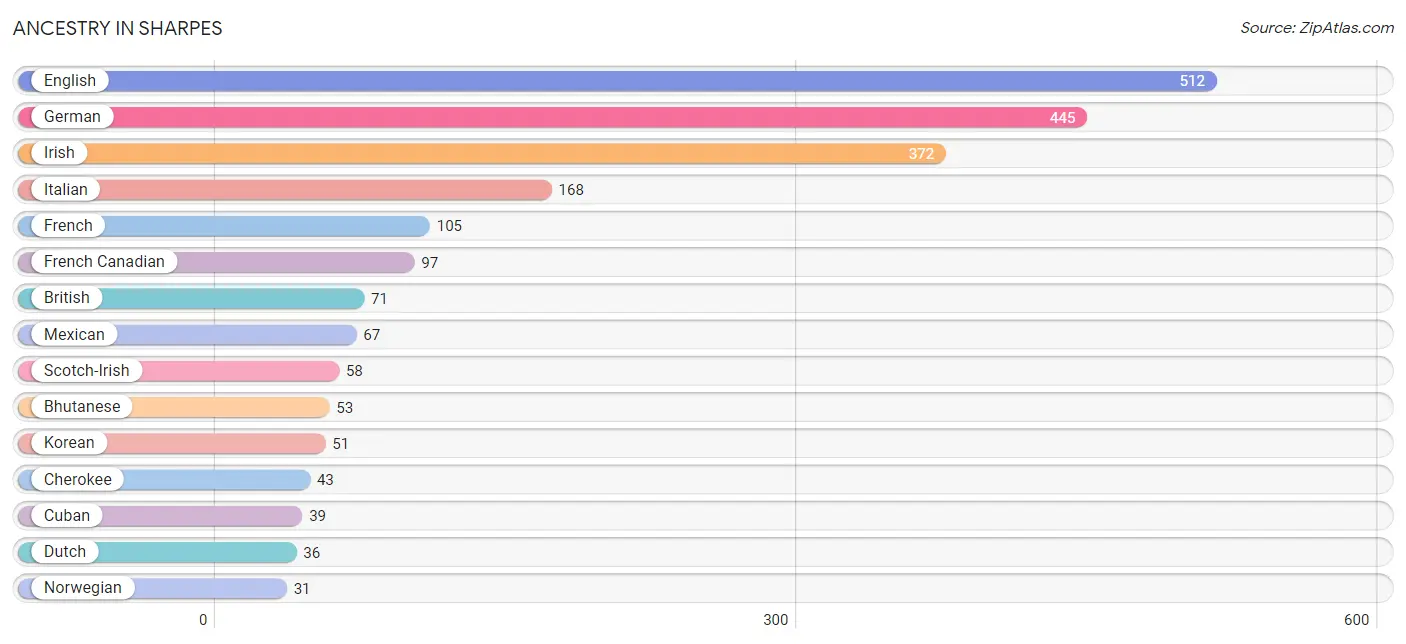
| Ancestry | # Population | % Population |
| American | 29 | 1.0% |
| Arab | 17 | 0.6% |
| Bhutanese | 53 | 1.9% |
| Brazilian | 13 | 0.5% |
| British | 71 | 2.5% |
| Cherokee | 43 | 1.5% |
| Colombian | 9 | 0.3% |
| Cuban | 39 | 1.4% |
| Czech | 4 | 0.1% |
| Dutch | 36 | 1.3% |
| English | 512 | 18.2% |
| European | 24 | 0.9% |
| French | 105 | 3.7% |
| French Canadian | 97 | 3.5% |
| German | 445 | 15.8% |
| Greek | 16 | 0.6% |
| Irish | 372 | 13.2% |
| Italian | 168 | 6.0% |
| Korean | 51 | 1.8% |
| Lebanese | 17 | 0.6% |
| Mexican | 67 | 2.4% |
| Northern European | 12 | 0.4% |
| Norwegian | 31 | 1.1% |
| Polish | 24 | 0.9% |
| Puerto Rican | 9 | 0.3% |
| Russian | 6 | 0.2% |
| Scotch-Irish | 58 | 2.1% |
| Scottish | 16 | 0.6% |
| South American | 24 | 0.9% |
| Spanish | 11 | 0.4% |
| Swedish | 31 | 1.1% |
| Ukrainian | 8 | 0.3% |
| Uruguayan | 15 | 0.5% |
| Welsh | 8 | 0.3% | View All 34 Rows |
Immigrants in Sharpes
The most numerous immigrant groups reported in Sharpes came from Latin America (55 | 2.0%), Caribbean (39 | 1.4%), Cuba (39 | 1.4%), Europe (35 | 1.2%), and Canada (23 | 0.8%), together accounting for 6.8% of all Sharpes residents.
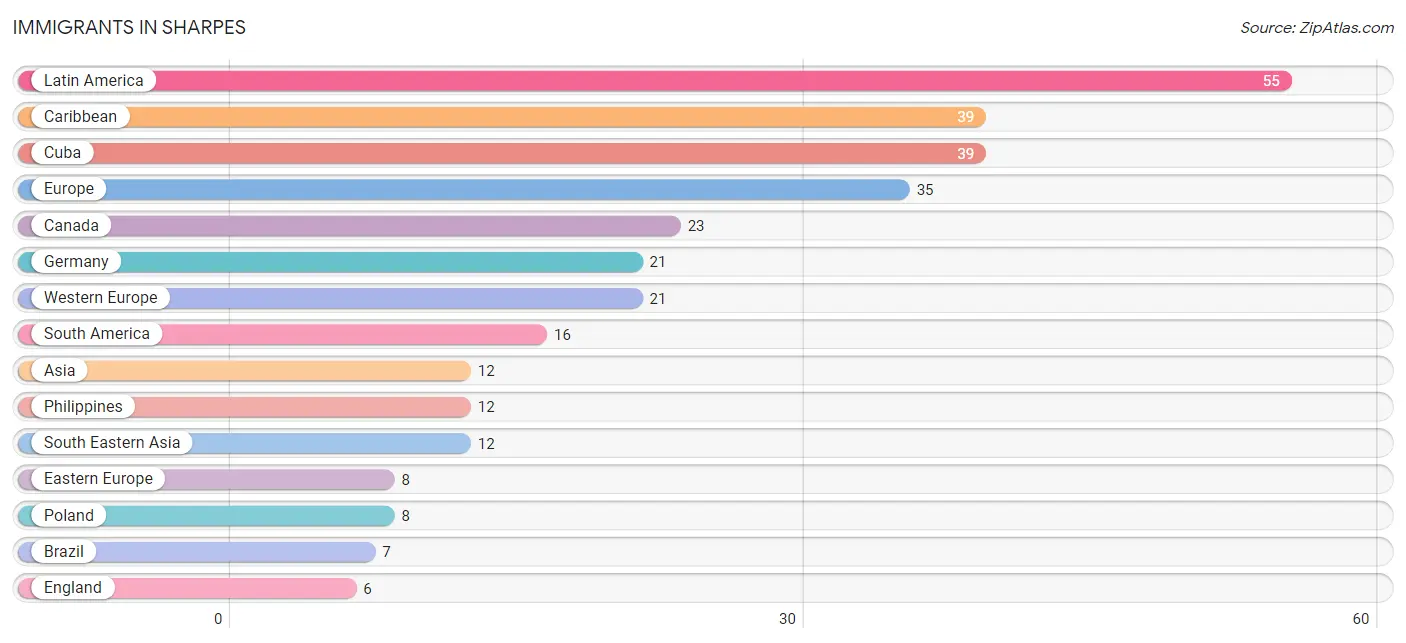
| Immigration Origin | # Population | % Population |
| Asia | 12 | 0.4% |
| Brazil | 7 | 0.3% |
| Canada | 23 | 0.8% |
| Caribbean | 39 | 1.4% |
| Cuba | 39 | 1.4% |
| Eastern Europe | 8 | 0.3% |
| England | 6 | 0.2% |
| Europe | 35 | 1.2% |
| Germany | 21 | 0.7% |
| Latin America | 55 | 2.0% |
| Northern Europe | 6 | 0.2% |
| Philippines | 12 | 0.4% |
| Poland | 8 | 0.3% |
| South America | 16 | 0.6% |
| South Eastern Asia | 12 | 0.4% |
| Western Europe | 21 | 0.7% | View All 16 Rows |
Sex and Age in Sharpes
Sex and Age in Sharpes
The most populous age groups in Sharpes are 50 to 54 Years (223 | 16.3%) for men and 55 to 59 Years (261 | 18.1%) for women.
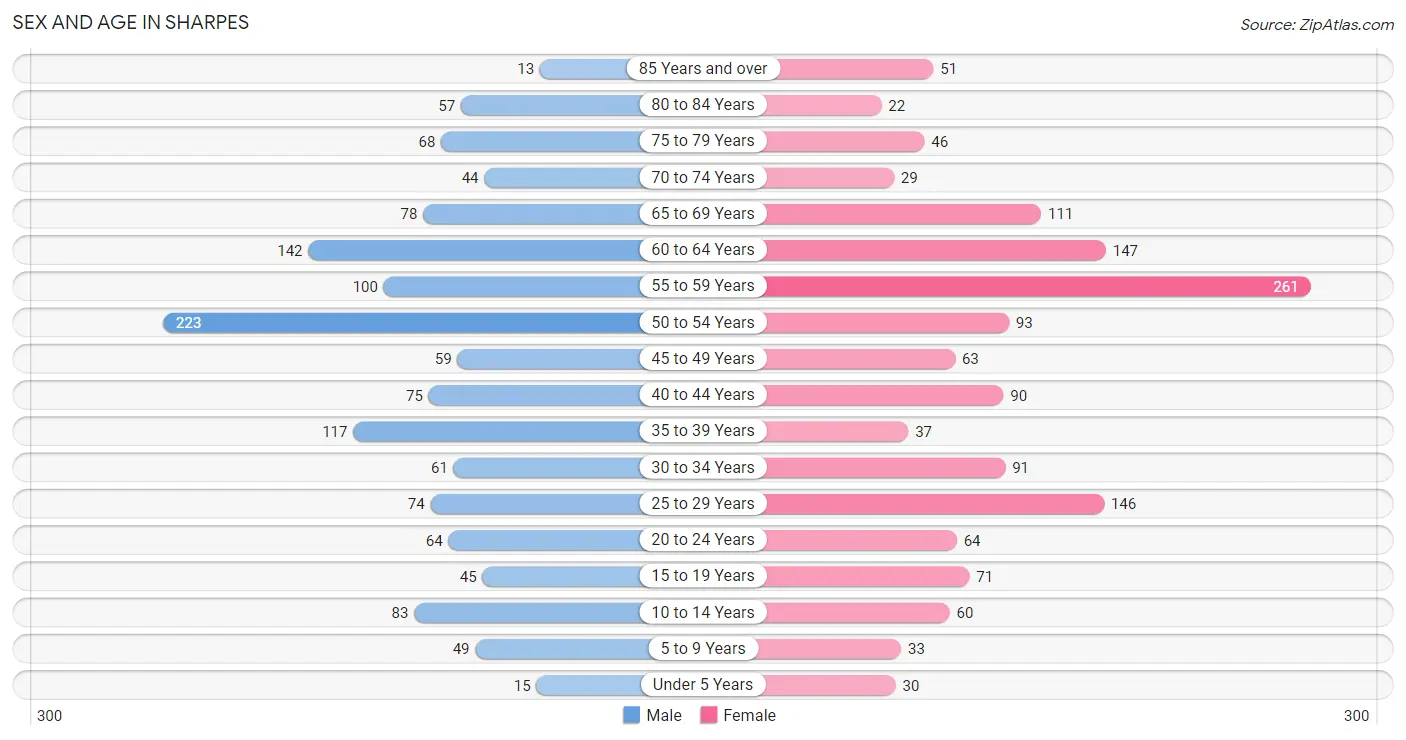
| Age Bracket | Male | Female |
| Under 5 Years | 15 (1.1%) | 30 (2.1%) |
| 5 to 9 Years | 49 (3.6%) | 33 (2.3%) |
| 10 to 14 Years | 83 (6.1%) | 60 (4.2%) |
| 15 to 19 Years | 45 (3.3%) | 71 (4.9%) |
| 20 to 24 Years | 64 (4.7%) | 64 (4.4%) |
| 25 to 29 Years | 74 (5.4%) | 146 (10.1%) |
| 30 to 34 Years | 61 (4.5%) | 91 (6.3%) |
| 35 to 39 Years | 117 (8.6%) | 37 (2.6%) |
| 40 to 44 Years | 75 (5.5%) | 90 (6.2%) |
| 45 to 49 Years | 59 (4.3%) | 63 (4.4%) |
| 50 to 54 Years | 223 (16.3%) | 93 (6.4%) |
| 55 to 59 Years | 100 (7.3%) | 261 (18.1%) |
| 60 to 64 Years | 142 (10.4%) | 147 (10.2%) |
| 65 to 69 Years | 78 (5.7%) | 111 (7.7%) |
| 70 to 74 Years | 44 (3.2%) | 29 (2.0%) |
| 75 to 79 Years | 68 (5.0%) | 46 (3.2%) |
| 80 to 84 Years | 57 (4.2%) | 22 (1.5%) |
| 85 Years and over | 13 (0.9%) | 51 (3.5%) |
| Total | 1,367 (100.0%) | 1,445 (100.0%) |
Families and Households in Sharpes
Median Family Size in Sharpes
The median family size in Sharpes is 2.96 persons per family, with single male/father families (71 | 10.8%) accounting for the largest median family size of 3.44 persons per family. On the other hand, single female/mother families (143 | 21.8%) represent the smallest median family size with 2.80 persons per family.
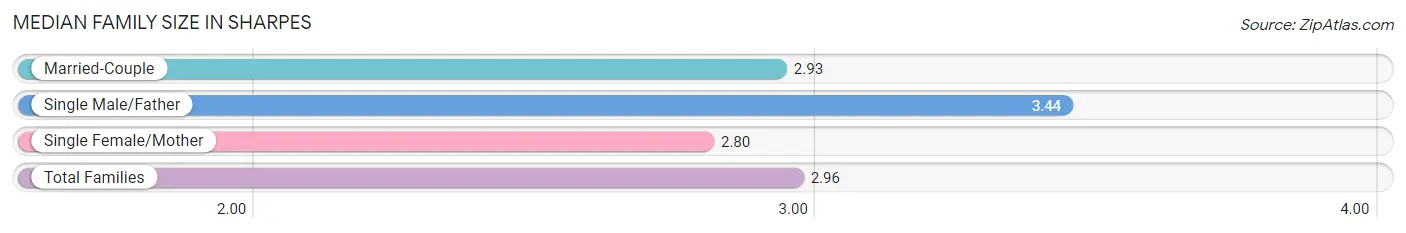
| Family Type | # Families | Family Size |
| Married-Couple | 443 (67.4%) | 2.93 |
| Single Male/Father | 71 (10.8%) | 3.44 |
| Single Female/Mother | 143 (21.8%) | 2.80 |
| Total Families | 657 (100.0%) | 2.96 |
Median Household Size in Sharpes
The median household size in Sharpes is 2.45 persons per household, with single male/father households (71 | 6.2%) accounting for the largest median household size of 4.18 persons per household. non-family households (492 | 42.8%) represent the smallest median household size with 1.45 persons per household.
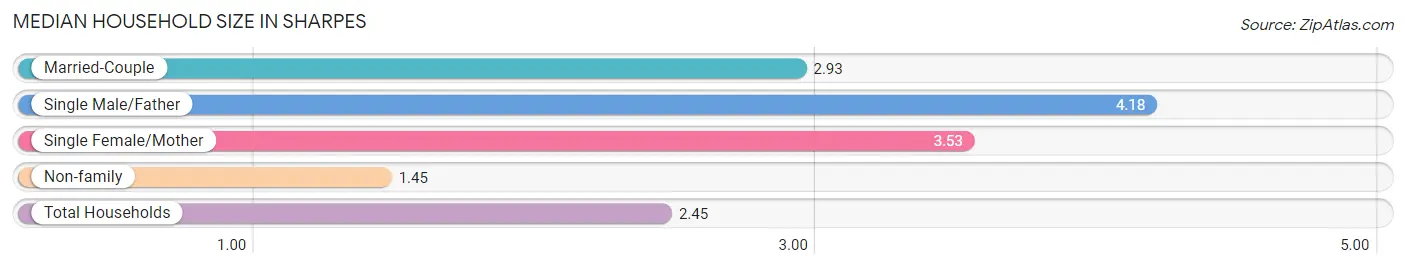
| Household Type | # Households | Household Size |
| Married-Couple | 443 (38.6%) | 2.93 |
| Single Male/Father | 71 (6.2%) | 4.18 |
| Single Female/Mother | 143 (12.4%) | 3.53 |
| Non-family | 492 (42.8%) | 1.45 |
| Total Households | 1,149 (100.0%) | 2.45 |
Household Size by Marriage Status in Sharpes
Out of a total of 1,149 households in Sharpes, 657 (57.2%) are family households, while 492 (42.8%) are nonfamily households. The most numerous type of family households are 2-person households, comprising 341, and the most common type of nonfamily households are 1-person households, comprising 300.
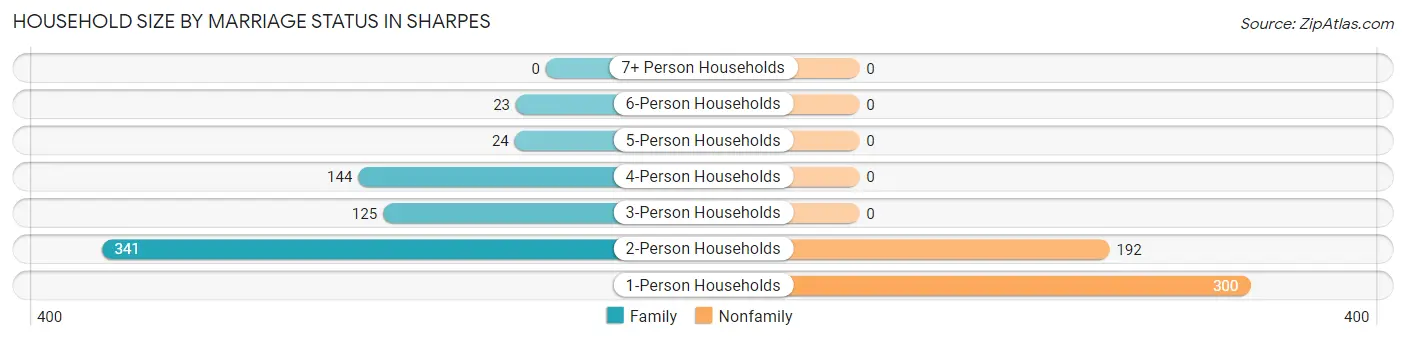
| Household Size | Family Households | Nonfamily Households |
| 1-Person Households | - | 300 (26.1%) |
| 2-Person Households | 341 (29.7%) | 192 (16.7%) |
| 3-Person Households | 125 (10.9%) | 0 (0.0%) |
| 4-Person Households | 144 (12.5%) | 0 (0.0%) |
| 5-Person Households | 24 (2.1%) | 0 (0.0%) |
| 6-Person Households | 23 (2.0%) | 0 (0.0%) |
| 7+ Person Households | 0 (0.0%) | 0 (0.0%) |
| Total | 657 (57.2%) | 492 (42.8%) |
Female Fertility in Sharpes
Fertility by Age in Sharpes
Average fertility rate in Sharpes is 42.0 births per 1,000 women. Women in the age bracket of 20 to 34 years have the highest fertility rate with 56.0 births per 1,000 women. Women in the age bracket of 20 to 34 years acount for 70.8% of all women with births.
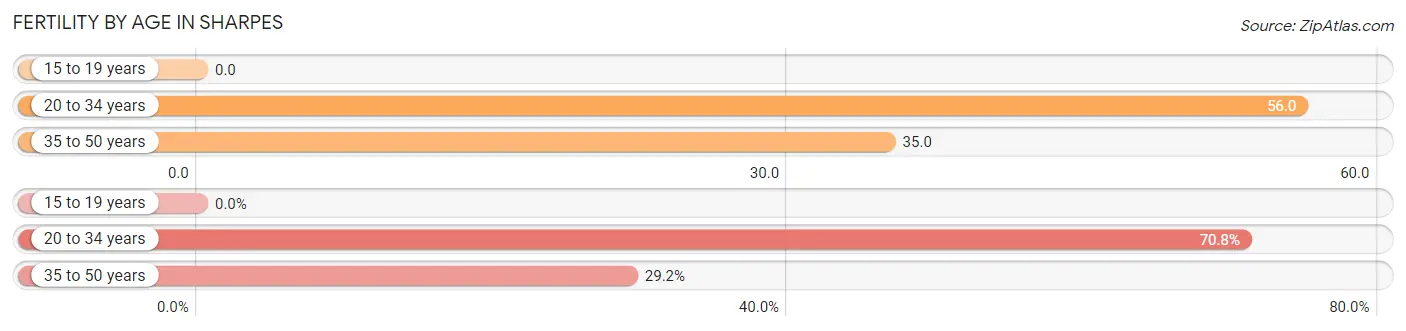
| Age Bracket | Women with Births | Births / 1,000 Women |
| 15 to 19 years | 0 (0.0%) | 0.0 |
| 20 to 34 years | 17 (70.8%) | 56.0 |
| 35 to 50 years | 7 (29.2%) | 35.0 |
| Total | 24 (100.0%) | 42.0 |
Fertility by Age by Marriage Status in Sharpes
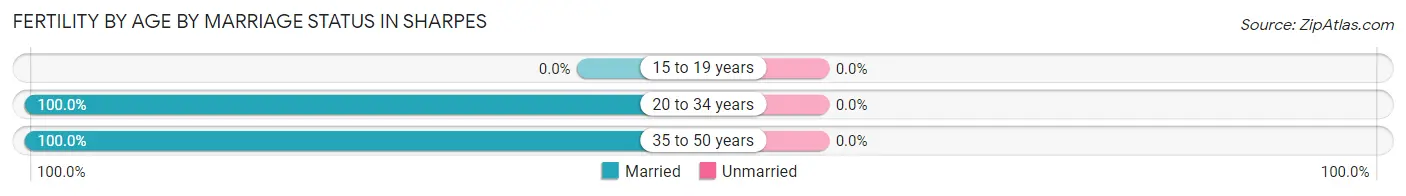
| Age Bracket | Married | Unmarried |
| 15 to 19 years | 0 (0.0%) | 0 (0.0%) |
| 20 to 34 years | 17 (100.0%) | 0 (0.0%) |
| 35 to 50 years | 7 (100.0%) | 0 (0.0%) |
| Total | 24 (100.0%) | 0 (0.0%) |
Fertility by Education in Sharpes
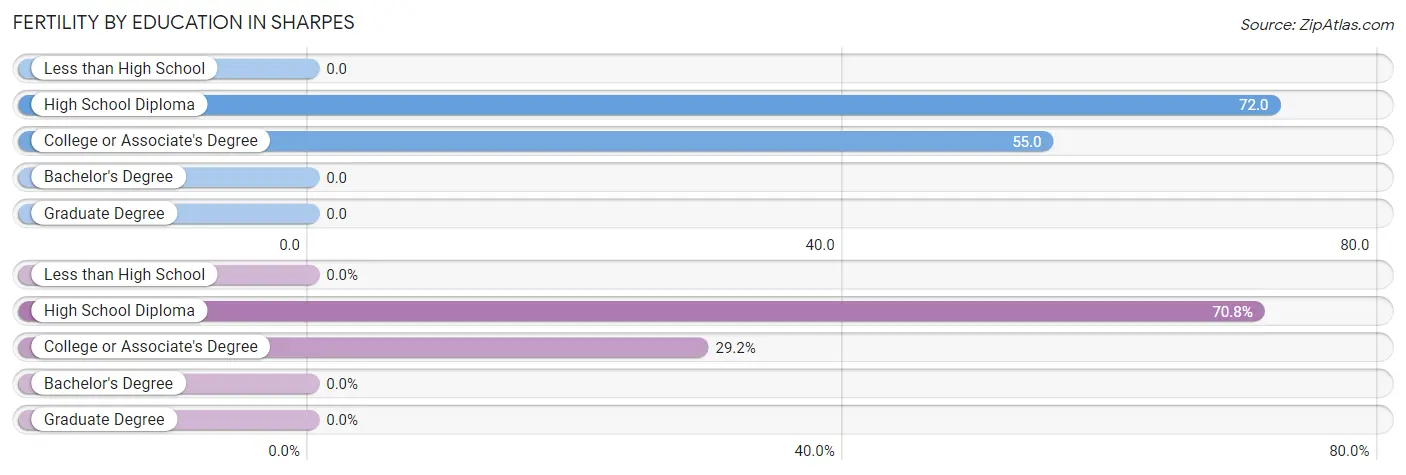
| Educational Attainment | Women with Births | Births / 1,000 Women |
| Less than High School | 0 (0.0%) | 0.0 |
| High School Diploma | 17 (70.8%) | 72.0 |
| College or Associate's Degree | 7 (29.2%) | 55.0 |
| Bachelor's Degree | 0 (0.0%) | 0.0 |
| Graduate Degree | 0 (0.0%) | 0.0 |
| Total | 24 (100.0%) | 42.0 |
Fertility by Education by Marriage Status in Sharpes
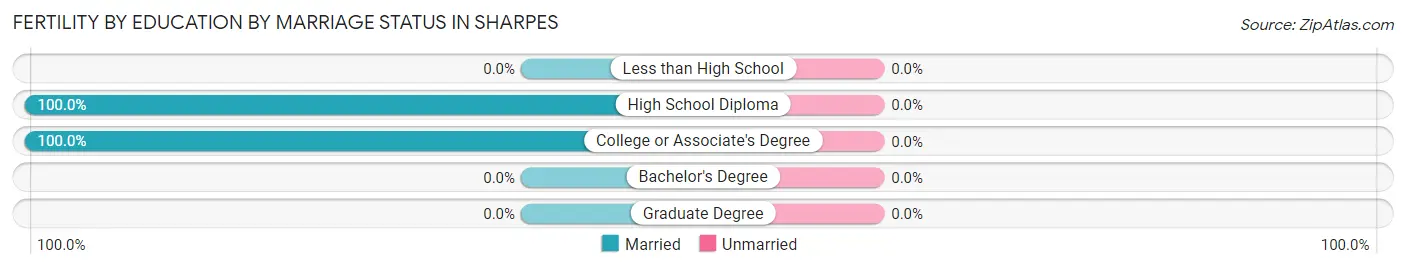
| Educational Attainment | Married | Unmarried |
| Less than High School | 0 (0.0%) | 0 (0.0%) |
| High School Diploma | 17 (100.0%) | 0 (0.0%) |
| College or Associate's Degree | 7 (100.0%) | 0 (0.0%) |
| Bachelor's Degree | 0 (0.0%) | 0 (0.0%) |
| Graduate Degree | 0 (0.0%) | 0 (0.0%) |
| Total | 24 (100.0%) | 0 (0.0%) |
Employment Characteristics in Sharpes
Employment by Class of Employer in Sharpes
Among the 1,345 employed individuals in Sharpes, private company employees (1,003 | 74.6%), self-employed (incorporated) (106 | 7.9%), and local government employees (81 | 6.0%) make up the most common classes of employment.
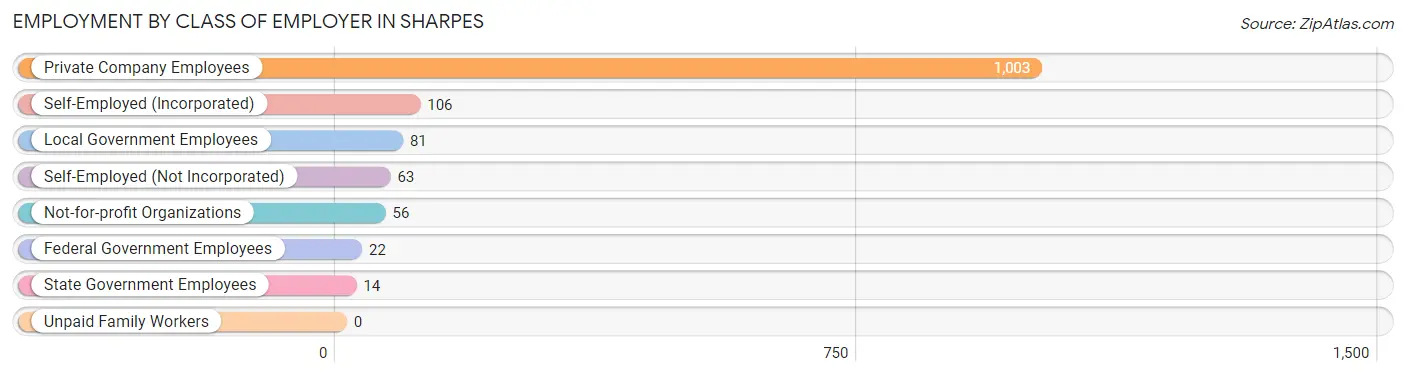
| Employer Class | # Employees | % Employees |
| Private Company Employees | 1,003 | 74.6% |
| Self-Employed (Incorporated) | 106 | 7.9% |
| Self-Employed (Not Incorporated) | 63 | 4.7% |
| Not-for-profit Organizations | 56 | 4.2% |
| Local Government Employees | 81 | 6.0% |
| State Government Employees | 14 | 1.0% |
| Federal Government Employees | 22 | 1.6% |
| Unpaid Family Workers | 0 | 0.0% |
| Total | 1,345 | 100.0% |
Employment Status by Age in Sharpes
According to the labor force statistics for Sharpes, out of the total population over 16 years of age (2,524), 58.2% or 1,469 individuals are in the labor force, with 5.6% or 82 of them unemployed. The age group with the highest labor force participation rate is 20 to 24 years, with 92.2% or 118 individuals in the labor force. Within the labor force, the 16 to 19 years age range has the highest percentage of unemployed individuals, with 100.0% or 15 of them being unemployed.
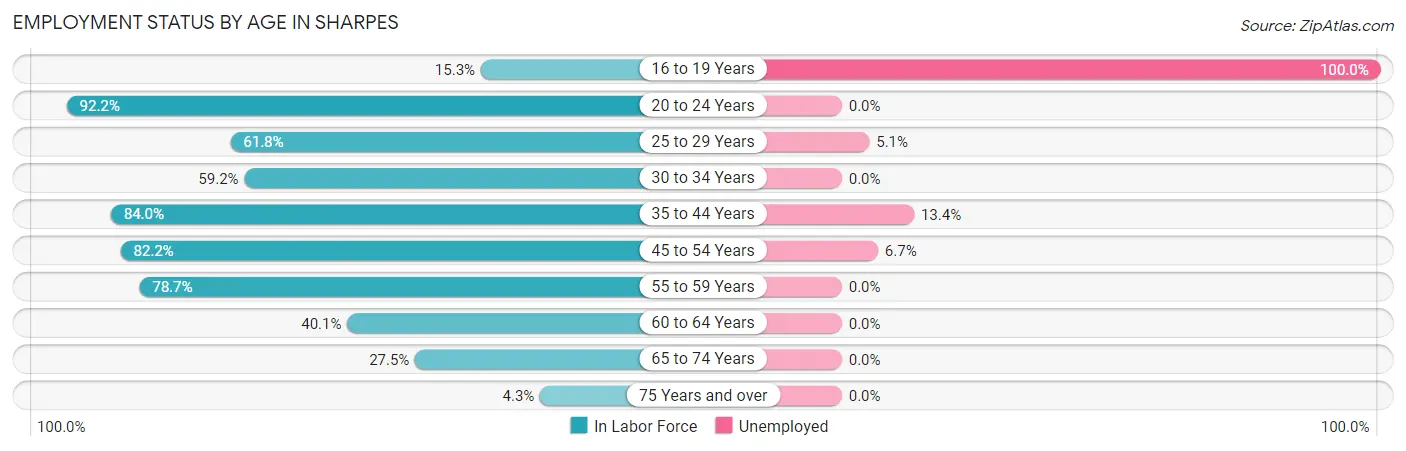
| Age Bracket | In Labor Force | Unemployed |
| 16 to 19 Years | 15 (15.3%) | 15 (100.0%) |
| 20 to 24 Years | 118 (92.2%) | 0 (0.0%) |
| 25 to 29 Years | 136 (61.8%) | 7 (5.1%) |
| 30 to 34 Years | 90 (59.2%) | 0 (0.0%) |
| 35 to 44 Years | 268 (84.0%) | 36 (13.4%) |
| 45 to 54 Years | 360 (82.2%) | 24 (6.7%) |
| 55 to 59 Years | 284 (78.7%) | 0 (0.0%) |
| 60 to 64 Years | 116 (40.1%) | 0 (0.0%) |
| 65 to 74 Years | 72 (27.5%) | 0 (0.0%) |
| 75 Years and over | 11 (4.3%) | 0 (0.0%) |
| Total | 1,469 (58.2%) | 82 (5.6%) |
Employment Status by Educational Attainment in Sharpes
According to labor force statistics for Sharpes, 70.5% of individuals (1,254) out of the total population between 25 and 64 years of age (1,779) are in the labor force, with 5.3% or 66 of them being unemployed. The group with the highest labor force participation rate are those with the educational attainment of high school diploma, with 74.3% or 494 individuals in the labor force. Within the labor force, individuals with high school diploma education have the highest percentage of unemployment, with 9.9% or 49 of them being unemployed.
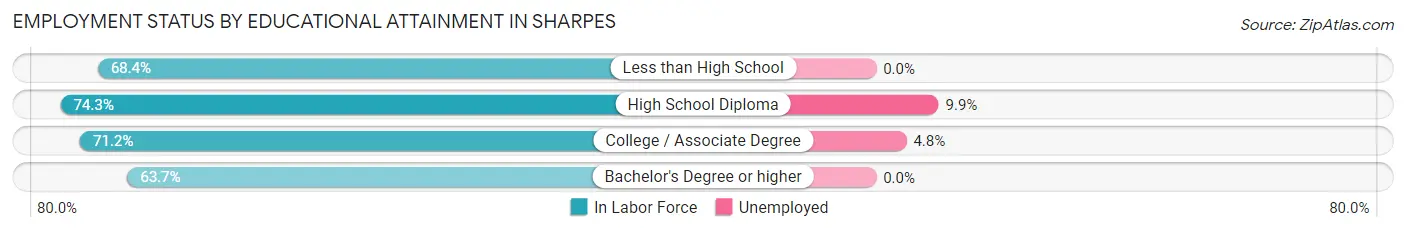
| Educational Attainment | In Labor Force | Unemployed |
| Less than High School | 154 (68.4%) | 0 (0.0%) |
| High School Diploma | 494 (74.3%) | 66 (9.9%) |
| College / Associate Degree | 376 (71.2%) | 25 (4.8%) |
| Bachelor's Degree or higher | 230 (63.7%) | 0 (0.0%) |
| Total | 1,254 (70.5%) | 94 (5.3%) |
Employment Occupations by Sex in Sharpes
Management, Business, Science and Arts Occupations
The most common Management, Business, Science and Arts occupations in Sharpes are Management (178 | 12.8%), Health Diagnosing & Treating (132 | 9.5%), Business & Financial (95 | 6.8%), Community & Social Service (71 | 5.1%), and Computers, Engineering & Science (53 | 3.8%).
Management, Business, Science and Arts Occupations by Sex
Within the Management, Business, Science and Arts occupations in Sharpes, the most male-oriented occupations are Computers, Engineering & Science (100.0%), Computers & Mathematics (100.0%), and Architecture & Engineering (100.0%), while the most female-oriented occupations are Education, Arts & Media (100.0%), Health Technologists (88.2%), and Health Diagnosing & Treating (85.6%).
| Occupation | Male | Female |
| Management | 129 (72.5%) | 49 (27.5%) |
| Business & Financial | 40 (42.1%) | 55 (57.9%) |
| Computers, Engineering & Science | 53 (100.0%) | 0 (0.0%) |
| Computers & Mathematics | 28 (100.0%) | 0 (0.0%) |
| Architecture & Engineering | 20 (100.0%) | 0 (0.0%) |
| Life, Physical & Social Science | 5 (100.0%) | 0 (0.0%) |
| Community & Social Service | 33 (46.5%) | 38 (53.5%) |
| Education, Arts & Media | 0 (0.0%) | 7 (100.0%) |
| Legal Services & Support | 6 (100.0%) | 0 (0.0%) |
| Education Instruction & Library | 8 (20.5%) | 31 (79.5%) |
| Arts, Media & Entertainment | 19 (100.0%) | 0 (0.0%) |
| Health Diagnosing & Treating | 19 (14.4%) | 113 (85.6%) |
| Health Technologists | 6 (11.8%) | 45 (88.2%) |
| Total (Category) | 274 (51.8%) | 255 (48.2%) |
| Total (Overall) | 738 (53.2%) | 650 (46.8%) |
Services Occupations
The most common Services occupations in Sharpes are Food Preparation & Serving (95 | 6.8%), Cleaning & Maintenance (63 | 4.5%), Healthcare Support (59 | 4.3%), Security & Protection (52 | 3.7%), and Law Enforcement (46 | 3.3%).
Services Occupations by Sex
Within the Services occupations in Sharpes, the most male-oriented occupations are Firefighting & Prevention (100.0%), Cleaning & Maintenance (84.1%), and Security & Protection (32.7%), while the most female-oriented occupations are Healthcare Support (100.0%), Personal Care & Service (100.0%), and Law Enforcement (76.1%).
| Occupation | Male | Female |
| Healthcare Support | 0 (0.0%) | 59 (100.0%) |
| Security & Protection | 17 (32.7%) | 35 (67.3%) |
| Firefighting & Prevention | 6 (100.0%) | 0 (0.0%) |
| Law Enforcement | 11 (23.9%) | 35 (76.1%) |
| Food Preparation & Serving | 26 (27.4%) | 69 (72.6%) |
| Cleaning & Maintenance | 53 (84.1%) | 10 (15.9%) |
| Personal Care & Service | 0 (0.0%) | 21 (100.0%) |
| Total (Category) | 96 (33.1%) | 194 (66.9%) |
| Total (Overall) | 738 (53.2%) | 650 (46.8%) |
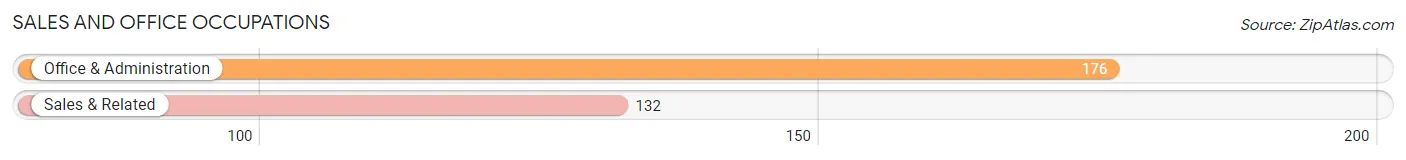
Sales and Office Occupations
The most common Sales and Office occupations in Sharpes are Office & Administration (176 | 12.7%), and Sales & Related (132 | 9.5%).
Sales and Office Occupations by Sex
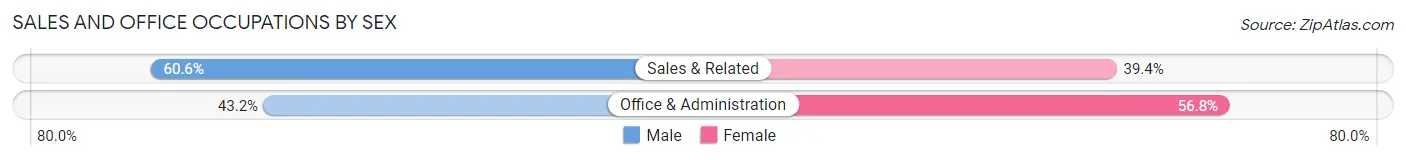
| Occupation | Male | Female |
| Sales & Related | 80 (60.6%) | 52 (39.4%) |
| Office & Administration | 76 (43.2%) | 100 (56.8%) |
| Total (Category) | 156 (50.6%) | 152 (49.3%) |
| Total (Overall) | 738 (53.2%) | 650 (46.8%) |
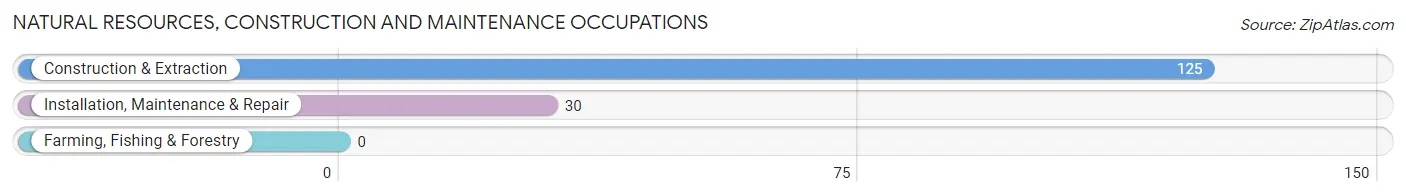
Natural Resources, Construction and Maintenance Occupations
The most common Natural Resources, Construction and Maintenance occupations in Sharpes are Construction & Extraction (125 | 9.0%), and Installation, Maintenance & Repair (30 | 2.2%).
Natural Resources, Construction and Maintenance Occupations by Sex
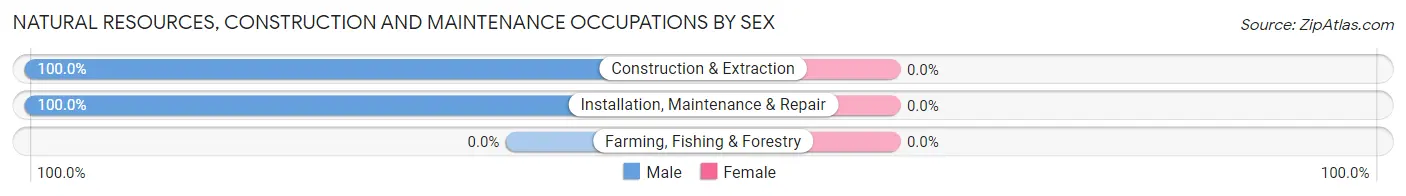
| Occupation | Male | Female |
| Farming, Fishing & Forestry | 0 (0.0%) | 0 (0.0%) |
| Construction & Extraction | 125 (100.0%) | 0 (0.0%) |
| Installation, Maintenance & Repair | 30 (100.0%) | 0 (0.0%) |
| Total (Category) | 155 (100.0%) | 0 (0.0%) |
| Total (Overall) | 738 (53.2%) | 650 (46.8%) |
Production, Transportation and Moving Occupations
The most common Production, Transportation and Moving occupations in Sharpes are Material Moving (44 | 3.2%), Production (38 | 2.7%), and Transportation (24 | 1.7%).
Production, Transportation and Moving Occupations by Sex
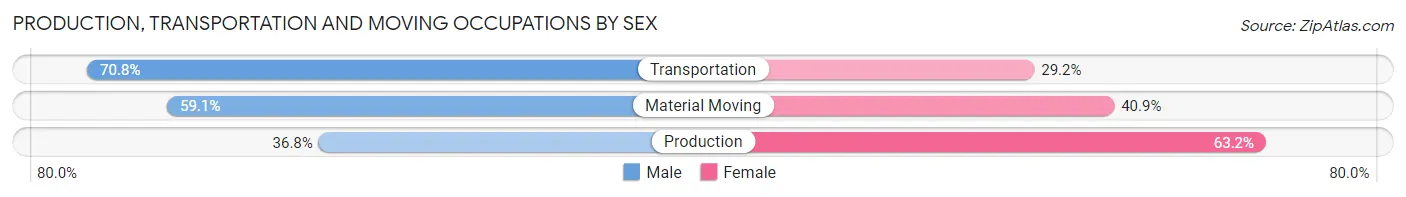
| Occupation | Male | Female |
| Production | 14 (36.8%) | 24 (63.2%) |
| Transportation | 17 (70.8%) | 7 (29.2%) |
| Material Moving | 26 (59.1%) | 18 (40.9%) |
| Total (Category) | 57 (53.8%) | 49 (46.2%) |
| Total (Overall) | 738 (53.2%) | 650 (46.8%) |
Employment Industries by Sex in Sharpes
Employment Industries in Sharpes
The major employment industries in Sharpes include Construction (197 | 14.2%), Health Care & Social Assistance (187 | 13.5%), Retail Trade (142 | 10.2%), Professional & Scientific (126 | 9.1%), and Accommodation & Food Services (113 | 8.1%).
Employment Industries by Sex in Sharpes
The Sharpes industries that see more men than women are Wholesale Trade (100.0%), Real Estate, Rental & Leasing (100.0%), and Arts, Entertainment & Recreation (100.0%), whereas the industries that tend to have a higher number of women are Agriculture, Fishing & Hunting (100.0%), Health Care & Social Assistance (89.8%), and Educational Services (74.6%).
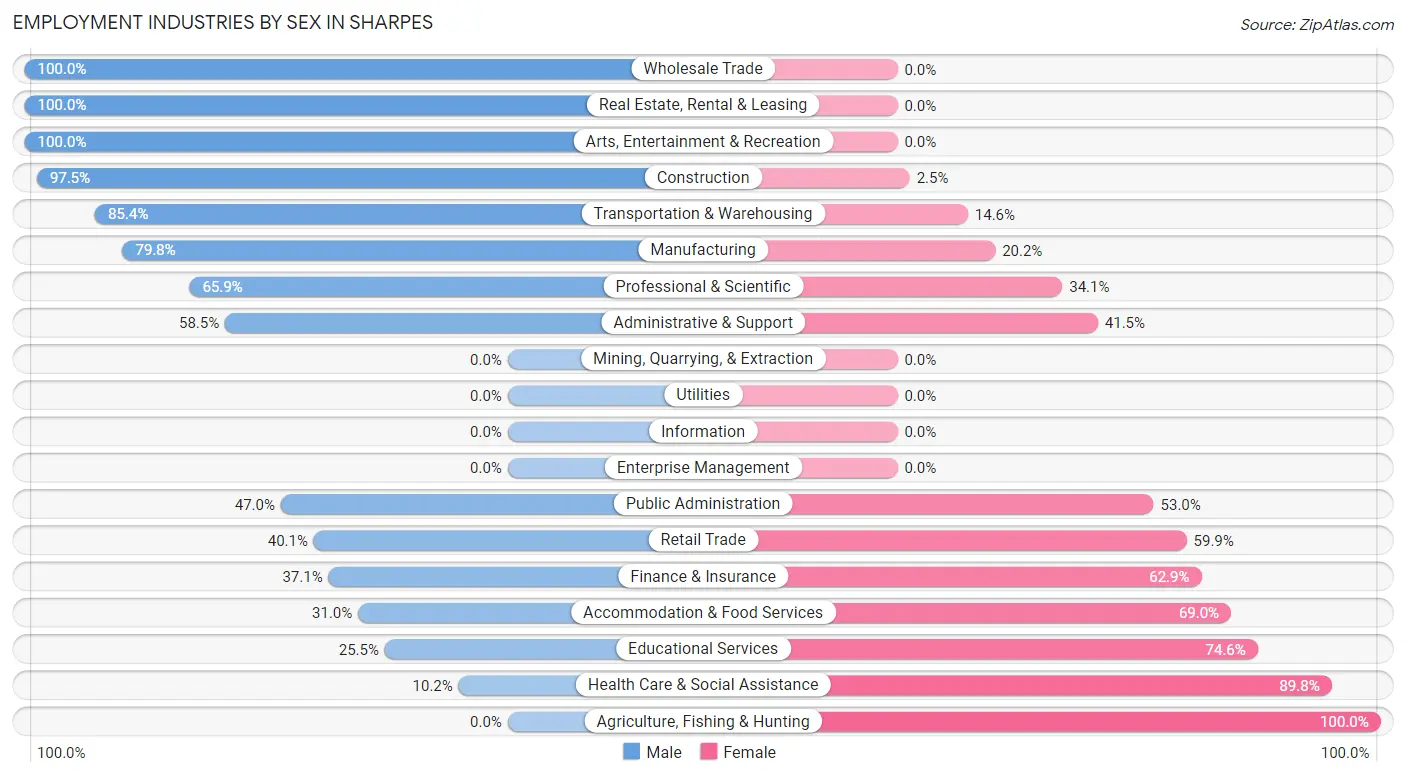
| Industry | Male | Female |
| Agriculture, Fishing & Hunting | 0 (0.0%) | 42 (100.0%) |
| Mining, Quarrying, & Extraction | 0 (0.0%) | 0 (0.0%) |
| Construction | 192 (97.5%) | 5 (2.5%) |
| Manufacturing | 67 (79.8%) | 17 (20.2%) |
| Wholesale Trade | 43 (100.0%) | 0 (0.0%) |
| Retail Trade | 57 (40.1%) | 85 (59.9%) |
| Transportation & Warehousing | 41 (85.4%) | 7 (14.6%) |
| Utilities | 0 (0.0%) | 0 (0.0%) |
| Information | 0 (0.0%) | 0 (0.0%) |
| Finance & Insurance | 23 (37.1%) | 39 (62.9%) |
| Real Estate, Rental & Leasing | 20 (100.0%) | 0 (0.0%) |
| Professional & Scientific | 83 (65.9%) | 43 (34.1%) |
| Enterprise Management | 0 (0.0%) | 0 (0.0%) |
| Administrative & Support | 55 (58.5%) | 39 (41.5%) |
| Educational Services | 14 (25.5%) | 41 (74.6%) |
| Health Care & Social Assistance | 19 (10.2%) | 168 (89.8%) |
| Arts, Entertainment & Recreation | 19 (100.0%) | 0 (0.0%) |
| Accommodation & Food Services | 35 (31.0%) | 78 (69.0%) |
| Public Administration | 31 (47.0%) | 35 (53.0%) |
| Total | 738 (53.2%) | 650 (46.8%) |
Education in Sharpes
School Enrollment in Sharpes
The most common levels of schooling among the 427 students in Sharpes are middle school (146 | 34.2%), college / undergraduate (99 | 23.2%), and high school (72 | 16.9%).
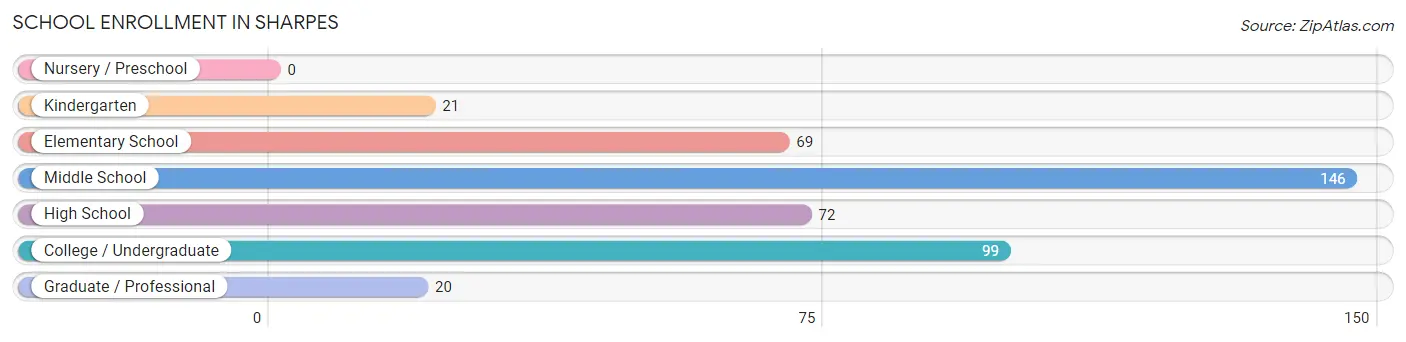
| School Level | # Students | % Students |
| Nursery / Preschool | 0 | 0.0% |
| Kindergarten | 21 | 4.9% |
| Elementary School | 69 | 16.2% |
| Middle School | 146 | 34.2% |
| High School | 72 | 16.9% |
| College / Undergraduate | 99 | 23.2% |
| Graduate / Professional | 20 | 4.7% |
| Total | 427 | 100.0% |
School Enrollment by Age by Funding Source in Sharpes
Out of a total of 427 students who are enrolled in schools in Sharpes, 68 (15.9%) attend a private institution, while the remaining 359 (84.1%) are enrolled in public schools. The age group of 18 to 19 year olds has the highest likelihood of being enrolled in private schools, with 15 (100.0% in the age bracket) enrolled. Conversely, the age group of 10 to 14 year olds has the lowest likelihood of being enrolled in a private school, with 143 (100.0% in the age bracket) attending a public institution.
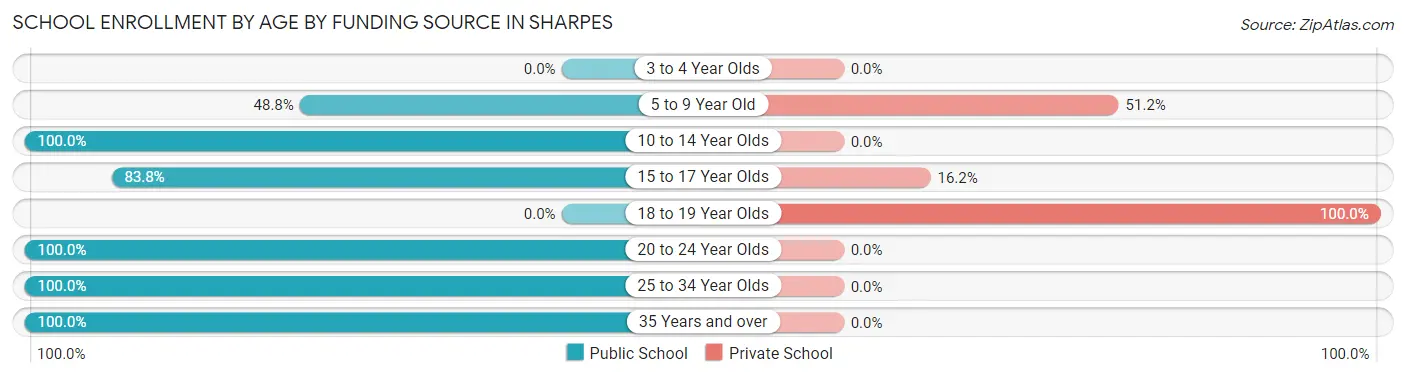
| Age Bracket | Public School | Private School |
| 3 to 4 Year Olds | 0 (0.0%) | 0 (0.0%) |
| 5 to 9 Year Old | 40 (48.8%) | 42 (51.2%) |
| 10 to 14 Year Olds | 143 (100.0%) | 0 (0.0%) |
| 15 to 17 Year Olds | 57 (83.8%) | 11 (16.2%) |
| 18 to 19 Year Olds | 0 (0.0%) | 15 (100.0%) |
| 20 to 24 Year Olds | 39 (100.0%) | 0 (0.0%) |
| 25 to 34 Year Olds | 45 (100.0%) | 0 (0.0%) |
| 35 Years and over | 35 (100.0%) | 0 (0.0%) |
| Total | 359 (84.1%) | 68 (15.9%) |
Educational Attainment by Field of Study in Sharpes
Science & technology (93 | 13.2%), social sciences (76 | 10.8%), computers & mathematics (73 | 10.3%), bio, nature & agricultural (70 | 9.9%), and engineering (68 | 9.7%) are the most common fields of study among 705 individuals in Sharpes who have obtained a bachelor's degree or higher.
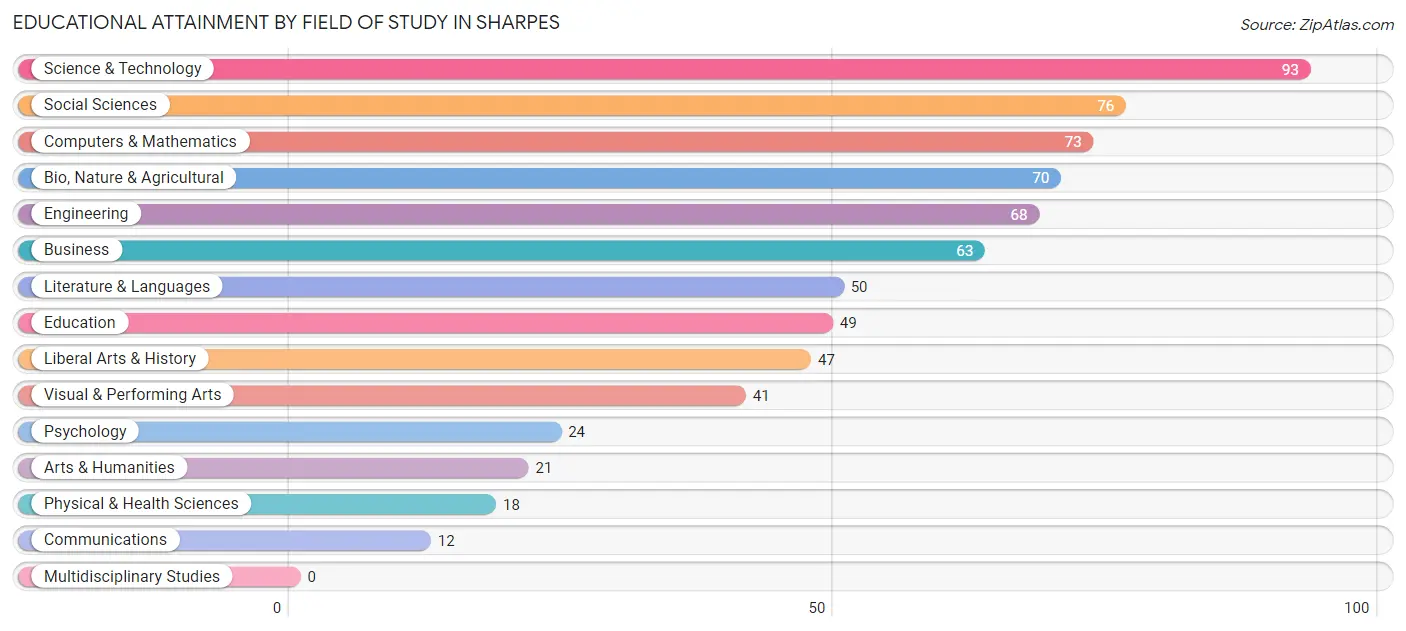
| Field of Study | # Graduates | % Graduates |
| Computers & Mathematics | 73 | 10.3% |
| Bio, Nature & Agricultural | 70 | 9.9% |
| Physical & Health Sciences | 18 | 2.5% |
| Psychology | 24 | 3.4% |
| Social Sciences | 76 | 10.8% |
| Engineering | 68 | 9.7% |
| Multidisciplinary Studies | 0 | 0.0% |
| Science & Technology | 93 | 13.2% |
| Business | 63 | 8.9% |
| Education | 49 | 7.0% |
| Literature & Languages | 50 | 7.1% |
| Liberal Arts & History | 47 | 6.7% |
| Visual & Performing Arts | 41 | 5.8% |
| Communications | 12 | 1.7% |
| Arts & Humanities | 21 | 3.0% |
| Total | 705 | 100.0% |
Transportation & Commute in Sharpes
Vehicle Availability by Sex in Sharpes
The most prevalent vehicle ownership categories in Sharpes are males with 2 vehicles (403, accounting for 57.2%) and females with 2 vehicles (294, making up 63.0%).
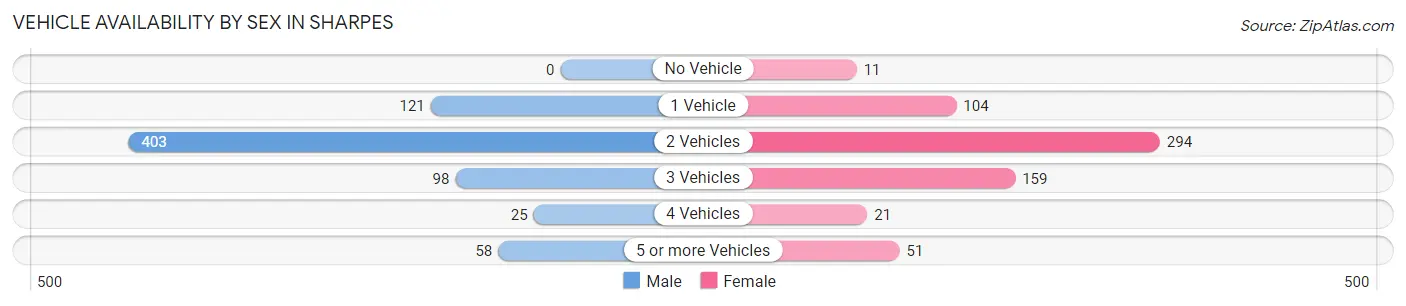
| Vehicles Available | Male | Female |
| No Vehicle | 0 (0.0%) | 11 (1.7%) |
| 1 Vehicle | 121 (17.2%) | 104 (16.3%) |
| 2 Vehicles | 403 (57.2%) | 294 (45.9%) |
| 3 Vehicles | 98 (13.9%) | 159 (24.8%) |
| 4 Vehicles | 25 (3.5%) | 21 (3.3%) |
| 5 or more Vehicles | 58 (8.2%) | 51 (8.0%) |
| Total | 705 (100.0%) | 640 (100.0%) |
Commute Time in Sharpes
The most frequently occuring commute durations in Sharpes are 45 to 59 minutes (208 commuters, 17.4%), 60 to 89 minutes (151 commuters, 12.6%), and 20 to 24 minutes (146 commuters, 12.2%).
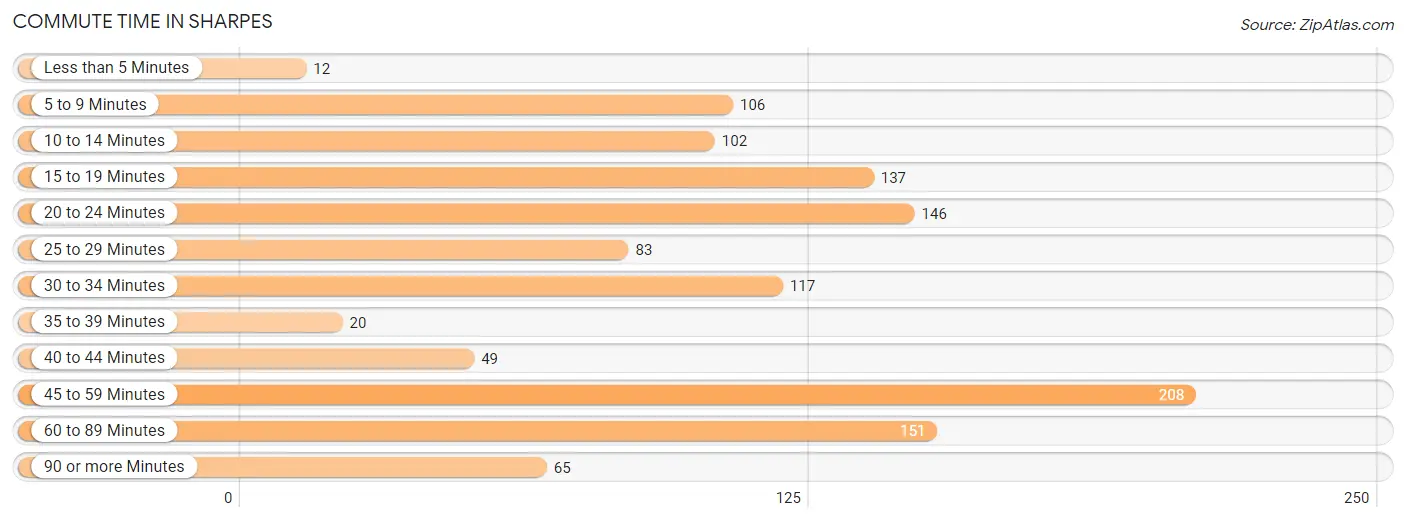
| Commute Time | # Commuters | % Commuters |
| Less than 5 Minutes | 12 | 1.0% |
| 5 to 9 Minutes | 106 | 8.9% |
| 10 to 14 Minutes | 102 | 8.5% |
| 15 to 19 Minutes | 137 | 11.5% |
| 20 to 24 Minutes | 146 | 12.2% |
| 25 to 29 Minutes | 83 | 6.9% |
| 30 to 34 Minutes | 117 | 9.8% |
| 35 to 39 Minutes | 20 | 1.7% |
| 40 to 44 Minutes | 49 | 4.1% |
| 45 to 59 Minutes | 208 | 17.4% |
| 60 to 89 Minutes | 151 | 12.6% |
| 90 or more Minutes | 65 | 5.4% |
Commute Time by Sex in Sharpes
The most common commute times in Sharpes are 15 to 19 minutes (104 commuters, 16.9%) for males and 45 to 59 minutes (146 commuters, 25.1%) for females.
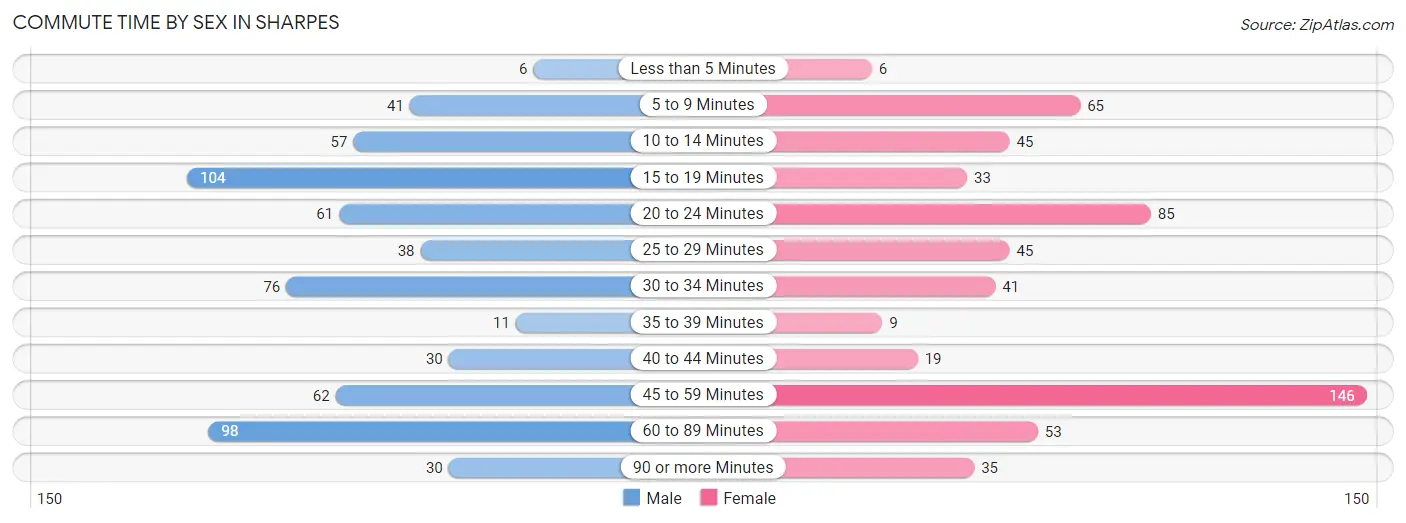
| Commute Time | Male | Female |
| Less than 5 Minutes | 6 (1.0%) | 6 (1.0%) |
| 5 to 9 Minutes | 41 (6.7%) | 65 (11.2%) |
| 10 to 14 Minutes | 57 (9.3%) | 45 (7.7%) |
| 15 to 19 Minutes | 104 (16.9%) | 33 (5.7%) |
| 20 to 24 Minutes | 61 (9.9%) | 85 (14.6%) |
| 25 to 29 Minutes | 38 (6.2%) | 45 (7.7%) |
| 30 to 34 Minutes | 76 (12.4%) | 41 (7.0%) |
| 35 to 39 Minutes | 11 (1.8%) | 9 (1.5%) |
| 40 to 44 Minutes | 30 (4.9%) | 19 (3.3%) |
| 45 to 59 Minutes | 62 (10.1%) | 146 (25.1%) |
| 60 to 89 Minutes | 98 (16.0%) | 53 (9.1%) |
| 90 or more Minutes | 30 (4.9%) | 35 (6.0%) |
Time of Departure to Work by Sex in Sharpes
The most frequent times of departure to work in Sharpes are 5:30 AM to 5:59 AM (125, 20.4%) for males and 9:00 AM to 9:59 AM (127, 21.8%) for females.
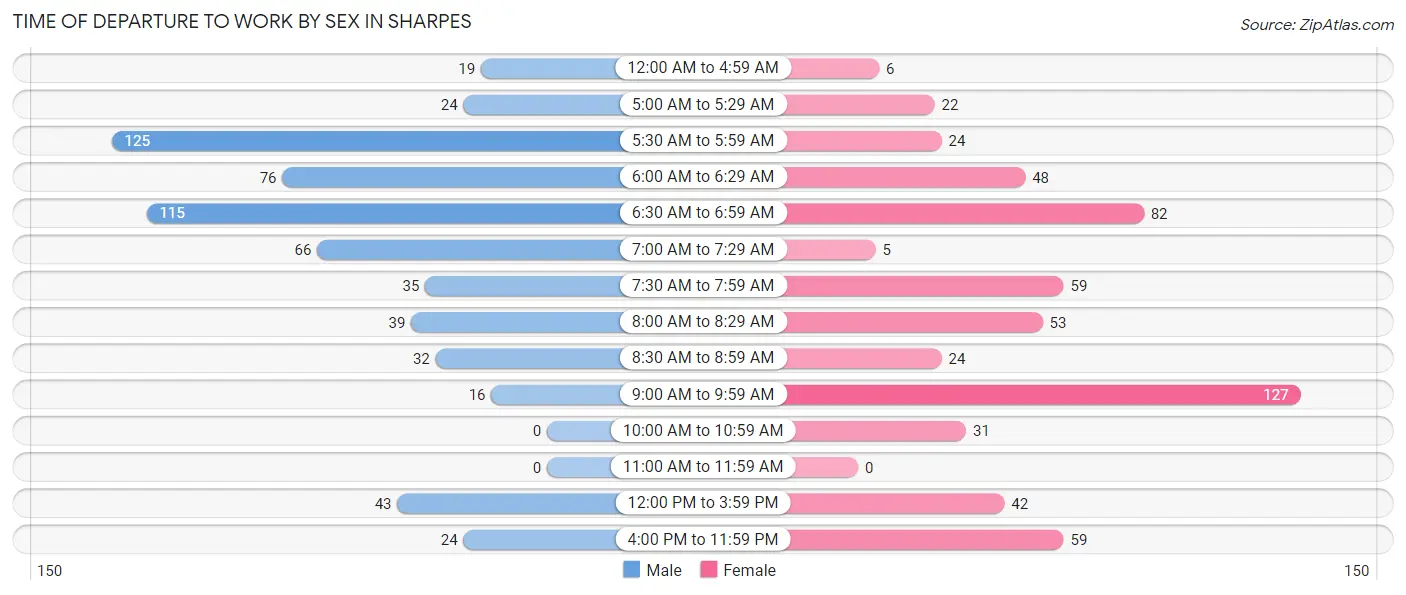
| Time of Departure | Male | Female |
| 12:00 AM to 4:59 AM | 19 (3.1%) | 6 (1.0%) |
| 5:00 AM to 5:29 AM | 24 (3.9%) | 22 (3.8%) |
| 5:30 AM to 5:59 AM | 125 (20.4%) | 24 (4.1%) |
| 6:00 AM to 6:29 AM | 76 (12.4%) | 48 (8.3%) |
| 6:30 AM to 6:59 AM | 115 (18.7%) | 82 (14.1%) |
| 7:00 AM to 7:29 AM | 66 (10.7%) | 5 (0.9%) |
| 7:30 AM to 7:59 AM | 35 (5.7%) | 59 (10.1%) |
| 8:00 AM to 8:29 AM | 39 (6.4%) | 53 (9.1%) |
| 8:30 AM to 8:59 AM | 32 (5.2%) | 24 (4.1%) |
| 9:00 AM to 9:59 AM | 16 (2.6%) | 127 (21.8%) |
| 10:00 AM to 10:59 AM | 0 (0.0%) | 31 (5.3%) |
| 11:00 AM to 11:59 AM | 0 (0.0%) | 0 (0.0%) |
| 12:00 PM to 3:59 PM | 43 (7.0%) | 42 (7.2%) |
| 4:00 PM to 11:59 PM | 24 (3.9%) | 59 (10.1%) |
| Total | 614 (100.0%) | 582 (100.0%) |
Housing Occupancy in Sharpes
Occupancy by Ownership in Sharpes
Of the total 1,149 dwellings in Sharpes, owner-occupied units account for 785 (68.3%), while renter-occupied units make up 364 (31.7%).
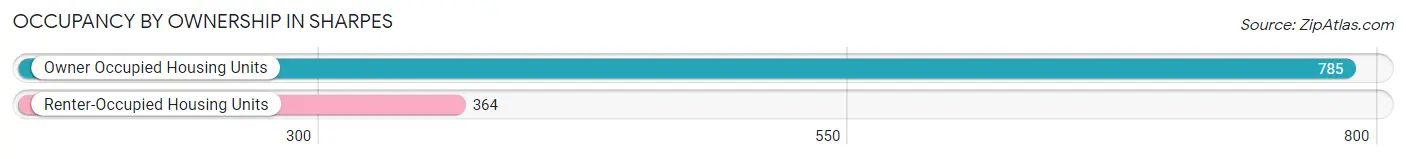
| Occupancy | # Housing Units | % Housing Units |
| Owner Occupied Housing Units | 785 | 68.3% |
| Renter-Occupied Housing Units | 364 | 31.7% |
| Total Occupied Housing Units | 1,149 | 100.0% |
Occupancy by Household Size in Sharpes
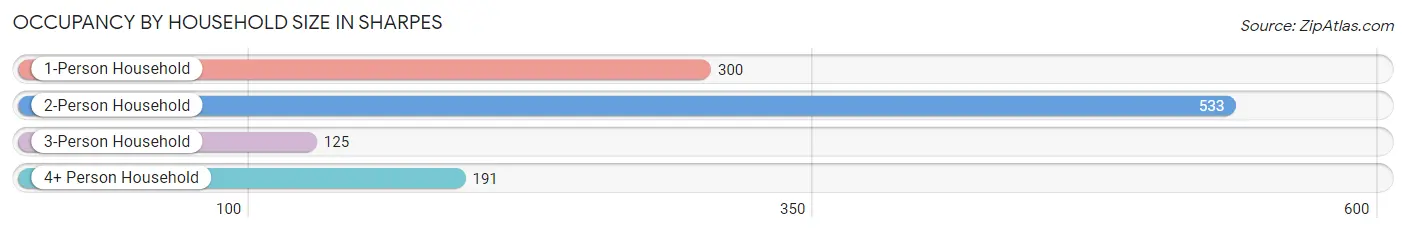
| Household Size | # Housing Units | % Housing Units |
| 1-Person Household | 300 | 26.1% |
| 2-Person Household | 533 | 46.4% |
| 3-Person Household | 125 | 10.9% |
| 4+ Person Household | 191 | 16.6% |
| Total Housing Units | 1,149 | 100.0% |
Occupancy by Ownership by Household Size in Sharpes
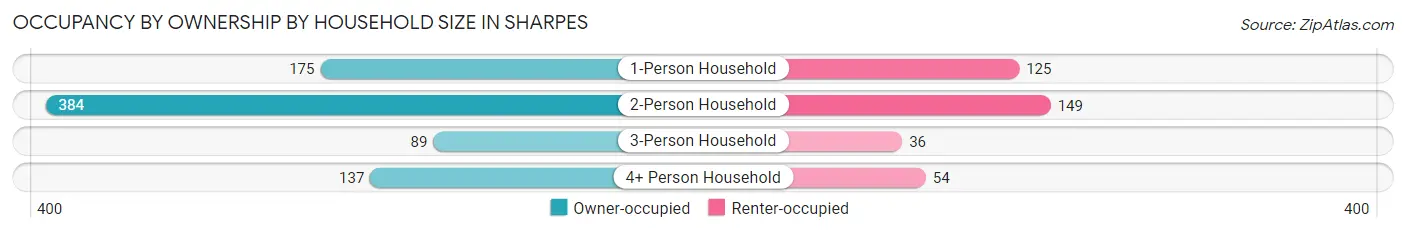
| Household Size | Owner-occupied | Renter-occupied |
| 1-Person Household | 175 (58.3%) | 125 (41.7%) |
| 2-Person Household | 384 (72.1%) | 149 (28.0%) |
| 3-Person Household | 89 (71.2%) | 36 (28.8%) |
| 4+ Person Household | 137 (71.7%) | 54 (28.3%) |
| Total Housing Units | 785 (68.3%) | 364 (31.7%) |
Occupancy by Educational Attainment in Sharpes
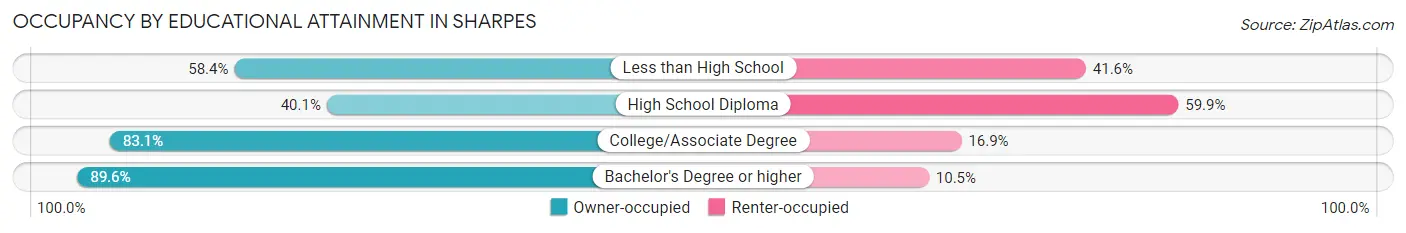
| Household Size | Owner-occupied | Renter-occupied |
| Less than High School | 52 (58.4%) | 37 (41.6%) |
| High School Diploma | 154 (40.1%) | 230 (59.9%) |
| College/Associate Degree | 339 (83.1%) | 69 (16.9%) |
| Bachelor's Degree or higher | 240 (89.5%) | 28 (10.4%) |
Occupancy by Age of Householder in Sharpes
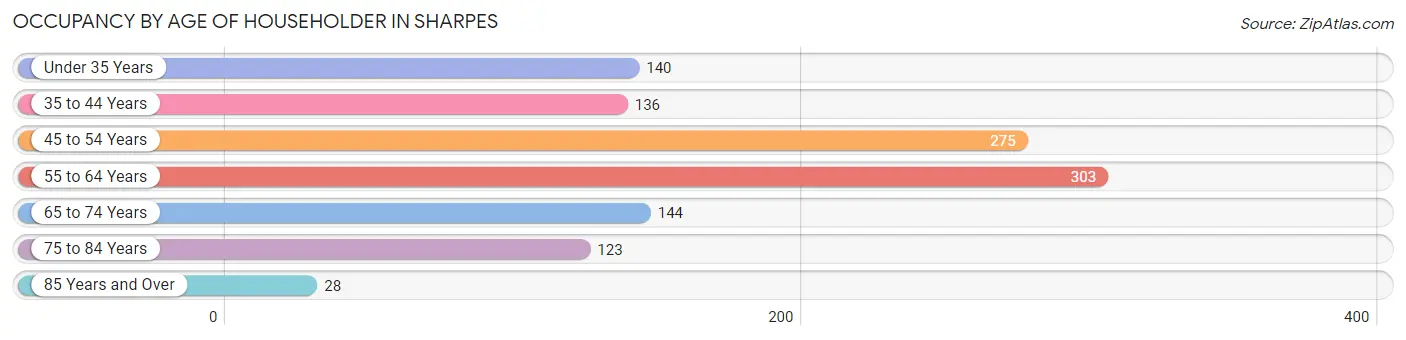
| Age Bracket | # Households | % Households |
| Under 35 Years | 140 | 12.2% |
| 35 to 44 Years | 136 | 11.8% |
| 45 to 54 Years | 275 | 23.9% |
| 55 to 64 Years | 303 | 26.4% |
| 65 to 74 Years | 144 | 12.5% |
| 75 to 84 Years | 123 | 10.7% |
| 85 Years and Over | 28 | 2.4% |
| Total | 1,149 | 100.0% |
Housing Finances in Sharpes
Median Income by Occupancy in Sharpes
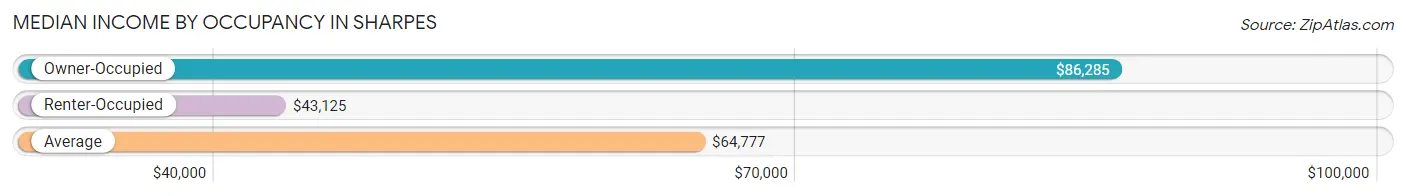
| Occupancy Type | # Households | Median Income |
| Owner-Occupied | 785 (68.3%) | $86,285 |
| Renter-Occupied | 364 (31.7%) | $43,125 |
| Average | 1,149 (100.0%) | $64,777 |
Occupancy by Householder Income Bracket in Sharpes
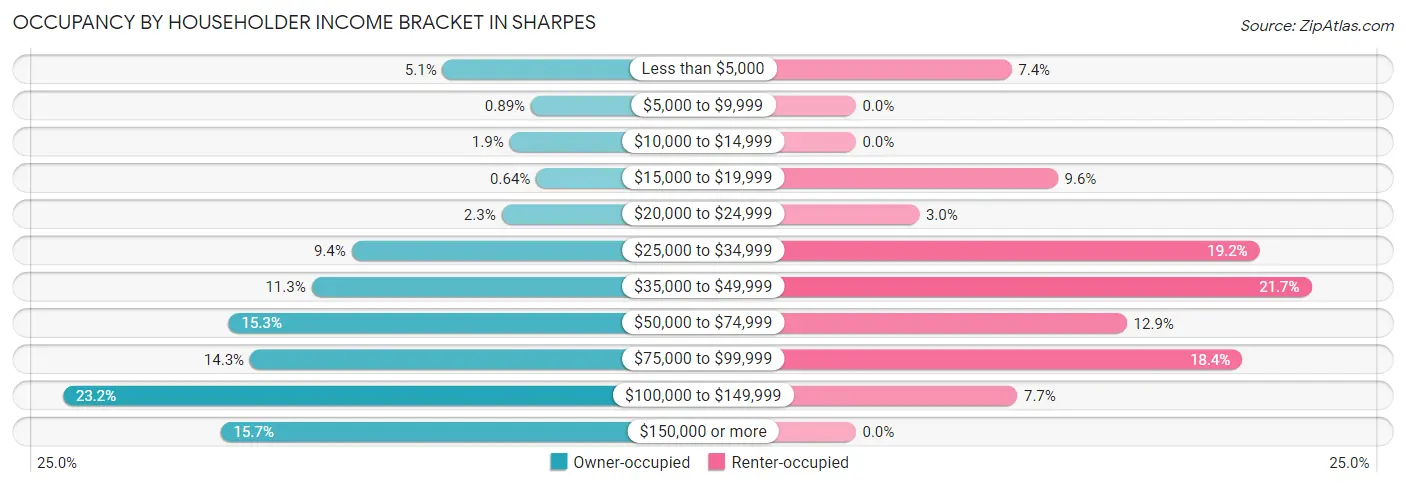
| Income Bracket | Owner-occupied | Renter-occupied |
| Less than $5,000 | 40 (5.1%) | 27 (7.4%) |
| $5,000 to $9,999 | 7 (0.9%) | 0 (0.0%) |
| $10,000 to $14,999 | 15 (1.9%) | 0 (0.0%) |
| $15,000 to $19,999 | 5 (0.6%) | 35 (9.6%) |
| $20,000 to $24,999 | 18 (2.3%) | 11 (3.0%) |
| $25,000 to $34,999 | 74 (9.4%) | 70 (19.2%) |
| $35,000 to $49,999 | 89 (11.3%) | 79 (21.7%) |
| $50,000 to $74,999 | 120 (15.3%) | 47 (12.9%) |
| $75,000 to $99,999 | 112 (14.3%) | 67 (18.4%) |
| $100,000 to $149,999 | 182 (23.2%) | 28 (7.7%) |
| $150,000 or more | 123 (15.7%) | 0 (0.0%) |
| Total | 785 (100.0%) | 364 (100.0%) |
Monthly Housing Cost Tiers in Sharpes
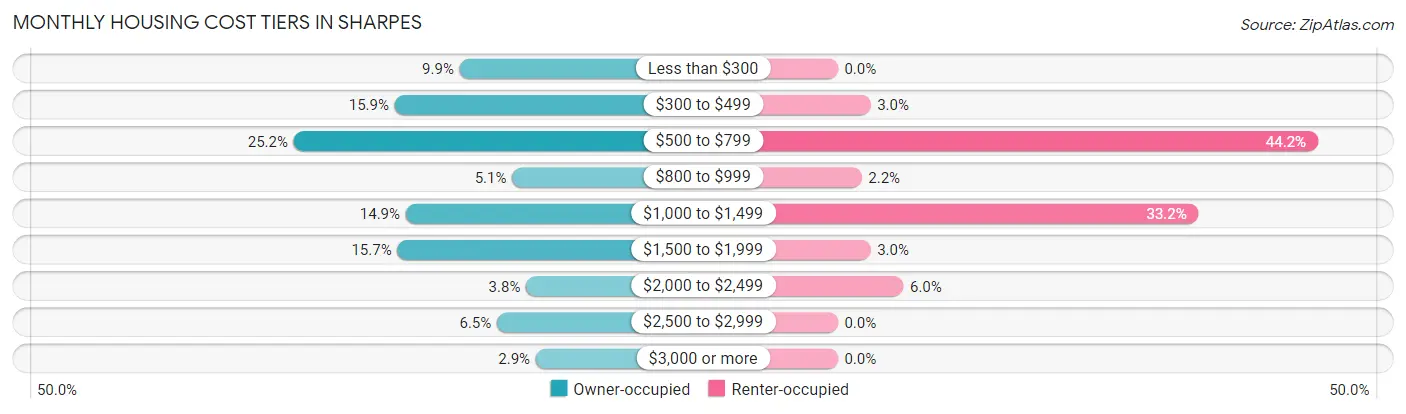
| Monthly Cost | Owner-occupied | Renter-occupied |
| Less than $300 | 78 (9.9%) | 0 (0.0%) |
| $300 to $499 | 125 (15.9%) | 11 (3.0%) |
| $500 to $799 | 198 (25.2%) | 161 (44.2%) |
| $800 to $999 | 40 (5.1%) | 8 (2.2%) |
| $1,000 to $1,499 | 117 (14.9%) | 121 (33.2%) |
| $1,500 to $1,999 | 123 (15.7%) | 11 (3.0%) |
| $2,000 to $2,499 | 30 (3.8%) | 22 (6.0%) |
| $2,500 to $2,999 | 51 (6.5%) | 0 (0.0%) |
| $3,000 or more | 23 (2.9%) | 0 (0.0%) |
| Total | 785 (100.0%) | 364 (100.0%) |
Physical Housing Characteristics in Sharpes
Housing Structures in Sharpes
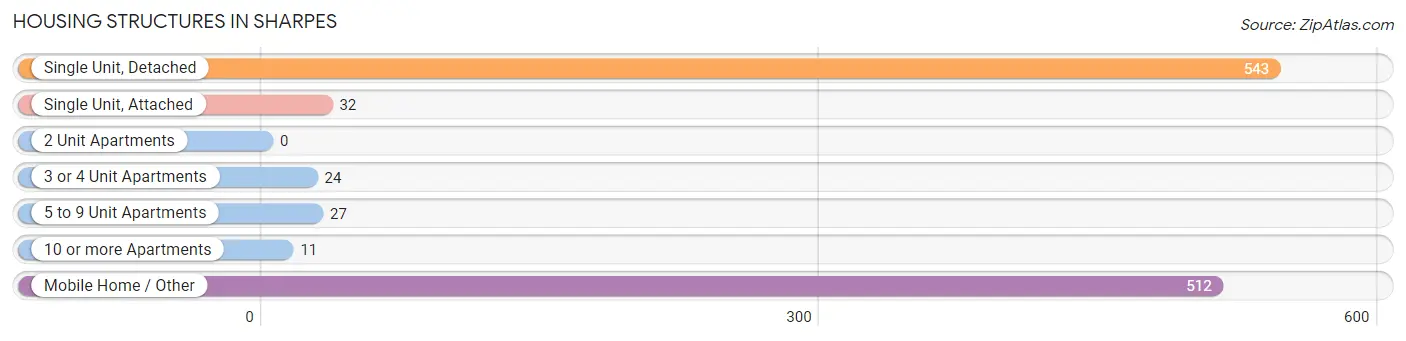
| Structure Type | # Housing Units | % Housing Units |
| Single Unit, Detached | 543 | 47.3% |
| Single Unit, Attached | 32 | 2.8% |
| 2 Unit Apartments | 0 | 0.0% |
| 3 or 4 Unit Apartments | 24 | 2.1% |
| 5 to 9 Unit Apartments | 27 | 2.4% |
| 10 or more Apartments | 11 | 1.0% |
| Mobile Home / Other | 512 | 44.6% |
| Total | 1,149 | 100.0% |
Housing Structures by Occupancy in Sharpes
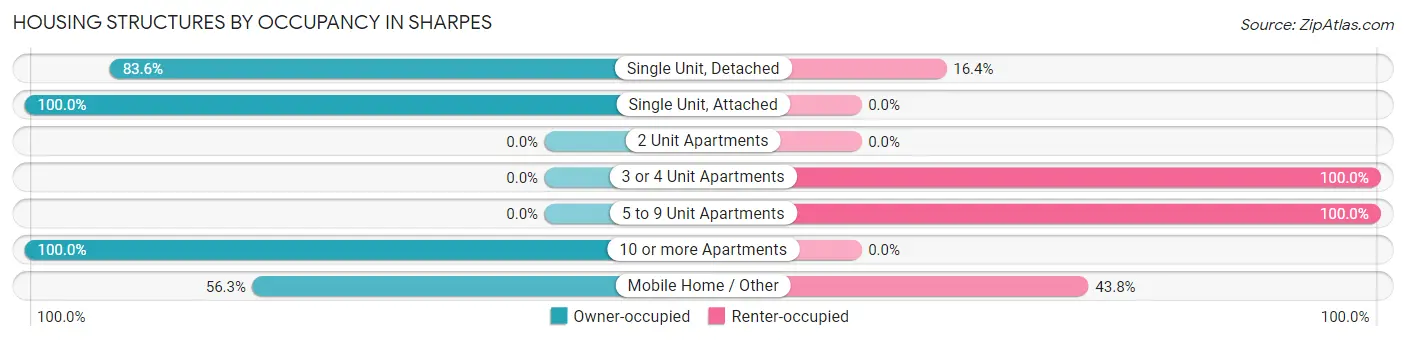
| Structure Type | Owner-occupied | Renter-occupied |
| Single Unit, Detached | 454 (83.6%) | 89 (16.4%) |
| Single Unit, Attached | 32 (100.0%) | 0 (0.0%) |
| 2 Unit Apartments | 0 (0.0%) | 0 (0.0%) |
| 3 or 4 Unit Apartments | 0 (0.0%) | 24 (100.0%) |
| 5 to 9 Unit Apartments | 0 (0.0%) | 27 (100.0%) |
| 10 or more Apartments | 11 (100.0%) | 0 (0.0%) |
| Mobile Home / Other | 288 (56.2%) | 224 (43.8%) |
| Total | 785 (68.3%) | 364 (31.7%) |
Housing Structures by Number of Rooms in Sharpes
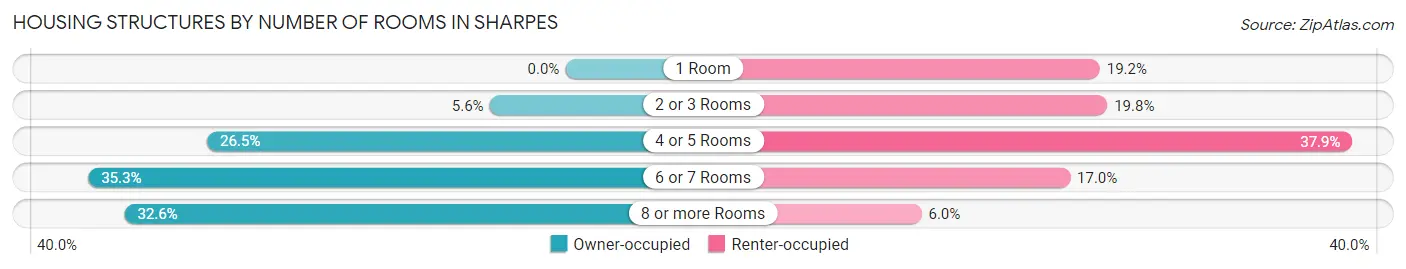
| Number of Rooms | Owner-occupied | Renter-occupied |
| 1 Room | 0 (0.0%) | 70 (19.2%) |
| 2 or 3 Rooms | 44 (5.6%) | 72 (19.8%) |
| 4 or 5 Rooms | 208 (26.5%) | 138 (37.9%) |
| 6 or 7 Rooms | 277 (35.3%) | 62 (17.0%) |
| 8 or more Rooms | 256 (32.6%) | 22 (6.0%) |
| Total | 785 (100.0%) | 364 (100.0%) |
Housing Structure by Heating Type in Sharpes
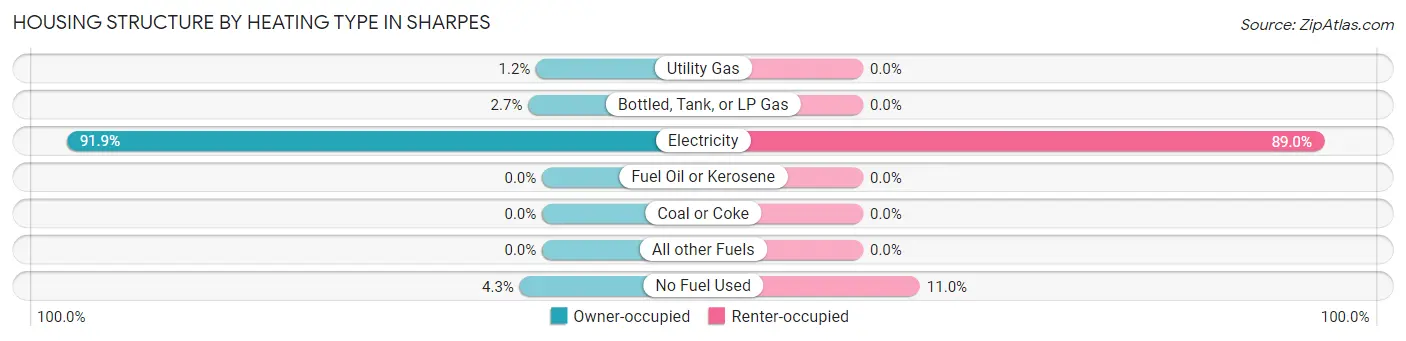
| Heating Type | Owner-occupied | Renter-occupied |
| Utility Gas | 9 (1.1%) | 0 (0.0%) |
| Bottled, Tank, or LP Gas | 21 (2.7%) | 0 (0.0%) |
| Electricity | 721 (91.8%) | 324 (89.0%) |
| Fuel Oil or Kerosene | 0 (0.0%) | 0 (0.0%) |
| Coal or Coke | 0 (0.0%) | 0 (0.0%) |
| All other Fuels | 0 (0.0%) | 0 (0.0%) |
| No Fuel Used | 34 (4.3%) | 40 (11.0%) |
| Total | 785 (100.0%) | 364 (100.0%) |
Household Vehicle Usage in Sharpes
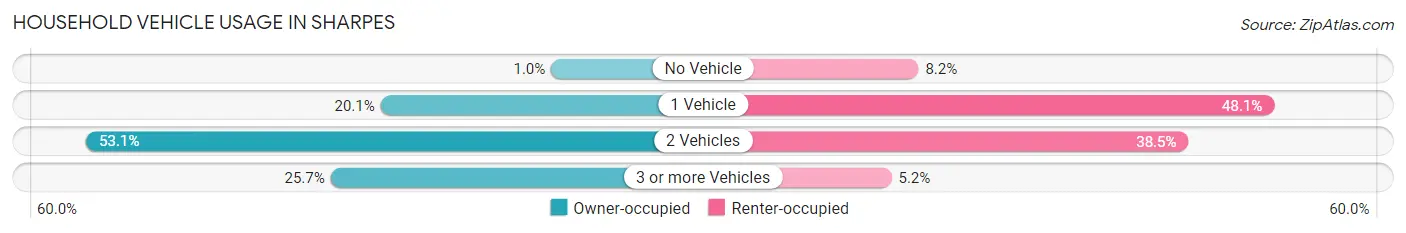
| Vehicles per Household | Owner-occupied | Renter-occupied |
| No Vehicle | 8 (1.0%) | 30 (8.2%) |
| 1 Vehicle | 158 (20.1%) | 175 (48.1%) |
| 2 Vehicles | 417 (53.1%) | 140 (38.5%) |
| 3 or more Vehicles | 202 (25.7%) | 19 (5.2%) |
| Total | 785 (100.0%) | 364 (100.0%) |
Real Estate & Mortgages in Sharpes
Real Estate and Mortgage Overview in Sharpes
| Characteristic | Without Mortgage | With Mortgage |
| Housing Units | 414 | 371 |
| Median Property Value | - | - |
| Median Household Income | $52,214 | $67 |
| Monthly Housing Costs | $521 | $23 |
| Real Estate Taxes | $1,948 | $36 |
Property Value by Mortgage Status in Sharpes
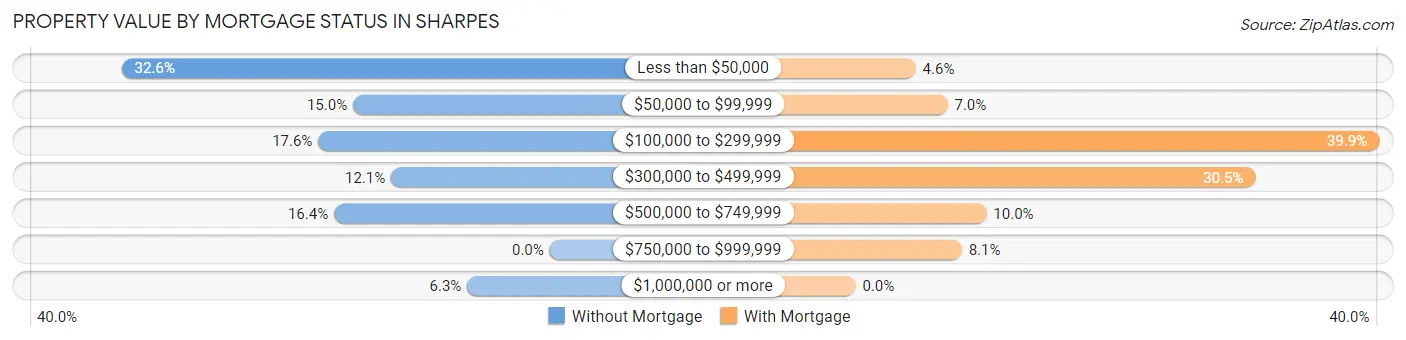
| Property Value | Without Mortgage | With Mortgage |
| Less than $50,000 | 135 (32.6%) | 17 (4.6%) |
| $50,000 to $99,999 | 62 (15.0%) | 26 (7.0%) |
| $100,000 to $299,999 | 73 (17.6%) | 148 (39.9%) |
| $300,000 to $499,999 | 50 (12.1%) | 113 (30.5%) |
| $500,000 to $749,999 | 68 (16.4%) | 37 (10.0%) |
| $750,000 to $999,999 | 0 (0.0%) | 30 (8.1%) |
| $1,000,000 or more | 26 (6.3%) | 0 (0.0%) |
| Total | 414 (100.0%) | 371 (100.0%) |
Household Income by Mortgage Status in Sharpes
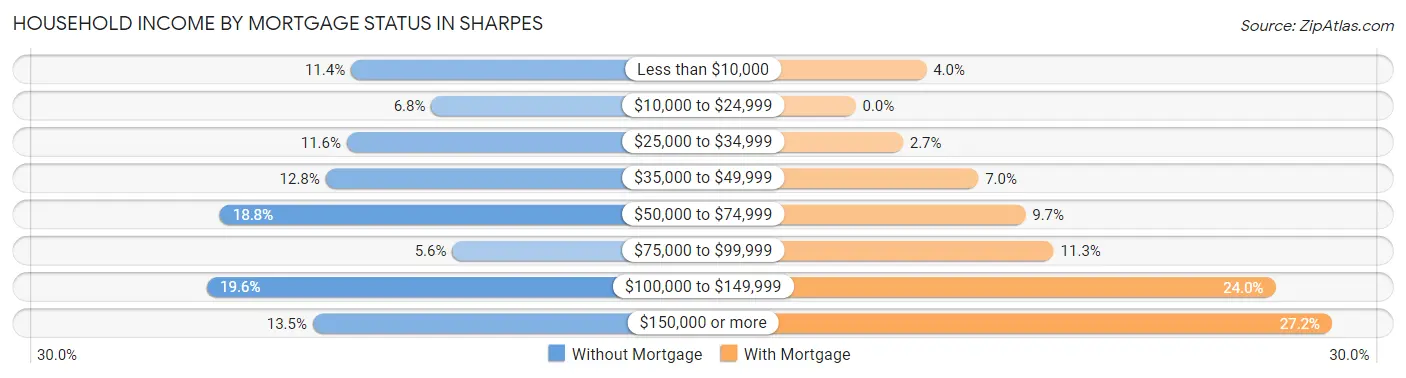
| Household Income | Without Mortgage | With Mortgage |
| Less than $10,000 | 47 (11.4%) | 15 (4.0%) |
| $10,000 to $24,999 | 28 (6.8%) | 0 (0.0%) |
| $25,000 to $34,999 | 48 (11.6%) | 10 (2.7%) |
| $35,000 to $49,999 | 53 (12.8%) | 26 (7.0%) |
| $50,000 to $74,999 | 78 (18.8%) | 36 (9.7%) |
| $75,000 to $99,999 | 23 (5.6%) | 42 (11.3%) |
| $100,000 to $149,999 | 81 (19.6%) | 89 (24.0%) |
| $150,000 or more | 56 (13.5%) | 101 (27.2%) |
| Total | 414 (100.0%) | 371 (100.0%) |
Property Value to Household Income Ratio in Sharpes
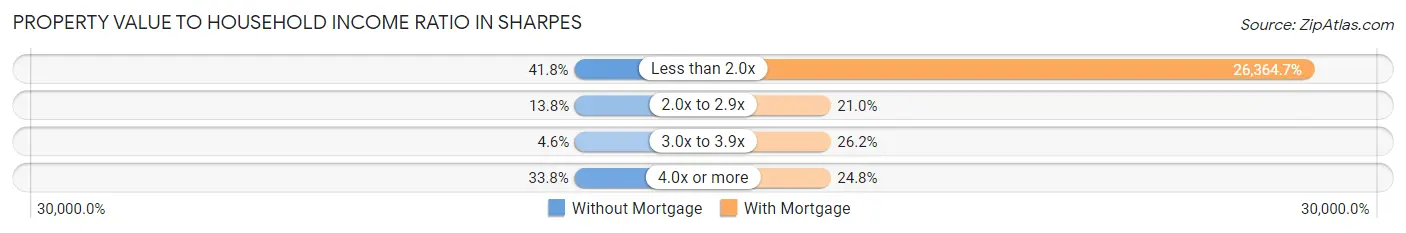
| Value-to-Income Ratio | Without Mortgage | With Mortgage |
| Less than 2.0x | 173 (41.8%) | 97,813 (26,364.7%) |
| 2.0x to 2.9x | 57 (13.8%) | 78 (21.0%) |
| 3.0x to 3.9x | 19 (4.6%) | 97 (26.2%) |
| 4.0x or more | 140 (33.8%) | 92 (24.8%) |
| Total | 414 (100.0%) | 371 (100.0%) |
Real Estate Taxes by Mortgage Status in Sharpes
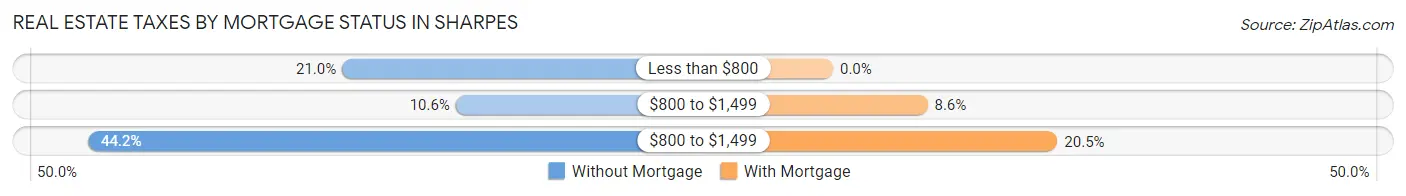
| Property Taxes | Without Mortgage | With Mortgage |
| Less than $800 | 87 (21.0%) | 0 (0.0%) |
| $800 to $1,499 | 44 (10.6%) | 32 (8.6%) |
| $800 to $1,499 | 183 (44.2%) | 76 (20.5%) |
| Total | 414 (100.0%) | 371 (100.0%) |
Health & Disability in Sharpes
Health Insurance Coverage by Age in Sharpes
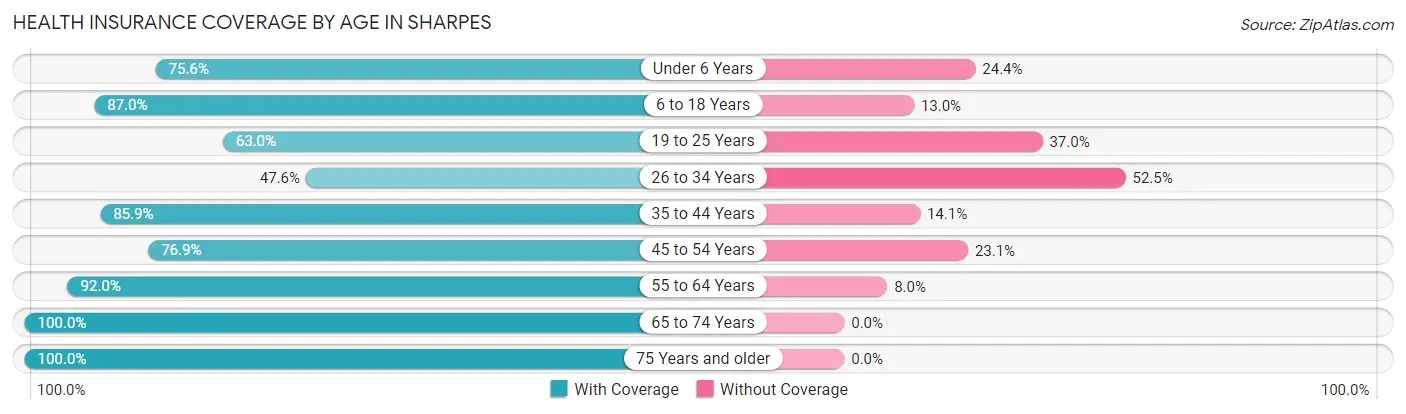
| Age Bracket | With Coverage | Without Coverage |
| Under 6 Years | 34 (75.6%) | 11 (24.4%) |
| 6 to 18 Years | 288 (87.0%) | 43 (13.0%) |
| 19 to 25 Years | 116 (63.0%) | 68 (37.0%) |
| 26 to 34 Years | 155 (47.5%) | 171 (52.4%) |
| 35 to 44 Years | 274 (85.9%) | 45 (14.1%) |
| 45 to 54 Years | 337 (76.9%) | 101 (23.1%) |
| 55 to 64 Years | 598 (92.0%) | 52 (8.0%) |
| 65 to 74 Years | 262 (100.0%) | 0 (0.0%) |
| 75 Years and older | 257 (100.0%) | 0 (0.0%) |
| Total | 2,321 (82.5%) | 491 (17.5%) |
Health Insurance Coverage by Citizenship Status in Sharpes
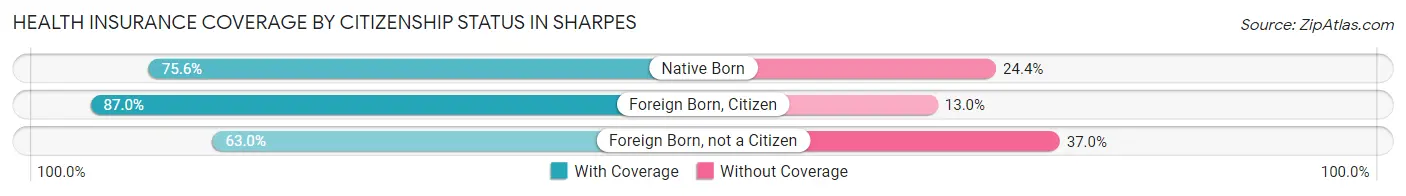
| Citizenship Status | With Coverage | Without Coverage |
| Native Born | 34 (75.6%) | 11 (24.4%) |
| Foreign Born, Citizen | 288 (87.0%) | 43 (13.0%) |
| Foreign Born, not a Citizen | 116 (63.0%) | 68 (37.0%) |
Health Insurance Coverage by Household Income in Sharpes
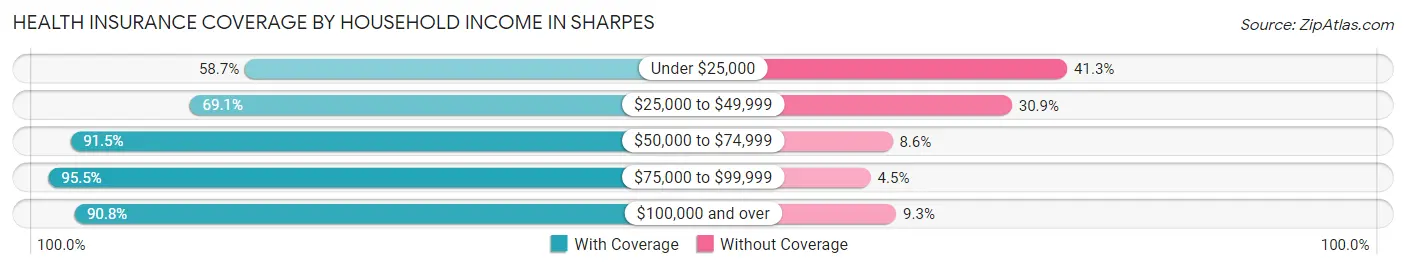
| Household Income | With Coverage | Without Coverage |
| Under $25,000 | 155 (58.7%) | 109 (41.3%) |
| $25,000 to $49,999 | 534 (69.1%) | 239 (30.9%) |
| $50,000 to $74,999 | 396 (91.4%) | 37 (8.6%) |
| $75,000 to $99,999 | 363 (95.5%) | 17 (4.5%) |
| $100,000 and over | 873 (90.7%) | 89 (9.2%) |
Public vs Private Health Insurance Coverage by Age in Sharpes
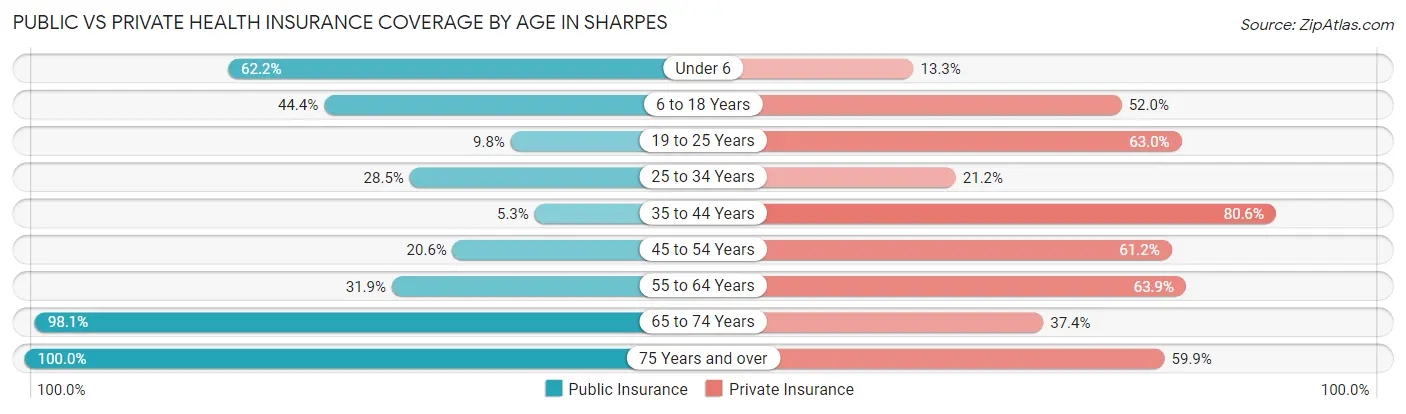
| Age Bracket | Public Insurance | Private Insurance |
| Under 6 | 28 (62.2%) | 6 (13.3%) |
| 6 to 18 Years | 147 (44.4%) | 172 (52.0%) |
| 19 to 25 Years | 18 (9.8%) | 116 (63.0%) |
| 25 to 34 Years | 93 (28.5%) | 69 (21.2%) |
| 35 to 44 Years | 17 (5.3%) | 257 (80.6%) |
| 45 to 54 Years | 90 (20.5%) | 268 (61.2%) |
| 55 to 64 Years | 207 (31.9%) | 415 (63.8%) |
| 65 to 74 Years | 257 (98.1%) | 98 (37.4%) |
| 75 Years and over | 257 (100.0%) | 154 (59.9%) |
| Total | 1,114 (39.6%) | 1,555 (55.3%) |
Disability Status by Sex by Age in Sharpes
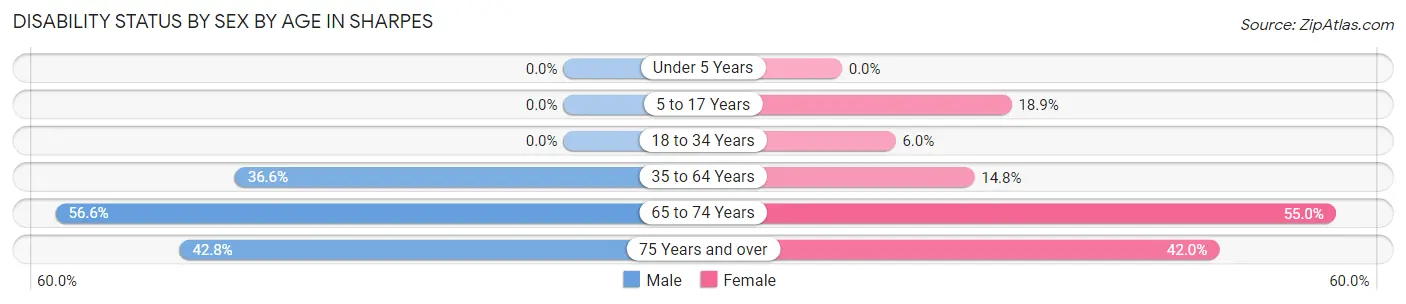
| Age Bracket | Male | Female |
| Under 5 Years | 0 (0.0%) | 0 (0.0%) |
| 5 to 17 Years | 0 (0.0%) | 31 (18.9%) |
| 18 to 34 Years | 0 (0.0%) | 18 (6.0%) |
| 35 to 64 Years | 262 (36.6%) | 102 (14.8%) |
| 65 to 74 Years | 69 (56.6%) | 77 (55.0%) |
| 75 Years and over | 59 (42.7%) | 50 (42.0%) |
Disability Class by Sex by Age in Sharpes
Disability Class: Hearing Difficulty
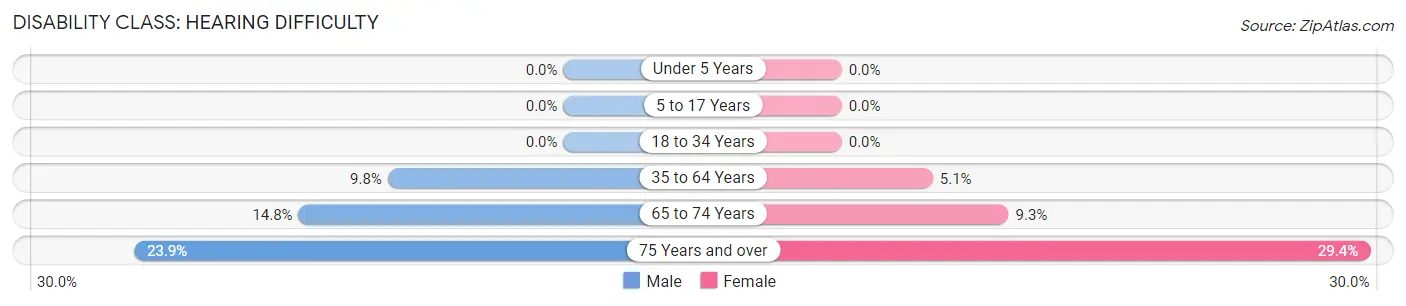
| Age Bracket | Male | Female |
| Under 5 Years | 0 (0.0%) | 0 (0.0%) |
| 5 to 17 Years | 0 (0.0%) | 0 (0.0%) |
| 18 to 34 Years | 0 (0.0%) | 0 (0.0%) |
| 35 to 64 Years | 70 (9.8%) | 35 (5.1%) |
| 65 to 74 Years | 18 (14.7%) | 13 (9.3%) |
| 75 Years and over | 33 (23.9%) | 35 (29.4%) |
Disability Class: Vision Difficulty
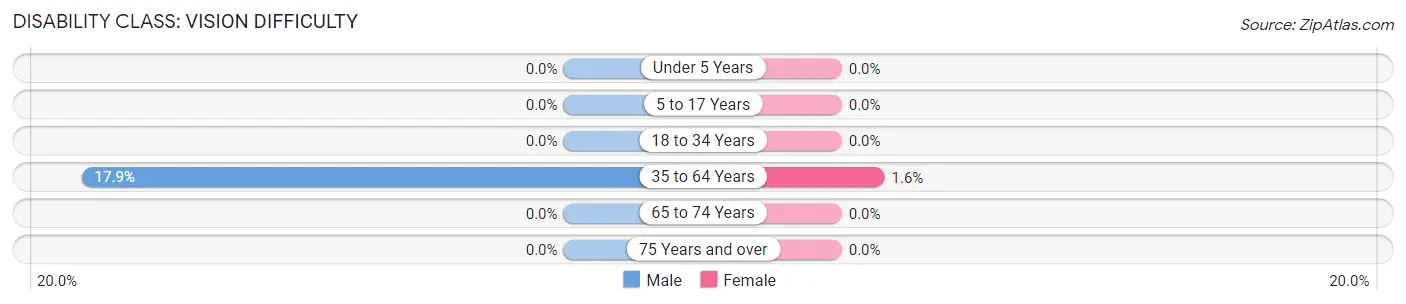
| Age Bracket | Male | Female |
| Under 5 Years | 0 (0.0%) | 0 (0.0%) |
| 5 to 17 Years | 0 (0.0%) | 0 (0.0%) |
| 18 to 34 Years | 0 (0.0%) | 0 (0.0%) |
| 35 to 64 Years | 128 (17.9%) | 11 (1.6%) |
| 65 to 74 Years | 0 (0.0%) | 0 (0.0%) |
| 75 Years and over | 0 (0.0%) | 0 (0.0%) |
Disability Class: Cognitive Difficulty
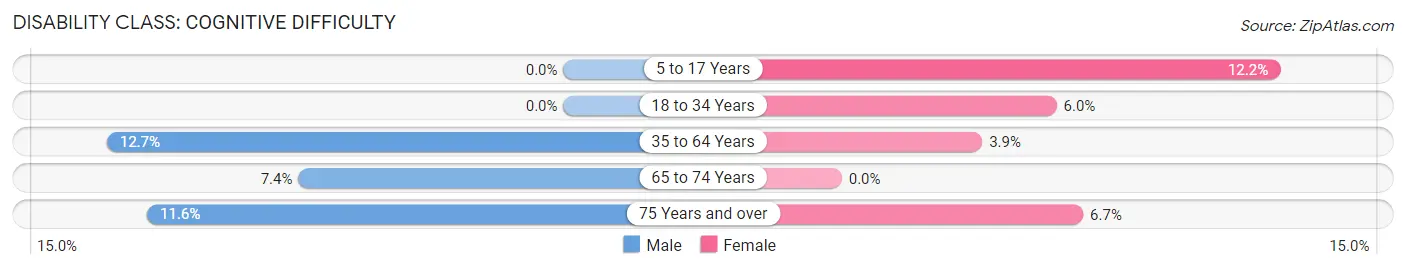
| Age Bracket | Male | Female |
| 5 to 17 Years | 0 (0.0%) | 20 (12.2%) |
| 18 to 34 Years | 0 (0.0%) | 18 (6.0%) |
| 35 to 64 Years | 91 (12.7%) | 27 (3.9%) |
| 65 to 74 Years | 9 (7.4%) | 0 (0.0%) |
| 75 Years and over | 16 (11.6%) | 8 (6.7%) |
Disability Class: Ambulatory Difficulty
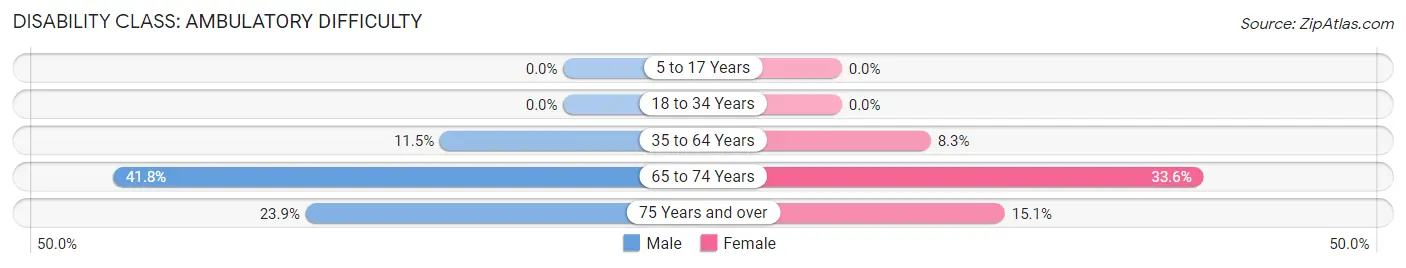
| Age Bracket | Male | Female |
| 5 to 17 Years | 0 (0.0%) | 0 (0.0%) |
| 18 to 34 Years | 0 (0.0%) | 0 (0.0%) |
| 35 to 64 Years | 82 (11.5%) | 57 (8.3%) |
| 65 to 74 Years | 51 (41.8%) | 47 (33.6%) |
| 75 Years and over | 33 (23.9%) | 18 (15.1%) |
Disability Class: Self-Care Difficulty
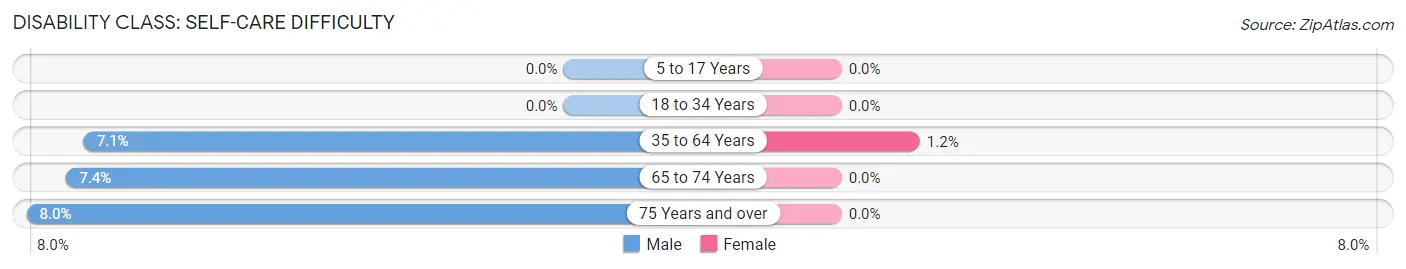
| Age Bracket | Male | Female |
| 5 to 17 Years | 0 (0.0%) | 0 (0.0%) |
| 18 to 34 Years | 0 (0.0%) | 0 (0.0%) |
| 35 to 64 Years | 51 (7.1%) | 8 (1.2%) |
| 65 to 74 Years | 9 (7.4%) | 0 (0.0%) |
| 75 Years and over | 11 (8.0%) | 0 (0.0%) |
Technology Access in Sharpes
Computing Device Access in Sharpes
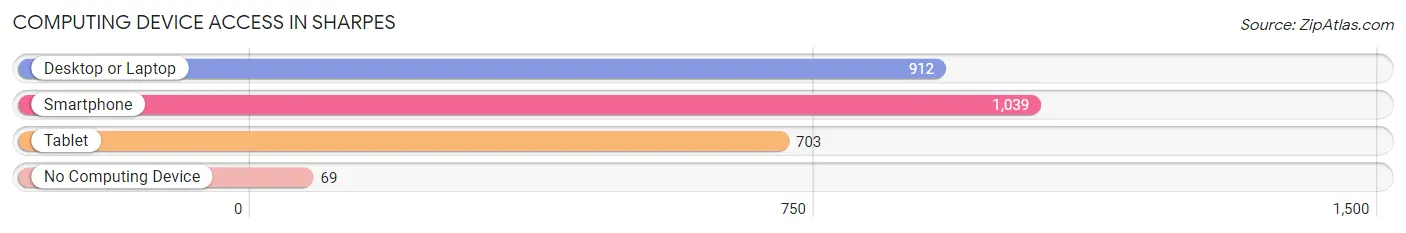
| Device Type | # Households | % Households |
| Desktop or Laptop | 912 | 79.4% |
| Smartphone | 1,039 | 90.4% |
| Tablet | 703 | 61.2% |
| No Computing Device | 69 | 6.0% |
| Total | 1,149 | 100.0% |
Internet Access in Sharpes
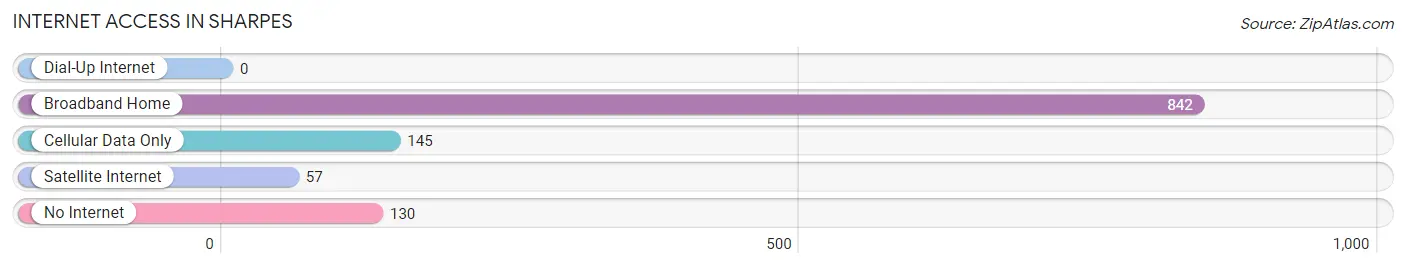
| Internet Type | # Households | % Households |
| Dial-Up Internet | 0 | 0.0% |
| Broadband Home | 842 | 73.3% |
| Cellular Data Only | 145 | 12.6% |
| Satellite Internet | 57 | 5.0% |
| No Internet | 130 | 11.3% |
| Total | 1,149 | 100.0% |
Sharpes Summary
Sharpes is an unincorporated community located in Brevard County, Florida, United States. It is located on the east coast of the state, approximately 20 miles south of the city of Melbourne. The population of Sharpes was estimated to be 1,845 in 2019.
History
The area now known as Sharpes was originally inhabited by the Ais Indians, who were part of the Seminole tribe. The Ais Indians were known for their fishing and hunting skills, and they lived in the area for centuries before the arrival of European settlers.
The first European settlers arrived in the area in the late 1800s. The area was named after Captain William Sharp, who was a British naval officer who served in the American Revolution. He was granted a large tract of land in the area in 1824.
The area was sparsely populated until the early 1900s, when the Florida East Coast Railway was built through the area. This brought an influx of new settlers to the area, and the population began to grow.
Geography
Sharpes is located in Brevard County, Florida, on the east coast of the state. It is located approximately 20 miles south of the city of Melbourne. The area is mostly flat, with some low hills and wetlands. The climate is humid subtropical, with hot, humid summers and mild winters.
The area is home to several parks and nature preserves, including the Merritt Island National Wildlife Refuge, the Canaveral National Seashore, and the Archie Carr National Wildlife Refuge.
Economy
The economy of Sharpes is largely based on tourism and agriculture. The area is home to several tourist attractions, including the Kennedy Space Center, the Merritt Island National Wildlife Refuge, and the Canaveral National Seashore.
Agriculture is also an important part of the local economy. The area is home to several farms, which produce a variety of crops, including citrus fruits, vegetables, and hay.
Demographics
The population of Sharpes was estimated to be 1,845 in 2019. The population is mostly white (90.3%), with a small percentage of African Americans (4.2%), Hispanics (3.2%), and Asians (1.3%). The median household income is $45,845, and the median home value is $164,400.
The area is served by the Brevard County School District, which includes several elementary, middle, and high schools. The area is also home to several colleges and universities, including the University of Central Florida, Florida Institute of Technology, and Eastern Florida State College.
Conclusion
Sharpes is an unincorporated community located in Brevard County, Florida. It is located on the east coast of the state, approximately 20 miles south of the city of Melbourne. The population of Sharpes was estimated to be 1,845 in 2019. The area is mostly flat, with some low hills and wetlands. The economy of Sharpes is largely based on tourism and agriculture, and the population is mostly white. The area is served by the Brevard County School District, and is home to several colleges and universities.
Common Questions
What is Per Capita Income in Sharpes?
Per Capita income in Sharpes is $33,796.
What is the Median Family Income in Sharpes?
Median Family Income in Sharpes is $68,625.
What is the Median Household income in Sharpes?
Median Household Income in Sharpes is $64,777.
What is Income or Wage Gap in Sharpes?
Income or Wage Gap in Sharpes is 22.1%.
Women in Sharpes earn 77.9 cents for every dollar earned by a man.
What is Inequality or Gini Index in Sharpes?
Inequality or Gini Index in Sharpes is 0.41.
What is the Total Population of Sharpes?
Total Population of Sharpes is 2,812.
What is the Total Male Population of Sharpes?
Total Male Population of Sharpes is 1,367.
What is the Total Female Population of Sharpes?
Total Female Population of Sharpes is 1,445.
What is the Ratio of Males per 100 Females in Sharpes?
There are 94.60 Males per 100 Females in Sharpes.
What is the Ratio of Females per 100 Males in Sharpes?
There are 105.71 Females per 100 Males in Sharpes.
What is the Median Population Age in Sharpes?
Median Population Age in Sharpes is 51.5 Years.
What is the Average Family Size in Sharpes
Average Family Size in Sharpes is 3.0 People.
What is the Average Household Size in Sharpes
Average Household Size in Sharpes is 2.5 People.
How Large is the Labor Force in Sharpes?
There are 1,469 People in the Labor Forcein in Sharpes.
What is the Percentage of People in the Labor Force in Sharpes?
58.2% of People are in the Labor Force in Sharpes.
What is the Unemployment Rate in Sharpes?
Unemployment Rate in Sharpes is 5.6%.