Ocean Ridge, FL Map & Demographics
Ocean Ridge Map
Ocean Ridge Overview
$126,256
PER CAPITA INCOME
$224,674
AVG FAMILY INCOME
$107,813
AVG HOUSEHOLD INCOME
44.7%
WAGE / INCOME GAP [ % ]
55.3¢/ $1
WAGE / INCOME GAP [ $ ]
0.62
INEQUALITY / GINI INDEX
1,712
TOTAL POPULATION
892
MALE POPULATION
820
FEMALE POPULATION
108.78
MALES / 100 FEMALES
91.93
FEMALES / 100 MALES
60.0
MEDIAN AGE
2.5
AVG FAMILY SIZE
1.9
AVG HOUSEHOLD SIZE
868
LABOR FORCE [ PEOPLE ]
55.8%
PERCENT IN LABOR FORCE
3.5%
UNEMPLOYMENT RATE
Ocean Ridge Area Codes
Income in Ocean Ridge
Income Overview in Ocean Ridge
Per Capita Income in Ocean Ridge is $126,256, while median incomes of families and households are $224,674 and $107,813 respectively.
| Characteristic | Number | Measure |
| Per Capita Income | 1,712 | $126,256 |
| Median Family Income | 492 | $224,674 |
| Mean Family Income | 492 | $352,125 |
| Median Household Income | 891 | $107,813 |
| Mean Household Income | 891 | $238,179 |
| Income Deficit | 492 | $0 |
| Wage / Income Gap (%) | 1,712 | 44.70% |
| Wage / Income Gap ($) | 1,712 | 55.30¢ per $1 |
| Gini / Inequality Index | 1,712 | 0.62 |
Earnings by Sex in Ocean Ridge
Average Earnings in Ocean Ridge are $40,781, $48,942 for men and $27,065 for women, a difference of 44.7%.
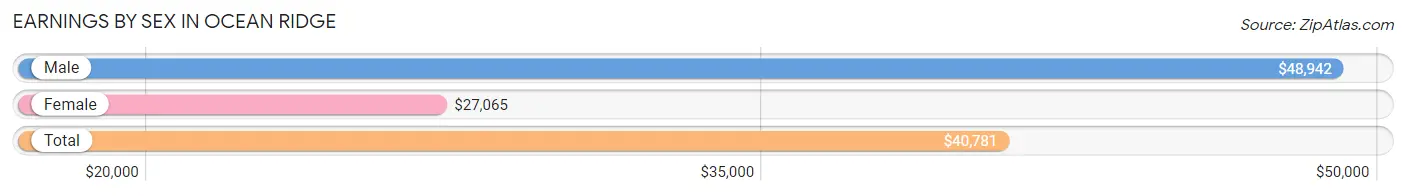
| Sex | Number | Average Earnings |
| Male | 531 (60.7%) | $48,942 |
| Female | 344 (39.3%) | $27,065 |
| Total | 875 (100.0%) | $40,781 |
Earnings by Sex by Income Bracket in Ocean Ridge
The most common earnings brackets in Ocean Ridge are $100,000+ for men (214 | 40.3%) and $100,000+ for women (75 | 21.8%).
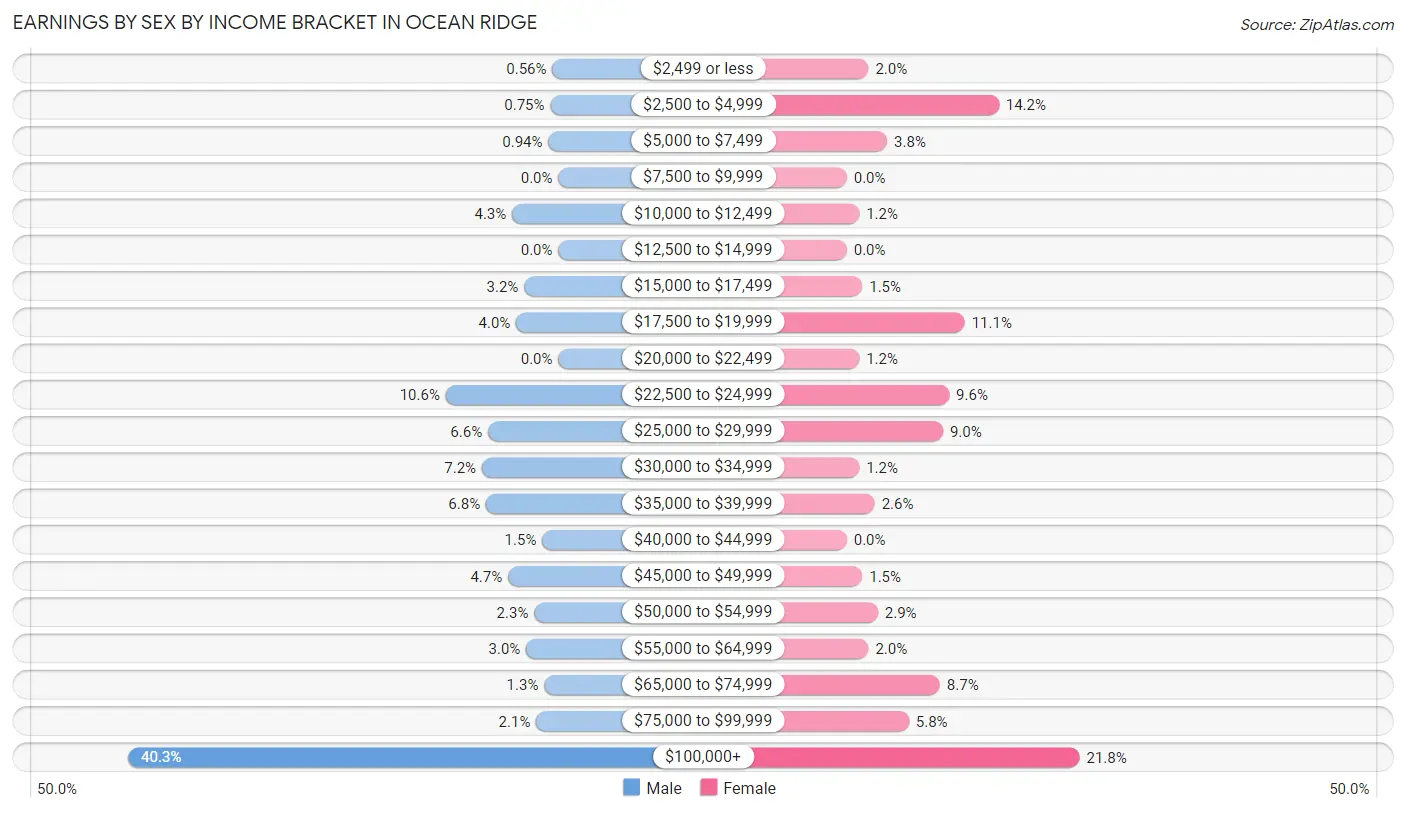
| Income | Male | Female |
| $2,499 or less | 3 (0.6%) | 7 (2.0%) |
| $2,500 to $4,999 | 4 (0.7%) | 49 (14.2%) |
| $5,000 to $7,499 | 5 (0.9%) | 13 (3.8%) |
| $7,500 to $9,999 | 0 (0.0%) | 0 (0.0%) |
| $10,000 to $12,499 | 23 (4.3%) | 4 (1.2%) |
| $12,500 to $14,999 | 0 (0.0%) | 0 (0.0%) |
| $15,000 to $17,499 | 17 (3.2%) | 5 (1.5%) |
| $17,500 to $19,999 | 21 (4.0%) | 38 (11.1%) |
| $20,000 to $22,499 | 0 (0.0%) | 4 (1.2%) |
| $22,500 to $24,999 | 56 (10.5%) | 33 (9.6%) |
| $25,000 to $29,999 | 35 (6.6%) | 31 (9.0%) |
| $30,000 to $34,999 | 38 (7.2%) | 4 (1.2%) |
| $35,000 to $39,999 | 36 (6.8%) | 9 (2.6%) |
| $40,000 to $44,999 | 8 (1.5%) | 0 (0.0%) |
| $45,000 to $49,999 | 25 (4.7%) | 5 (1.5%) |
| $50,000 to $54,999 | 12 (2.3%) | 10 (2.9%) |
| $55,000 to $64,999 | 16 (3.0%) | 7 (2.0%) |
| $65,000 to $74,999 | 7 (1.3%) | 30 (8.7%) |
| $75,000 to $99,999 | 11 (2.1%) | 20 (5.8%) |
| $100,000+ | 214 (40.3%) | 75 (21.8%) |
| Total | 531 (100.0%) | 344 (100.0%) |
Earnings by Sex by Educational Attainment in Ocean Ridge
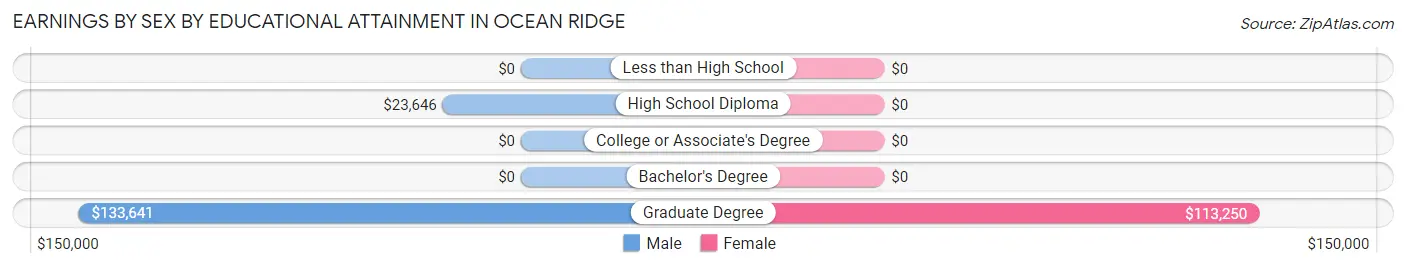
| Educational Attainment | Male Income | Female Income |
| Less than High School | - | - |
| High School Diploma | $23,646 | $0 |
| College or Associate's Degree | - | - |
| Bachelor's Degree | - | - |
| Graduate Degree | $133,641 | $113,250 |
| Total | $64,750 | $0 |
Family Income in Ocean Ridge
Family Income Brackets in Ocean Ridge
According to the Ocean Ridge family income data, there are 278 families falling into the $200,000+ income range, which is the most common income bracket and makes up 56.5% of all families.
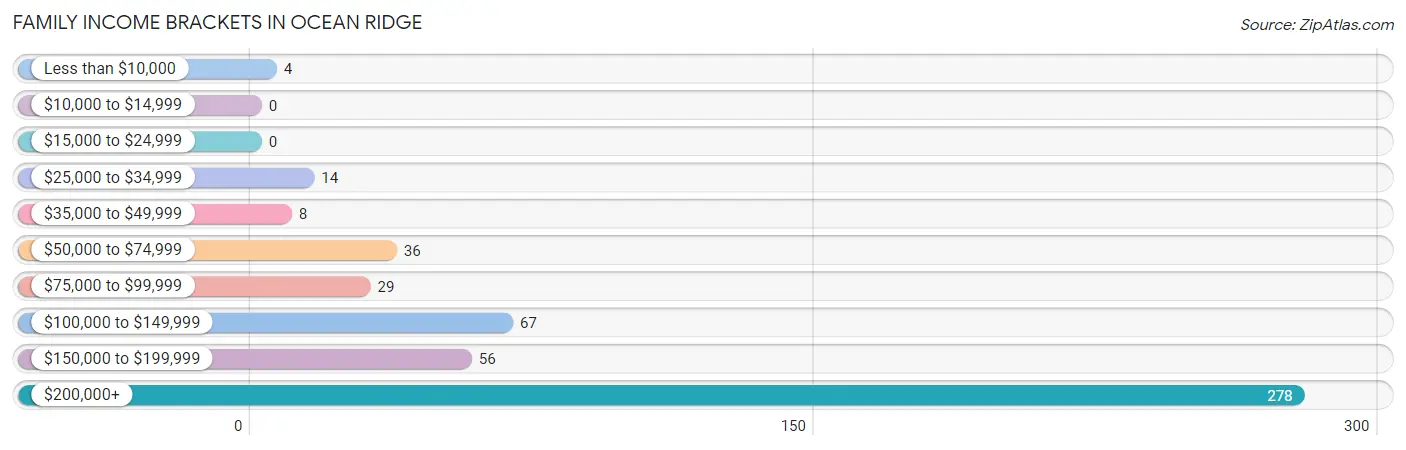
| Income Bracket | # Families | % Families |
| Less than $10,000 | 4 | 0.8% |
| $10,000 to $14,999 | 0 | 0.0% |
| $15,000 to $24,999 | 0 | 0.0% |
| $25,000 to $34,999 | 14 | 2.8% |
| $35,000 to $49,999 | 8 | 1.6% |
| $50,000 to $74,999 | 36 | 7.3% |
| $75,000 to $99,999 | 29 | 5.9% |
| $100,000 to $149,999 | 67 | 13.6% |
| $150,000 to $199,999 | 56 | 11.4% |
| $200,000+ | 278 | 56.5% |
Family Income by Famaliy Size in Ocean Ridge
4-person families (23 | 4.7%) account for the highest median family income in Ocean Ridge with $250,001 per family, while 2-person families (381 | 77.4%) have the highest median income of $116,054 per family member.
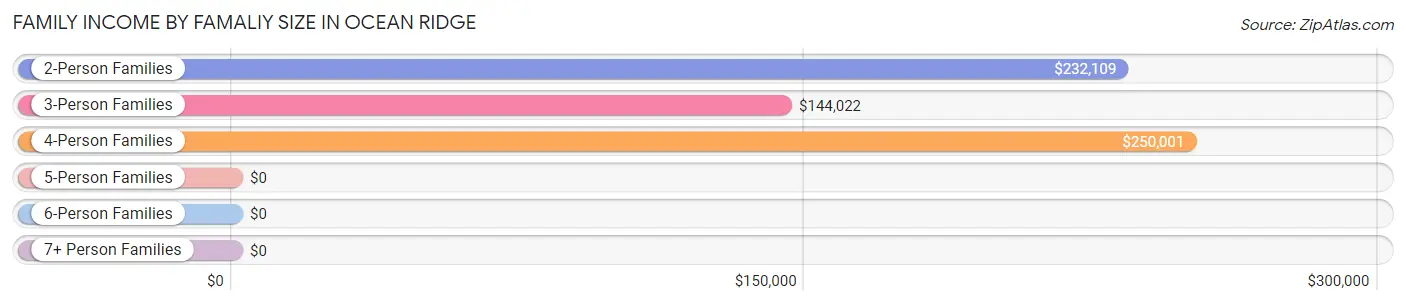
| Income Bracket | # Families | Median Income |
| 2-Person Families | 381 (77.4%) | $232,109 |
| 3-Person Families | 62 (12.6%) | $144,022 |
| 4-Person Families | 23 (4.7%) | $250,001 |
| 5-Person Families | 26 (5.3%) | $0 |
| 6-Person Families | 0 (0.0%) | $0 |
| 7+ Person Families | 0 (0.0%) | $0 |
| Total | 492 (100.0%) | $224,674 |
Family Income by Number of Earners in Ocean Ridge
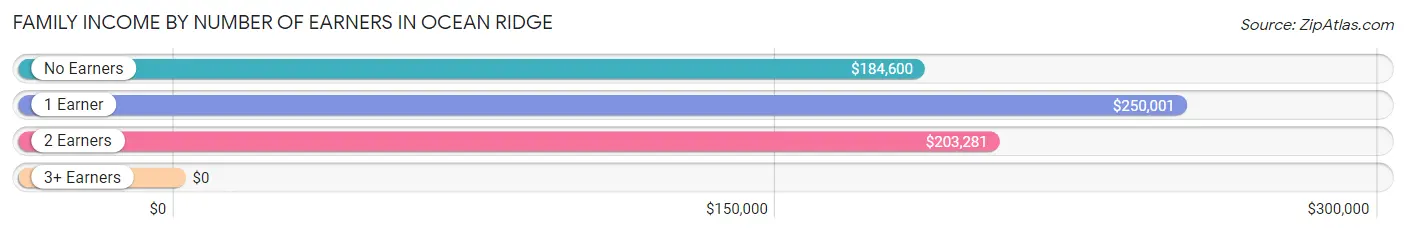
| Number of Earners | # Families | Median Income |
| No Earners | 170 (34.5%) | $184,600 |
| 1 Earner | 164 (33.3%) | $250,001 |
| 2 Earners | 135 (27.4%) | $203,281 |
| 3+ Earners | 23 (4.7%) | $0 |
| Total | 492 (100.0%) | $224,674 |
Household Income in Ocean Ridge
Household Income Brackets in Ocean Ridge
With 312 households falling in the category, the $200,000+ income range is the most frequent in Ocean Ridge, accounting for 35.0% of all households.
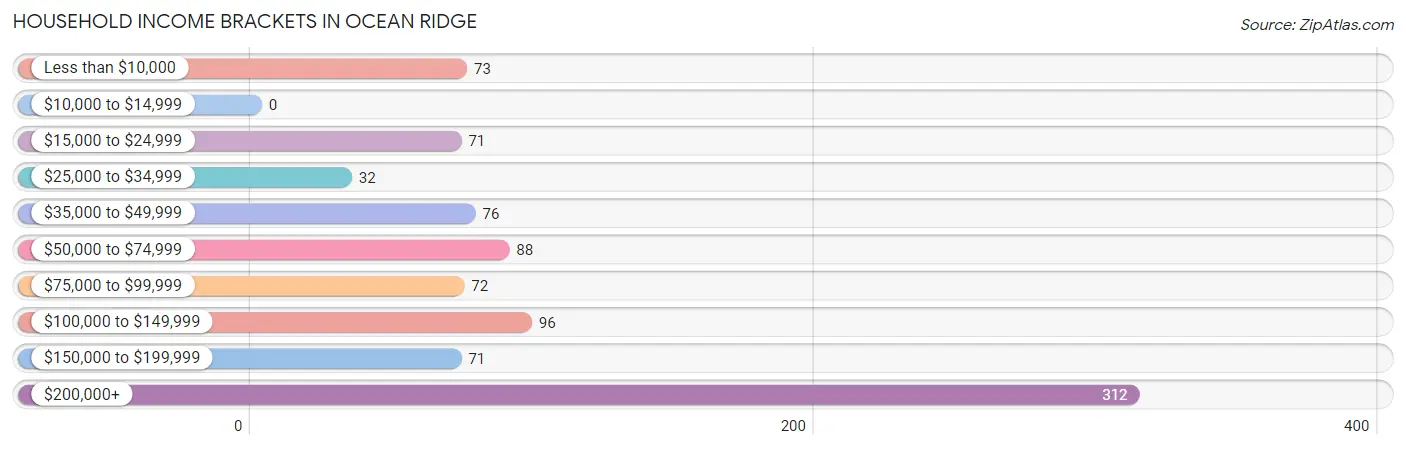
| Income Bracket | # Households | % Households |
| Less than $10,000 | 73 | 8.2% |
| $10,000 to $14,999 | 0 | 0.0% |
| $15,000 to $24,999 | 71 | 8.0% |
| $25,000 to $34,999 | 32 | 3.6% |
| $35,000 to $49,999 | 76 | 8.5% |
| $50,000 to $74,999 | 88 | 9.9% |
| $75,000 to $99,999 | 72 | 8.1% |
| $100,000 to $149,999 | 96 | 10.8% |
| $150,000 to $199,999 | 71 | 8.0% |
| $200,000+ | 312 | 35.0% |
Household Income by Householder Age in Ocean Ridge
The median household income in Ocean Ridge is $107,813, with the highest median household income of $142,989 found in the 65+ years age bracket for the primary householder. A total of 479 households (53.8%) fall into this category.
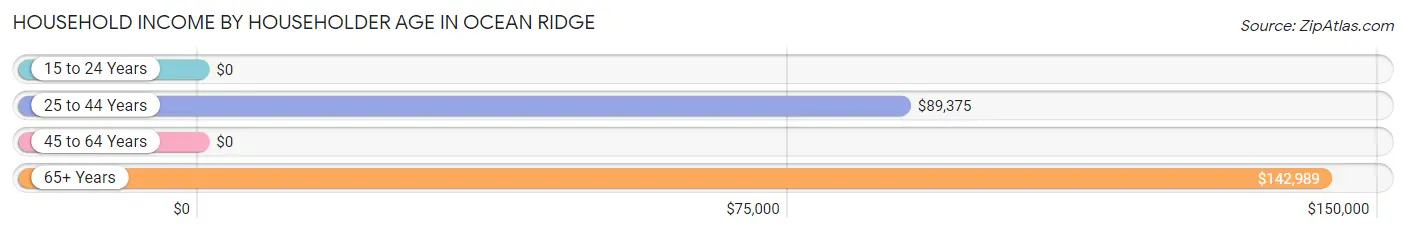
| Income Bracket | # Households | Median Income |
| 15 to 24 Years | 0 (0.0%) | $0 |
| 25 to 44 Years | 62 (7.0%) | $89,375 |
| 45 to 64 Years | 350 (39.3%) | $0 |
| 65+ Years | 479 (53.8%) | $142,989 |
| Total | 891 (100.0%) | $107,813 |
Poverty in Ocean Ridge
Income Below Poverty by Sex and Age in Ocean Ridge
With 2.6% poverty level for males and 7.4% for females among the residents of Ocean Ridge, 45 to 54 year old males and 55 to 64 year old females are the most vulnerable to poverty, with 12 males (16.0%) and 57 females (21.3%) in their respective age groups living below the poverty level.
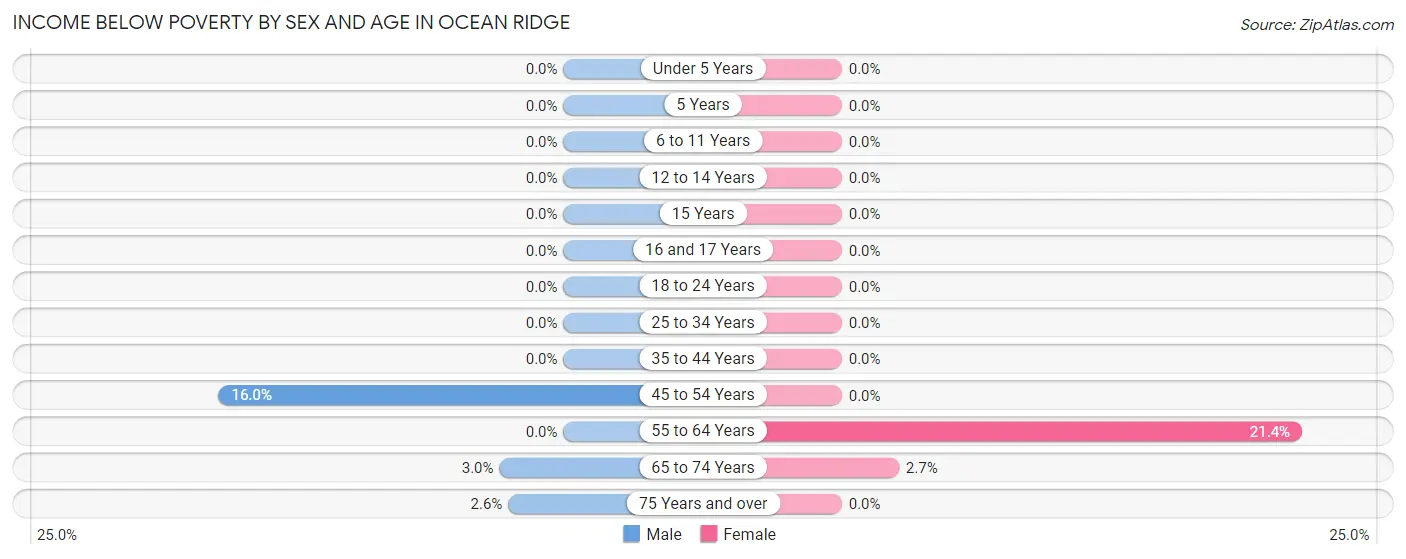
| Age Bracket | Male | Female |
| Under 5 Years | 0 (0.0%) | 0 (0.0%) |
| 5 Years | 0 (0.0%) | 0 (0.0%) |
| 6 to 11 Years | 0 (0.0%) | 0 (0.0%) |
| 12 to 14 Years | 0 (0.0%) | 0 (0.0%) |
| 15 Years | 0 (0.0%) | 0 (0.0%) |
| 16 and 17 Years | 0 (0.0%) | 0 (0.0%) |
| 18 to 24 Years | 0 (0.0%) | 0 (0.0%) |
| 25 to 34 Years | 0 (0.0%) | 0 (0.0%) |
| 35 to 44 Years | 0 (0.0%) | 0 (0.0%) |
| 45 to 54 Years | 12 (16.0%) | 0 (0.0%) |
| 55 to 64 Years | 0 (0.0%) | 57 (21.3%) |
| 65 to 74 Years | 6 (3.0%) | 4 (2.6%) |
| 75 Years and over | 5 (2.6%) | 0 (0.0%) |
| Total | 23 (2.6%) | 61 (7.4%) |
Income Above Poverty by Sex and Age in Ocean Ridge
According to the poverty statistics in Ocean Ridge, males aged under 5 years and females aged 6 to 11 years are the age groups that are most secure financially, with 100.0% of males and 100.0% of females in these age groups living above the poverty line.
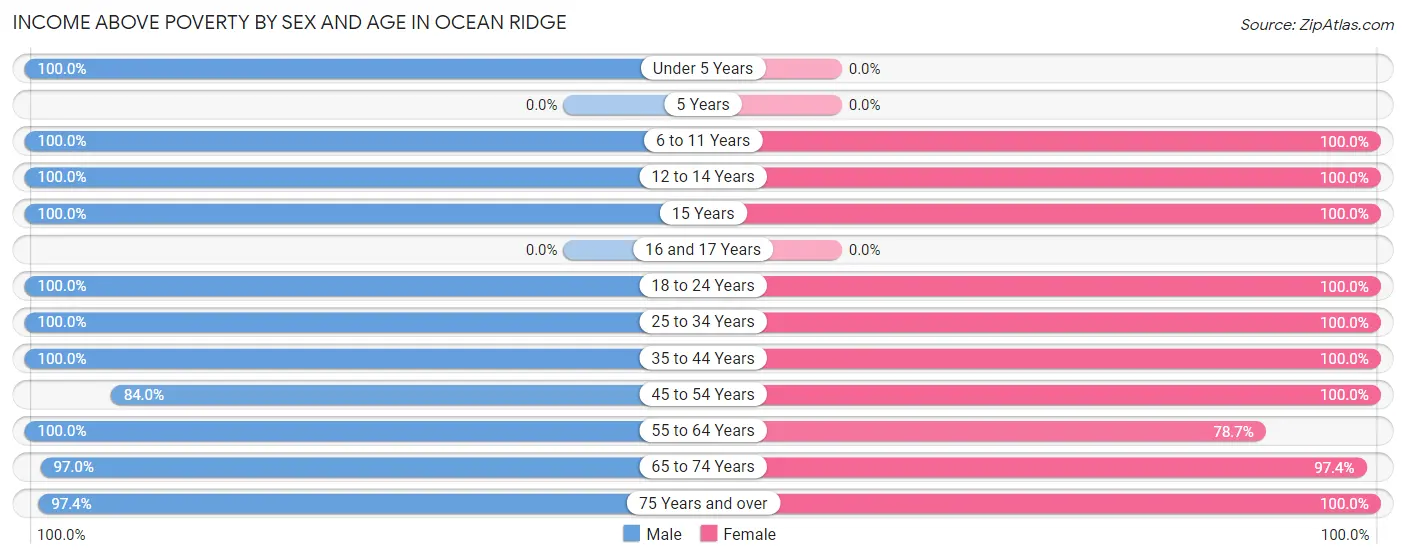
| Age Bracket | Male | Female |
| Under 5 Years | 51 (100.0%) | 0 (0.0%) |
| 5 Years | 0 (0.0%) | 0 (0.0%) |
| 6 to 11 Years | 23 (100.0%) | 16 (100.0%) |
| 12 to 14 Years | 18 (100.0%) | 30 (100.0%) |
| 15 Years | 6 (100.0%) | 12 (100.0%) |
| 16 and 17 Years | 0 (0.0%) | 0 (0.0%) |
| 18 to 24 Years | 76 (100.0%) | 42 (100.0%) |
| 25 to 34 Years | 47 (100.0%) | 44 (100.0%) |
| 35 to 44 Years | 63 (100.0%) | 37 (100.0%) |
| 45 to 54 Years | 63 (84.0%) | 82 (100.0%) |
| 55 to 64 Years | 136 (100.0%) | 210 (78.6%) |
| 65 to 74 Years | 196 (97.0%) | 147 (97.4%) |
| 75 Years and over | 190 (97.4%) | 139 (100.0%) |
| Total | 869 (97.4%) | 759 (92.6%) |
Income Below Poverty Among Married-Couple Families in Ocean Ridge
The poverty statistics for married-couple families in Ocean Ridge show that 0.9% or 4 of the total 422 families live below the poverty line. Families with no children have the highest poverty rate of 1.1%, comprising of 4 families. On the other hand, families with 1 or 2 children have the lowest poverty rate of 0.0%, which includes 0 families.
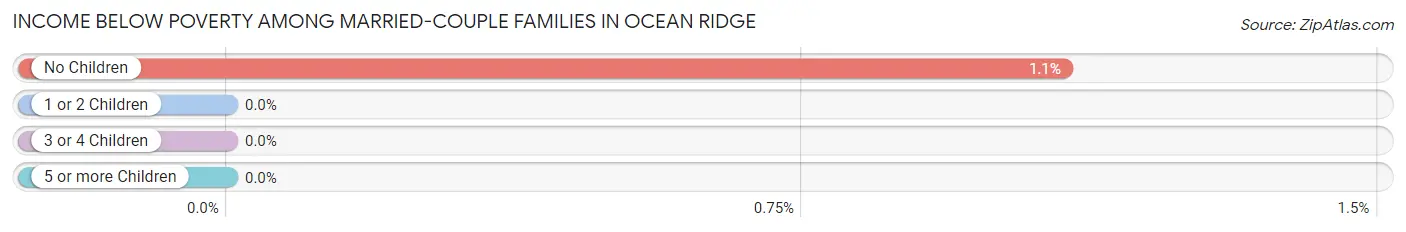
| Children | Above Poverty | Below Poverty |
| No Children | 362 (98.9%) | 4 (1.1%) |
| 1 or 2 Children | 53 (100.0%) | 0 (0.0%) |
| 3 or 4 Children | 3 (100.0%) | 0 (0.0%) |
| 5 or more Children | 0 (0.0%) | 0 (0.0%) |
| Total | 418 (99.1%) | 4 (0.9%) |
Income Below Poverty Among Single-Parent Households in Ocean Ridge
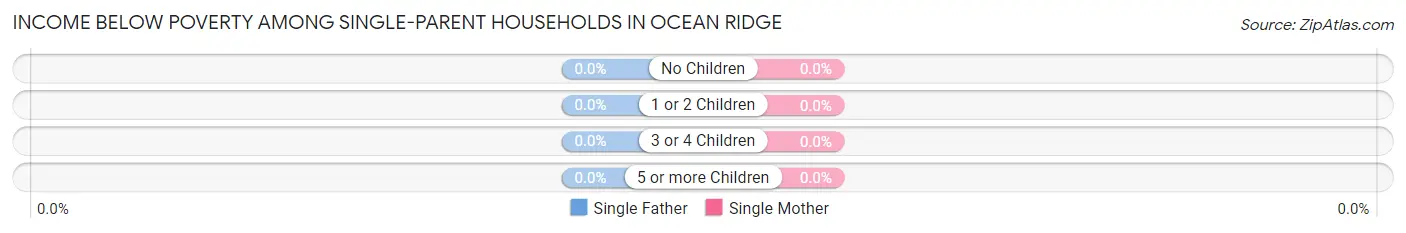
| Children | Single Father | Single Mother |
| No Children | 0 (0.0%) | 0 (0.0%) |
| 1 or 2 Children | 0 (0.0%) | 0 (0.0%) |
| 3 or 4 Children | 0 (0.0%) | 0 (0.0%) |
| 5 or more Children | 0 (0.0%) | 0 (0.0%) |
| Total | 0 (0.0%) | 0 (0.0%) |
Income Below Poverty Among Married-Couple vs Single-Parent Households in Ocean Ridge
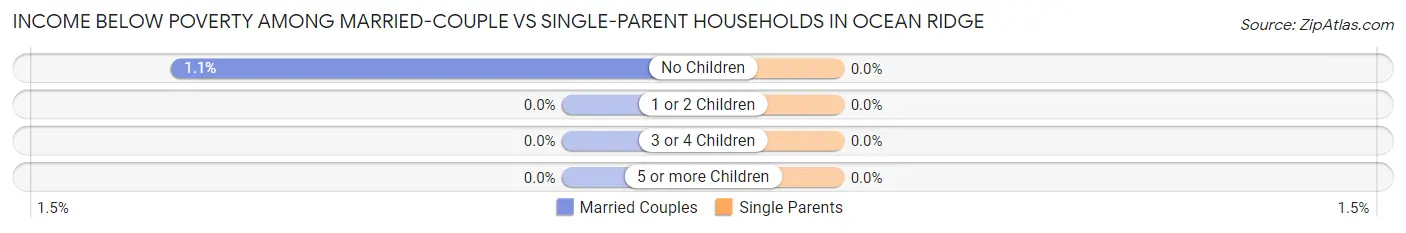
| Children | Married-Couple Families | Single-Parent Households |
| No Children | 4 (1.1%) | 0 (0.0%) |
| 1 or 2 Children | 0 (0.0%) | 0 (0.0%) |
| 3 or 4 Children | 0 (0.0%) | 0 (0.0%) |
| 5 or more Children | 0 (0.0%) | 0 (0.0%) |
| Total | 4 (0.9%) | 0 (0.0%) |
Race in Ocean Ridge
The most populous races in Ocean Ridge are White / Caucasian (1,466 | 85.6%), Hispanic or Latino (201 | 11.7%), and Some other Race (191 | 11.2%).
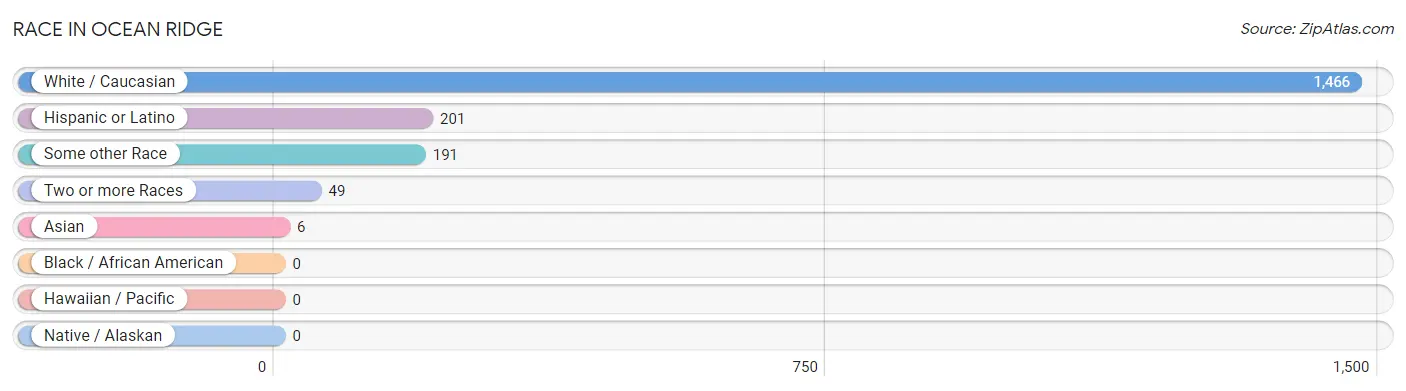
| Race | # Population | % Population |
| Asian | 6 | 0.4% |
| Black / African American | 0 | 0.0% |
| Hawaiian / Pacific | 0 | 0.0% |
| Hispanic or Latino | 201 | 11.7% |
| Native / Alaskan | 0 | 0.0% |
| White / Caucasian | 1,466 | 85.6% |
| Two or more Races | 49 | 2.9% |
| Some other Race | 191 | 11.2% |
| Total | 1,712 | 100.0% |
Ancestry in Ocean Ridge
The most populous ancestries reported in Ocean Ridge are Italian (330 | 19.3%), Irish (216 | 12.6%), English (215 | 12.6%), German (205 | 12.0%), and European (116 | 6.8%), together accounting for 63.2% of all Ocean Ridge residents.
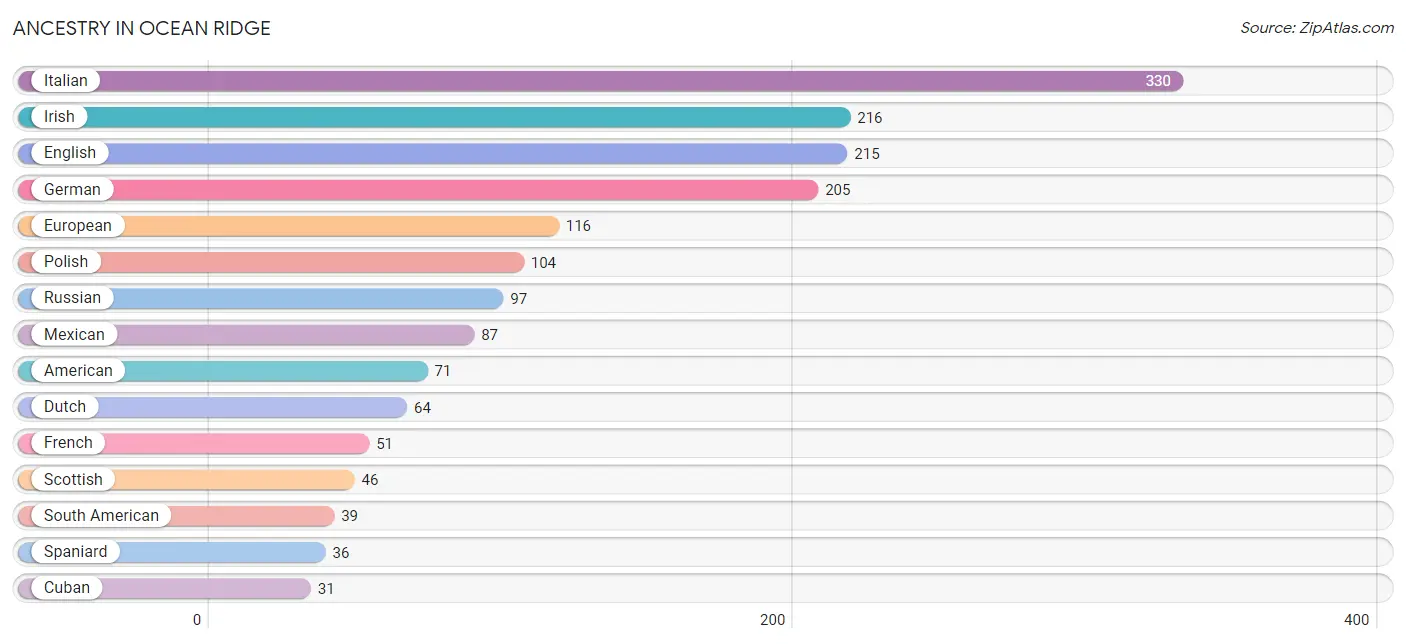
| Ancestry | # Population | % Population |
| American | 71 | 4.2% |
| Arab | 29 | 1.7% |
| Austrian | 21 | 1.2% |
| Bhutanese | 6 | 0.4% |
| British | 15 | 0.9% |
| Central American | 8 | 0.5% |
| Colombian | 9 | 0.5% |
| Croatian | 21 | 1.2% |
| Cuban | 31 | 1.8% |
| Czech | 4 | 0.2% |
| Danish | 12 | 0.7% |
| Dutch | 64 | 3.7% |
| Eastern European | 6 | 0.4% |
| English | 215 | 12.6% |
| Estonian | 4 | 0.2% |
| European | 116 | 6.8% |
| Finnish | 4 | 0.2% |
| French | 51 | 3.0% |
| German | 205 | 12.0% |
| Greek | 10 | 0.6% |
| Irish | 216 | 12.6% |
| Italian | 330 | 19.3% |
| Latvian | 28 | 1.6% |
| Lebanese | 29 | 1.7% |
| Luxembourger | 10 | 0.6% |
| Mexican | 87 | 5.1% |
| Norwegian | 20 | 1.2% |
| Polish | 104 | 6.1% |
| Russian | 97 | 5.7% |
| Salvadoran | 8 | 0.5% |
| Scotch-Irish | 22 | 1.3% |
| Scottish | 46 | 2.7% |
| South African | 4 | 0.2% |
| South American | 39 | 2.3% |
| Spaniard | 36 | 2.1% |
| Subsaharan African | 4 | 0.2% |
| Swedish | 27 | 1.6% |
| Swiss | 4 | 0.2% |
| Ukrainian | 23 | 1.3% |
| Venezuelan | 30 | 1.8% |
| Welsh | 9 | 0.5% |
| Yugoslavian | 5 | 0.3% | View All 42 Rows |
Immigrants in Ocean Ridge
The most numerous immigrant groups reported in Ocean Ridge came from Europe (91 | 5.3%), Latin America (75 | 4.4%), South America (42 | 2.5%), Eastern Europe (28 | 1.6%), and Northern Europe (27 | 1.6%), together accounting for 15.4% of all Ocean Ridge residents.
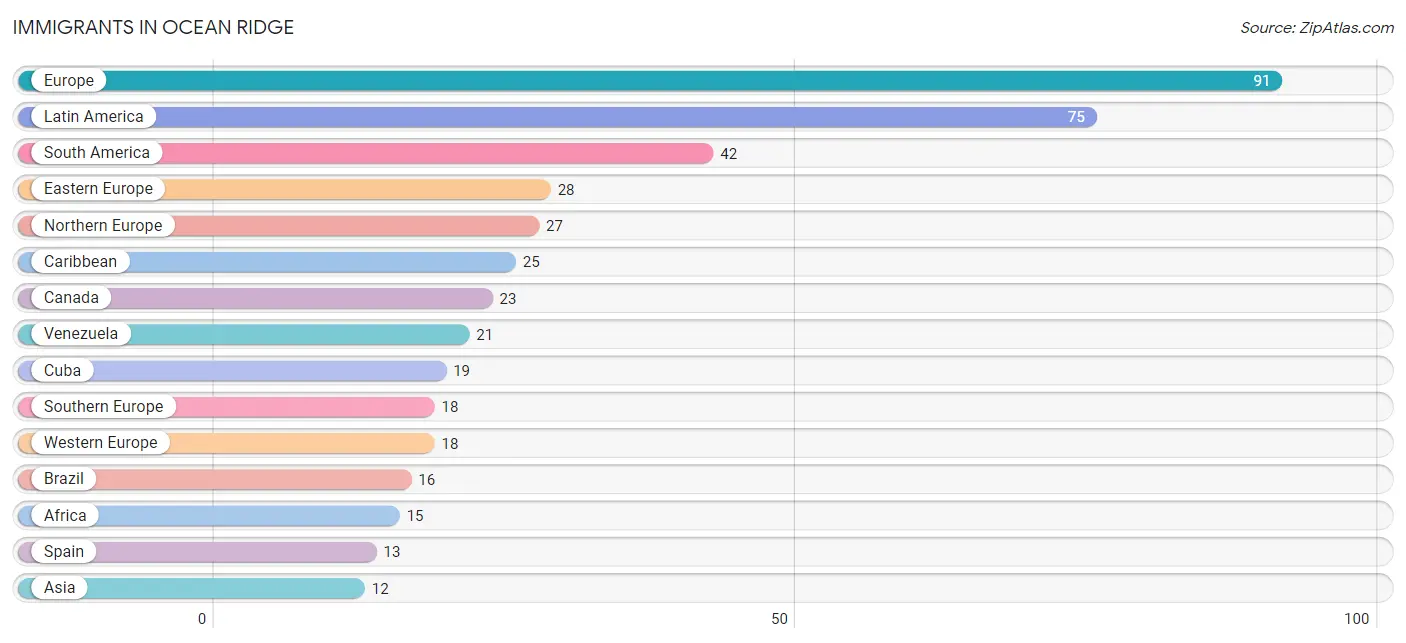
| Immigration Origin | # Population | % Population |
| Africa | 15 | 0.9% |
| Asia | 12 | 0.7% |
| Brazil | 16 | 0.9% |
| Canada | 23 | 1.3% |
| Caribbean | 25 | 1.5% |
| Central America | 8 | 0.5% |
| Colombia | 5 | 0.3% |
| Cuba | 19 | 1.1% |
| Denmark | 4 | 0.2% |
| Eastern Africa | 4 | 0.2% |
| Eastern Asia | 6 | 0.4% |
| Eastern Europe | 28 | 1.6% |
| El Salvador | 8 | 0.5% |
| Europe | 91 | 5.3% |
| France | 7 | 0.4% |
| Germany | 5 | 0.3% |
| Italy | 5 | 0.3% |
| Japan | 6 | 0.4% |
| Latin America | 75 | 4.4% |
| Latvia | 3 | 0.2% |
| Lebanon | 6 | 0.4% |
| Netherlands | 6 | 0.4% |
| Northern Europe | 27 | 1.6% |
| Russia | 7 | 0.4% |
| South Africa | 11 | 0.6% |
| South America | 42 | 2.5% |
| Southern Europe | 18 | 1.1% |
| Spain | 13 | 0.8% |
| Sweden | 5 | 0.3% |
| Trinidad and Tobago | 6 | 0.4% |
| Ukraine | 12 | 0.7% |
| Venezuela | 21 | 1.2% |
| Western Asia | 6 | 0.4% |
| Western Europe | 18 | 1.1% |
| Zimbabwe | 4 | 0.2% | View All 35 Rows |
Sex and Age in Ocean Ridge
Sex and Age in Ocean Ridge
The most populous age groups in Ocean Ridge are 70 to 74 Years (144 | 16.1%) for men and 55 to 59 Years (156 | 19.0%) for women.
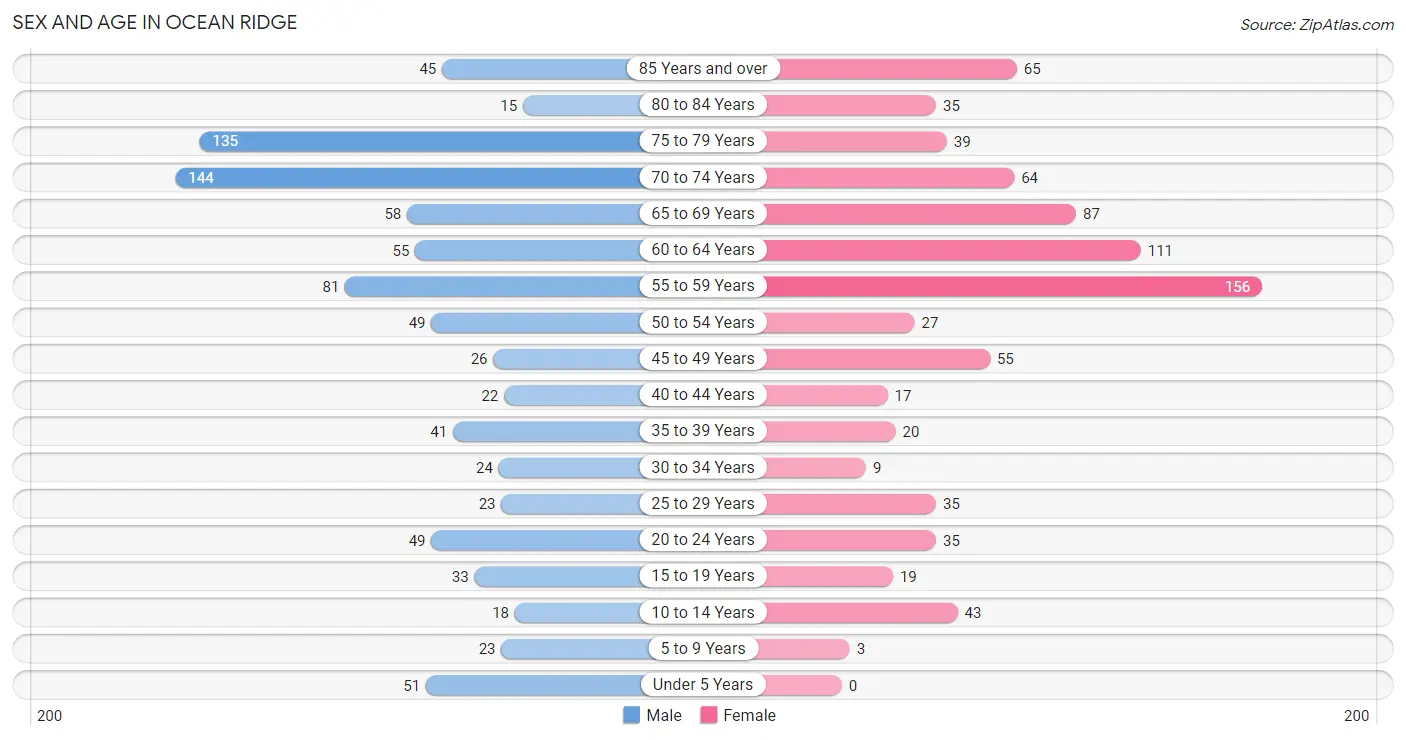
| Age Bracket | Male | Female |
| Under 5 Years | 51 (5.7%) | 0 (0.0%) |
| 5 to 9 Years | 23 (2.6%) | 3 (0.4%) |
| 10 to 14 Years | 18 (2.0%) | 43 (5.2%) |
| 15 to 19 Years | 33 (3.7%) | 19 (2.3%) |
| 20 to 24 Years | 49 (5.5%) | 35 (4.3%) |
| 25 to 29 Years | 23 (2.6%) | 35 (4.3%) |
| 30 to 34 Years | 24 (2.7%) | 9 (1.1%) |
| 35 to 39 Years | 41 (4.6%) | 20 (2.4%) |
| 40 to 44 Years | 22 (2.5%) | 17 (2.1%) |
| 45 to 49 Years | 26 (2.9%) | 55 (6.7%) |
| 50 to 54 Years | 49 (5.5%) | 27 (3.3%) |
| 55 to 59 Years | 81 (9.1%) | 156 (19.0%) |
| 60 to 64 Years | 55 (6.2%) | 111 (13.5%) |
| 65 to 69 Years | 58 (6.5%) | 87 (10.6%) |
| 70 to 74 Years | 144 (16.1%) | 64 (7.8%) |
| 75 to 79 Years | 135 (15.1%) | 39 (4.8%) |
| 80 to 84 Years | 15 (1.7%) | 35 (4.3%) |
| 85 Years and over | 45 (5.0%) | 65 (7.9%) |
| Total | 892 (100.0%) | 820 (100.0%) |
Families and Households in Ocean Ridge
Median Family Size in Ocean Ridge
The median family size in Ocean Ridge is 2.45 persons per family, with single male/father families (56 | 11.4%) accounting for the largest median family size of 4.23 persons per family. On the other hand, married-couple families (422 | 85.8%) represent the smallest median family size with 2.20 persons per family.
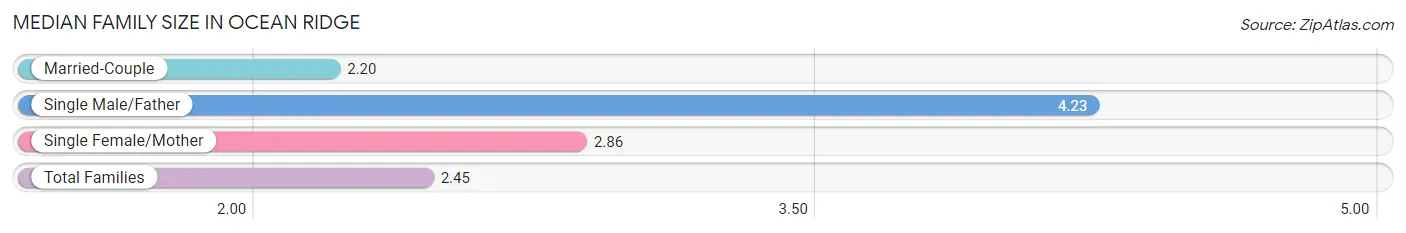
| Family Type | # Families | Family Size |
| Married-Couple | 422 (85.8%) | 2.20 |
| Single Male/Father | 56 (11.4%) | 4.23 |
| Single Female/Mother | 14 (2.9%) | 2.86 |
| Total Families | 492 (100.0%) | 2.45 |
Median Household Size in Ocean Ridge
The median household size in Ocean Ridge is 1.92 persons per household, with single male/father households (56 | 6.3%) accounting for the largest median household size of 4.77 persons per household. non-family households (399 | 44.8%) represent the smallest median household size with 1.15 persons per household.
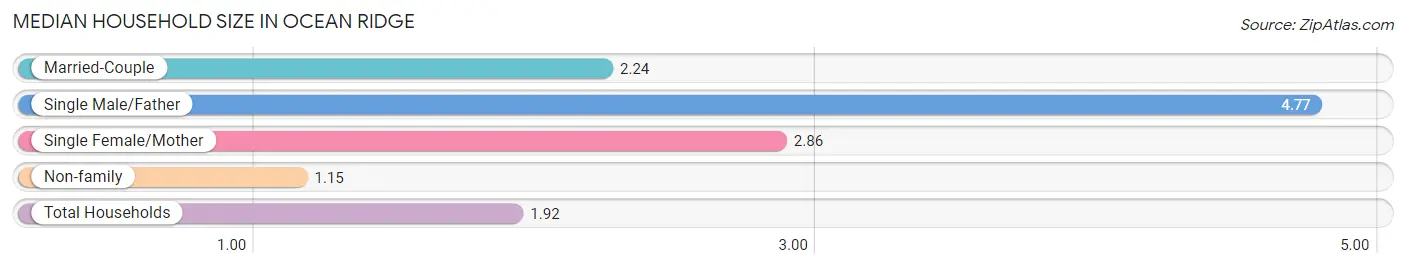
| Household Type | # Households | Household Size |
| Married-Couple | 422 (47.4%) | 2.24 |
| Single Male/Father | 56 (6.3%) | 4.77 |
| Single Female/Mother | 14 (1.6%) | 2.86 |
| Non-family | 399 (44.8%) | 1.15 |
| Total Households | 891 (100.0%) | 1.92 |
Household Size by Marriage Status in Ocean Ridge
Out of a total of 891 households in Ocean Ridge, 492 (55.2%) are family households, while 399 (44.8%) are nonfamily households. The most numerous type of family households are 2-person households, comprising 370, and the most common type of nonfamily households are 1-person households, comprising 356.
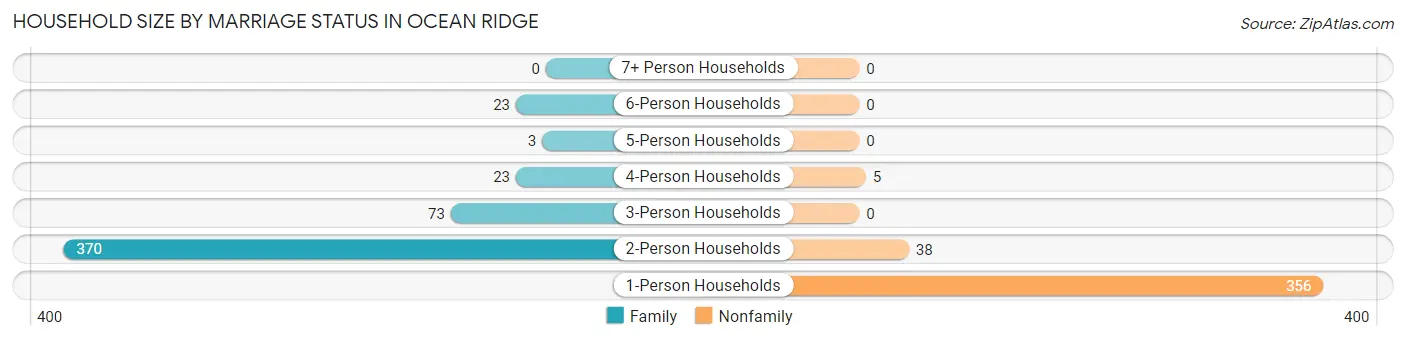
| Household Size | Family Households | Nonfamily Households |
| 1-Person Households | - | 356 (40.0%) |
| 2-Person Households | 370 (41.5%) | 38 (4.3%) |
| 3-Person Households | 73 (8.2%) | 0 (0.0%) |
| 4-Person Households | 23 (2.6%) | 5 (0.6%) |
| 5-Person Households | 3 (0.3%) | 0 (0.0%) |
| 6-Person Households | 23 (2.6%) | 0 (0.0%) |
| 7+ Person Households | 0 (0.0%) | 0 (0.0%) |
| Total | 492 (55.2%) | 399 (44.8%) |
Female Fertility in Ocean Ridge
Fertility by Age in Ocean Ridge
Average fertility rate in Ocean Ridge is 55.0 births per 1,000 women. Women in the age bracket of 35 to 50 years have the highest fertility rate with 108.0 births per 1,000 women. Women in the age bracket of 35 to 50 years acount for 100.0% of all women with births.
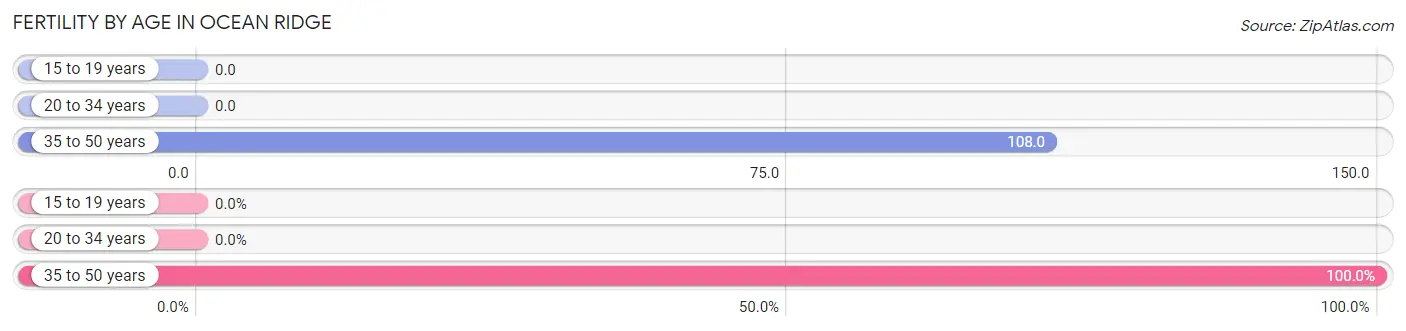
| Age Bracket | Women with Births | Births / 1,000 Women |
| 15 to 19 years | 0 (0.0%) | 0.0 |
| 20 to 34 years | 0 (0.0%) | 0.0 |
| 35 to 50 years | 11 (100.0%) | 108.0 |
| Total | 11 (100.0%) | 55.0 |
Fertility by Age by Marriage Status in Ocean Ridge
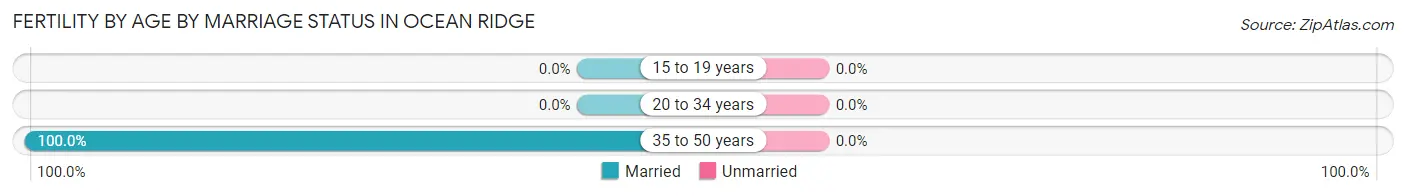
| Age Bracket | Married | Unmarried |
| 15 to 19 years | 0 (0.0%) | 0 (0.0%) |
| 20 to 34 years | 0 (0.0%) | 0 (0.0%) |
| 35 to 50 years | 11 (100.0%) | 0 (0.0%) |
| Total | 11 (100.0%) | 0 (0.0%) |
Fertility by Education in Ocean Ridge
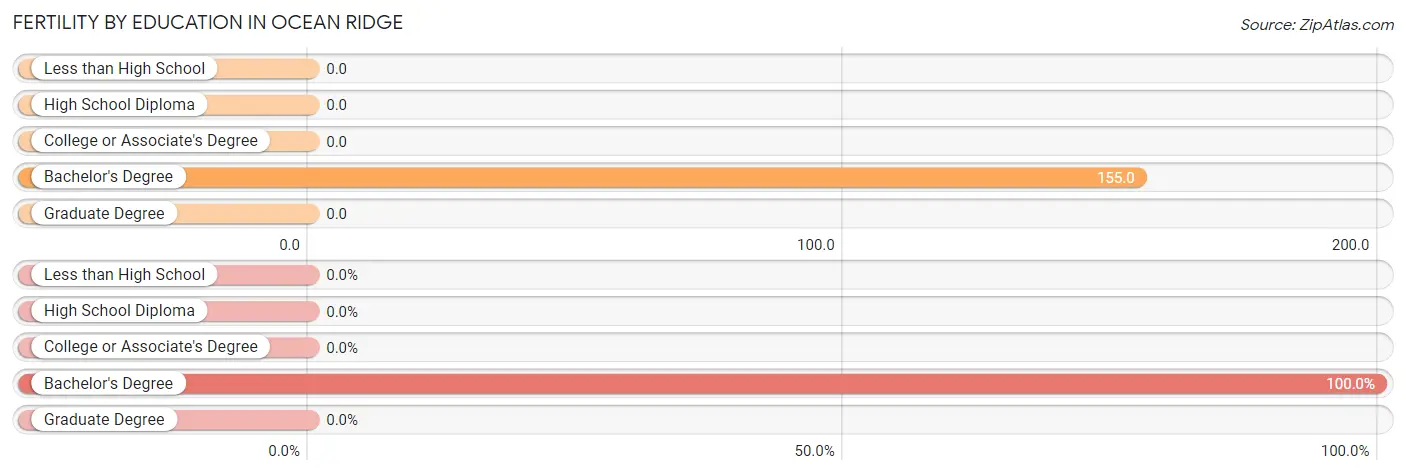
| Educational Attainment | Women with Births | Births / 1,000 Women |
| Less than High School | 0 (0.0%) | 0.0 |
| High School Diploma | 0 (0.0%) | 0.0 |
| College or Associate's Degree | 0 (0.0%) | 0.0 |
| Bachelor's Degree | 11 (100.0%) | 155.0 |
| Graduate Degree | 0 (0.0%) | 0.0 |
| Total | 11 (100.0%) | 55.0 |
Fertility by Education by Marriage Status in Ocean Ridge
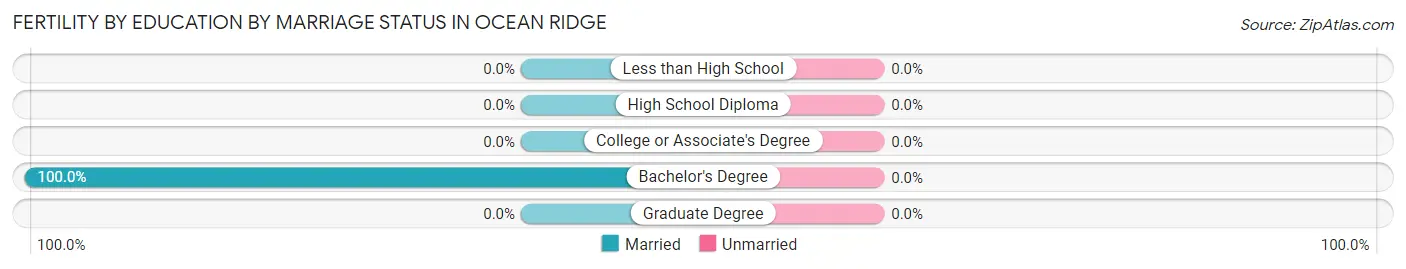
| Educational Attainment | Married | Unmarried |
| Less than High School | 0 (0.0%) | 0 (0.0%) |
| High School Diploma | 0 (0.0%) | 0 (0.0%) |
| College or Associate's Degree | 0 (0.0%) | 0 (0.0%) |
| Bachelor's Degree | 11 (100.0%) | 0 (0.0%) |
| Graduate Degree | 0 (0.0%) | 0 (0.0%) |
| Total | 11 (100.0%) | 0 (0.0%) |
Employment Characteristics in Ocean Ridge
Employment by Class of Employer in Ocean Ridge
Among the 789 employed individuals in Ocean Ridge, private company employees (508 | 64.4%), self-employed (incorporated) (147 | 18.6%), and self-employed (not incorporated) (84 | 10.6%) make up the most common classes of employment.
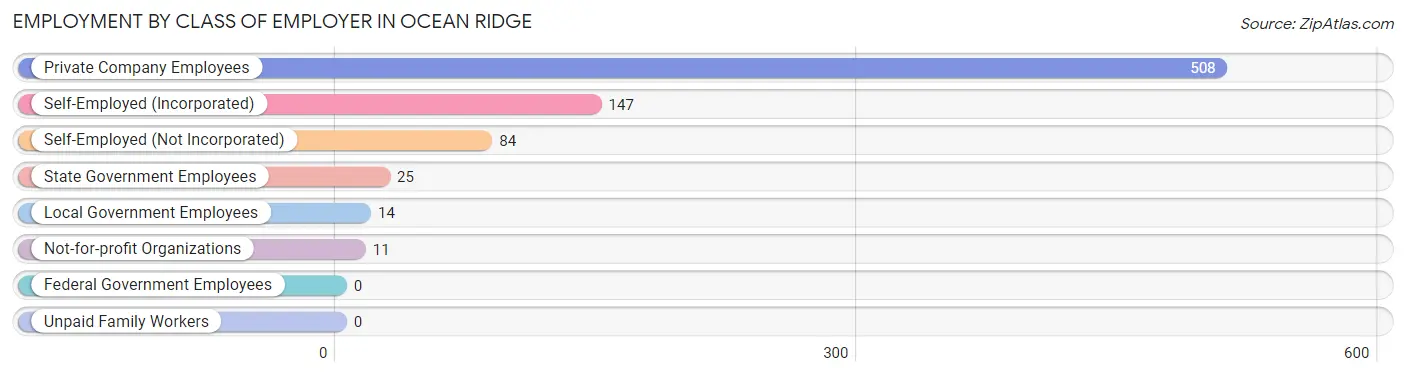
| Employer Class | # Employees | % Employees |
| Private Company Employees | 508 | 64.4% |
| Self-Employed (Incorporated) | 147 | 18.6% |
| Self-Employed (Not Incorporated) | 84 | 10.6% |
| Not-for-profit Organizations | 11 | 1.4% |
| Local Government Employees | 14 | 1.8% |
| State Government Employees | 25 | 3.2% |
| Federal Government Employees | 0 | 0.0% |
| Unpaid Family Workers | 0 | 0.0% |
| Total | 789 | 100.0% |
Employment Status by Age in Ocean Ridge
According to the labor force statistics for Ocean Ridge, out of the total population over 16 years of age (1,556), 55.8% or 868 individuals are in the labor force, with 3.5% or 30 of them unemployed. The age group with the highest labor force participation rate is 16 to 19 years, with 100.0% or 34 individuals in the labor force. Within the labor force, the 60 to 64 years age range has the highest percentage of unemployed individuals, with 12.3% or 9 of them being unemployed.
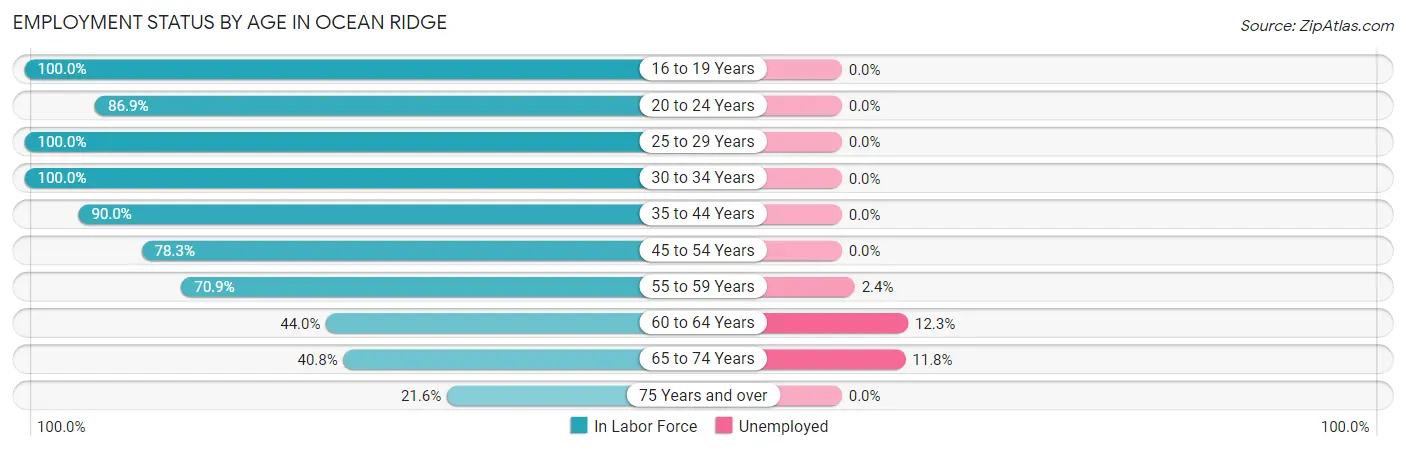
| Age Bracket | In Labor Force | Unemployed |
| 16 to 19 Years | 34 (100.0%) | 0 (0.0%) |
| 20 to 24 Years | 73 (86.9%) | 0 (0.0%) |
| 25 to 29 Years | 58 (100.0%) | 0 (0.0%) |
| 30 to 34 Years | 33 (100.0%) | 0 (0.0%) |
| 35 to 44 Years | 90 (90.0%) | 0 (0.0%) |
| 45 to 54 Years | 123 (78.3%) | 0 (0.0%) |
| 55 to 59 Years | 168 (70.9%) | 4 (2.4%) |
| 60 to 64 Years | 73 (44.0%) | 9 (12.3%) |
| 65 to 74 Years | 144 (40.8%) | 17 (11.8%) |
| 75 Years and over | 72 (21.6%) | 0 (0.0%) |
| Total | 868 (55.8%) | 30 (3.5%) |
Employment Status by Educational Attainment in Ocean Ridge
According to labor force statistics for Ocean Ridge, 72.6% of individuals (545) out of the total population between 25 and 64 years of age (751) are in the labor force, with 2.4% or 13 of them being unemployed. The group with the highest labor force participation rate are those with the educational attainment of high school diploma, with 95.5% or 85 individuals in the labor force. Within the labor force, individuals with bachelor's degree or higher education have the highest percentage of unemployment, with 3.7% or 13 of them being unemployed.
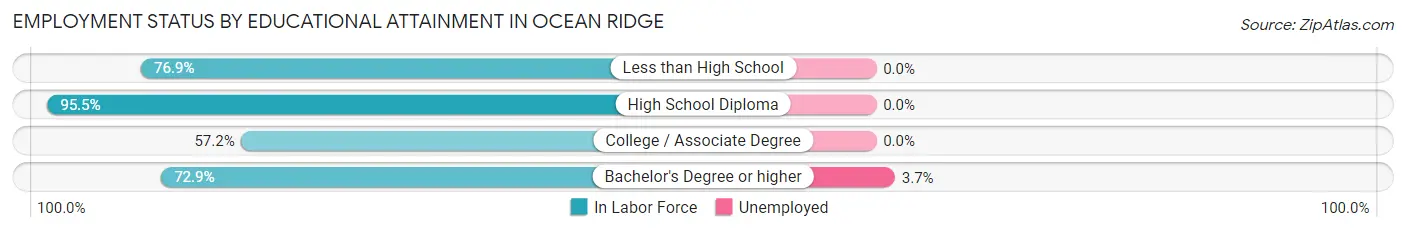
| Educational Attainment | In Labor Force | Unemployed |
| Less than High School | 20 (76.9%) | 0 (0.0%) |
| High School Diploma | 85 (95.5%) | 0 (0.0%) |
| College / Associate Degree | 87 (57.2%) | 0 (0.0%) |
| Bachelor's Degree or higher | 353 (72.9%) | 18 (3.7%) |
| Total | 545 (72.6%) | 18 (2.4%) |
Employment Occupations by Sex in Ocean Ridge
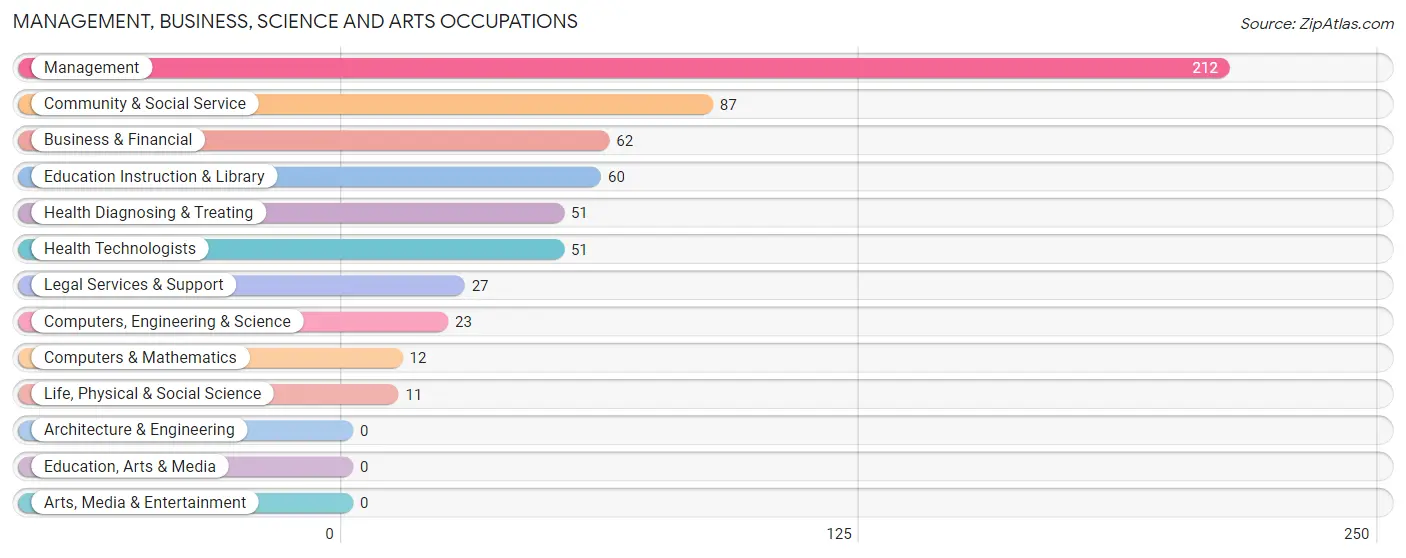
Management, Business, Science and Arts Occupations
The most common Management, Business, Science and Arts occupations in Ocean Ridge are Management (212 | 25.3%), Community & Social Service (87 | 10.4%), Business & Financial (62 | 7.4%), Education Instruction & Library (60 | 7.2%), and Health Diagnosing & Treating (51 | 6.1%).
Management, Business, Science and Arts Occupations by Sex
Within the Management, Business, Science and Arts occupations in Ocean Ridge, the most male-oriented occupations are Computers & Mathematics (100.0%), Management (80.2%), and Computers, Engineering & Science (78.3%), while the most female-oriented occupations are Business & Financial (62.9%), Life, Physical & Social Science (45.5%), and Community & Social Service (33.3%).
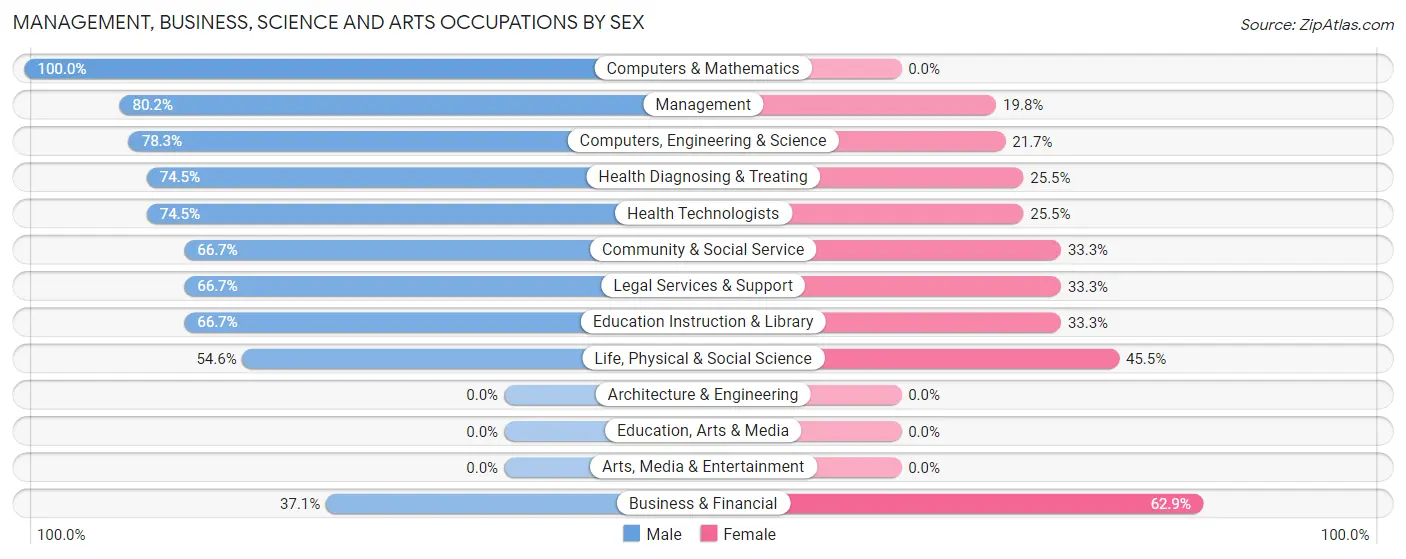
| Occupation | Male | Female |
| Management | 170 (80.2%) | 42 (19.8%) |
| Business & Financial | 23 (37.1%) | 39 (62.9%) |
| Computers, Engineering & Science | 18 (78.3%) | 5 (21.7%) |
| Computers & Mathematics | 12 (100.0%) | 0 (0.0%) |
| Architecture & Engineering | 0 (0.0%) | 0 (0.0%) |
| Life, Physical & Social Science | 6 (54.5%) | 5 (45.5%) |
| Community & Social Service | 58 (66.7%) | 29 (33.3%) |
| Education, Arts & Media | 0 (0.0%) | 0 (0.0%) |
| Legal Services & Support | 18 (66.7%) | 9 (33.3%) |
| Education Instruction & Library | 40 (66.7%) | 20 (33.3%) |
| Arts, Media & Entertainment | 0 (0.0%) | 0 (0.0%) |
| Health Diagnosing & Treating | 38 (74.5%) | 13 (25.5%) |
| Health Technologists | 38 (74.5%) | 13 (25.5%) |
| Total (Category) | 307 (70.6%) | 128 (29.4%) |
| Total (Overall) | 504 (60.1%) | 334 (39.9%) |
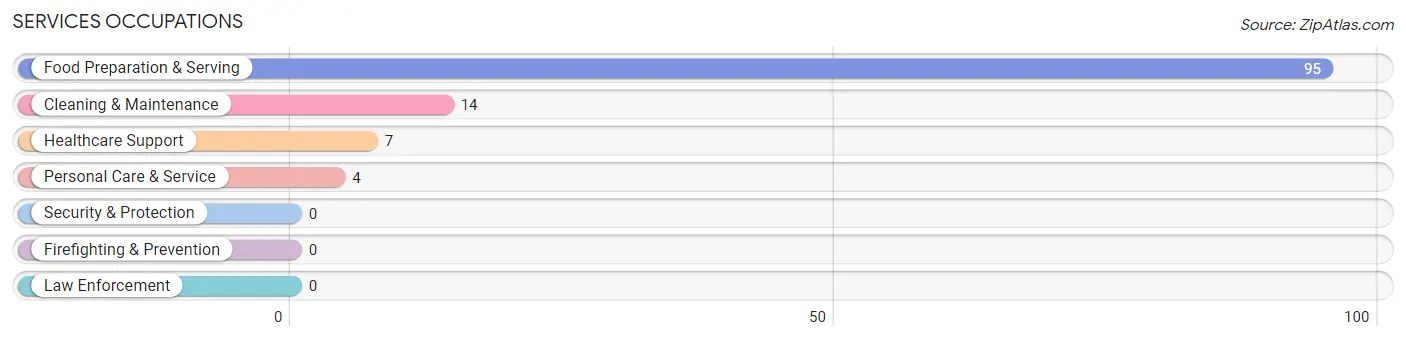
Services Occupations
The most common Services occupations in Ocean Ridge are Food Preparation & Serving (95 | 11.3%), Cleaning & Maintenance (14 | 1.7%), Healthcare Support (7 | 0.8%), and Personal Care & Service (4 | 0.5%).
Services Occupations by Sex
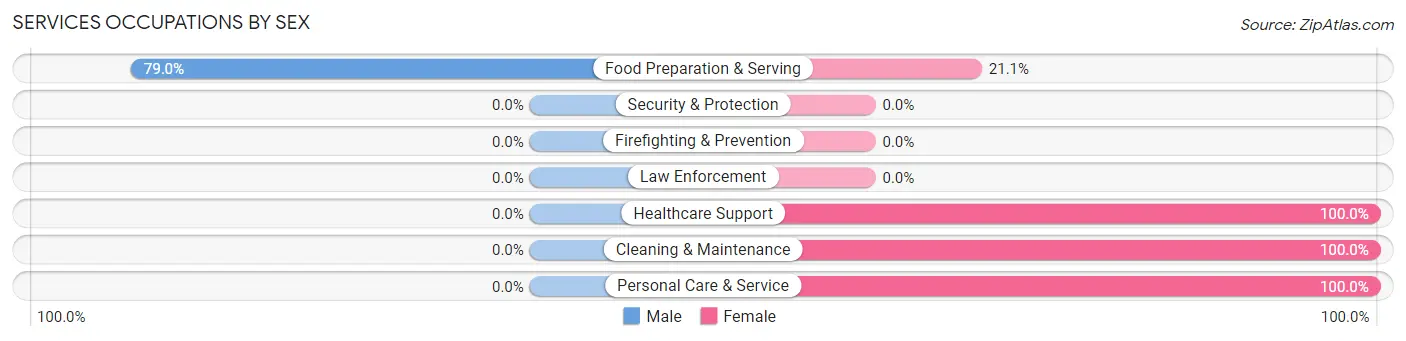
| Occupation | Male | Female |
| Healthcare Support | 0 (0.0%) | 7 (100.0%) |
| Security & Protection | 0 (0.0%) | 0 (0.0%) |
| Firefighting & Prevention | 0 (0.0%) | 0 (0.0%) |
| Law Enforcement | 0 (0.0%) | 0 (0.0%) |
| Food Preparation & Serving | 75 (78.9%) | 20 (21.0%) |
| Cleaning & Maintenance | 0 (0.0%) | 14 (100.0%) |
| Personal Care & Service | 0 (0.0%) | 4 (100.0%) |
| Total (Category) | 75 (62.5%) | 45 (37.5%) |
| Total (Overall) | 504 (60.1%) | 334 (39.9%) |
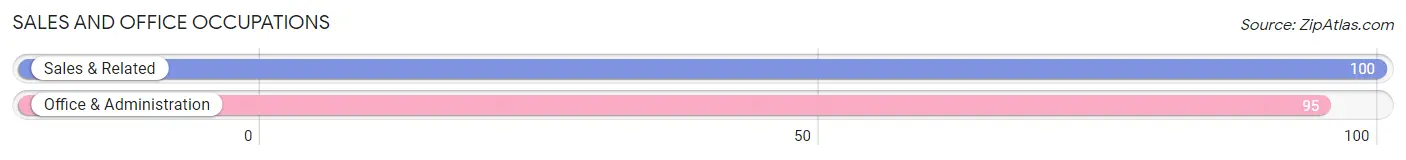
Sales and Office Occupations
The most common Sales and Office occupations in Ocean Ridge are Sales & Related (100 | 11.9%), and Office & Administration (95 | 11.3%).
Sales and Office Occupations by Sex
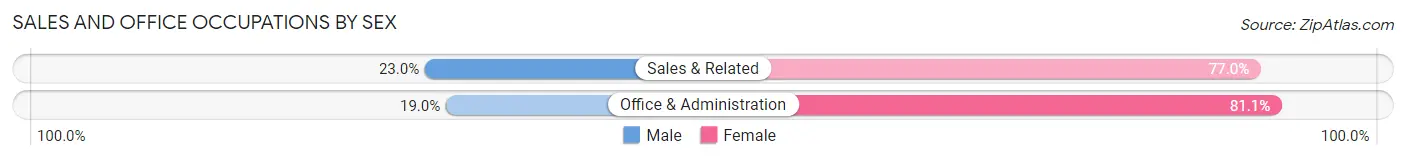
| Occupation | Male | Female |
| Sales & Related | 23 (23.0%) | 77 (77.0%) |
| Office & Administration | 18 (19.0%) | 77 (81.0%) |
| Total (Category) | 41 (21.0%) | 154 (79.0%) |
| Total (Overall) | 504 (60.1%) | 334 (39.9%) |
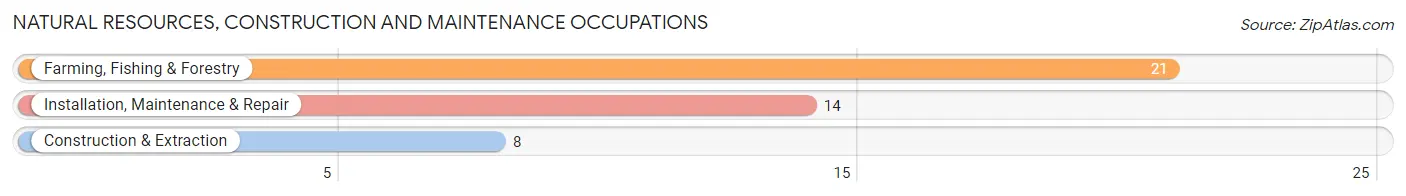
Natural Resources, Construction and Maintenance Occupations
The most common Natural Resources, Construction and Maintenance occupations in Ocean Ridge are Farming, Fishing & Forestry (21 | 2.5%), Installation, Maintenance & Repair (14 | 1.7%), and Construction & Extraction (8 | 0.9%).
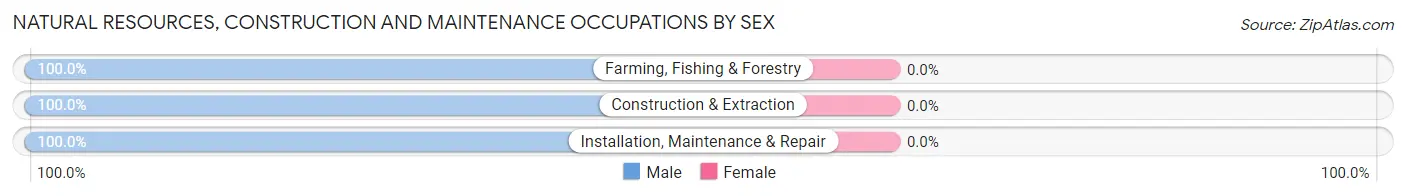
Natural Resources, Construction and Maintenance Occupations by Sex
| Occupation | Male | Female |
| Farming, Fishing & Forestry | 21 (100.0%) | 0 (0.0%) |
| Construction & Extraction | 8 (100.0%) | 0 (0.0%) |
| Installation, Maintenance & Repair | 14 (100.0%) | 0 (0.0%) |
| Total (Category) | 43 (100.0%) | 0 (0.0%) |
| Total (Overall) | 504 (60.1%) | 334 (39.9%) |
Production, Transportation and Moving Occupations
The most common Production, Transportation and Moving occupations in Ocean Ridge are Material Moving (30 | 3.6%), Production (8 | 0.9%), and Transportation (7 | 0.8%).
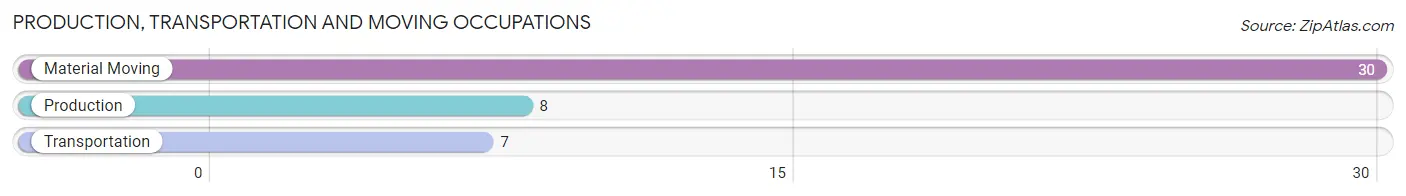
Production, Transportation and Moving Occupations by Sex
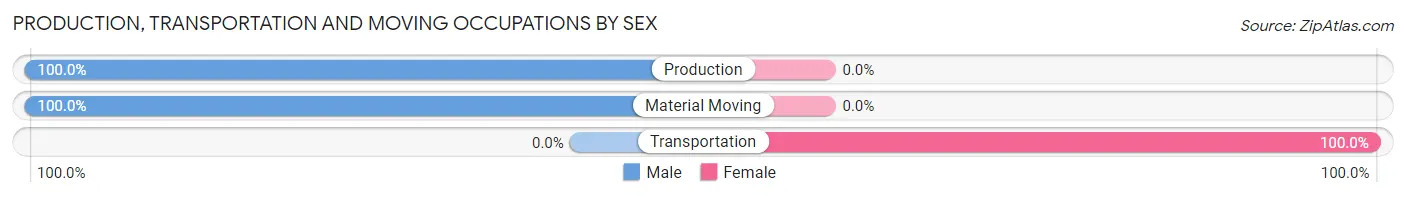
| Occupation | Male | Female |
| Production | 8 (100.0%) | 0 (0.0%) |
| Transportation | 0 (0.0%) | 7 (100.0%) |
| Material Moving | 30 (100.0%) | 0 (0.0%) |
| Total (Category) | 38 (84.4%) | 7 (15.6%) |
| Total (Overall) | 504 (60.1%) | 334 (39.9%) |
Employment Industries by Sex in Ocean Ridge
Employment Industries in Ocean Ridge
The major employment industries in Ocean Ridge include Professional & Scientific (125 | 14.9%), Accommodation & Food Services (107 | 12.8%), Health Care & Social Assistance (95 | 11.3%), Retail Trade (89 | 10.6%), and Educational Services (60 | 7.2%).
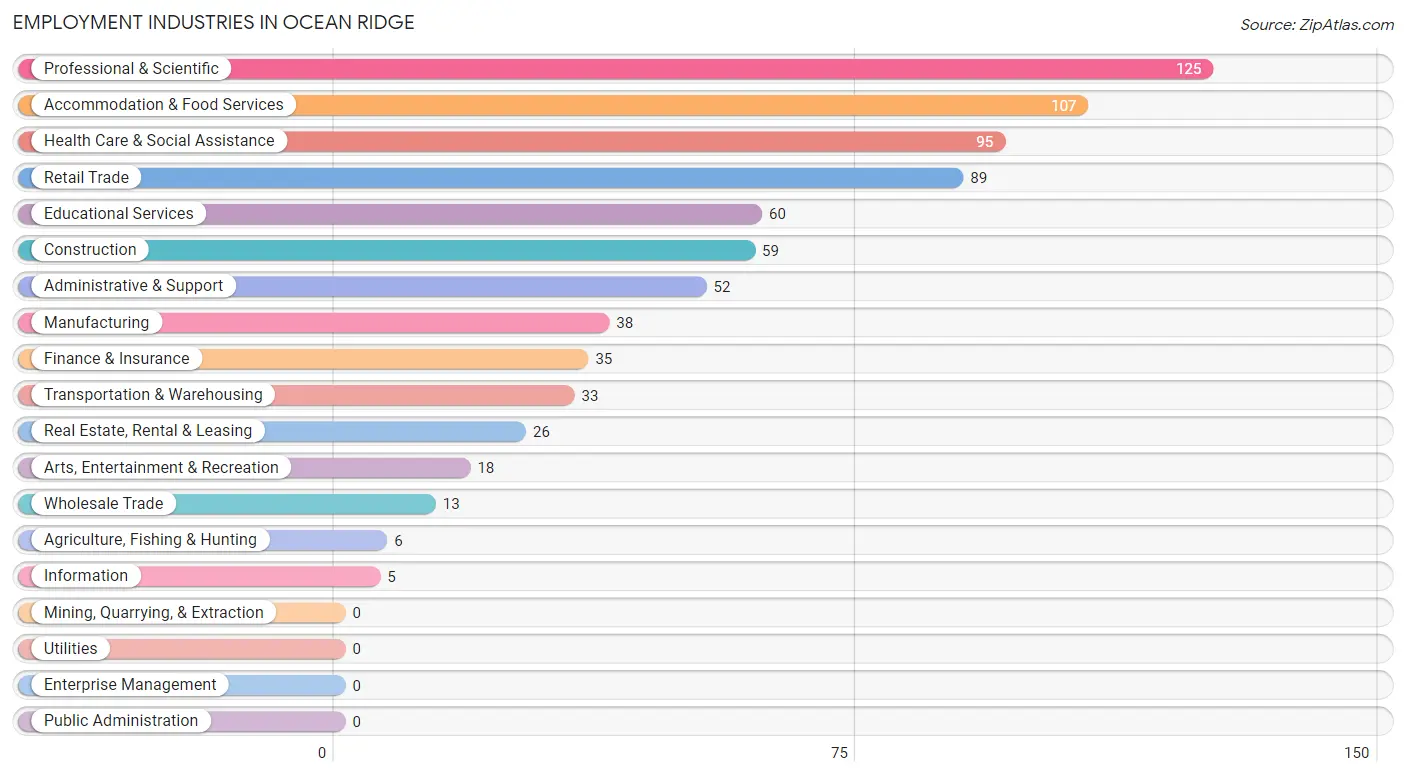
Employment Industries by Sex in Ocean Ridge
The Ocean Ridge industries that see more men than women are Agriculture, Fishing & Hunting (100.0%), Wholesale Trade (100.0%), and Information (100.0%), whereas the industries that tend to have a higher number of women are Arts, Entertainment & Recreation (100.0%), Retail Trade (70.8%), and Finance & Insurance (62.9%).
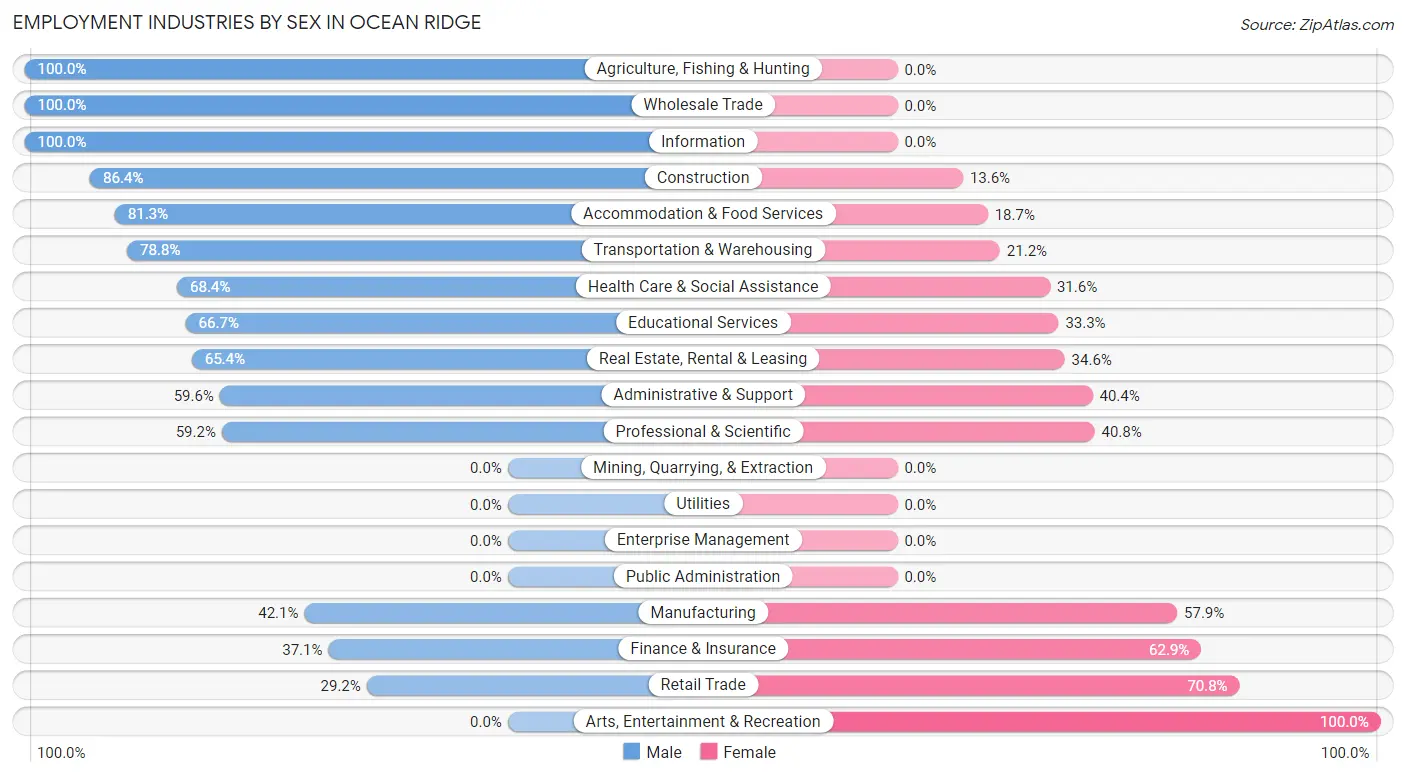
| Industry | Male | Female |
| Agriculture, Fishing & Hunting | 6 (100.0%) | 0 (0.0%) |
| Mining, Quarrying, & Extraction | 0 (0.0%) | 0 (0.0%) |
| Construction | 51 (86.4%) | 8 (13.6%) |
| Manufacturing | 16 (42.1%) | 22 (57.9%) |
| Wholesale Trade | 13 (100.0%) | 0 (0.0%) |
| Retail Trade | 26 (29.2%) | 63 (70.8%) |
| Transportation & Warehousing | 26 (78.8%) | 7 (21.2%) |
| Utilities | 0 (0.0%) | 0 (0.0%) |
| Information | 5 (100.0%) | 0 (0.0%) |
| Finance & Insurance | 13 (37.1%) | 22 (62.9%) |
| Real Estate, Rental & Leasing | 17 (65.4%) | 9 (34.6%) |
| Professional & Scientific | 74 (59.2%) | 51 (40.8%) |
| Enterprise Management | 0 (0.0%) | 0 (0.0%) |
| Administrative & Support | 31 (59.6%) | 21 (40.4%) |
| Educational Services | 40 (66.7%) | 20 (33.3%) |
| Health Care & Social Assistance | 65 (68.4%) | 30 (31.6%) |
| Arts, Entertainment & Recreation | 0 (0.0%) | 18 (100.0%) |
| Accommodation & Food Services | 87 (81.3%) | 20 (18.7%) |
| Public Administration | 0 (0.0%) | 0 (0.0%) |
| Total | 504 (60.1%) | 334 (39.9%) |
Education in Ocean Ridge
School Enrollment in Ocean Ridge
The most common levels of schooling among the 129 students in Ocean Ridge are middle school (64 | 49.6%), elementary school (31 | 24.0%), and college / undergraduate (24 | 18.6%).
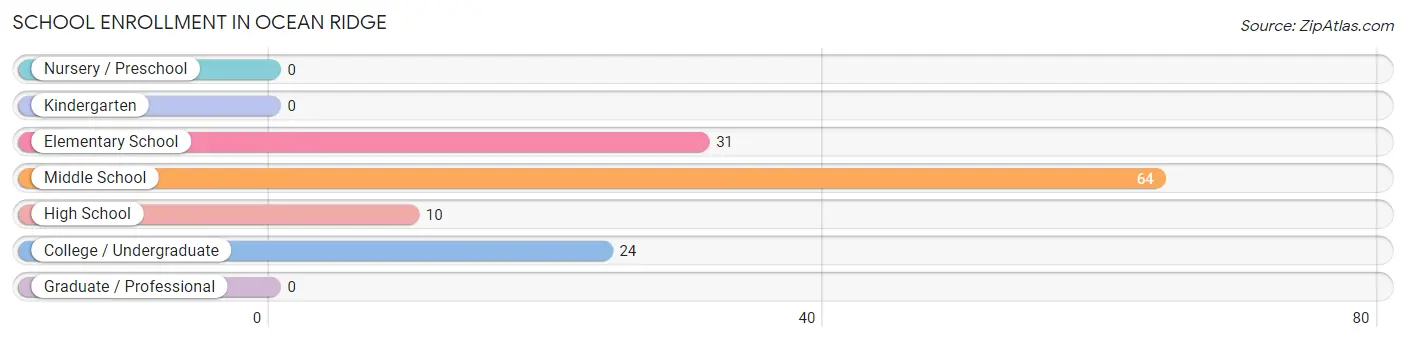
| School Level | # Students | % Students |
| Nursery / Preschool | 0 | 0.0% |
| Kindergarten | 0 | 0.0% |
| Elementary School | 31 | 24.0% |
| Middle School | 64 | 49.6% |
| High School | 10 | 7.7% |
| College / Undergraduate | 24 | 18.6% |
| Graduate / Professional | 0 | 0.0% |
| Total | 129 | 100.0% |
School Enrollment by Age by Funding Source in Ocean Ridge
Out of a total of 129 students who are enrolled in schools in Ocean Ridge, 41 (31.8%) attend a private institution, while the remaining 88 (68.2%) are enrolled in public schools. The age group of 18 to 19 year olds has the highest likelihood of being enrolled in private schools, with 7 (100.0% in the age bracket) enrolled. Conversely, the age group of 20 to 24 year olds has the lowest likelihood of being enrolled in a private school, with 5 (100.0% in the age bracket) attending a public institution.
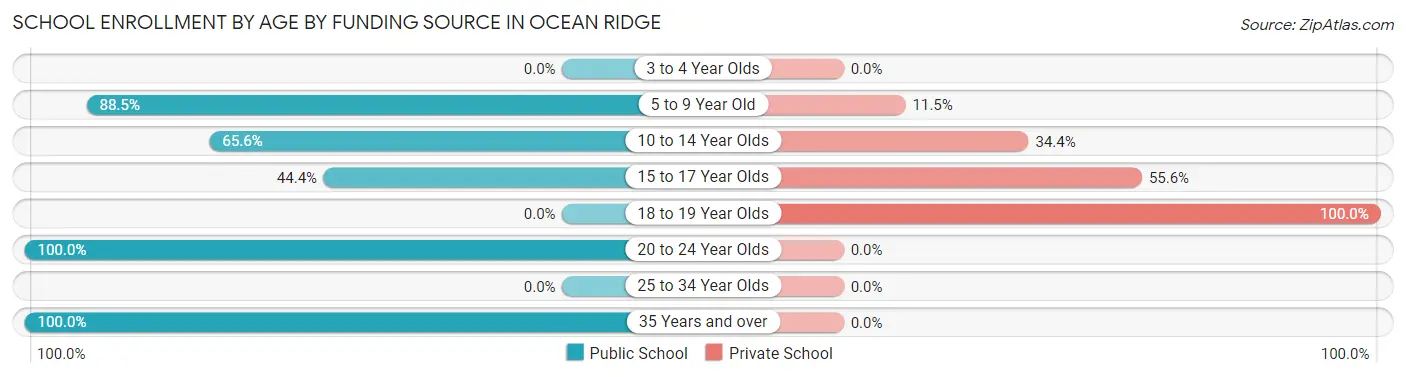
| Age Bracket | Public School | Private School |
| 3 to 4 Year Olds | 0 (0.0%) | 0 (0.0%) |
| 5 to 9 Year Old | 23 (88.5%) | 3 (11.5%) |
| 10 to 14 Year Olds | 40 (65.6%) | 21 (34.4%) |
| 15 to 17 Year Olds | 8 (44.4%) | 10 (55.6%) |
| 18 to 19 Year Olds | 0 (0.0%) | 7 (100.0%) |
| 20 to 24 Year Olds | 5 (100.0%) | 0 (0.0%) |
| 25 to 34 Year Olds | 0 (0.0%) | 0 (0.0%) |
| 35 Years and over | 12 (100.0%) | 0 (0.0%) |
| Total | 88 (68.2%) | 41 (31.8%) |
Educational Attainment by Field of Study in Ocean Ridge
Business (303 | 28.3%), liberal arts & history (127 | 11.8%), education (79 | 7.4%), communications (79 | 7.4%), and bio, nature & agricultural (67 | 6.2%) are the most common fields of study among 1,072 individuals in Ocean Ridge who have obtained a bachelor's degree or higher.
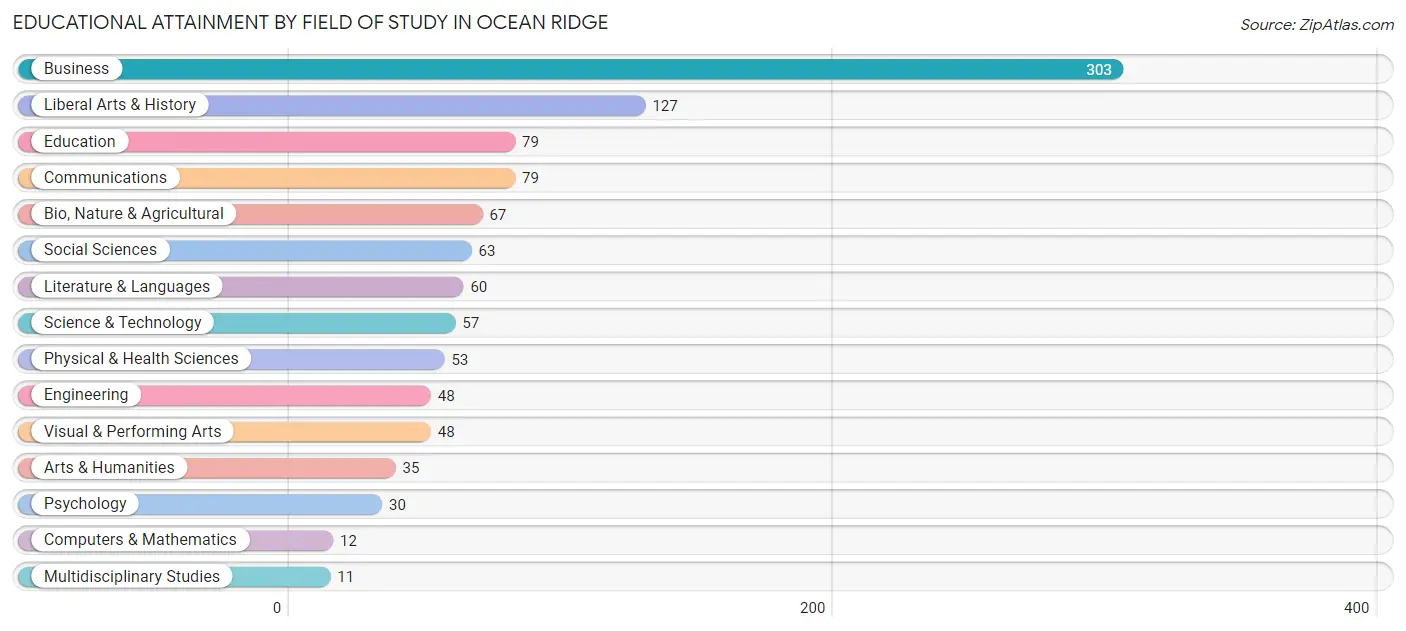
| Field of Study | # Graduates | % Graduates |
| Computers & Mathematics | 12 | 1.1% |
| Bio, Nature & Agricultural | 67 | 6.2% |
| Physical & Health Sciences | 53 | 4.9% |
| Psychology | 30 | 2.8% |
| Social Sciences | 63 | 5.9% |
| Engineering | 48 | 4.5% |
| Multidisciplinary Studies | 11 | 1.0% |
| Science & Technology | 57 | 5.3% |
| Business | 303 | 28.3% |
| Education | 79 | 7.4% |
| Literature & Languages | 60 | 5.6% |
| Liberal Arts & History | 127 | 11.8% |
| Visual & Performing Arts | 48 | 4.5% |
| Communications | 79 | 7.4% |
| Arts & Humanities | 35 | 3.3% |
| Total | 1,072 | 100.0% |
Transportation & Commute in Ocean Ridge
Vehicle Availability by Sex in Ocean Ridge
The most prevalent vehicle ownership categories in Ocean Ridge are males with 2 vehicles (191, accounting for 37.9%) and females with 2 vehicles (97, making up 67.0%).
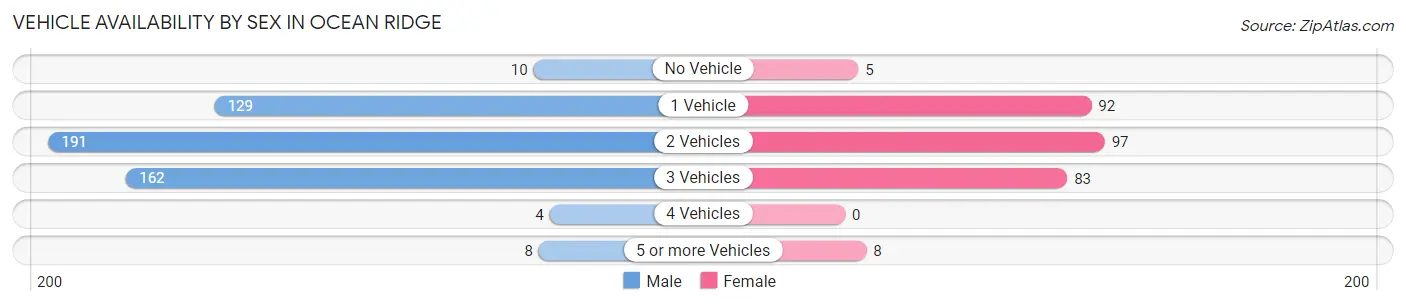
| Vehicles Available | Male | Female |
| No Vehicle | 10 (2.0%) | 5 (1.8%) |
| 1 Vehicle | 129 (25.6%) | 92 (32.3%) |
| 2 Vehicles | 191 (37.9%) | 97 (34.0%) |
| 3 Vehicles | 162 (32.1%) | 83 (29.1%) |
| 4 Vehicles | 4 (0.8%) | 0 (0.0%) |
| 5 or more Vehicles | 8 (1.6%) | 8 (2.8%) |
| Total | 504 (100.0%) | 285 (100.0%) |
Commute Time in Ocean Ridge
The most frequently occuring commute durations in Ocean Ridge are 15 to 19 minutes (150 commuters, 23.1%), 20 to 24 minutes (149 commuters, 22.9%), and 30 to 34 minutes (86 commuters, 13.2%).
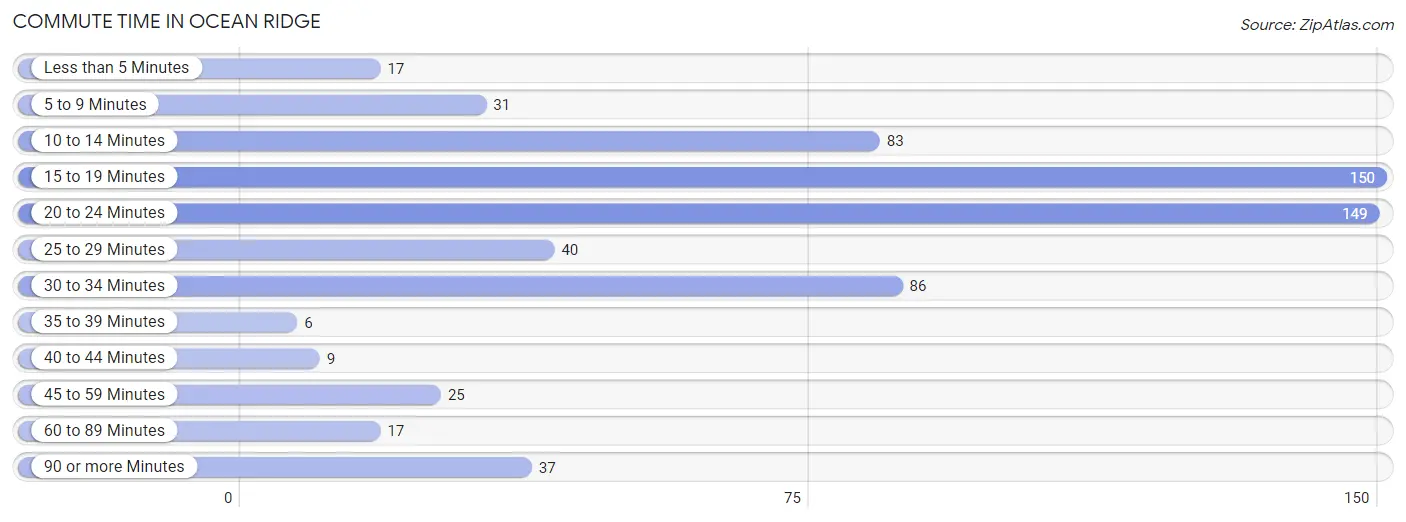
| Commute Time | # Commuters | % Commuters |
| Less than 5 Minutes | 17 | 2.6% |
| 5 to 9 Minutes | 31 | 4.8% |
| 10 to 14 Minutes | 83 | 12.8% |
| 15 to 19 Minutes | 150 | 23.1% |
| 20 to 24 Minutes | 149 | 22.9% |
| 25 to 29 Minutes | 40 | 6.1% |
| 30 to 34 Minutes | 86 | 13.2% |
| 35 to 39 Minutes | 6 | 0.9% |
| 40 to 44 Minutes | 9 | 1.4% |
| 45 to 59 Minutes | 25 | 3.8% |
| 60 to 89 Minutes | 17 | 2.6% |
| 90 or more Minutes | 37 | 5.7% |
Commute Time by Sex in Ocean Ridge
The most common commute times in Ocean Ridge are 20 to 24 minutes (115 commuters, 27.3%) for males and 15 to 19 minutes (59 commuters, 25.9%) for females.
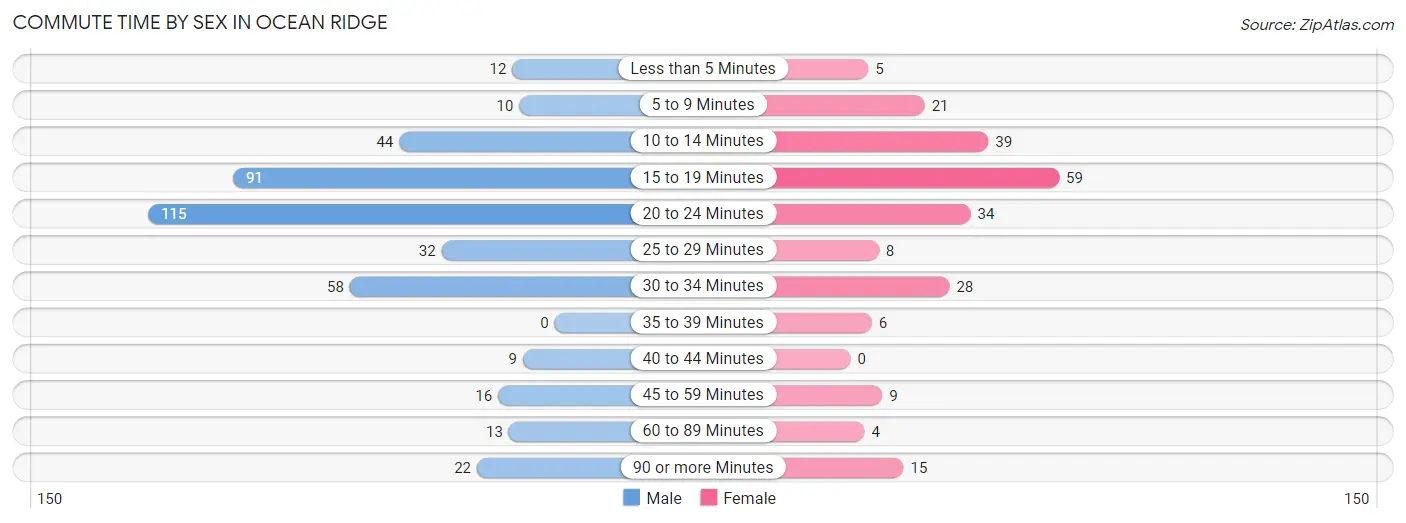
| Commute Time | Male | Female |
| Less than 5 Minutes | 12 (2.8%) | 5 (2.2%) |
| 5 to 9 Minutes | 10 (2.4%) | 21 (9.2%) |
| 10 to 14 Minutes | 44 (10.4%) | 39 (17.1%) |
| 15 to 19 Minutes | 91 (21.6%) | 59 (25.9%) |
| 20 to 24 Minutes | 115 (27.3%) | 34 (14.9%) |
| 25 to 29 Minutes | 32 (7.6%) | 8 (3.5%) |
| 30 to 34 Minutes | 58 (13.7%) | 28 (12.3%) |
| 35 to 39 Minutes | 0 (0.0%) | 6 (2.6%) |
| 40 to 44 Minutes | 9 (2.1%) | 0 (0.0%) |
| 45 to 59 Minutes | 16 (3.8%) | 9 (4.0%) |
| 60 to 89 Minutes | 13 (3.1%) | 4 (1.8%) |
| 90 or more Minutes | 22 (5.2%) | 15 (6.6%) |
Time of Departure to Work by Sex in Ocean Ridge
The most frequent times of departure to work in Ocean Ridge are 9:00 AM to 9:59 AM (102, 24.2%) for males and 8:00 AM to 8:29 AM (77, 33.8%) for females.
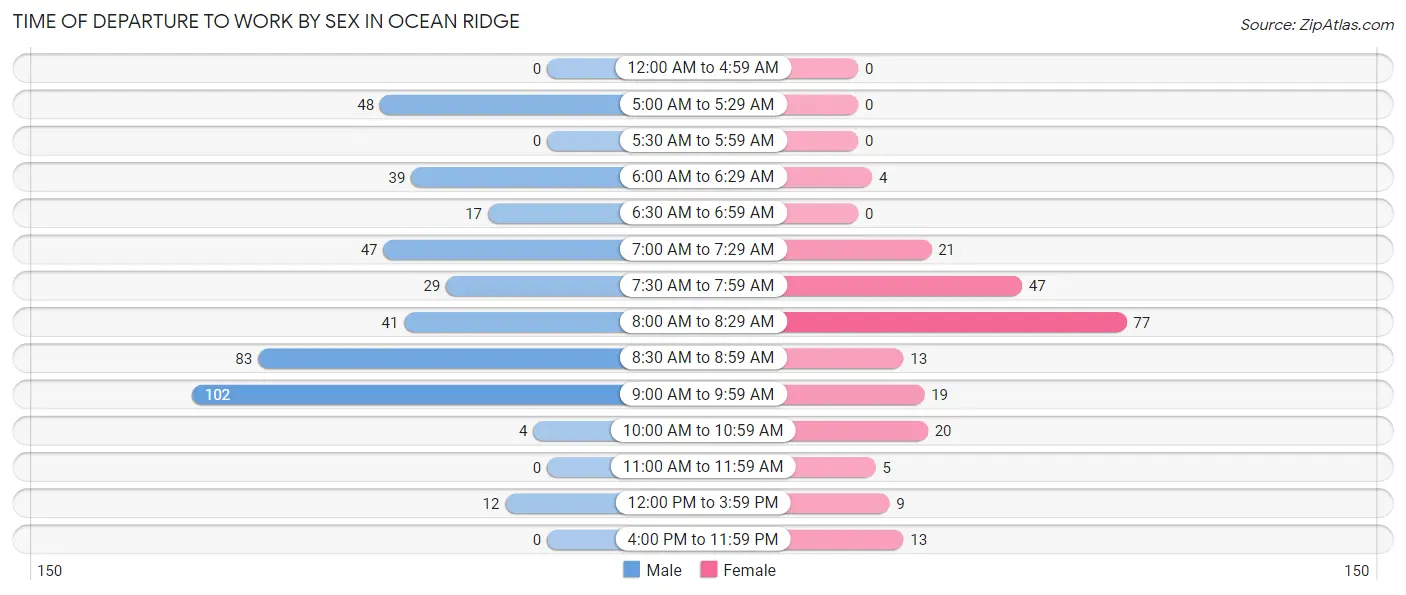
| Time of Departure | Male | Female |
| 12:00 AM to 4:59 AM | 0 (0.0%) | 0 (0.0%) |
| 5:00 AM to 5:29 AM | 48 (11.4%) | 0 (0.0%) |
| 5:30 AM to 5:59 AM | 0 (0.0%) | 0 (0.0%) |
| 6:00 AM to 6:29 AM | 39 (9.2%) | 4 (1.8%) |
| 6:30 AM to 6:59 AM | 17 (4.0%) | 0 (0.0%) |
| 7:00 AM to 7:29 AM | 47 (11.1%) | 21 (9.2%) |
| 7:30 AM to 7:59 AM | 29 (6.9%) | 47 (20.6%) |
| 8:00 AM to 8:29 AM | 41 (9.7%) | 77 (33.8%) |
| 8:30 AM to 8:59 AM | 83 (19.7%) | 13 (5.7%) |
| 9:00 AM to 9:59 AM | 102 (24.2%) | 19 (8.3%) |
| 10:00 AM to 10:59 AM | 4 (0.9%) | 20 (8.8%) |
| 11:00 AM to 11:59 AM | 0 (0.0%) | 5 (2.2%) |
| 12:00 PM to 3:59 PM | 12 (2.8%) | 9 (4.0%) |
| 4:00 PM to 11:59 PM | 0 (0.0%) | 13 (5.7%) |
| Total | 422 (100.0%) | 228 (100.0%) |
Housing Occupancy in Ocean Ridge
Occupancy by Ownership in Ocean Ridge
Of the total 891 dwellings in Ocean Ridge, owner-occupied units account for 739 (82.9%), while renter-occupied units make up 152 (17.1%).
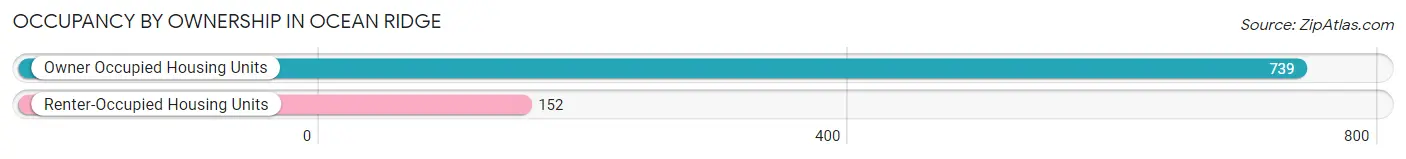
| Occupancy | # Housing Units | % Housing Units |
| Owner Occupied Housing Units | 739 | 82.9% |
| Renter-Occupied Housing Units | 152 | 17.1% |
| Total Occupied Housing Units | 891 | 100.0% |
Occupancy by Household Size in Ocean Ridge
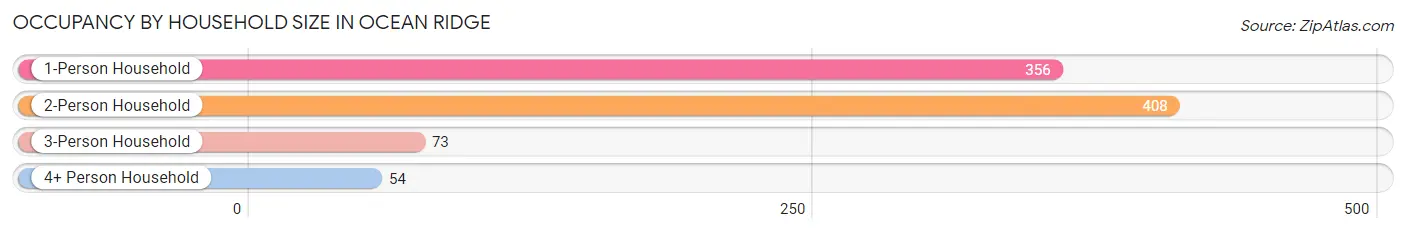
| Household Size | # Housing Units | % Housing Units |
| 1-Person Household | 356 | 40.0% |
| 2-Person Household | 408 | 45.8% |
| 3-Person Household | 73 | 8.2% |
| 4+ Person Household | 54 | 6.1% |
| Total Housing Units | 891 | 100.0% |
Occupancy by Ownership by Household Size in Ocean Ridge
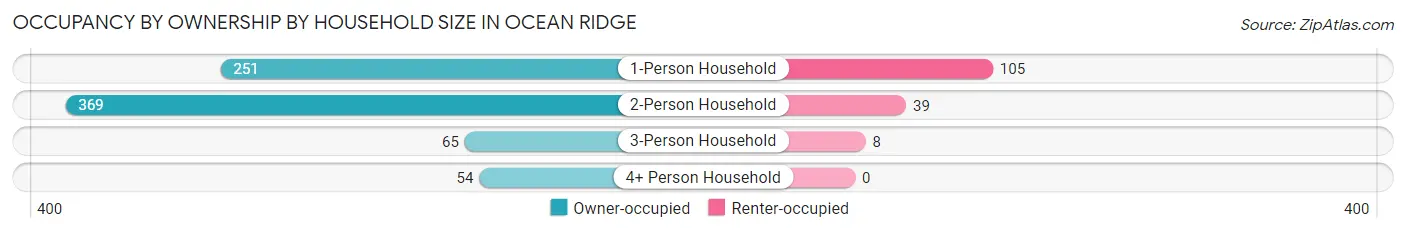
| Household Size | Owner-occupied | Renter-occupied |
| 1-Person Household | 251 (70.5%) | 105 (29.5%) |
| 2-Person Household | 369 (90.4%) | 39 (9.6%) |
| 3-Person Household | 65 (89.0%) | 8 (11.0%) |
| 4+ Person Household | 54 (100.0%) | 0 (0.0%) |
| Total Housing Units | 739 (82.9%) | 152 (17.1%) |
Occupancy by Educational Attainment in Ocean Ridge
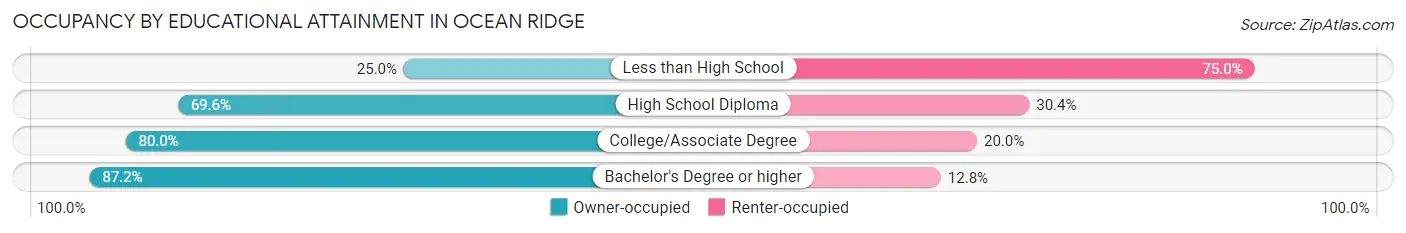
| Household Size | Owner-occupied | Renter-occupied |
| Less than High School | 6 (25.0%) | 18 (75.0%) |
| High School Diploma | 39 (69.6%) | 17 (30.4%) |
| College/Associate Degree | 144 (80.0%) | 36 (20.0%) |
| Bachelor's Degree or higher | 550 (87.2%) | 81 (12.8%) |
Occupancy by Age of Householder in Ocean Ridge
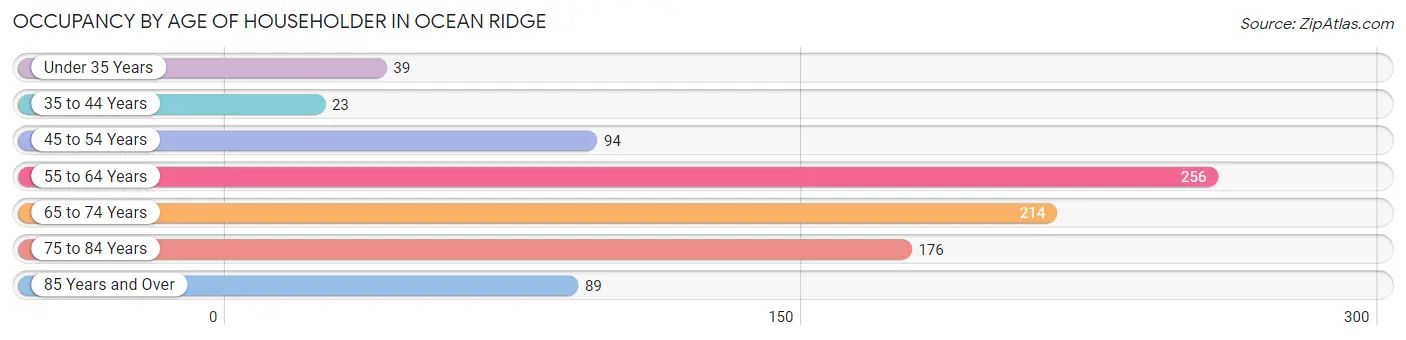
| Age Bracket | # Households | % Households |
| Under 35 Years | 39 | 4.4% |
| 35 to 44 Years | 23 | 2.6% |
| 45 to 54 Years | 94 | 10.5% |
| 55 to 64 Years | 256 | 28.7% |
| 65 to 74 Years | 214 | 24.0% |
| 75 to 84 Years | 176 | 19.8% |
| 85 Years and Over | 89 | 10.0% |
| Total | 891 | 100.0% |
Housing Finances in Ocean Ridge
Median Income by Occupancy in Ocean Ridge
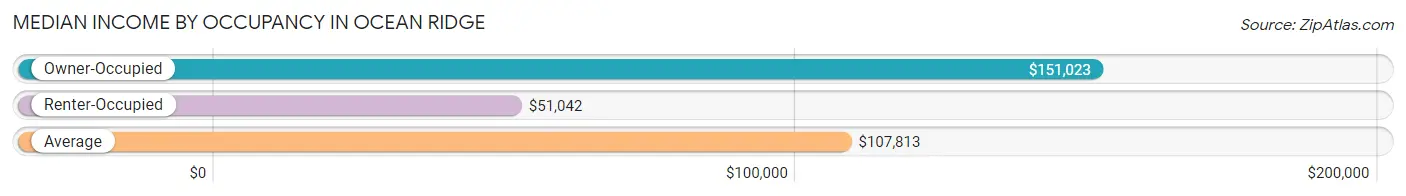
| Occupancy Type | # Households | Median Income |
| Owner-Occupied | 739 (82.9%) | $151,023 |
| Renter-Occupied | 152 (17.1%) | $51,042 |
| Average | 891 (100.0%) | $107,813 |
Occupancy by Householder Income Bracket in Ocean Ridge
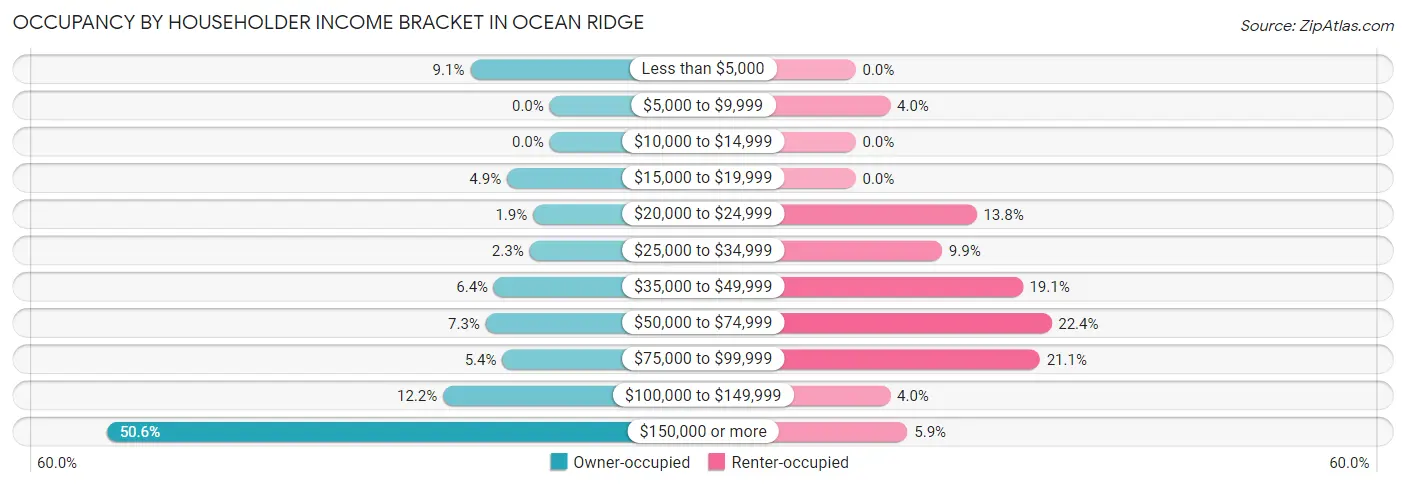
| Income Bracket | Owner-occupied | Renter-occupied |
| Less than $5,000 | 67 (9.1%) | 0 (0.0%) |
| $5,000 to $9,999 | 0 (0.0%) | 6 (4.0%) |
| $10,000 to $14,999 | 0 (0.0%) | 0 (0.0%) |
| $15,000 to $19,999 | 36 (4.9%) | 0 (0.0%) |
| $20,000 to $24,999 | 14 (1.9%) | 21 (13.8%) |
| $25,000 to $34,999 | 17 (2.3%) | 15 (9.9%) |
| $35,000 to $49,999 | 47 (6.4%) | 29 (19.1%) |
| $50,000 to $74,999 | 54 (7.3%) | 34 (22.4%) |
| $75,000 to $99,999 | 40 (5.4%) | 32 (21.0%) |
| $100,000 to $149,999 | 90 (12.2%) | 6 (4.0%) |
| $150,000 or more | 374 (50.6%) | 9 (5.9%) |
| Total | 739 (100.0%) | 152 (100.0%) |
Monthly Housing Cost Tiers in Ocean Ridge
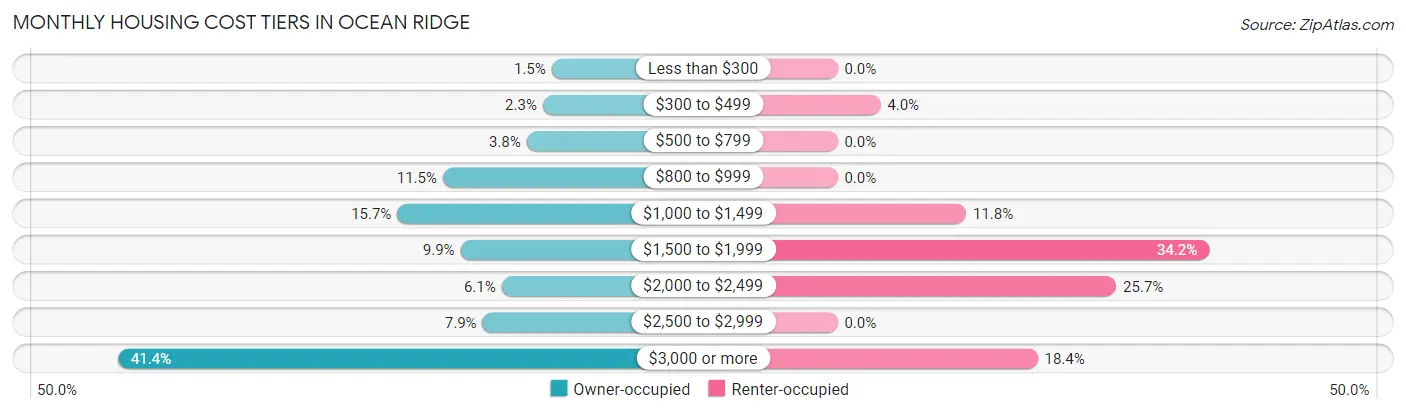
| Monthly Cost | Owner-occupied | Renter-occupied |
| Less than $300 | 11 (1.5%) | 0 (0.0%) |
| $300 to $499 | 17 (2.3%) | 6 (4.0%) |
| $500 to $799 | 28 (3.8%) | 0 (0.0%) |
| $800 to $999 | 85 (11.5%) | 0 (0.0%) |
| $1,000 to $1,499 | 116 (15.7%) | 18 (11.8%) |
| $1,500 to $1,999 | 73 (9.9%) | 52 (34.2%) |
| $2,000 to $2,499 | 45 (6.1%) | 39 (25.7%) |
| $2,500 to $2,999 | 58 (7.9%) | 0 (0.0%) |
| $3,000 or more | 306 (41.4%) | 28 (18.4%) |
| Total | 739 (100.0%) | 152 (100.0%) |
Physical Housing Characteristics in Ocean Ridge
Housing Structures in Ocean Ridge
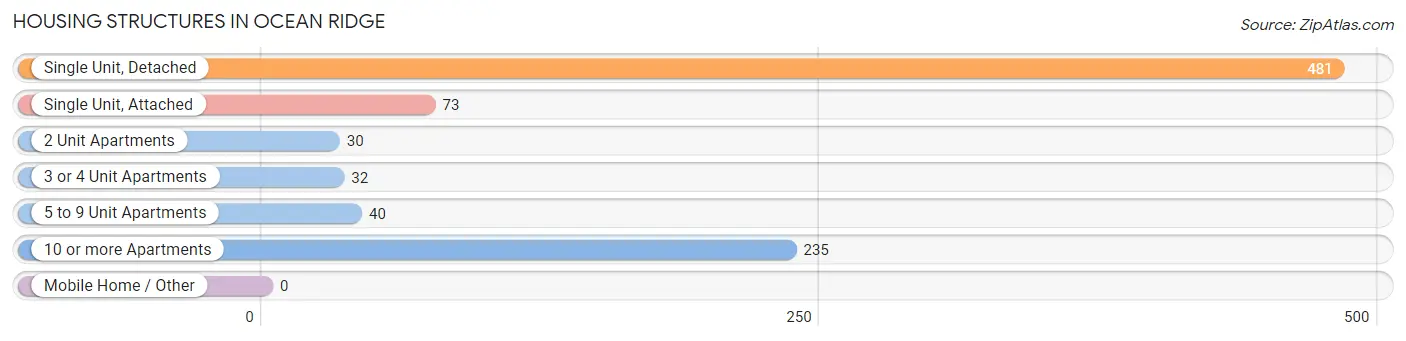
| Structure Type | # Housing Units | % Housing Units |
| Single Unit, Detached | 481 | 54.0% |
| Single Unit, Attached | 73 | 8.2% |
| 2 Unit Apartments | 30 | 3.4% |
| 3 or 4 Unit Apartments | 32 | 3.6% |
| 5 to 9 Unit Apartments | 40 | 4.5% |
| 10 or more Apartments | 235 | 26.4% |
| Mobile Home / Other | 0 | 0.0% |
| Total | 891 | 100.0% |
Housing Structures by Occupancy in Ocean Ridge
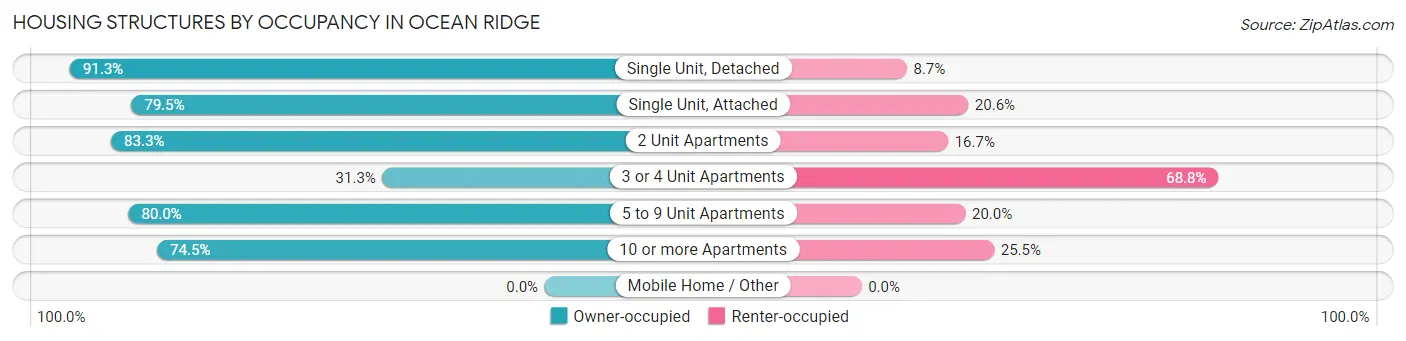
| Structure Type | Owner-occupied | Renter-occupied |
| Single Unit, Detached | 439 (91.3%) | 42 (8.7%) |
| Single Unit, Attached | 58 (79.4%) | 15 (20.5%) |
| 2 Unit Apartments | 25 (83.3%) | 5 (16.7%) |
| 3 or 4 Unit Apartments | 10 (31.2%) | 22 (68.8%) |
| 5 to 9 Unit Apartments | 32 (80.0%) | 8 (20.0%) |
| 10 or more Apartments | 175 (74.5%) | 60 (25.5%) |
| Mobile Home / Other | 0 (0.0%) | 0 (0.0%) |
| Total | 739 (82.9%) | 152 (17.1%) |
Housing Structures by Number of Rooms in Ocean Ridge
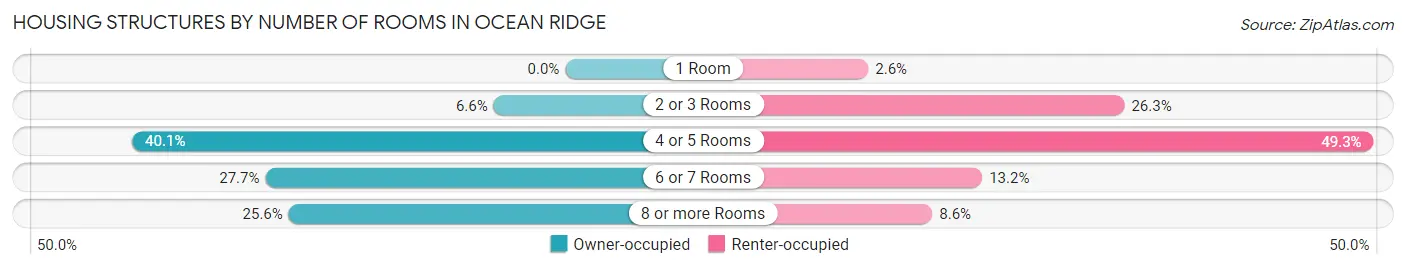
| Number of Rooms | Owner-occupied | Renter-occupied |
| 1 Room | 0 (0.0%) | 4 (2.6%) |
| 2 or 3 Rooms | 49 (6.6%) | 40 (26.3%) |
| 4 or 5 Rooms | 296 (40.1%) | 75 (49.3%) |
| 6 or 7 Rooms | 205 (27.7%) | 20 (13.2%) |
| 8 or more Rooms | 189 (25.6%) | 13 (8.6%) |
| Total | 739 (100.0%) | 152 (100.0%) |
Housing Structure by Heating Type in Ocean Ridge
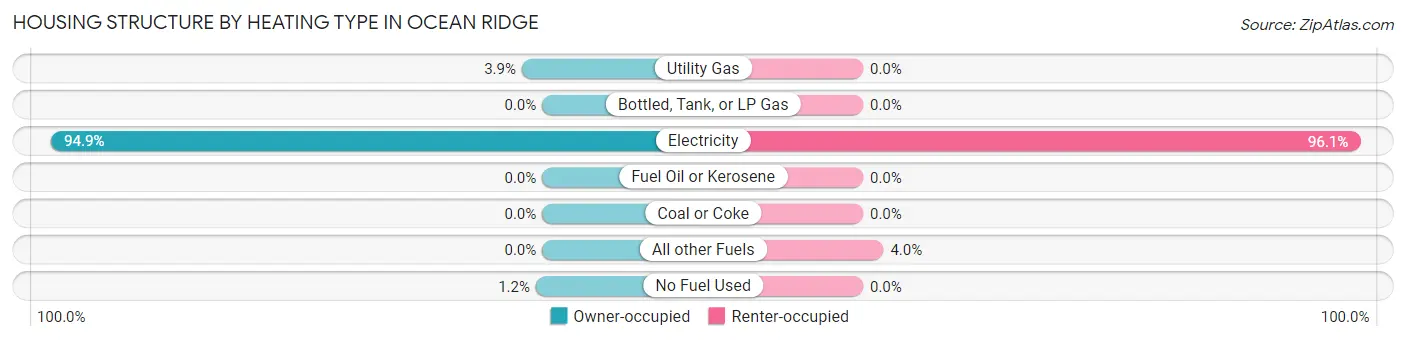
| Heating Type | Owner-occupied | Renter-occupied |
| Utility Gas | 29 (3.9%) | 0 (0.0%) |
| Bottled, Tank, or LP Gas | 0 (0.0%) | 0 (0.0%) |
| Electricity | 701 (94.9%) | 146 (96.1%) |
| Fuel Oil or Kerosene | 0 (0.0%) | 0 (0.0%) |
| Coal or Coke | 0 (0.0%) | 0 (0.0%) |
| All other Fuels | 0 (0.0%) | 6 (4.0%) |
| No Fuel Used | 9 (1.2%) | 0 (0.0%) |
| Total | 739 (100.0%) | 152 (100.0%) |
Household Vehicle Usage in Ocean Ridge
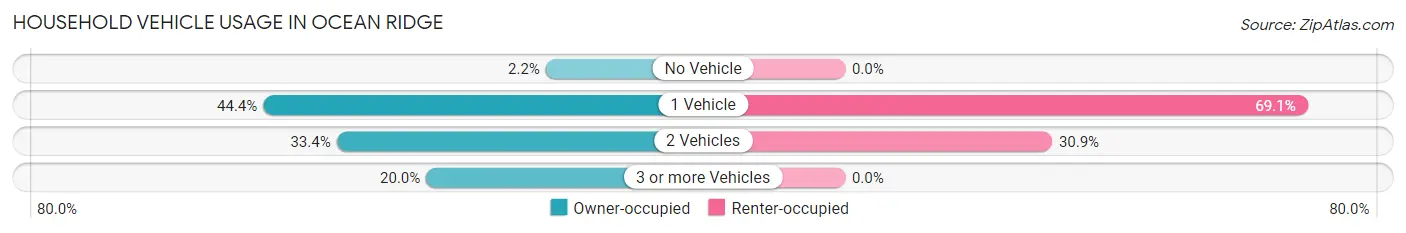
| Vehicles per Household | Owner-occupied | Renter-occupied |
| No Vehicle | 16 (2.2%) | 0 (0.0%) |
| 1 Vehicle | 328 (44.4%) | 105 (69.1%) |
| 2 Vehicles | 247 (33.4%) | 47 (30.9%) |
| 3 or more Vehicles | 148 (20.0%) | 0 (0.0%) |
| Total | 739 (100.0%) | 152 (100.0%) |
Real Estate & Mortgages in Ocean Ridge
Real Estate and Mortgage Overview in Ocean Ridge
| Characteristic | Without Mortgage | With Mortgage |
| Housing Units | 484 | 255 |
| Median Property Value | $976,600 | $1,157,100 |
| Median Household Income | $101,500 | $183 |
| Monthly Housing Costs | $1,501 | $164 |
| Real Estate Taxes | $10,001 | $0 |
Property Value by Mortgage Status in Ocean Ridge
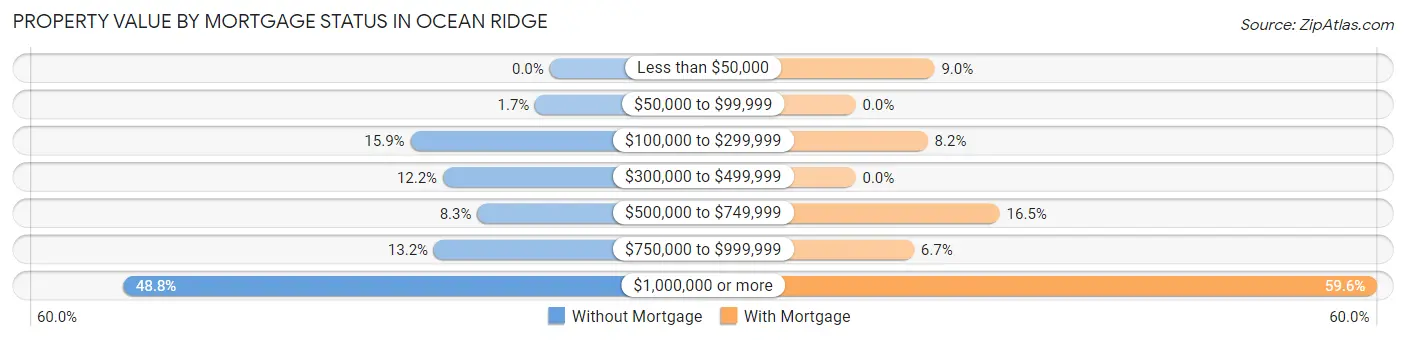
| Property Value | Without Mortgage | With Mortgage |
| Less than $50,000 | 0 (0.0%) | 23 (9.0%) |
| $50,000 to $99,999 | 8 (1.7%) | 0 (0.0%) |
| $100,000 to $299,999 | 77 (15.9%) | 21 (8.2%) |
| $300,000 to $499,999 | 59 (12.2%) | 0 (0.0%) |
| $500,000 to $749,999 | 40 (8.3%) | 42 (16.5%) |
| $750,000 to $999,999 | 64 (13.2%) | 17 (6.7%) |
| $1,000,000 or more | 236 (48.8%) | 152 (59.6%) |
| Total | 484 (100.0%) | 255 (100.0%) |
Household Income by Mortgage Status in Ocean Ridge
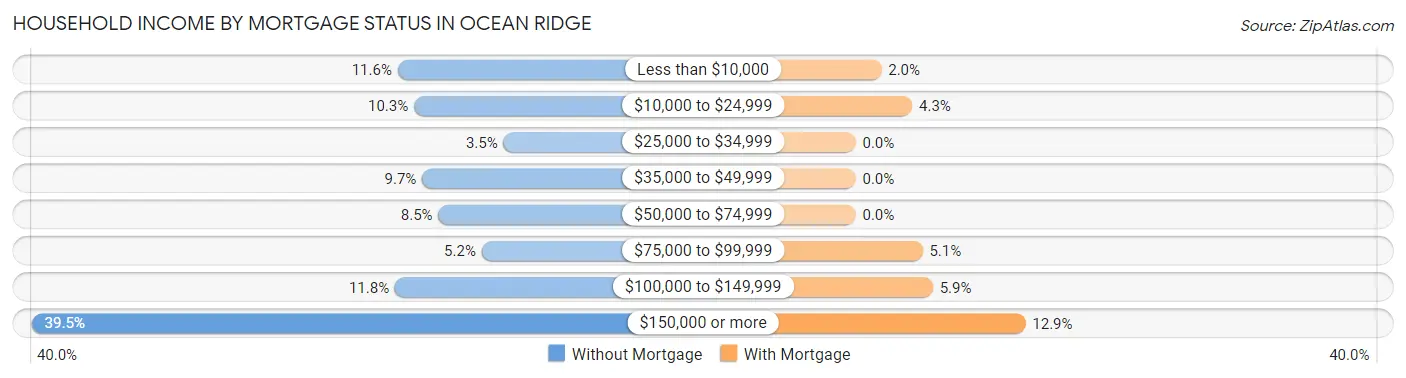
| Household Income | Without Mortgage | With Mortgage |
| Less than $10,000 | 56 (11.6%) | 5 (2.0%) |
| $10,000 to $24,999 | 50 (10.3%) | 11 (4.3%) |
| $25,000 to $34,999 | 17 (3.5%) | 0 (0.0%) |
| $35,000 to $49,999 | 47 (9.7%) | 0 (0.0%) |
| $50,000 to $74,999 | 41 (8.5%) | 0 (0.0%) |
| $75,000 to $99,999 | 25 (5.2%) | 13 (5.1%) |
| $100,000 to $149,999 | 57 (11.8%) | 15 (5.9%) |
| $150,000 or more | 191 (39.5%) | 33 (12.9%) |
| Total | 484 (100.0%) | 255 (100.0%) |
Property Value to Household Income Ratio in Ocean Ridge
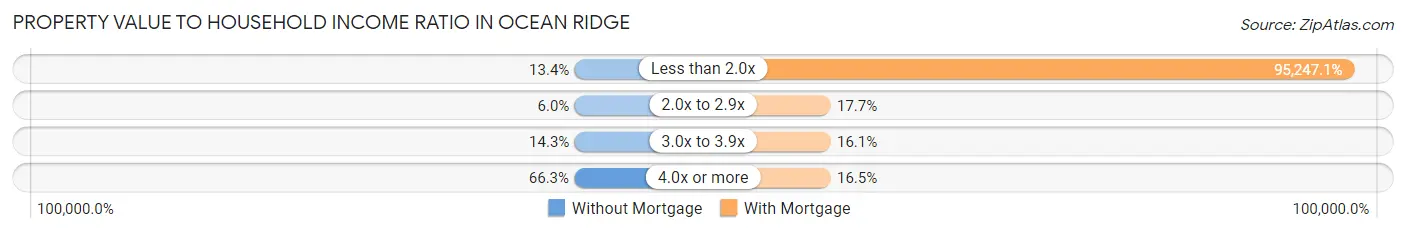
| Value-to-Income Ratio | Without Mortgage | With Mortgage |
| Less than 2.0x | 65 (13.4%) | 242,880 (95,247.1%) |
| 2.0x to 2.9x | 29 (6.0%) | 45 (17.6%) |
| 3.0x to 3.9x | 69 (14.3%) | 41 (16.1%) |
| 4.0x or more | 321 (66.3%) | 42 (16.5%) |
| Total | 484 (100.0%) | 255 (100.0%) |
Real Estate Taxes by Mortgage Status in Ocean Ridge
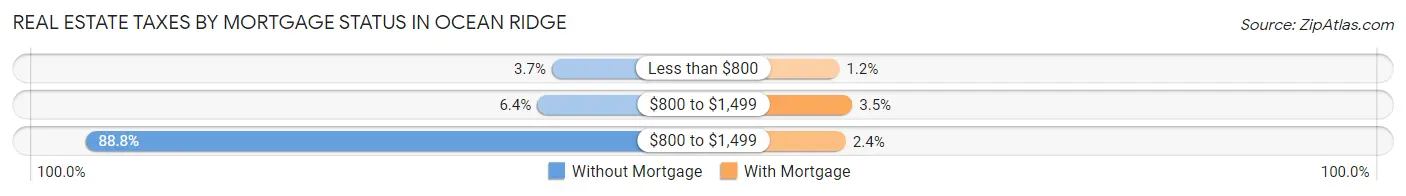
| Property Taxes | Without Mortgage | With Mortgage |
| Less than $800 | 18 (3.7%) | 3 (1.2%) |
| $800 to $1,499 | 31 (6.4%) | 9 (3.5%) |
| $800 to $1,499 | 430 (88.8%) | 6 (2.4%) |
| Total | 484 (100.0%) | 255 (100.0%) |
Health & Disability in Ocean Ridge
Health Insurance Coverage by Age in Ocean Ridge
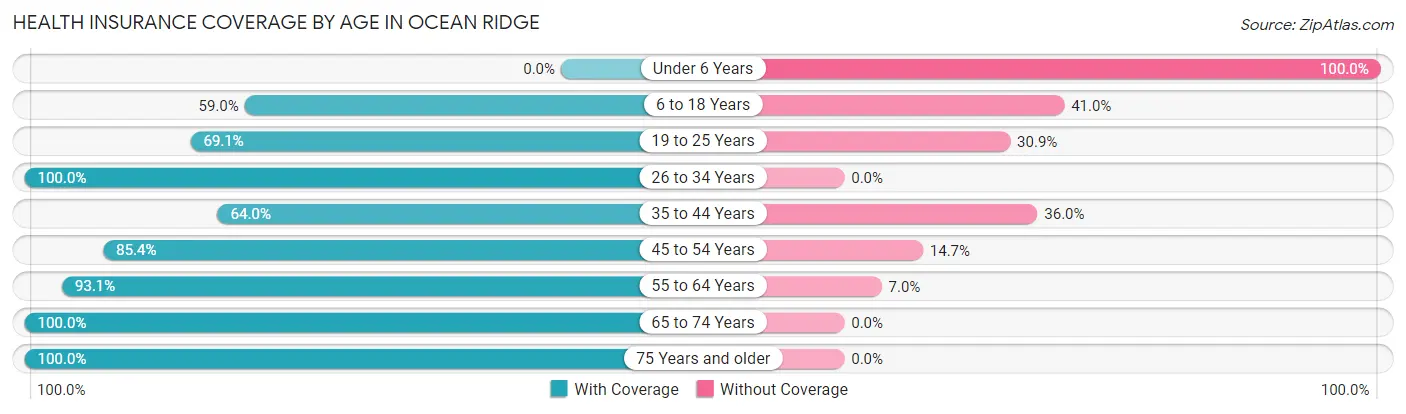
| Age Bracket | With Coverage | Without Coverage |
| Under 6 Years | 0 (0.0%) | 51 (100.0%) |
| 6 to 18 Years | 82 (59.0%) | 57 (41.0%) |
| 19 to 25 Years | 67 (69.1%) | 30 (30.9%) |
| 26 to 34 Years | 78 (100.0%) | 0 (0.0%) |
| 35 to 44 Years | 64 (64.0%) | 36 (36.0%) |
| 45 to 54 Years | 134 (85.4%) | 23 (14.6%) |
| 55 to 64 Years | 375 (93.0%) | 28 (7.0%) |
| 65 to 74 Years | 353 (100.0%) | 0 (0.0%) |
| 75 Years and older | 334 (100.0%) | 0 (0.0%) |
| Total | 1,487 (86.9%) | 225 (13.1%) |
Health Insurance Coverage by Citizenship Status in Ocean Ridge
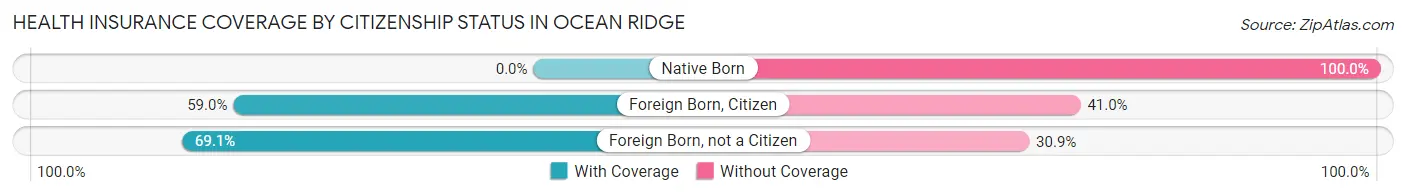
| Citizenship Status | With Coverage | Without Coverage |
| Native Born | 0 (0.0%) | 51 (100.0%) |
| Foreign Born, Citizen | 82 (59.0%) | 57 (41.0%) |
| Foreign Born, not a Citizen | 67 (69.1%) | 30 (30.9%) |
Health Insurance Coverage by Household Income in Ocean Ridge
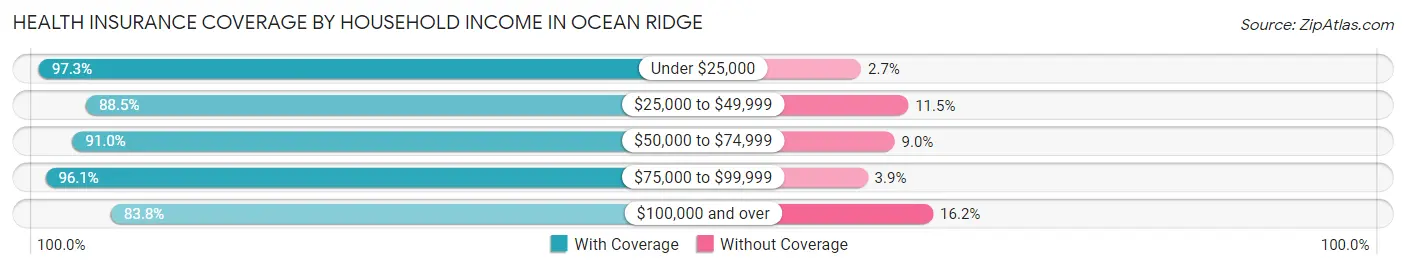
| Household Income | With Coverage | Without Coverage |
| Under $25,000 | 145 (97.3%) | 4 (2.7%) |
| $25,000 to $49,999 | 123 (88.5%) | 16 (11.5%) |
| $50,000 to $74,999 | 122 (91.0%) | 12 (9.0%) |
| $75,000 to $99,999 | 123 (96.1%) | 5 (3.9%) |
| $100,000 and over | 974 (83.8%) | 188 (16.2%) |
Public vs Private Health Insurance Coverage by Age in Ocean Ridge
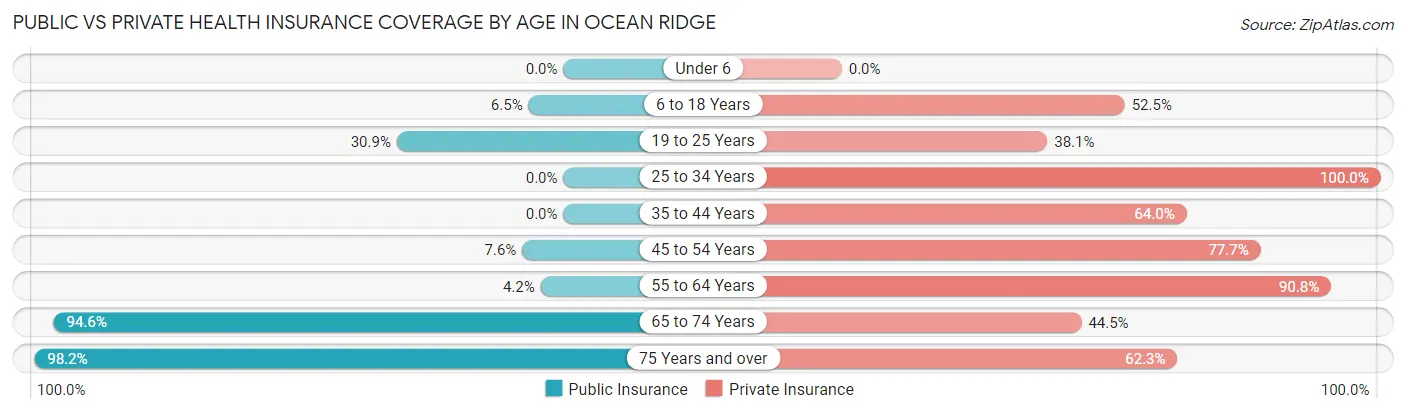
| Age Bracket | Public Insurance | Private Insurance |
| Under 6 | 0 (0.0%) | 0 (0.0%) |
| 6 to 18 Years | 9 (6.5%) | 73 (52.5%) |
| 19 to 25 Years | 30 (30.9%) | 37 (38.1%) |
| 25 to 34 Years | 0 (0.0%) | 78 (100.0%) |
| 35 to 44 Years | 0 (0.0%) | 64 (64.0%) |
| 45 to 54 Years | 12 (7.6%) | 122 (77.7%) |
| 55 to 64 Years | 17 (4.2%) | 366 (90.8%) |
| 65 to 74 Years | 334 (94.6%) | 157 (44.5%) |
| 75 Years and over | 328 (98.2%) | 208 (62.3%) |
| Total | 730 (42.6%) | 1,105 (64.5%) |
Disability Status by Sex by Age in Ocean Ridge
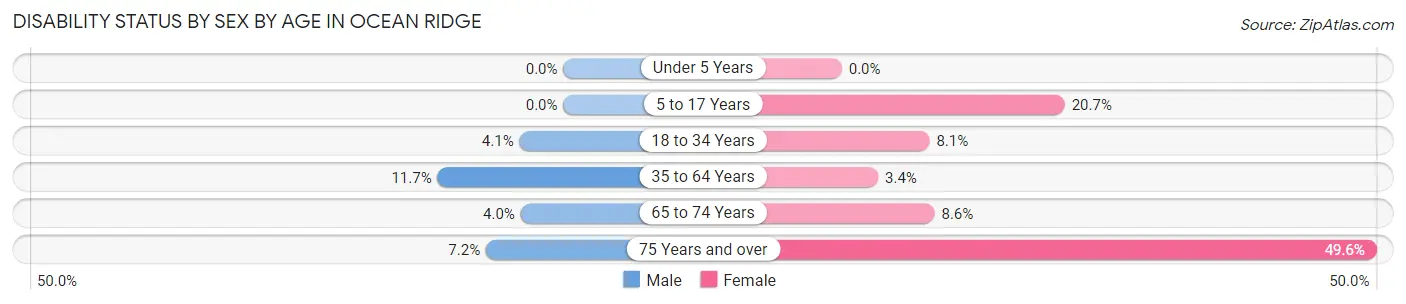
| Age Bracket | Male | Female |
| Under 5 Years | 0 (0.0%) | 0 (0.0%) |
| 5 to 17 Years | 0 (0.0%) | 12 (20.7%) |
| 18 to 34 Years | 5 (4.1%) | 7 (8.1%) |
| 35 to 64 Years | 32 (11.7%) | 13 (3.4%) |
| 65 to 74 Years | 8 (4.0%) | 13 (8.6%) |
| 75 Years and over | 14 (7.2%) | 69 (49.6%) |
Disability Class by Sex by Age in Ocean Ridge
Disability Class: Hearing Difficulty
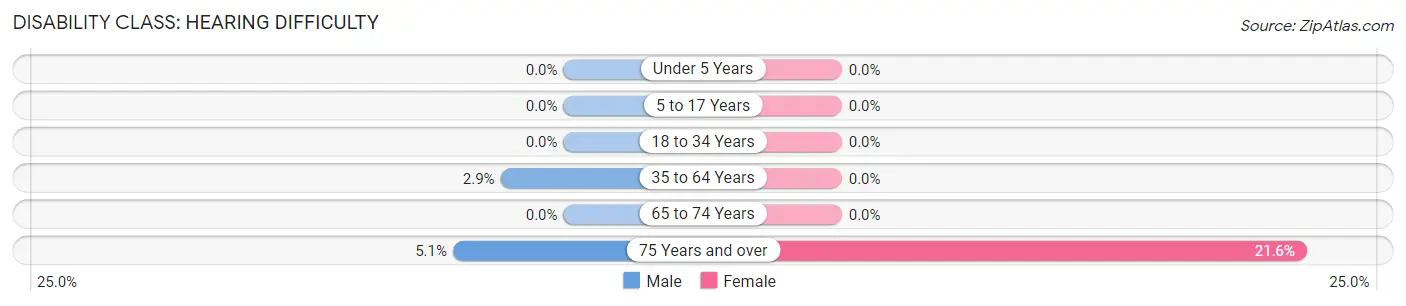
| Age Bracket | Male | Female |
| Under 5 Years | 0 (0.0%) | 0 (0.0%) |
| 5 to 17 Years | 0 (0.0%) | 0 (0.0%) |
| 18 to 34 Years | 0 (0.0%) | 0 (0.0%) |
| 35 to 64 Years | 8 (2.9%) | 0 (0.0%) |
| 65 to 74 Years | 0 (0.0%) | 0 (0.0%) |
| 75 Years and over | 10 (5.1%) | 30 (21.6%) |
Disability Class: Vision Difficulty
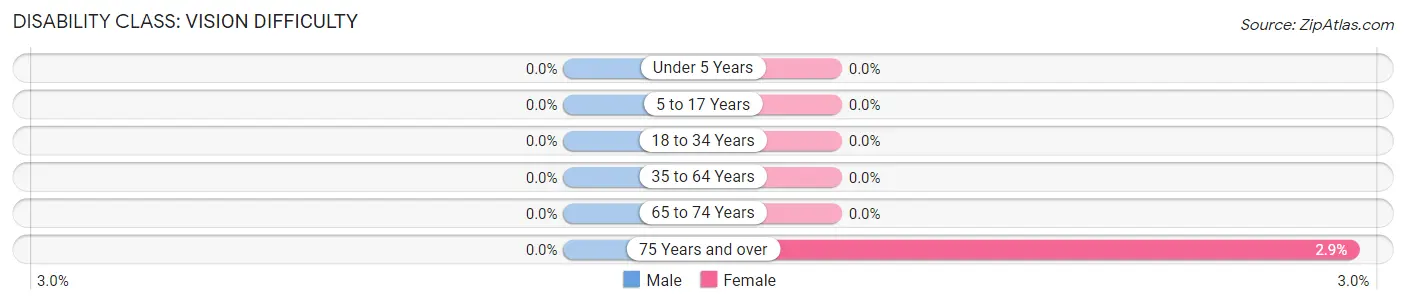
| Age Bracket | Male | Female |
| Under 5 Years | 0 (0.0%) | 0 (0.0%) |
| 5 to 17 Years | 0 (0.0%) | 0 (0.0%) |
| 18 to 34 Years | 0 (0.0%) | 0 (0.0%) |
| 35 to 64 Years | 0 (0.0%) | 0 (0.0%) |
| 65 to 74 Years | 0 (0.0%) | 0 (0.0%) |
| 75 Years and over | 0 (0.0%) | 4 (2.9%) |
Disability Class: Cognitive Difficulty
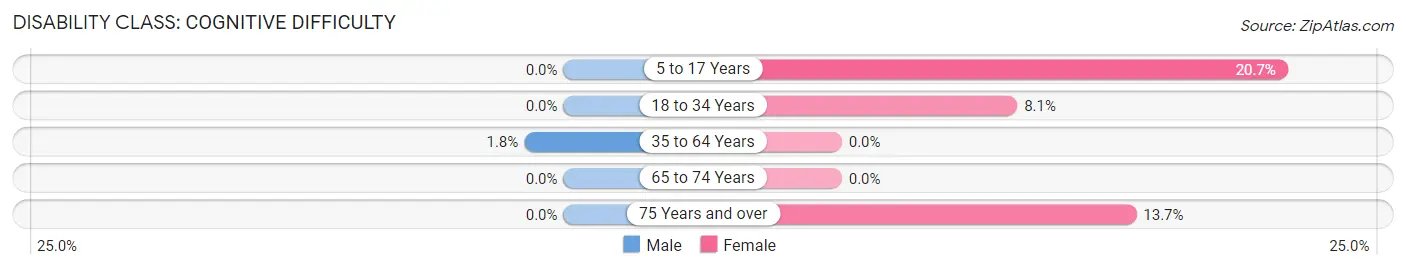
| Age Bracket | Male | Female |
| 5 to 17 Years | 0 (0.0%) | 12 (20.7%) |
| 18 to 34 Years | 0 (0.0%) | 7 (8.1%) |
| 35 to 64 Years | 5 (1.8%) | 0 (0.0%) |
| 65 to 74 Years | 0 (0.0%) | 0 (0.0%) |
| 75 Years and over | 0 (0.0%) | 19 (13.7%) |
Disability Class: Ambulatory Difficulty

| Age Bracket | Male | Female |
| 5 to 17 Years | 0 (0.0%) | 0 (0.0%) |
| 18 to 34 Years | 0 (0.0%) | 0 (0.0%) |
| 35 to 64 Years | 19 (6.9%) | 4 (1.0%) |
| 65 to 74 Years | 0 (0.0%) | 13 (8.6%) |
| 75 Years and over | 9 (4.6%) | 44 (31.7%) |
Disability Class: Self-Care Difficulty
| Age Bracket | Male | Female |
| 5 to 17 Years | 0 (0.0%) | 0 (0.0%) |
| 18 to 34 Years | 0 (0.0%) | 0 (0.0%) |
| 35 to 64 Years | 15 (5.5%) | 0 (0.0%) |
| 65 to 74 Years | 8 (4.0%) | 0 (0.0%) |
| 75 Years and over | 0 (0.0%) | 14 (10.1%) |
Technology Access in Ocean Ridge
Computing Device Access in Ocean Ridge
| Device Type | # Households | % Households |
| Desktop or Laptop | 770 | 86.4% |
| Smartphone | 839 | 94.2% |
| Tablet | 632 | 70.9% |
| No Computing Device | 4 | 0.4% |
| Total | 891 | 100.0% |
Internet Access in Ocean Ridge
| Internet Type | # Households | % Households |
| Dial-Up Internet | 0 | 0.0% |
| Broadband Home | 742 | 83.3% |
| Cellular Data Only | 41 | 4.6% |
| Satellite Internet | 96 | 10.8% |
| No Internet | 91 | 10.2% |
| Total | 891 | 100.0% |
Ocean Ridge Summary
History
Ocean Ridge is a town located in Palm Beach County, Florida. It is situated on the eastern coast of the state, just south of the city of Boynton Beach. The town was incorporated in 1931 and is known for its beautiful beaches and lush tropical vegetation.
The area that is now Ocean Ridge was originally inhabited by the Tequesta Indians, who were a Native American tribe that lived in the area for thousands of years. The first European settlers arrived in the area in the late 1700s, and the town was officially incorporated in 1931.
The town was originally known as Boynton Beach Shores, but the name was changed to Ocean Ridge in 1939. The name was chosen to reflect the town’s proximity to the Atlantic Ocean.
Geography
Ocean Ridge is located in Palm Beach County, Florida. It is situated on the eastern coast of the state, just south of the city of Boynton Beach. The town is bordered by the Atlantic Ocean to the east, the Intracoastal Waterway to the west, and the cities of Boynton Beach and Delray Beach to the north and south, respectively.
The town covers an area of 1.3 square miles and has a population of approximately 2,000 people. The town is located at an elevation of 10 feet above sea level.
The town is known for its beautiful beaches and lush tropical vegetation. The town is home to a variety of wildlife, including sea turtles, manatees, and dolphins.
Economy
The economy of Ocean Ridge is largely based on tourism and real estate. The town is home to a variety of hotels, restaurants, and other businesses that cater to tourists. The town is also home to a number of luxury homes and condominiums, which attract a large number of wealthy buyers.
The town is also home to a number of small businesses, including retail stores, art galleries, and other services. The town is also home to a number of marinas, which provide services to boaters and fishermen.
Demographics
As of the 2010 census, the population of Ocean Ridge was 2,000 people. The racial makeup of the town was 94.2% White, 2.2% African American, 0.7% Asian, 0.3% Native American, and 2.6% from other races.
The median household income in Ocean Ridge was $68,750, and the median family income was $77,500. The per capita income in the town was $37,500.
Conclusion
Ocean Ridge is a small town located in Palm Beach County, Florida. It is situated on the eastern coast of the state, just south of the city of Boynton Beach. The town was incorporated in 1931 and is known for its beautiful beaches and lush tropical vegetation. The economy of Ocean Ridge is largely based on tourism and real estate, and the town is home to a variety of hotels, restaurants, and other businesses that cater to tourists. The population of Ocean Ridge was 2,000 people as of the 2010 census, and the median household income was $68,750.
Common Questions
What is Per Capita Income in Ocean Ridge?
Per Capita income in Ocean Ridge is $126,256.
What is the Median Family Income in Ocean Ridge?
Median Family Income in Ocean Ridge is $224,674.
What is the Median Household income in Ocean Ridge?
Median Household Income in Ocean Ridge is $107,813.
What is Income or Wage Gap in Ocean Ridge?
Income or Wage Gap in Ocean Ridge is 44.7%.
Women in Ocean Ridge earn 55.3 cents for every dollar earned by a man.
What is Inequality or Gini Index in Ocean Ridge?
Inequality or Gini Index in Ocean Ridge is 0.62.
What is the Total Population of Ocean Ridge?
Total Population of Ocean Ridge is 1,712.
What is the Total Male Population of Ocean Ridge?
Total Male Population of Ocean Ridge is 892.
What is the Total Female Population of Ocean Ridge?
Total Female Population of Ocean Ridge is 820.
What is the Ratio of Males per 100 Females in Ocean Ridge?
There are 108.78 Males per 100 Females in Ocean Ridge.
What is the Ratio of Females per 100 Males in Ocean Ridge?
There are 91.93 Females per 100 Males in Ocean Ridge.
What is the Median Population Age in Ocean Ridge?
Median Population Age in Ocean Ridge is 60.0 Years.
What is the Average Family Size in Ocean Ridge
Average Family Size in Ocean Ridge is 2.5 People.
What is the Average Household Size in Ocean Ridge
Average Household Size in Ocean Ridge is 1.9 People.
How Large is the Labor Force in Ocean Ridge?
There are 868 People in the Labor Forcein in Ocean Ridge.
What is the Percentage of People in the Labor Force in Ocean Ridge?
55.8% of People are in the Labor Force in Ocean Ridge.
What is the Unemployment Rate in Ocean Ridge?
Unemployment Rate in Ocean Ridge is 3.5%.