Osprey, FL Map & Demographics
Osprey Map
Osprey Overview
$69,632
PER CAPITA INCOME
$106,547
AVG FAMILY INCOME
$94,860
AVG HOUSEHOLD INCOME
15.8%
WAGE / INCOME GAP [ % ]
84.2¢/ $1
WAGE / INCOME GAP [ $ ]
0.50
INEQUALITY / GINI INDEX
6,195
TOTAL POPULATION
3,174
MALE POPULATION
3,021
FEMALE POPULATION
105.06
MALES / 100 FEMALES
95.18
FEMALES / 100 MALES
60.4
MEDIAN AGE
2.4
AVG FAMILY SIZE
2.2
AVG HOUSEHOLD SIZE
2,146
LABOR FORCE [ PEOPLE ]
38.7%
PERCENT IN LABOR FORCE
2.2%
UNEMPLOYMENT RATE
Osprey Zip Codes
Osprey Area Codes
Income in Osprey
Income Overview in Osprey
Per Capita Income in Osprey is $69,632, while median incomes of families and households are $106,547 and $94,860 respectively.
| Characteristic | Number | Measure |
| Per Capita Income | 6,195 | $69,632 |
| Median Family Income | 2,213 | $106,547 |
| Mean Family Income | 2,213 | $167,319 |
| Median Household Income | 2,855 | $94,860 |
| Mean Household Income | 2,855 | $149,418 |
| Income Deficit | 2,213 | $0 |
| Wage / Income Gap (%) | 6,195 | 15.77% |
| Wage / Income Gap ($) | 6,195 | 84.23¢ per $1 |
| Gini / Inequality Index | 6,195 | 0.50 |
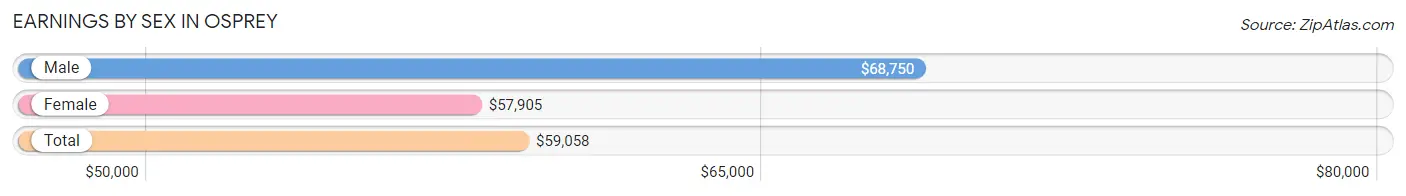
Earnings by Sex in Osprey
Average Earnings in Osprey are $59,058, $68,750 for men and $57,905 for women, a difference of 15.8%.
| Sex | Number | Average Earnings |
| Male | 1,352 (56.7%) | $68,750 |
| Female | 1,032 (43.3%) | $57,905 |
| Total | 2,384 (100.0%) | $59,058 |
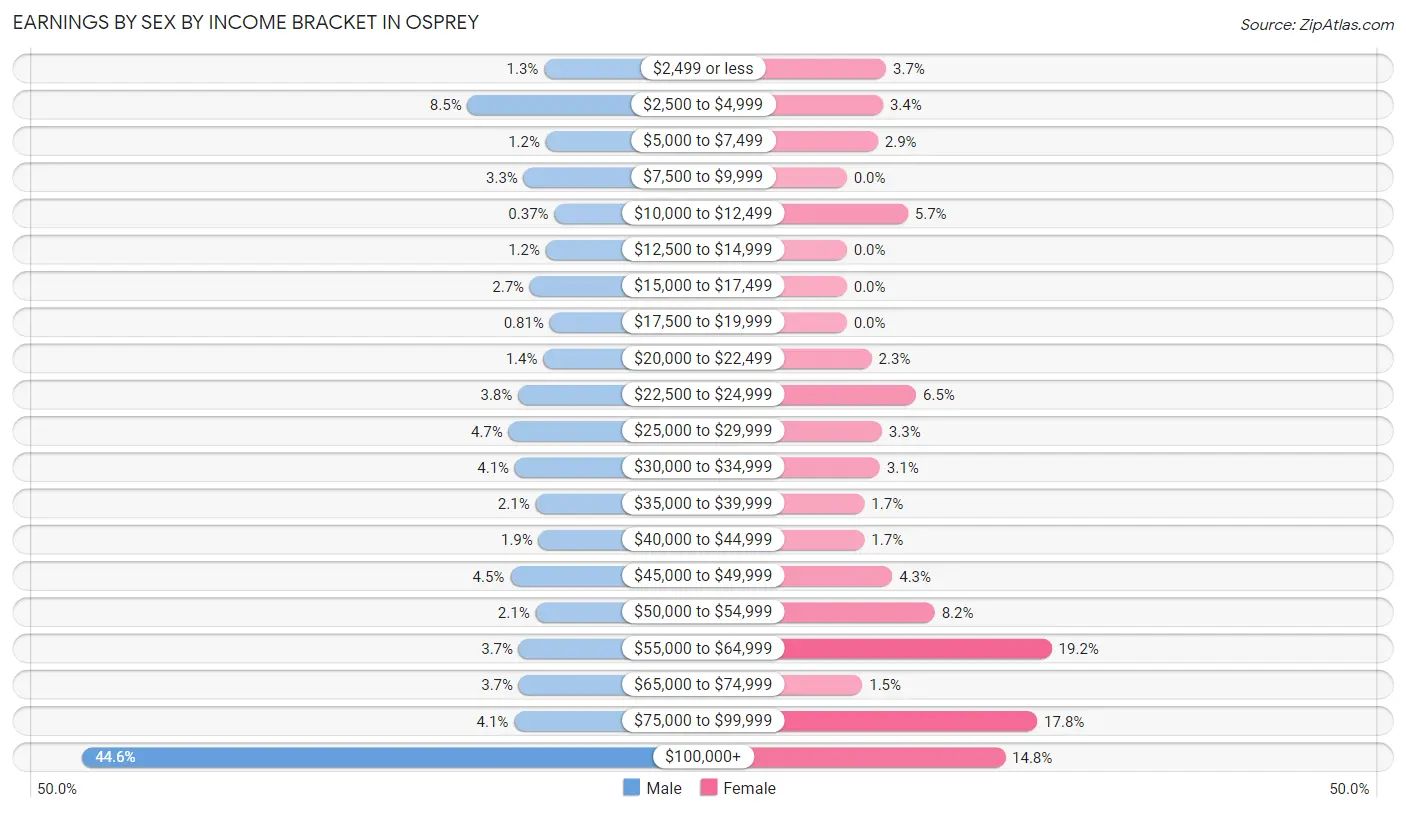
Earnings by Sex by Income Bracket in Osprey
The most common earnings brackets in Osprey are $100,000+ for men (603 | 44.6%) and $55,000 to $64,999 for women (198 | 19.2%).
| Income | Male | Female |
| $2,499 or less | 18 (1.3%) | 38 (3.7%) |
| $2,500 to $4,999 | 115 (8.5%) | 35 (3.4%) |
| $5,000 to $7,499 | 16 (1.2%) | 30 (2.9%) |
| $7,500 to $9,999 | 44 (3.3%) | 0 (0.0%) |
| $10,000 to $12,499 | 5 (0.4%) | 59 (5.7%) |
| $12,500 to $14,999 | 16 (1.2%) | 0 (0.0%) |
| $15,000 to $17,499 | 36 (2.7%) | 0 (0.0%) |
| $17,500 to $19,999 | 11 (0.8%) | 0 (0.0%) |
| $20,000 to $22,499 | 19 (1.4%) | 24 (2.3%) |
| $22,500 to $24,999 | 51 (3.8%) | 67 (6.5%) |
| $25,000 to $29,999 | 63 (4.7%) | 34 (3.3%) |
| $30,000 to $34,999 | 55 (4.1%) | 32 (3.1%) |
| $35,000 to $39,999 | 29 (2.1%) | 17 (1.7%) |
| $40,000 to $44,999 | 25 (1.8%) | 17 (1.7%) |
| $45,000 to $49,999 | 61 (4.5%) | 44 (4.3%) |
| $50,000 to $54,999 | 29 (2.1%) | 85 (8.2%) |
| $55,000 to $64,999 | 50 (3.7%) | 198 (19.2%) |
| $65,000 to $74,999 | 50 (3.7%) | 15 (1.5%) |
| $75,000 to $99,999 | 56 (4.1%) | 184 (17.8%) |
| $100,000+ | 603 (44.6%) | 153 (14.8%) |
| Total | 1,352 (100.0%) | 1,032 (100.0%) |
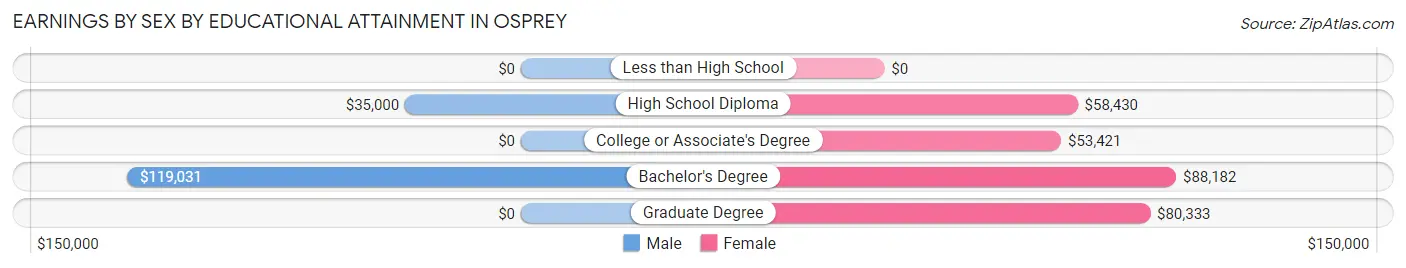
Earnings by Sex by Educational Attainment in Osprey
Average earnings in Osprey are $90,833 for men and $58,961 for women, a difference of 35.1%. Men with an educational attainment of bachelor's degree enjoy the highest average annual earnings of $119,031, while those with high school diploma education earn the least with $35,000. Women with an educational attainment of bachelor's degree earn the most with the average annual earnings of $88,182, while those with college or associate's degree education have the smallest earnings of $53,421.
| Educational Attainment | Male Income | Female Income |
| Less than High School | - | - |
| High School Diploma | $35,000 | $58,430 |
| College or Associate's Degree | - | - |
| Bachelor's Degree | $119,031 | $88,182 |
| Graduate Degree | - | - |
| Total | $90,833 | $58,961 |
Family Income in Osprey
Family Income Brackets in Osprey
According to the Osprey family income data, there are 564 families falling into the $200,000+ income range, which is the most common income bracket and makes up 25.5% of all families. Conversely, the $10,000 to $14,999 income bracket is the least frequent group with only 9 families (0.4%) belonging to this category.
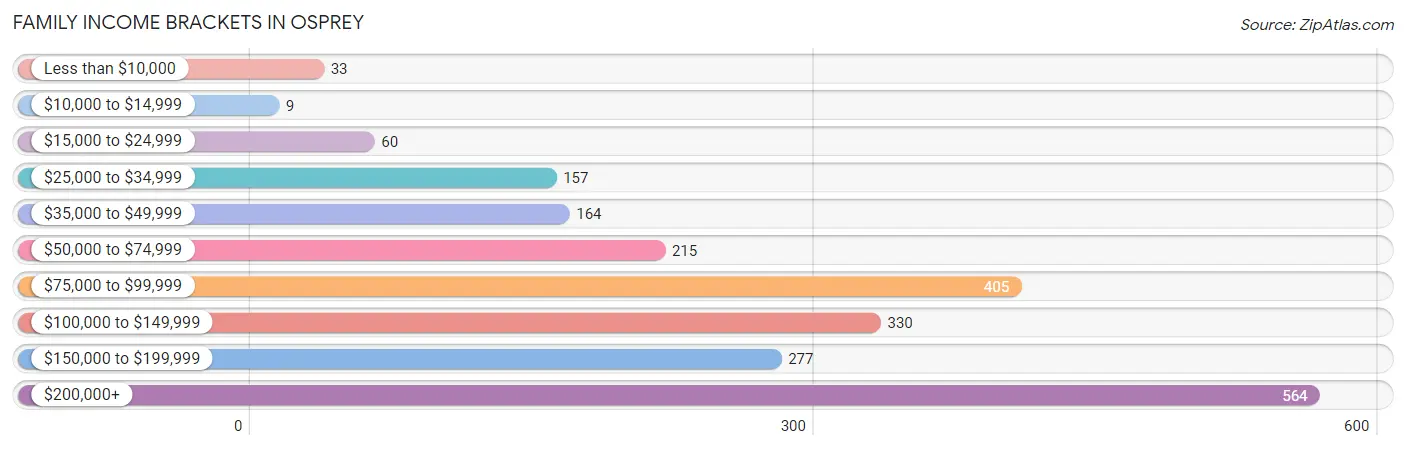
| Income Bracket | # Families | % Families |
| Less than $10,000 | 33 | 1.5% |
| $10,000 to $14,999 | 9 | 0.4% |
| $15,000 to $24,999 | 60 | 2.7% |
| $25,000 to $34,999 | 157 | 7.1% |
| $35,000 to $49,999 | 164 | 7.4% |
| $50,000 to $74,999 | 215 | 9.7% |
| $75,000 to $99,999 | 405 | 18.3% |
| $100,000 to $149,999 | 330 | 14.9% |
| $150,000 to $199,999 | 277 | 12.5% |
| $200,000+ | 564 | 25.5% |
Family Income by Famaliy Size in Osprey
3-person families (289 | 13.1%) account for the highest median family income in Osprey with $126,058 per family, while 2-person families (1,706 | 77.1%) have the highest median income of $52,627 per family member.
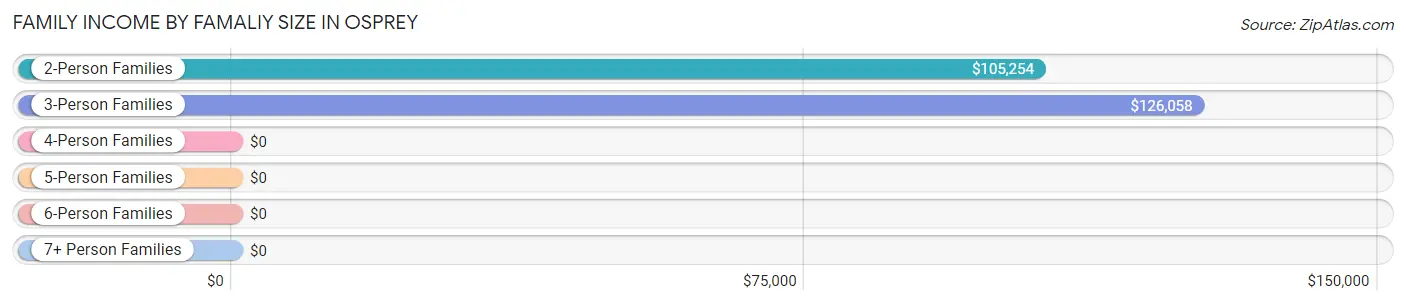
| Income Bracket | # Families | Median Income |
| 2-Person Families | 1,706 (77.1%) | $105,254 |
| 3-Person Families | 289 (13.1%) | $126,058 |
| 4-Person Families | 141 (6.4%) | $0 |
| 5-Person Families | 46 (2.1%) | $0 |
| 6-Person Families | 31 (1.4%) | $0 |
| 7+ Person Families | 0 (0.0%) | $0 |
| Total | 2,213 (100.0%) | $106,547 |
Family Income by Number of Earners in Osprey
The median family income in Osprey is $106,547, with families comprising 3+ earners (77) having the highest median family income of $236,898, while families with no earners (995) have the lowest median family income of $93,032, accounting for 3.5% and 45.0% of families, respectively.
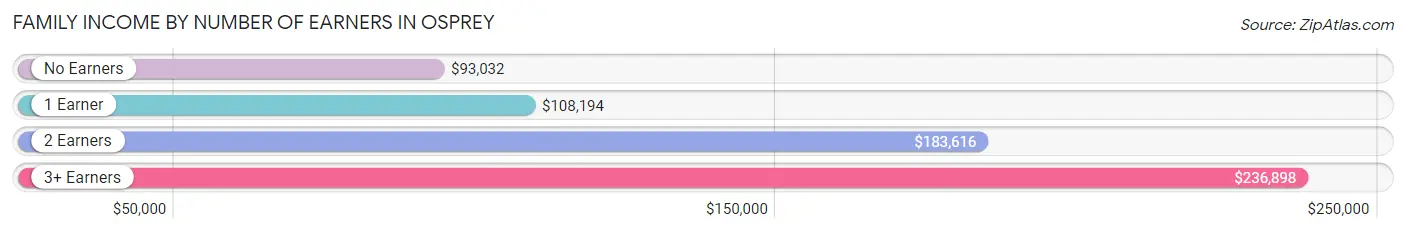
| Number of Earners | # Families | Median Income |
| No Earners | 995 (45.0%) | $93,032 |
| 1 Earner | 511 (23.1%) | $108,194 |
| 2 Earners | 630 (28.5%) | $183,616 |
| 3+ Earners | 77 (3.5%) | $236,898 |
| Total | 2,213 (100.0%) | $106,547 |
Household Income in Osprey
Household Income Brackets in Osprey
With 617 households falling in the category, the $200,000+ income range is the most frequent in Osprey, accounting for 21.6% of all households. In contrast, only 20 households (0.7%) fall into the $10,000 to $14,999 income bracket, making it the least populous group.
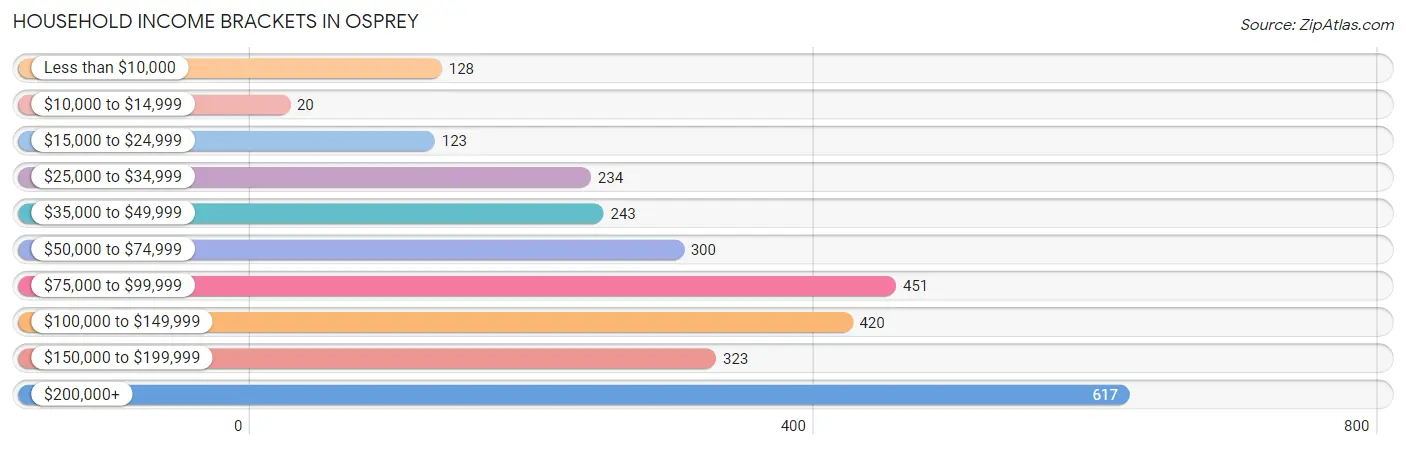
| Income Bracket | # Households | % Households |
| Less than $10,000 | 128 | 4.5% |
| $10,000 to $14,999 | 20 | 0.7% |
| $15,000 to $24,999 | 123 | 4.3% |
| $25,000 to $34,999 | 234 | 8.2% |
| $35,000 to $49,999 | 243 | 8.5% |
| $50,000 to $74,999 | 300 | 10.5% |
| $75,000 to $99,999 | 451 | 15.8% |
| $100,000 to $149,999 | 420 | 14.7% |
| $150,000 to $199,999 | 323 | 11.3% |
| $200,000+ | 617 | 21.6% |
Household Income by Householder Age in Osprey
The median household income in Osprey is $94,860, with the highest median household income of $122,500 found in the 45 to 64 years age bracket for the primary householder. A total of 1,026 households (35.9%) fall into this category. Meanwhile, the 15 to 24 years age bracket for the primary householder has the lowest median household income of $0, with 16 households (0.6%) in this group.
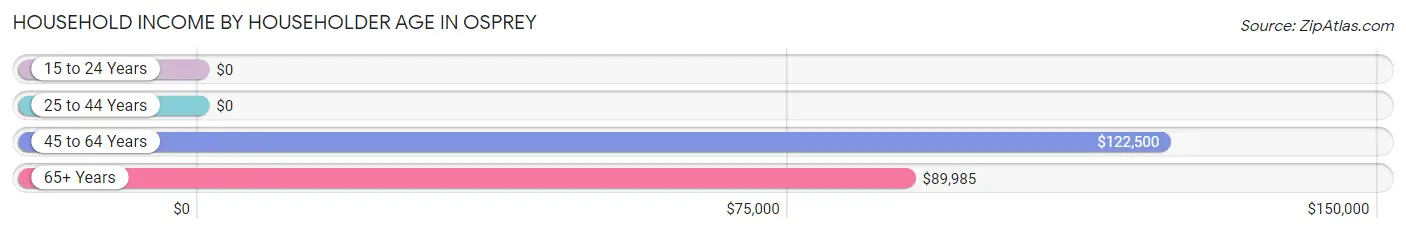
| Income Bracket | # Households | Median Income |
| 15 to 24 Years | 16 (0.6%) | $0 |
| 25 to 44 Years | 274 (9.6%) | $0 |
| 45 to 64 Years | 1,026 (35.9%) | $122,500 |
| 65+ Years | 1,539 (53.9%) | $89,985 |
| Total | 2,855 (100.0%) | $94,860 |
Poverty in Osprey
Income Below Poverty by Sex and Age in Osprey
With 6.3% poverty level for males and 8.8% for females among the residents of Osprey, 6 to 11 year old males and 18 to 24 year old females are the most vulnerable to poverty, with 75 males (43.1%) and 36 females (63.2%) in their respective age groups living below the poverty level.
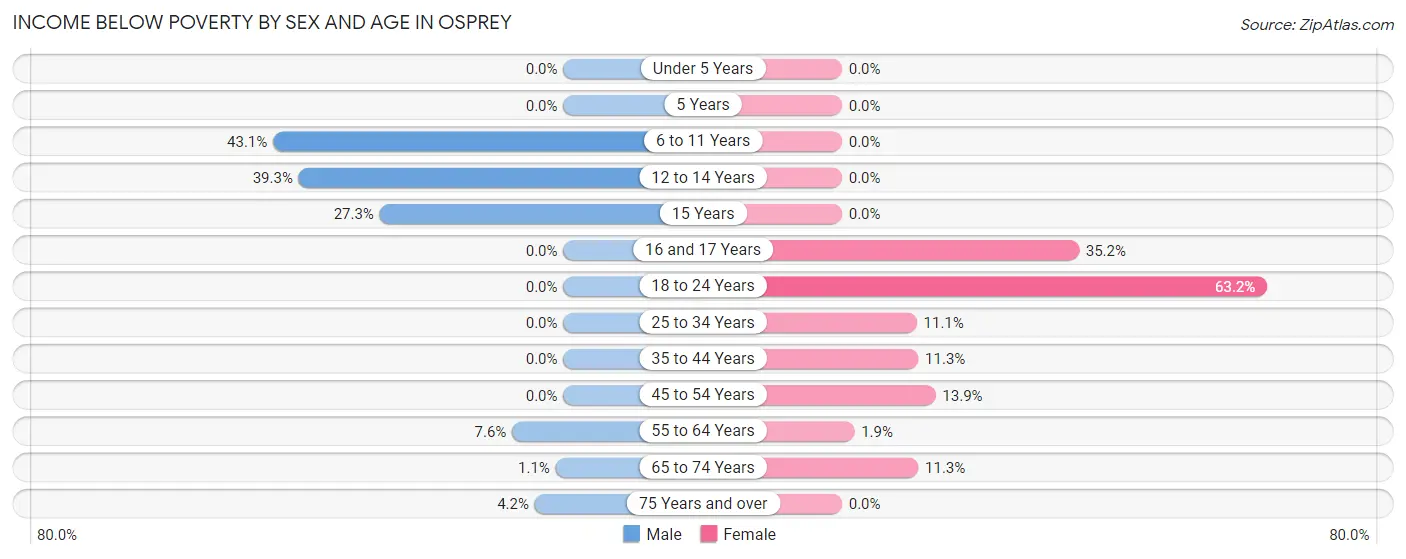
| Age Bracket | Male | Female |
| Under 5 Years | 0 (0.0%) | 0 (0.0%) |
| 5 Years | 0 (0.0%) | 0 (0.0%) |
| 6 to 11 Years | 75 (43.1%) | 0 (0.0%) |
| 12 to 14 Years | 33 (39.3%) | 0 (0.0%) |
| 15 Years | 9 (27.3%) | 0 (0.0%) |
| 16 and 17 Years | 0 (0.0%) | 38 (35.2%) |
| 18 to 24 Years | 0 (0.0%) | 36 (63.2%) |
| 25 to 34 Years | 0 (0.0%) | 14 (11.1%) |
| 35 to 44 Years | 0 (0.0%) | 22 (11.3%) |
| 45 to 54 Years | 0 (0.0%) | 57 (13.9%) |
| 55 to 64 Years | 46 (7.6%) | 11 (1.8%) |
| 65 to 74 Years | 8 (1.1%) | 87 (11.3%) |
| 75 Years and over | 30 (4.2%) | 0 (0.0%) |
| Total | 201 (6.3%) | 265 (8.8%) |
Income Above Poverty by Sex and Age in Osprey
According to the poverty statistics in Osprey, males aged under 5 years and females aged under 5 years are the age groups that are most secure financially, with 100.0% of males and 100.0% of females in these age groups living above the poverty line.
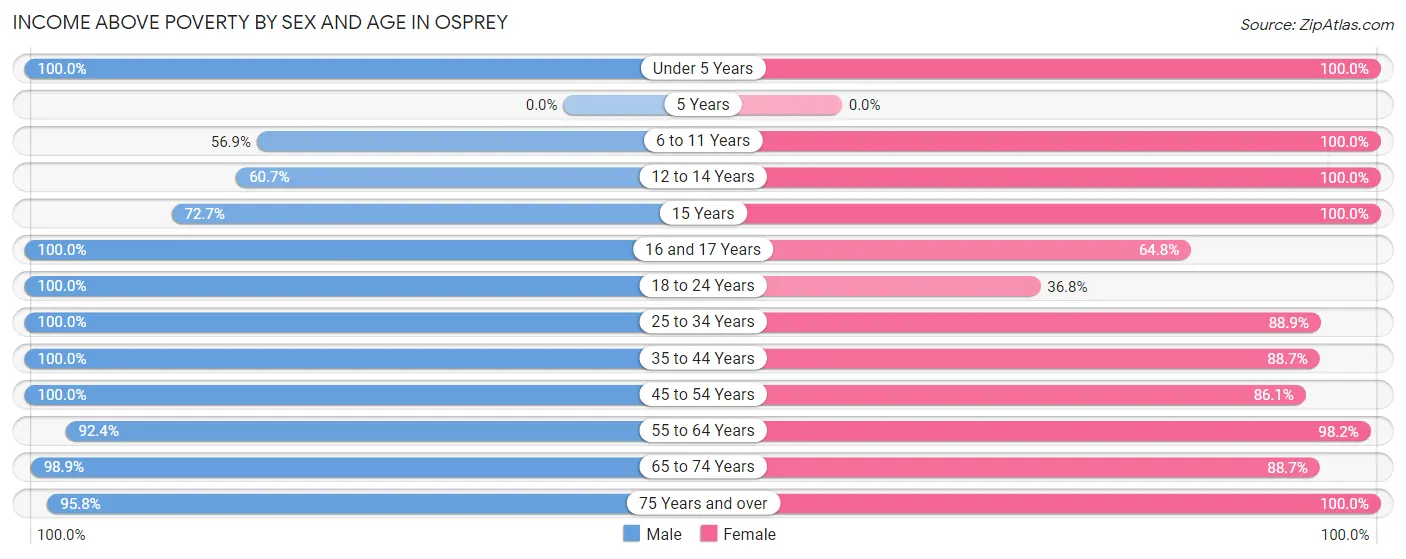
| Age Bracket | Male | Female |
| Under 5 Years | 175 (100.0%) | 14 (100.0%) |
| 5 Years | 0 (0.0%) | 0 (0.0%) |
| 6 to 11 Years | 99 (56.9%) | 91 (100.0%) |
| 12 to 14 Years | 51 (60.7%) | 41 (100.0%) |
| 15 Years | 24 (72.7%) | 28 (100.0%) |
| 16 and 17 Years | 30 (100.0%) | 70 (64.8%) |
| 18 to 24 Years | 134 (100.0%) | 21 (36.8%) |
| 25 to 34 Years | 102 (100.0%) | 112 (88.9%) |
| 35 to 44 Years | 143 (100.0%) | 172 (88.7%) |
| 45 to 54 Years | 282 (100.0%) | 353 (86.1%) |
| 55 to 64 Years | 559 (92.4%) | 584 (98.2%) |
| 65 to 74 Years | 696 (98.9%) | 681 (88.7%) |
| 75 Years and over | 678 (95.8%) | 579 (100.0%) |
| Total | 2,973 (93.7%) | 2,746 (91.2%) |
Income Below Poverty Among Married-Couple Families in Osprey
The poverty statistics for married-couple families in Osprey show that 2.1% or 44 of the total 2,105 families live below the poverty line. Families with 3 or 4 children have the highest poverty rate of 57.1%, comprising of 24 families. On the other hand, families with no children have the lowest poverty rate of 0.7%, which includes 12 families.
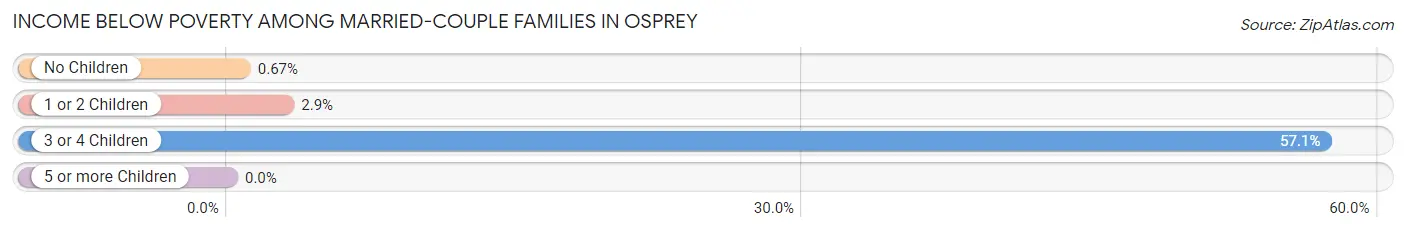
| Children | Above Poverty | Below Poverty |
| No Children | 1,779 (99.3%) | 12 (0.7%) |
| 1 or 2 Children | 264 (97.1%) | 8 (2.9%) |
| 3 or 4 Children | 18 (42.9%) | 24 (57.1%) |
| 5 or more Children | 0 (0.0%) | 0 (0.0%) |
| Total | 2,061 (97.9%) | 44 (2.1%) |
Income Below Poverty Among Single-Parent Households in Osprey
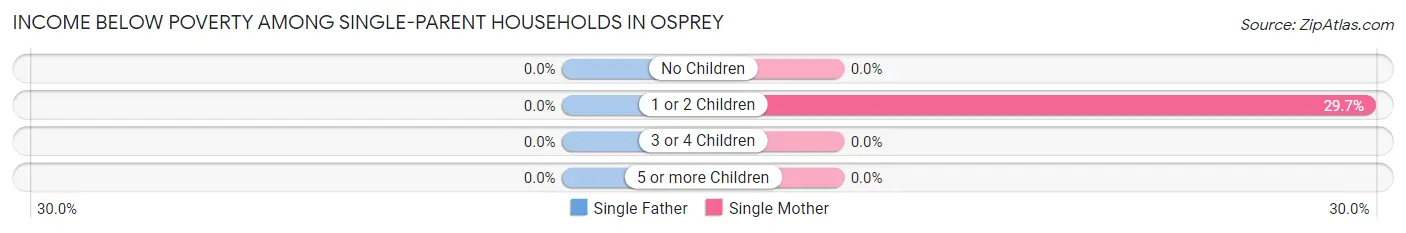
| Children | Single Father | Single Mother |
| No Children | 0 (0.0%) | 0 (0.0%) |
| 1 or 2 Children | 0 (0.0%) | 22 (29.7%) |
| 3 or 4 Children | 0 (0.0%) | 0 (0.0%) |
| 5 or more Children | 0 (0.0%) | 0 (0.0%) |
| Total | 0 (0.0%) | 22 (26.2%) |
Income Below Poverty Among Married-Couple vs Single-Parent Households in Osprey
The poverty data for Osprey shows that 44 of the married-couple family households (2.1%) and 22 of the single-parent households (20.4%) are living below the poverty level. Within the married-couple family households, those with 3 or 4 children have the highest poverty rate, with 24 households (57.1%) falling below the poverty line. Among the single-parent households, those with 1 or 2 children have the highest poverty rate, with 22 household (29.7%) living below poverty.
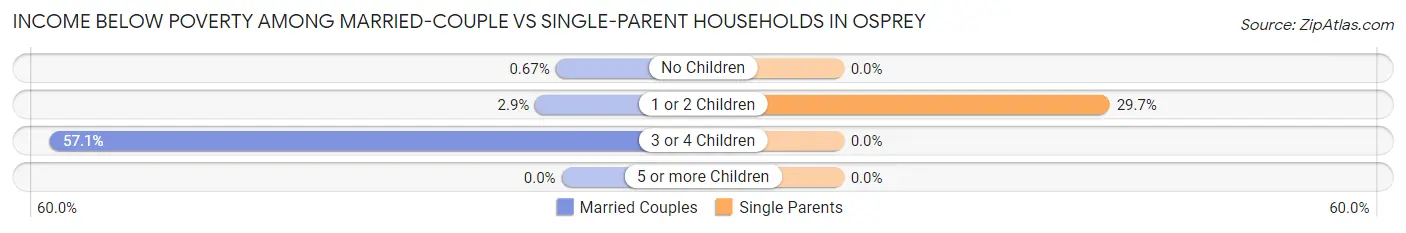
| Children | Married-Couple Families | Single-Parent Households |
| No Children | 12 (0.7%) | 0 (0.0%) |
| 1 or 2 Children | 8 (2.9%) | 22 (29.7%) |
| 3 or 4 Children | 24 (57.1%) | 0 (0.0%) |
| 5 or more Children | 0 (0.0%) | 0 (0.0%) |
| Total | 44 (2.1%) | 22 (20.4%) |
Race in Osprey
The most populous races in Osprey are White / Caucasian (5,865 | 94.7%), Hispanic or Latino (238 | 3.8%), and Asian (133 | 2.1%).
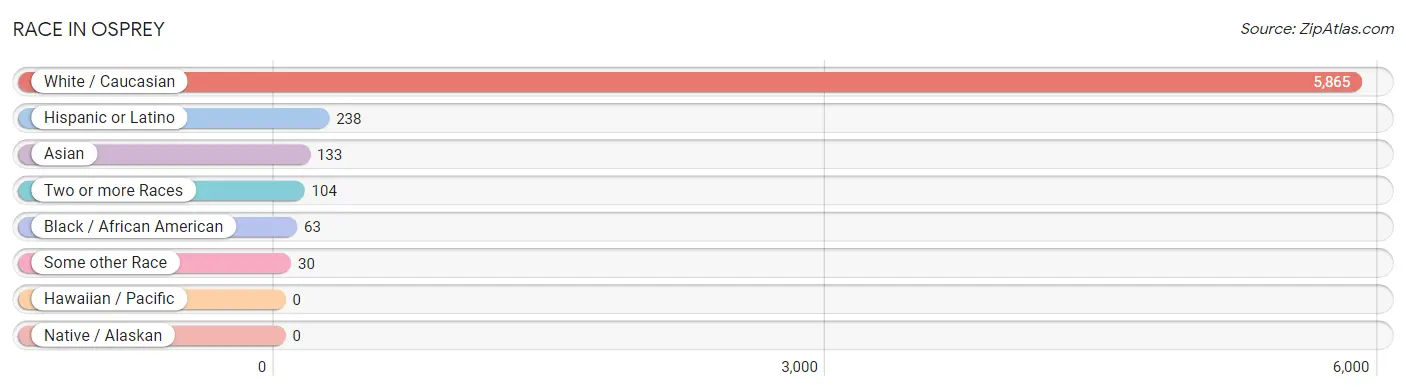
| Race | # Population | % Population |
| Asian | 133 | 2.1% |
| Black / African American | 63 | 1.0% |
| Hawaiian / Pacific | 0 | 0.0% |
| Hispanic or Latino | 238 | 3.8% |
| Native / Alaskan | 0 | 0.0% |
| White / Caucasian | 5,865 | 94.7% |
| Two or more Races | 104 | 1.7% |
| Some other Race | 30 | 0.5% |
| Total | 6,195 | 100.0% |
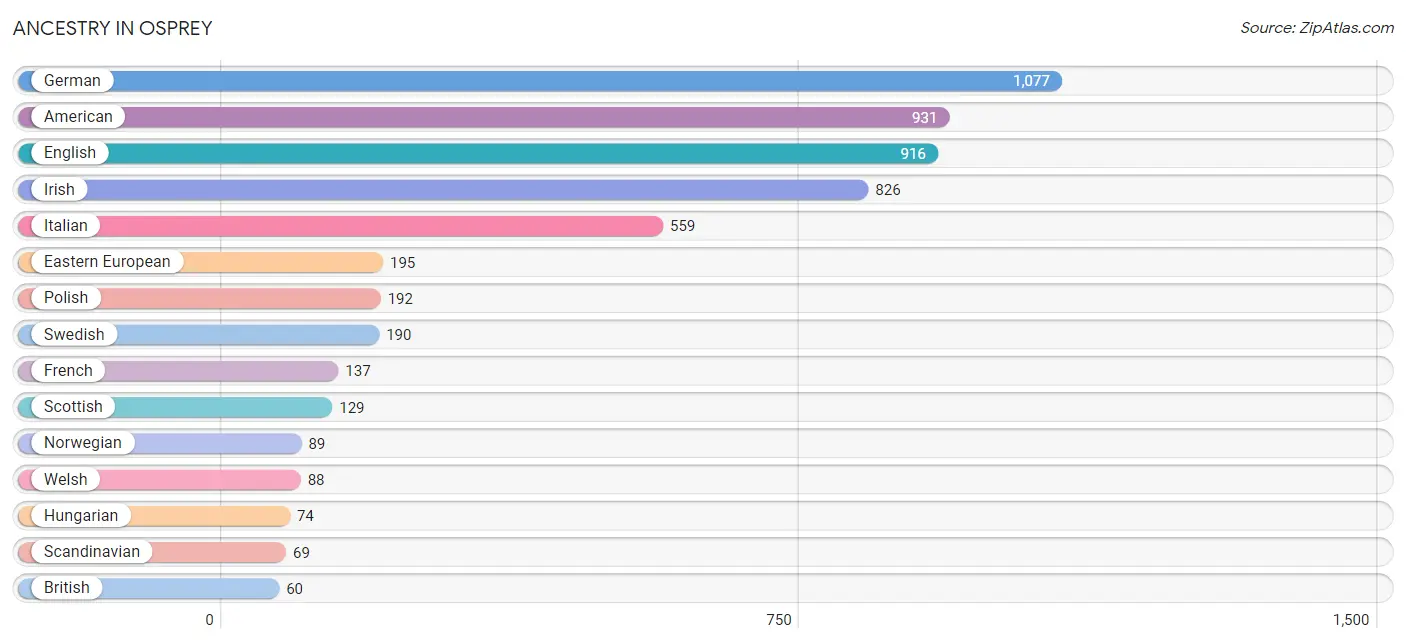
Ancestry in Osprey
The most populous ancestries reported in Osprey are German (1,077 | 17.4%), American (931 | 15.0%), English (916 | 14.8%), Irish (826 | 13.3%), and Italian (559 | 9.0%), together accounting for 69.6% of all Osprey residents.
| Ancestry | # Population | % Population |
| African | 7 | 0.1% |
| American | 931 | 15.0% |
| Arab | 14 | 0.2% |
| British | 60 | 1.0% |
| Canadian | 15 | 0.2% |
| Croatian | 28 | 0.4% |
| Czech | 24 | 0.4% |
| Dutch | 53 | 0.9% |
| Eastern European | 195 | 3.2% |
| English | 916 | 14.8% |
| European | 56 | 0.9% |
| Filipino | 17 | 0.3% |
| Finnish | 15 | 0.2% |
| French | 137 | 2.2% |
| French Canadian | 38 | 0.6% |
| German | 1,077 | 17.4% |
| Ghanaian | 14 | 0.2% |
| Hungarian | 74 | 1.2% |
| Indian (Asian) | 44 | 0.7% |
| Iranian | 42 | 0.7% |
| Irish | 826 | 13.3% |
| Italian | 559 | 9.0% |
| Laotian | 10 | 0.2% |
| Lebanese | 14 | 0.2% |
| Macedonian | 19 | 0.3% |
| Maltese | 11 | 0.2% |
| Mexican | 51 | 0.8% |
| Northern European | 28 | 0.4% |
| Norwegian | 89 | 1.4% |
| Polish | 192 | 3.1% |
| Russian | 25 | 0.4% |
| Scandinavian | 69 | 1.1% |
| Scotch-Irish | 18 | 0.3% |
| Scottish | 129 | 2.1% |
| Slovak | 28 | 0.4% |
| South American | 50 | 0.8% |
| Spaniard | 58 | 0.9% |
| Spanish | 10 | 0.2% |
| Sri Lankan | 42 | 0.7% |
| Subsaharan African | 21 | 0.3% |
| Swedish | 190 | 3.1% |
| Thai | 20 | 0.3% |
| Ukrainian | 17 | 0.3% |
| Venezuelan | 50 | 0.8% |
| Welsh | 88 | 1.4% | View All 45 Rows |
Immigrants in Osprey
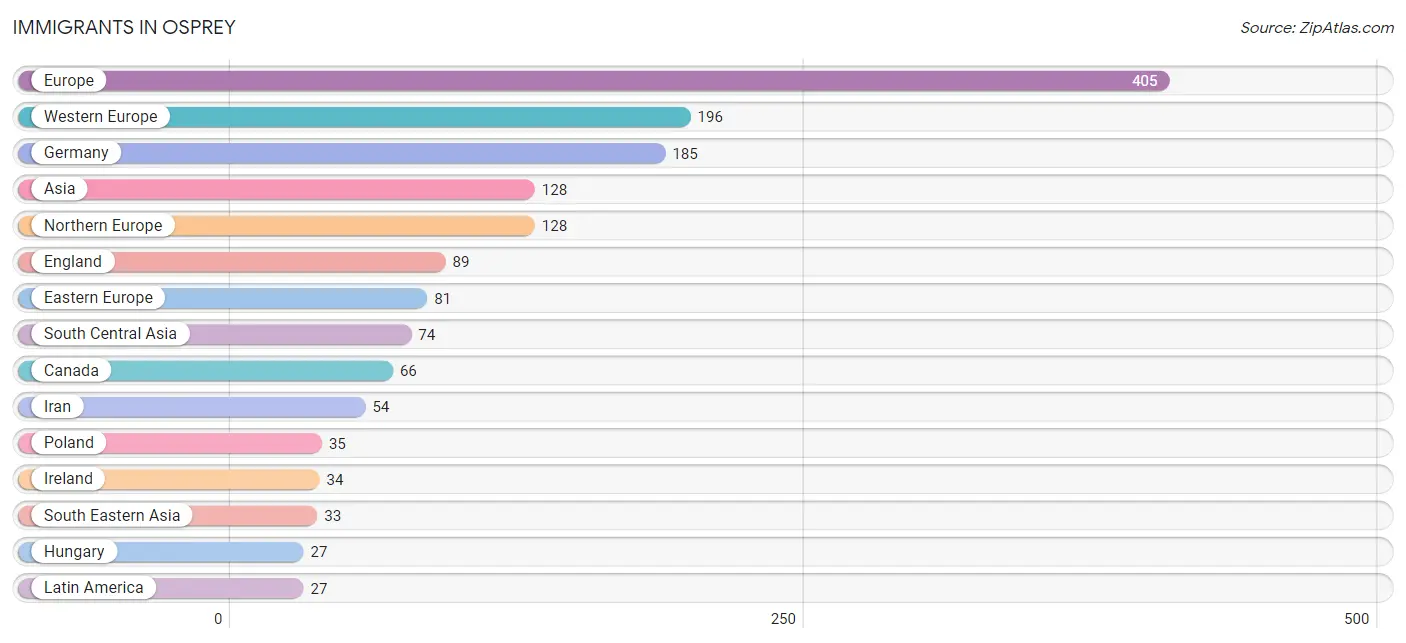
The most numerous immigrant groups reported in Osprey came from Europe (405 | 6.5%), Western Europe (196 | 3.2%), Germany (185 | 3.0%), Asia (128 | 2.1%), and Northern Europe (128 | 2.1%), together accounting for 16.8% of all Osprey residents.
| Immigration Origin | # Population | % Population |
| Africa | 14 | 0.2% |
| Asia | 128 | 2.1% |
| Belgium | 4 | 0.1% |
| Canada | 66 | 1.1% |
| China | 21 | 0.3% |
| Eastern Asia | 21 | 0.3% |
| Eastern Europe | 81 | 1.3% |
| England | 89 | 1.4% |
| Europe | 405 | 6.5% |
| France | 7 | 0.1% |
| Germany | 185 | 3.0% |
| Ghana | 14 | 0.2% |
| Hungary | 27 | 0.4% |
| India | 20 | 0.3% |
| Indonesia | 10 | 0.2% |
| Iran | 54 | 0.9% |
| Ireland | 34 | 0.5% |
| Latin America | 27 | 0.4% |
| North Macedonia | 19 | 0.3% |
| Northern Europe | 128 | 2.1% |
| Poland | 35 | 0.6% |
| Scotland | 5 | 0.1% |
| South America | 27 | 0.4% |
| South Central Asia | 74 | 1.2% |
| South Eastern Asia | 33 | 0.5% |
| Venezuela | 27 | 0.4% |
| Vietnam | 23 | 0.4% |
| Western Africa | 14 | 0.2% |
| Western Europe | 196 | 3.2% | View All 29 Rows |
Sex and Age in Osprey
Sex and Age in Osprey
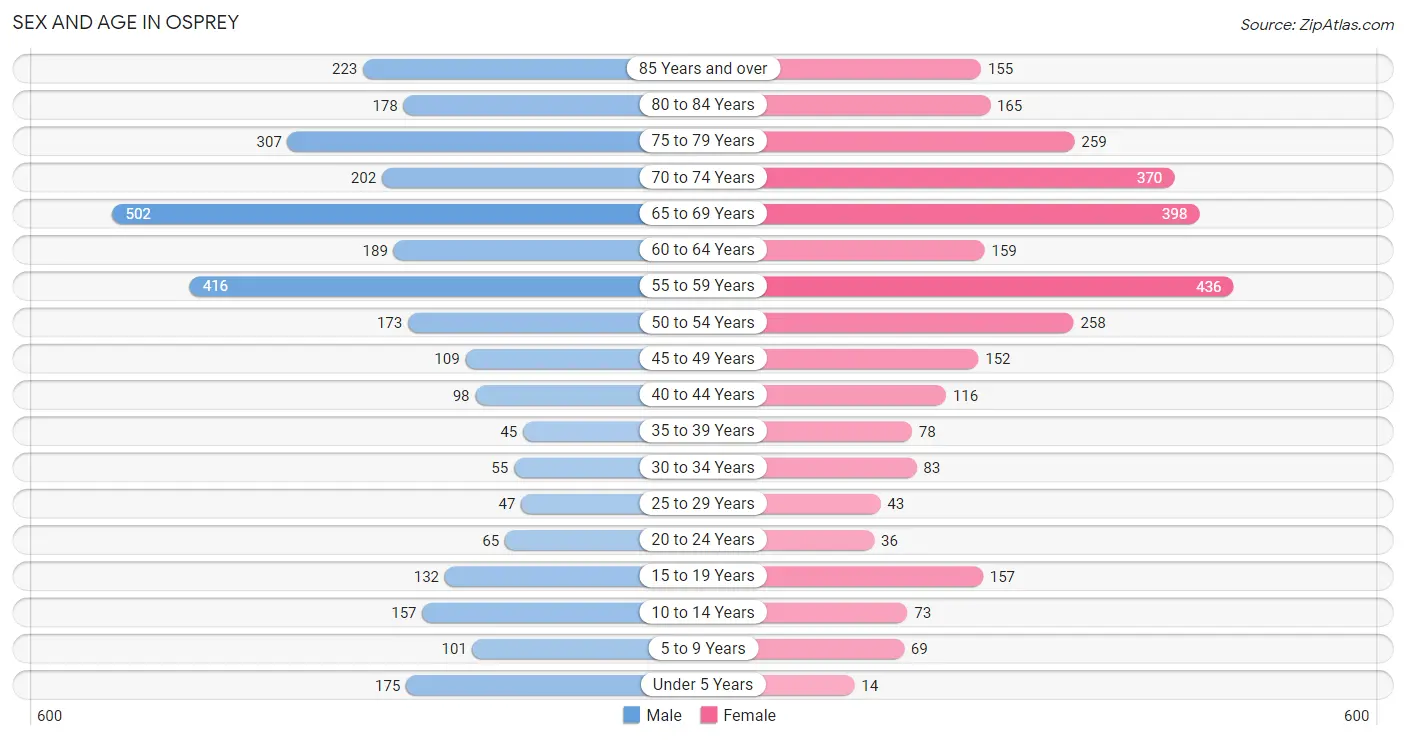
The most populous age groups in Osprey are 65 to 69 Years (502 | 15.8%) for men and 55 to 59 Years (436 | 14.4%) for women.
| Age Bracket | Male | Female |
| Under 5 Years | 175 (5.5%) | 14 (0.5%) |
| 5 to 9 Years | 101 (3.2%) | 69 (2.3%) |
| 10 to 14 Years | 157 (5.0%) | 73 (2.4%) |
| 15 to 19 Years | 132 (4.2%) | 157 (5.2%) |
| 20 to 24 Years | 65 (2.1%) | 36 (1.2%) |
| 25 to 29 Years | 47 (1.5%) | 43 (1.4%) |
| 30 to 34 Years | 55 (1.7%) | 83 (2.8%) |
| 35 to 39 Years | 45 (1.4%) | 78 (2.6%) |
| 40 to 44 Years | 98 (3.1%) | 116 (3.8%) |
| 45 to 49 Years | 109 (3.4%) | 152 (5.0%) |
| 50 to 54 Years | 173 (5.4%) | 258 (8.5%) |
| 55 to 59 Years | 416 (13.1%) | 436 (14.4%) |
| 60 to 64 Years | 189 (5.9%) | 159 (5.3%) |
| 65 to 69 Years | 502 (15.8%) | 398 (13.2%) |
| 70 to 74 Years | 202 (6.4%) | 370 (12.2%) |
| 75 to 79 Years | 307 (9.7%) | 259 (8.6%) |
| 80 to 84 Years | 178 (5.6%) | 165 (5.5%) |
| 85 Years and over | 223 (7.0%) | 155 (5.1%) |
| Total | 3,174 (100.0%) | 3,021 (100.0%) |
Families and Households in Osprey
Median Family Size in Osprey
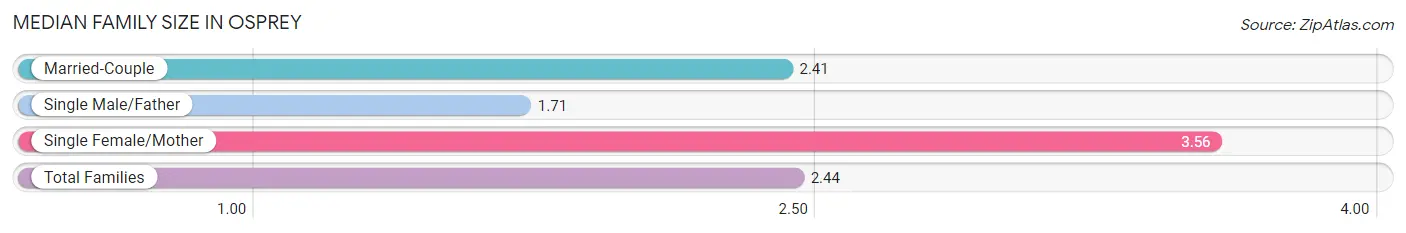
The median family size in Osprey is 2.44 persons per family, with single female/mother families (84 | 3.8%) accounting for the largest median family size of 3.56 persons per family. On the other hand, single male/father families (24 | 1.1%) represent the smallest median family size with 1.71 persons per family.
| Family Type | # Families | Family Size |
| Married-Couple | 2,105 (95.1%) | 2.41 |
| Single Male/Father | 24 (1.1%) | 1.71 |
| Single Female/Mother | 84 (3.8%) | 3.56 |
| Total Families | 2,213 (100.0%) | 2.44 |
Median Household Size in Osprey
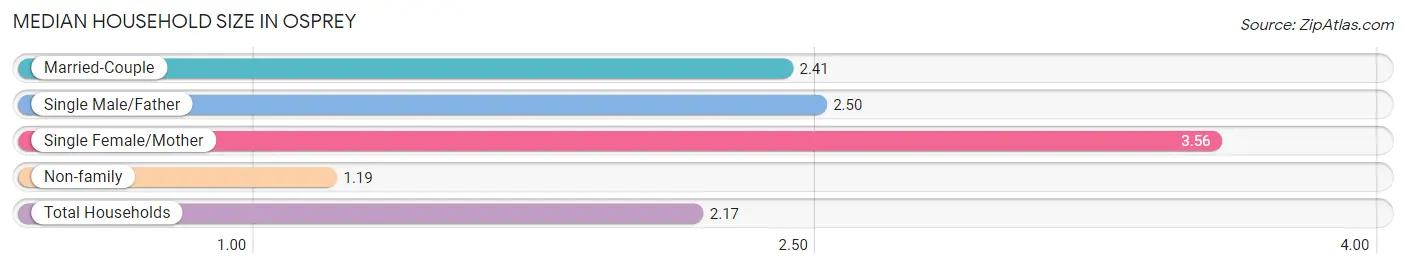
The median household size in Osprey is 2.17 persons per household, with single female/mother households (84 | 2.9%) accounting for the largest median household size of 3.56 persons per household. non-family households (642 | 22.5%) represent the smallest median household size with 1.19 persons per household.
| Household Type | # Households | Household Size |
| Married-Couple | 2,105 (73.7%) | 2.41 |
| Single Male/Father | 24 (0.8%) | 2.50 |
| Single Female/Mother | 84 (2.9%) | 3.56 |
| Non-family | 642 (22.5%) | 1.19 |
| Total Households | 2,855 (100.0%) | 2.17 |
Household Size by Marriage Status in Osprey
Out of a total of 2,855 households in Osprey, 2,213 (77.5%) are family households, while 642 (22.5%) are nonfamily households. The most numerous type of family households are 2-person households, comprising 1,692, and the most common type of nonfamily households are 1-person households, comprising 535.
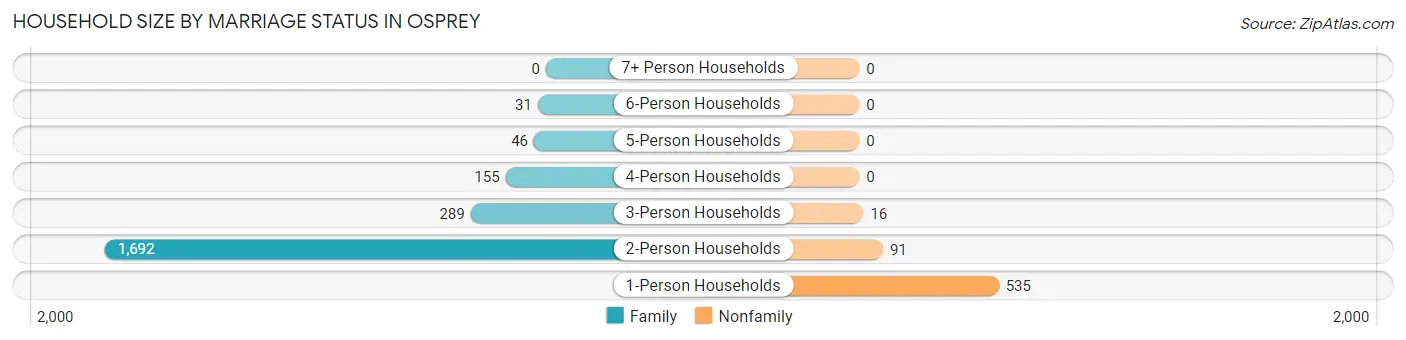
| Household Size | Family Households | Nonfamily Households |
| 1-Person Households | - | 535 (18.7%) |
| 2-Person Households | 1,692 (59.3%) | 91 (3.2%) |
| 3-Person Households | 289 (10.1%) | 16 (0.6%) |
| 4-Person Households | 155 (5.4%) | 0 (0.0%) |
| 5-Person Households | 46 (1.6%) | 0 (0.0%) |
| 6-Person Households | 31 (1.1%) | 0 (0.0%) |
| 7+ Person Households | 0 (0.0%) | 0 (0.0%) |
| Total | 2,213 (77.5%) | 642 (22.5%) |
Female Fertility in Osprey
Fertility by Age in Osprey
Average fertility rate in Osprey is 14.0 births per 1,000 women. Women in the age bracket of 20 to 34 years have the highest fertility rate with 62.0 births per 1,000 women. Women in the age bracket of 20 to 34 years acount for 100.0% of all women with births.
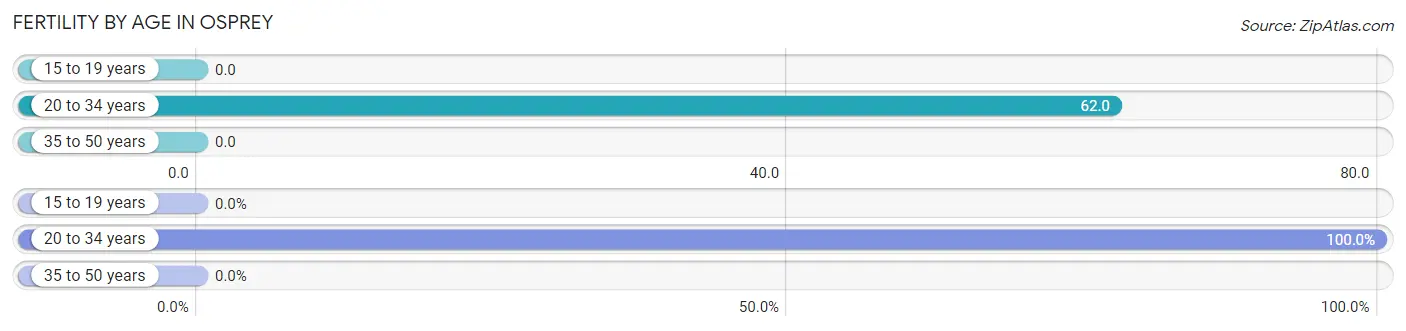
| Age Bracket | Women with Births | Births / 1,000 Women |
| 15 to 19 years | 0 (0.0%) | 0.0 |
| 20 to 34 years | 10 (100.0%) | 62.0 |
| 35 to 50 years | 0 (0.0%) | 0.0 |
| Total | 10 (100.0%) | 14.0 |
Fertility by Age by Marriage Status in Osprey
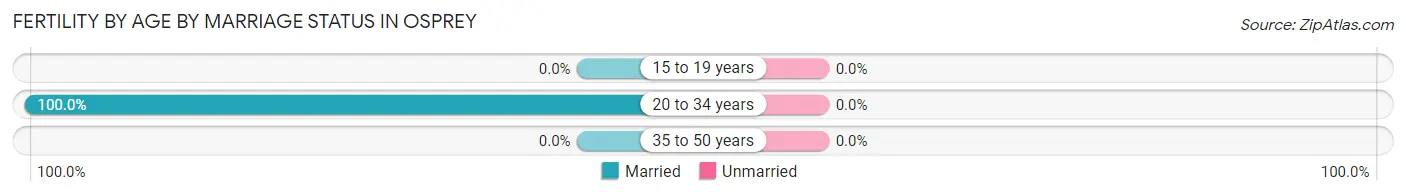
| Age Bracket | Married | Unmarried |
| 15 to 19 years | 0 (0.0%) | 0 (0.0%) |
| 20 to 34 years | 10 (100.0%) | 0 (0.0%) |
| 35 to 50 years | 0 (0.0%) | 0 (0.0%) |
| Total | 10 (100.0%) | 0 (0.0%) |
Fertility by Education in Osprey
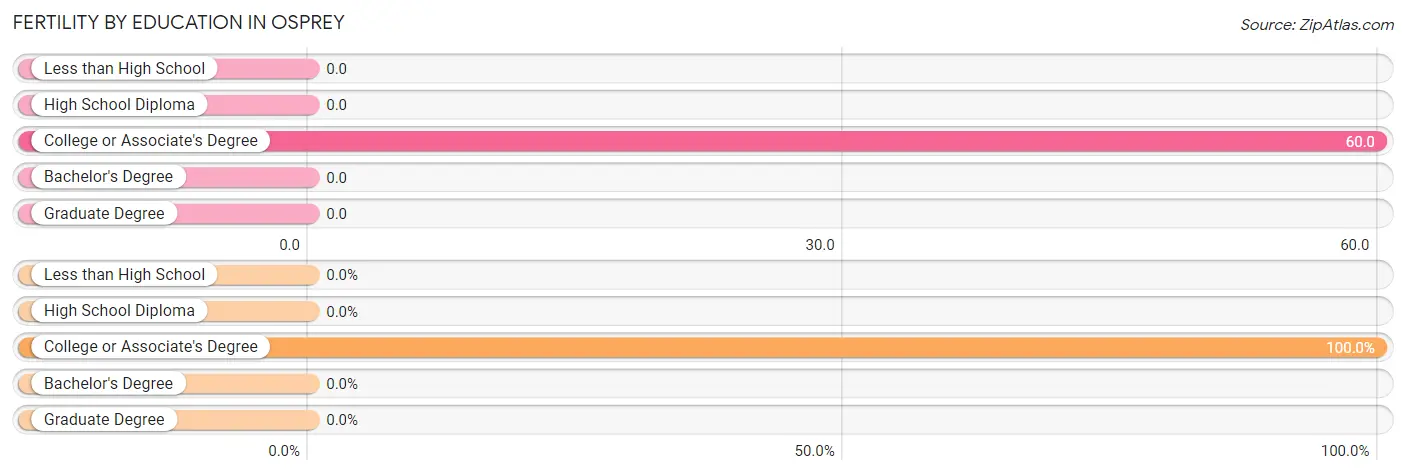
| Educational Attainment | Women with Births | Births / 1,000 Women |
| Less than High School | 0 (0.0%) | 0.0 |
| High School Diploma | 0 (0.0%) | 0.0 |
| College or Associate's Degree | 10 (100.0%) | 60.0 |
| Bachelor's Degree | 0 (0.0%) | 0.0 |
| Graduate Degree | 0 (0.0%) | 0.0 |
| Total | 10 (100.0%) | 14.0 |
Fertility by Education by Marriage Status in Osprey
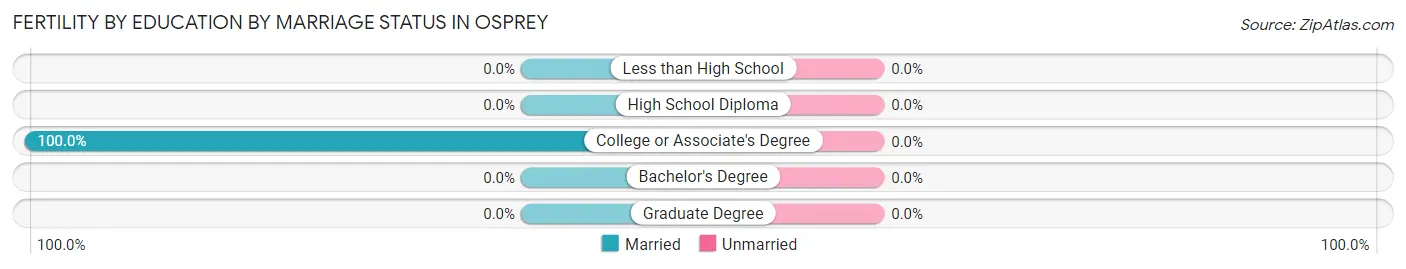
| Educational Attainment | Married | Unmarried |
| Less than High School | 0 (0.0%) | 0 (0.0%) |
| High School Diploma | 0 (0.0%) | 0 (0.0%) |
| College or Associate's Degree | 10 (100.0%) | 0 (0.0%) |
| Bachelor's Degree | 0 (0.0%) | 0 (0.0%) |
| Graduate Degree | 0 (0.0%) | 0 (0.0%) |
| Total | 10 (100.0%) | 0 (0.0%) |
Employment Characteristics in Osprey
Employment by Class of Employer in Osprey
Among the 2,096 employed individuals in Osprey, private company employees (1,290 | 61.6%), self-employed (incorporated) (342 | 16.3%), and self-employed (not incorporated) (140 | 6.7%) make up the most common classes of employment.
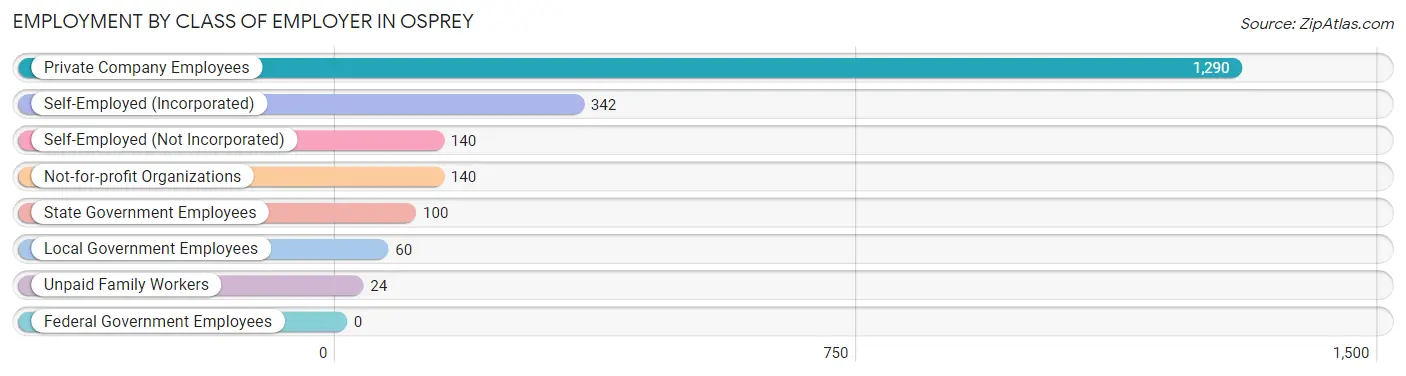
| Employer Class | # Employees | % Employees |
| Private Company Employees | 1,290 | 61.6% |
| Self-Employed (Incorporated) | 342 | 16.3% |
| Self-Employed (Not Incorporated) | 140 | 6.7% |
| Not-for-profit Organizations | 140 | 6.7% |
| Local Government Employees | 60 | 2.9% |
| State Government Employees | 100 | 4.8% |
| Federal Government Employees | 0 | 0.0% |
| Unpaid Family Workers | 24 | 1.1% |
| Total | 2,096 | 100.0% |
Employment Status by Age in Osprey
According to the labor force statistics for Osprey, out of the total population over 16 years of age (5,545), 38.7% or 2,146 individuals are in the labor force, with 2.2% or 47 of them unemployed. The age group with the highest labor force participation rate is 20 to 24 years, with 100.0% or 101 individuals in the labor force. Within the labor force, the 20 to 24 years age range has the highest percentage of unemployed individuals, with 24.8% or 25 of them being unemployed.
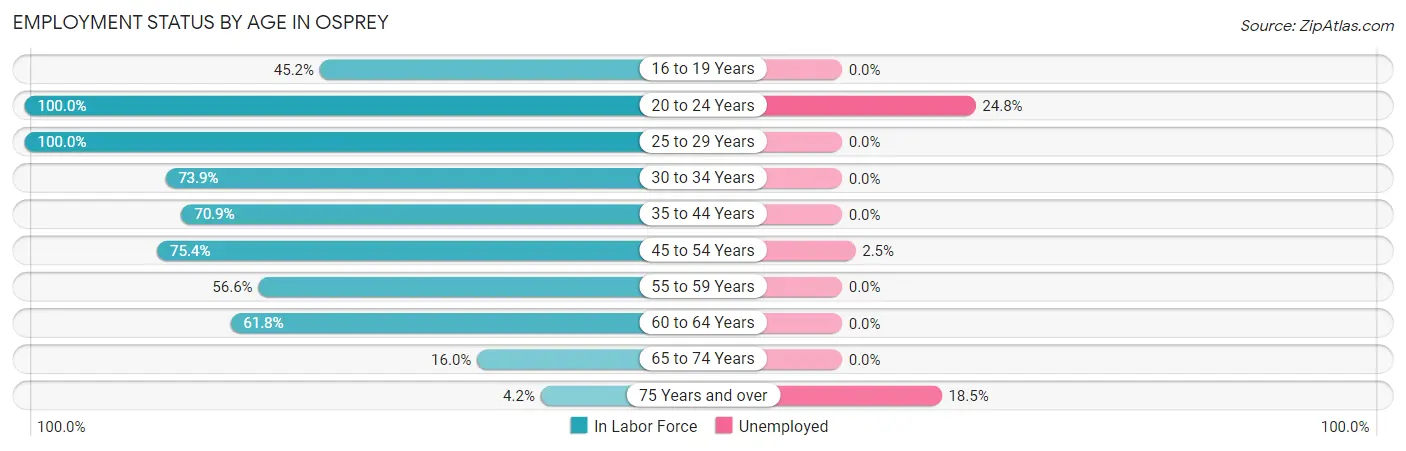
| Age Bracket | In Labor Force | Unemployed |
| 16 to 19 Years | 103 (45.2%) | 0 (0.0%) |
| 20 to 24 Years | 101 (100.0%) | 25 (24.8%) |
| 25 to 29 Years | 90 (100.0%) | 0 (0.0%) |
| 30 to 34 Years | 102 (73.9%) | 0 (0.0%) |
| 35 to 44 Years | 239 (70.9%) | 0 (0.0%) |
| 45 to 54 Years | 522 (75.4%) | 13 (2.5%) |
| 55 to 59 Years | 482 (56.6%) | 0 (0.0%) |
| 60 to 64 Years | 215 (61.8%) | 0 (0.0%) |
| 65 to 74 Years | 236 (16.0%) | 0 (0.0%) |
| 75 Years and over | 54 (4.2%) | 10 (18.5%) |
| Total | 2,146 (38.7%) | 47 (2.2%) |
Employment Status by Educational Attainment in Osprey
According to labor force statistics for Osprey, 67.2% of individuals (1,651) out of the total population between 25 and 64 years of age (2,457) are in the labor force, with 0.8% or 13 of them being unemployed. The group with the highest labor force participation rate are those with the educational attainment of less than high school, with 100.0% or 14 individuals in the labor force. Within the labor force, individuals with bachelor's degree or higher education have the highest percentage of unemployment, with 1.1% or 12 of them being unemployed.
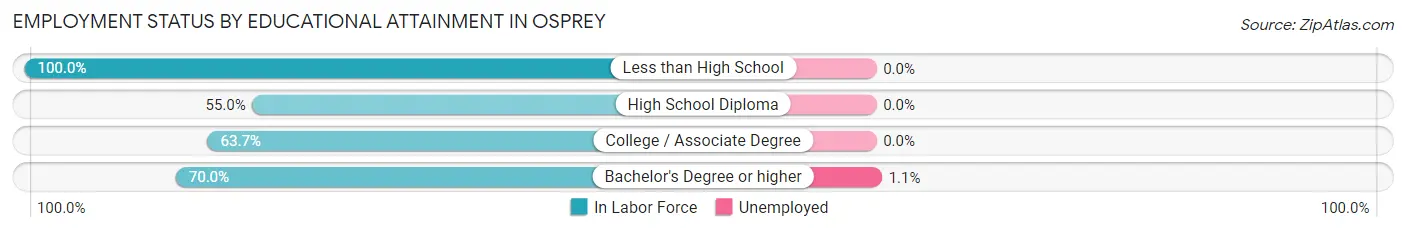
| Educational Attainment | In Labor Force | Unemployed |
| Less than High School | 14 (100.0%) | 0 (0.0%) |
| High School Diploma | 144 (55.0%) | 0 (0.0%) |
| College / Associate Degree | 356 (63.7%) | 0 (0.0%) |
| Bachelor's Degree or higher | 1,135 (70.0%) | 18 (1.1%) |
| Total | 1,651 (67.2%) | 20 (0.8%) |
Employment Occupations by Sex in Osprey
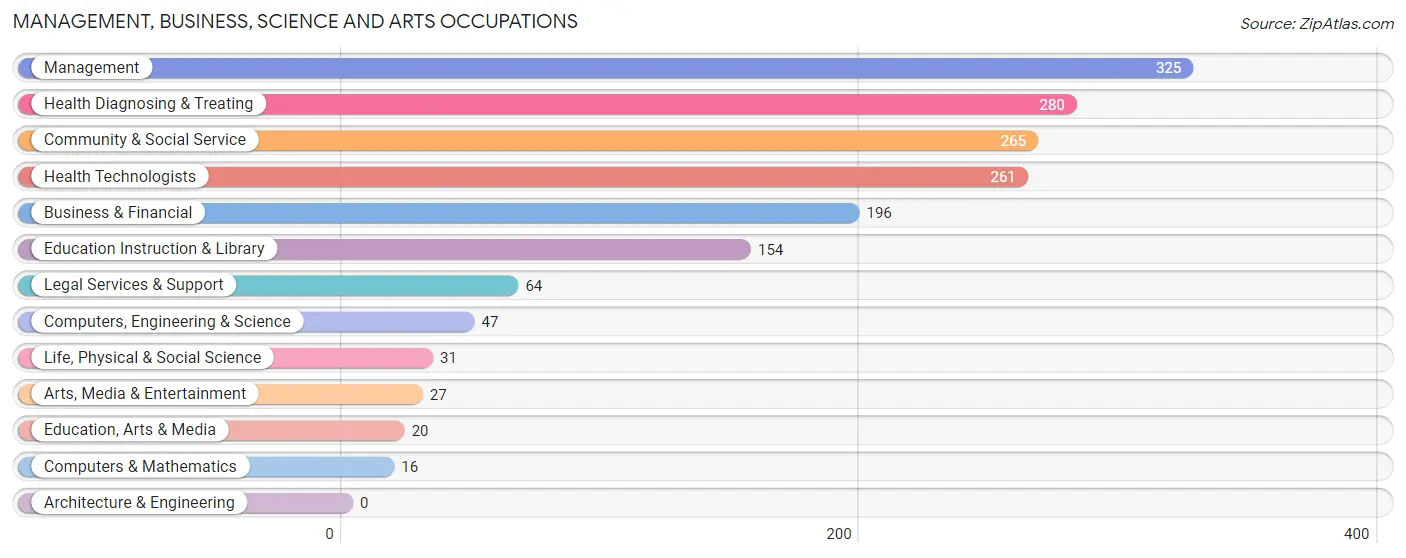
Management, Business, Science and Arts Occupations
The most common Management, Business, Science and Arts occupations in Osprey are Management (325 | 15.5%), Health Diagnosing & Treating (280 | 13.4%), Community & Social Service (265 | 12.6%), Health Technologists (261 | 12.4%), and Business & Financial (196 | 9.3%).
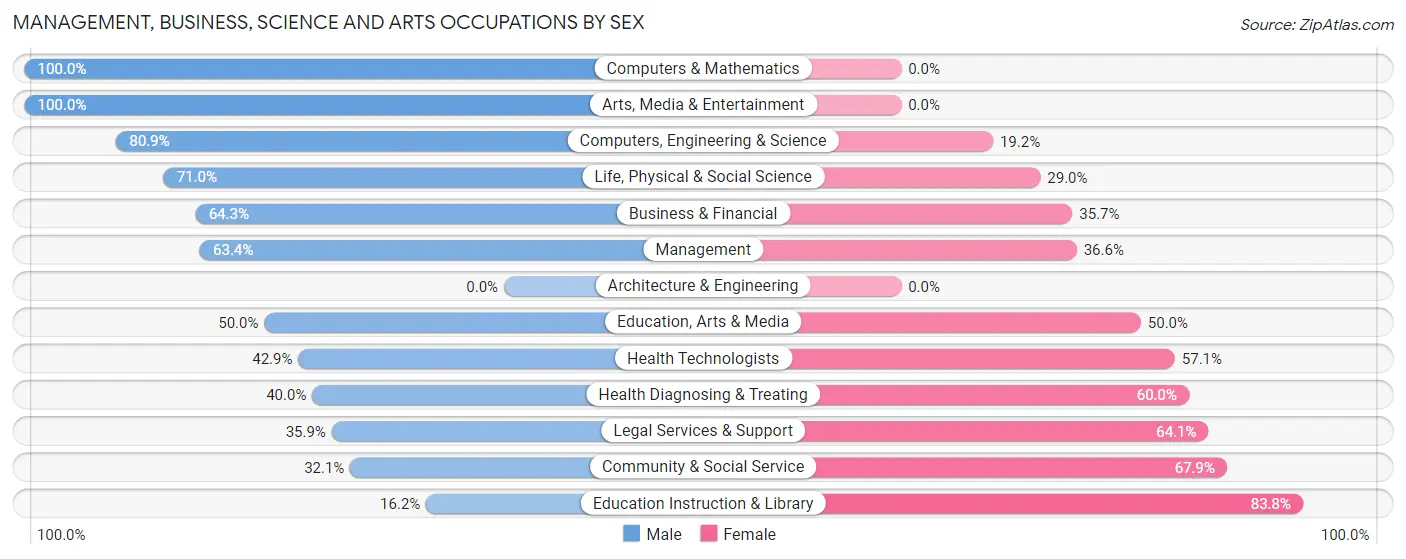
Management, Business, Science and Arts Occupations by Sex
Within the Management, Business, Science and Arts occupations in Osprey, the most male-oriented occupations are Computers & Mathematics (100.0%), Arts, Media & Entertainment (100.0%), and Computers, Engineering & Science (80.8%), while the most female-oriented occupations are Education Instruction & Library (83.8%), Community & Social Service (67.9%), and Legal Services & Support (64.1%).
| Occupation | Male | Female |
| Management | 206 (63.4%) | 119 (36.6%) |
| Business & Financial | 126 (64.3%) | 70 (35.7%) |
| Computers, Engineering & Science | 38 (80.8%) | 9 (19.2%) |
| Computers & Mathematics | 16 (100.0%) | 0 (0.0%) |
| Architecture & Engineering | 0 (0.0%) | 0 (0.0%) |
| Life, Physical & Social Science | 22 (71.0%) | 9 (29.0%) |
| Community & Social Service | 85 (32.1%) | 180 (67.9%) |
| Education, Arts & Media | 10 (50.0%) | 10 (50.0%) |
| Legal Services & Support | 23 (35.9%) | 41 (64.1%) |
| Education Instruction & Library | 25 (16.2%) | 129 (83.8%) |
| Arts, Media & Entertainment | 27 (100.0%) | 0 (0.0%) |
| Health Diagnosing & Treating | 112 (40.0%) | 168 (60.0%) |
| Health Technologists | 112 (42.9%) | 149 (57.1%) |
| Total (Category) | 567 (50.9%) | 546 (49.1%) |
| Total (Overall) | 1,151 (54.9%) | 945 (45.1%) |
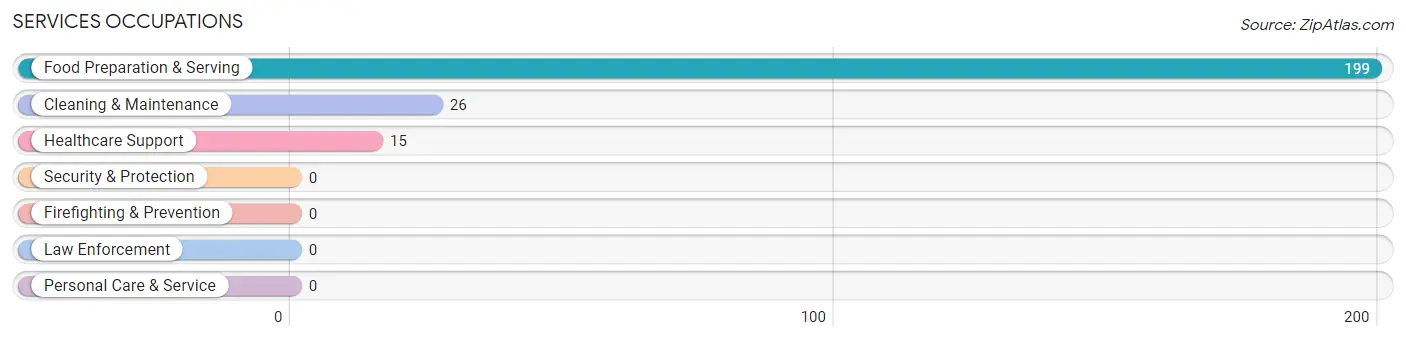
Services Occupations
The most common Services occupations in Osprey are Food Preparation & Serving (199 | 9.5%), Cleaning & Maintenance (26 | 1.2%), and Healthcare Support (15 | 0.7%).
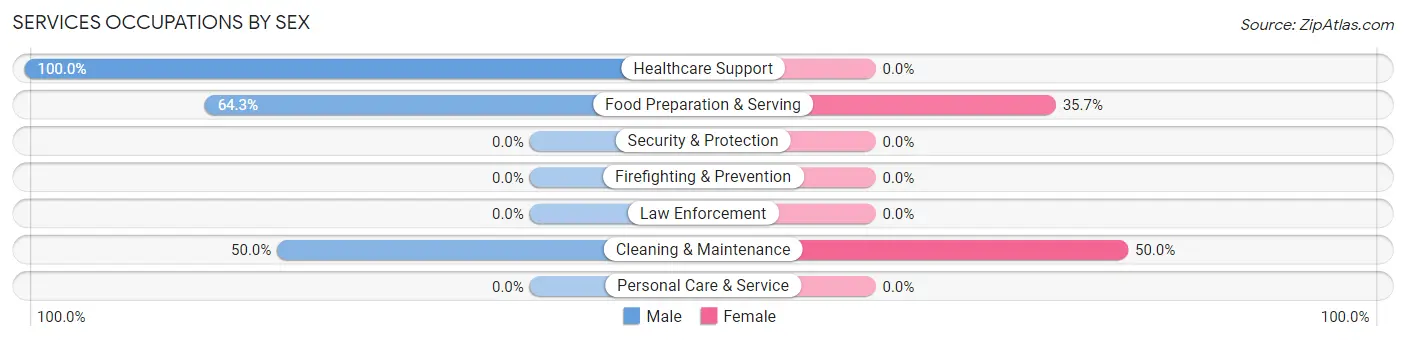
Services Occupations by Sex
Within the Services occupations in Osprey, the most male-oriented occupations are Healthcare Support (100.0%), Food Preparation & Serving (64.3%), and Cleaning & Maintenance (50.0%), while the most female-oriented occupations are Cleaning & Maintenance (50.0%), and Food Preparation & Serving (35.7%).
| Occupation | Male | Female |
| Healthcare Support | 15 (100.0%) | 0 (0.0%) |
| Security & Protection | 0 (0.0%) | 0 (0.0%) |
| Firefighting & Prevention | 0 (0.0%) | 0 (0.0%) |
| Law Enforcement | 0 (0.0%) | 0 (0.0%) |
| Food Preparation & Serving | 128 (64.3%) | 71 (35.7%) |
| Cleaning & Maintenance | 13 (50.0%) | 13 (50.0%) |
| Personal Care & Service | 0 (0.0%) | 0 (0.0%) |
| Total (Category) | 156 (65.0%) | 84 (35.0%) |
| Total (Overall) | 1,151 (54.9%) | 945 (45.1%) |
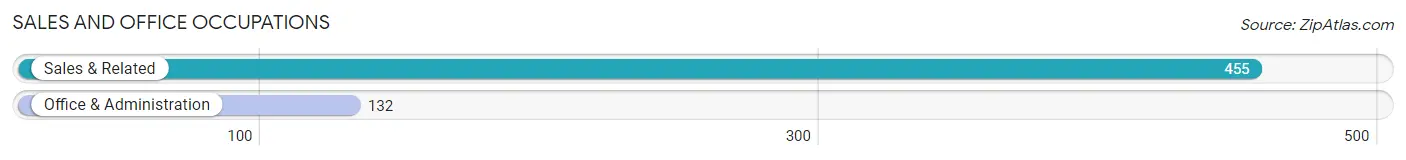
Sales and Office Occupations
The most common Sales and Office occupations in Osprey are Sales & Related (455 | 21.7%), and Office & Administration (132 | 6.3%).
Sales and Office Occupations by Sex
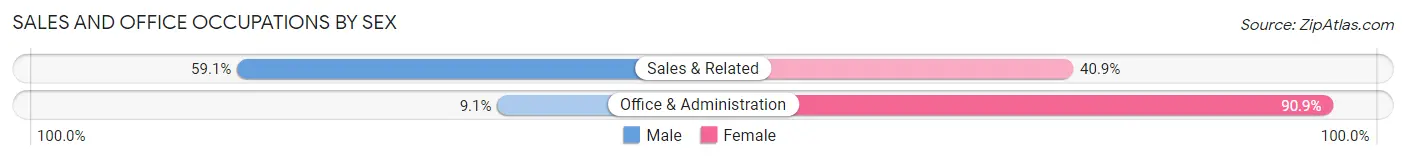
| Occupation | Male | Female |
| Sales & Related | 269 (59.1%) | 186 (40.9%) |
| Office & Administration | 12 (9.1%) | 120 (90.9%) |
| Total (Category) | 281 (47.9%) | 306 (52.1%) |
| Total (Overall) | 1,151 (54.9%) | 945 (45.1%) |
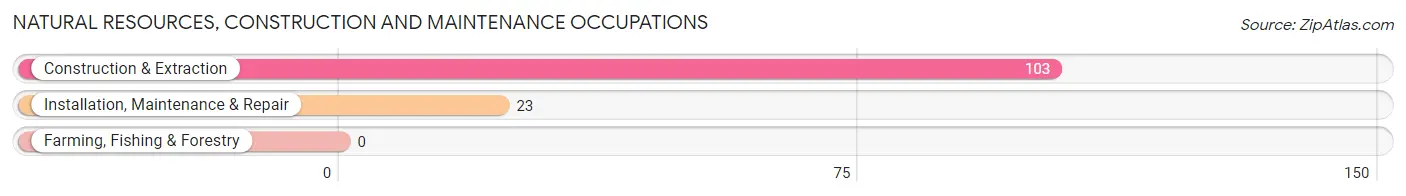
Natural Resources, Construction and Maintenance Occupations
The most common Natural Resources, Construction and Maintenance occupations in Osprey are Construction & Extraction (103 | 4.9%), and Installation, Maintenance & Repair (23 | 1.1%).
Natural Resources, Construction and Maintenance Occupations by Sex
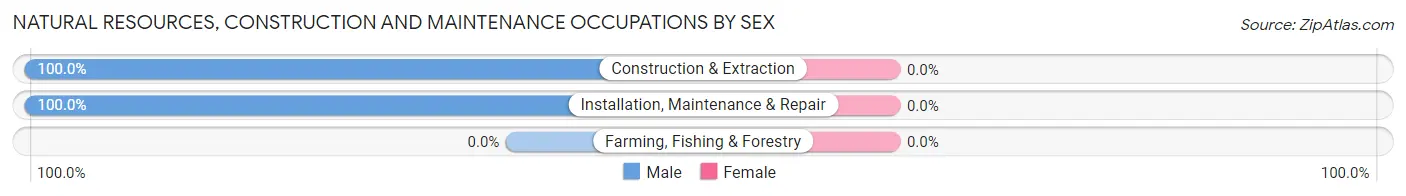
| Occupation | Male | Female |
| Farming, Fishing & Forestry | 0 (0.0%) | 0 (0.0%) |
| Construction & Extraction | 103 (100.0%) | 0 (0.0%) |
| Installation, Maintenance & Repair | 23 (100.0%) | 0 (0.0%) |
| Total (Category) | 126 (100.0%) | 0 (0.0%) |
| Total (Overall) | 1,151 (54.9%) | 945 (45.1%) |
Production, Transportation and Moving Occupations
The most common Production, Transportation and Moving occupations in Osprey are Transportation (21 | 1.0%), and Material Moving (9 | 0.4%).

Production, Transportation and Moving Occupations by Sex
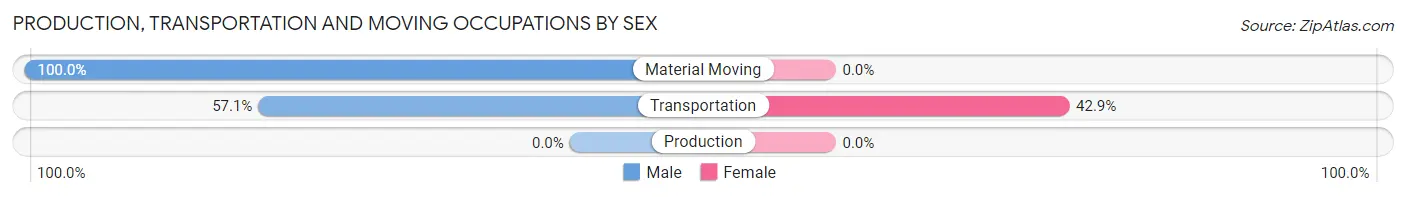
| Occupation | Male | Female |
| Production | 0 (0.0%) | 0 (0.0%) |
| Transportation | 12 (57.1%) | 9 (42.9%) |
| Material Moving | 9 (100.0%) | 0 (0.0%) |
| Total (Category) | 21 (70.0%) | 9 (30.0%) |
| Total (Overall) | 1,151 (54.9%) | 945 (45.1%) |
Employment Industries by Sex in Osprey
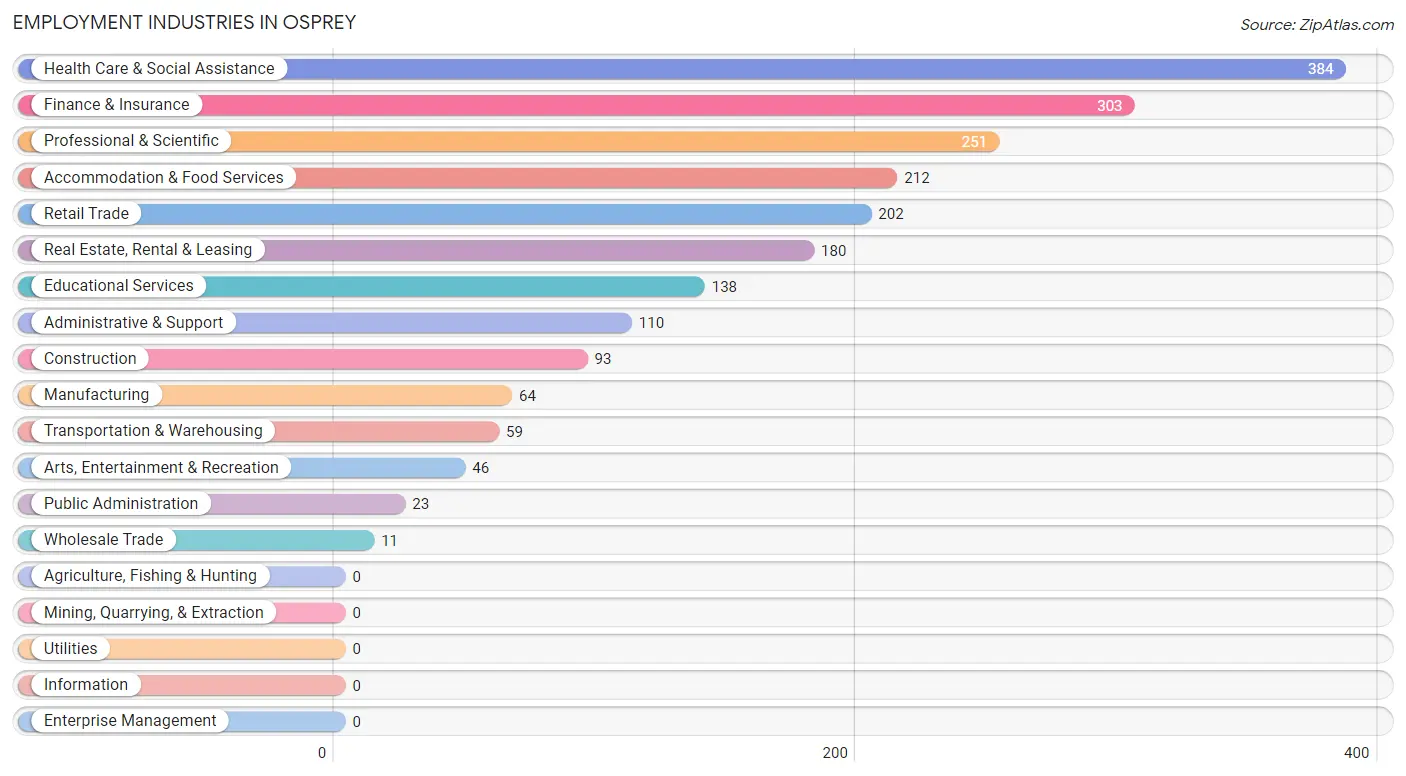
Employment Industries in Osprey
The major employment industries in Osprey include Health Care & Social Assistance (384 | 18.3%), Finance & Insurance (303 | 14.5%), Professional & Scientific (251 | 12.0%), Accommodation & Food Services (212 | 10.1%), and Retail Trade (202 | 9.6%).
Employment Industries by Sex in Osprey
The Osprey industries that see more men than women are Wholesale Trade (100.0%), Arts, Entertainment & Recreation (100.0%), and Public Administration (100.0%), whereas the industries that tend to have a higher number of women are Educational Services (89.9%), Health Care & Social Assistance (60.7%), and Accommodation & Food Services (55.7%).
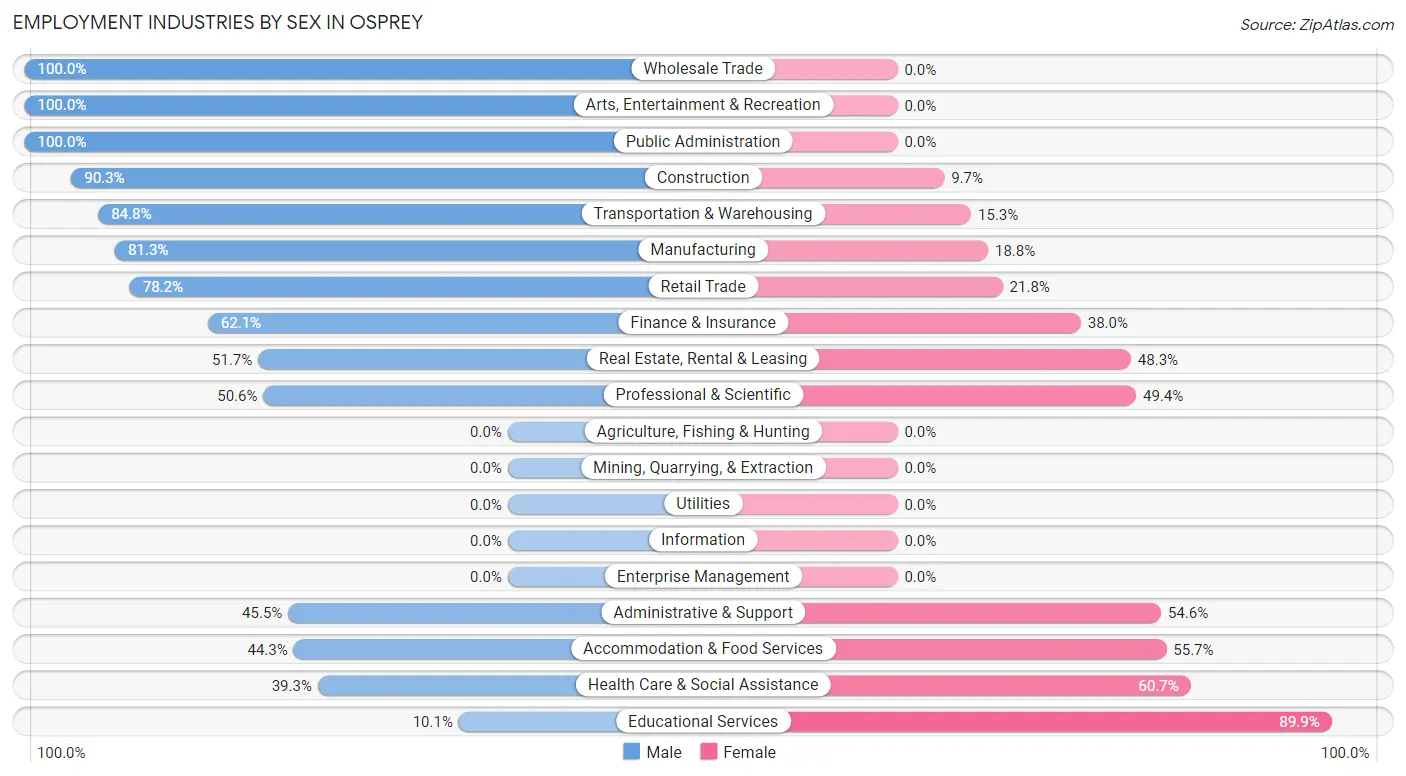
| Industry | Male | Female |
| Agriculture, Fishing & Hunting | 0 (0.0%) | 0 (0.0%) |
| Mining, Quarrying, & Extraction | 0 (0.0%) | 0 (0.0%) |
| Construction | 84 (90.3%) | 9 (9.7%) |
| Manufacturing | 52 (81.2%) | 12 (18.8%) |
| Wholesale Trade | 11 (100.0%) | 0 (0.0%) |
| Retail Trade | 158 (78.2%) | 44 (21.8%) |
| Transportation & Warehousing | 50 (84.8%) | 9 (15.2%) |
| Utilities | 0 (0.0%) | 0 (0.0%) |
| Information | 0 (0.0%) | 0 (0.0%) |
| Finance & Insurance | 188 (62.1%) | 115 (38.0%) |
| Real Estate, Rental & Leasing | 93 (51.7%) | 87 (48.3%) |
| Professional & Scientific | 127 (50.6%) | 124 (49.4%) |
| Enterprise Management | 0 (0.0%) | 0 (0.0%) |
| Administrative & Support | 50 (45.5%) | 60 (54.5%) |
| Educational Services | 14 (10.1%) | 124 (89.9%) |
| Health Care & Social Assistance | 151 (39.3%) | 233 (60.7%) |
| Arts, Entertainment & Recreation | 46 (100.0%) | 0 (0.0%) |
| Accommodation & Food Services | 94 (44.3%) | 118 (55.7%) |
| Public Administration | 23 (100.0%) | 0 (0.0%) |
| Total | 1,151 (54.9%) | 945 (45.1%) |
Education in Osprey
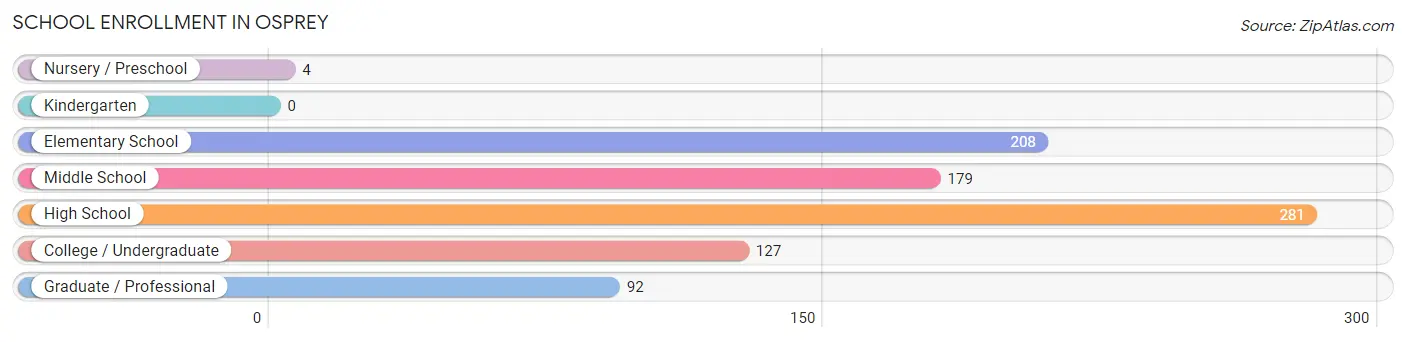
School Enrollment in Osprey
The most common levels of schooling among the 891 students in Osprey are high school (281 | 31.5%), elementary school (208 | 23.3%), and middle school (179 | 20.1%).
| School Level | # Students | % Students |
| Nursery / Preschool | 4 | 0.4% |
| Kindergarten | 0 | 0.0% |
| Elementary School | 208 | 23.3% |
| Middle School | 179 | 20.1% |
| High School | 281 | 31.5% |
| College / Undergraduate | 127 | 14.2% |
| Graduate / Professional | 92 | 10.3% |
| Total | 891 | 100.0% |
School Enrollment by Age by Funding Source in Osprey
Out of a total of 891 students who are enrolled in schools in Osprey, 193 (21.7%) attend a private institution, while the remaining 698 (78.3%) are enrolled in public schools. The age group of 3 to 4 year olds has the highest likelihood of being enrolled in private schools, with 4 (100.0% in the age bracket) enrolled. Conversely, the age group of 18 to 19 year olds has the lowest likelihood of being enrolled in a private school, with 90 (100.0% in the age bracket) attending a public institution.
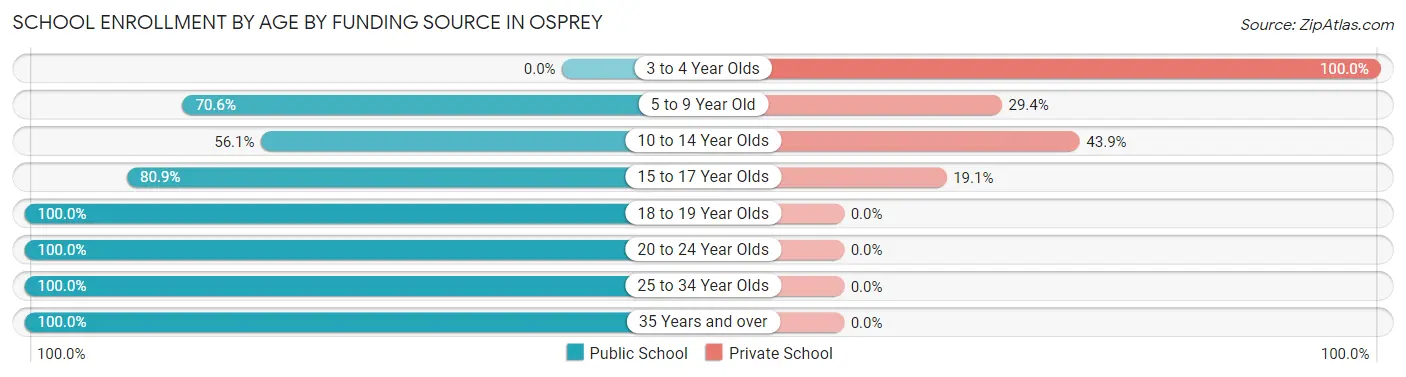
| Age Bracket | Public School | Private School |
| 3 to 4 Year Olds | 0 (0.0%) | 4 (100.0%) |
| 5 to 9 Year Old | 120 (70.6%) | 50 (29.4%) |
| 10 to 14 Year Olds | 129 (56.1%) | 101 (43.9%) |
| 15 to 17 Year Olds | 161 (80.9%) | 38 (19.1%) |
| 18 to 19 Year Olds | 90 (100.0%) | 0 (0.0%) |
| 20 to 24 Year Olds | 96 (100.0%) | 0 (0.0%) |
| 25 to 34 Year Olds | 48 (100.0%) | 0 (0.0%) |
| 35 Years and over | 54 (100.0%) | 0 (0.0%) |
| Total | 698 (78.3%) | 193 (21.7%) |
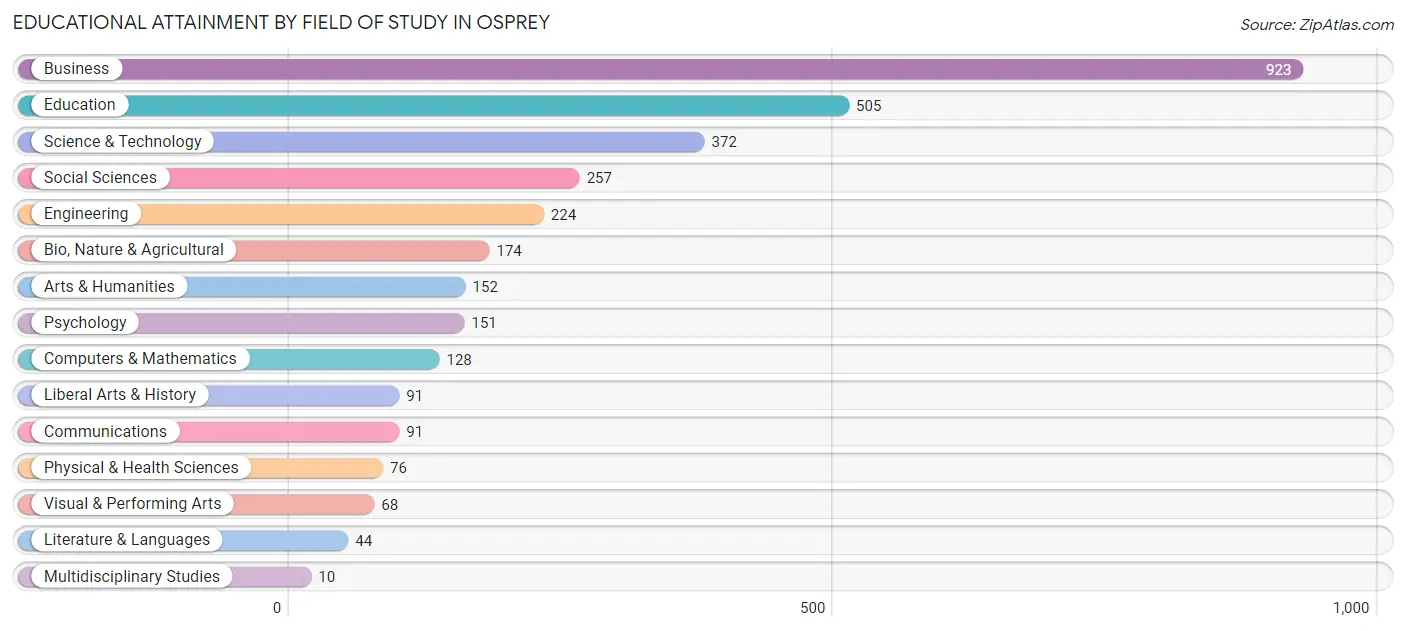
Educational Attainment by Field of Study in Osprey
Business (923 | 28.3%), education (505 | 15.5%), science & technology (372 | 11.4%), social sciences (257 | 7.9%), and engineering (224 | 6.9%) are the most common fields of study among 3,266 individuals in Osprey who have obtained a bachelor's degree or higher.
| Field of Study | # Graduates | % Graduates |
| Computers & Mathematics | 128 | 3.9% |
| Bio, Nature & Agricultural | 174 | 5.3% |
| Physical & Health Sciences | 76 | 2.3% |
| Psychology | 151 | 4.6% |
| Social Sciences | 257 | 7.9% |
| Engineering | 224 | 6.9% |
| Multidisciplinary Studies | 10 | 0.3% |
| Science & Technology | 372 | 11.4% |
| Business | 923 | 28.3% |
| Education | 505 | 15.5% |
| Literature & Languages | 44 | 1.3% |
| Liberal Arts & History | 91 | 2.8% |
| Visual & Performing Arts | 68 | 2.1% |
| Communications | 91 | 2.8% |
| Arts & Humanities | 152 | 4.6% |
| Total | 3,266 | 100.0% |
Transportation & Commute in Osprey
Vehicle Availability by Sex in Osprey
The most prevalent vehicle ownership categories in Osprey are males with 2 vehicles (642, accounting for 55.8%) and females with 2 vehicles (536, making up 67.9%).
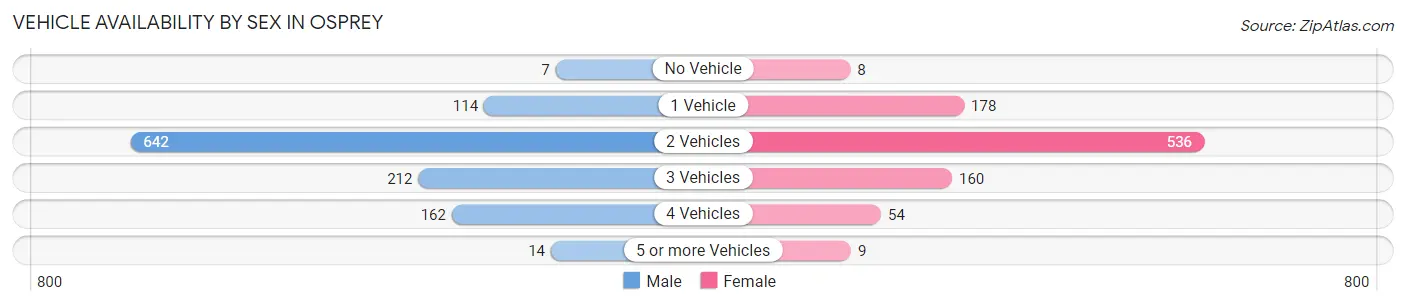
| Vehicles Available | Male | Female |
| No Vehicle | 7 (0.6%) | 8 (0.9%) |
| 1 Vehicle | 114 (9.9%) | 178 (18.8%) |
| 2 Vehicles | 642 (55.8%) | 536 (56.7%) |
| 3 Vehicles | 212 (18.4%) | 160 (16.9%) |
| 4 Vehicles | 162 (14.1%) | 54 (5.7%) |
| 5 or more Vehicles | 14 (1.2%) | 9 (0.9%) |
| Total | 1,151 (100.0%) | 945 (100.0%) |
Commute Time in Osprey
The most frequently occuring commute durations in Osprey are 30 to 34 minutes (527 commuters, 30.5%), 20 to 24 minutes (347 commuters, 20.1%), and 15 to 19 minutes (269 commuters, 15.6%).
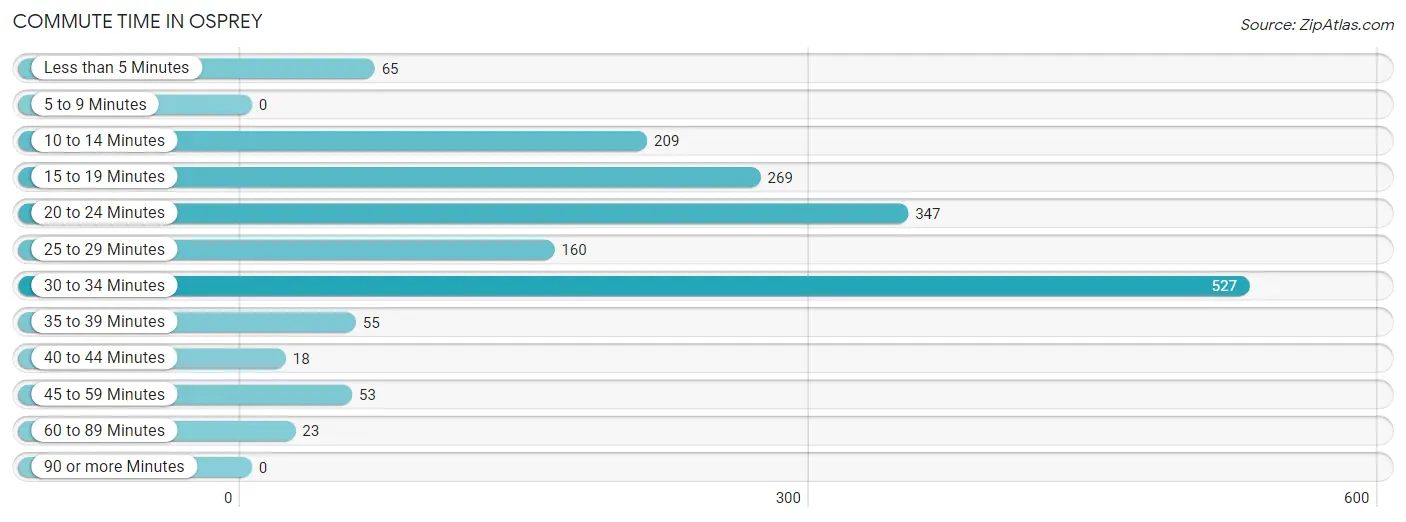
| Commute Time | # Commuters | % Commuters |
| Less than 5 Minutes | 65 | 3.8% |
| 5 to 9 Minutes | 0 | 0.0% |
| 10 to 14 Minutes | 209 | 12.1% |
| 15 to 19 Minutes | 269 | 15.6% |
| 20 to 24 Minutes | 347 | 20.1% |
| 25 to 29 Minutes | 160 | 9.3% |
| 30 to 34 Minutes | 527 | 30.5% |
| 35 to 39 Minutes | 55 | 3.2% |
| 40 to 44 Minutes | 18 | 1.0% |
| 45 to 59 Minutes | 53 | 3.1% |
| 60 to 89 Minutes | 23 | 1.3% |
| 90 or more Minutes | 0 | 0.0% |
Commute Time by Sex in Osprey
The most common commute times in Osprey are 30 to 34 minutes (310 commuters, 33.7%) for males and 30 to 34 minutes (217 commuters, 27.0%) for females.
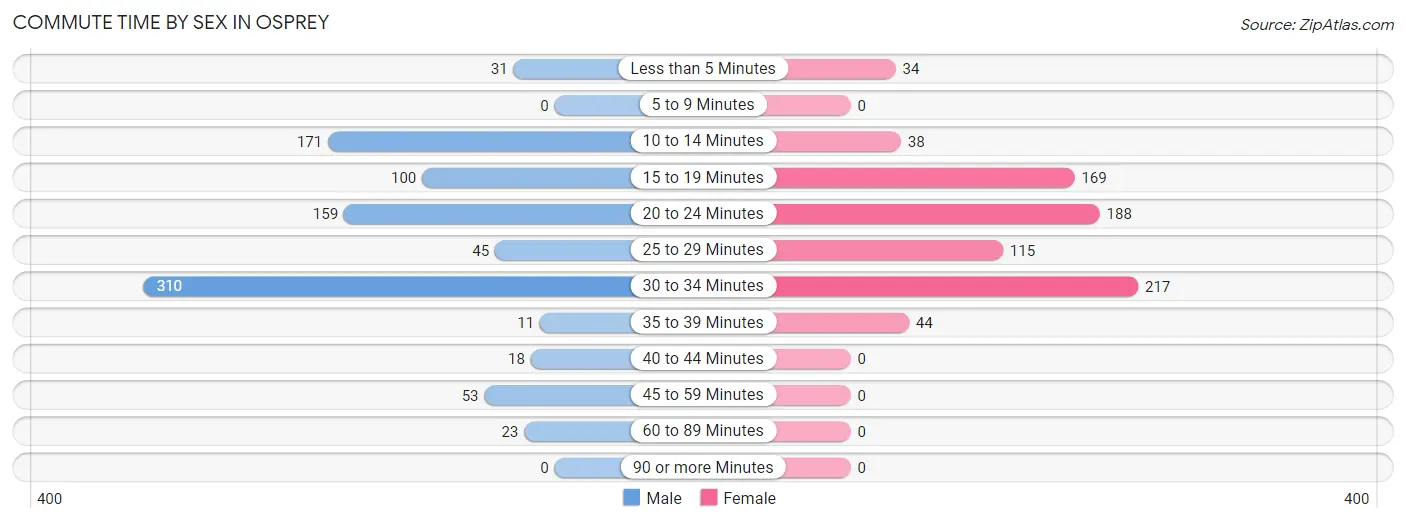
| Commute Time | Male | Female |
| Less than 5 Minutes | 31 (3.4%) | 34 (4.2%) |
| 5 to 9 Minutes | 0 (0.0%) | 0 (0.0%) |
| 10 to 14 Minutes | 171 (18.6%) | 38 (4.7%) |
| 15 to 19 Minutes | 100 (10.9%) | 169 (21.0%) |
| 20 to 24 Minutes | 159 (17.3%) | 188 (23.4%) |
| 25 to 29 Minutes | 45 (4.9%) | 115 (14.3%) |
| 30 to 34 Minutes | 310 (33.7%) | 217 (27.0%) |
| 35 to 39 Minutes | 11 (1.2%) | 44 (5.5%) |
| 40 to 44 Minutes | 18 (1.9%) | 0 (0.0%) |
| 45 to 59 Minutes | 53 (5.8%) | 0 (0.0%) |
| 60 to 89 Minutes | 23 (2.5%) | 0 (0.0%) |
| 90 or more Minutes | 0 (0.0%) | 0 (0.0%) |
Time of Departure to Work by Sex in Osprey
The most frequent times of departure to work in Osprey are 7:30 AM to 7:59 AM (184, 20.0%) for males and 9:00 AM to 9:59 AM (139, 17.3%) for females.
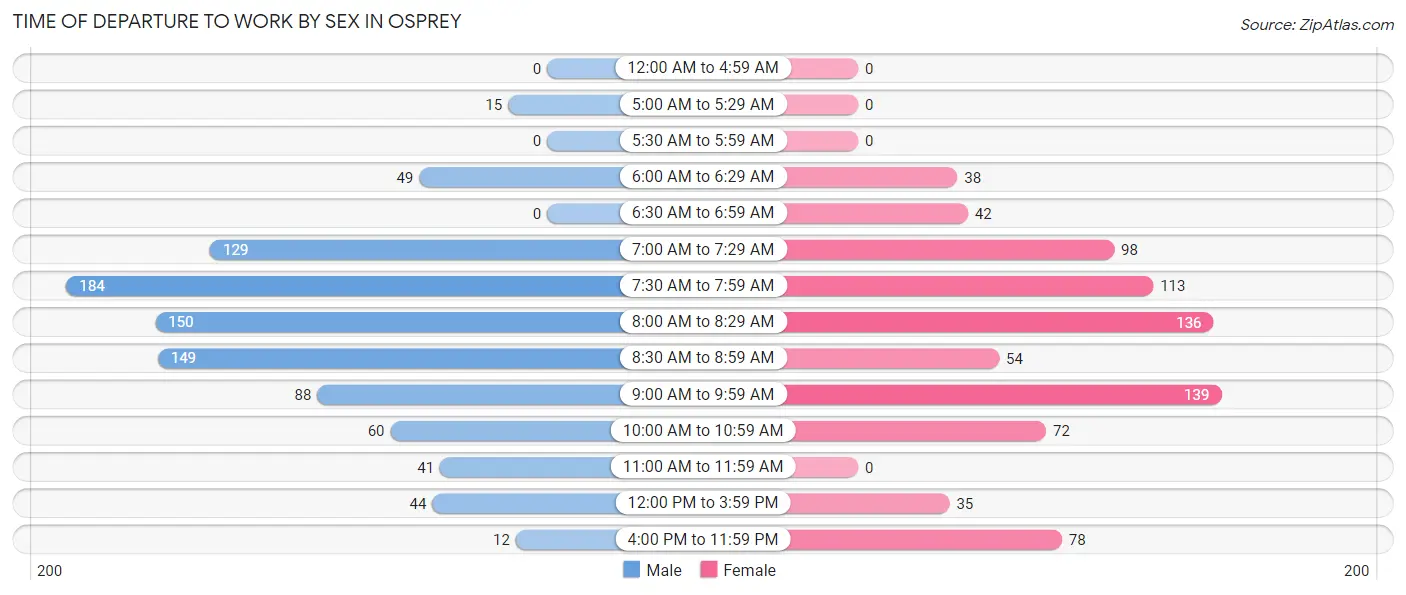
| Time of Departure | Male | Female |
| 12:00 AM to 4:59 AM | 0 (0.0%) | 0 (0.0%) |
| 5:00 AM to 5:29 AM | 15 (1.6%) | 0 (0.0%) |
| 5:30 AM to 5:59 AM | 0 (0.0%) | 0 (0.0%) |
| 6:00 AM to 6:29 AM | 49 (5.3%) | 38 (4.7%) |
| 6:30 AM to 6:59 AM | 0 (0.0%) | 42 (5.2%) |
| 7:00 AM to 7:29 AM | 129 (14.0%) | 98 (12.2%) |
| 7:30 AM to 7:59 AM | 184 (20.0%) | 113 (14.0%) |
| 8:00 AM to 8:29 AM | 150 (16.3%) | 136 (16.9%) |
| 8:30 AM to 8:59 AM | 149 (16.2%) | 54 (6.7%) |
| 9:00 AM to 9:59 AM | 88 (9.6%) | 139 (17.3%) |
| 10:00 AM to 10:59 AM | 60 (6.5%) | 72 (8.9%) |
| 11:00 AM to 11:59 AM | 41 (4.4%) | 0 (0.0%) |
| 12:00 PM to 3:59 PM | 44 (4.8%) | 35 (4.3%) |
| 4:00 PM to 11:59 PM | 12 (1.3%) | 78 (9.7%) |
| Total | 921 (100.0%) | 805 (100.0%) |
Housing Occupancy in Osprey
Occupancy by Ownership in Osprey
Of the total 2,855 dwellings in Osprey, owner-occupied units account for 2,503 (87.7%), while renter-occupied units make up 352 (12.3%).
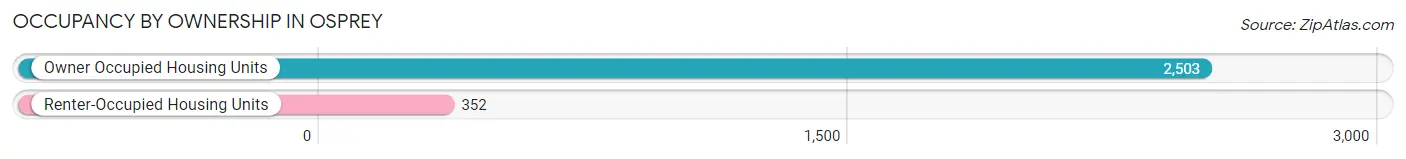
| Occupancy | # Housing Units | % Housing Units |
| Owner Occupied Housing Units | 2,503 | 87.7% |
| Renter-Occupied Housing Units | 352 | 12.3% |
| Total Occupied Housing Units | 2,855 | 100.0% |
Occupancy by Household Size in Osprey
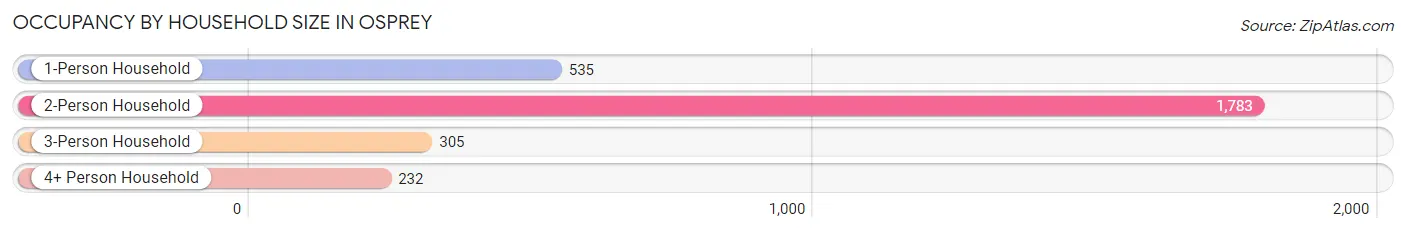
| Household Size | # Housing Units | % Housing Units |
| 1-Person Household | 535 | 18.7% |
| 2-Person Household | 1,783 | 62.5% |
| 3-Person Household | 305 | 10.7% |
| 4+ Person Household | 232 | 8.1% |
| Total Housing Units | 2,855 | 100.0% |
Occupancy by Ownership by Household Size in Osprey
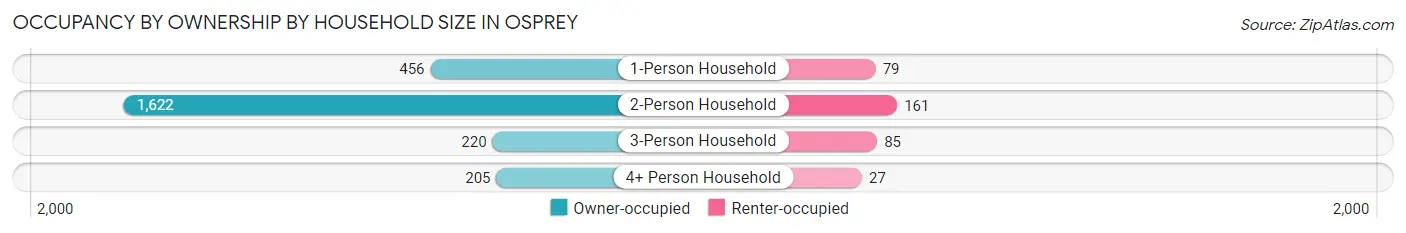
| Household Size | Owner-occupied | Renter-occupied |
| 1-Person Household | 456 (85.2%) | 79 (14.8%) |
| 2-Person Household | 1,622 (91.0%) | 161 (9.0%) |
| 3-Person Household | 220 (72.1%) | 85 (27.9%) |
| 4+ Person Household | 205 (88.4%) | 27 (11.6%) |
| Total Housing Units | 2,503 (87.7%) | 352 (12.3%) |
Occupancy by Educational Attainment in Osprey
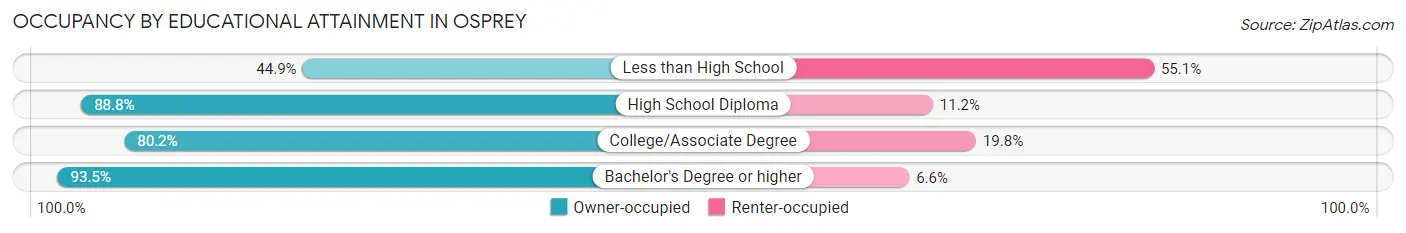
| Household Size | Owner-occupied | Renter-occupied |
| Less than High School | 53 (44.9%) | 65 (55.1%) |
| High School Diploma | 379 (88.8%) | 48 (11.2%) |
| College/Associate Degree | 531 (80.2%) | 131 (19.8%) |
| Bachelor's Degree or higher | 1,540 (93.4%) | 108 (6.6%) |
Occupancy by Age of Householder in Osprey
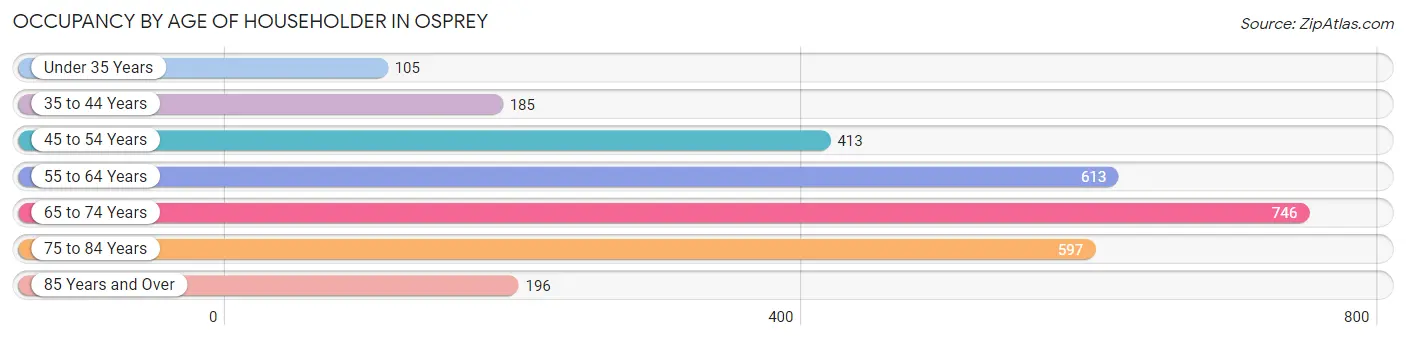
| Age Bracket | # Households | % Households |
| Under 35 Years | 105 | 3.7% |
| 35 to 44 Years | 185 | 6.5% |
| 45 to 54 Years | 413 | 14.5% |
| 55 to 64 Years | 613 | 21.5% |
| 65 to 74 Years | 746 | 26.1% |
| 75 to 84 Years | 597 | 20.9% |
| 85 Years and Over | 196 | 6.9% |
| Total | 2,855 | 100.0% |
Housing Finances in Osprey
Median Income by Occupancy in Osprey
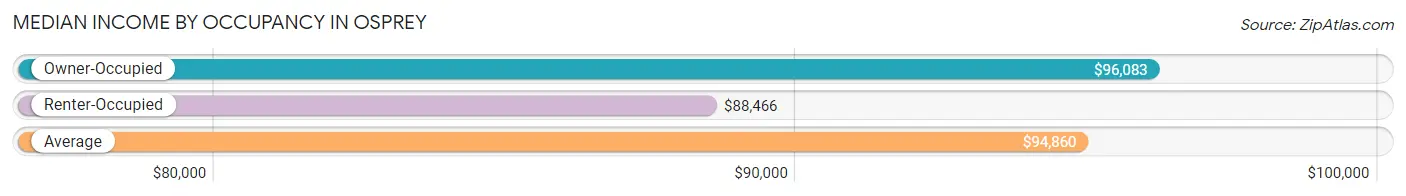
| Occupancy Type | # Households | Median Income |
| Owner-Occupied | 2,503 (87.7%) | $96,083 |
| Renter-Occupied | 352 (12.3%) | $88,466 |
| Average | 2,855 (100.0%) | $94,860 |
Occupancy by Householder Income Bracket in Osprey
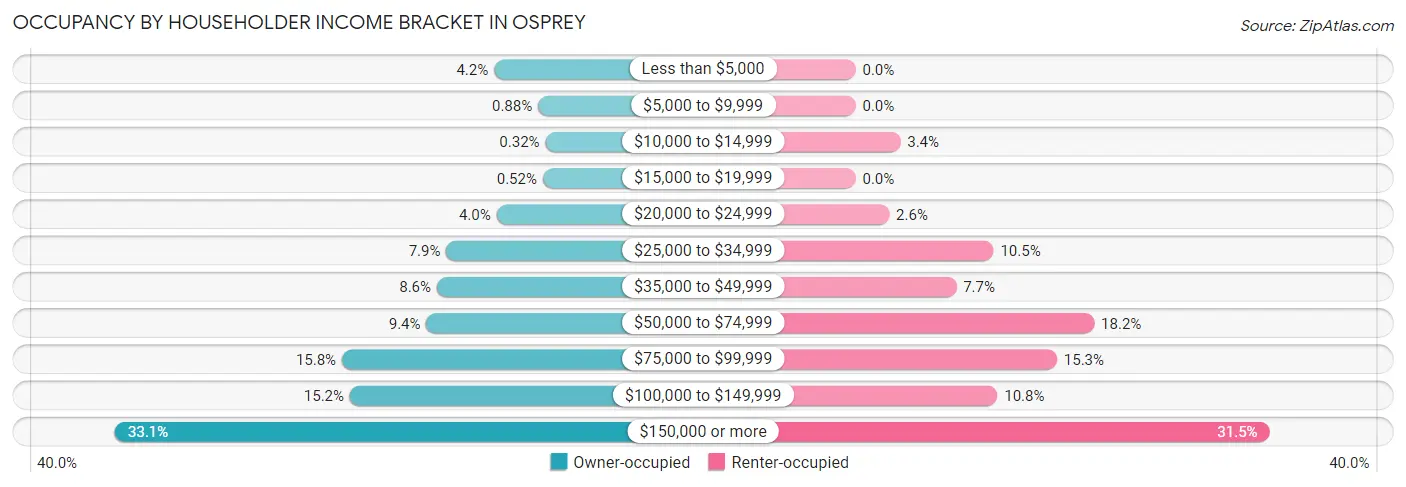
| Income Bracket | Owner-occupied | Renter-occupied |
| Less than $5,000 | 106 (4.2%) | 0 (0.0%) |
| $5,000 to $9,999 | 22 (0.9%) | 0 (0.0%) |
| $10,000 to $14,999 | 8 (0.3%) | 12 (3.4%) |
| $15,000 to $19,999 | 13 (0.5%) | 0 (0.0%) |
| $20,000 to $24,999 | 101 (4.0%) | 9 (2.6%) |
| $25,000 to $34,999 | 197 (7.9%) | 37 (10.5%) |
| $35,000 to $49,999 | 215 (8.6%) | 27 (7.7%) |
| $50,000 to $74,999 | 235 (9.4%) | 64 (18.2%) |
| $75,000 to $99,999 | 396 (15.8%) | 54 (15.3%) |
| $100,000 to $149,999 | 381 (15.2%) | 38 (10.8%) |
| $150,000 or more | 829 (33.1%) | 111 (31.5%) |
| Total | 2,503 (100.0%) | 352 (100.0%) |
Monthly Housing Cost Tiers in Osprey
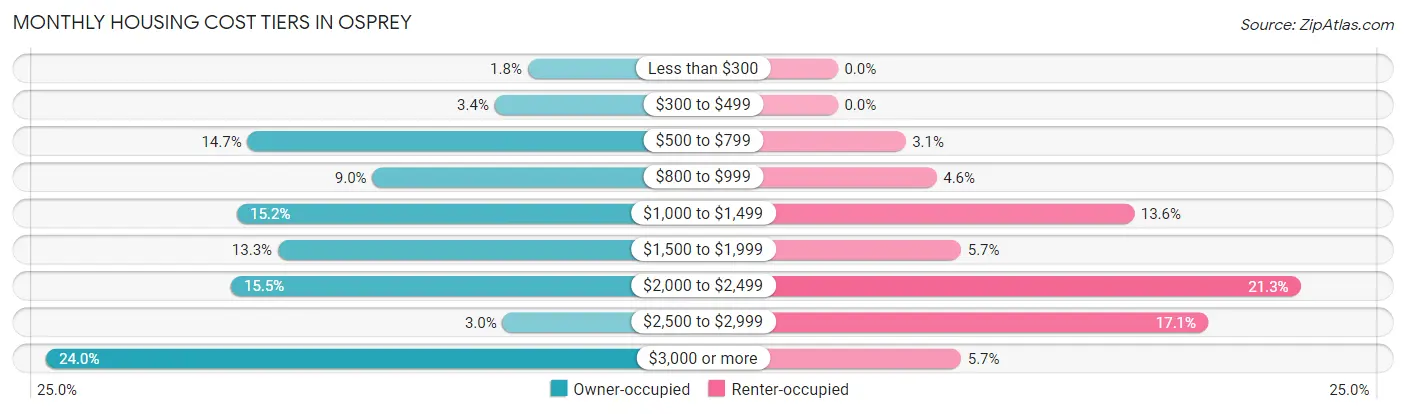
| Monthly Cost | Owner-occupied | Renter-occupied |
| Less than $300 | 46 (1.8%) | 0 (0.0%) |
| $300 to $499 | 84 (3.4%) | 0 (0.0%) |
| $500 to $799 | 369 (14.7%) | 11 (3.1%) |
| $800 to $999 | 225 (9.0%) | 16 (4.5%) |
| $1,000 to $1,499 | 381 (15.2%) | 48 (13.6%) |
| $1,500 to $1,999 | 334 (13.3%) | 20 (5.7%) |
| $2,000 to $2,499 | 388 (15.5%) | 75 (21.3%) |
| $2,500 to $2,999 | 75 (3.0%) | 60 (17.1%) |
| $3,000 or more | 601 (24.0%) | 20 (5.7%) |
| Total | 2,503 (100.0%) | 352 (100.0%) |
Physical Housing Characteristics in Osprey
Housing Structures in Osprey
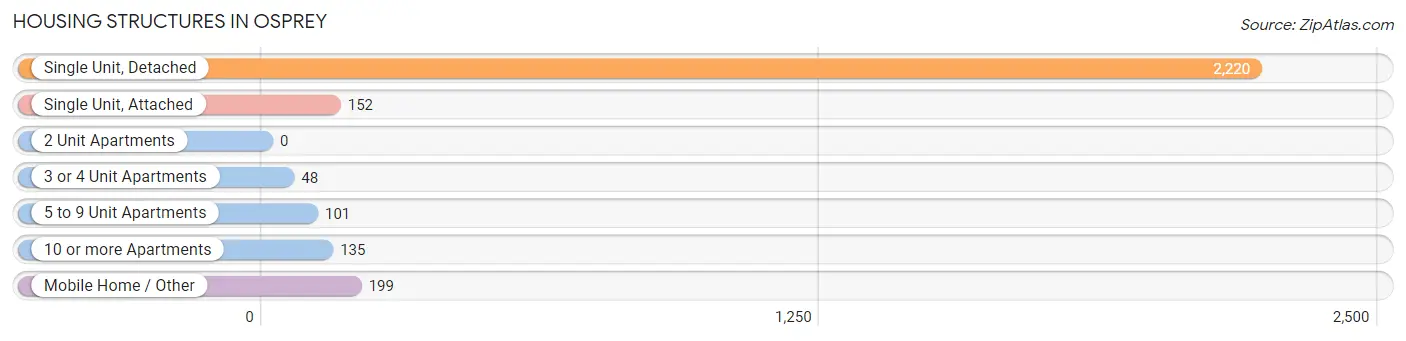
| Structure Type | # Housing Units | % Housing Units |
| Single Unit, Detached | 2,220 | 77.8% |
| Single Unit, Attached | 152 | 5.3% |
| 2 Unit Apartments | 0 | 0.0% |
| 3 or 4 Unit Apartments | 48 | 1.7% |
| 5 to 9 Unit Apartments | 101 | 3.5% |
| 10 or more Apartments | 135 | 4.7% |
| Mobile Home / Other | 199 | 7.0% |
| Total | 2,855 | 100.0% |
Housing Structures by Occupancy in Osprey
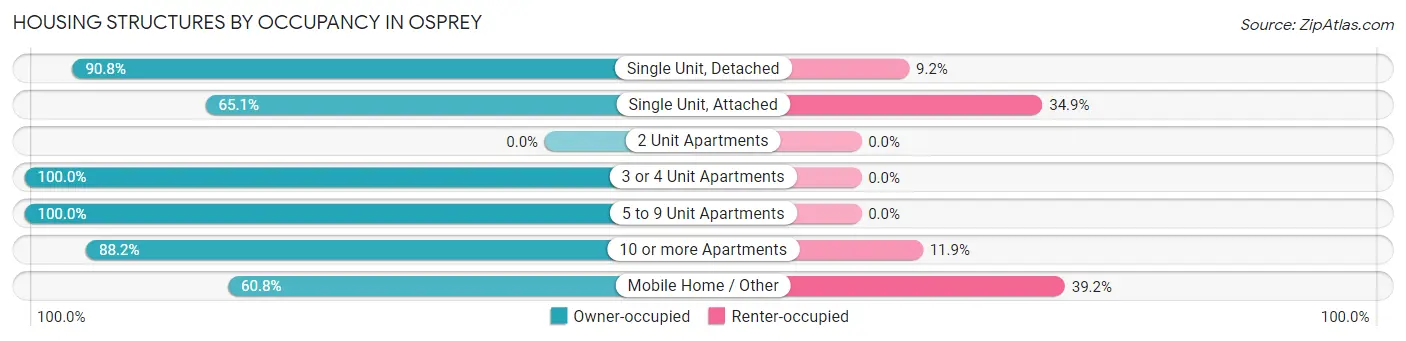
| Structure Type | Owner-occupied | Renter-occupied |
| Single Unit, Detached | 2,015 (90.8%) | 205 (9.2%) |
| Single Unit, Attached | 99 (65.1%) | 53 (34.9%) |
| 2 Unit Apartments | 0 (0.0%) | 0 (0.0%) |
| 3 or 4 Unit Apartments | 48 (100.0%) | 0 (0.0%) |
| 5 to 9 Unit Apartments | 101 (100.0%) | 0 (0.0%) |
| 10 or more Apartments | 119 (88.1%) | 16 (11.8%) |
| Mobile Home / Other | 121 (60.8%) | 78 (39.2%) |
| Total | 2,503 (87.7%) | 352 (12.3%) |
Housing Structures by Number of Rooms in Osprey
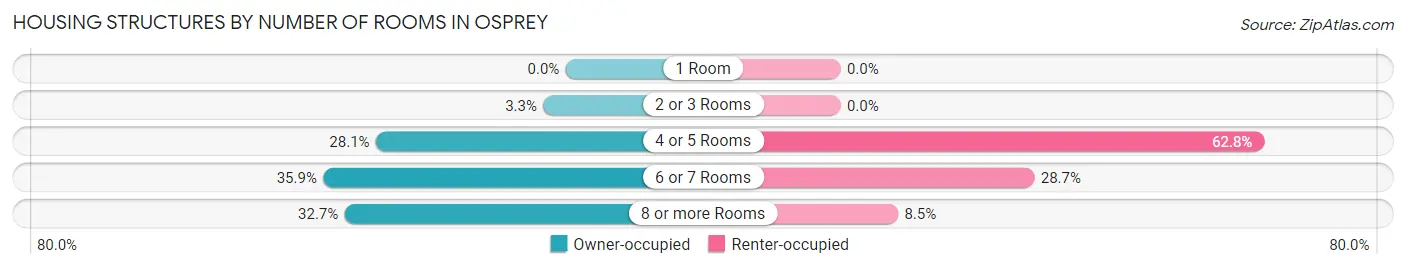
| Number of Rooms | Owner-occupied | Renter-occupied |
| 1 Room | 0 (0.0%) | 0 (0.0%) |
| 2 or 3 Rooms | 83 (3.3%) | 0 (0.0%) |
| 4 or 5 Rooms | 703 (28.1%) | 221 (62.8%) |
| 6 or 7 Rooms | 898 (35.9%) | 101 (28.7%) |
| 8 or more Rooms | 819 (32.7%) | 30 (8.5%) |
| Total | 2,503 (100.0%) | 352 (100.0%) |
Housing Structure by Heating Type in Osprey
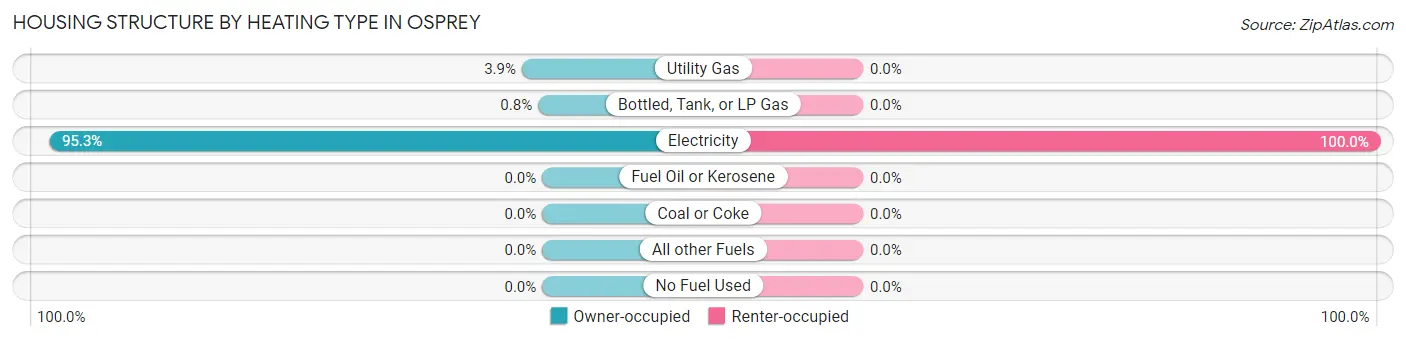
| Heating Type | Owner-occupied | Renter-occupied |
| Utility Gas | 98 (3.9%) | 0 (0.0%) |
| Bottled, Tank, or LP Gas | 20 (0.8%) | 0 (0.0%) |
| Electricity | 2,385 (95.3%) | 352 (100.0%) |
| Fuel Oil or Kerosene | 0 (0.0%) | 0 (0.0%) |
| Coal or Coke | 0 (0.0%) | 0 (0.0%) |
| All other Fuels | 0 (0.0%) | 0 (0.0%) |
| No Fuel Used | 0 (0.0%) | 0 (0.0%) |
| Total | 2,503 (100.0%) | 352 (100.0%) |
Household Vehicle Usage in Osprey
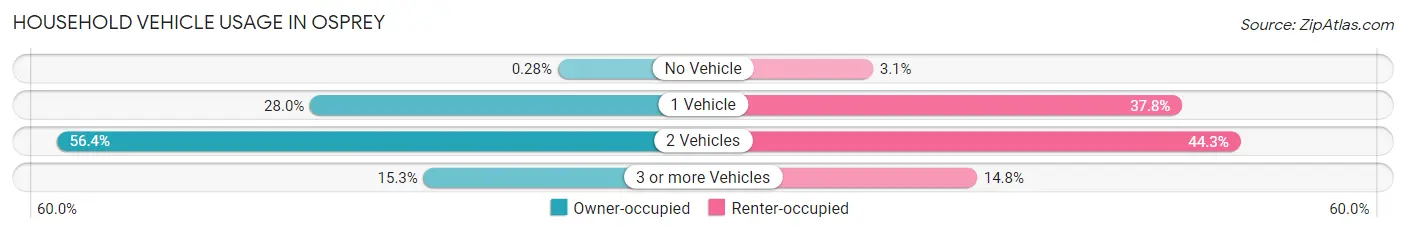
| Vehicles per Household | Owner-occupied | Renter-occupied |
| No Vehicle | 7 (0.3%) | 11 (3.1%) |
| 1 Vehicle | 701 (28.0%) | 133 (37.8%) |
| 2 Vehicles | 1,412 (56.4%) | 156 (44.3%) |
| 3 or more Vehicles | 383 (15.3%) | 52 (14.8%) |
| Total | 2,503 (100.0%) | 352 (100.0%) |
Real Estate & Mortgages in Osprey
Real Estate and Mortgage Overview in Osprey
| Characteristic | Without Mortgage | With Mortgage |
| Housing Units | 1,284 | 1,219 |
| Median Property Value | $668,100 | $670,600 |
| Median Household Income | $74,602 | $574 |
| Monthly Housing Costs | $898 | $567 |
| Real Estate Taxes | $4,678 | $10 |
Property Value by Mortgage Status in Osprey
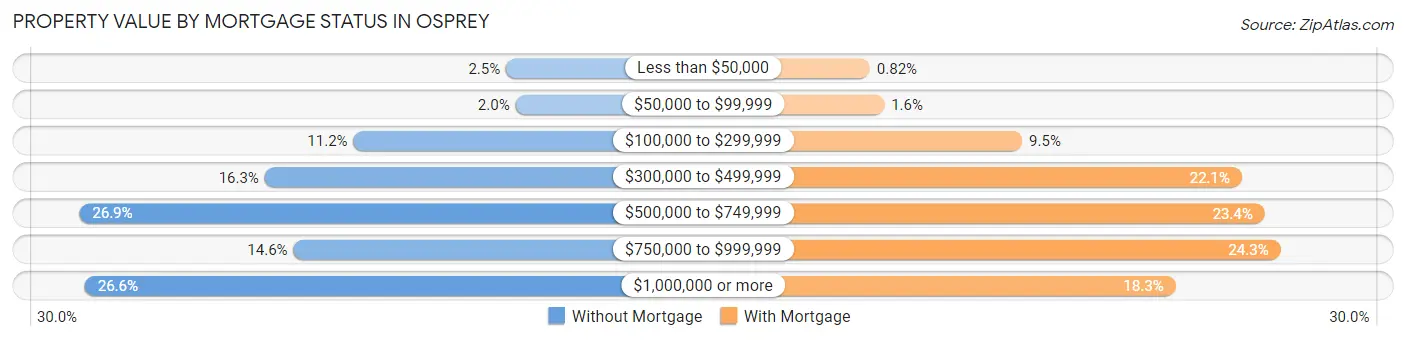
| Property Value | Without Mortgage | With Mortgage |
| Less than $50,000 | 32 (2.5%) | 10 (0.8%) |
| $50,000 to $99,999 | 25 (1.9%) | 20 (1.6%) |
| $100,000 to $299,999 | 144 (11.2%) | 116 (9.5%) |
| $300,000 to $499,999 | 209 (16.3%) | 269 (22.1%) |
| $500,000 to $749,999 | 345 (26.9%) | 285 (23.4%) |
| $750,000 to $999,999 | 188 (14.6%) | 296 (24.3%) |
| $1,000,000 or more | 341 (26.6%) | 223 (18.3%) |
| Total | 1,284 (100.0%) | 1,219 (100.0%) |
Household Income by Mortgage Status in Osprey
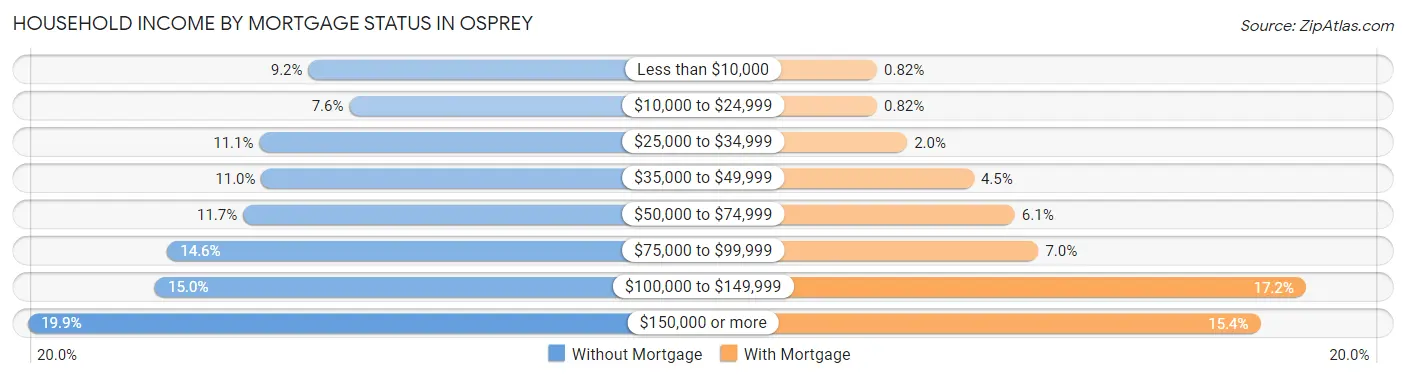
| Household Income | Without Mortgage | With Mortgage |
| Less than $10,000 | 118 (9.2%) | 10 (0.8%) |
| $10,000 to $24,999 | 98 (7.6%) | 10 (0.8%) |
| $25,000 to $34,999 | 142 (11.1%) | 24 (2.0%) |
| $35,000 to $49,999 | 141 (11.0%) | 55 (4.5%) |
| $50,000 to $74,999 | 150 (11.7%) | 74 (6.1%) |
| $75,000 to $99,999 | 187 (14.6%) | 85 (7.0%) |
| $100,000 to $149,999 | 193 (15.0%) | 209 (17.2%) |
| $150,000 or more | 255 (19.9%) | 188 (15.4%) |
| Total | 1,284 (100.0%) | 1,219 (100.0%) |
Property Value to Household Income Ratio in Osprey
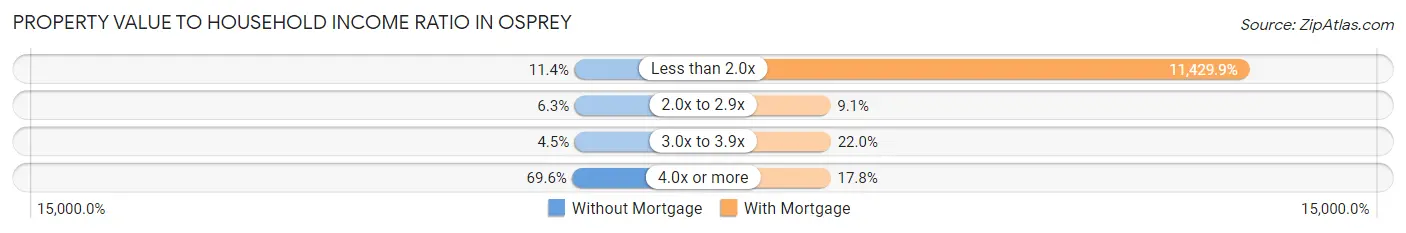
| Value-to-Income Ratio | Without Mortgage | With Mortgage |
| Less than 2.0x | 146 (11.4%) | 139,330 (11,429.9%) |
| 2.0x to 2.9x | 81 (6.3%) | 111 (9.1%) |
| 3.0x to 3.9x | 58 (4.5%) | 268 (22.0%) |
| 4.0x or more | 893 (69.6%) | 217 (17.8%) |
| Total | 1,284 (100.0%) | 1,219 (100.0%) |
Real Estate Taxes by Mortgage Status in Osprey
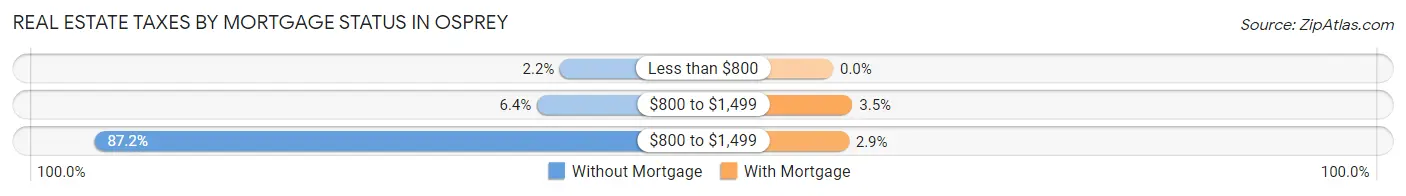
| Property Taxes | Without Mortgage | With Mortgage |
| Less than $800 | 28 (2.2%) | 0 (0.0%) |
| $800 to $1,499 | 82 (6.4%) | 43 (3.5%) |
| $800 to $1,499 | 1,120 (87.2%) | 35 (2.9%) |
| Total | 1,284 (100.0%) | 1,219 (100.0%) |
Health & Disability in Osprey
Health Insurance Coverage by Age in Osprey
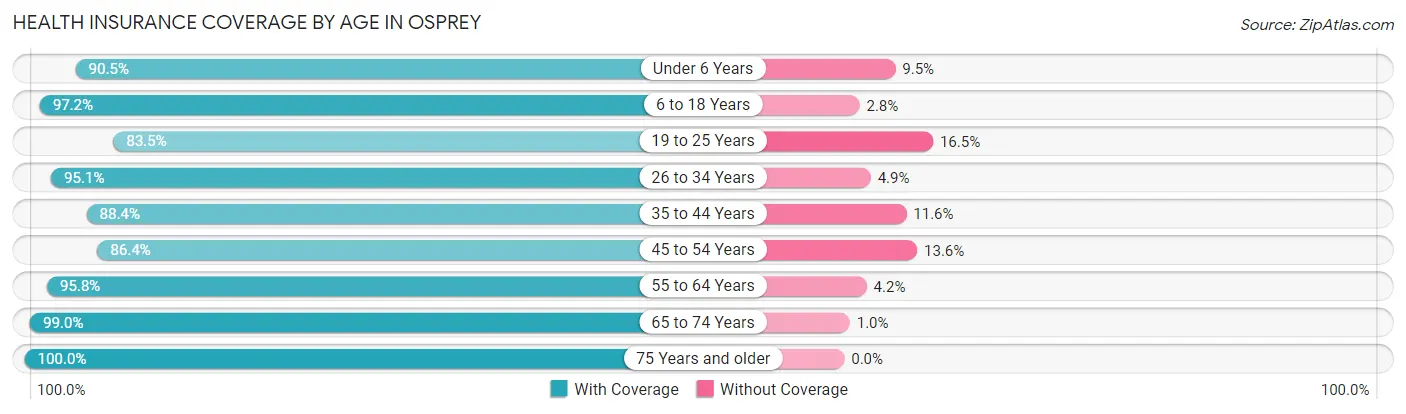
| Age Bracket | With Coverage | Without Coverage |
| Under 6 Years | 171 (90.5%) | 18 (9.5%) |
| 6 to 18 Years | 649 (97.2%) | 19 (2.8%) |
| 19 to 25 Years | 106 (83.5%) | 21 (16.5%) |
| 26 to 34 Years | 212 (95.1%) | 11 (4.9%) |
| 35 to 44 Years | 298 (88.4%) | 39 (11.6%) |
| 45 to 54 Years | 598 (86.4%) | 94 (13.6%) |
| 55 to 64 Years | 1,150 (95.8%) | 50 (4.2%) |
| 65 to 74 Years | 1,457 (99.0%) | 15 (1.0%) |
| 75 Years and older | 1,287 (100.0%) | 0 (0.0%) |
| Total | 5,928 (95.7%) | 267 (4.3%) |
Health Insurance Coverage by Citizenship Status in Osprey
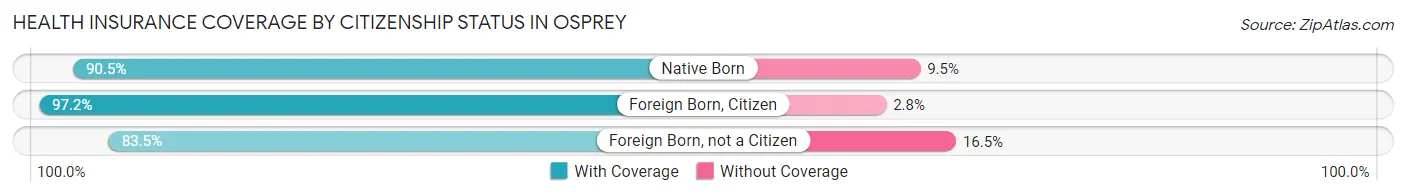
| Citizenship Status | With Coverage | Without Coverage |
| Native Born | 171 (90.5%) | 18 (9.5%) |
| Foreign Born, Citizen | 649 (97.2%) | 19 (2.8%) |
| Foreign Born, not a Citizen | 106 (83.5%) | 21 (16.5%) |
Health Insurance Coverage by Household Income in Osprey
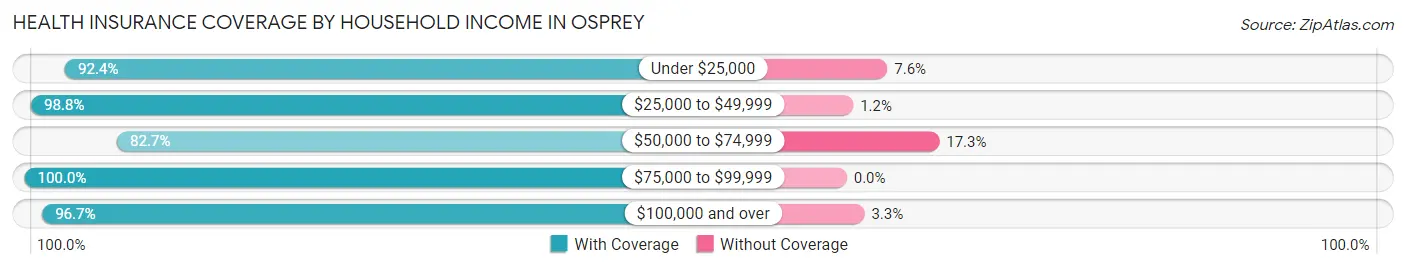
| Household Income | With Coverage | Without Coverage |
| Under $25,000 | 450 (92.4%) | 37 (7.6%) |
| $25,000 to $49,999 | 896 (98.8%) | 11 (1.2%) |
| $50,000 to $74,999 | 544 (82.7%) | 114 (17.3%) |
| $75,000 to $99,999 | 967 (100.0%) | 0 (0.0%) |
| $100,000 and over | 3,071 (96.7%) | 105 (3.3%) |
Public vs Private Health Insurance Coverage by Age in Osprey
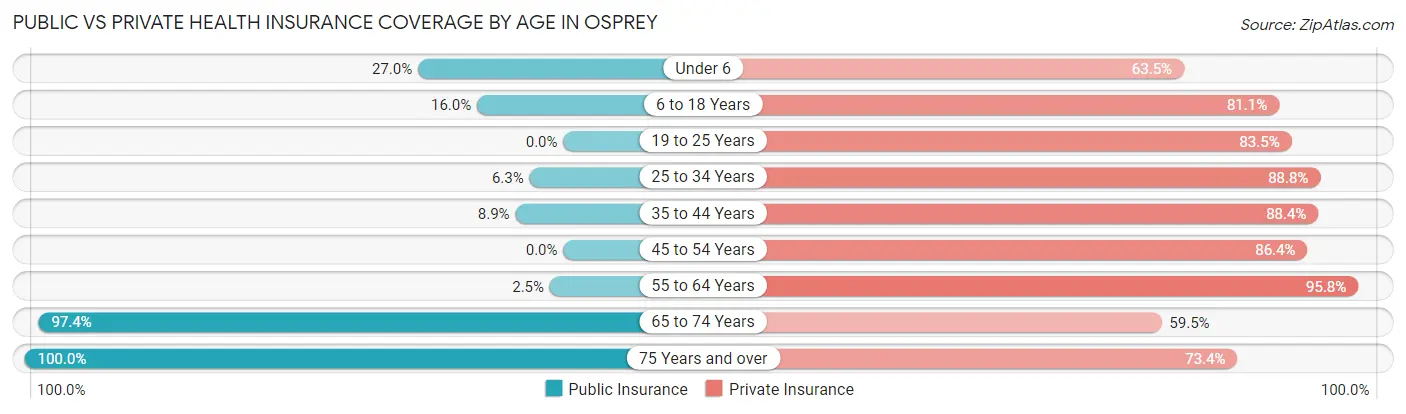
| Age Bracket | Public Insurance | Private Insurance |
| Under 6 | 51 (27.0%) | 120 (63.5%) |
| 6 to 18 Years | 107 (16.0%) | 542 (81.1%) |
| 19 to 25 Years | 0 (0.0%) | 106 (83.5%) |
| 25 to 34 Years | 14 (6.3%) | 198 (88.8%) |
| 35 to 44 Years | 30 (8.9%) | 298 (88.4%) |
| 45 to 54 Years | 0 (0.0%) | 598 (86.4%) |
| 55 to 64 Years | 30 (2.5%) | 1,150 (95.8%) |
| 65 to 74 Years | 1,434 (97.4%) | 876 (59.5%) |
| 75 Years and over | 1,287 (100.0%) | 945 (73.4%) |
| Total | 2,953 (47.7%) | 4,833 (78.0%) |
Disability Status by Sex by Age in Osprey
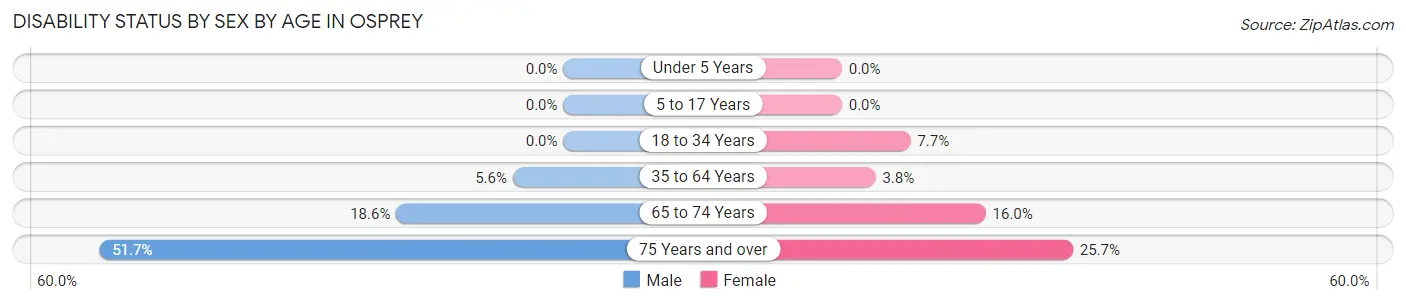
| Age Bracket | Male | Female |
| Under 5 Years | 0 (0.0%) | 0 (0.0%) |
| 5 to 17 Years | 0 (0.0%) | 0 (0.0%) |
| 18 to 34 Years | 0 (0.0%) | 14 (7.6%) |
| 35 to 64 Years | 58 (5.6%) | 45 (3.7%) |
| 65 to 74 Years | 131 (18.6%) | 123 (16.0%) |
| 75 Years and over | 366 (51.7%) | 149 (25.7%) |
Disability Class by Sex by Age in Osprey
Disability Class: Hearing Difficulty
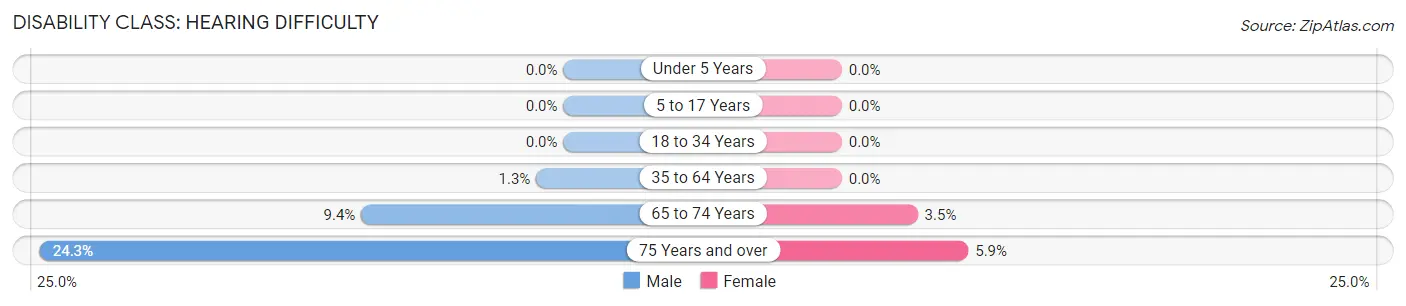
| Age Bracket | Male | Female |
| Under 5 Years | 0 (0.0%) | 0 (0.0%) |
| 5 to 17 Years | 0 (0.0%) | 0 (0.0%) |
| 18 to 34 Years | 0 (0.0%) | 0 (0.0%) |
| 35 to 64 Years | 13 (1.3%) | 0 (0.0%) |
| 65 to 74 Years | 66 (9.4%) | 27 (3.5%) |
| 75 Years and over | 172 (24.3%) | 34 (5.9%) |
Disability Class: Vision Difficulty
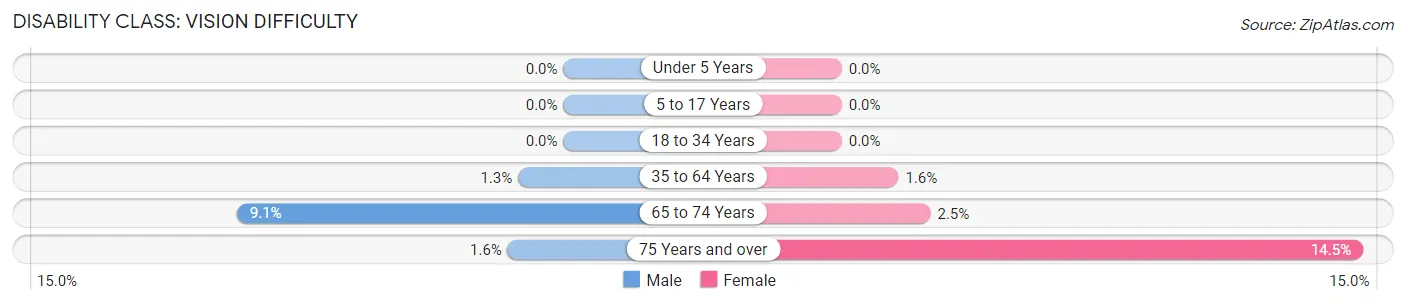
| Age Bracket | Male | Female |
| Under 5 Years | 0 (0.0%) | 0 (0.0%) |
| 5 to 17 Years | 0 (0.0%) | 0 (0.0%) |
| 18 to 34 Years | 0 (0.0%) | 0 (0.0%) |
| 35 to 64 Years | 13 (1.3%) | 19 (1.6%) |
| 65 to 74 Years | 64 (9.1%) | 19 (2.5%) |
| 75 Years and over | 11 (1.5%) | 84 (14.5%) |
Disability Class: Cognitive Difficulty
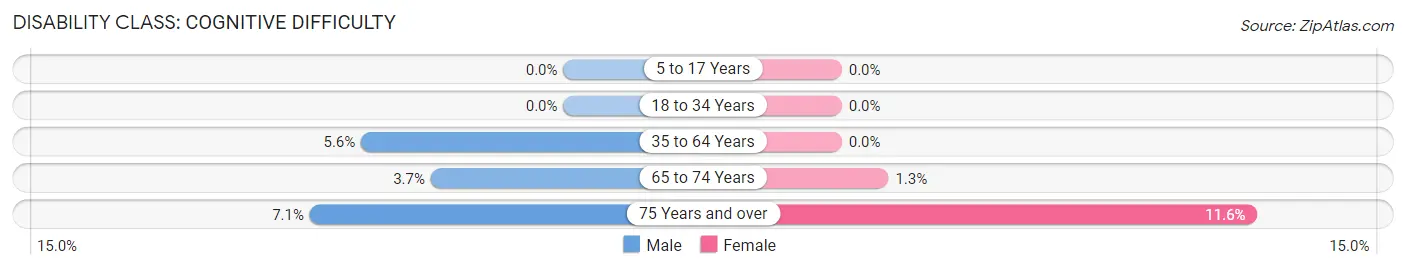
| Age Bracket | Male | Female |
| 5 to 17 Years | 0 (0.0%) | 0 (0.0%) |
| 18 to 34 Years | 0 (0.0%) | 0 (0.0%) |
| 35 to 64 Years | 58 (5.6%) | 0 (0.0%) |
| 65 to 74 Years | 26 (3.7%) | 10 (1.3%) |
| 75 Years and over | 50 (7.1%) | 67 (11.6%) |
Disability Class: Ambulatory Difficulty
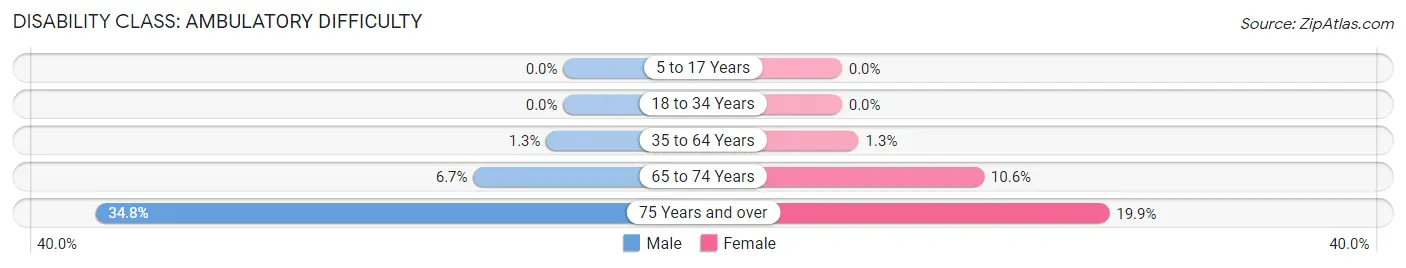
| Age Bracket | Male | Female |
| 5 to 17 Years | 0 (0.0%) | 0 (0.0%) |
| 18 to 34 Years | 0 (0.0%) | 0 (0.0%) |
| 35 to 64 Years | 13 (1.3%) | 15 (1.3%) |
| 65 to 74 Years | 47 (6.7%) | 81 (10.5%) |
| 75 Years and over | 246 (34.7%) | 115 (19.9%) |
Disability Class: Self-Care Difficulty
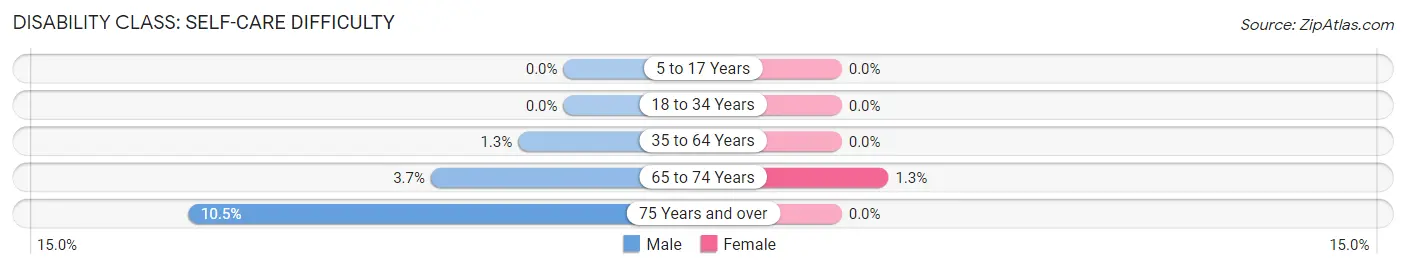
| Age Bracket | Male | Female |
| 5 to 17 Years | 0 (0.0%) | 0 (0.0%) |
| 18 to 34 Years | 0 (0.0%) | 0 (0.0%) |
| 35 to 64 Years | 13 (1.3%) | 0 (0.0%) |
| 65 to 74 Years | 26 (3.7%) | 10 (1.3%) |
| 75 Years and over | 74 (10.4%) | 0 (0.0%) |
Technology Access in Osprey
Computing Device Access in Osprey
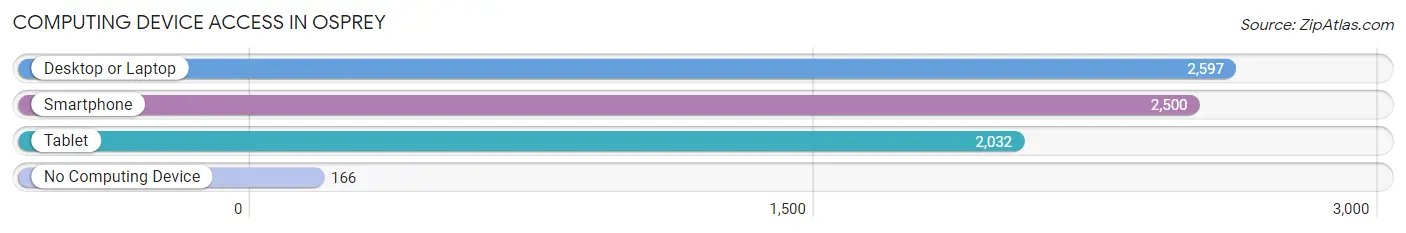
| Device Type | # Households | % Households |
| Desktop or Laptop | 2,597 | 91.0% |
| Smartphone | 2,500 | 87.6% |
| Tablet | 2,032 | 71.2% |
| No Computing Device | 166 | 5.8% |
| Total | 2,855 | 100.0% |
Internet Access in Osprey
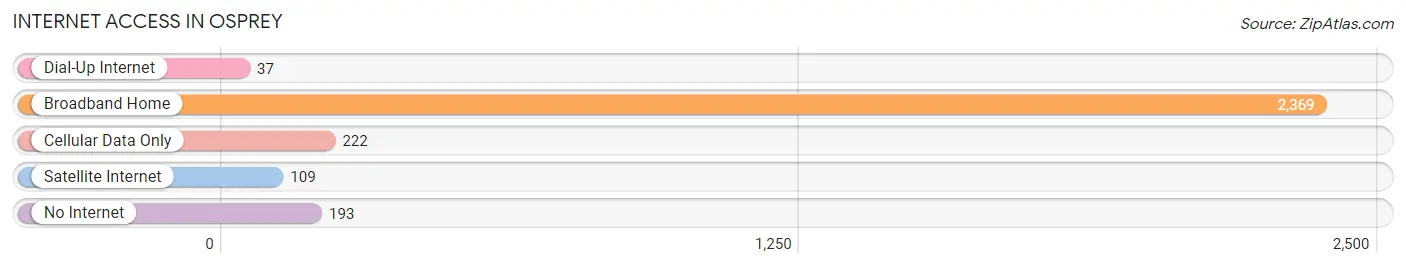
| Internet Type | # Households | % Households |
| Dial-Up Internet | 37 | 1.3% |
| Broadband Home | 2,369 | 83.0% |
| Cellular Data Only | 222 | 7.8% |
| Satellite Internet | 109 | 3.8% |
| No Internet | 193 | 6.8% |
| Total | 2,855 | 100.0% |
Osprey Summary
Osprey is a small town located in Sarasota County, Florida. It is situated on the south shore of Little Sarasota Bay, just north of the city of Venice. The town has a population of approximately 2,500 people and covers an area of 1.3 square miles.
History
Osprey was first settled in the late 1800s by settlers from the nearby town of Venice. The town was originally known as Pine Level, but was later renamed Osprey in honor of the osprey birds that were common in the area. The town was incorporated in 1925 and has remained a small, rural community ever since.
Geography
Osprey is located on the south shore of Little Sarasota Bay, just north of the city of Venice. The town is bordered by the Myakka River to the east and the Gulf of Mexico to the west. The town is situated on a flat coastal plain, with the highest elevation being just over 20 feet above sea level. The town is home to several parks, including Oscar Scherer State Park and the Legacy Trail.
Economy
Osprey’s economy is largely based on tourism and agriculture. The town is home to several resorts and hotels, as well as a number of restaurants and shops. The town is also home to several farms, which produce a variety of fruits and vegetables.
Demographics
As of the 2010 census, Osprey had a population of 2,543 people. The racial makeup of the town was 94.3% White, 1.3% African American, 0.3% Native American, 1.2% Asian, 0.1% Pacific Islander, 1.7% from other races, and 1.2% from two or more races. Hispanic or Latino of any race were 4.2% of the population.
The median income for a household in Osprey was $45,938, and the median income for a family was $51,938. The per capita income for the town was $25,938. About 8.3% of families and 10.2% of the population were below the poverty line, including 14.2% of those under age 18 and 5.2% of those age 65 or over.
Osprey is a small, rural town with a rich history and a diverse population. The town is home to several resorts and farms, and is a popular destination for tourists. The town is also home to several parks and trails, making it a great place to explore the outdoors.
Common Questions
What is Per Capita Income in Osprey?
Per Capita income in Osprey is $69,632.
What is the Median Family Income in Osprey?
Median Family Income in Osprey is $106,547.
What is the Median Household income in Osprey?
Median Household Income in Osprey is $94,860.
What is Income or Wage Gap in Osprey?
Income or Wage Gap in Osprey is 15.8%.
Women in Osprey earn 84.2 cents for every dollar earned by a man.
What is Inequality or Gini Index in Osprey?
Inequality or Gini Index in Osprey is 0.50.
What is the Total Population of Osprey?
Total Population of Osprey is 6,195.
What is the Total Male Population of Osprey?
Total Male Population of Osprey is 3,174.
What is the Total Female Population of Osprey?
Total Female Population of Osprey is 3,021.
What is the Ratio of Males per 100 Females in Osprey?
There are 105.06 Males per 100 Females in Osprey.
What is the Ratio of Females per 100 Males in Osprey?
There are 95.18 Females per 100 Males in Osprey.
What is the Median Population Age in Osprey?
Median Population Age in Osprey is 60.4 Years.
What is the Average Family Size in Osprey
Average Family Size in Osprey is 2.4 People.
What is the Average Household Size in Osprey
Average Household Size in Osprey is 2.2 People.
How Large is the Labor Force in Osprey?
There are 2,146 People in the Labor Forcein in Osprey.
What is the Percentage of People in the Labor Force in Osprey?
38.7% of People are in the Labor Force in Osprey.
What is the Unemployment Rate in Osprey?
Unemployment Rate in Osprey is 2.2%.