Port St Joe, FL Map & Demographics
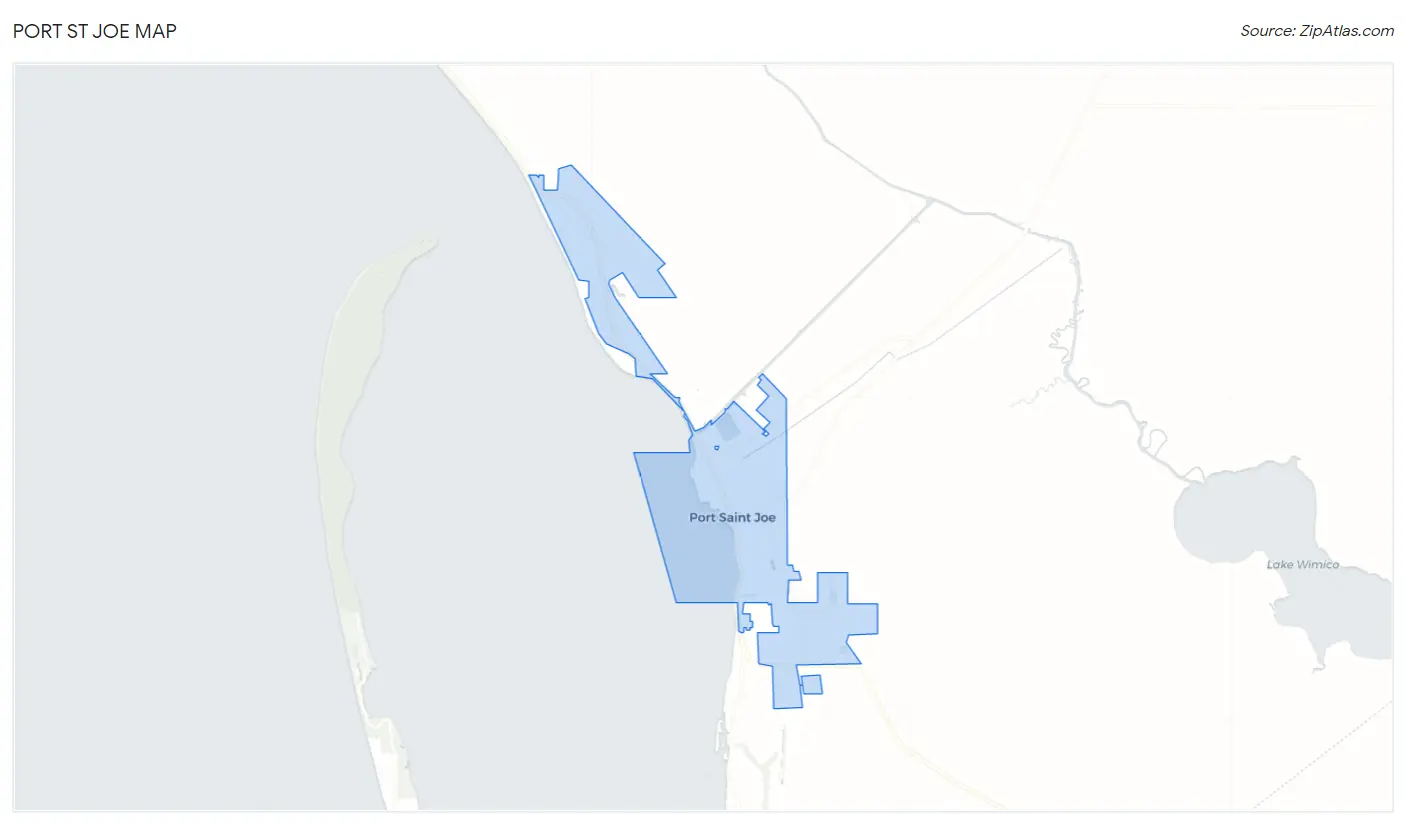
Port St Joe Map
Port St Joe Overview
$32,412
PER CAPITA INCOME
$77,750
AVG FAMILY INCOME
$59,429
AVG HOUSEHOLD INCOME
3.5%
WAGE / INCOME GAP [ % ]
96.5¢/ $1
WAGE / INCOME GAP [ $ ]
0.38
INEQUALITY / GINI INDEX
3,533
TOTAL POPULATION
1,716
MALE POPULATION
1,817
FEMALE POPULATION
94.44
MALES / 100 FEMALES
105.89
FEMALES / 100 MALES
52.1
MEDIAN AGE
2.7
AVG FAMILY SIZE
2.3
AVG HOUSEHOLD SIZE
1,560
LABOR FORCE [ PEOPLE ]
55.4%
PERCENT IN LABOR FORCE
5.3%
UNEMPLOYMENT RATE
Port St Joe Area Codes
Income in Port St Joe
Income Overview in Port St Joe
Per Capita Income in Port St Joe is $32,412, while median incomes of families and households are $77,750 and $59,429 respectively.
| Characteristic | Number | Measure |
| Per Capita Income | 3,533 | $32,412 |
| Median Family Income | 976 | $77,750 |
| Mean Family Income | 976 | $88,997 |
| Median Household Income | 1,492 | $59,429 |
| Mean Household Income | 1,492 | $77,067 |
| Income Deficit | 976 | $0 |
| Wage / Income Gap (%) | 3,533 | 3.48% |
| Wage / Income Gap ($) | 3,533 | 96.52¢ per $1 |
| Gini / Inequality Index | 3,533 | 0.38 |
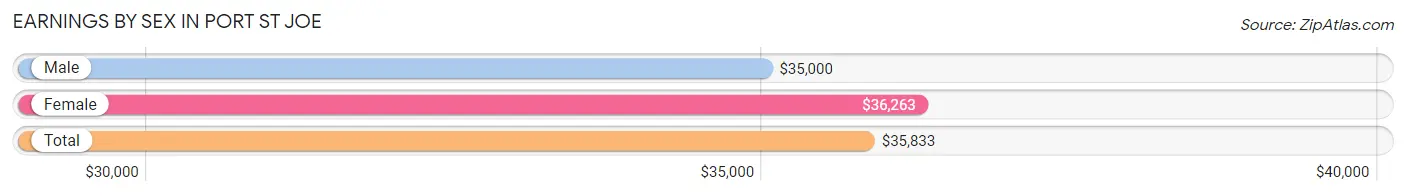
Earnings by Sex in Port St Joe
Average Earnings in Port St Joe are $35,833, $35,000 for men and $36,263 for women, a difference of 3.5%.
| Sex | Number | Average Earnings |
| Male | 912 (52.2%) | $35,000 |
| Female | 834 (47.8%) | $36,263 |
| Total | 1,746 (100.0%) | $35,833 |
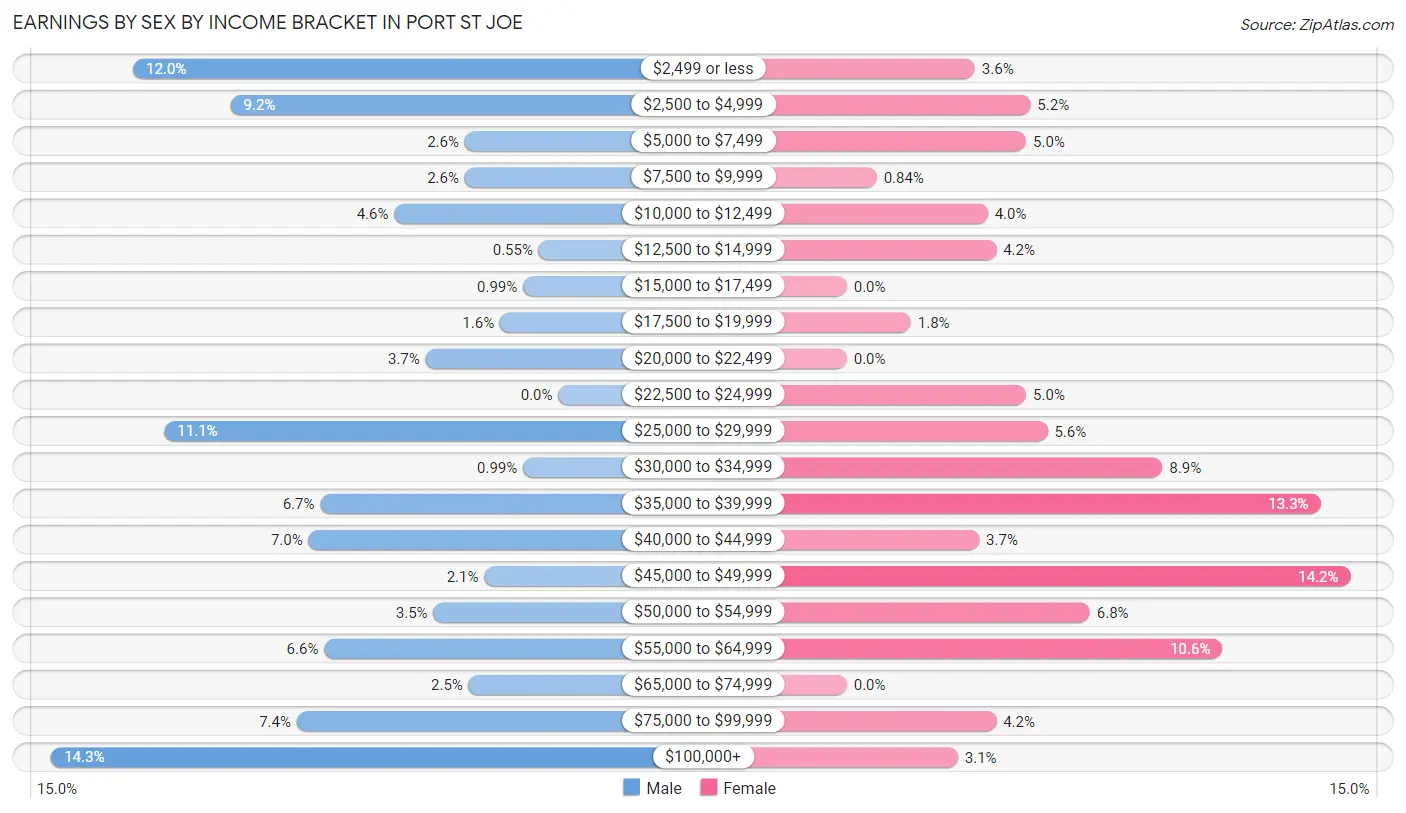
Earnings by Sex by Income Bracket in Port St Joe
The most common earnings brackets in Port St Joe are $100,000+ for men (130 | 14.2%) and $45,000 to $49,999 for women (118 | 14.1%).
| Income | Male | Female |
| $2,499 or less | 109 (11.9%) | 30 (3.6%) |
| $2,500 to $4,999 | 84 (9.2%) | 43 (5.2%) |
| $5,000 to $7,499 | 24 (2.6%) | 42 (5.0%) |
| $7,500 to $9,999 | 24 (2.6%) | 7 (0.8%) |
| $10,000 to $12,499 | 42 (4.6%) | 33 (4.0%) |
| $12,500 to $14,999 | 5 (0.5%) | 35 (4.2%) |
| $15,000 to $17,499 | 9 (1.0%) | 0 (0.0%) |
| $17,500 to $19,999 | 15 (1.6%) | 15 (1.8%) |
| $20,000 to $22,499 | 34 (3.7%) | 0 (0.0%) |
| $22,500 to $24,999 | 0 (0.0%) | 42 (5.0%) |
| $25,000 to $29,999 | 101 (11.1%) | 47 (5.6%) |
| $30,000 to $34,999 | 9 (1.0%) | 74 (8.9%) |
| $35,000 to $39,999 | 61 (6.7%) | 111 (13.3%) |
| $40,000 to $44,999 | 64 (7.0%) | 31 (3.7%) |
| $45,000 to $49,999 | 19 (2.1%) | 118 (14.1%) |
| $50,000 to $54,999 | 32 (3.5%) | 57 (6.8%) |
| $55,000 to $64,999 | 60 (6.6%) | 88 (10.5%) |
| $65,000 to $74,999 | 23 (2.5%) | 0 (0.0%) |
| $75,000 to $99,999 | 67 (7.3%) | 35 (4.2%) |
| $100,000+ | 130 (14.2%) | 26 (3.1%) |
| Total | 912 (100.0%) | 834 (100.0%) |
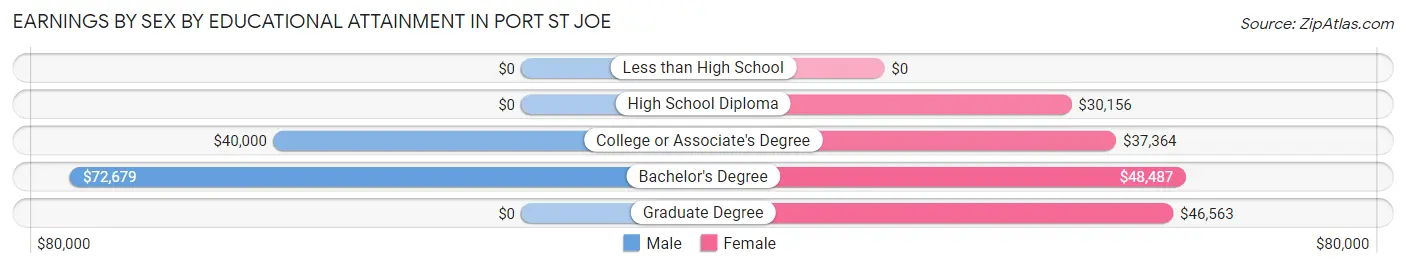
Earnings by Sex by Educational Attainment in Port St Joe
Average earnings in Port St Joe are $40,285 for men and $36,972 for women, a difference of 8.2%. Men with an educational attainment of bachelor's degree enjoy the highest average annual earnings of $72,679, while those with college or associate's degree education earn the least with $40,000. Women with an educational attainment of bachelor's degree earn the most with the average annual earnings of $48,487, while those with high school diploma education have the smallest earnings of $30,156.
| Educational Attainment | Male Income | Female Income |
| Less than High School | - | - |
| High School Diploma | - | - |
| College or Associate's Degree | $40,000 | $37,364 |
| Bachelor's Degree | $72,679 | $48,487 |
| Graduate Degree | - | - |
| Total | $40,285 | $36,972 |
Family Income in Port St Joe
Family Income Brackets in Port St Joe
According to the Port St Joe family income data, there are 194 families falling into the $35,000 to $49,999 income range, which is the most common income bracket and makes up 19.9% of all families.
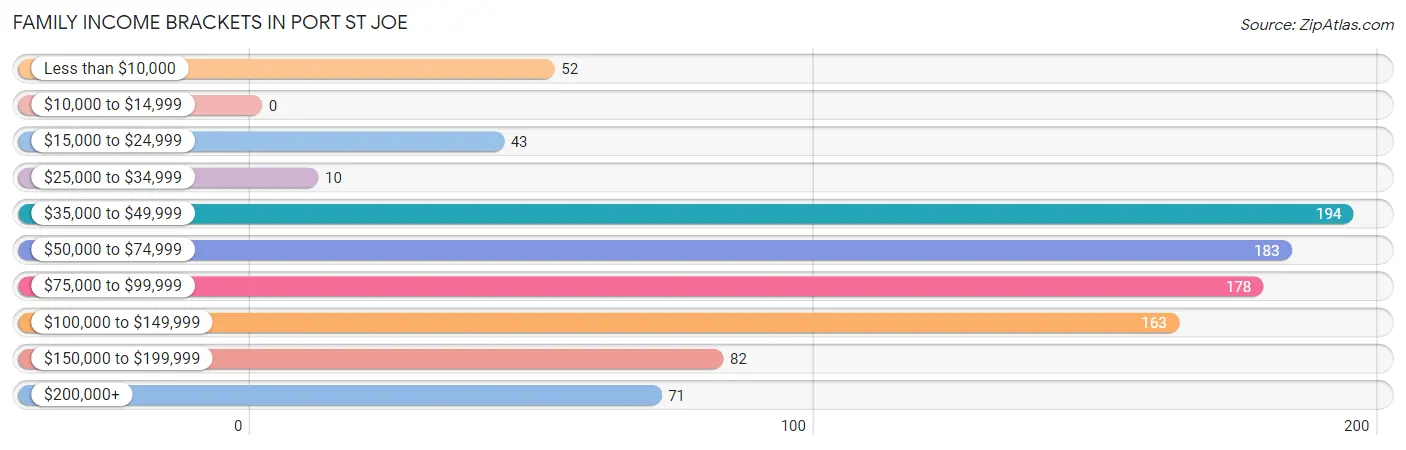
| Income Bracket | # Families | % Families |
| Less than $10,000 | 52 | 5.3% |
| $10,000 to $14,999 | 0 | 0.0% |
| $15,000 to $24,999 | 43 | 4.4% |
| $25,000 to $34,999 | 10 | 1.0% |
| $35,000 to $49,999 | 194 | 19.9% |
| $50,000 to $74,999 | 183 | 18.8% |
| $75,000 to $99,999 | 178 | 18.2% |
| $100,000 to $149,999 | 163 | 16.7% |
| $150,000 to $199,999 | 82 | 8.4% |
| $200,000+ | 71 | 7.3% |
Family Income by Famaliy Size in Port St Joe
4-person families (174 | 17.8%) account for the highest median family income in Port St Joe with $85,100 per family, while 2-person families (483 | 49.5%) have the highest median income of $38,594 per family member.
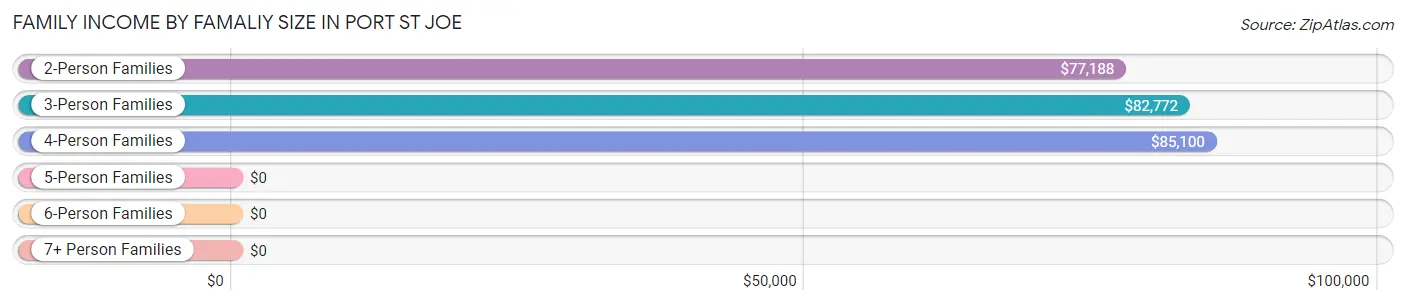
| Income Bracket | # Families | Median Income |
| 2-Person Families | 483 (49.5%) | $77,188 |
| 3-Person Families | 233 (23.9%) | $82,772 |
| 4-Person Families | 174 (17.8%) | $85,100 |
| 5-Person Families | 36 (3.7%) | $0 |
| 6-Person Families | 10 (1.0%) | $0 |
| 7+ Person Families | 40 (4.1%) | $0 |
| Total | 976 (100.0%) | $77,750 |
Family Income by Number of Earners in Port St Joe
The median family income in Port St Joe is $77,750, with families comprising 2 earners (550) having the highest median family income of $97,313, while families with 1 earner (246) have the lowest median family income of $43,934, accounting for 56.4% and 25.2% of families, respectively.
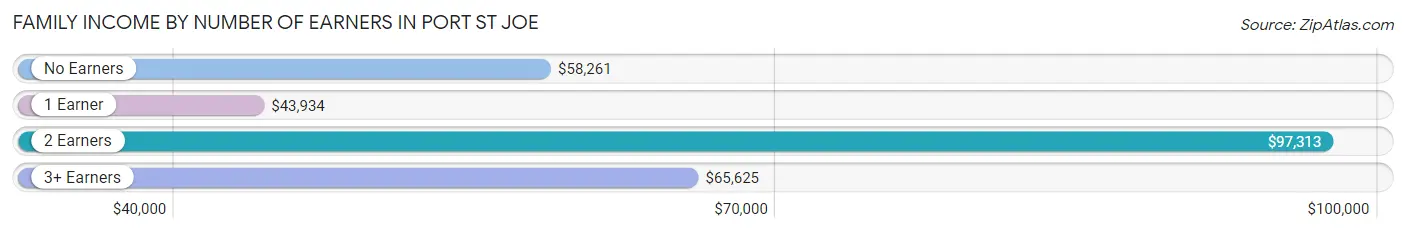
| Number of Earners | # Families | Median Income |
| No Earners | 134 (13.7%) | $58,261 |
| 1 Earner | 246 (25.2%) | $43,934 |
| 2 Earners | 550 (56.4%) | $97,313 |
| 3+ Earners | 46 (4.7%) | $65,625 |
| Total | 976 (100.0%) | $77,750 |
Household Income in Port St Joe
Household Income Brackets in Port St Joe
With 278 households falling in the category, the $35,000 to $49,999 income range is the most frequent in Port St Joe, accounting for 18.6% of all households. In contrast, only 7 households (0.5%) fall into the $10,000 to $14,999 income bracket, making it the least populous group.
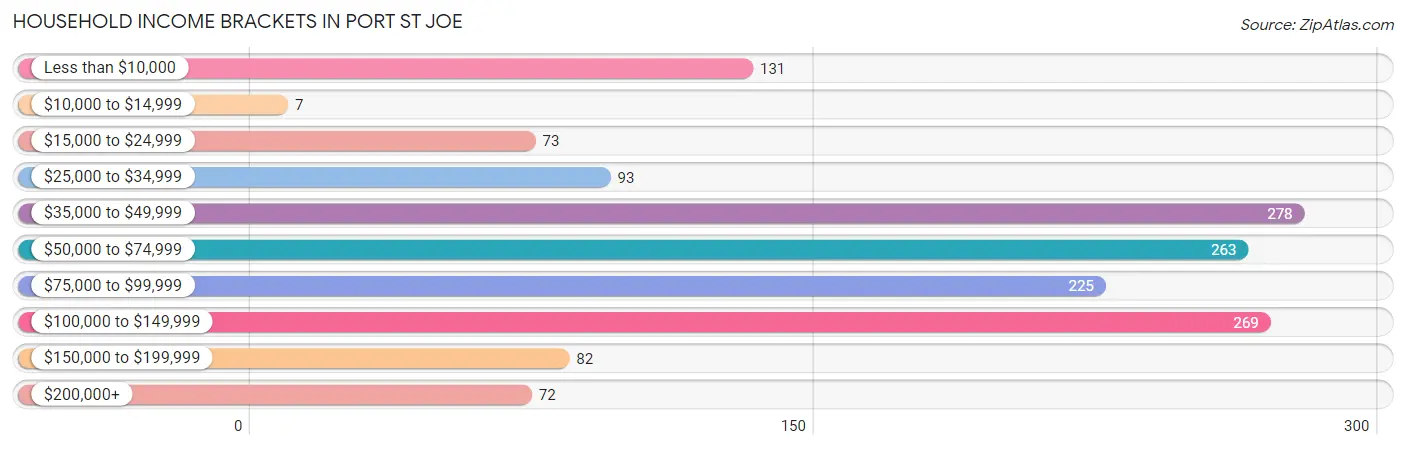
| Income Bracket | # Households | % Households |
| Less than $10,000 | 131 | 8.8% |
| $10,000 to $14,999 | 7 | 0.5% |
| $15,000 to $24,999 | 73 | 4.9% |
| $25,000 to $34,999 | 93 | 6.2% |
| $35,000 to $49,999 | 278 | 18.6% |
| $50,000 to $74,999 | 263 | 17.6% |
| $75,000 to $99,999 | 225 | 15.1% |
| $100,000 to $149,999 | 269 | 18.0% |
| $150,000 to $199,999 | 82 | 5.5% |
| $200,000+ | 72 | 4.8% |
Household Income by Householder Age in Port St Joe
The median household income in Port St Joe is $59,429, with the highest median household income of $86,450 found in the 45 to 64 years age bracket for the primary householder. A total of 660 households (44.2%) fall into this category. Meanwhile, the 15 to 24 years age bracket for the primary householder has the lowest median household income of $0, with 47 households (3.2%) in this group.
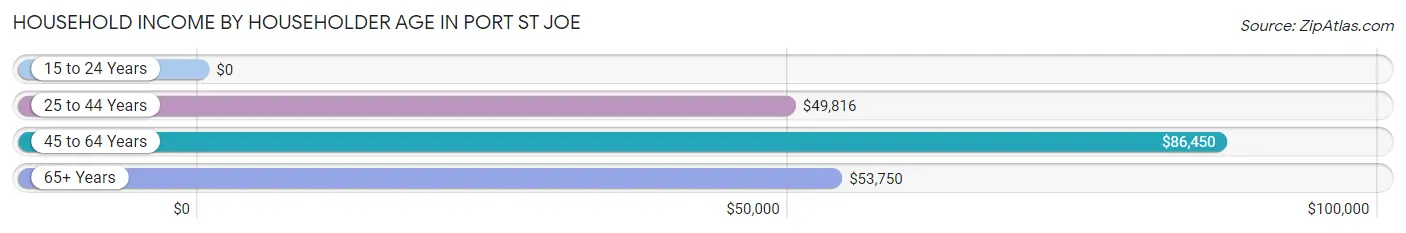
| Income Bracket | # Households | Median Income |
| 15 to 24 Years | 47 (3.2%) | $0 |
| 25 to 44 Years | 367 (24.6%) | $49,816 |
| 45 to 64 Years | 660 (44.2%) | $86,450 |
| 65+ Years | 418 (28.0%) | $53,750 |
| Total | 1,492 (100.0%) | $59,429 |
Poverty in Port St Joe
Income Below Poverty by Sex and Age in Port St Joe
With 9.4% poverty level for males and 11.2% for females among the residents of Port St Joe, 16 and 17 year old males and 18 to 24 year old females are the most vulnerable to poverty, with 17 males (48.6%) and 47 females (77.0%) in their respective age groups living below the poverty level.
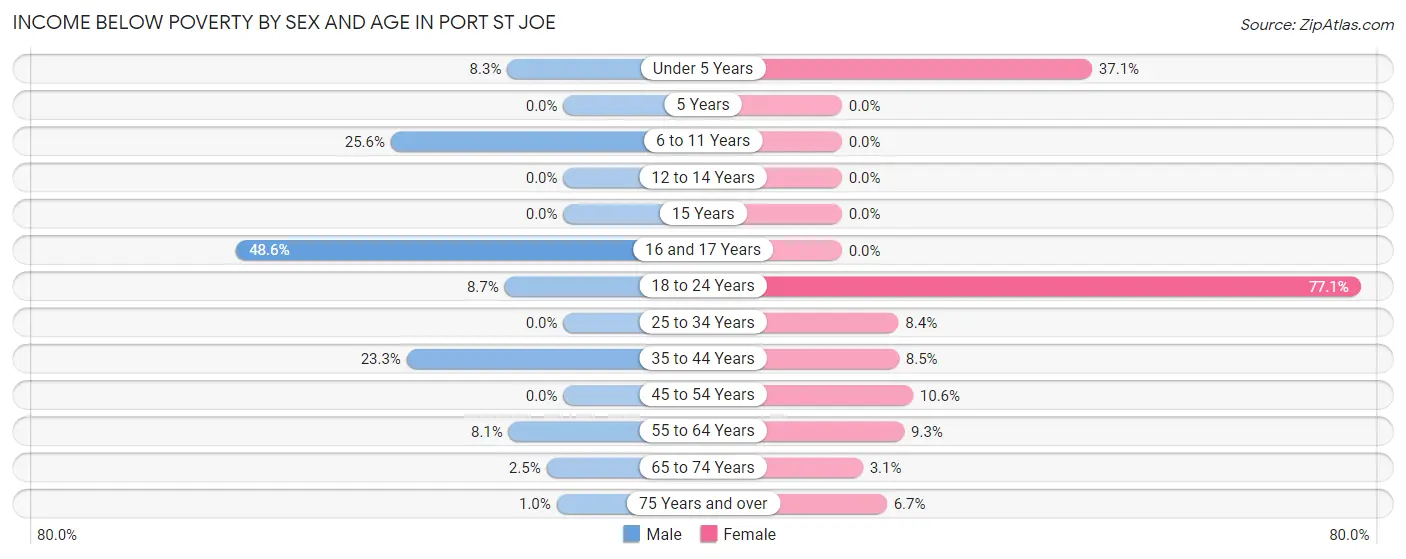
| Age Bracket | Male | Female |
| Under 5 Years | 15 (8.3%) | 39 (37.1%) |
| 5 Years | 0 (0.0%) | 0 (0.0%) |
| 6 to 11 Years | 31 (25.6%) | 0 (0.0%) |
| 12 to 14 Years | 0 (0.0%) | 0 (0.0%) |
| 15 Years | 0 (0.0%) | 0 (0.0%) |
| 16 and 17 Years | 17 (48.6%) | 0 (0.0%) |
| 18 to 24 Years | 11 (8.7%) | 47 (77.0%) |
| 25 to 34 Years | 0 (0.0%) | 26 (8.4%) |
| 35 to 44 Years | 40 (23.3%) | 10 (8.5%) |
| 45 to 54 Years | 0 (0.0%) | 25 (10.5%) |
| 55 to 64 Years | 33 (8.1%) | 32 (9.2%) |
| 65 to 74 Years | 5 (2.5%) | 5 (3.1%) |
| 75 Years and over | 2 (1.0%) | 11 (6.7%) |
| Total | 154 (9.4%) | 195 (11.2%) |
Income Above Poverty by Sex and Age in Port St Joe
According to the poverty statistics in Port St Joe, males aged 12 to 14 years and females aged 5 years are the age groups that are most secure financially, with 100.0% of males and 100.0% of females in these age groups living above the poverty line.
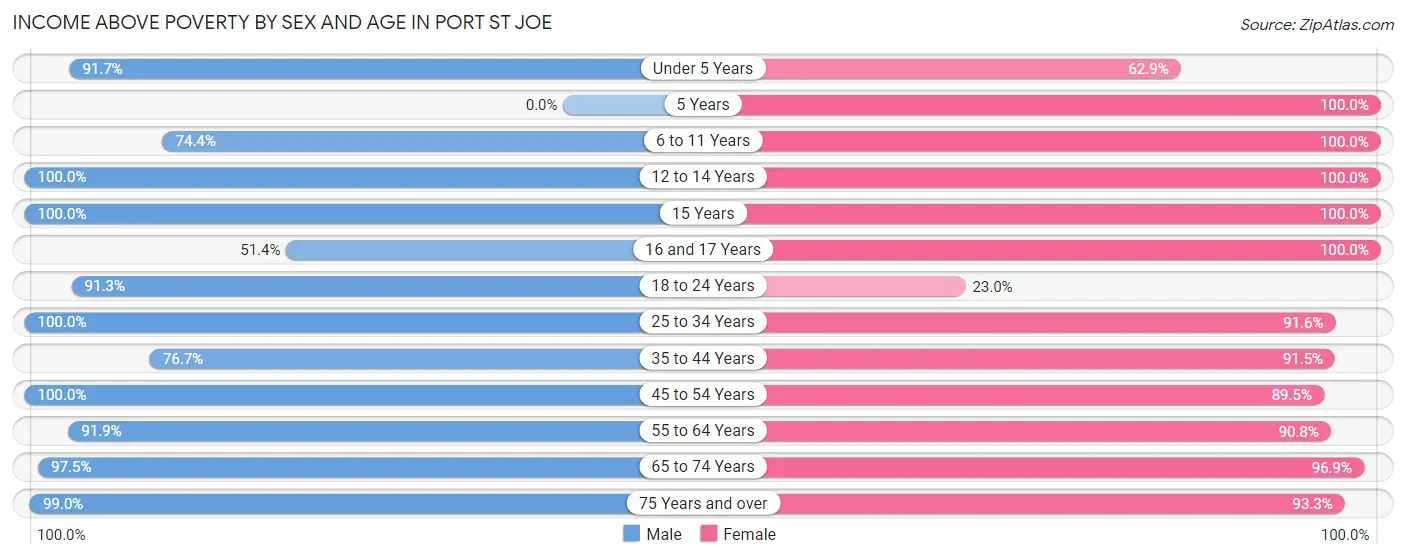
| Age Bracket | Male | Female |
| Under 5 Years | 165 (91.7%) | 66 (62.9%) |
| 5 Years | 0 (0.0%) | 60 (100.0%) |
| 6 to 11 Years | 90 (74.4%) | 152 (100.0%) |
| 12 to 14 Years | 71 (100.0%) | 16 (100.0%) |
| 15 Years | 6 (100.0%) | 6 (100.0%) |
| 16 and 17 Years | 18 (51.4%) | 3 (100.0%) |
| 18 to 24 Years | 115 (91.3%) | 14 (23.0%) |
| 25 to 34 Years | 29 (100.0%) | 283 (91.6%) |
| 35 to 44 Years | 132 (76.7%) | 108 (91.5%) |
| 45 to 54 Years | 99 (100.0%) | 212 (89.4%) |
| 55 to 64 Years | 373 (91.9%) | 314 (90.7%) |
| 65 to 74 Years | 195 (97.5%) | 156 (96.9%) |
| 75 Years and over | 198 (99.0%) | 154 (93.3%) |
| Total | 1,491 (90.6%) | 1,544 (88.8%) |
Income Below Poverty Among Married-Couple Families in Port St Joe
The poverty statistics for married-couple families in Port St Joe show that 2.0% or 15 of the total 738 families live below the poverty line. Families with 3 or 4 children have the highest poverty rate of 15.1%, comprising of 10 families. On the other hand, families with 1 or 2 children have the lowest poverty rate of 0.0%, which includes 0 families.
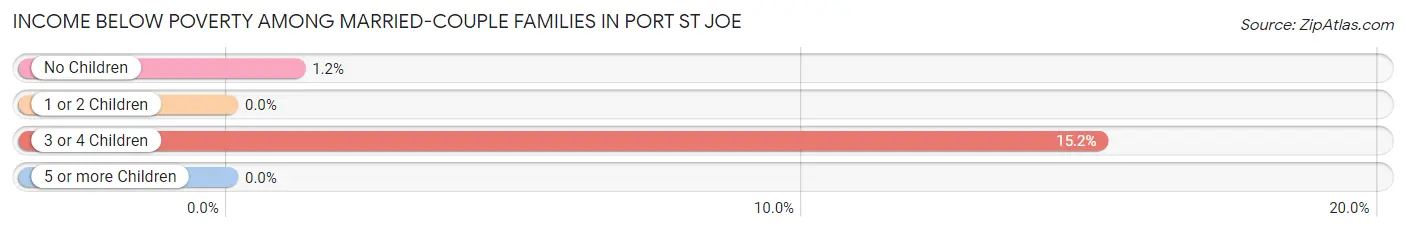
| Children | Above Poverty | Below Poverty |
| No Children | 424 (98.8%) | 5 (1.2%) |
| 1 or 2 Children | 243 (100.0%) | 0 (0.0%) |
| 3 or 4 Children | 56 (84.9%) | 10 (15.1%) |
| 5 or more Children | 0 (0.0%) | 0 (0.0%) |
| Total | 723 (98.0%) | 15 (2.0%) |
Income Below Poverty Among Single-Parent Households in Port St Joe
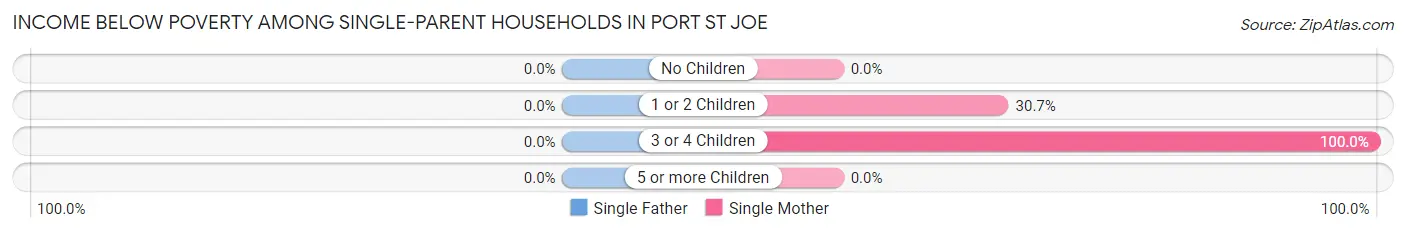
| Children | Single Father | Single Mother |
| No Children | 0 (0.0%) | 0 (0.0%) |
| 1 or 2 Children | 0 (0.0%) | 47 (30.7%) |
| 3 or 4 Children | 0 (0.0%) | 26 (100.0%) |
| 5 or more Children | 0 (0.0%) | 0 (0.0%) |
| Total | 0 (0.0%) | 73 (33.6%) |
Income Below Poverty Among Married-Couple vs Single-Parent Households in Port St Joe
The poverty data for Port St Joe shows that 15 of the married-couple family households (2.0%) and 73 of the single-parent households (30.7%) are living below the poverty level. Within the married-couple family households, those with 3 or 4 children have the highest poverty rate, with 10 households (15.1%) falling below the poverty line. Among the single-parent households, those with 3 or 4 children have the highest poverty rate, with 26 household (100.0%) living below poverty.
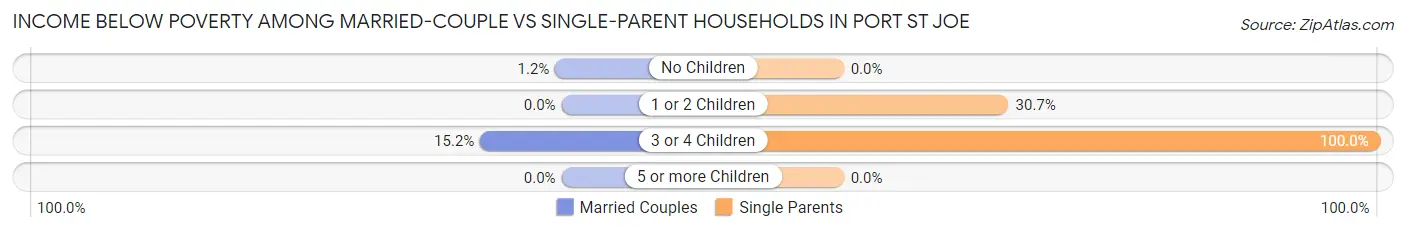
| Children | Married-Couple Families | Single-Parent Households |
| No Children | 5 (1.2%) | 0 (0.0%) |
| 1 or 2 Children | 0 (0.0%) | 47 (30.7%) |
| 3 or 4 Children | 10 (15.1%) | 26 (100.0%) |
| 5 or more Children | 0 (0.0%) | 0 (0.0%) |
| Total | 15 (2.0%) | 73 (30.7%) |
Race in Port St Joe
The most populous races in Port St Joe are White / Caucasian (2,866 | 81.1%), Black / African American (513 | 14.5%), and Two or more Races (112 | 3.2%).
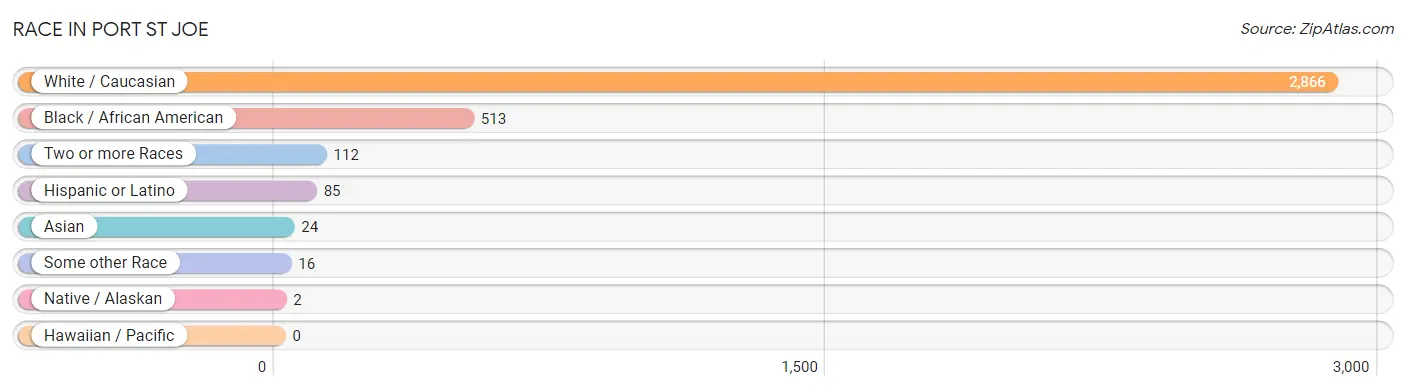
| Race | # Population | % Population |
| Asian | 24 | 0.7% |
| Black / African American | 513 | 14.5% |
| Hawaiian / Pacific | 0 | 0.0% |
| Hispanic or Latino | 85 | 2.4% |
| Native / Alaskan | 2 | 0.1% |
| White / Caucasian | 2,866 | 81.1% |
| Two or more Races | 112 | 3.2% |
| Some other Race | 16 | 0.4% |
| Total | 3,533 | 100.0% |
Ancestry in Port St Joe
The most populous ancestries reported in Port St Joe are American (427 | 12.1%), English (359 | 10.2%), Irish (206 | 5.8%), German (138 | 3.9%), and Italian (104 | 2.9%), together accounting for 34.9% of all Port St Joe residents.
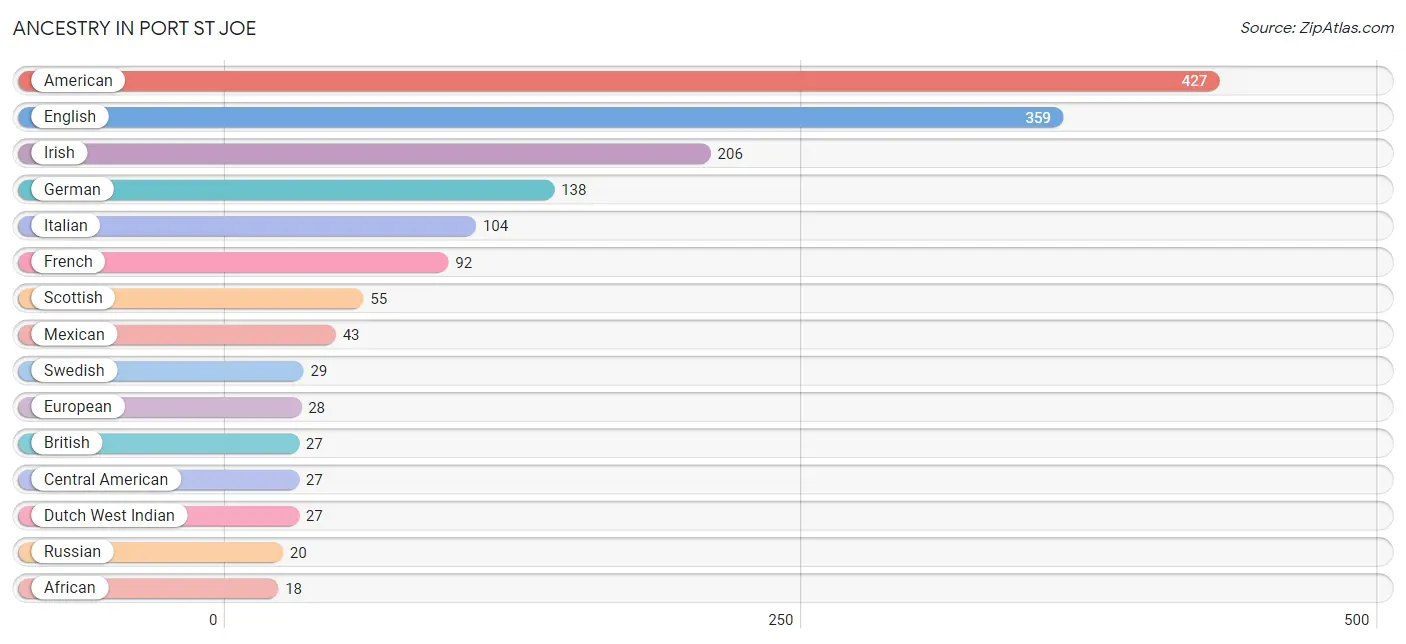
| Ancestry | # Population | % Population |
| African | 18 | 0.5% |
| American | 427 | 12.1% |
| British | 27 | 0.8% |
| Central American | 27 | 0.8% |
| Central American Indian | 2 | 0.1% |
| Cuban | 6 | 0.2% |
| Dutch West Indian | 27 | 0.8% |
| English | 359 | 10.2% |
| European | 28 | 0.8% |
| French | 92 | 2.6% |
| German | 138 | 3.9% |
| Honduran | 18 | 0.5% |
| Irish | 206 | 5.8% |
| Italian | 104 | 2.9% |
| Korean | 7 | 0.2% |
| Mexican | 43 | 1.2% |
| Nicaraguan | 2 | 0.1% |
| Norwegian | 10 | 0.3% |
| Peruvian | 2 | 0.1% |
| Polish | 9 | 0.3% |
| Puerto Rican | 4 | 0.1% |
| Russian | 20 | 0.6% |
| Salvadoran | 7 | 0.2% |
| Scotch-Irish | 9 | 0.3% |
| Scottish | 55 | 1.6% |
| South American | 2 | 0.1% |
| Soviet Union | 7 | 0.2% |
| Spaniard | 3 | 0.1% |
| Subsaharan African | 18 | 0.5% |
| Swedish | 29 | 0.8% |
| Thai | 17 | 0.5% |
| Welsh | 16 | 0.4% | View All 32 Rows |
Immigrants in Port St Joe
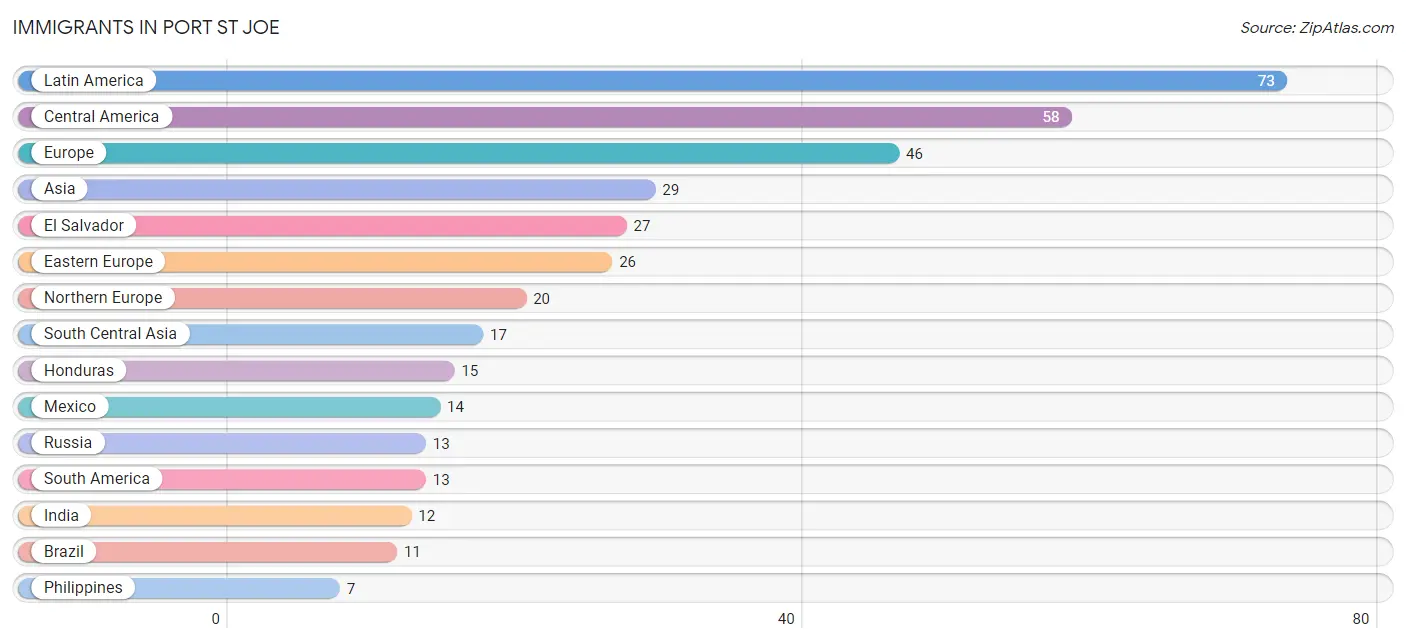
The most numerous immigrant groups reported in Port St Joe came from Latin America (73 | 2.1%), Central America (58 | 1.6%), Europe (46 | 1.3%), Asia (29 | 0.8%), and El Salvador (27 | 0.8%), together accounting for 6.6% of all Port St Joe residents.
| Immigration Origin | # Population | % Population |
| Asia | 29 | 0.8% |
| Bangladesh | 5 | 0.1% |
| Brazil | 11 | 0.3% |
| Caribbean | 2 | 0.1% |
| Central America | 58 | 1.6% |
| Cuba | 2 | 0.1% |
| Eastern Europe | 26 | 0.7% |
| El Salvador | 27 | 0.8% |
| Europe | 46 | 1.3% |
| Honduras | 15 | 0.4% |
| Hungary | 6 | 0.2% |
| India | 12 | 0.3% |
| Israel | 5 | 0.1% |
| Latin America | 73 | 2.1% |
| Mexico | 14 | 0.4% |
| Nicaragua | 2 | 0.1% |
| Northern Europe | 20 | 0.6% |
| Peru | 2 | 0.1% |
| Philippines | 7 | 0.2% |
| Russia | 13 | 0.4% |
| South America | 13 | 0.4% |
| South Central Asia | 17 | 0.5% |
| South Eastern Asia | 7 | 0.2% |
| Western Asia | 5 | 0.1% | View All 24 Rows |
Sex and Age in Port St Joe
Sex and Age in Port St Joe
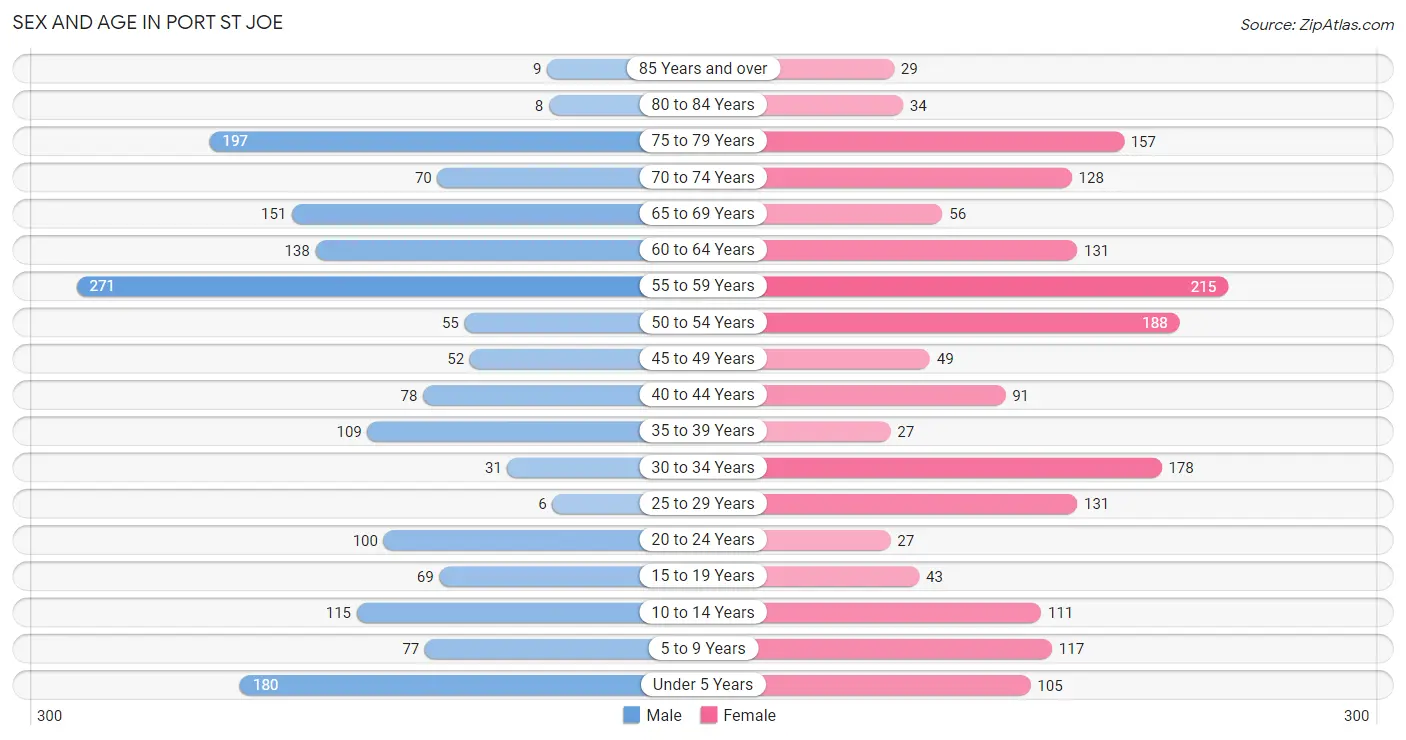
The most populous age groups in Port St Joe are 55 to 59 Years (271 | 15.8%) for men and 55 to 59 Years (215 | 11.8%) for women.
| Age Bracket | Male | Female |
| Under 5 Years | 180 (10.5%) | 105 (5.8%) |
| 5 to 9 Years | 77 (4.5%) | 117 (6.4%) |
| 10 to 14 Years | 115 (6.7%) | 111 (6.1%) |
| 15 to 19 Years | 69 (4.0%) | 43 (2.4%) |
| 20 to 24 Years | 100 (5.8%) | 27 (1.5%) |
| 25 to 29 Years | 6 (0.4%) | 131 (7.2%) |
| 30 to 34 Years | 31 (1.8%) | 178 (9.8%) |
| 35 to 39 Years | 109 (6.4%) | 27 (1.5%) |
| 40 to 44 Years | 78 (4.5%) | 91 (5.0%) |
| 45 to 49 Years | 52 (3.0%) | 49 (2.7%) |
| 50 to 54 Years | 55 (3.2%) | 188 (10.3%) |
| 55 to 59 Years | 271 (15.8%) | 215 (11.8%) |
| 60 to 64 Years | 138 (8.0%) | 131 (7.2%) |
| 65 to 69 Years | 151 (8.8%) | 56 (3.1%) |
| 70 to 74 Years | 70 (4.1%) | 128 (7.0%) |
| 75 to 79 Years | 197 (11.5%) | 157 (8.6%) |
| 80 to 84 Years | 8 (0.5%) | 34 (1.9%) |
| 85 Years and over | 9 (0.5%) | 29 (1.6%) |
| Total | 1,716 (100.0%) | 1,817 (100.0%) |
Families and Households in Port St Joe
Median Family Size in Port St Joe
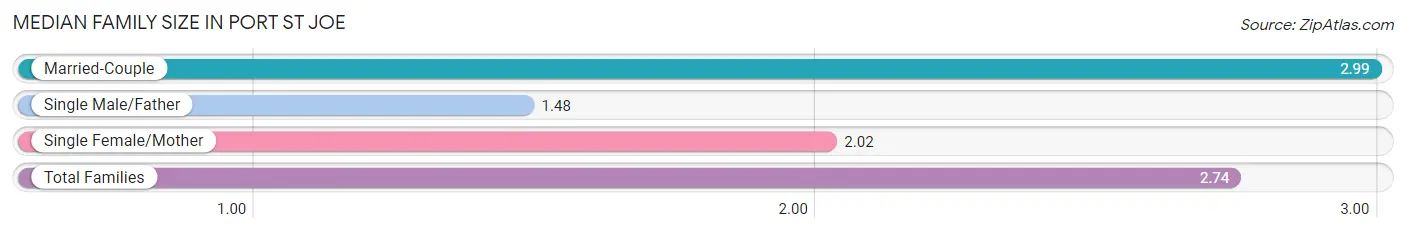
The median family size in Port St Joe is 2.74 persons per family, with married-couple families (738 | 75.6%) accounting for the largest median family size of 2.99 persons per family. On the other hand, single male/father families (21 | 2.1%) represent the smallest median family size with 1.48 persons per family.
| Family Type | # Families | Family Size |
| Married-Couple | 738 (75.6%) | 2.99 |
| Single Male/Father | 21 (2.1%) | 1.48 |
| Single Female/Mother | 217 (22.2%) | 2.02 |
| Total Families | 976 (100.0%) | 2.74 |
Median Household Size in Port St Joe
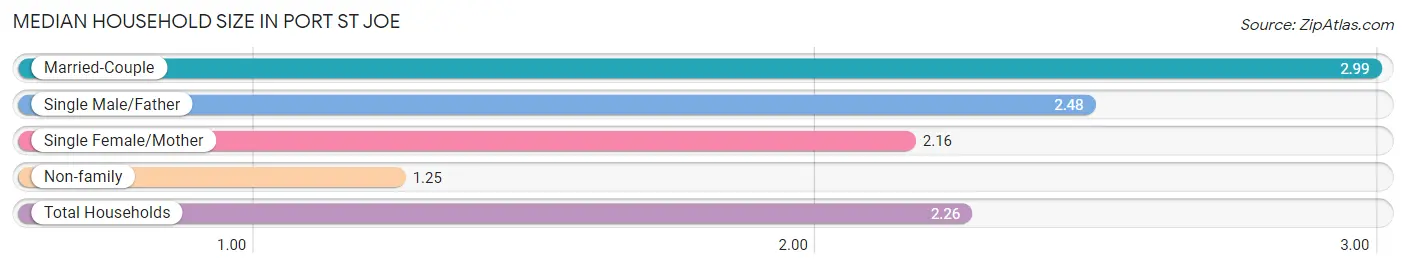
The median household size in Port St Joe is 2.26 persons per household, with married-couple households (738 | 49.5%) accounting for the largest median household size of 2.99 persons per household. non-family households (516 | 34.6%) represent the smallest median household size with 1.25 persons per household.
| Household Type | # Households | Household Size |
| Married-Couple | 738 (49.5%) | 2.99 |
| Single Male/Father | 21 (1.4%) | 2.48 |
| Single Female/Mother | 217 (14.5%) | 2.16 |
| Non-family | 516 (34.6%) | 1.25 |
| Total Households | 1,492 (100.0%) | 2.26 |
Household Size by Marriage Status in Port St Joe
Out of a total of 1,492 households in Port St Joe, 976 (65.4%) are family households, while 516 (34.6%) are nonfamily households. The most numerous type of family households are 2-person households, comprising 448, and the most common type of nonfamily households are 1-person households, comprising 385.
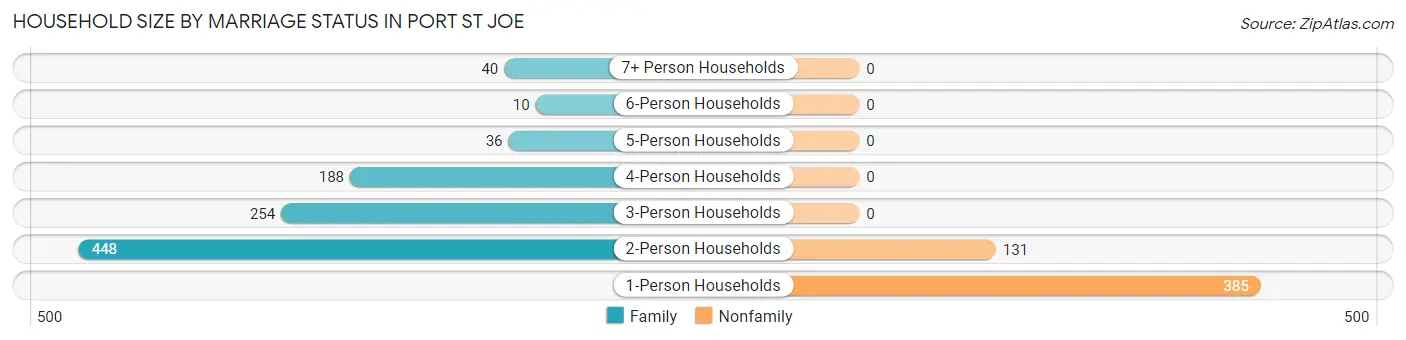
| Household Size | Family Households | Nonfamily Households |
| 1-Person Households | - | 385 (25.8%) |
| 2-Person Households | 448 (30.0%) | 131 (8.8%) |
| 3-Person Households | 254 (17.0%) | 0 (0.0%) |
| 4-Person Households | 188 (12.6%) | 0 (0.0%) |
| 5-Person Households | 36 (2.4%) | 0 (0.0%) |
| 6-Person Households | 10 (0.7%) | 0 (0.0%) |
| 7+ Person Households | 40 (2.7%) | 0 (0.0%) |
| Total | 976 (65.4%) | 516 (34.6%) |
Female Fertility in Port St Joe
Fertility by Age in Port St Joe
Average fertility rate in Port St Joe is 148.0 births per 1,000 women. Women in the age bracket of 15 to 19 years have the highest fertility rate with 488.0 births per 1,000 women. Women in the age bracket of 20 to 34 years acount for 64.2% of all women with births.
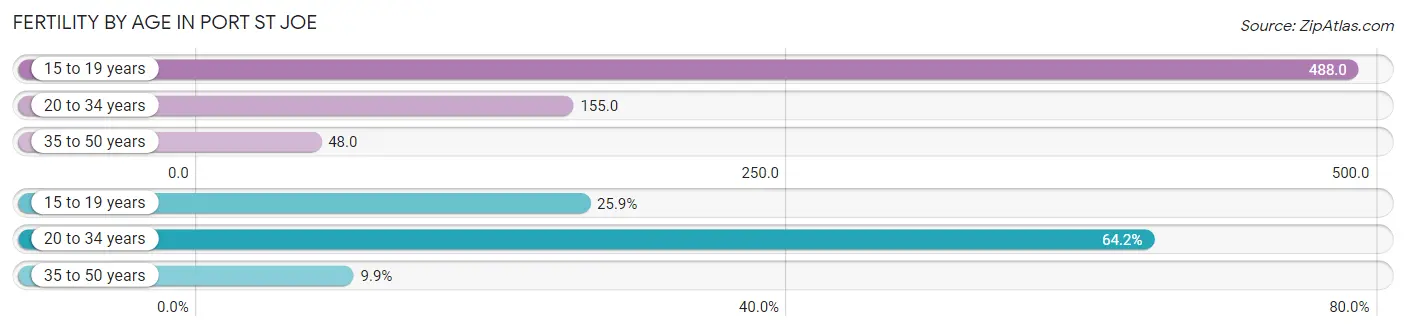
| Age Bracket | Women with Births | Births / 1,000 Women |
| 15 to 19 years | 21 (25.9%) | 488.0 |
| 20 to 34 years | 52 (64.2%) | 155.0 |
| 35 to 50 years | 8 (9.9%) | 48.0 |
| Total | 81 (100.0%) | 148.0 |
Fertility by Age by Marriage Status in Port St Joe
9.9% of women with births (81) in Port St Joe are married. The highest percentage of unmarried women with births falls into 15 to 19 years age bracket with 100.0% of them unmarried at the time of birth, while the lowest percentage of unmarried women with births belong to 35 to 50 years age bracket with 0.0% of them unmarried.
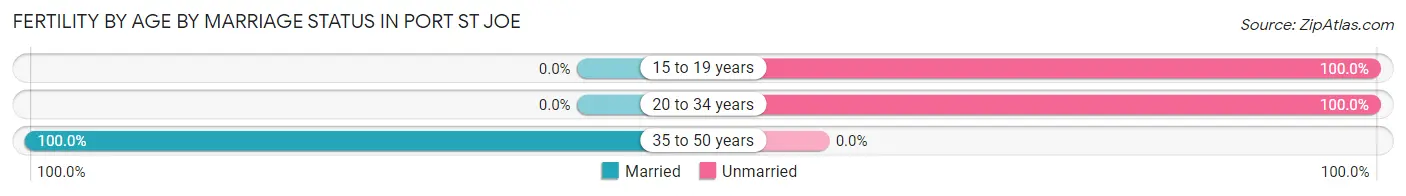
| Age Bracket | Married | Unmarried |
| 15 to 19 years | 0 (0.0%) | 21 (100.0%) |
| 20 to 34 years | 0 (0.0%) | 52 (100.0%) |
| 35 to 50 years | 8 (100.0%) | 0 (0.0%) |
| Total | 8 (9.9%) | 73 (90.1%) |
Fertility by Education in Port St Joe
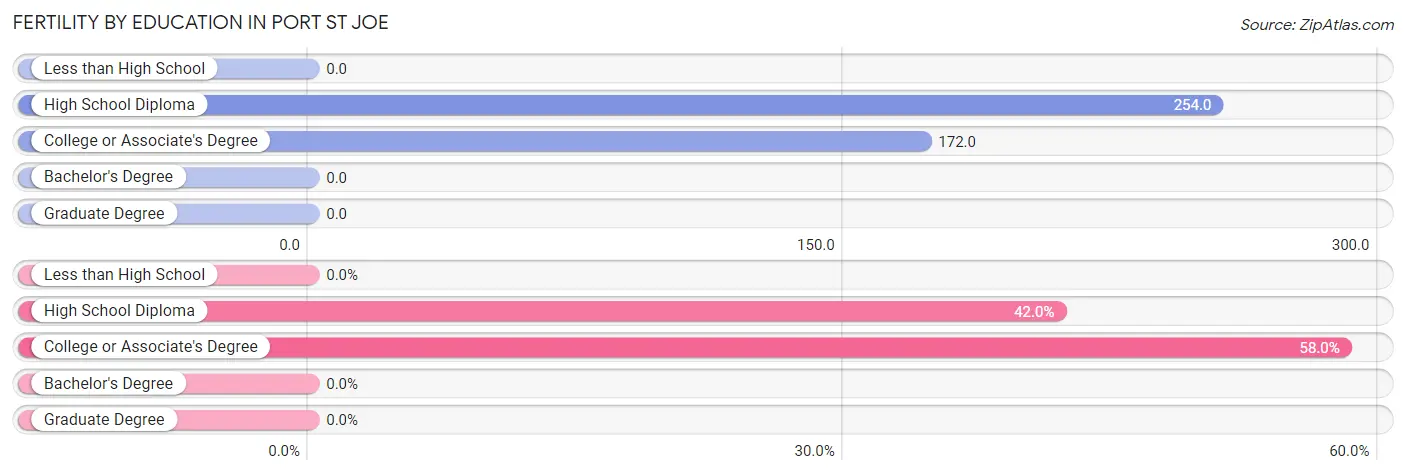
| Educational Attainment | Women with Births | Births / 1,000 Women |
| Less than High School | 0 (0.0%) | 0.0 |
| High School Diploma | 34 (42.0%) | 254.0 |
| College or Associate's Degree | 47 (58.0%) | 172.0 |
| Bachelor's Degree | 0 (0.0%) | 0.0 |
| Graduate Degree | 0 (0.0%) | 0.0 |
| Total | 81 (100.0%) | 148.0 |
Fertility by Education by Marriage Status in Port St Joe
90.1% of women with births in Port St Joe are unmarried. Women with the educational attainment of high school diploma are most likely to be married with 23.5% of them married at childbirth, while women with the educational attainment of college or associate's degree are least likely to be married with 100.0% of them unmarried at childbirth.
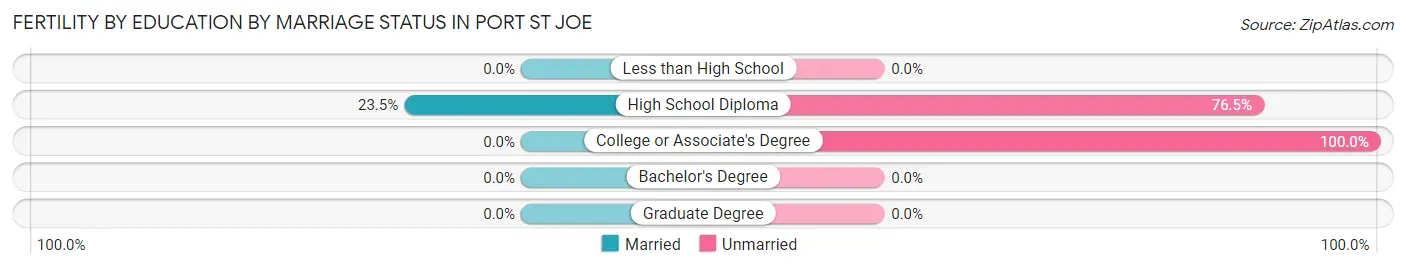
| Educational Attainment | Married | Unmarried |
| Less than High School | 0 (0.0%) | 0 (0.0%) |
| High School Diploma | 8 (23.5%) | 26 (76.5%) |
| College or Associate's Degree | 0 (0.0%) | 47 (100.0%) |
| Bachelor's Degree | 0 (0.0%) | 0 (0.0%) |
| Graduate Degree | 0 (0.0%) | 0 (0.0%) |
| Total | 8 (9.9%) | 73 (90.1%) |
Employment Characteristics in Port St Joe
Employment by Class of Employer in Port St Joe
Among the 1,418 employed individuals in Port St Joe, private company employees (890 | 62.8%), local government employees (152 | 10.7%), and not-for-profit organizations (129 | 9.1%) make up the most common classes of employment.
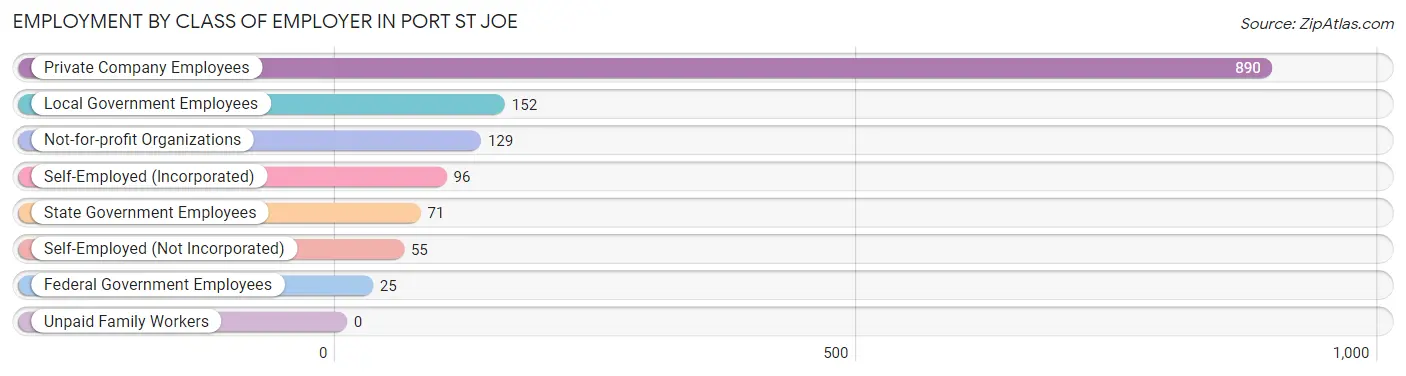
| Employer Class | # Employees | % Employees |
| Private Company Employees | 890 | 62.8% |
| Self-Employed (Incorporated) | 96 | 6.8% |
| Self-Employed (Not Incorporated) | 55 | 3.9% |
| Not-for-profit Organizations | 129 | 9.1% |
| Local Government Employees | 152 | 10.7% |
| State Government Employees | 71 | 5.0% |
| Federal Government Employees | 25 | 1.8% |
| Unpaid Family Workers | 0 | 0.0% |
| Total | 1,418 | 100.0% |
Employment Status by Age in Port St Joe
According to the labor force statistics for Port St Joe, out of the total population over 16 years of age (2,816), 55.4% or 1,560 individuals are in the labor force, with 5.3% or 83 of them unemployed. The age group with the highest labor force participation rate is 30 to 34 years, with 96.7% or 202 individuals in the labor force. Within the labor force, the 35 to 44 years age range has the highest percentage of unemployed individuals, with 26.6% or 77 of them being unemployed.
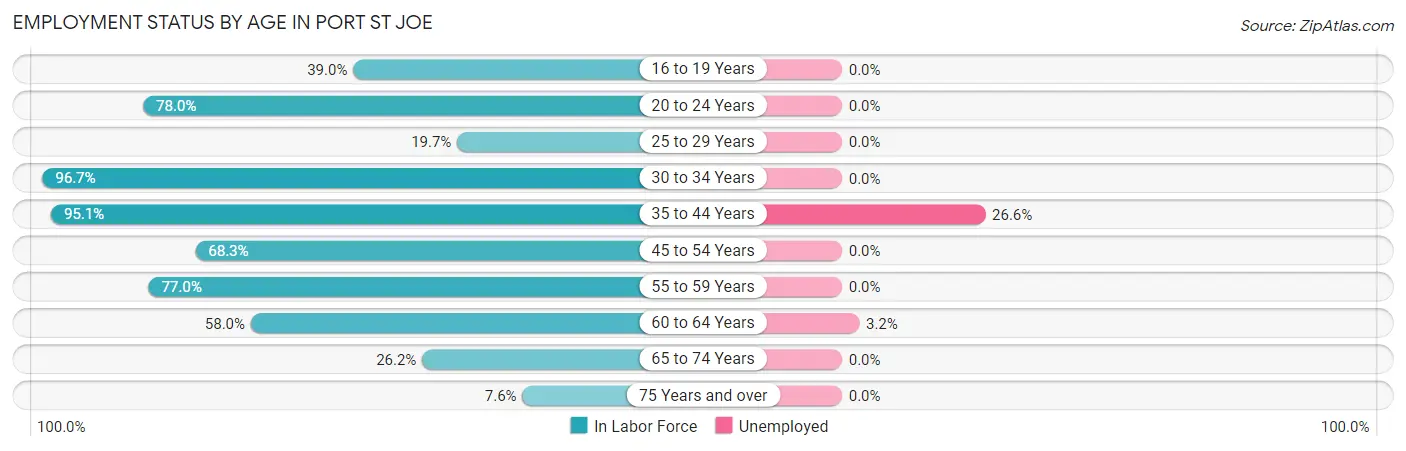
| Age Bracket | In Labor Force | Unemployed |
| 16 to 19 Years | 39 (39.0%) | 0 (0.0%) |
| 20 to 24 Years | 99 (78.0%) | 0 (0.0%) |
| 25 to 29 Years | 27 (19.7%) | 0 (0.0%) |
| 30 to 34 Years | 202 (96.7%) | 0 (0.0%) |
| 35 to 44 Years | 290 (95.1%) | 77 (26.6%) |
| 45 to 54 Years | 235 (68.3%) | 0 (0.0%) |
| 55 to 59 Years | 374 (77.0%) | 0 (0.0%) |
| 60 to 64 Years | 156 (58.0%) | 5 (3.2%) |
| 65 to 74 Years | 106 (26.2%) | 0 (0.0%) |
| 75 Years and over | 33 (7.6%) | 0 (0.0%) |
| Total | 1,560 (55.4%) | 83 (5.3%) |
Employment Status by Educational Attainment in Port St Joe
According to labor force statistics for Port St Joe, 73.4% of individuals (1,284) out of the total population between 25 and 64 years of age (1,750) are in the labor force, with 6.4% or 82 of them being unemployed. The group with the highest labor force participation rate are those with the educational attainment of high school diploma, with 81.0% or 325 individuals in the labor force. Within the labor force, individuals with high school diploma education have the highest percentage of unemployment, with 10.5% or 34 of them being unemployed.
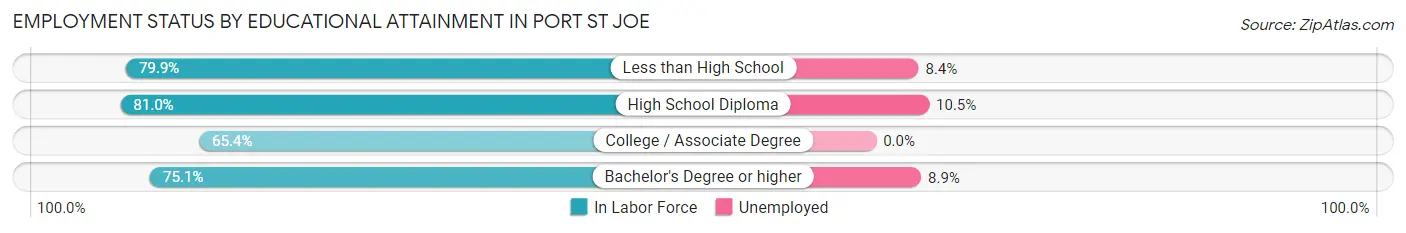
| Educational Attainment | In Labor Force | Unemployed |
| Less than High School | 119 (79.9%) | 13 (8.4%) |
| High School Diploma | 325 (81.0%) | 42 (10.5%) |
| College / Associate Degree | 414 (65.4%) | 0 (0.0%) |
| Bachelor's Degree or higher | 426 (75.1%) | 50 (8.9%) |
| Total | 1,285 (73.4%) | 112 (6.4%) |
Employment Occupations by Sex in Port St Joe
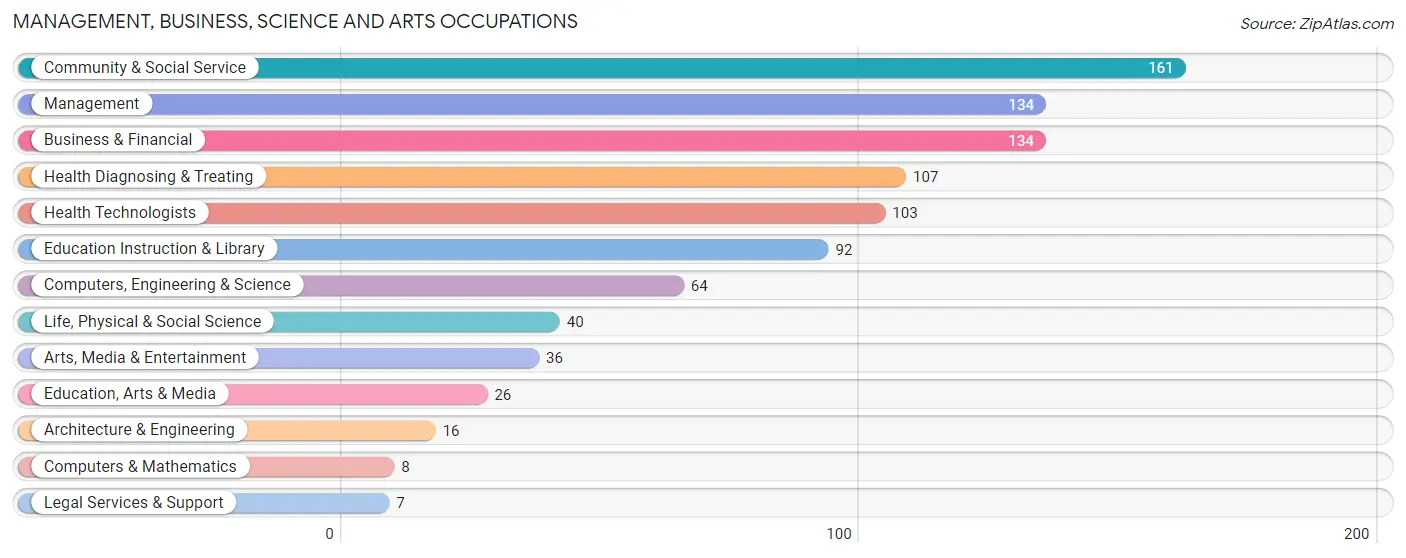
Management, Business, Science and Arts Occupations
The most common Management, Business, Science and Arts occupations in Port St Joe are Community & Social Service (161 | 10.9%), Management (134 | 9.1%), Business & Financial (134 | 9.1%), Health Diagnosing & Treating (107 | 7.2%), and Health Technologists (103 | 7.0%).
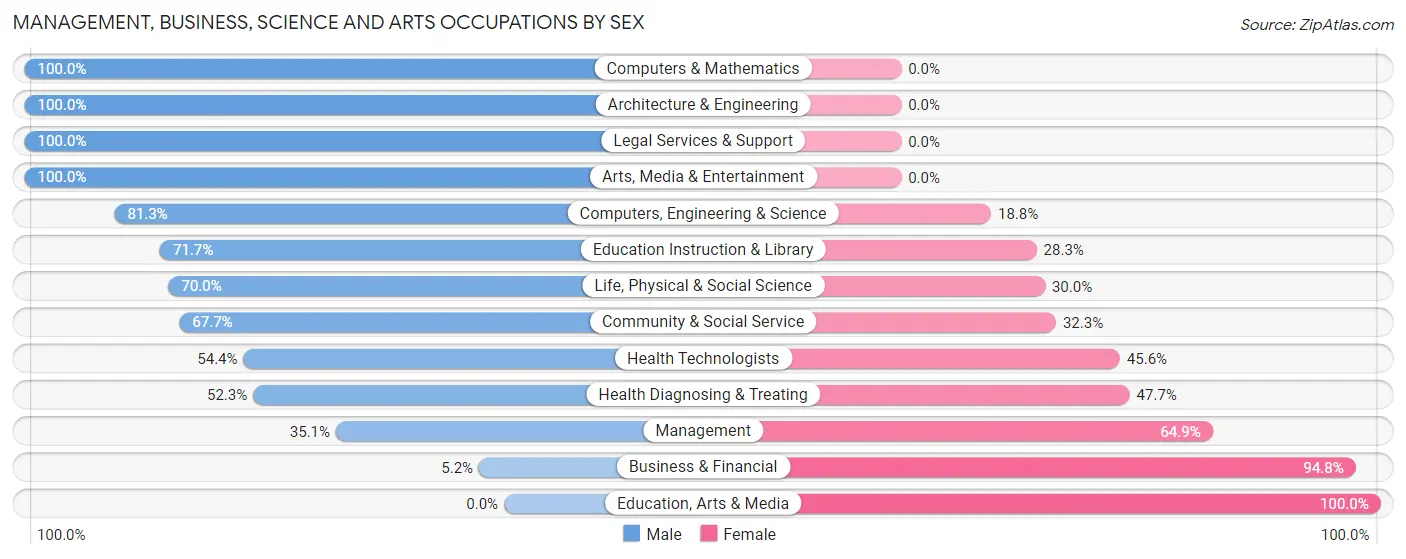
Management, Business, Science and Arts Occupations by Sex
Within the Management, Business, Science and Arts occupations in Port St Joe, the most male-oriented occupations are Computers & Mathematics (100.0%), Architecture & Engineering (100.0%), and Legal Services & Support (100.0%), while the most female-oriented occupations are Education, Arts & Media (100.0%), Business & Financial (94.8%), and Management (64.9%).
| Occupation | Male | Female |
| Management | 47 (35.1%) | 87 (64.9%) |
| Business & Financial | 7 (5.2%) | 127 (94.8%) |
| Computers, Engineering & Science | 52 (81.2%) | 12 (18.8%) |
| Computers & Mathematics | 8 (100.0%) | 0 (0.0%) |
| Architecture & Engineering | 16 (100.0%) | 0 (0.0%) |
| Life, Physical & Social Science | 28 (70.0%) | 12 (30.0%) |
| Community & Social Service | 109 (67.7%) | 52 (32.3%) |
| Education, Arts & Media | 0 (0.0%) | 26 (100.0%) |
| Legal Services & Support | 7 (100.0%) | 0 (0.0%) |
| Education Instruction & Library | 66 (71.7%) | 26 (28.3%) |
| Arts, Media & Entertainment | 36 (100.0%) | 0 (0.0%) |
| Health Diagnosing & Treating | 56 (52.3%) | 51 (47.7%) |
| Health Technologists | 56 (54.4%) | 47 (45.6%) |
| Total (Category) | 271 (45.2%) | 329 (54.8%) |
| Total (Overall) | 716 (48.4%) | 763 (51.6%) |
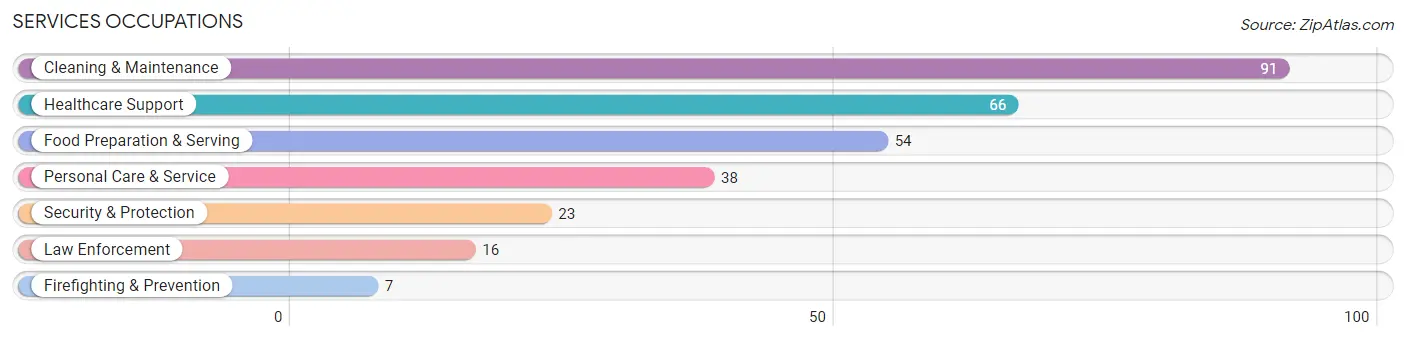
Services Occupations
The most common Services occupations in Port St Joe are Cleaning & Maintenance (91 | 6.1%), Healthcare Support (66 | 4.5%), Food Preparation & Serving (54 | 3.6%), Personal Care & Service (38 | 2.6%), and Security & Protection (23 | 1.6%).
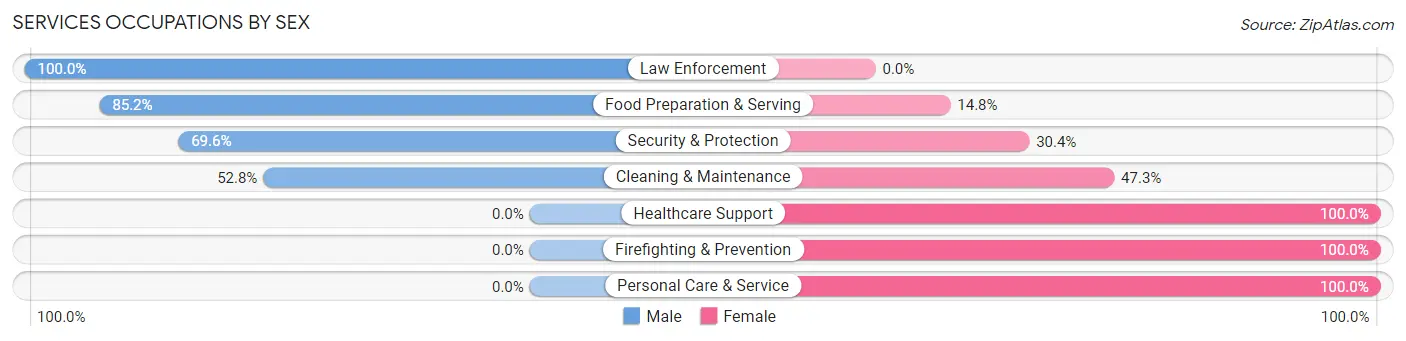
Services Occupations by Sex
Within the Services occupations in Port St Joe, the most male-oriented occupations are Law Enforcement (100.0%), Food Preparation & Serving (85.2%), and Security & Protection (69.6%), while the most female-oriented occupations are Healthcare Support (100.0%), Firefighting & Prevention (100.0%), and Personal Care & Service (100.0%).
| Occupation | Male | Female |
| Healthcare Support | 0 (0.0%) | 66 (100.0%) |
| Security & Protection | 16 (69.6%) | 7 (30.4%) |
| Firefighting & Prevention | 0 (0.0%) | 7 (100.0%) |
| Law Enforcement | 16 (100.0%) | 0 (0.0%) |
| Food Preparation & Serving | 46 (85.2%) | 8 (14.8%) |
| Cleaning & Maintenance | 48 (52.7%) | 43 (47.2%) |
| Personal Care & Service | 0 (0.0%) | 38 (100.0%) |
| Total (Category) | 110 (40.4%) | 162 (59.6%) |
| Total (Overall) | 716 (48.4%) | 763 (51.6%) |
Sales and Office Occupations
The most common Sales and Office occupations in Port St Joe are Office & Administration (232 | 15.7%), and Sales & Related (139 | 9.4%).
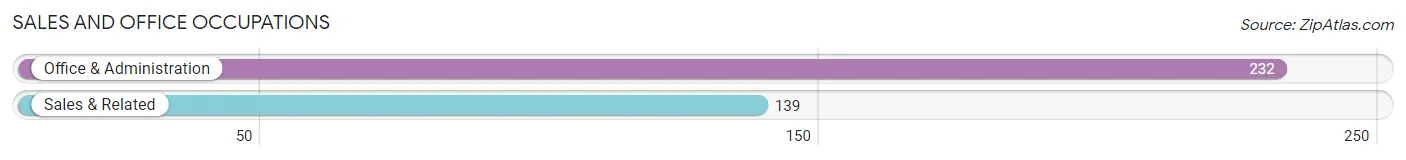
Sales and Office Occupations by Sex
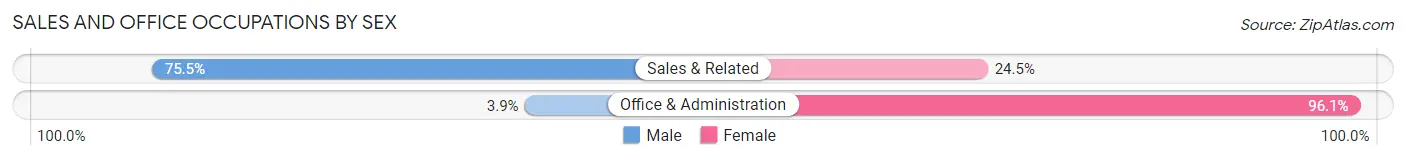
| Occupation | Male | Female |
| Sales & Related | 105 (75.5%) | 34 (24.5%) |
| Office & Administration | 9 (3.9%) | 223 (96.1%) |
| Total (Category) | 114 (30.7%) | 257 (69.3%) |
| Total (Overall) | 716 (48.4%) | 763 (51.6%) |
Natural Resources, Construction and Maintenance Occupations
The most common Natural Resources, Construction and Maintenance occupations in Port St Joe are Construction & Extraction (127 | 8.6%), and Installation, Maintenance & Repair (33 | 2.2%).
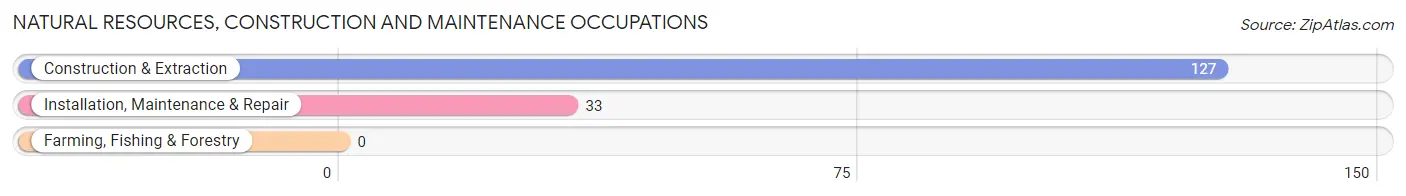
Natural Resources, Construction and Maintenance Occupations by Sex
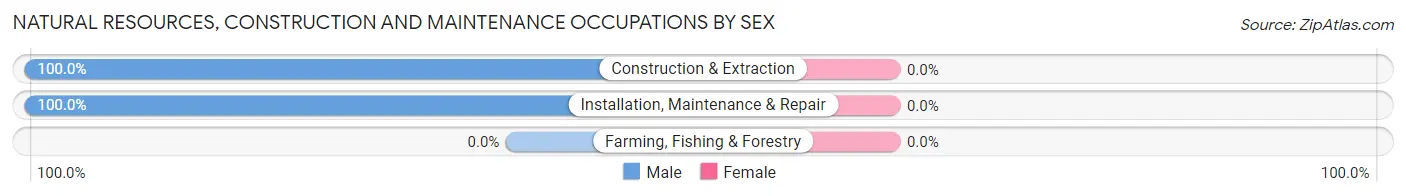
| Occupation | Male | Female |
| Farming, Fishing & Forestry | 0 (0.0%) | 0 (0.0%) |
| Construction & Extraction | 127 (100.0%) | 0 (0.0%) |
| Installation, Maintenance & Repair | 33 (100.0%) | 0 (0.0%) |
| Total (Category) | 160 (100.0%) | 0 (0.0%) |
| Total (Overall) | 716 (48.4%) | 763 (51.6%) |
Production, Transportation and Moving Occupations
The most common Production, Transportation and Moving occupations in Port St Joe are Material Moving (51 | 3.5%), and Production (25 | 1.7%).
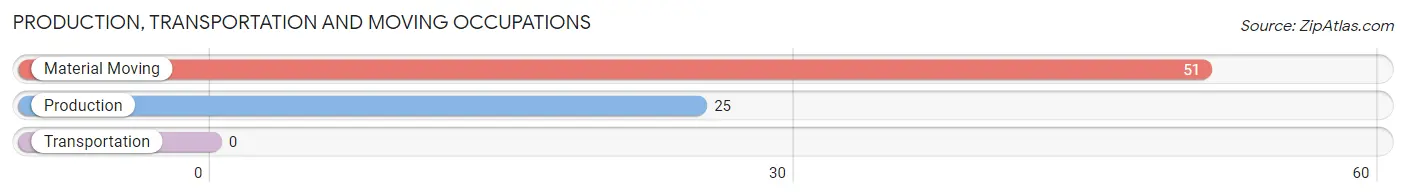
Production, Transportation and Moving Occupations by Sex
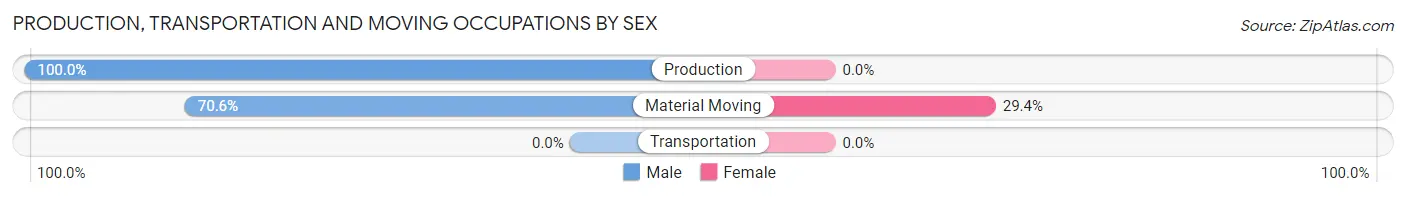
| Occupation | Male | Female |
| Production | 25 (100.0%) | 0 (0.0%) |
| Transportation | 0 (0.0%) | 0 (0.0%) |
| Material Moving | 36 (70.6%) | 15 (29.4%) |
| Total (Category) | 61 (80.3%) | 15 (19.7%) |
| Total (Overall) | 716 (48.4%) | 763 (51.6%) |
Employment Industries by Sex in Port St Joe
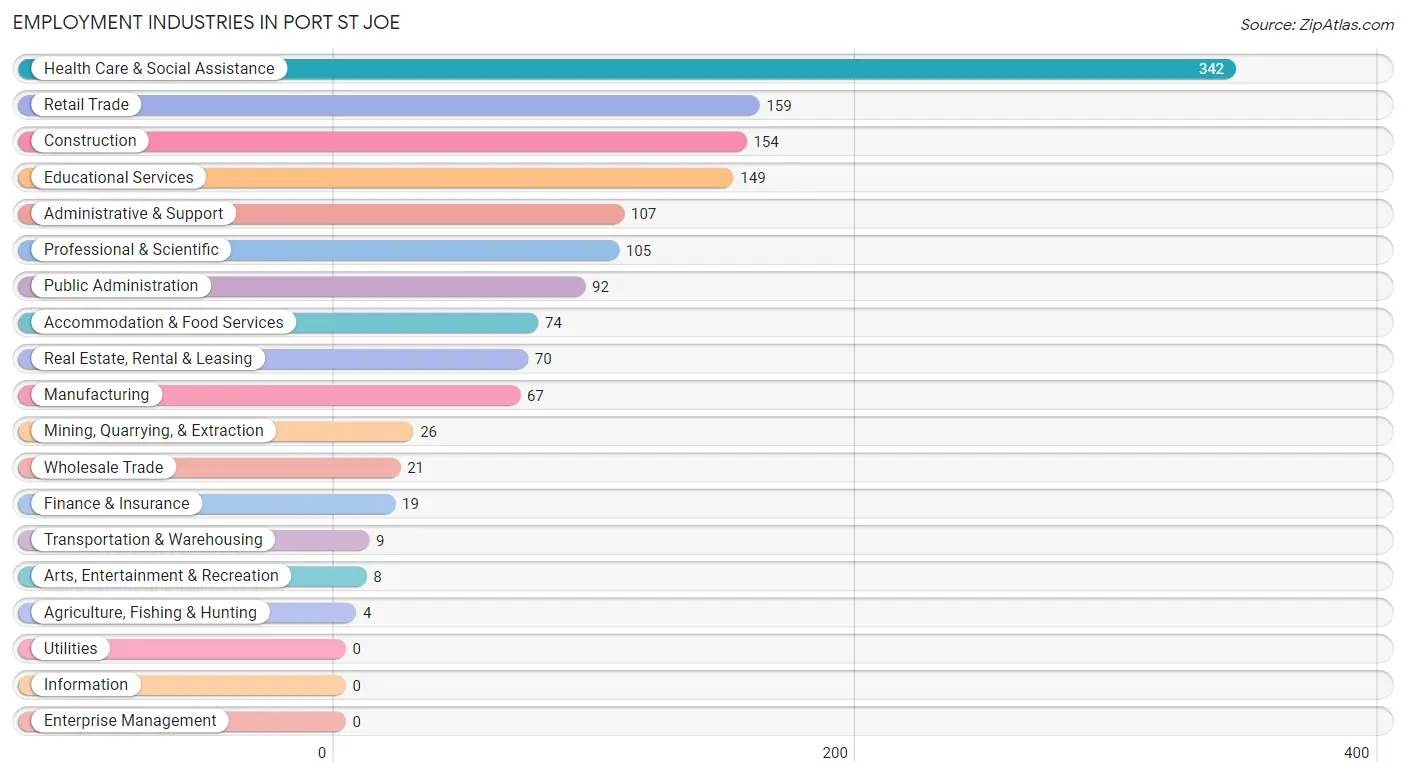
Employment Industries in Port St Joe
The major employment industries in Port St Joe include Health Care & Social Assistance (342 | 23.1%), Retail Trade (159 | 10.7%), Construction (154 | 10.4%), Educational Services (149 | 10.1%), and Administrative & Support (107 | 7.2%).
Employment Industries by Sex in Port St Joe
The Port St Joe industries that see more men than women are Agriculture, Fishing & Hunting (100.0%), Mining, Quarrying, & Extraction (100.0%), and Manufacturing (100.0%), whereas the industries that tend to have a higher number of women are Transportation & Warehousing (100.0%), Health Care & Social Assistance (83.6%), and Professional & Scientific (63.8%).
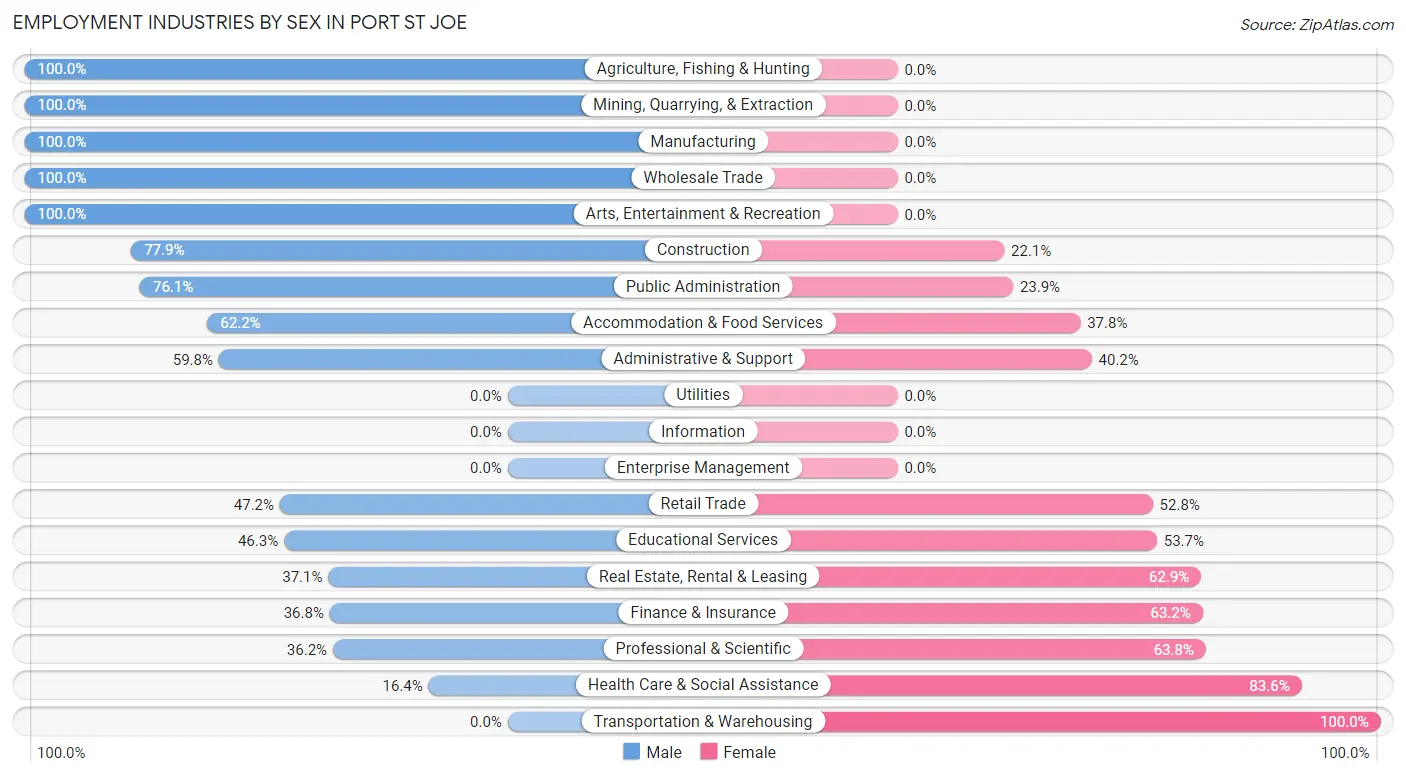
| Industry | Male | Female |
| Agriculture, Fishing & Hunting | 4 (100.0%) | 0 (0.0%) |
| Mining, Quarrying, & Extraction | 26 (100.0%) | 0 (0.0%) |
| Construction | 120 (77.9%) | 34 (22.1%) |
| Manufacturing | 67 (100.0%) | 0 (0.0%) |
| Wholesale Trade | 21 (100.0%) | 0 (0.0%) |
| Retail Trade | 75 (47.2%) | 84 (52.8%) |
| Transportation & Warehousing | 0 (0.0%) | 9 (100.0%) |
| Utilities | 0 (0.0%) | 0 (0.0%) |
| Information | 0 (0.0%) | 0 (0.0%) |
| Finance & Insurance | 7 (36.8%) | 12 (63.2%) |
| Real Estate, Rental & Leasing | 26 (37.1%) | 44 (62.9%) |
| Professional & Scientific | 38 (36.2%) | 67 (63.8%) |
| Enterprise Management | 0 (0.0%) | 0 (0.0%) |
| Administrative & Support | 64 (59.8%) | 43 (40.2%) |
| Educational Services | 69 (46.3%) | 80 (53.7%) |
| Health Care & Social Assistance | 56 (16.4%) | 286 (83.6%) |
| Arts, Entertainment & Recreation | 8 (100.0%) | 0 (0.0%) |
| Accommodation & Food Services | 46 (62.2%) | 28 (37.8%) |
| Public Administration | 70 (76.1%) | 22 (23.9%) |
| Total | 716 (48.4%) | 763 (51.6%) |
Education in Port St Joe
School Enrollment in Port St Joe
The most common levels of schooling among the 728 students in Port St Joe are middle school (192 | 26.4%), nursery / preschool (166 | 22.8%), and elementary school (141 | 19.4%).
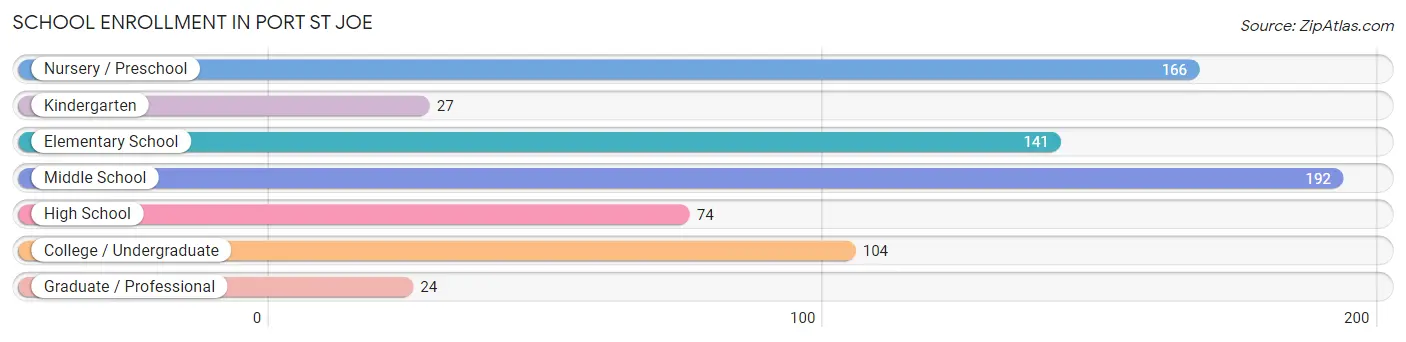
| School Level | # Students | % Students |
| Nursery / Preschool | 166 | 22.8% |
| Kindergarten | 27 | 3.7% |
| Elementary School | 141 | 19.4% |
| Middle School | 192 | 26.4% |
| High School | 74 | 10.2% |
| College / Undergraduate | 104 | 14.3% |
| Graduate / Professional | 24 | 3.3% |
| Total | 728 | 100.0% |
School Enrollment by Age by Funding Source in Port St Joe
Out of a total of 728 students who are enrolled in schools in Port St Joe, 163 (22.4%) attend a private institution, while the remaining 565 (77.6%) are enrolled in public schools. The age group of 3 to 4 year olds has the highest likelihood of being enrolled in private schools, with 122 (100.0% in the age bracket) enrolled. Conversely, the age group of 10 to 14 year olds has the lowest likelihood of being enrolled in a private school, with 226 (100.0% in the age bracket) attending a public institution.
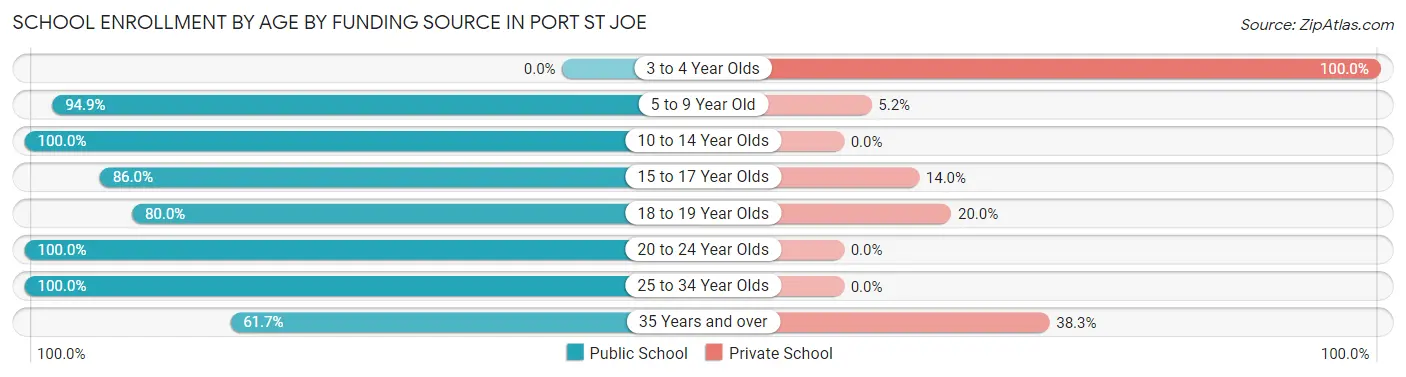
| Age Bracket | Public School | Private School |
| 3 to 4 Year Olds | 0 (0.0%) | 122 (100.0%) |
| 5 to 9 Year Old | 184 (94.9%) | 10 (5.1%) |
| 10 to 14 Year Olds | 226 (100.0%) | 0 (0.0%) |
| 15 to 17 Year Olds | 43 (86.0%) | 7 (14.0%) |
| 18 to 19 Year Olds | 24 (80.0%) | 6 (20.0%) |
| 20 to 24 Year Olds | 54 (100.0%) | 0 (0.0%) |
| 25 to 34 Year Olds | 5 (100.0%) | 0 (0.0%) |
| 35 Years and over | 29 (61.7%) | 18 (38.3%) |
| Total | 565 (77.6%) | 163 (22.4%) |
Educational Attainment by Field of Study in Port St Joe
Science & technology (194 | 24.8%), business (179 | 22.9%), education (143 | 18.3%), social sciences (57 | 7.3%), and physical & health sciences (34 | 4.3%) are the most common fields of study among 783 individuals in Port St Joe who have obtained a bachelor's degree or higher.
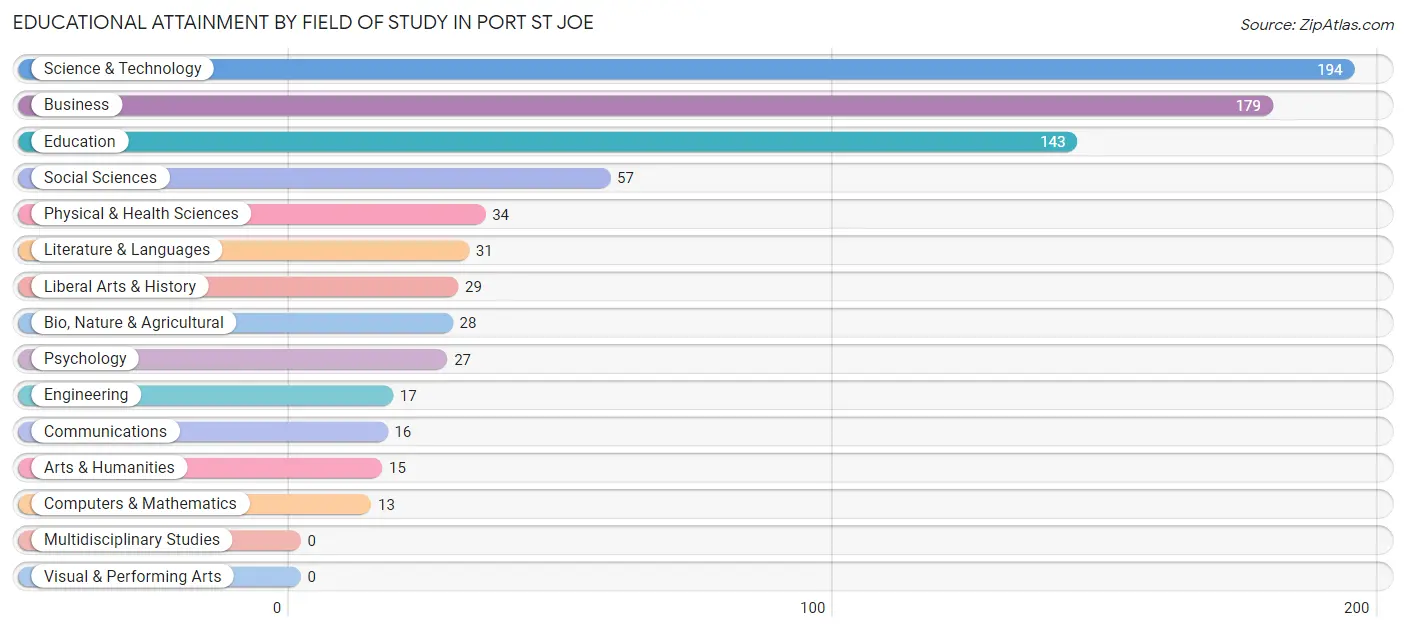
| Field of Study | # Graduates | % Graduates |
| Computers & Mathematics | 13 | 1.7% |
| Bio, Nature & Agricultural | 28 | 3.6% |
| Physical & Health Sciences | 34 | 4.3% |
| Psychology | 27 | 3.5% |
| Social Sciences | 57 | 7.3% |
| Engineering | 17 | 2.2% |
| Multidisciplinary Studies | 0 | 0.0% |
| Science & Technology | 194 | 24.8% |
| Business | 179 | 22.9% |
| Education | 143 | 18.3% |
| Literature & Languages | 31 | 4.0% |
| Liberal Arts & History | 29 | 3.7% |
| Visual & Performing Arts | 0 | 0.0% |
| Communications | 16 | 2.0% |
| Arts & Humanities | 15 | 1.9% |
| Total | 783 | 100.0% |
Transportation & Commute in Port St Joe
Vehicle Availability by Sex in Port St Joe
The most prevalent vehicle ownership categories in Port St Joe are males with 2 vehicles (318, accounting for 48.3%) and females with 2 vehicles (357, making up 42.1%).
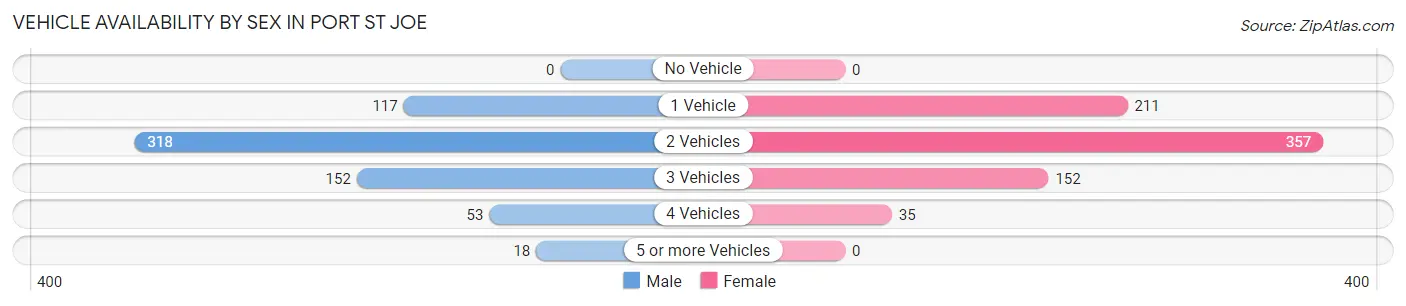
| Vehicles Available | Male | Female |
| No Vehicle | 0 (0.0%) | 0 (0.0%) |
| 1 Vehicle | 117 (17.8%) | 211 (28.0%) |
| 2 Vehicles | 318 (48.3%) | 357 (47.3%) |
| 3 Vehicles | 152 (23.1%) | 152 (20.1%) |
| 4 Vehicles | 53 (8.1%) | 35 (4.6%) |
| 5 or more Vehicles | 18 (2.7%) | 0 (0.0%) |
| Total | 658 (100.0%) | 755 (100.0%) |
Commute Time in Port St Joe
The most frequently occuring commute durations in Port St Joe are 5 to 9 minutes (382 commuters, 28.7%), 10 to 14 minutes (216 commuters, 16.2%), and 45 to 59 minutes (182 commuters, 13.7%).
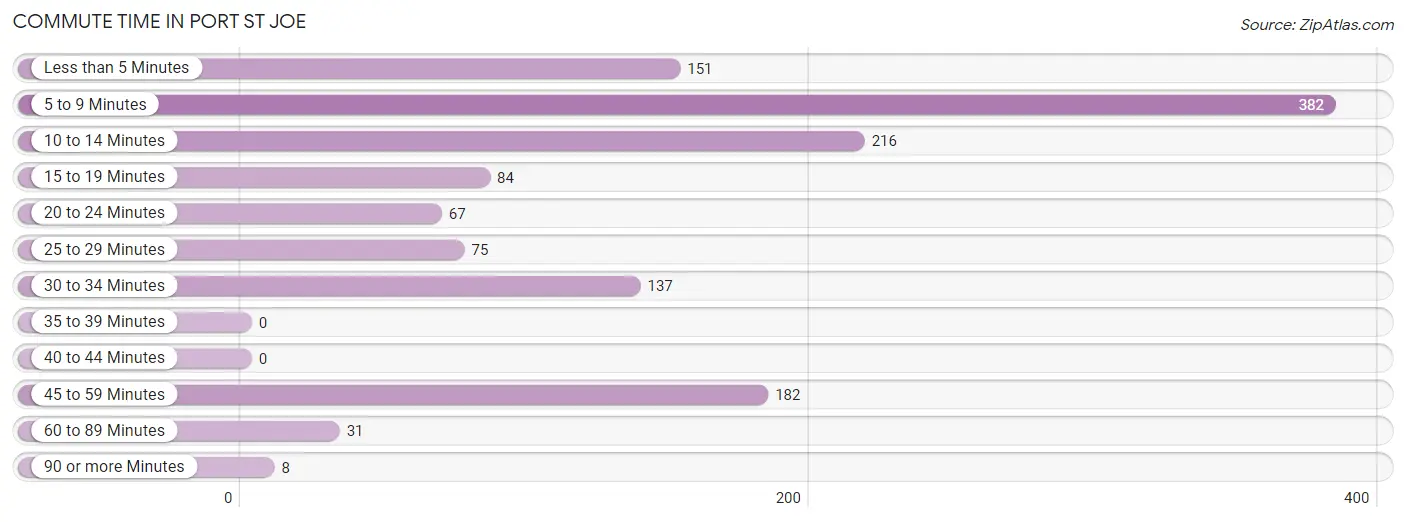
| Commute Time | # Commuters | % Commuters |
| Less than 5 Minutes | 151 | 11.3% |
| 5 to 9 Minutes | 382 | 28.7% |
| 10 to 14 Minutes | 216 | 16.2% |
| 15 to 19 Minutes | 84 | 6.3% |
| 20 to 24 Minutes | 67 | 5.0% |
| 25 to 29 Minutes | 75 | 5.6% |
| 30 to 34 Minutes | 137 | 10.3% |
| 35 to 39 Minutes | 0 | 0.0% |
| 40 to 44 Minutes | 0 | 0.0% |
| 45 to 59 Minutes | 182 | 13.7% |
| 60 to 89 Minutes | 31 | 2.3% |
| 90 or more Minutes | 8 | 0.6% |
Commute Time by Sex in Port St Joe
The most common commute times in Port St Joe are 5 to 9 minutes (218 commuters, 33.5%) for males and 5 to 9 minutes (164 commuters, 24.0%) for females.
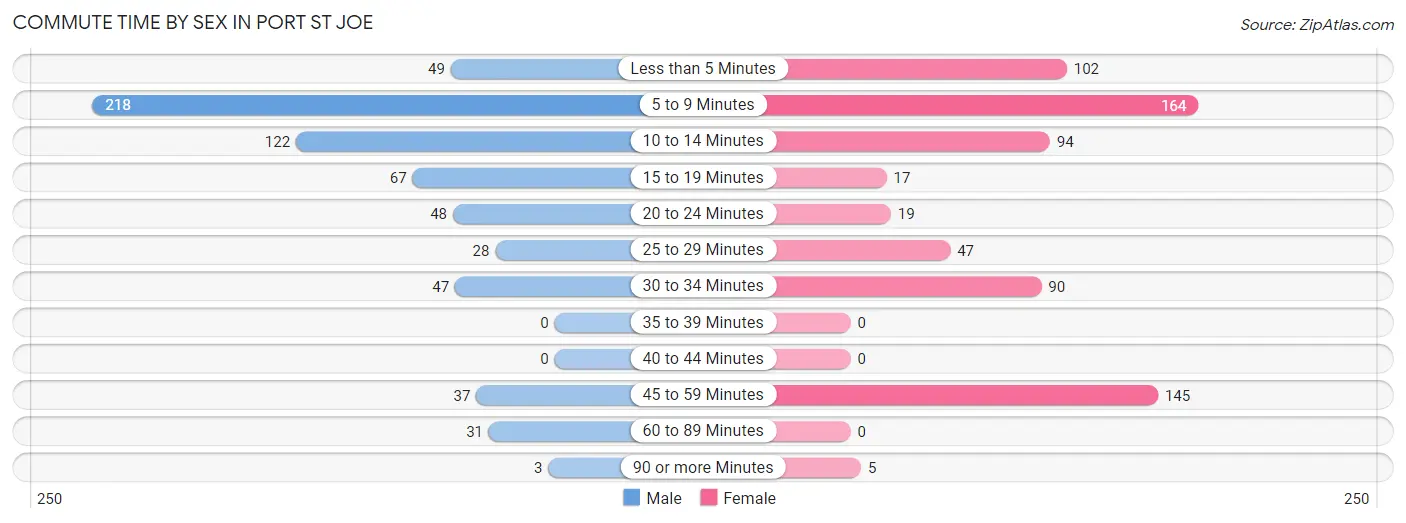
| Commute Time | Male | Female |
| Less than 5 Minutes | 49 (7.5%) | 102 (14.9%) |
| 5 to 9 Minutes | 218 (33.5%) | 164 (24.0%) |
| 10 to 14 Minutes | 122 (18.8%) | 94 (13.8%) |
| 15 to 19 Minutes | 67 (10.3%) | 17 (2.5%) |
| 20 to 24 Minutes | 48 (7.4%) | 19 (2.8%) |
| 25 to 29 Minutes | 28 (4.3%) | 47 (6.9%) |
| 30 to 34 Minutes | 47 (7.2%) | 90 (13.2%) |
| 35 to 39 Minutes | 0 (0.0%) | 0 (0.0%) |
| 40 to 44 Minutes | 0 (0.0%) | 0 (0.0%) |
| 45 to 59 Minutes | 37 (5.7%) | 145 (21.2%) |
| 60 to 89 Minutes | 31 (4.8%) | 0 (0.0%) |
| 90 or more Minutes | 3 (0.5%) | 5 (0.7%) |
Time of Departure to Work by Sex in Port St Joe
The most frequent times of departure to work in Port St Joe are 7:30 AM to 7:59 AM (192, 29.5%) for males and 8:00 AM to 8:29 AM (156, 22.8%) for females.
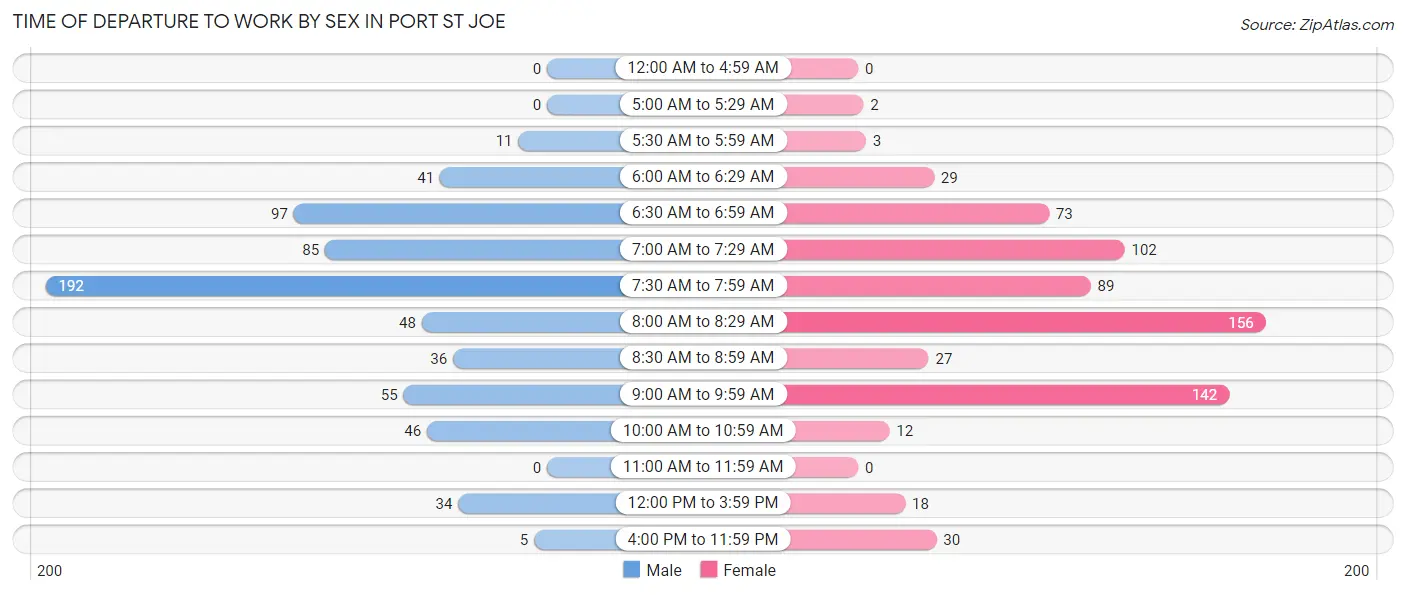
| Time of Departure | Male | Female |
| 12:00 AM to 4:59 AM | 0 (0.0%) | 0 (0.0%) |
| 5:00 AM to 5:29 AM | 0 (0.0%) | 2 (0.3%) |
| 5:30 AM to 5:59 AM | 11 (1.7%) | 3 (0.4%) |
| 6:00 AM to 6:29 AM | 41 (6.3%) | 29 (4.3%) |
| 6:30 AM to 6:59 AM | 97 (14.9%) | 73 (10.7%) |
| 7:00 AM to 7:29 AM | 85 (13.1%) | 102 (14.9%) |
| 7:30 AM to 7:59 AM | 192 (29.5%) | 89 (13.0%) |
| 8:00 AM to 8:29 AM | 48 (7.4%) | 156 (22.8%) |
| 8:30 AM to 8:59 AM | 36 (5.5%) | 27 (4.0%) |
| 9:00 AM to 9:59 AM | 55 (8.5%) | 142 (20.8%) |
| 10:00 AM to 10:59 AM | 46 (7.1%) | 12 (1.8%) |
| 11:00 AM to 11:59 AM | 0 (0.0%) | 0 (0.0%) |
| 12:00 PM to 3:59 PM | 34 (5.2%) | 18 (2.6%) |
| 4:00 PM to 11:59 PM | 5 (0.8%) | 30 (4.4%) |
| Total | 650 (100.0%) | 683 (100.0%) |
Housing Occupancy in Port St Joe
Occupancy by Ownership in Port St Joe
Of the total 1,492 dwellings in Port St Joe, owner-occupied units account for 1,178 (78.9%), while renter-occupied units make up 314 (21.0%).
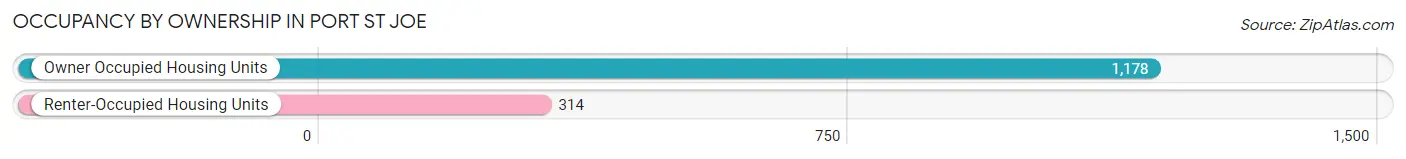
| Occupancy | # Housing Units | % Housing Units |
| Owner Occupied Housing Units | 1,178 | 78.9% |
| Renter-Occupied Housing Units | 314 | 21.0% |
| Total Occupied Housing Units | 1,492 | 100.0% |
Occupancy by Household Size in Port St Joe
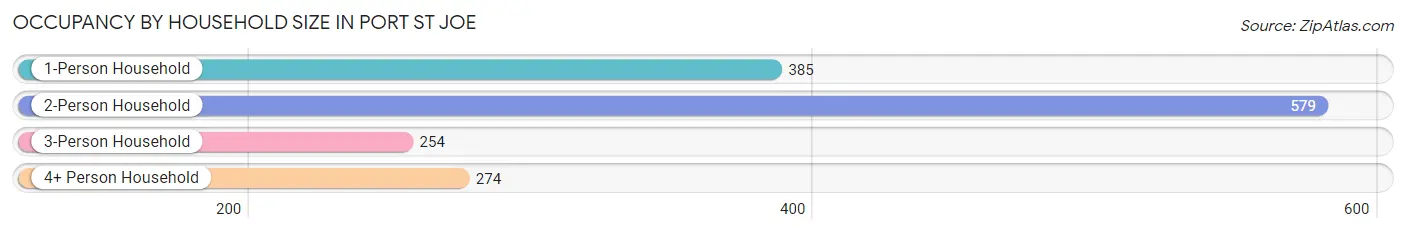
| Household Size | # Housing Units | % Housing Units |
| 1-Person Household | 385 | 25.8% |
| 2-Person Household | 579 | 38.8% |
| 3-Person Household | 254 | 17.0% |
| 4+ Person Household | 274 | 18.4% |
| Total Housing Units | 1,492 | 100.0% |
Occupancy by Ownership by Household Size in Port St Joe
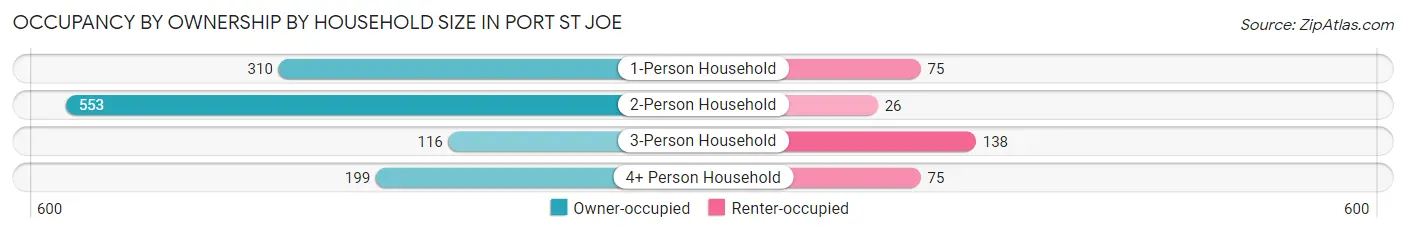
| Household Size | Owner-occupied | Renter-occupied |
| 1-Person Household | 310 (80.5%) | 75 (19.5%) |
| 2-Person Household | 553 (95.5%) | 26 (4.5%) |
| 3-Person Household | 116 (45.7%) | 138 (54.3%) |
| 4+ Person Household | 199 (72.6%) | 75 (27.4%) |
| Total Housing Units | 1,178 (78.9%) | 314 (21.0%) |
Occupancy by Educational Attainment in Port St Joe
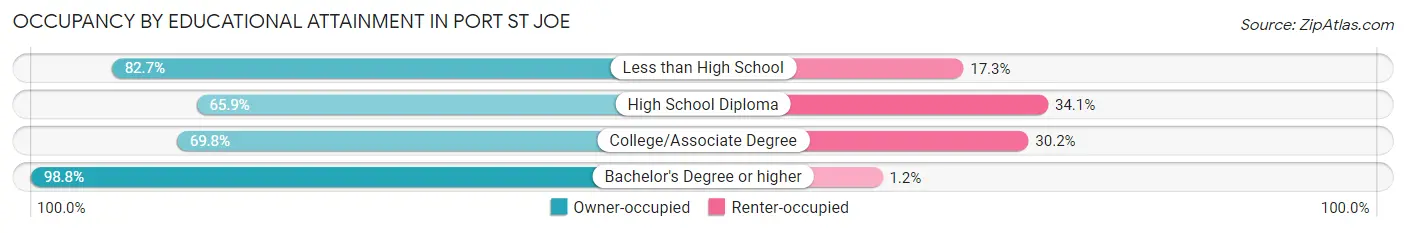
| Household Size | Owner-occupied | Renter-occupied |
| Less than High School | 67 (82.7%) | 14 (17.3%) |
| High School Diploma | 236 (65.9%) | 122 (34.1%) |
| College/Associate Degree | 398 (69.8%) | 172 (30.2%) |
| Bachelor's Degree or higher | 477 (98.8%) | 6 (1.2%) |
Occupancy by Age of Householder in Port St Joe
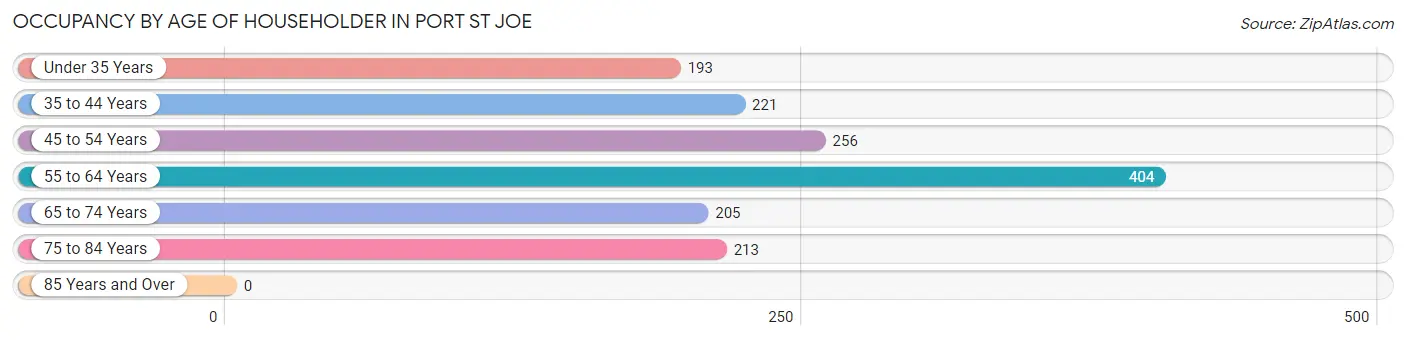
| Age Bracket | # Households | % Households |
| Under 35 Years | 193 | 12.9% |
| 35 to 44 Years | 221 | 14.8% |
| 45 to 54 Years | 256 | 17.2% |
| 55 to 64 Years | 404 | 27.1% |
| 65 to 74 Years | 205 | 13.7% |
| 75 to 84 Years | 213 | 14.3% |
| 85 Years and Over | 0 | 0.0% |
| Total | 1,492 | 100.0% |
Housing Finances in Port St Joe
Median Income by Occupancy in Port St Joe
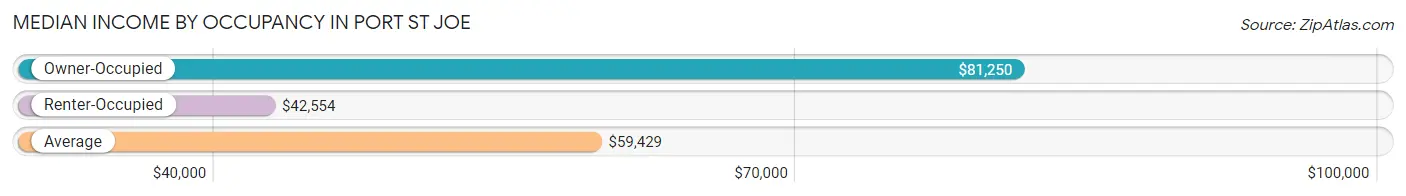
| Occupancy Type | # Households | Median Income |
| Owner-Occupied | 1,178 (78.9%) | $81,250 |
| Renter-Occupied | 314 (21.0%) | $42,554 |
| Average | 1,492 (100.0%) | $59,429 |
Occupancy by Householder Income Bracket in Port St Joe
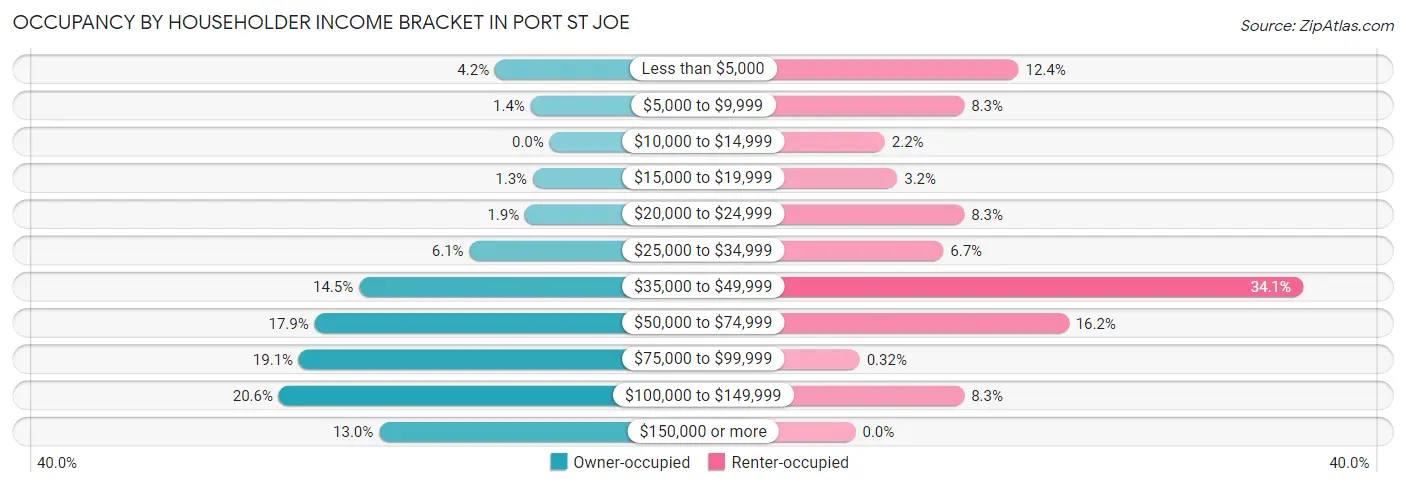
| Income Bracket | Owner-occupied | Renter-occupied |
| Less than $5,000 | 49 (4.2%) | 39 (12.4%) |
| $5,000 to $9,999 | 17 (1.4%) | 26 (8.3%) |
| $10,000 to $14,999 | 0 (0.0%) | 7 (2.2%) |
| $15,000 to $19,999 | 15 (1.3%) | 10 (3.2%) |
| $20,000 to $24,999 | 22 (1.9%) | 26 (8.3%) |
| $25,000 to $34,999 | 72 (6.1%) | 21 (6.7%) |
| $35,000 to $49,999 | 171 (14.5%) | 107 (34.1%) |
| $50,000 to $74,999 | 211 (17.9%) | 51 (16.2%) |
| $75,000 to $99,999 | 225 (19.1%) | 1 (0.3%) |
| $100,000 to $149,999 | 243 (20.6%) | 26 (8.3%) |
| $150,000 or more | 153 (13.0%) | 0 (0.0%) |
| Total | 1,178 (100.0%) | 314 (100.0%) |
Monthly Housing Cost Tiers in Port St Joe
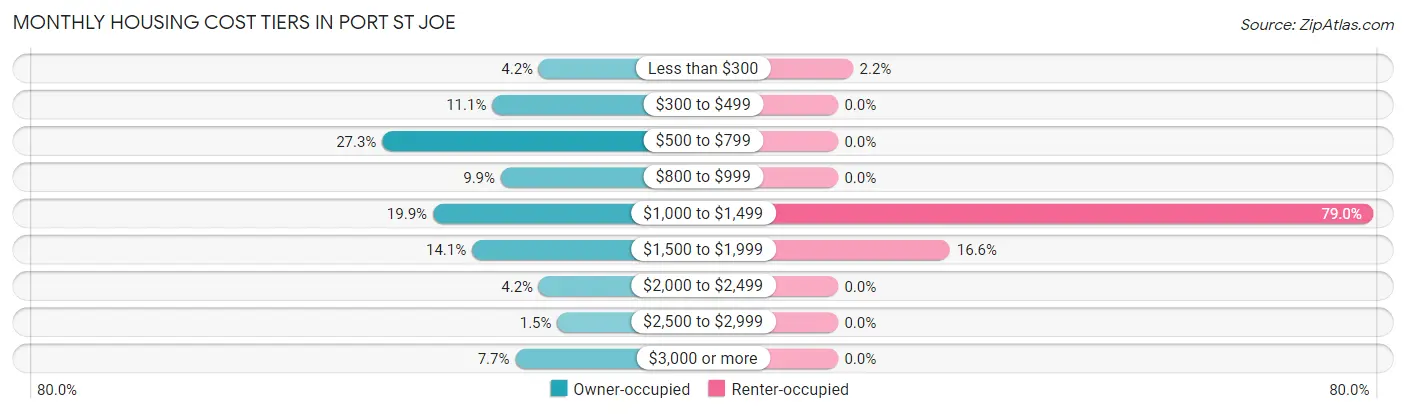
| Monthly Cost | Owner-occupied | Renter-occupied |
| Less than $300 | 50 (4.2%) | 7 (2.2%) |
| $300 to $499 | 131 (11.1%) | 0 (0.0%) |
| $500 to $799 | 322 (27.3%) | 0 (0.0%) |
| $800 to $999 | 116 (9.9%) | 0 (0.0%) |
| $1,000 to $1,499 | 234 (19.9%) | 248 (79.0%) |
| $1,500 to $1,999 | 166 (14.1%) | 52 (16.6%) |
| $2,000 to $2,499 | 50 (4.2%) | 0 (0.0%) |
| $2,500 to $2,999 | 18 (1.5%) | 0 (0.0%) |
| $3,000 or more | 91 (7.7%) | 0 (0.0%) |
| Total | 1,178 (100.0%) | 314 (100.0%) |
Physical Housing Characteristics in Port St Joe
Housing Structures in Port St Joe
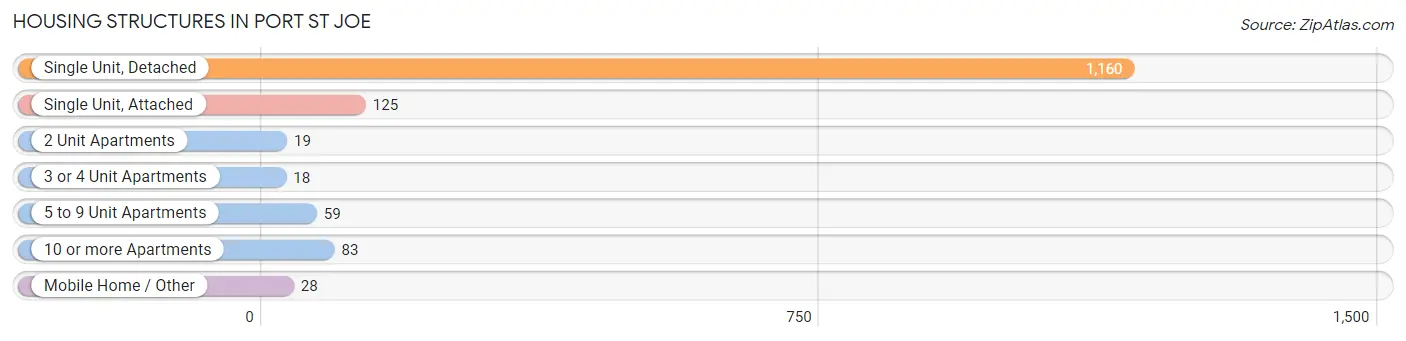
| Structure Type | # Housing Units | % Housing Units |
| Single Unit, Detached | 1,160 | 77.7% |
| Single Unit, Attached | 125 | 8.4% |
| 2 Unit Apartments | 19 | 1.3% |
| 3 or 4 Unit Apartments | 18 | 1.2% |
| 5 to 9 Unit Apartments | 59 | 4.0% |
| 10 or more Apartments | 83 | 5.6% |
| Mobile Home / Other | 28 | 1.9% |
| Total | 1,492 | 100.0% |
Housing Structures by Occupancy in Port St Joe
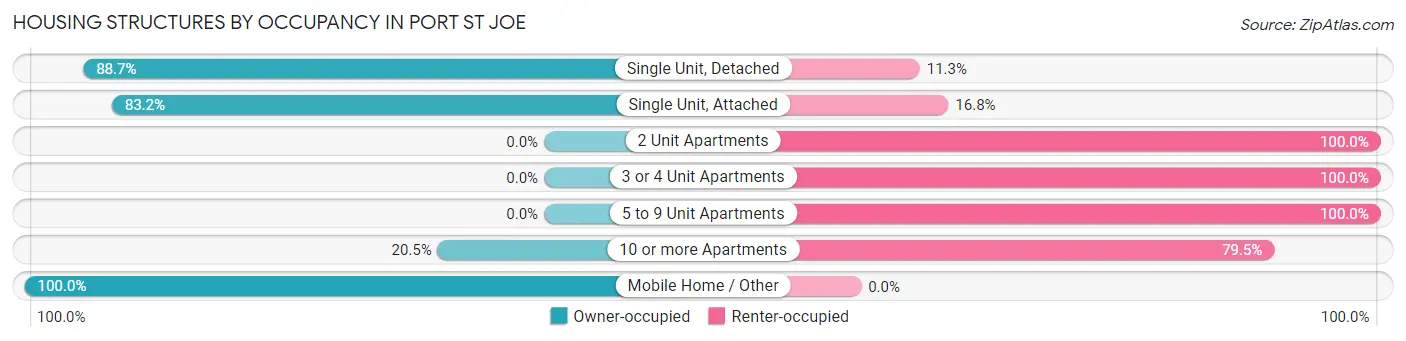
| Structure Type | Owner-occupied | Renter-occupied |
| Single Unit, Detached | 1,029 (88.7%) | 131 (11.3%) |
| Single Unit, Attached | 104 (83.2%) | 21 (16.8%) |
| 2 Unit Apartments | 0 (0.0%) | 19 (100.0%) |
| 3 or 4 Unit Apartments | 0 (0.0%) | 18 (100.0%) |
| 5 to 9 Unit Apartments | 0 (0.0%) | 59 (100.0%) |
| 10 or more Apartments | 17 (20.5%) | 66 (79.5%) |
| Mobile Home / Other | 28 (100.0%) | 0 (0.0%) |
| Total | 1,178 (78.9%) | 314 (21.0%) |
Housing Structures by Number of Rooms in Port St Joe
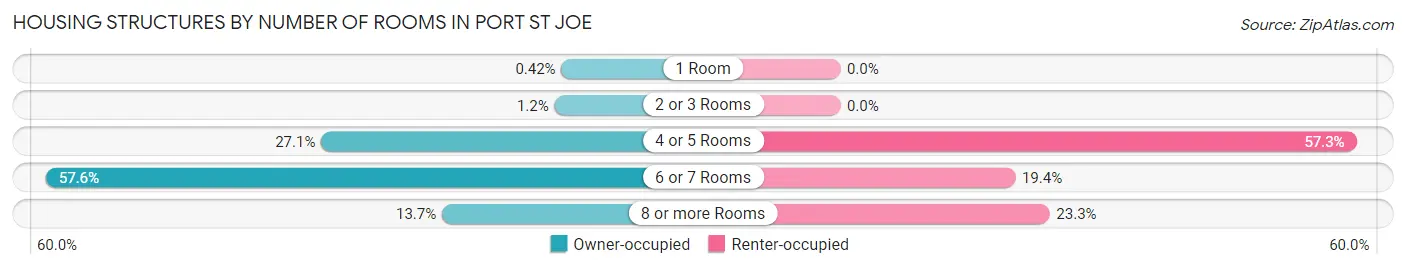
| Number of Rooms | Owner-occupied | Renter-occupied |
| 1 Room | 5 (0.4%) | 0 (0.0%) |
| 2 or 3 Rooms | 14 (1.2%) | 0 (0.0%) |
| 4 or 5 Rooms | 319 (27.1%) | 180 (57.3%) |
| 6 or 7 Rooms | 679 (57.6%) | 61 (19.4%) |
| 8 or more Rooms | 161 (13.7%) | 73 (23.3%) |
| Total | 1,178 (100.0%) | 314 (100.0%) |
Housing Structure by Heating Type in Port St Joe
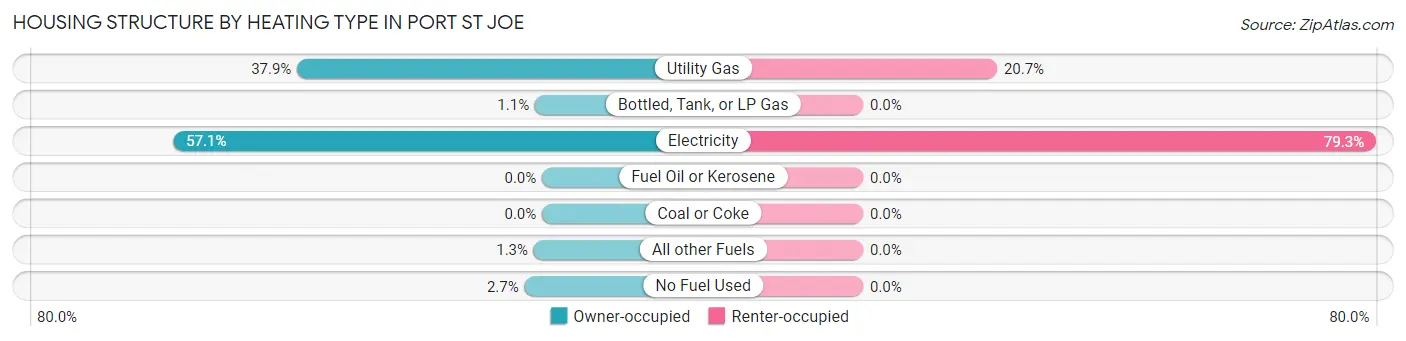
| Heating Type | Owner-occupied | Renter-occupied |
| Utility Gas | 446 (37.9%) | 65 (20.7%) |
| Bottled, Tank, or LP Gas | 13 (1.1%) | 0 (0.0%) |
| Electricity | 672 (57.1%) | 249 (79.3%) |
| Fuel Oil or Kerosene | 0 (0.0%) | 0 (0.0%) |
| Coal or Coke | 0 (0.0%) | 0 (0.0%) |
| All other Fuels | 15 (1.3%) | 0 (0.0%) |
| No Fuel Used | 32 (2.7%) | 0 (0.0%) |
| Total | 1,178 (100.0%) | 314 (100.0%) |
Household Vehicle Usage in Port St Joe
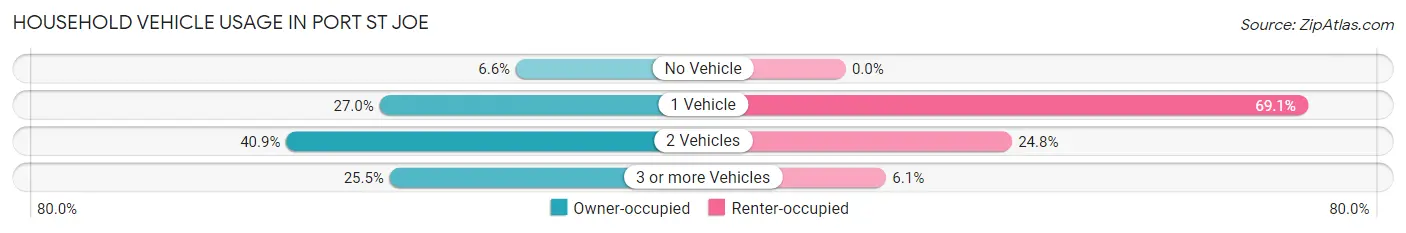
| Vehicles per Household | Owner-occupied | Renter-occupied |
| No Vehicle | 78 (6.6%) | 0 (0.0%) |
| 1 Vehicle | 318 (27.0%) | 217 (69.1%) |
| 2 Vehicles | 482 (40.9%) | 78 (24.8%) |
| 3 or more Vehicles | 300 (25.5%) | 19 (6.0%) |
| Total | 1,178 (100.0%) | 314 (100.0%) |
Real Estate & Mortgages in Port St Joe
Real Estate and Mortgage Overview in Port St Joe
| Characteristic | Without Mortgage | With Mortgage |
| Housing Units | 631 | 547 |
| Median Property Value | $213,600 | $246,900 |
| Median Household Income | $68,594 | $51 |
| Monthly Housing Costs | $632 | $91 |
| Real Estate Taxes | $1,246 | $5 |
Property Value by Mortgage Status in Port St Joe
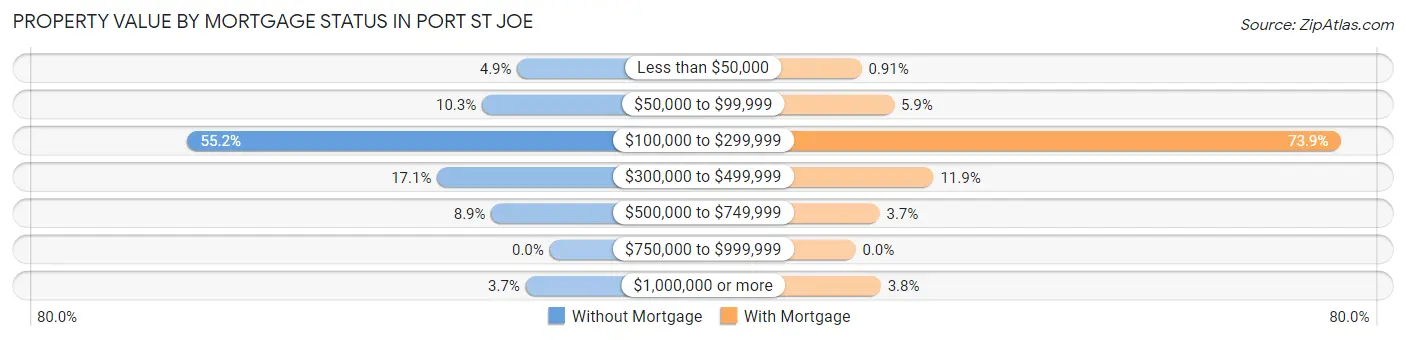
| Property Value | Without Mortgage | With Mortgage |
| Less than $50,000 | 31 (4.9%) | 5 (0.9%) |
| $50,000 to $99,999 | 65 (10.3%) | 32 (5.9%) |
| $100,000 to $299,999 | 348 (55.1%) | 404 (73.9%) |
| $300,000 to $499,999 | 108 (17.1%) | 65 (11.9%) |
| $500,000 to $749,999 | 56 (8.9%) | 20 (3.7%) |
| $750,000 to $999,999 | 0 (0.0%) | 0 (0.0%) |
| $1,000,000 or more | 23 (3.6%) | 21 (3.8%) |
| Total | 631 (100.0%) | 547 (100.0%) |
Household Income by Mortgage Status in Port St Joe
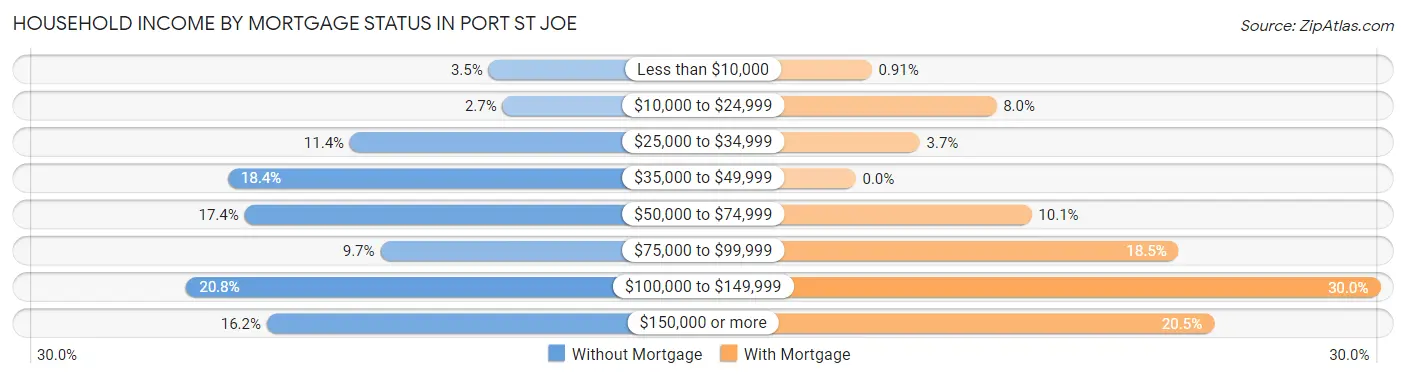
| Household Income | Without Mortgage | With Mortgage |
| Less than $10,000 | 22 (3.5%) | 5 (0.9%) |
| $10,000 to $24,999 | 17 (2.7%) | 44 (8.0%) |
| $25,000 to $34,999 | 72 (11.4%) | 20 (3.7%) |
| $35,000 to $49,999 | 116 (18.4%) | 0 (0.0%) |
| $50,000 to $74,999 | 110 (17.4%) | 55 (10.1%) |
| $75,000 to $99,999 | 61 (9.7%) | 101 (18.5%) |
| $100,000 to $149,999 | 131 (20.8%) | 164 (30.0%) |
| $150,000 or more | 102 (16.2%) | 112 (20.5%) |
| Total | 631 (100.0%) | 547 (100.0%) |
Property Value to Household Income Ratio in Port St Joe
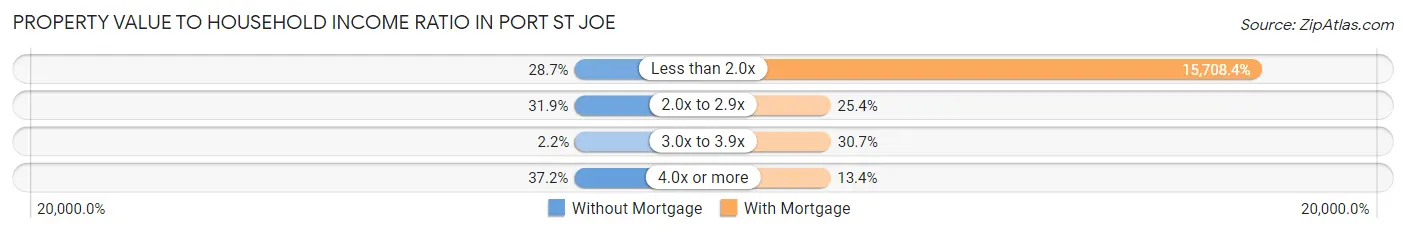
| Value-to-Income Ratio | Without Mortgage | With Mortgage |
| Less than 2.0x | 181 (28.7%) | 85,925 (15,708.4%) |
| 2.0x to 2.9x | 201 (31.9%) | 139 (25.4%) |
| 3.0x to 3.9x | 14 (2.2%) | 168 (30.7%) |
| 4.0x or more | 235 (37.2%) | 73 (13.4%) |
| Total | 631 (100.0%) | 547 (100.0%) |
Real Estate Taxes by Mortgage Status in Port St Joe
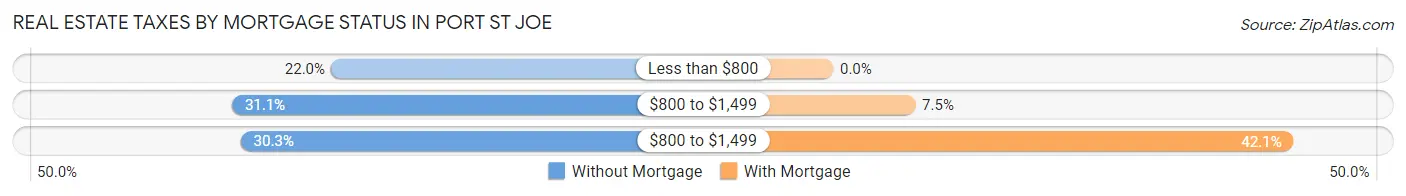
| Property Taxes | Without Mortgage | With Mortgage |
| Less than $800 | 139 (22.0%) | 0 (0.0%) |
| $800 to $1,499 | 196 (31.1%) | 41 (7.5%) |
| $800 to $1,499 | 191 (30.3%) | 230 (42.0%) |
| Total | 631 (100.0%) | 547 (100.0%) |
Health & Disability in Port St Joe
Health Insurance Coverage by Age in Port St Joe
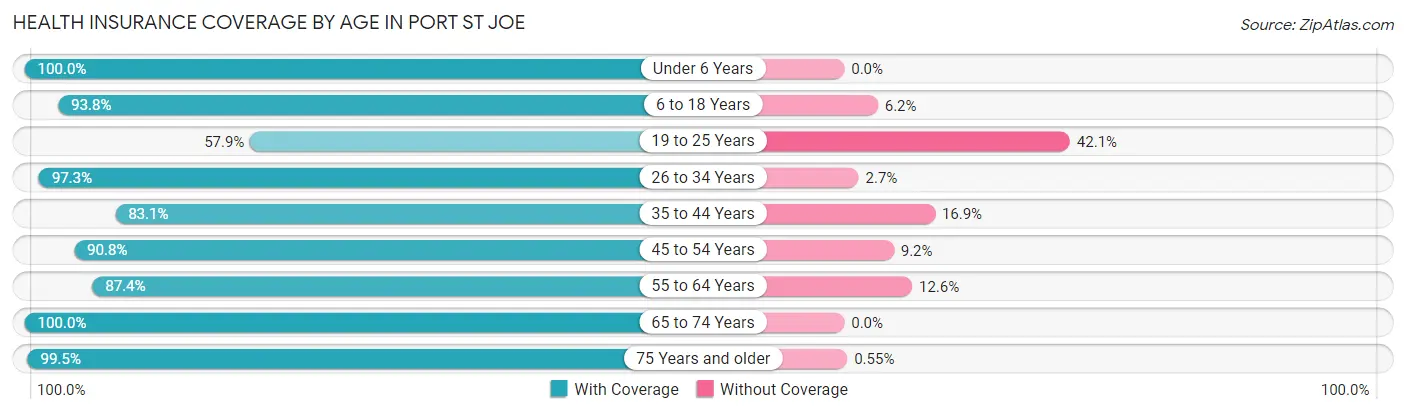
| Age Bracket | With Coverage | Without Coverage |
| Under 6 Years | 345 (100.0%) | 0 (0.0%) |
| 6 to 18 Years | 406 (93.8%) | 27 (6.2%) |
| 19 to 25 Years | 95 (57.9%) | 69 (42.1%) |
| 26 to 34 Years | 329 (97.3%) | 9 (2.7%) |
| 35 to 44 Years | 241 (83.1%) | 49 (16.9%) |
| 45 to 54 Years | 305 (90.8%) | 31 (9.2%) |
| 55 to 64 Years | 657 (87.4%) | 95 (12.6%) |
| 65 to 74 Years | 361 (100.0%) | 0 (0.0%) |
| 75 Years and older | 363 (99.5%) | 2 (0.5%) |
| Total | 3,102 (91.7%) | 282 (8.3%) |
Health Insurance Coverage by Citizenship Status in Port St Joe
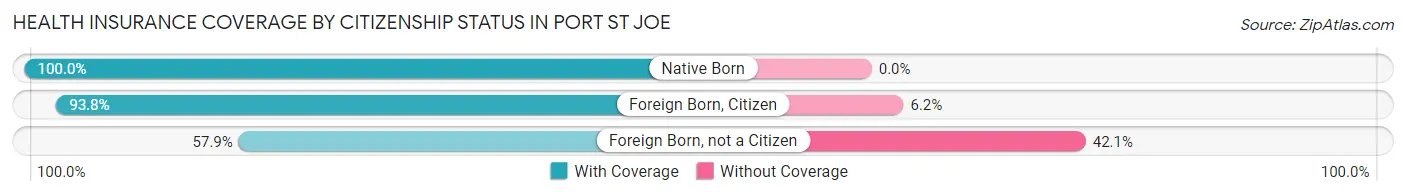
| Citizenship Status | With Coverage | Without Coverage |
| Native Born | 345 (100.0%) | 0 (0.0%) |
| Foreign Born, Citizen | 406 (93.8%) | 27 (6.2%) |
| Foreign Born, not a Citizen | 95 (57.9%) | 69 (42.1%) |
Health Insurance Coverage by Household Income in Port St Joe
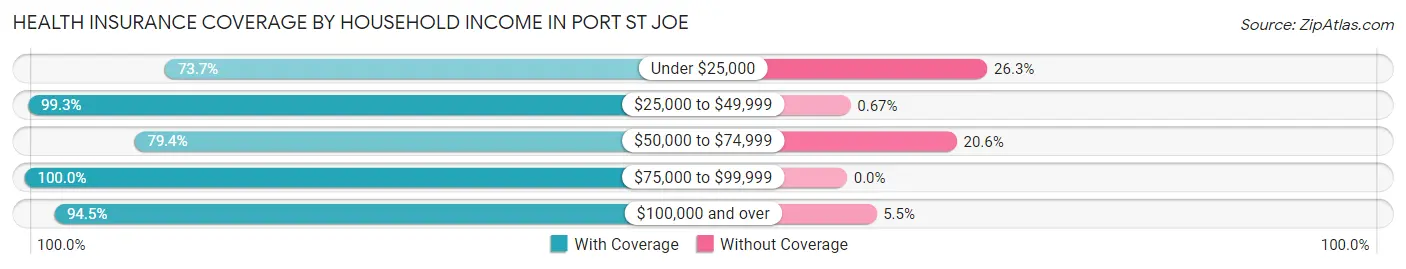
| Household Income | With Coverage | Without Coverage |
| Under $25,000 | 213 (73.7%) | 76 (26.3%) |
| $25,000 to $49,999 | 740 (99.3%) | 5 (0.7%) |
| $50,000 to $74,999 | 537 (79.4%) | 139 (20.6%) |
| $75,000 to $99,999 | 718 (100.0%) | 0 (0.0%) |
| $100,000 and over | 891 (94.5%) | 52 (5.5%) |
Public vs Private Health Insurance Coverage by Age in Port St Joe
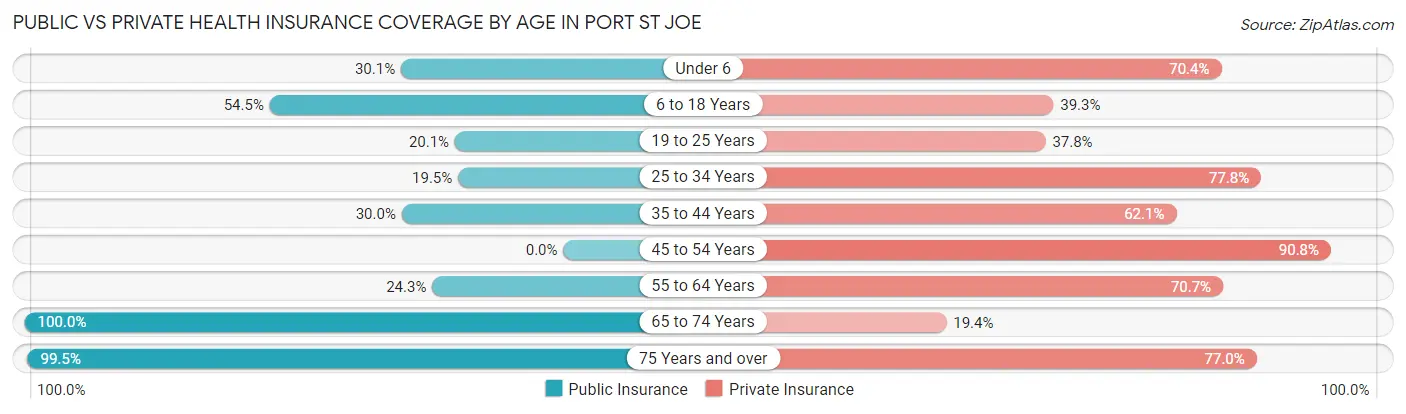
| Age Bracket | Public Insurance | Private Insurance |
| Under 6 | 104 (30.1%) | 243 (70.4%) |
| 6 to 18 Years | 236 (54.5%) | 170 (39.3%) |
| 19 to 25 Years | 33 (20.1%) | 62 (37.8%) |
| 25 to 34 Years | 66 (19.5%) | 263 (77.8%) |
| 35 to 44 Years | 87 (30.0%) | 180 (62.1%) |
| 45 to 54 Years | 0 (0.0%) | 305 (90.8%) |
| 55 to 64 Years | 183 (24.3%) | 532 (70.7%) |
| 65 to 74 Years | 361 (100.0%) | 70 (19.4%) |
| 75 Years and over | 363 (99.5%) | 281 (77.0%) |
| Total | 1,433 (42.3%) | 2,106 (62.2%) |
Disability Status by Sex by Age in Port St Joe
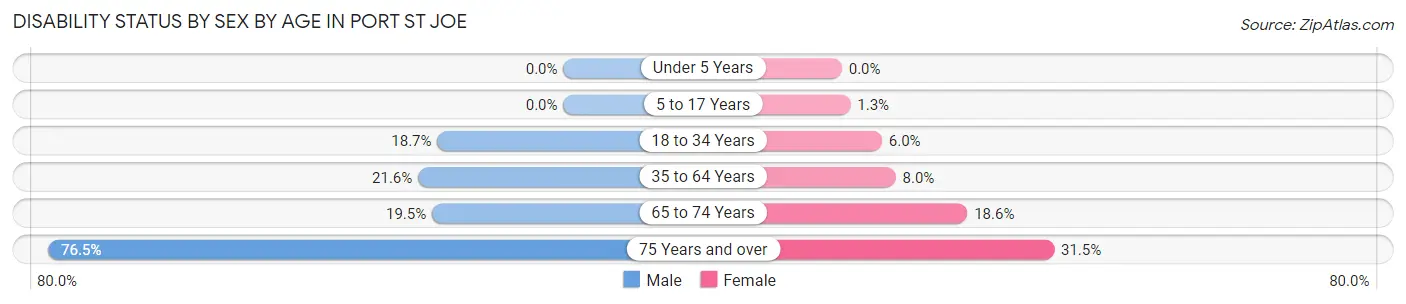
| Age Bracket | Male | Female |
| Under 5 Years | 0 (0.0%) | 0 (0.0%) |
| 5 to 17 Years | 0 (0.0%) | 3 (1.3%) |
| 18 to 34 Years | 29 (18.7%) | 22 (5.9%) |
| 35 to 64 Years | 146 (21.6%) | 56 (8.0%) |
| 65 to 74 Years | 39 (19.5%) | 30 (18.6%) |
| 75 Years and over | 153 (76.5%) | 52 (31.5%) |
Disability Class by Sex by Age in Port St Joe
Disability Class: Hearing Difficulty
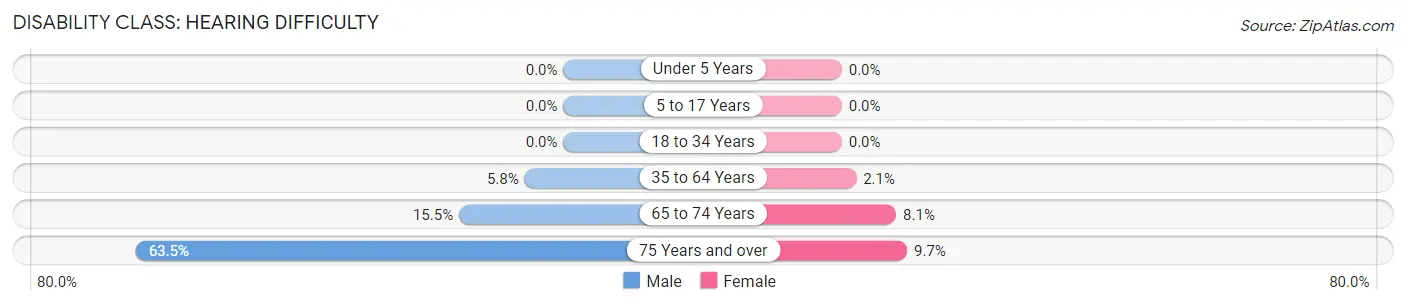
| Age Bracket | Male | Female |
| Under 5 Years | 0 (0.0%) | 0 (0.0%) |
| 5 to 17 Years | 0 (0.0%) | 0 (0.0%) |
| 18 to 34 Years | 0 (0.0%) | 0 (0.0%) |
| 35 to 64 Years | 39 (5.8%) | 15 (2.1%) |
| 65 to 74 Years | 31 (15.5%) | 13 (8.1%) |
| 75 Years and over | 127 (63.5%) | 16 (9.7%) |
Disability Class: Vision Difficulty
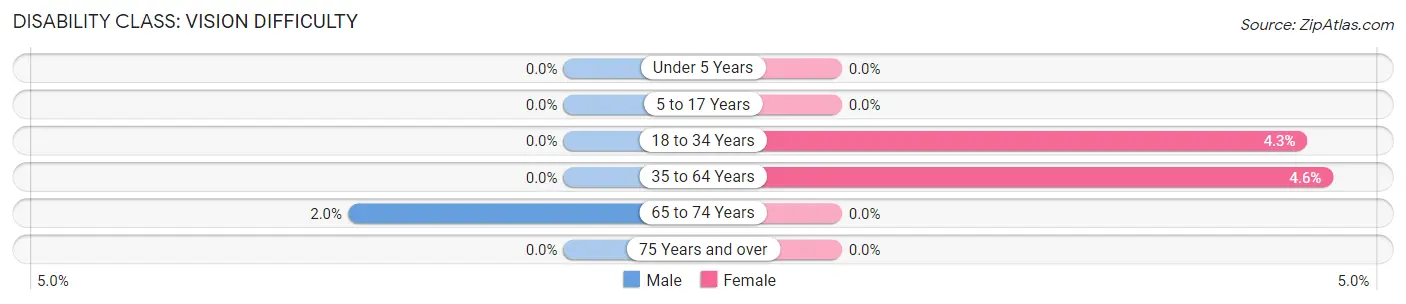
| Age Bracket | Male | Female |
| Under 5 Years | 0 (0.0%) | 0 (0.0%) |
| 5 to 17 Years | 0 (0.0%) | 0 (0.0%) |
| 18 to 34 Years | 0 (0.0%) | 16 (4.3%) |
| 35 to 64 Years | 0 (0.0%) | 32 (4.6%) |
| 65 to 74 Years | 4 (2.0%) | 0 (0.0%) |
| 75 Years and over | 0 (0.0%) | 0 (0.0%) |
Disability Class: Cognitive Difficulty
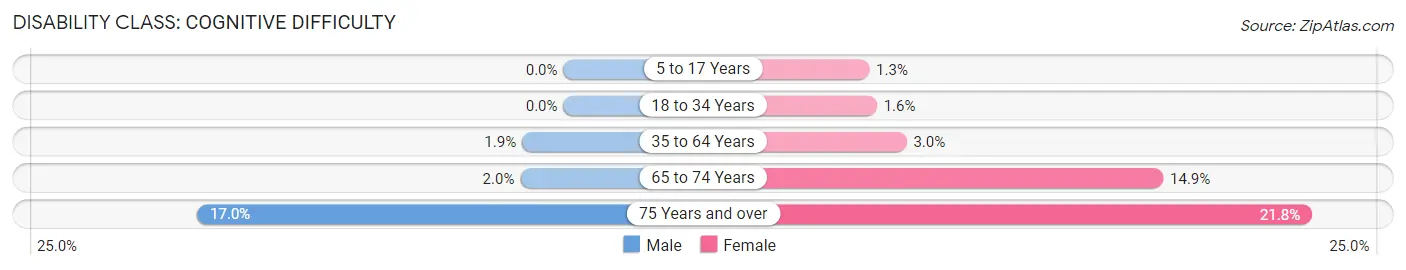
| Age Bracket | Male | Female |
| 5 to 17 Years | 0 (0.0%) | 3 (1.3%) |
| 18 to 34 Years | 0 (0.0%) | 6 (1.6%) |
| 35 to 64 Years | 13 (1.9%) | 21 (3.0%) |
| 65 to 74 Years | 4 (2.0%) | 24 (14.9%) |
| 75 Years and over | 34 (17.0%) | 36 (21.8%) |
Disability Class: Ambulatory Difficulty
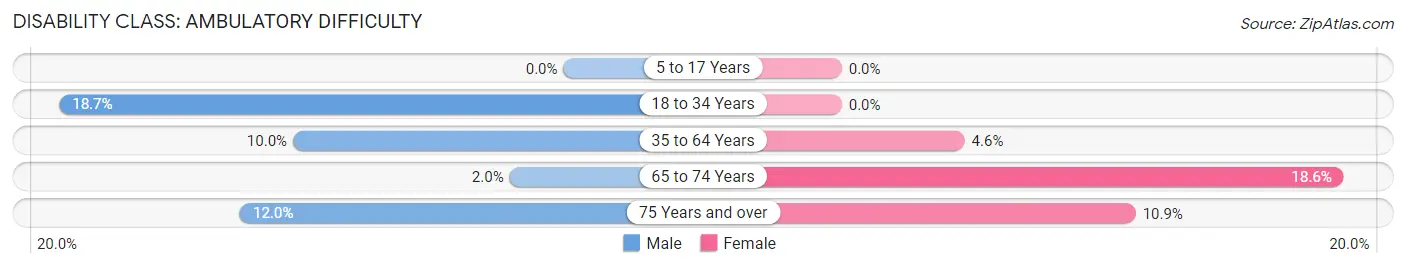
| Age Bracket | Male | Female |
| 5 to 17 Years | 0 (0.0%) | 0 (0.0%) |
| 18 to 34 Years | 29 (18.7%) | 0 (0.0%) |
| 35 to 64 Years | 68 (10.0%) | 32 (4.6%) |
| 65 to 74 Years | 4 (2.0%) | 30 (18.6%) |
| 75 Years and over | 24 (12.0%) | 18 (10.9%) |
Disability Class: Self-Care Difficulty
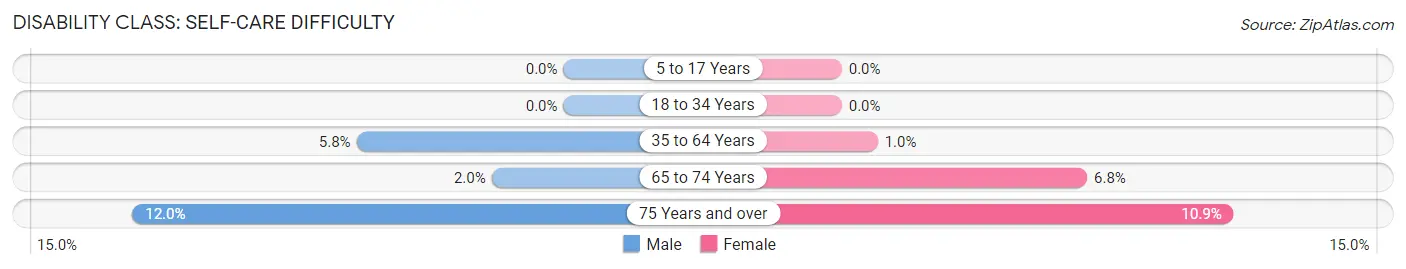
| Age Bracket | Male | Female |
| 5 to 17 Years | 0 (0.0%) | 0 (0.0%) |
| 18 to 34 Years | 0 (0.0%) | 0 (0.0%) |
| 35 to 64 Years | 39 (5.8%) | 7 (1.0%) |
| 65 to 74 Years | 4 (2.0%) | 11 (6.8%) |
| 75 Years and over | 24 (12.0%) | 18 (10.9%) |
Technology Access in Port St Joe
Computing Device Access in Port St Joe
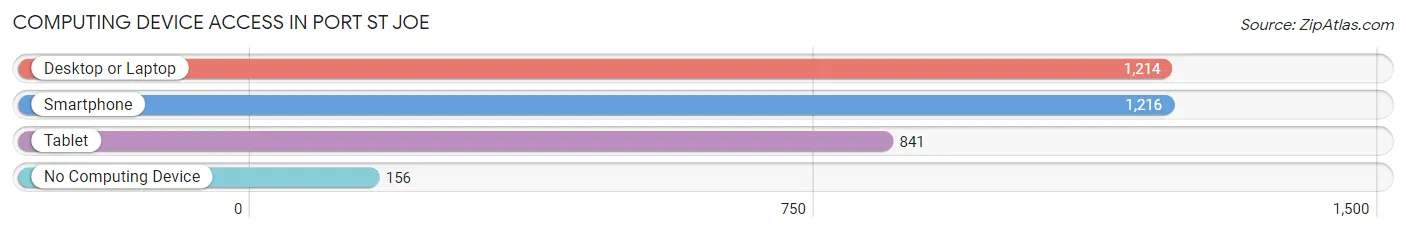
| Device Type | # Households | % Households |
| Desktop or Laptop | 1,214 | 81.4% |
| Smartphone | 1,216 | 81.5% |
| Tablet | 841 | 56.4% |
| No Computing Device | 156 | 10.5% |
| Total | 1,492 | 100.0% |
Internet Access in Port St Joe
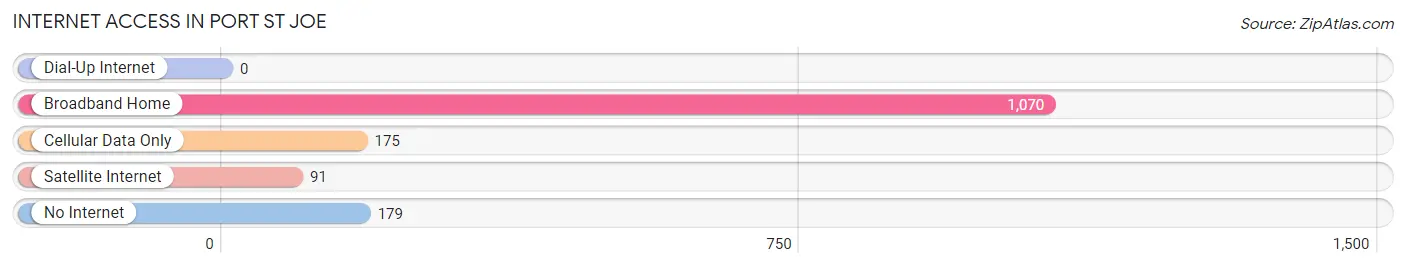
| Internet Type | # Households | % Households |
| Dial-Up Internet | 0 | 0.0% |
| Broadband Home | 1,070 | 71.7% |
| Cellular Data Only | 175 | 11.7% |
| Satellite Internet | 91 | 6.1% |
| No Internet | 179 | 12.0% |
| Total | 1,492 | 100.0% |
Port St Joe Summary
Port St. Joe is a small city located in the panhandle of Florida, in Gulf County. It is situated on the Gulf of Mexico, and is the county seat of Gulf County. The city is known for its beautiful beaches, fishing, and outdoor activities.
History
Port St. Joe was founded in 1835 by William Simmons and John Gorrie. The city was originally named Simmons Bayou, but was later changed to Port St. Joe in 1837. The city was named after Joseph W. St. Joe, a local landowner. The city was incorporated in 1909.
In the early 1900s, Port St. Joe was a major port for the lumber industry. The city was home to several sawmills and lumber companies, and was a major supplier of lumber to the rest of the country. The city was also home to a number of other industries, including a paper mill, a canning factory, and a shipbuilding company.
In the 1950s, the city began to experience a decline in its economy. The lumber industry had moved away, and the paper mill and canning factory had closed. The city was in need of a new economic base. In the 1960s, the city began to focus on tourism and recreation. The city was able to attract visitors with its beautiful beaches and outdoor activities.
Geography
Port St. Joe is located in the panhandle of Florida, in Gulf County. The city is situated on the Gulf of Mexico, and is bordered by the Apalachicola Bay to the east. The city is located about 30 miles south of Panama City, and about 90 miles east of Pensacola.
The city has a total area of 4.2 square miles, of which 0.2 square miles is water. The city is located at an elevation of 10 feet above sea level.
Economy
Port St. Joe’s economy is largely based on tourism and recreation. The city is home to several hotels, restaurants, and other businesses that cater to tourists. The city is also home to a number of marinas, which provide access to the Gulf of Mexico for fishing and other activities.
The city is also home to a number of manufacturing and industrial businesses. The city is home to a paper mill, a shipbuilding company, and a number of other businesses.
Demographics
As of the 2010 census, Port St. Joe had a population of 3,445. The city has a population density of 817.7 people per square mile. The median age of the population is 44.7 years.
The racial makeup of the city is 79.2% White, 15.3% African American, 0.3% Native American, 0.7% Asian, 0.1% Pacific Islander, and 4.4% from other races. The median household income is $37,917.
Conclusion
Port St. Joe is a small city located in the panhandle of Florida, in Gulf County. The city is known for its beautiful beaches, fishing, and outdoor activities. The city’s economy is largely based on tourism and recreation, and the city is home to a number of manufacturing and industrial businesses. As of the 2010 census, Port St. Joe had a population of 3,445. The city has a population density of 817.7 people per square mile, and the median age of the population is 44.7 years.
Common Questions
What is Per Capita Income in Port St Joe?
Per Capita income in Port St Joe is $32,412.
What is the Median Family Income in Port St Joe?
Median Family Income in Port St Joe is $77,750.
What is the Median Household income in Port St Joe?
Median Household Income in Port St Joe is $59,429.
What is Income or Wage Gap in Port St Joe?
Income or Wage Gap in Port St Joe is 3.5%.
Women in Port St Joe earn 96.5 cents for every dollar earned by a man.
What is Inequality or Gini Index in Port St Joe?
Inequality or Gini Index in Port St Joe is 0.38.
What is the Total Population of Port St Joe?
Total Population of Port St Joe is 3,533.
What is the Total Male Population of Port St Joe?
Total Male Population of Port St Joe is 1,716.
What is the Total Female Population of Port St Joe?
Total Female Population of Port St Joe is 1,817.
What is the Ratio of Males per 100 Females in Port St Joe?
There are 94.44 Males per 100 Females in Port St Joe.
What is the Ratio of Females per 100 Males in Port St Joe?
There are 105.89 Females per 100 Males in Port St Joe.
What is the Median Population Age in Port St Joe?
Median Population Age in Port St Joe is 52.1 Years.
What is the Average Family Size in Port St Joe
Average Family Size in Port St Joe is 2.7 People.
What is the Average Household Size in Port St Joe
Average Household Size in Port St Joe is 2.3 People.
How Large is the Labor Force in Port St Joe?
There are 1,560 People in the Labor Forcein in Port St Joe.
What is the Percentage of People in the Labor Force in Port St Joe?
55.4% of People are in the Labor Force in Port St Joe.
What is the Unemployment Rate in Port St Joe?
Unemployment Rate in Port St Joe is 5.3%.