San Carlos Park, FL Map & Demographics
San Carlos Park Map
San Carlos Park Overview
$31,212
PER CAPITA INCOME
$81,907
AVG FAMILY INCOME
$78,022
AVG HOUSEHOLD INCOME
22.3%
WAGE / INCOME GAP [ % ]
77.7¢/ $1
WAGE / INCOME GAP [ $ ]
0.36
INEQUALITY / GINI INDEX
18,888
TOTAL POPULATION
9,620
MALE POPULATION
9,268
FEMALE POPULATION
103.80
MALES / 100 FEMALES
96.34
FEMALES / 100 MALES
35.3
MEDIAN AGE
3.4
AVG FAMILY SIZE
3.0
AVG HOUSEHOLD SIZE
10,649
LABOR FORCE [ PEOPLE ]
69.6%
PERCENT IN LABOR FORCE
2.1%
UNEMPLOYMENT RATE
Income in San Carlos Park
Income Overview in San Carlos Park
Per Capita Income in San Carlos Park is $31,212, while median incomes of families and households are $81,907 and $78,022 respectively.
| Characteristic | Number | Measure |
| Per Capita Income | 18,888 | $31,212 |
| Median Family Income | 4,453 | $81,907 |
| Mean Family Income | 4,453 | $86,571 |
| Median Household Income | 6,291 | $78,022 |
| Mean Household Income | 6,291 | $84,348 |
| Income Deficit | 4,453 | $0 |
| Wage / Income Gap (%) | 18,888 | 22.30% |
| Wage / Income Gap ($) | 18,888 | 77.70¢ per $1 |
| Gini / Inequality Index | 18,888 | 0.36 |
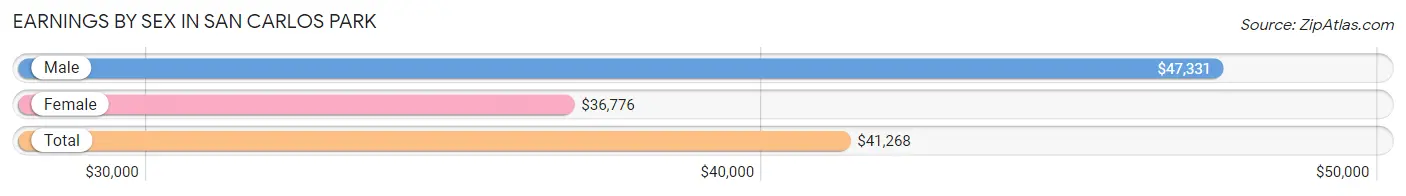
Earnings by Sex in San Carlos Park
Average Earnings in San Carlos Park are $41,268, $47,331 for men and $36,776 for women, a difference of 22.3%.
| Sex | Number | Average Earnings |
| Male | 5,870 (53.5%) | $47,331 |
| Female | 5,101 (46.5%) | $36,776 |
| Total | 10,971 (100.0%) | $41,268 |
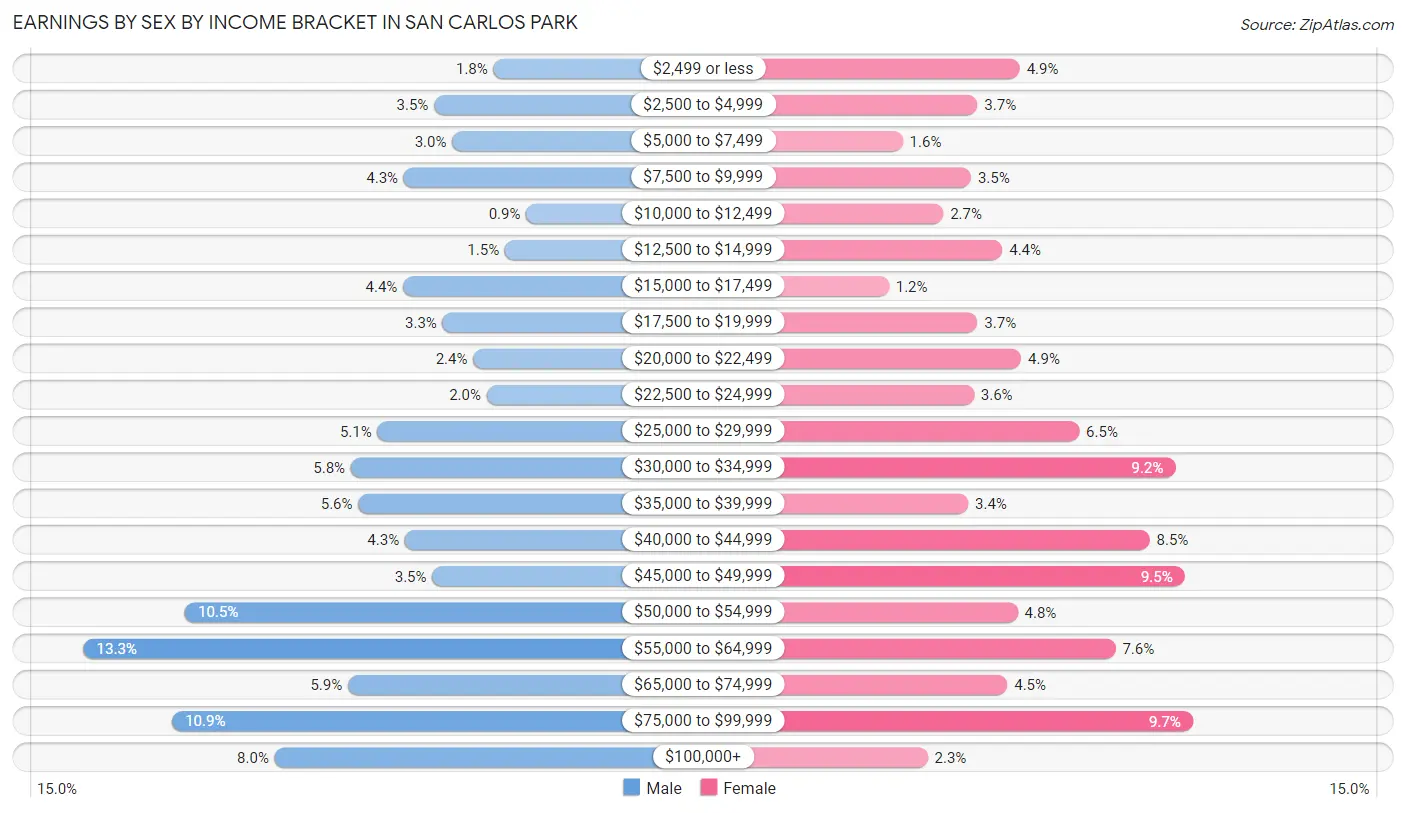
Earnings by Sex by Income Bracket in San Carlos Park
The most common earnings brackets in San Carlos Park are $55,000 to $64,999 for men (783 | 13.3%) and $75,000 to $99,999 for women (496 | 9.7%).
| Income | Male | Female |
| $2,499 or less | 107 (1.8%) | 248 (4.9%) |
| $2,500 to $4,999 | 205 (3.5%) | 187 (3.7%) |
| $5,000 to $7,499 | 175 (3.0%) | 80 (1.6%) |
| $7,500 to $9,999 | 255 (4.3%) | 178 (3.5%) |
| $10,000 to $12,499 | 53 (0.9%) | 138 (2.7%) |
| $12,500 to $14,999 | 88 (1.5%) | 223 (4.4%) |
| $15,000 to $17,499 | 256 (4.4%) | 60 (1.2%) |
| $17,500 to $19,999 | 191 (3.3%) | 187 (3.7%) |
| $20,000 to $22,499 | 140 (2.4%) | 250 (4.9%) |
| $22,500 to $24,999 | 118 (2.0%) | 182 (3.6%) |
| $25,000 to $29,999 | 298 (5.1%) | 333 (6.5%) |
| $30,000 to $34,999 | 342 (5.8%) | 471 (9.2%) |
| $35,000 to $39,999 | 330 (5.6%) | 174 (3.4%) |
| $40,000 to $44,999 | 253 (4.3%) | 434 (8.5%) |
| $45,000 to $49,999 | 208 (3.5%) | 484 (9.5%) |
| $50,000 to $54,999 | 616 (10.5%) | 245 (4.8%) |
| $55,000 to $64,999 | 783 (13.3%) | 385 (7.5%) |
| $65,000 to $74,999 | 347 (5.9%) | 230 (4.5%) |
| $75,000 to $99,999 | 637 (10.8%) | 496 (9.7%) |
| $100,000+ | 468 (8.0%) | 116 (2.3%) |
| Total | 5,870 (100.0%) | 5,101 (100.0%) |
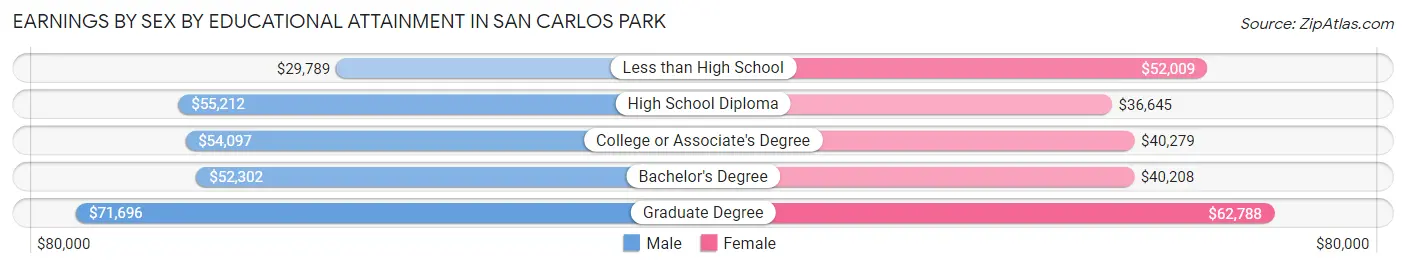
Earnings by Sex by Educational Attainment in San Carlos Park
Average earnings in San Carlos Park are $52,261 for men and $41,589 for women, a difference of 20.4%. Men with an educational attainment of graduate degree enjoy the highest average annual earnings of $71,696, while those with less than high school education earn the least with $29,789. Women with an educational attainment of graduate degree earn the most with the average annual earnings of $62,788, while those with high school diploma education have the smallest earnings of $36,645.
| Educational Attainment | Male Income | Female Income |
| Less than High School | $29,789 | $52,009 |
| High School Diploma | $55,212 | $36,645 |
| College or Associate's Degree | $54,097 | $40,279 |
| Bachelor's Degree | $52,302 | $40,208 |
| Graduate Degree | $71,696 | $62,788 |
| Total | $52,261 | $41,589 |
Family Income in San Carlos Park
Family Income Brackets in San Carlos Park
According to the San Carlos Park family income data, there are 1,274 families falling into the $75,000 to $99,999 income range, which is the most common income bracket and makes up 28.6% of all families. Conversely, the $10,000 to $14,999 income bracket is the least frequent group with only 27 families (0.6%) belonging to this category.
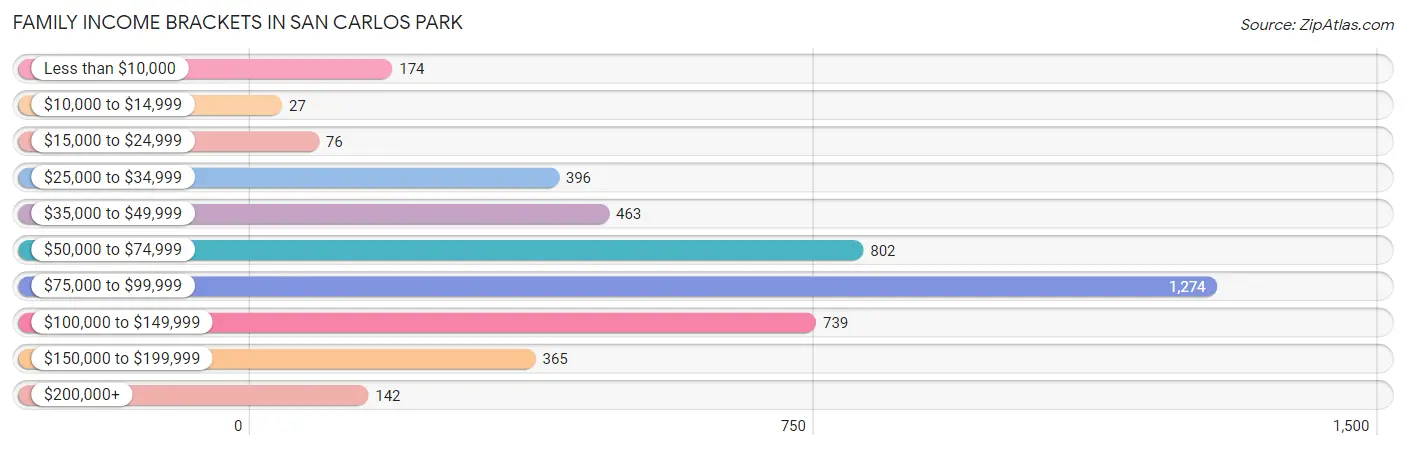
| Income Bracket | # Families | % Families |
| Less than $10,000 | 174 | 3.9% |
| $10,000 to $14,999 | 27 | 0.6% |
| $15,000 to $24,999 | 76 | 1.7% |
| $25,000 to $34,999 | 396 | 8.9% |
| $35,000 to $49,999 | 463 | 10.4% |
| $50,000 to $74,999 | 802 | 18.0% |
| $75,000 to $99,999 | 1,274 | 28.6% |
| $100,000 to $149,999 | 739 | 16.6% |
| $150,000 to $199,999 | 365 | 8.2% |
| $200,000+ | 142 | 3.2% |
Family Income by Famaliy Size in San Carlos Park
4-person families (976 | 21.9%) account for the highest median family income in San Carlos Park with $86,940 per family, while 2-person families (2,022 | 45.4%) have the highest median income of $33,180 per family member.
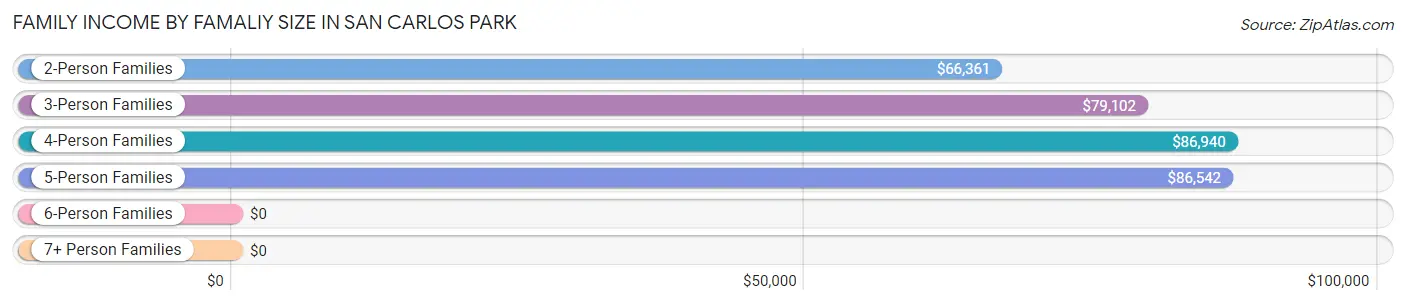
| Income Bracket | # Families | Median Income |
| 2-Person Families | 2,022 (45.4%) | $66,361 |
| 3-Person Families | 1,065 (23.9%) | $79,102 |
| 4-Person Families | 976 (21.9%) | $86,940 |
| 5-Person Families | 314 (7.0%) | $86,542 |
| 6-Person Families | 67 (1.5%) | $0 |
| 7+ Person Families | 9 (0.2%) | $0 |
| Total | 4,453 (100.0%) | $81,907 |
Family Income by Number of Earners in San Carlos Park
The median family income in San Carlos Park is $81,907, with families comprising 3+ earners (757) having the highest median family income of $98,883, while families with no earners (702) have the lowest median family income of $41,000, accounting for 17.0% and 15.8% of families, respectively.
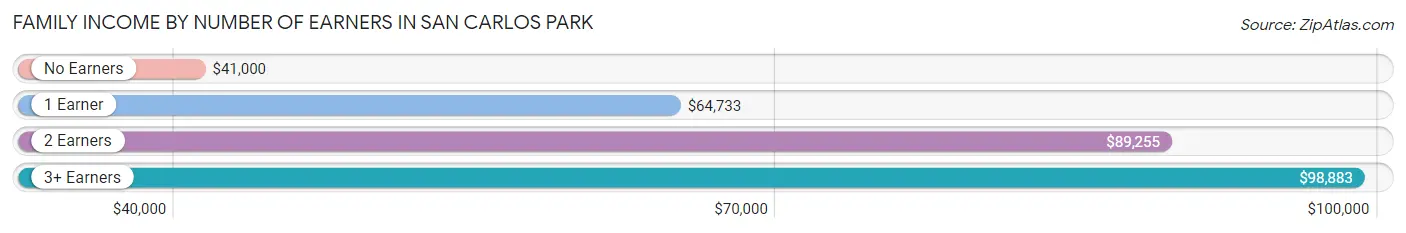
| Number of Earners | # Families | Median Income |
| No Earners | 702 (15.8%) | $41,000 |
| 1 Earner | 901 (20.2%) | $64,733 |
| 2 Earners | 2,093 (47.0%) | $89,255 |
| 3+ Earners | 757 (17.0%) | $98,883 |
| Total | 4,453 (100.0%) | $81,907 |
Household Income in San Carlos Park
Household Income Brackets in San Carlos Park
With 1,598 households falling in the category, the $75,000 to $99,999 income range is the most frequent in San Carlos Park, accounting for 25.4% of all households. In contrast, only 101 households (1.6%) fall into the $10,000 to $14,999 income bracket, making it the least populous group.
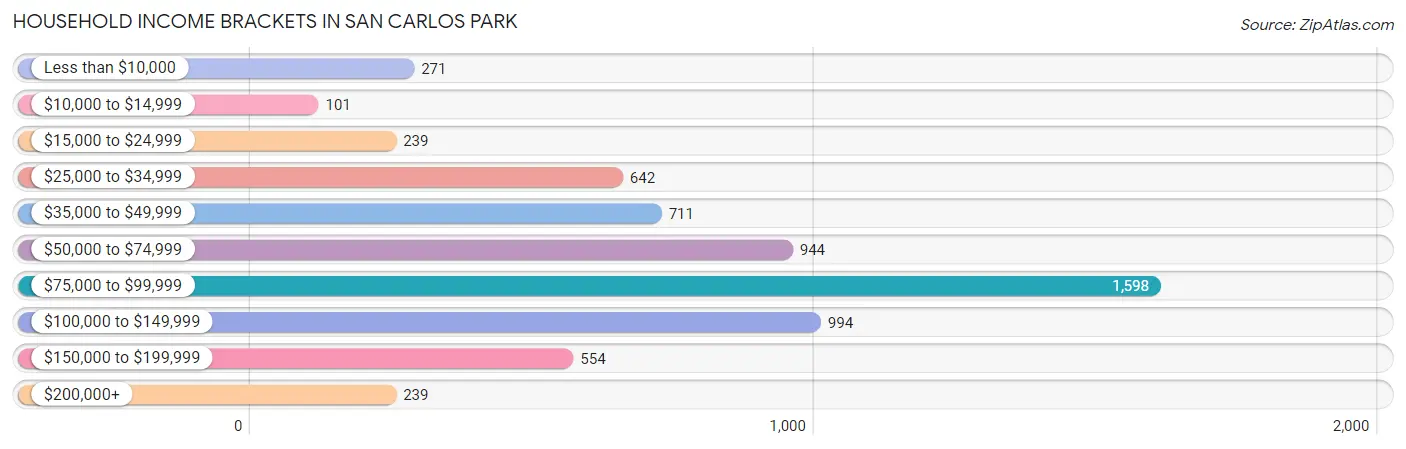
| Income Bracket | # Households | % Households |
| Less than $10,000 | 271 | 4.3% |
| $10,000 to $14,999 | 101 | 1.6% |
| $15,000 to $24,999 | 239 | 3.8% |
| $25,000 to $34,999 | 642 | 10.2% |
| $35,000 to $49,999 | 711 | 11.3% |
| $50,000 to $74,999 | 944 | 15.0% |
| $75,000 to $99,999 | 1,598 | 25.4% |
| $100,000 to $149,999 | 994 | 15.8% |
| $150,000 to $199,999 | 554 | 8.8% |
| $200,000+ | 239 | 3.8% |
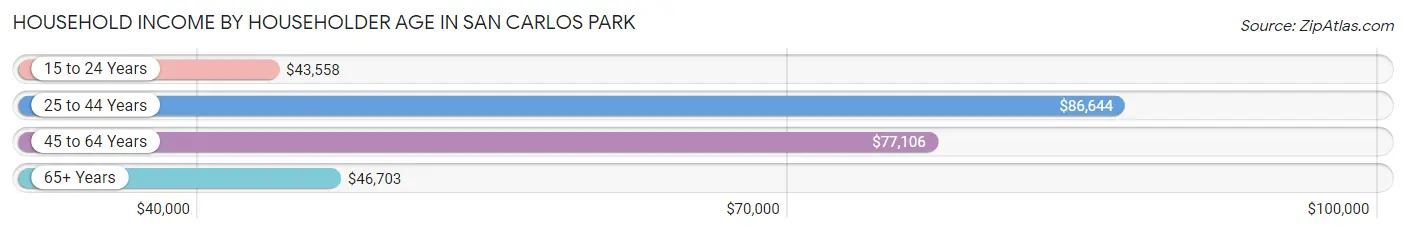
Household Income by Householder Age in San Carlos Park
The median household income in San Carlos Park is $78,022, with the highest median household income of $86,644 found in the 25 to 44 years age bracket for the primary householder. A total of 2,632 households (41.8%) fall into this category. Meanwhile, the 15 to 24 years age bracket for the primary householder has the lowest median household income of $43,558, with 287 households (4.6%) in this group.
| Income Bracket | # Households | Median Income |
| 15 to 24 Years | 287 (4.6%) | $43,558 |
| 25 to 44 Years | 2,632 (41.8%) | $86,644 |
| 45 to 64 Years | 1,972 (31.4%) | $77,106 |
| 65+ Years | 1,400 (22.3%) | $46,703 |
| Total | 6,291 (100.0%) | $78,022 |
Poverty in San Carlos Park
Income Below Poverty by Sex and Age in San Carlos Park
With 10.8% poverty level for males and 10.8% for females among the residents of San Carlos Park, 5 year old males and 18 to 24 year old females are the most vulnerable to poverty, with 13 males (40.6%) and 268 females (31.5%) in their respective age groups living below the poverty level.
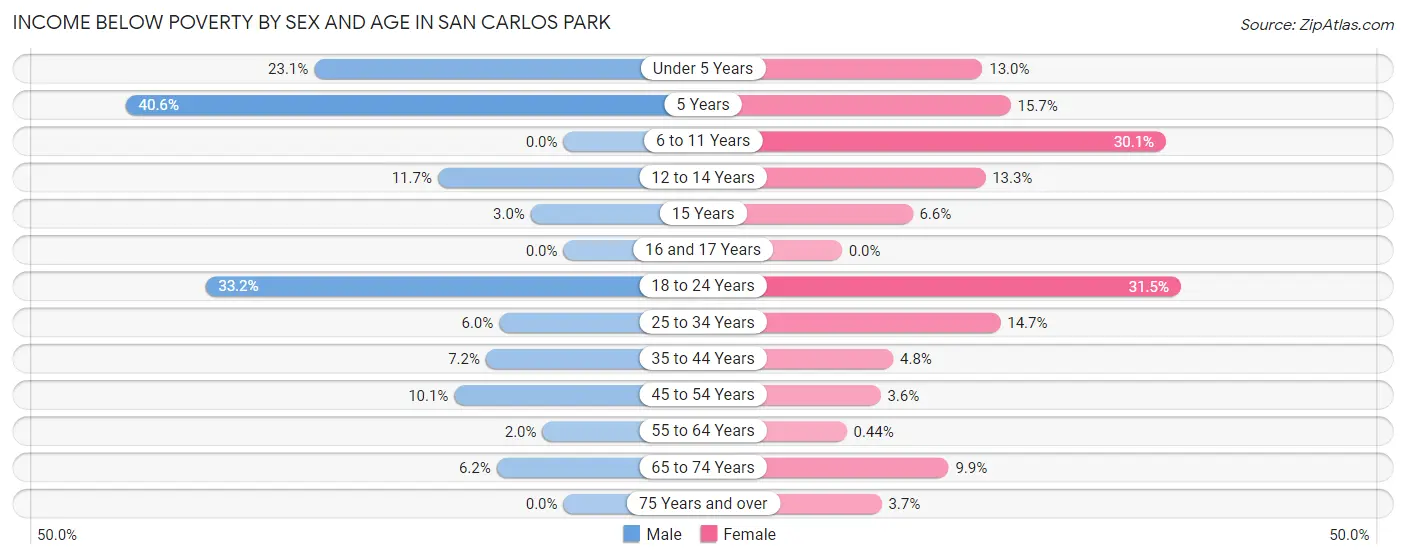
| Age Bracket | Male | Female |
| Under 5 Years | 124 (23.1%) | 72 (13.0%) |
| 5 Years | 13 (40.6%) | 21 (15.7%) |
| 6 to 11 Years | 0 (0.0%) | 179 (30.1%) |
| 12 to 14 Years | 33 (11.7%) | 37 (13.3%) |
| 15 Years | 9 (3.0%) | 12 (6.6%) |
| 16 and 17 Years | 0 (0.0%) | 0 (0.0%) |
| 18 to 24 Years | 514 (33.2%) | 268 (31.5%) |
| 25 to 34 Years | 101 (6.0%) | 179 (14.7%) |
| 35 to 44 Years | 95 (7.2%) | 73 (4.8%) |
| 45 to 54 Years | 97 (10.1%) | 32 (3.6%) |
| 55 to 64 Years | 19 (1.9%) | 5 (0.4%) |
| 65 to 74 Years | 29 (6.2%) | 101 (9.9%) |
| 75 Years and over | 0 (0.0%) | 20 (3.7%) |
| Total | 1,034 (10.8%) | 999 (10.8%) |
Income Above Poverty by Sex and Age in San Carlos Park
According to the poverty statistics in San Carlos Park, males aged 6 to 11 years and females aged 16 and 17 years are the age groups that are most secure financially, with 100.0% of males and 100.0% of females in these age groups living above the poverty line.
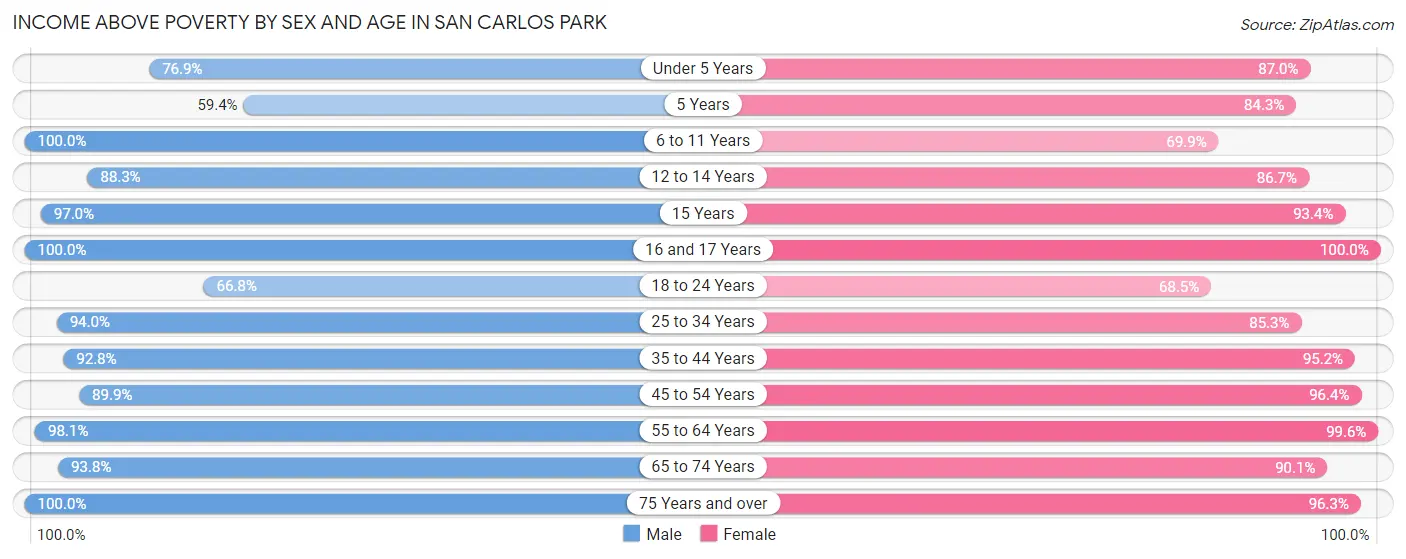
| Age Bracket | Male | Female |
| Under 5 Years | 412 (76.9%) | 480 (87.0%) |
| 5 Years | 19 (59.4%) | 113 (84.3%) |
| 6 to 11 Years | 601 (100.0%) | 416 (69.9%) |
| 12 to 14 Years | 250 (88.3%) | 241 (86.7%) |
| 15 Years | 288 (97.0%) | 171 (93.4%) |
| 16 and 17 Years | 201 (100.0%) | 257 (100.0%) |
| 18 to 24 Years | 1,033 (66.8%) | 584 (68.5%) |
| 25 to 34 Years | 1,593 (94.0%) | 1,038 (85.3%) |
| 35 to 44 Years | 1,224 (92.8%) | 1,462 (95.2%) |
| 45 to 54 Years | 861 (89.9%) | 860 (96.4%) |
| 55 to 64 Years | 953 (98.1%) | 1,144 (99.6%) |
| 65 to 74 Years | 439 (93.8%) | 919 (90.1%) |
| 75 Years and over | 677 (100.0%) | 523 (96.3%) |
| Total | 8,551 (89.2%) | 8,208 (89.1%) |
Income Below Poverty Among Married-Couple Families in San Carlos Park
The poverty statistics for married-couple families in San Carlos Park show that 4.2% or 127 of the total 3,043 families live below the poverty line. Families with 1 or 2 children have the highest poverty rate of 8.1%, comprising of 105 families. On the other hand, families with 5 or more children have the lowest poverty rate of 0.0%, which includes 0 families.
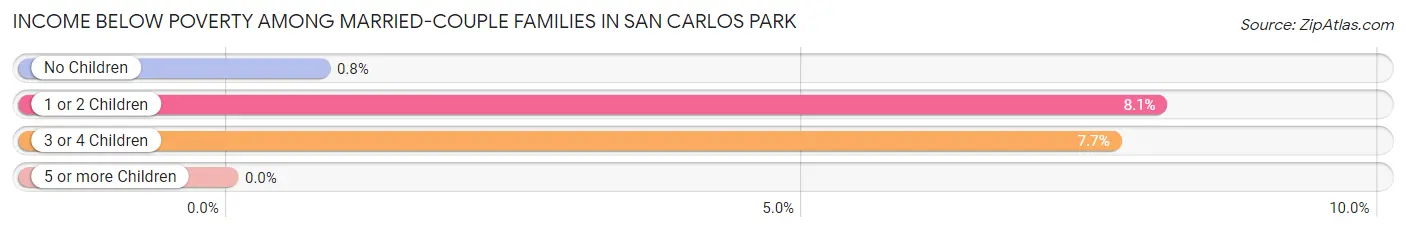
| Children | Above Poverty | Below Poverty |
| No Children | 1,606 (99.2%) | 13 (0.8%) |
| 1 or 2 Children | 1,193 (91.9%) | 105 (8.1%) |
| 3 or 4 Children | 108 (92.3%) | 9 (7.7%) |
| 5 or more Children | 9 (100.0%) | 0 (0.0%) |
| Total | 2,916 (95.8%) | 127 (4.2%) |
Income Below Poverty Among Single-Parent Households in San Carlos Park
According to the poverty data in San Carlos Park, 1.4% or 9 single-father households and 12.2% or 96 single-mother households are living below the poverty line. Among single-father households, those with 1 or 2 children have the highest poverty rate, with 9 households (1.8%) experiencing poverty. Likewise, among single-mother households, those with 3 or 4 children have the highest poverty rate, with 30 households (69.8%) falling below the poverty line.
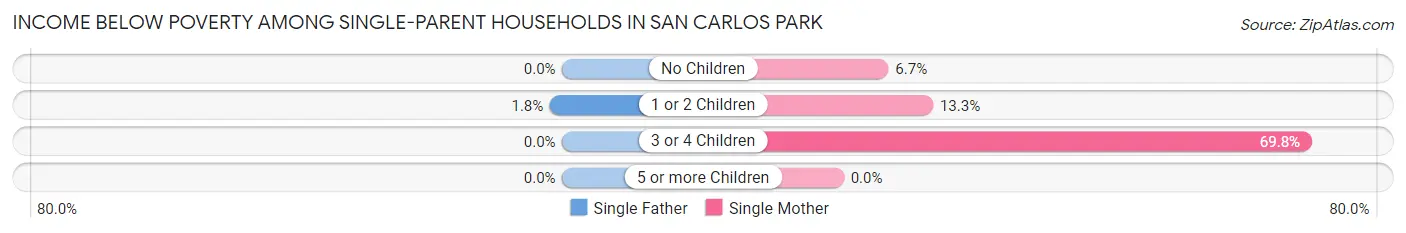
| Children | Single Father | Single Mother |
| No Children | 0 (0.0%) | 33 (6.7%) |
| 1 or 2 Children | 9 (1.8%) | 33 (13.3%) |
| 3 or 4 Children | 0 (0.0%) | 30 (69.8%) |
| 5 or more Children | 0 (0.0%) | 0 (0.0%) |
| Total | 9 (1.4%) | 96 (12.2%) |
Income Below Poverty Among Married-Couple vs Single-Parent Households in San Carlos Park
The poverty data for San Carlos Park shows that 127 of the married-couple family households (4.2%) and 105 of the single-parent households (7.4%) are living below the poverty level. Within the married-couple family households, those with 1 or 2 children have the highest poverty rate, with 105 households (8.1%) falling below the poverty line. Among the single-parent households, those with 3 or 4 children have the highest poverty rate, with 30 household (55.6%) living below poverty.
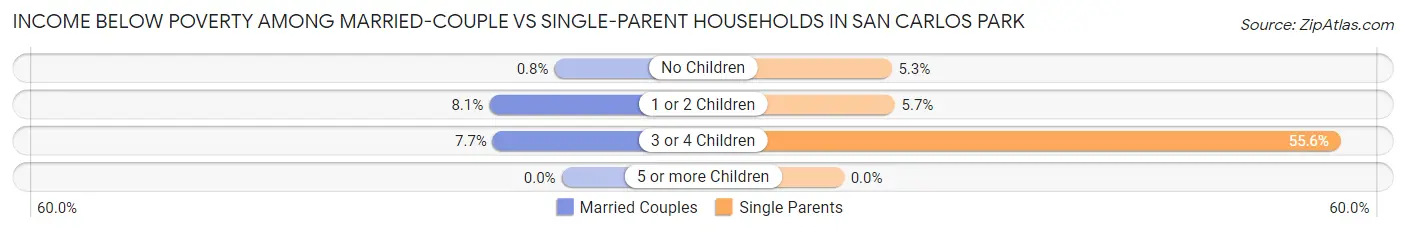
| Children | Married-Couple Families | Single-Parent Households |
| No Children | 13 (0.8%) | 33 (5.3%) |
| 1 or 2 Children | 105 (8.1%) | 42 (5.7%) |
| 3 or 4 Children | 9 (7.7%) | 30 (55.6%) |
| 5 or more Children | 0 (0.0%) | 0 (0.0%) |
| Total | 127 (4.2%) | 105 (7.4%) |
Race in San Carlos Park
The most populous races in San Carlos Park are White / Caucasian (12,935 | 68.5%), Hispanic or Latino (5,896 | 31.2%), and Two or more Races (3,163 | 16.8%).
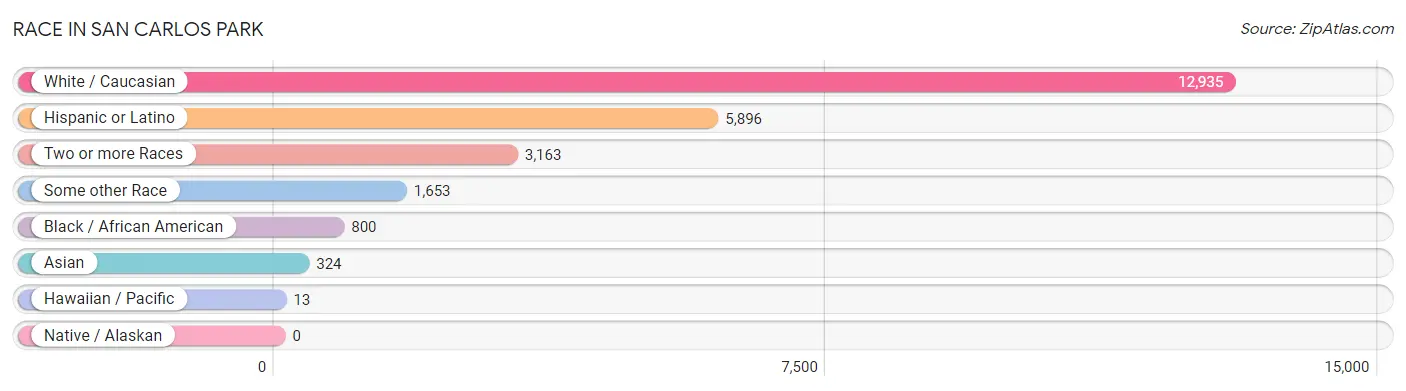
| Race | # Population | % Population |
| Asian | 324 | 1.7% |
| Black / African American | 800 | 4.2% |
| Hawaiian / Pacific | 13 | 0.1% |
| Hispanic or Latino | 5,896 | 31.2% |
| Native / Alaskan | 0 | 0.0% |
| White / Caucasian | 12,935 | 68.5% |
| Two or more Races | 3,163 | 16.8% |
| Some other Race | 1,653 | 8.7% |
| Total | 18,888 | 100.0% |
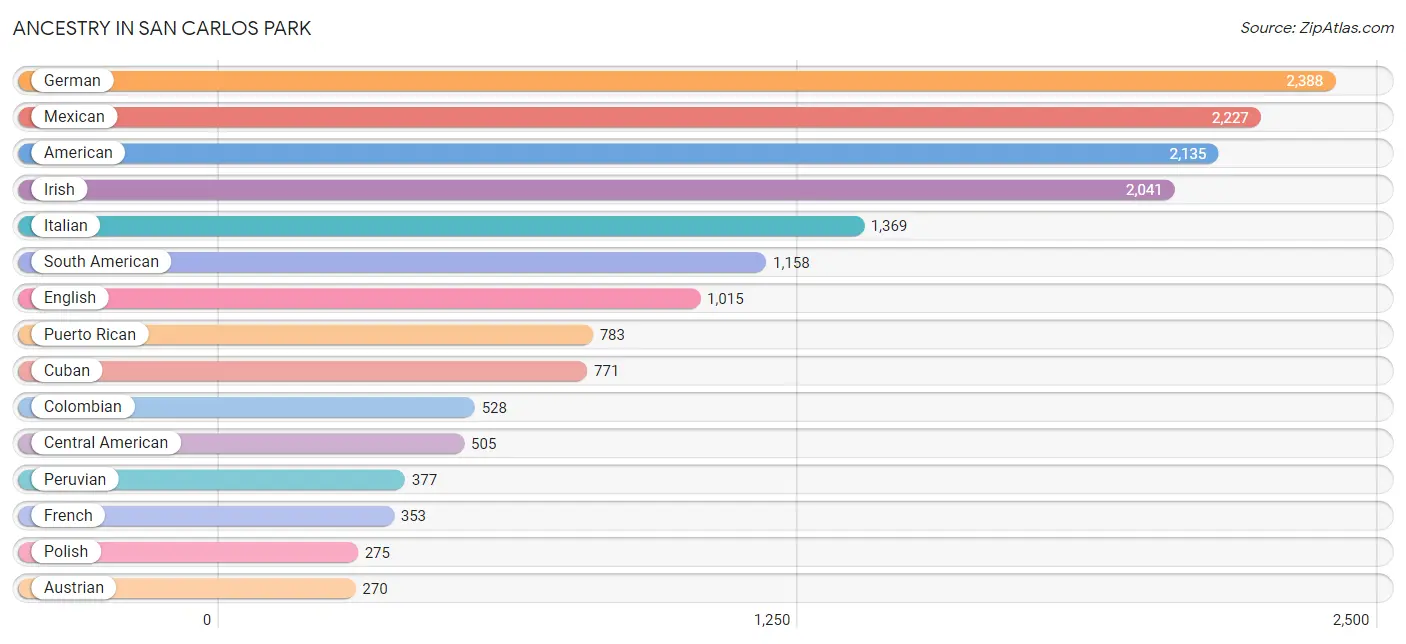
Ancestry in San Carlos Park
The most populous ancestries reported in San Carlos Park are German (2,388 | 12.6%), Mexican (2,227 | 11.8%), American (2,135 | 11.3%), Irish (2,041 | 10.8%), and Italian (1,369 | 7.2%), together accounting for 53.8% of all San Carlos Park residents.
| Ancestry | # Population | % Population |
| African | 32 | 0.2% |
| American | 2,135 | 11.3% |
| Apache | 22 | 0.1% |
| Argentinean | 98 | 0.5% |
| Austrian | 270 | 1.4% |
| Belizean | 136 | 0.7% |
| Bolivian | 56 | 0.3% |
| British | 20 | 0.1% |
| Canadian | 114 | 0.6% |
| Central American | 505 | 2.7% |
| Colombian | 528 | 2.8% |
| Costa Rican | 112 | 0.6% |
| Cuban | 771 | 4.1% |
| Czech | 47 | 0.3% |
| Danish | 13 | 0.1% |
| Dominican | 244 | 1.3% |
| Dutch | 163 | 0.9% |
| English | 1,015 | 5.4% |
| European | 176 | 0.9% |
| Finnish | 33 | 0.2% |
| French | 353 | 1.9% |
| French Canadian | 27 | 0.1% |
| German | 2,388 | 12.6% |
| Greek | 215 | 1.1% |
| Guatemalan | 195 | 1.0% |
| Haitian | 32 | 0.2% |
| Honduran | 61 | 0.3% |
| Hungarian | 5 | 0.0% |
| Indian (Asian) | 48 | 0.3% |
| Irish | 2,041 | 10.8% |
| Israeli | 12 | 0.1% |
| Italian | 1,369 | 7.2% |
| Jamaican | 49 | 0.3% |
| Korean | 203 | 1.1% |
| Lithuanian | 16 | 0.1% |
| Malaysian | 45 | 0.2% |
| Mexican | 2,227 | 11.8% |
| Mongolian | 11 | 0.1% |
| Native Hawaiian | 6 | 0.0% |
| Nicaraguan | 28 | 0.2% |
| Norwegian | 51 | 0.3% |
| Peruvian | 377 | 2.0% |
| Polish | 275 | 1.5% |
| Portuguese | 46 | 0.2% |
| Puerto Rican | 783 | 4.2% |
| Romanian | 16 | 0.1% |
| Russian | 25 | 0.1% |
| Salvadoran | 109 | 0.6% |
| Samoan | 7 | 0.0% |
| Scandinavian | 29 | 0.2% |
| Scotch-Irish | 71 | 0.4% |
| Scottish | 190 | 1.0% |
| Seminole | 35 | 0.2% |
| Sioux | 22 | 0.1% |
| Slovak | 23 | 0.1% |
| Slovene | 21 | 0.1% |
| South African | 81 | 0.4% |
| South American | 1,158 | 6.1% |
| Spaniard | 62 | 0.3% |
| Spanish | 23 | 0.1% |
| Sri Lankan | 206 | 1.1% |
| Subsaharan African | 113 | 0.6% |
| Swedish | 245 | 1.3% |
| Swiss | 19 | 0.1% |
| Trinidadian and Tobagonian | 109 | 0.6% |
| Ukrainian | 10 | 0.1% |
| Venezuelan | 99 | 0.5% |
| Welsh | 45 | 0.2% |
| West Indian | 117 | 0.6% | View All 69 Rows |
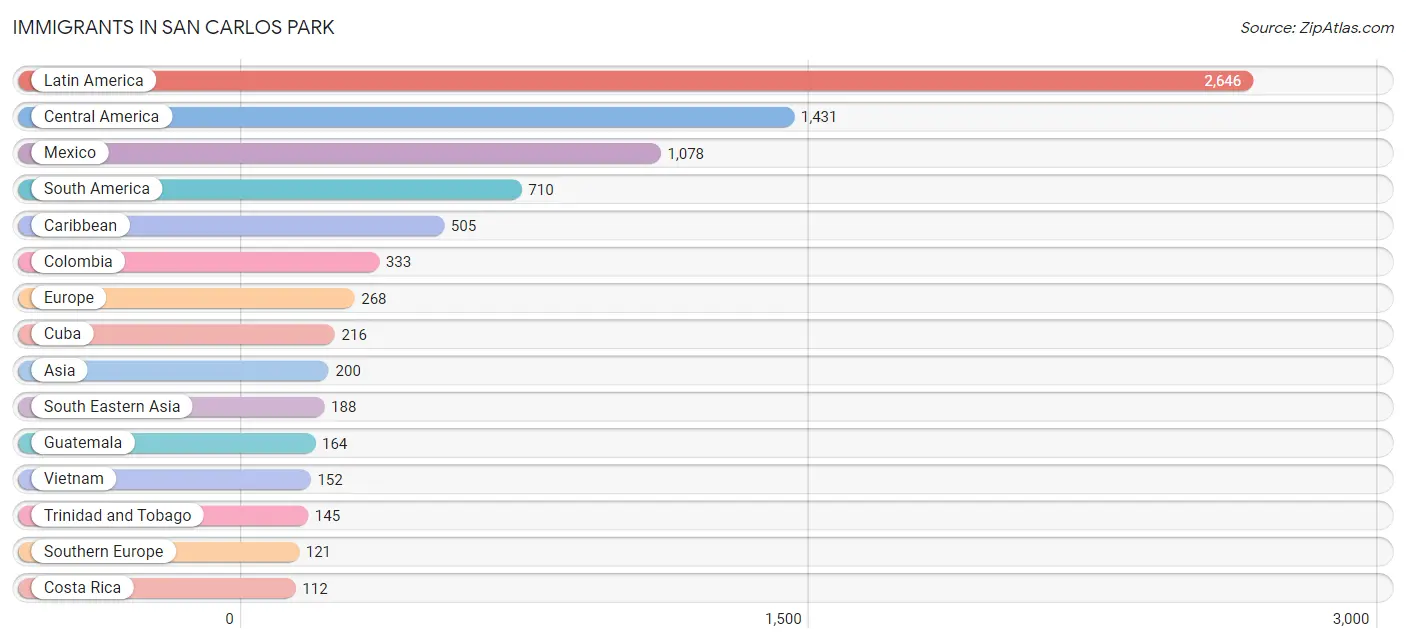
Immigrants in San Carlos Park
The most numerous immigrant groups reported in San Carlos Park came from Latin America (2,646 | 14.0%), Central America (1,431 | 7.6%), Mexico (1,078 | 5.7%), South America (710 | 3.8%), and Caribbean (505 | 2.7%), together accounting for 33.7% of all San Carlos Park residents.
| Immigration Origin | # Population | % Population |
| Africa | 90 | 0.5% |
| Argentina | 86 | 0.5% |
| Asia | 200 | 1.1% |
| Belize | 30 | 0.2% |
| Bolivia | 85 | 0.4% |
| Brazil | 28 | 0.2% |
| Canada | 69 | 0.4% |
| Caribbean | 505 | 2.7% |
| Central America | 1,431 | 7.6% |
| Colombia | 333 | 1.8% |
| Costa Rica | 112 | 0.6% |
| Cuba | 216 | 1.1% |
| Dominican Republic | 77 | 0.4% |
| Eastern Europe | 29 | 0.2% |
| Europe | 268 | 1.4% |
| Germany | 100 | 0.5% |
| Guatemala | 164 | 0.9% |
| Haiti | 15 | 0.1% |
| Honduras | 19 | 0.1% |
| Israel | 12 | 0.1% |
| Italy | 102 | 0.5% |
| Jamaica | 52 | 0.3% |
| Latin America | 2,646 | 14.0% |
| Malaysia | 11 | 0.1% |
| Mexico | 1,078 | 5.7% |
| Netherlands | 8 | 0.0% |
| Nicaragua | 28 | 0.2% |
| Northern Europe | 10 | 0.1% |
| Peru | 79 | 0.4% |
| Philippines | 25 | 0.1% |
| Poland | 3 | 0.0% |
| Portugal | 19 | 0.1% |
| Romania | 16 | 0.1% |
| South Africa | 90 | 0.5% |
| South America | 710 | 3.8% |
| South Eastern Asia | 188 | 1.0% |
| Southern Europe | 121 | 0.6% |
| Trinidad and Tobago | 145 | 0.8% |
| Ukraine | 10 | 0.1% |
| Venezuela | 99 | 0.5% |
| Vietnam | 152 | 0.8% |
| Western Asia | 12 | 0.1% |
| Western Europe | 108 | 0.6% | View All 43 Rows |
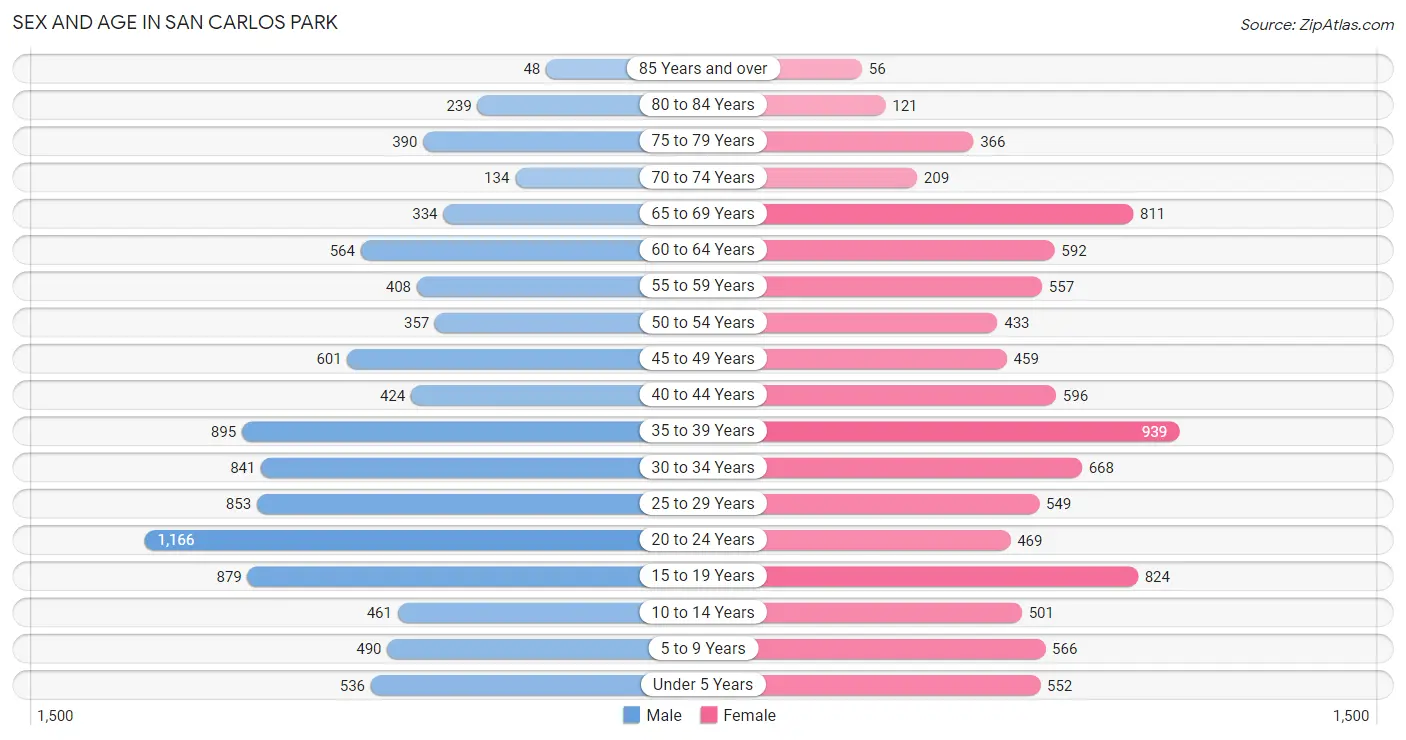
Sex and Age in San Carlos Park
Sex and Age in San Carlos Park
The most populous age groups in San Carlos Park are 20 to 24 Years (1,166 | 12.1%) for men and 35 to 39 Years (939 | 10.1%) for women.
| Age Bracket | Male | Female |
| Under 5 Years | 536 (5.6%) | 552 (6.0%) |
| 5 to 9 Years | 490 (5.1%) | 566 (6.1%) |
| 10 to 14 Years | 461 (4.8%) | 501 (5.4%) |
| 15 to 19 Years | 879 (9.1%) | 824 (8.9%) |
| 20 to 24 Years | 1,166 (12.1%) | 469 (5.1%) |
| 25 to 29 Years | 853 (8.9%) | 549 (5.9%) |
| 30 to 34 Years | 841 (8.7%) | 668 (7.2%) |
| 35 to 39 Years | 895 (9.3%) | 939 (10.1%) |
| 40 to 44 Years | 424 (4.4%) | 596 (6.4%) |
| 45 to 49 Years | 601 (6.2%) | 459 (5.0%) |
| 50 to 54 Years | 357 (3.7%) | 433 (4.7%) |
| 55 to 59 Years | 408 (4.2%) | 557 (6.0%) |
| 60 to 64 Years | 564 (5.9%) | 592 (6.4%) |
| 65 to 69 Years | 334 (3.5%) | 811 (8.7%) |
| 70 to 74 Years | 134 (1.4%) | 209 (2.3%) |
| 75 to 79 Years | 390 (4.1%) | 366 (4.0%) |
| 80 to 84 Years | 239 (2.5%) | 121 (1.3%) |
| 85 Years and over | 48 (0.5%) | 56 (0.6%) |
| Total | 9,620 (100.0%) | 9,268 (100.0%) |
Families and Households in San Carlos Park
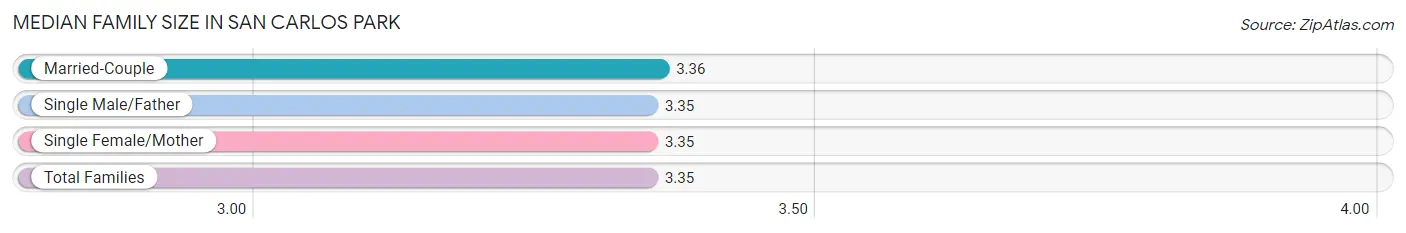
Median Family Size in San Carlos Park
The median family size in San Carlos Park is 3.35 persons per family, with married-couple families (3,043 | 68.3%) accounting for the largest median family size of 3.36 persons per family. On the other hand, single male/father families (624 | 14.0%) represent the smallest median family size with 3.35 persons per family.
| Family Type | # Families | Family Size |
| Married-Couple | 3,043 (68.3%) | 3.36 |
| Single Male/Father | 624 (14.0%) | 3.35 |
| Single Female/Mother | 786 (17.6%) | 3.35 |
| Total Families | 4,453 (100.0%) | 3.35 |
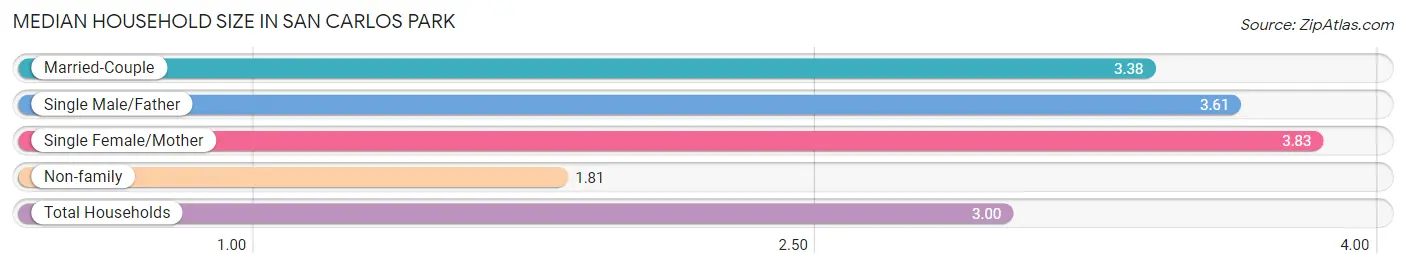
Median Household Size in San Carlos Park
The median household size in San Carlos Park is 3.00 persons per household, with single female/mother households (786 | 12.5%) accounting for the largest median household size of 3.83 persons per household. non-family households (1,838 | 29.2%) represent the smallest median household size with 1.81 persons per household.
| Household Type | # Households | Household Size |
| Married-Couple | 3,043 (48.4%) | 3.38 |
| Single Male/Father | 624 (9.9%) | 3.61 |
| Single Female/Mother | 786 (12.5%) | 3.83 |
| Non-family | 1,838 (29.2%) | 1.81 |
| Total Households | 6,291 (100.0%) | 3.00 |
Household Size by Marriage Status in San Carlos Park
Out of a total of 6,291 households in San Carlos Park, 4,453 (70.8%) are family households, while 1,838 (29.2%) are nonfamily households. The most numerous type of family households are 2-person households, comprising 1,809, and the most common type of nonfamily households are 1-person households, comprising 1,086.
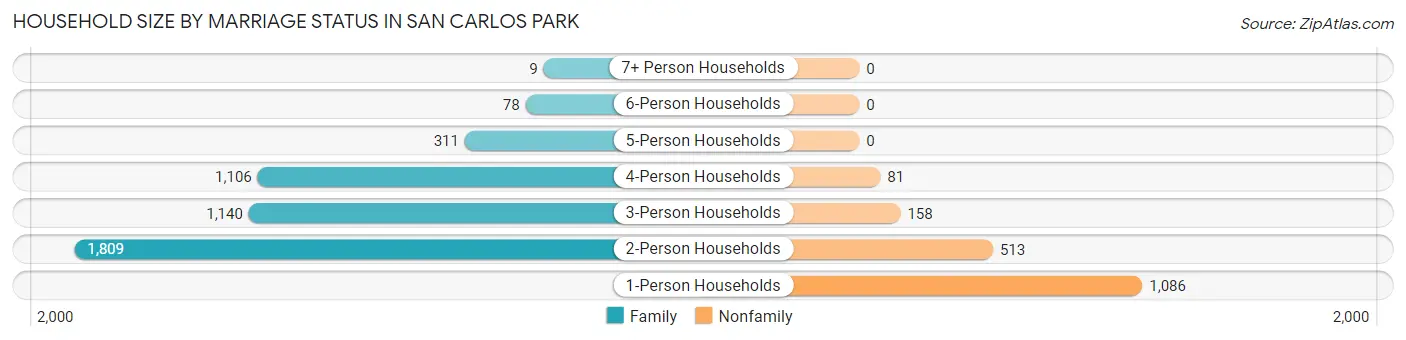
| Household Size | Family Households | Nonfamily Households |
| 1-Person Households | - | 1,086 (17.3%) |
| 2-Person Households | 1,809 (28.8%) | 513 (8.2%) |
| 3-Person Households | 1,140 (18.1%) | 158 (2.5%) |
| 4-Person Households | 1,106 (17.6%) | 81 (1.3%) |
| 5-Person Households | 311 (4.9%) | 0 (0.0%) |
| 6-Person Households | 78 (1.2%) | 0 (0.0%) |
| 7+ Person Households | 9 (0.1%) | 0 (0.0%) |
| Total | 4,453 (70.8%) | 1,838 (29.2%) |
Female Fertility in San Carlos Park
Fertility by Age in San Carlos Park
Average fertility rate in San Carlos Park is 38.0 births per 1,000 women. Women in the age bracket of 20 to 34 years have the highest fertility rate with 88.0 births per 1,000 women. Women in the age bracket of 20 to 34 years acount for 86.6% of all women with births.
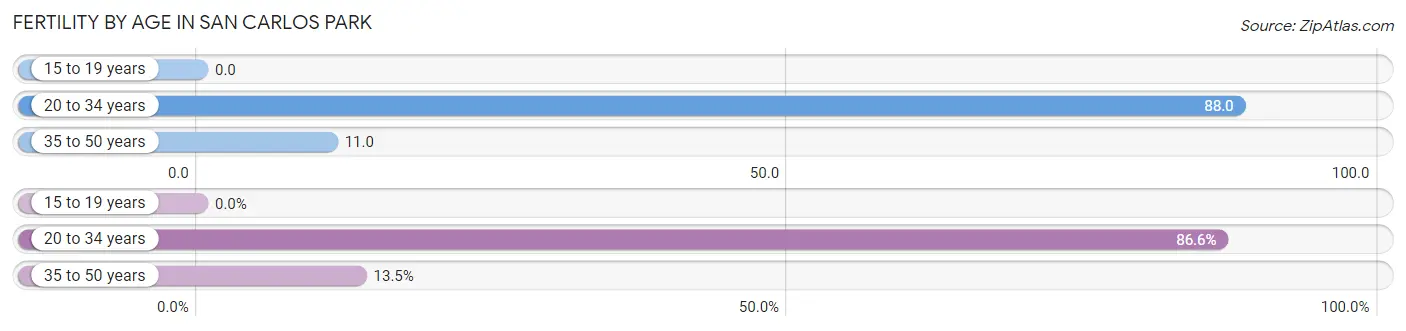
| Age Bracket | Women with Births | Births / 1,000 Women |
| 15 to 19 years | 0 (0.0%) | 0.0 |
| 20 to 34 years | 148 (86.6%) | 88.0 |
| 35 to 50 years | 23 (13.5%) | 11.0 |
| Total | 171 (100.0%) | 38.0 |
Fertility by Age by Marriage Status in San Carlos Park
58.5% of women with births (171) in San Carlos Park are married. The highest percentage of unmarried women with births falls into 20 to 34 years age bracket with 48.0% of them unmarried at the time of birth, while the lowest percentage of unmarried women with births belong to 35 to 50 years age bracket with 0.0% of them unmarried.
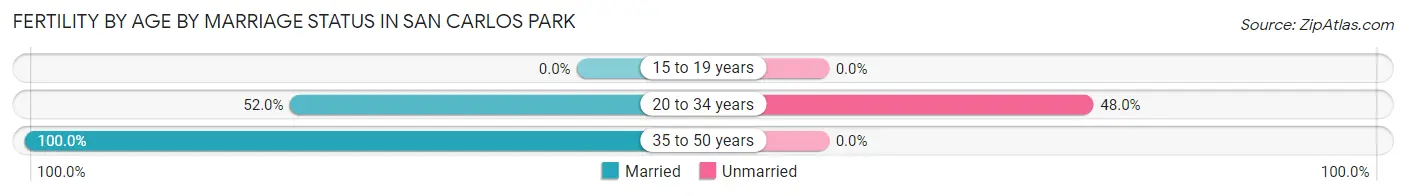
| Age Bracket | Married | Unmarried |
| 15 to 19 years | 0 (0.0%) | 0 (0.0%) |
| 20 to 34 years | 77 (52.0%) | 71 (48.0%) |
| 35 to 50 years | 23 (100.0%) | 0 (0.0%) |
| Total | 100 (58.5%) | 71 (41.5%) |
Fertility by Education in San Carlos Park
Average fertility rate in San Carlos Park is 38.0 births per 1,000 women. Women with the education attainment of graduate degree have the highest fertility rate of 134.0 births per 1,000 women, while women with the education attainment of less than high school have the lowest fertility at 9.0 births per 1,000 women. Women with the education attainment of bachelor's degree represent 36.8% of all women with births.
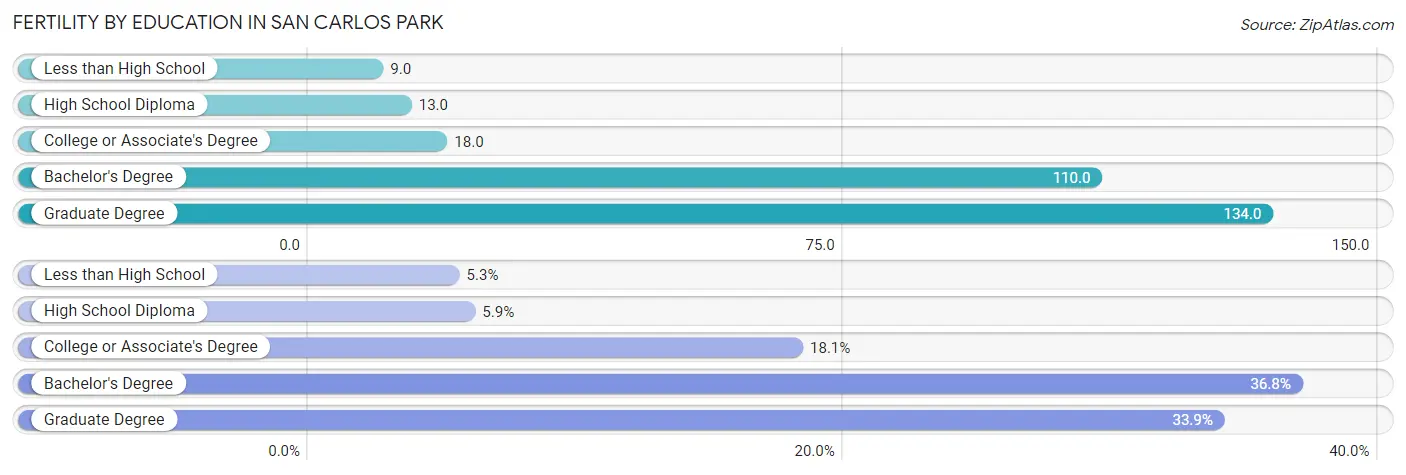
| Educational Attainment | Women with Births | Births / 1,000 Women |
| Less than High School | 9 (5.3%) | 9.0 |
| High School Diploma | 10 (5.9%) | 13.0 |
| College or Associate's Degree | 31 (18.1%) | 18.0 |
| Bachelor's Degree | 63 (36.8%) | 110.0 |
| Graduate Degree | 58 (33.9%) | 134.0 |
| Total | 171 (100.0%) | 38.0 |
Fertility by Education by Marriage Status in San Carlos Park
41.5% of women with births in San Carlos Park are unmarried. Women with the educational attainment of less than high school are most likely to be married with 100.0% of them married at childbirth, while women with the educational attainment of bachelor's degree are least likely to be married with 100.0% of them unmarried at childbirth.
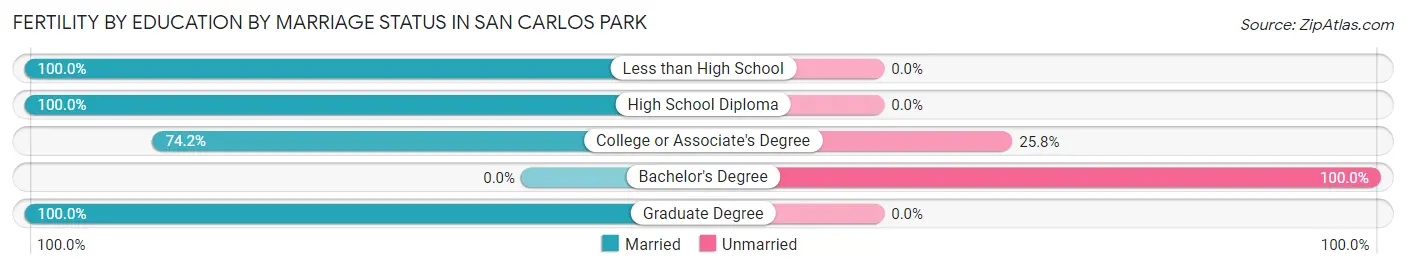
| Educational Attainment | Married | Unmarried |
| Less than High School | 9 (100.0%) | 0 (0.0%) |
| High School Diploma | 10 (100.0%) | 0 (0.0%) |
| College or Associate's Degree | 23 (74.2%) | 8 (25.8%) |
| Bachelor's Degree | 0 (0.0%) | 63 (100.0%) |
| Graduate Degree | 58 (100.0%) | 0 (0.0%) |
| Total | 100 (58.5%) | 71 (41.5%) |
Employment Characteristics in San Carlos Park
Employment by Class of Employer in San Carlos Park
Among the 10,237 employed individuals in San Carlos Park, private company employees (7,462 | 72.9%), local government employees (838 | 8.2%), and not-for-profit organizations (750 | 7.3%) make up the most common classes of employment.
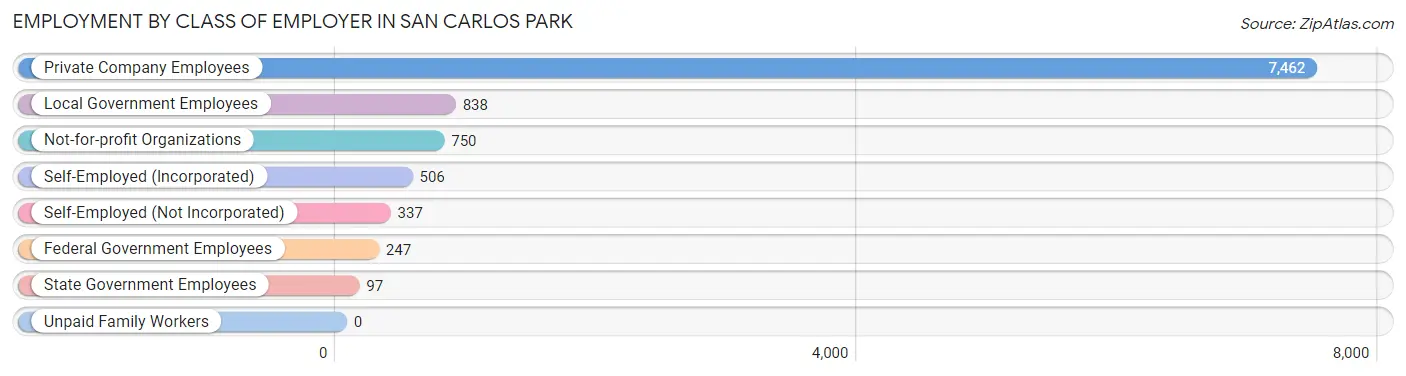
| Employer Class | # Employees | % Employees |
| Private Company Employees | 7,462 | 72.9% |
| Self-Employed (Incorporated) | 506 | 4.9% |
| Self-Employed (Not Incorporated) | 337 | 3.3% |
| Not-for-profit Organizations | 750 | 7.3% |
| Local Government Employees | 838 | 8.2% |
| State Government Employees | 97 | 0.9% |
| Federal Government Employees | 247 | 2.4% |
| Unpaid Family Workers | 0 | 0.0% |
| Total | 10,237 | 100.0% |
Employment Status by Age in San Carlos Park
According to the labor force statistics for San Carlos Park, out of the total population over 16 years of age (15,301), 69.6% or 10,649 individuals are in the labor force, with 2.1% or 224 of them unemployed. The age group with the highest labor force participation rate is 30 to 34 years, with 89.3% or 1,348 individuals in the labor force. Within the labor force, the 16 to 19 years age range has the highest percentage of unemployed individuals, with 6.8% or 58 of them being unemployed.
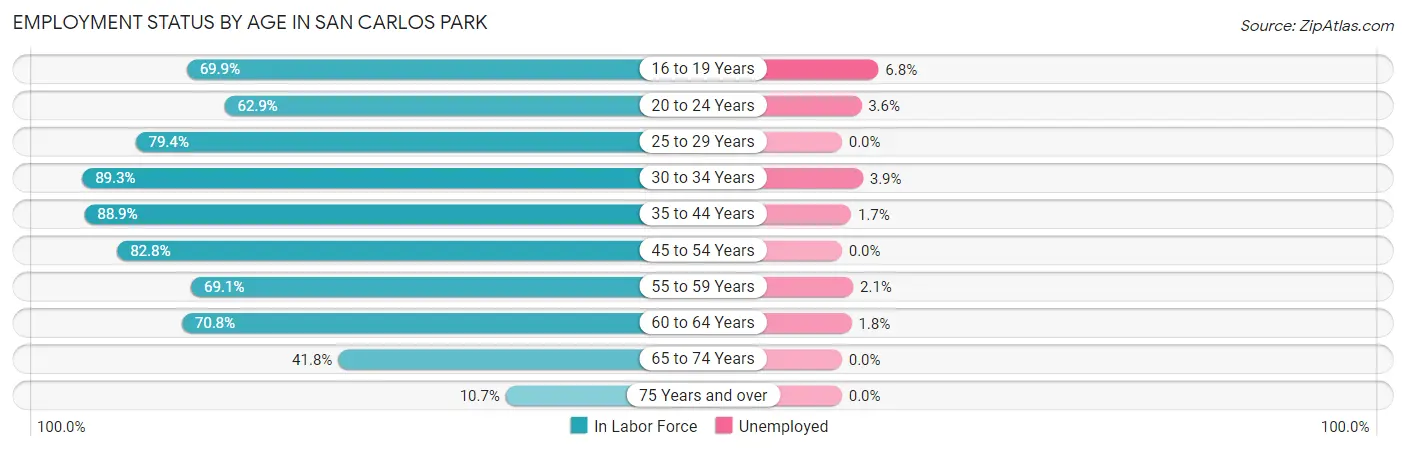
| Age Bracket | In Labor Force | Unemployed |
| 16 to 19 Years | 854 (69.9%) | 58 (6.8%) |
| 20 to 24 Years | 1,028 (62.9%) | 37 (3.6%) |
| 25 to 29 Years | 1,113 (79.4%) | 0 (0.0%) |
| 30 to 34 Years | 1,348 (89.3%) | 53 (3.9%) |
| 35 to 44 Years | 2,537 (88.9%) | 43 (1.7%) |
| 45 to 54 Years | 1,532 (82.8%) | 0 (0.0%) |
| 55 to 59 Years | 667 (69.1%) | 14 (2.1%) |
| 60 to 64 Years | 818 (70.8%) | 15 (1.8%) |
| 65 to 74 Years | 622 (41.8%) | 0 (0.0%) |
| 75 Years and over | 131 (10.7%) | 0 (0.0%) |
| Total | 10,649 (69.6%) | 224 (2.1%) |
Employment Status by Educational Attainment in San Carlos Park
According to labor force statistics for San Carlos Park, 82.3% of individuals (8,013) out of the total population between 25 and 64 years of age (9,736) are in the labor force, with 1.6% or 128 of them being unemployed. The group with the highest labor force participation rate are those with the educational attainment of college / associate degree, with 87.9% or 3,142 individuals in the labor force. Within the labor force, individuals with less than high school education have the highest percentage of unemployment, with 7.3% or 51 of them being unemployed.
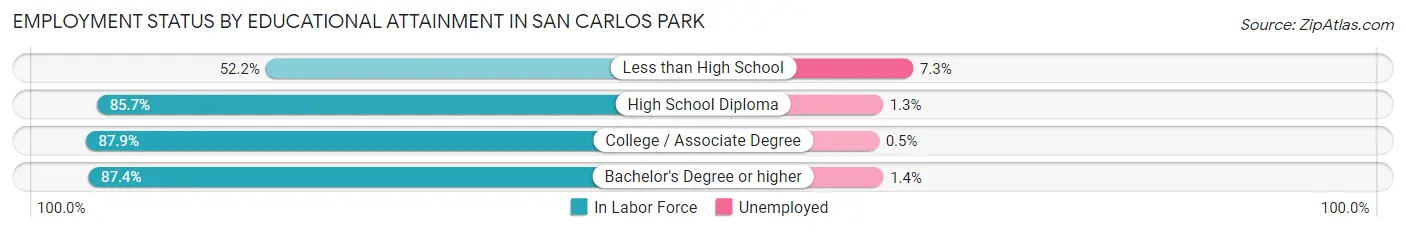
| Educational Attainment | In Labor Force | Unemployed |
| Less than High School | 698 (52.2%) | 98 (7.3%) |
| High School Diploma | 2,186 (85.7%) | 33 (1.3%) |
| College / Associate Degree | 3,142 (87.9%) | 18 (0.5%) |
| Bachelor's Degree or higher | 1,987 (87.4%) | 32 (1.4%) |
| Total | 8,013 (82.3%) | 156 (1.6%) |
Employment Occupations by Sex in San Carlos Park
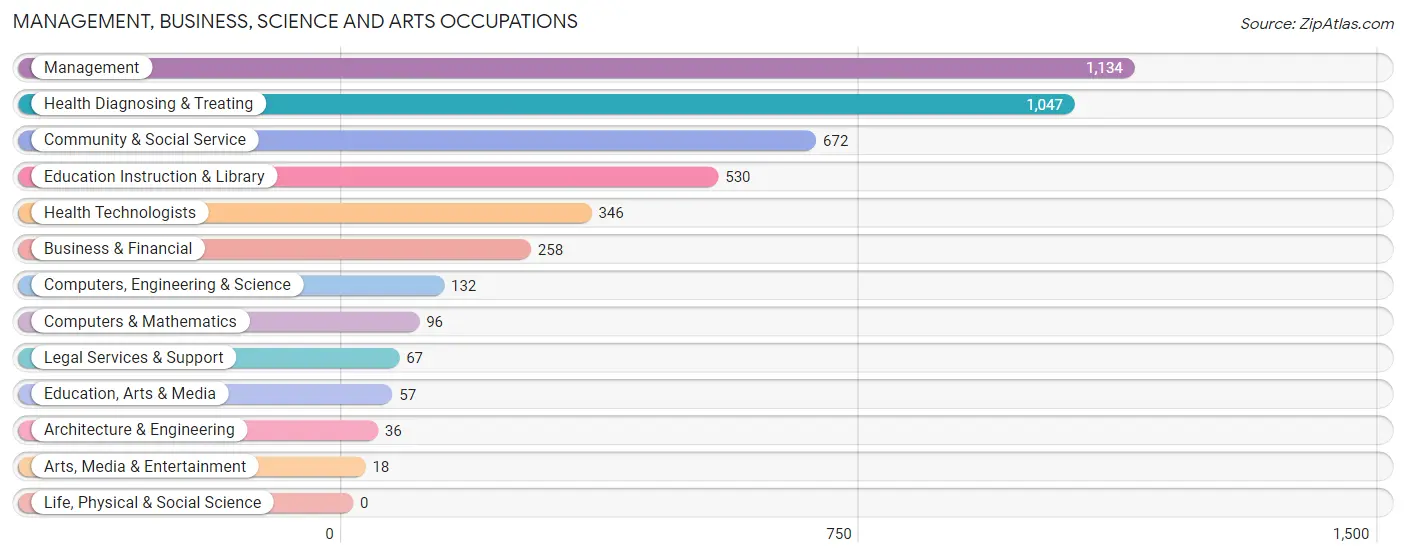
Management, Business, Science and Arts Occupations
The most common Management, Business, Science and Arts occupations in San Carlos Park are Management (1,134 | 10.9%), Health Diagnosing & Treating (1,047 | 10.0%), Community & Social Service (672 | 6.4%), Education Instruction & Library (530 | 5.1%), and Health Technologists (346 | 3.3%).
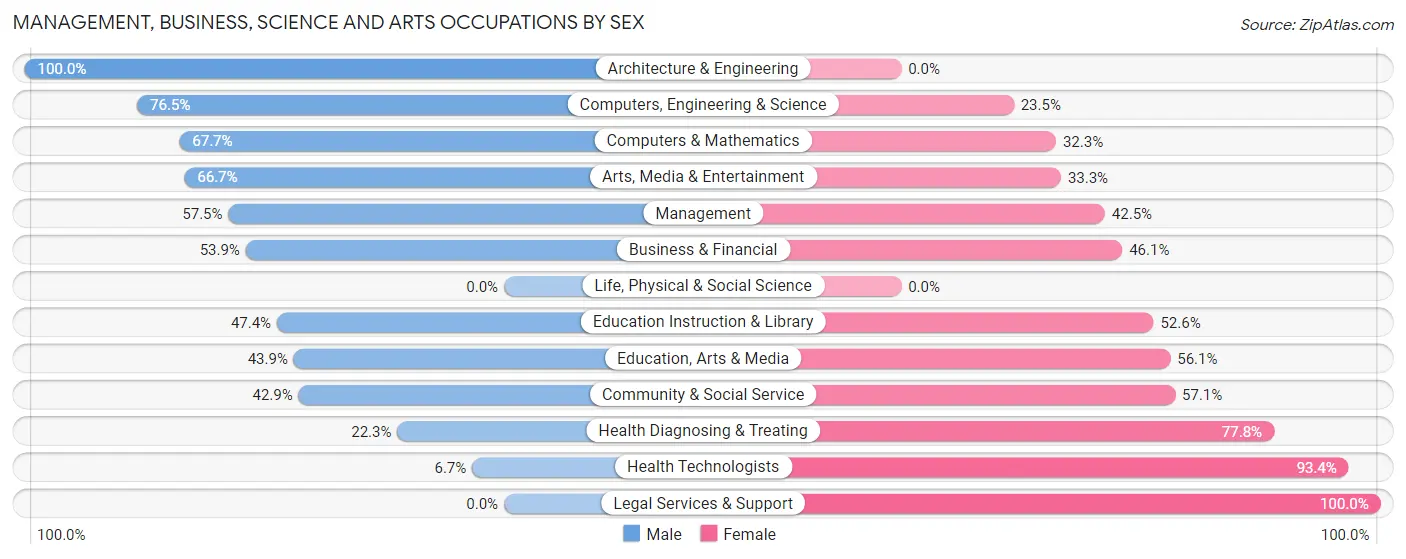
Management, Business, Science and Arts Occupations by Sex
Within the Management, Business, Science and Arts occupations in San Carlos Park, the most male-oriented occupations are Architecture & Engineering (100.0%), Computers, Engineering & Science (76.5%), and Computers & Mathematics (67.7%), while the most female-oriented occupations are Legal Services & Support (100.0%), Health Technologists (93.3%), and Health Diagnosing & Treating (77.7%).
| Occupation | Male | Female |
| Management | 652 (57.5%) | 482 (42.5%) |
| Business & Financial | 139 (53.9%) | 119 (46.1%) |
| Computers, Engineering & Science | 101 (76.5%) | 31 (23.5%) |
| Computers & Mathematics | 65 (67.7%) | 31 (32.3%) |
| Architecture & Engineering | 36 (100.0%) | 0 (0.0%) |
| Life, Physical & Social Science | 0 (0.0%) | 0 (0.0%) |
| Community & Social Service | 288 (42.9%) | 384 (57.1%) |
| Education, Arts & Media | 25 (43.9%) | 32 (56.1%) |
| Legal Services & Support | 0 (0.0%) | 67 (100.0%) |
| Education Instruction & Library | 251 (47.4%) | 279 (52.6%) |
| Arts, Media & Entertainment | 12 (66.7%) | 6 (33.3%) |
| Health Diagnosing & Treating | 233 (22.3%) | 814 (77.7%) |
| Health Technologists | 23 (6.7%) | 323 (93.3%) |
| Total (Category) | 1,413 (43.6%) | 1,830 (56.4%) |
| Total (Overall) | 5,610 (53.8%) | 4,820 (46.2%) |
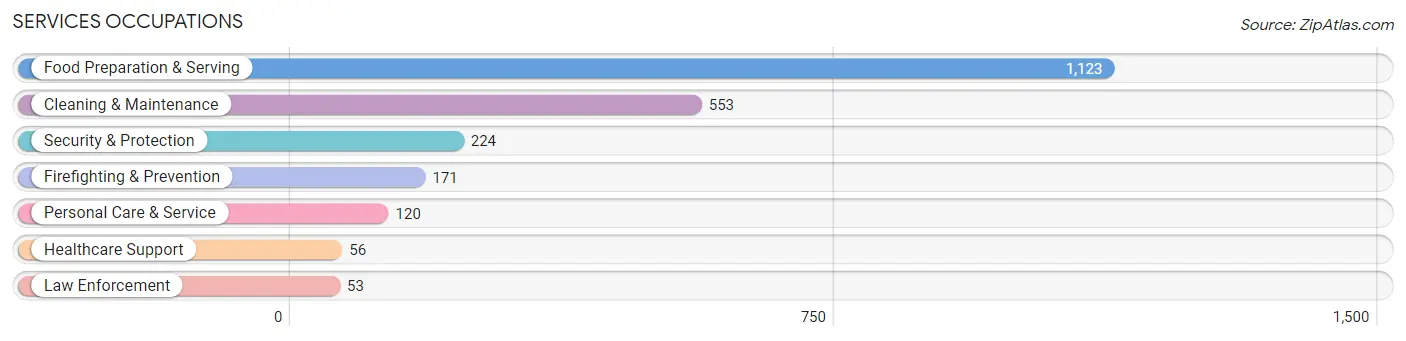
Services Occupations
The most common Services occupations in San Carlos Park are Food Preparation & Serving (1,123 | 10.8%), Cleaning & Maintenance (553 | 5.3%), Security & Protection (224 | 2.1%), Firefighting & Prevention (171 | 1.6%), and Personal Care & Service (120 | 1.1%).
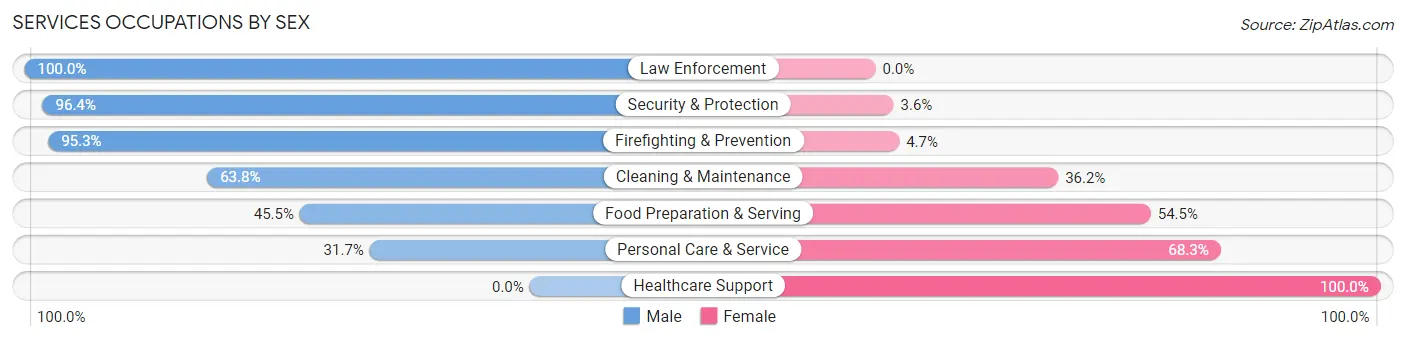
Services Occupations by Sex
Within the Services occupations in San Carlos Park, the most male-oriented occupations are Law Enforcement (100.0%), Security & Protection (96.4%), and Firefighting & Prevention (95.3%), while the most female-oriented occupations are Healthcare Support (100.0%), Personal Care & Service (68.3%), and Food Preparation & Serving (54.5%).
| Occupation | Male | Female |
| Healthcare Support | 0 (0.0%) | 56 (100.0%) |
| Security & Protection | 216 (96.4%) | 8 (3.6%) |
| Firefighting & Prevention | 163 (95.3%) | 8 (4.7%) |
| Law Enforcement | 53 (100.0%) | 0 (0.0%) |
| Food Preparation & Serving | 511 (45.5%) | 612 (54.5%) |
| Cleaning & Maintenance | 353 (63.8%) | 200 (36.2%) |
| Personal Care & Service | 38 (31.7%) | 82 (68.3%) |
| Total (Category) | 1,118 (53.8%) | 958 (46.2%) |
| Total (Overall) | 5,610 (53.8%) | 4,820 (46.2%) |
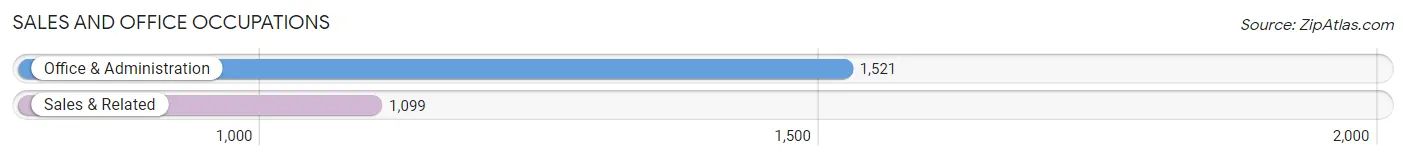
Sales and Office Occupations
The most common Sales and Office occupations in San Carlos Park are Office & Administration (1,521 | 14.6%), and Sales & Related (1,099 | 10.5%).
Sales and Office Occupations by Sex
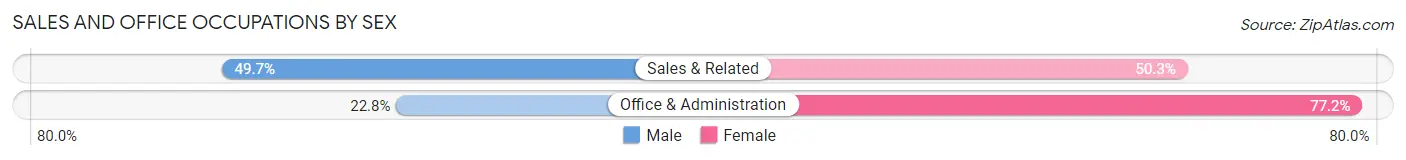
| Occupation | Male | Female |
| Sales & Related | 546 (49.7%) | 553 (50.3%) |
| Office & Administration | 347 (22.8%) | 1,174 (77.2%) |
| Total (Category) | 893 (34.1%) | 1,727 (65.9%) |
| Total (Overall) | 5,610 (53.8%) | 4,820 (46.2%) |
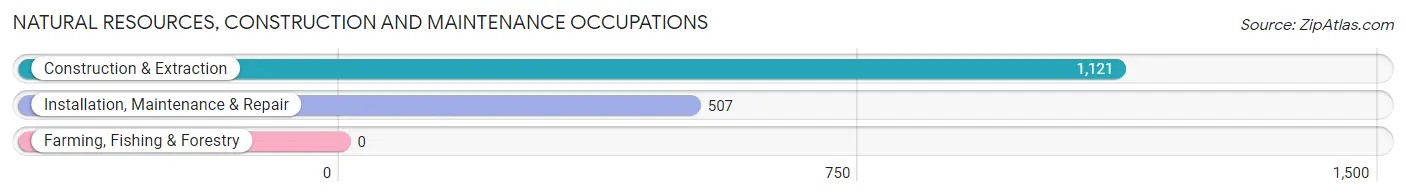
Natural Resources, Construction and Maintenance Occupations
The most common Natural Resources, Construction and Maintenance occupations in San Carlos Park are Construction & Extraction (1,121 | 10.7%), and Installation, Maintenance & Repair (507 | 4.9%).
Natural Resources, Construction and Maintenance Occupations by Sex
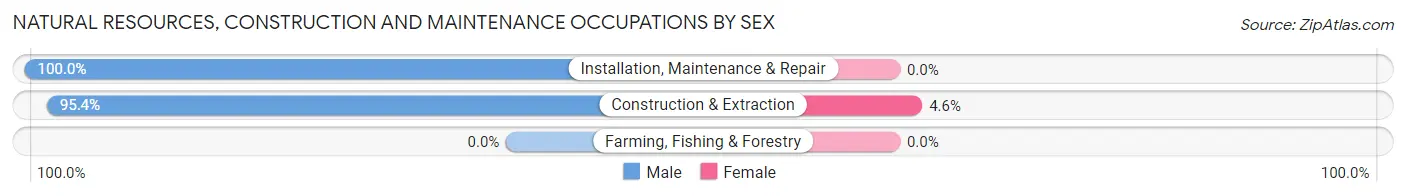
| Occupation | Male | Female |
| Farming, Fishing & Forestry | 0 (0.0%) | 0 (0.0%) |
| Construction & Extraction | 1,069 (95.4%) | 52 (4.6%) |
| Installation, Maintenance & Repair | 507 (100.0%) | 0 (0.0%) |
| Total (Category) | 1,576 (96.8%) | 52 (3.2%) |
| Total (Overall) | 5,610 (53.8%) | 4,820 (46.2%) |
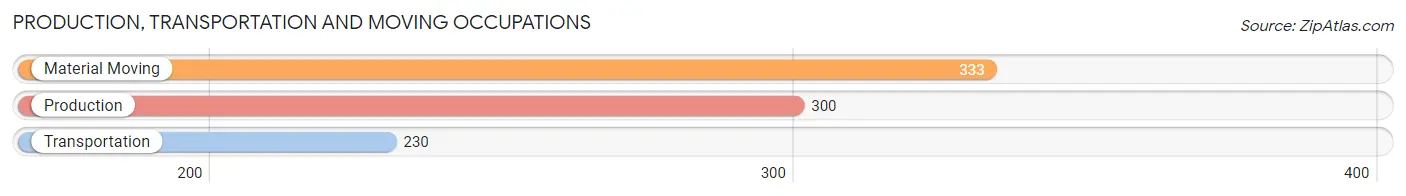
Production, Transportation and Moving Occupations
The most common Production, Transportation and Moving occupations in San Carlos Park are Material Moving (333 | 3.2%), Production (300 | 2.9%), and Transportation (230 | 2.2%).
Production, Transportation and Moving Occupations by Sex
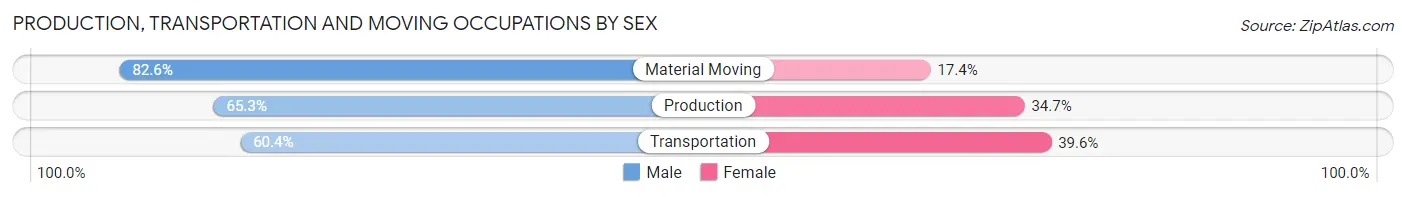
| Occupation | Male | Female |
| Production | 196 (65.3%) | 104 (34.7%) |
| Transportation | 139 (60.4%) | 91 (39.6%) |
| Material Moving | 275 (82.6%) | 58 (17.4%) |
| Total (Category) | 610 (70.7%) | 253 (29.3%) |
| Total (Overall) | 5,610 (53.8%) | 4,820 (46.2%) |
Employment Industries by Sex in San Carlos Park
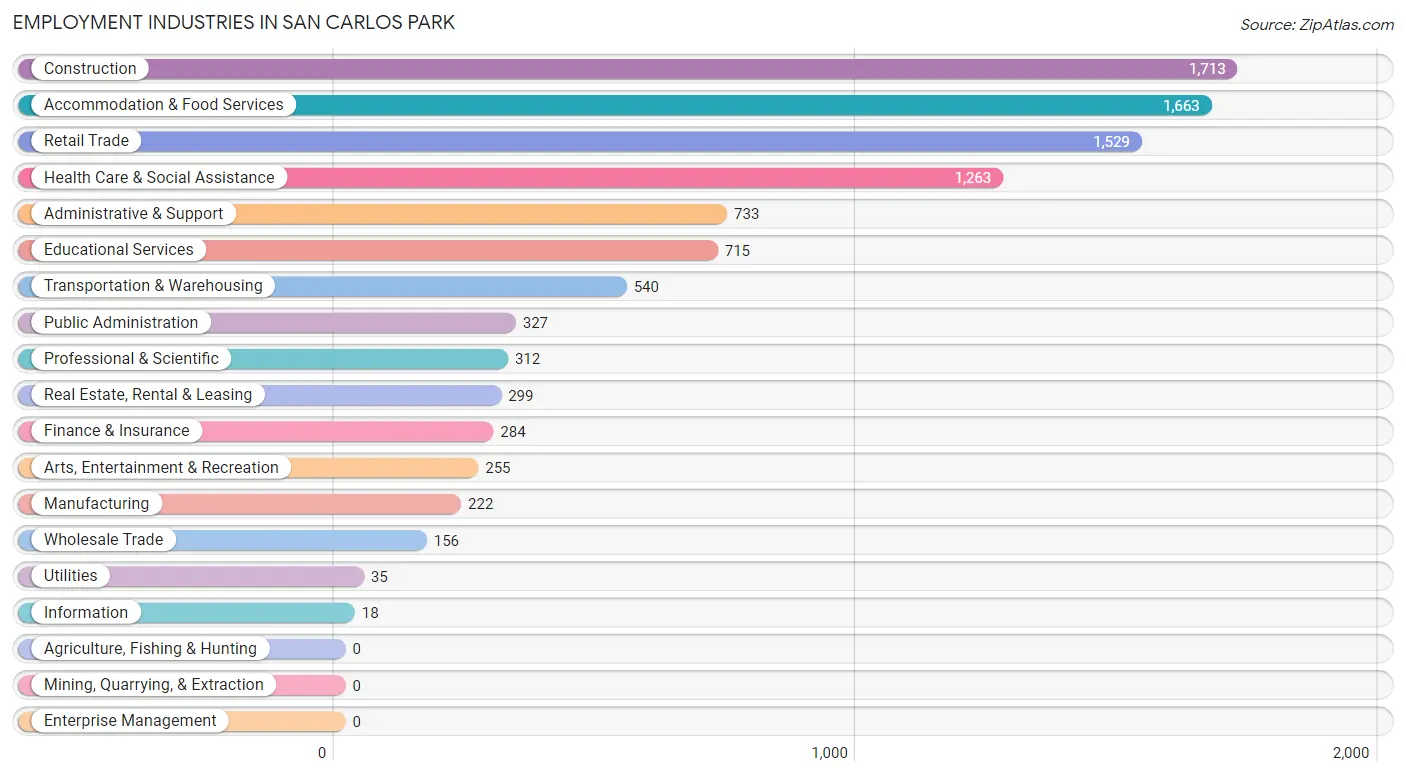
Employment Industries in San Carlos Park
The major employment industries in San Carlos Park include Construction (1,713 | 16.4%), Accommodation & Food Services (1,663 | 15.9%), Retail Trade (1,529 | 14.7%), Health Care & Social Assistance (1,263 | 12.1%), and Administrative & Support (733 | 7.0%).
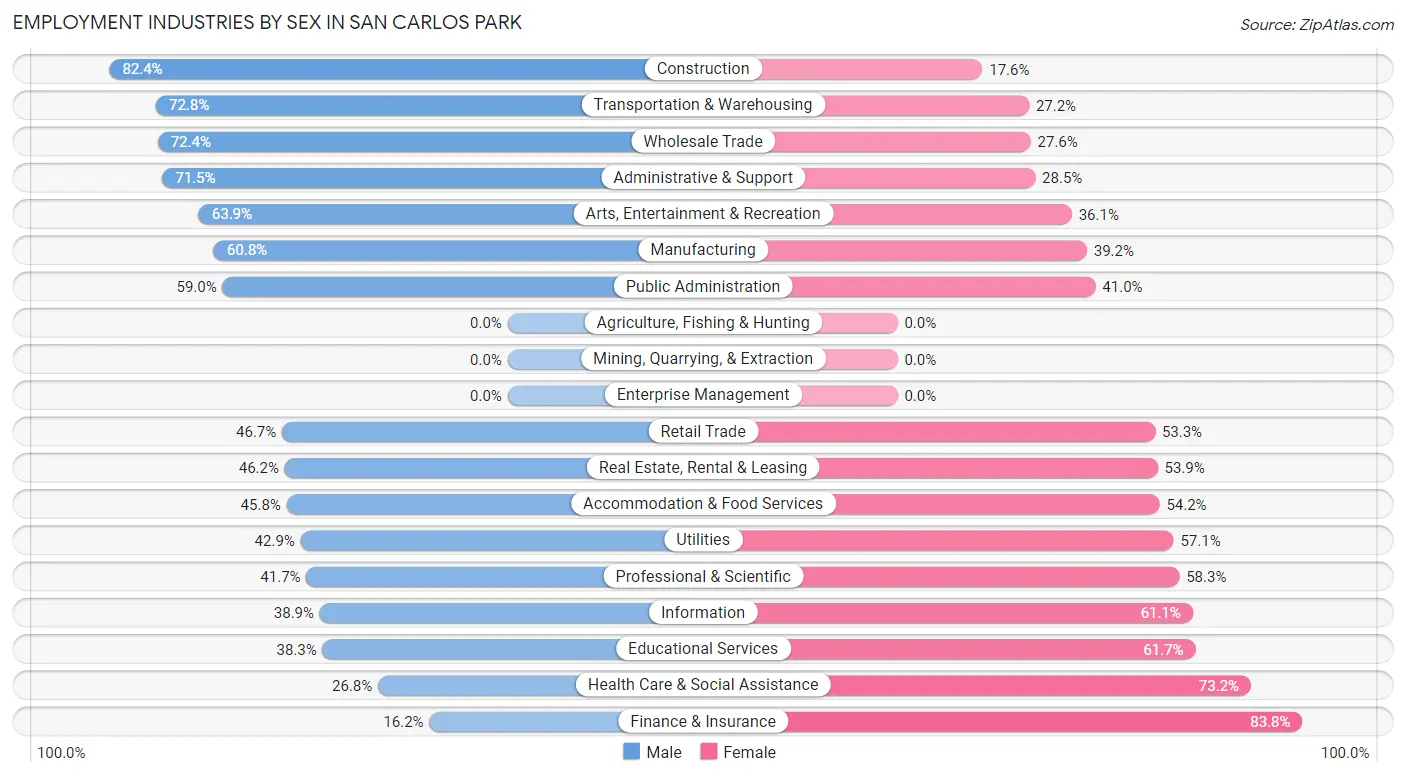
Employment Industries by Sex in San Carlos Park
The San Carlos Park industries that see more men than women are Construction (82.4%), Transportation & Warehousing (72.8%), and Wholesale Trade (72.4%), whereas the industries that tend to have a higher number of women are Finance & Insurance (83.8%), Health Care & Social Assistance (73.2%), and Educational Services (61.7%).
| Industry | Male | Female |
| Agriculture, Fishing & Hunting | 0 (0.0%) | 0 (0.0%) |
| Mining, Quarrying, & Extraction | 0 (0.0%) | 0 (0.0%) |
| Construction | 1,412 (82.4%) | 301 (17.6%) |
| Manufacturing | 135 (60.8%) | 87 (39.2%) |
| Wholesale Trade | 113 (72.4%) | 43 (27.6%) |
| Retail Trade | 714 (46.7%) | 815 (53.3%) |
| Transportation & Warehousing | 393 (72.8%) | 147 (27.2%) |
| Utilities | 15 (42.9%) | 20 (57.1%) |
| Information | 7 (38.9%) | 11 (61.1%) |
| Finance & Insurance | 46 (16.2%) | 238 (83.8%) |
| Real Estate, Rental & Leasing | 138 (46.2%) | 161 (53.8%) |
| Professional & Scientific | 130 (41.7%) | 182 (58.3%) |
| Enterprise Management | 0 (0.0%) | 0 (0.0%) |
| Administrative & Support | 524 (71.5%) | 209 (28.5%) |
| Educational Services | 274 (38.3%) | 441 (61.7%) |
| Health Care & Social Assistance | 339 (26.8%) | 924 (73.2%) |
| Arts, Entertainment & Recreation | 163 (63.9%) | 92 (36.1%) |
| Accommodation & Food Services | 761 (45.8%) | 902 (54.2%) |
| Public Administration | 193 (59.0%) | 134 (41.0%) |
| Total | 5,610 (53.8%) | 4,820 (46.2%) |
Education in San Carlos Park
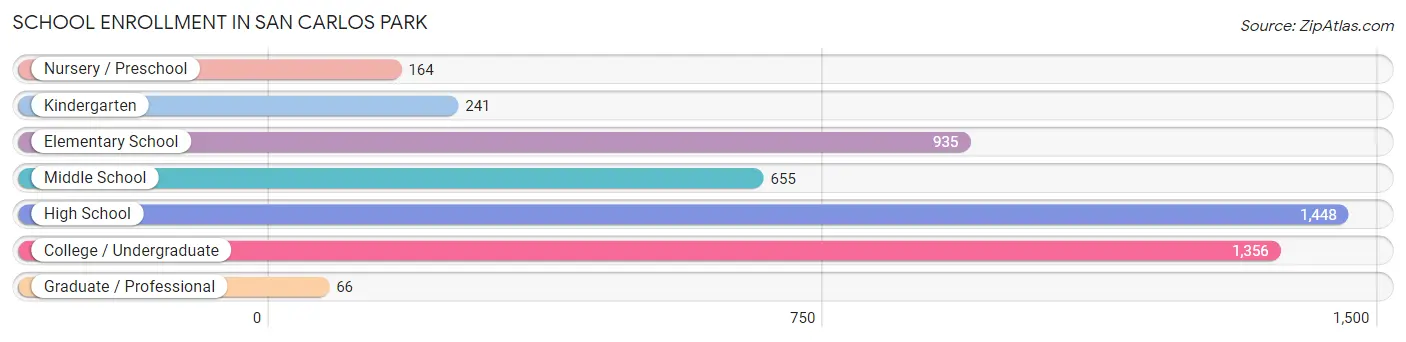
School Enrollment in San Carlos Park
The most common levels of schooling among the 4,865 students in San Carlos Park are high school (1,448 | 29.8%), college / undergraduate (1,356 | 27.9%), and elementary school (935 | 19.2%).
| School Level | # Students | % Students |
| Nursery / Preschool | 164 | 3.4% |
| Kindergarten | 241 | 5.0% |
| Elementary School | 935 | 19.2% |
| Middle School | 655 | 13.5% |
| High School | 1,448 | 29.8% |
| College / Undergraduate | 1,356 | 27.9% |
| Graduate / Professional | 66 | 1.4% |
| Total | 4,865 | 100.0% |
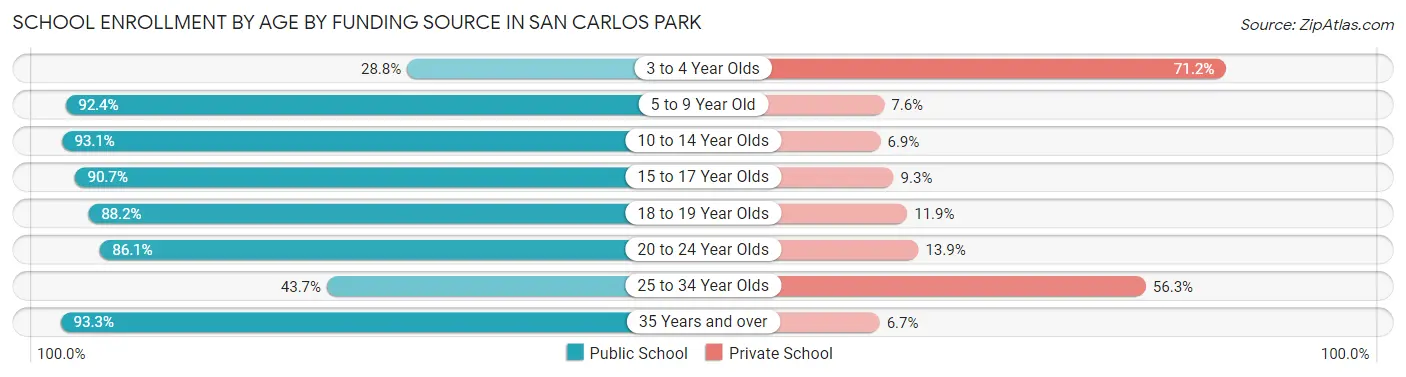
School Enrollment by Age by Funding Source in San Carlos Park
Out of a total of 4,865 students who are enrolled in schools in San Carlos Park, 628 (12.9%) attend a private institution, while the remaining 4,237 (87.1%) are enrolled in public schools. The age group of 3 to 4 year olds has the highest likelihood of being enrolled in private schools, with 109 (71.2% in the age bracket) enrolled. Conversely, the age group of 35 years and over has the lowest likelihood of being enrolled in a private school, with 153 (93.3% in the age bracket) attending a public institution.
| Age Bracket | Public School | Private School |
| 3 to 4 Year Olds | 44 (28.8%) | 109 (71.2%) |
| 5 to 9 Year Old | 976 (92.4%) | 80 (7.6%) |
| 10 to 14 Year Olds | 881 (93.1%) | 65 (6.9%) |
| 15 to 17 Year Olds | 789 (90.7%) | 81 (9.3%) |
| 18 to 19 Year Olds | 409 (88.1%) | 55 (11.8%) |
| 20 to 24 Year Olds | 927 (86.1%) | 150 (13.9%) |
| 25 to 34 Year Olds | 59 (43.7%) | 76 (56.3%) |
| 35 Years and over | 153 (93.3%) | 11 (6.7%) |
| Total | 4,237 (87.1%) | 628 (12.9%) |
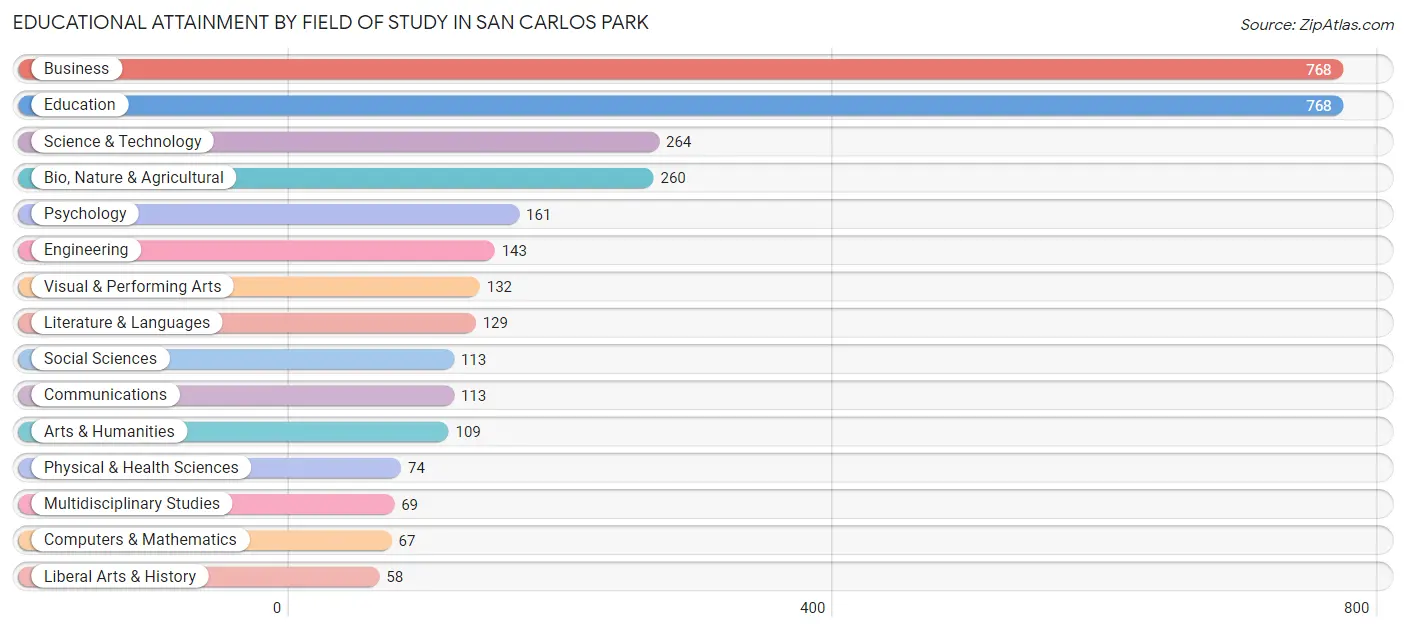
Educational Attainment by Field of Study in San Carlos Park
Business (768 | 23.8%), education (768 | 23.8%), science & technology (264 | 8.2%), bio, nature & agricultural (260 | 8.1%), and psychology (161 | 5.0%) are the most common fields of study among 3,228 individuals in San Carlos Park who have obtained a bachelor's degree or higher.
| Field of Study | # Graduates | % Graduates |
| Computers & Mathematics | 67 | 2.1% |
| Bio, Nature & Agricultural | 260 | 8.1% |
| Physical & Health Sciences | 74 | 2.3% |
| Psychology | 161 | 5.0% |
| Social Sciences | 113 | 3.5% |
| Engineering | 143 | 4.4% |
| Multidisciplinary Studies | 69 | 2.1% |
| Science & Technology | 264 | 8.2% |
| Business | 768 | 23.8% |
| Education | 768 | 23.8% |
| Literature & Languages | 129 | 4.0% |
| Liberal Arts & History | 58 | 1.8% |
| Visual & Performing Arts | 132 | 4.1% |
| Communications | 113 | 3.5% |
| Arts & Humanities | 109 | 3.4% |
| Total | 3,228 | 100.0% |
Transportation & Commute in San Carlos Park
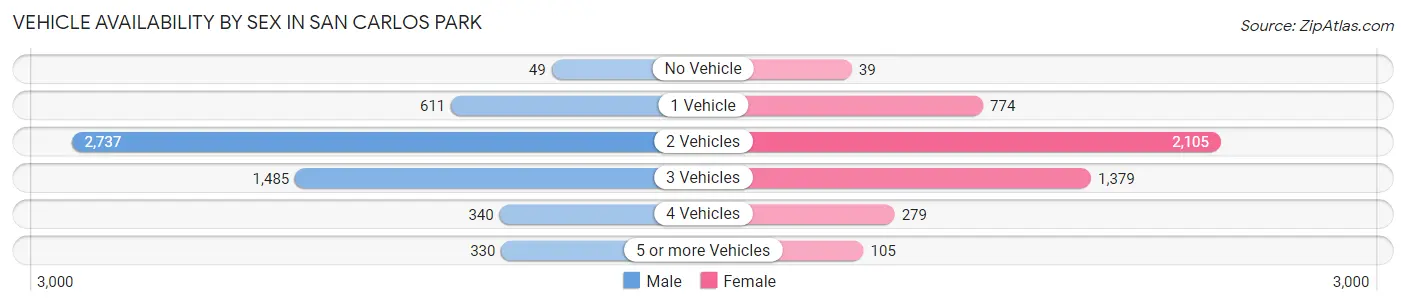
Vehicle Availability by Sex in San Carlos Park
The most prevalent vehicle ownership categories in San Carlos Park are males with 2 vehicles (2,737, accounting for 49.3%) and females with 2 vehicles (2,105, making up 58.5%).
| Vehicles Available | Male | Female |
| No Vehicle | 49 (0.9%) | 39 (0.8%) |
| 1 Vehicle | 611 (11.0%) | 774 (16.5%) |
| 2 Vehicles | 2,737 (49.3%) | 2,105 (45.0%) |
| 3 Vehicles | 1,485 (26.8%) | 1,379 (29.5%) |
| 4 Vehicles | 340 (6.1%) | 279 (6.0%) |
| 5 or more Vehicles | 330 (5.9%) | 105 (2.2%) |
| Total | 5,552 (100.0%) | 4,681 (100.0%) |
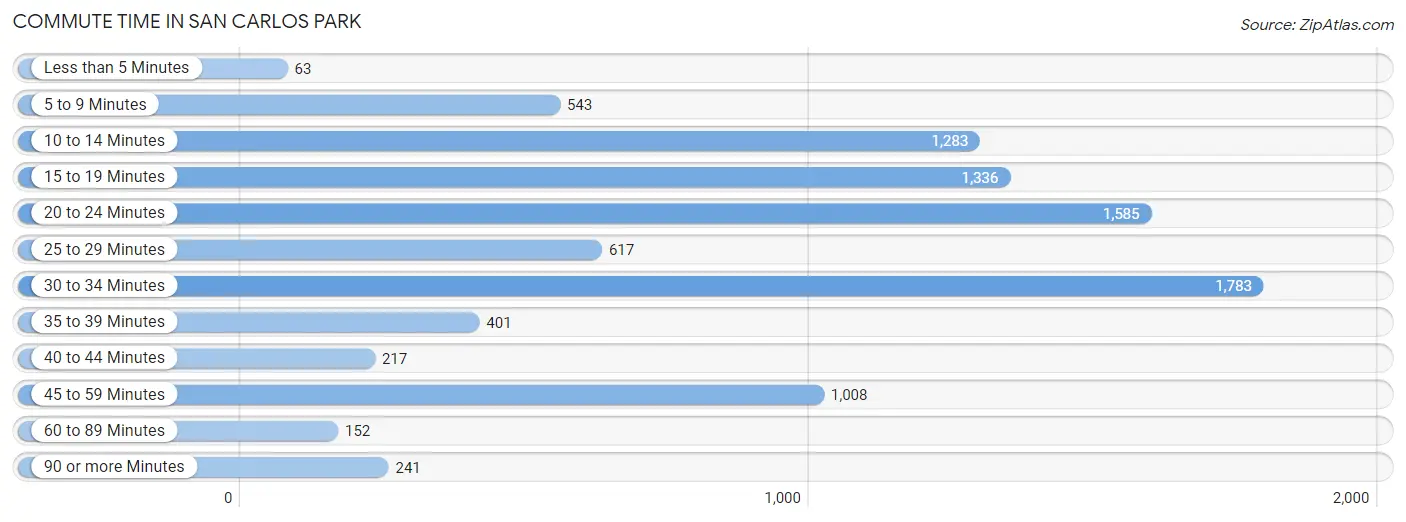
Commute Time in San Carlos Park
The most frequently occuring commute durations in San Carlos Park are 30 to 34 minutes (1,783 commuters, 19.3%), 20 to 24 minutes (1,585 commuters, 17.2%), and 15 to 19 minutes (1,336 commuters, 14.5%).
| Commute Time | # Commuters | % Commuters |
| Less than 5 Minutes | 63 | 0.7% |
| 5 to 9 Minutes | 543 | 5.9% |
| 10 to 14 Minutes | 1,283 | 13.9% |
| 15 to 19 Minutes | 1,336 | 14.5% |
| 20 to 24 Minutes | 1,585 | 17.2% |
| 25 to 29 Minutes | 617 | 6.7% |
| 30 to 34 Minutes | 1,783 | 19.3% |
| 35 to 39 Minutes | 401 | 4.3% |
| 40 to 44 Minutes | 217 | 2.4% |
| 45 to 59 Minutes | 1,008 | 10.9% |
| 60 to 89 Minutes | 152 | 1.7% |
| 90 or more Minutes | 241 | 2.6% |
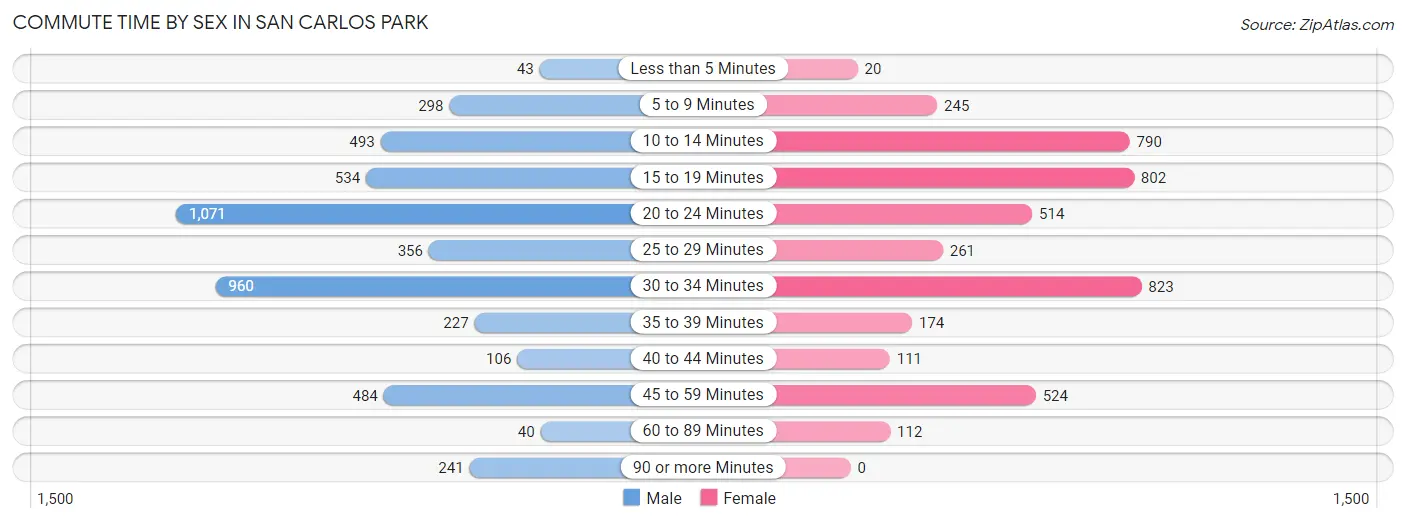
Commute Time by Sex in San Carlos Park
The most common commute times in San Carlos Park are 20 to 24 minutes (1,071 commuters, 22.1%) for males and 30 to 34 minutes (823 commuters, 18.8%) for females.
| Commute Time | Male | Female |
| Less than 5 Minutes | 43 (0.9%) | 20 (0.5%) |
| 5 to 9 Minutes | 298 (6.1%) | 245 (5.6%) |
| 10 to 14 Minutes | 493 (10.2%) | 790 (18.0%) |
| 15 to 19 Minutes | 534 (11.0%) | 802 (18.3%) |
| 20 to 24 Minutes | 1,071 (22.1%) | 514 (11.7%) |
| 25 to 29 Minutes | 356 (7.3%) | 261 (6.0%) |
| 30 to 34 Minutes | 960 (19.8%) | 823 (18.8%) |
| 35 to 39 Minutes | 227 (4.7%) | 174 (4.0%) |
| 40 to 44 Minutes | 106 (2.2%) | 111 (2.5%) |
| 45 to 59 Minutes | 484 (10.0%) | 524 (12.0%) |
| 60 to 89 Minutes | 40 (0.8%) | 112 (2.6%) |
| 90 or more Minutes | 241 (5.0%) | 0 (0.0%) |
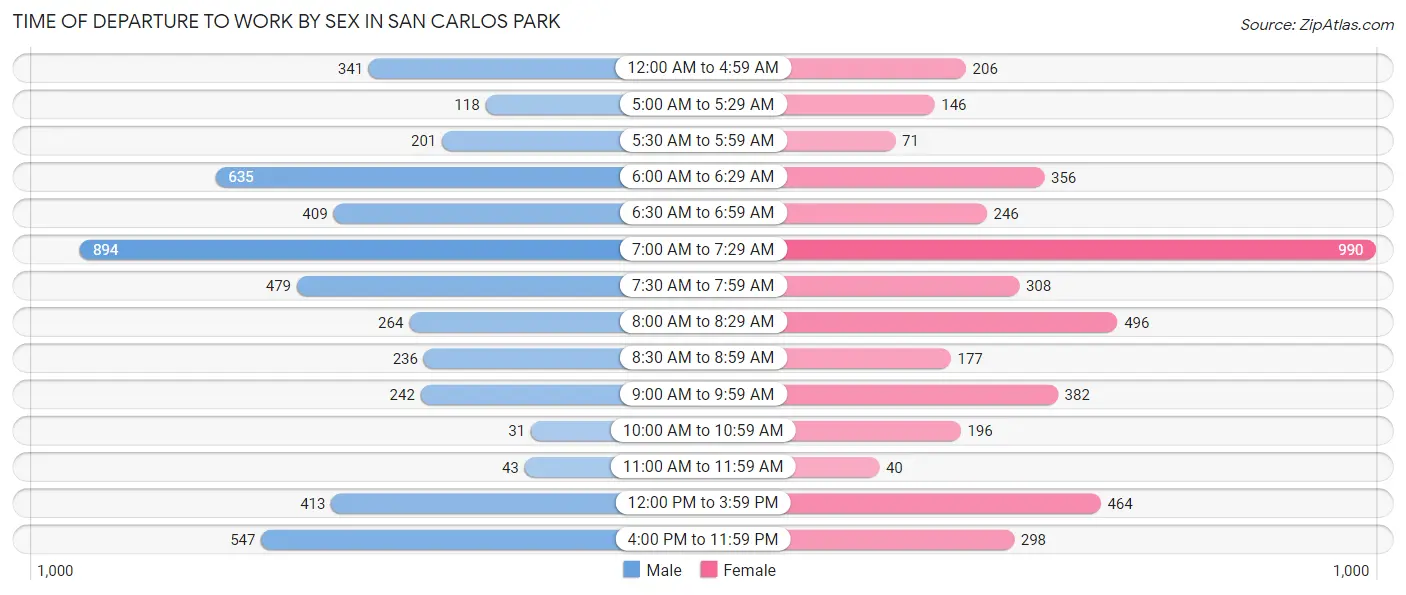
Time of Departure to Work by Sex in San Carlos Park
The most frequent times of departure to work in San Carlos Park are 7:00 AM to 7:29 AM (894, 18.4%) for males and 7:00 AM to 7:29 AM (990, 22.6%) for females.
| Time of Departure | Male | Female |
| 12:00 AM to 4:59 AM | 341 (7.0%) | 206 (4.7%) |
| 5:00 AM to 5:29 AM | 118 (2.4%) | 146 (3.3%) |
| 5:30 AM to 5:59 AM | 201 (4.1%) | 71 (1.6%) |
| 6:00 AM to 6:29 AM | 635 (13.1%) | 356 (8.1%) |
| 6:30 AM to 6:59 AM | 409 (8.4%) | 246 (5.6%) |
| 7:00 AM to 7:29 AM | 894 (18.4%) | 990 (22.6%) |
| 7:30 AM to 7:59 AM | 479 (9.9%) | 308 (7.0%) |
| 8:00 AM to 8:29 AM | 264 (5.4%) | 496 (11.3%) |
| 8:30 AM to 8:59 AM | 236 (4.9%) | 177 (4.0%) |
| 9:00 AM to 9:59 AM | 242 (5.0%) | 382 (8.7%) |
| 10:00 AM to 10:59 AM | 31 (0.6%) | 196 (4.5%) |
| 11:00 AM to 11:59 AM | 43 (0.9%) | 40 (0.9%) |
| 12:00 PM to 3:59 PM | 413 (8.5%) | 464 (10.6%) |
| 4:00 PM to 11:59 PM | 547 (11.3%) | 298 (6.8%) |
| Total | 4,853 (100.0%) | 4,376 (100.0%) |
Housing Occupancy in San Carlos Park
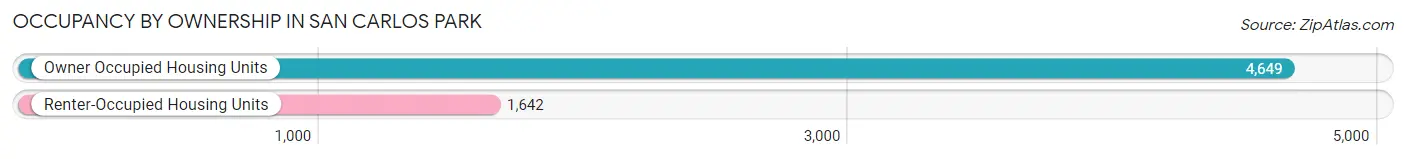
Occupancy by Ownership in San Carlos Park
Of the total 6,291 dwellings in San Carlos Park, owner-occupied units account for 4,649 (73.9%), while renter-occupied units make up 1,642 (26.1%).
| Occupancy | # Housing Units | % Housing Units |
| Owner Occupied Housing Units | 4,649 | 73.9% |
| Renter-Occupied Housing Units | 1,642 | 26.1% |
| Total Occupied Housing Units | 6,291 | 100.0% |
Occupancy by Household Size in San Carlos Park
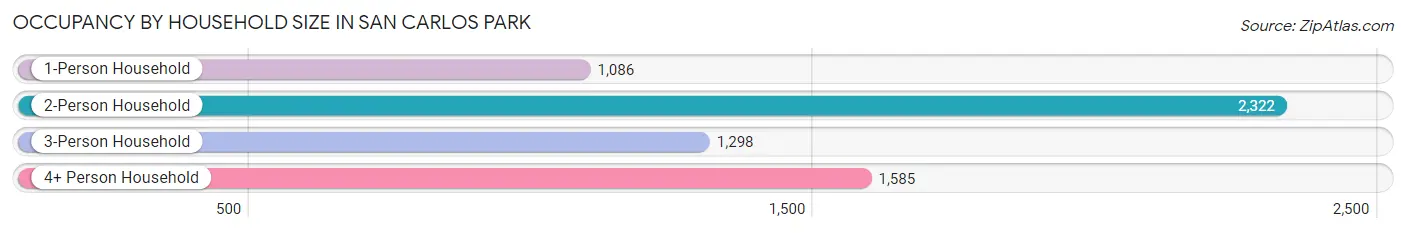
| Household Size | # Housing Units | % Housing Units |
| 1-Person Household | 1,086 | 17.3% |
| 2-Person Household | 2,322 | 36.9% |
| 3-Person Household | 1,298 | 20.6% |
| 4+ Person Household | 1,585 | 25.2% |
| Total Housing Units | 6,291 | 100.0% |
Occupancy by Ownership by Household Size in San Carlos Park
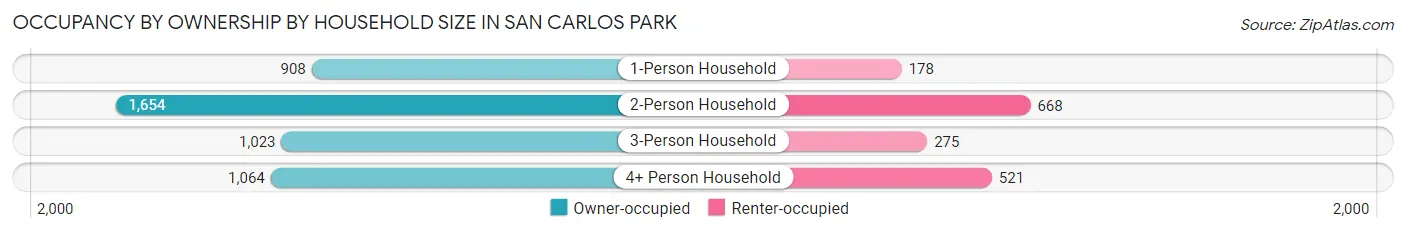
| Household Size | Owner-occupied | Renter-occupied |
| 1-Person Household | 908 (83.6%) | 178 (16.4%) |
| 2-Person Household | 1,654 (71.2%) | 668 (28.8%) |
| 3-Person Household | 1,023 (78.8%) | 275 (21.2%) |
| 4+ Person Household | 1,064 (67.1%) | 521 (32.9%) |
| Total Housing Units | 4,649 (73.9%) | 1,642 (26.1%) |
Occupancy by Educational Attainment in San Carlos Park
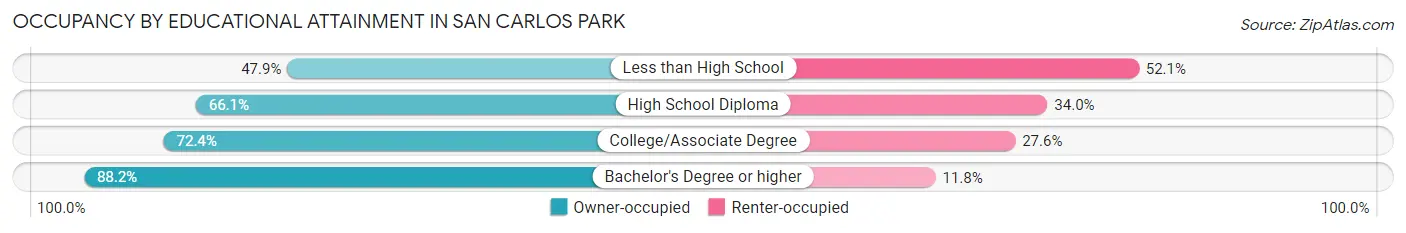
| Household Size | Owner-occupied | Renter-occupied |
| Less than High School | 197 (47.9%) | 214 (52.1%) |
| High School Diploma | 934 (66.0%) | 480 (34.0%) |
| College/Associate Degree | 1,936 (72.4%) | 737 (27.6%) |
| Bachelor's Degree or higher | 1,582 (88.2%) | 211 (11.8%) |
Occupancy by Age of Householder in San Carlos Park
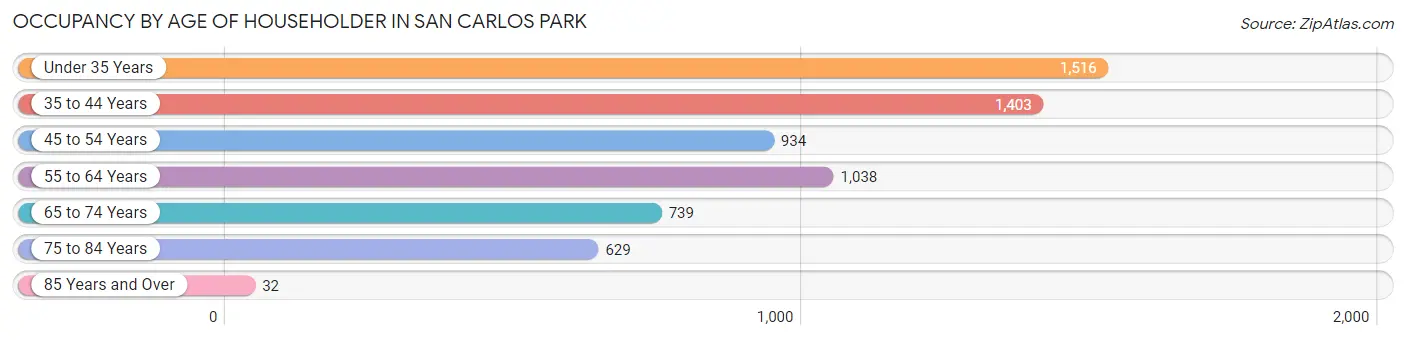
| Age Bracket | # Households | % Households |
| Under 35 Years | 1,516 | 24.1% |
| 35 to 44 Years | 1,403 | 22.3% |
| 45 to 54 Years | 934 | 14.8% |
| 55 to 64 Years | 1,038 | 16.5% |
| 65 to 74 Years | 739 | 11.7% |
| 75 to 84 Years | 629 | 10.0% |
| 85 Years and Over | 32 | 0.5% |
| Total | 6,291 | 100.0% |
Housing Finances in San Carlos Park
Median Income by Occupancy in San Carlos Park
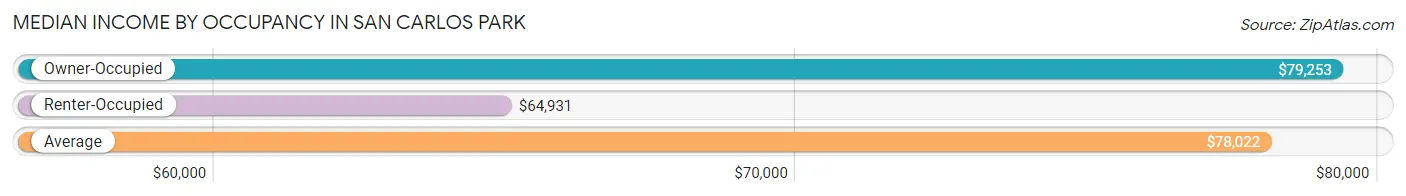
| Occupancy Type | # Households | Median Income |
| Owner-Occupied | 4,649 (73.9%) | $79,253 |
| Renter-Occupied | 1,642 (26.1%) | $64,931 |
| Average | 6,291 (100.0%) | $78,022 |
Occupancy by Householder Income Bracket in San Carlos Park
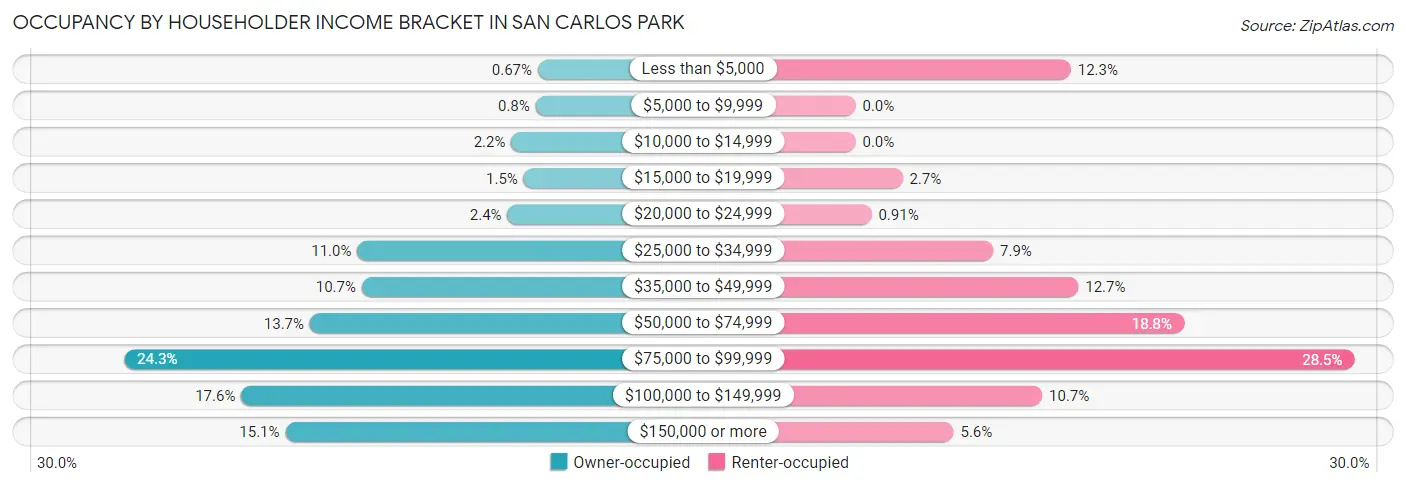
| Income Bracket | Owner-occupied | Renter-occupied |
| Less than $5,000 | 31 (0.7%) | 202 (12.3%) |
| $5,000 to $9,999 | 37 (0.8%) | 0 (0.0%) |
| $10,000 to $14,999 | 102 (2.2%) | 0 (0.0%) |
| $15,000 to $19,999 | 69 (1.5%) | 44 (2.7%) |
| $20,000 to $24,999 | 112 (2.4%) | 15 (0.9%) |
| $25,000 to $34,999 | 511 (11.0%) | 129 (7.9%) |
| $35,000 to $49,999 | 499 (10.7%) | 209 (12.7%) |
| $50,000 to $74,999 | 637 (13.7%) | 308 (18.8%) |
| $75,000 to $99,999 | 1,130 (24.3%) | 468 (28.5%) |
| $100,000 to $149,999 | 819 (17.6%) | 175 (10.7%) |
| $150,000 or more | 702 (15.1%) | 92 (5.6%) |
| Total | 4,649 (100.0%) | 1,642 (100.0%) |
Monthly Housing Cost Tiers in San Carlos Park
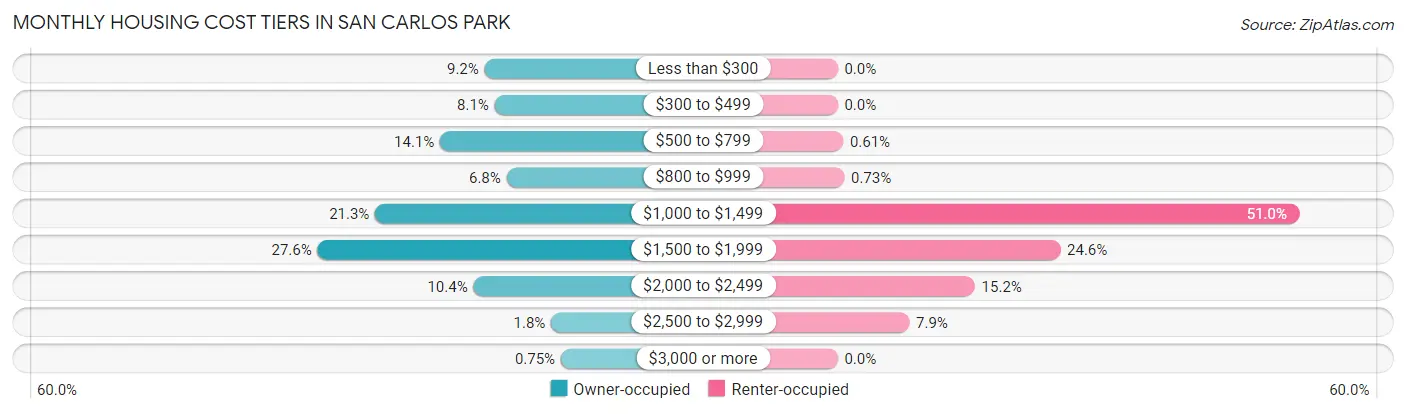
| Monthly Cost | Owner-occupied | Renter-occupied |
| Less than $300 | 427 (9.2%) | 0 (0.0%) |
| $300 to $499 | 375 (8.1%) | 0 (0.0%) |
| $500 to $799 | 655 (14.1%) | 10 (0.6%) |
| $800 to $999 | 314 (6.8%) | 12 (0.7%) |
| $1,000 to $1,499 | 989 (21.3%) | 837 (51.0%) |
| $1,500 to $1,999 | 1,285 (27.6%) | 404 (24.6%) |
| $2,000 to $2,499 | 484 (10.4%) | 249 (15.2%) |
| $2,500 to $2,999 | 85 (1.8%) | 130 (7.9%) |
| $3,000 or more | 35 (0.7%) | 0 (0.0%) |
| Total | 4,649 (100.0%) | 1,642 (100.0%) |
Physical Housing Characteristics in San Carlos Park
Housing Structures in San Carlos Park
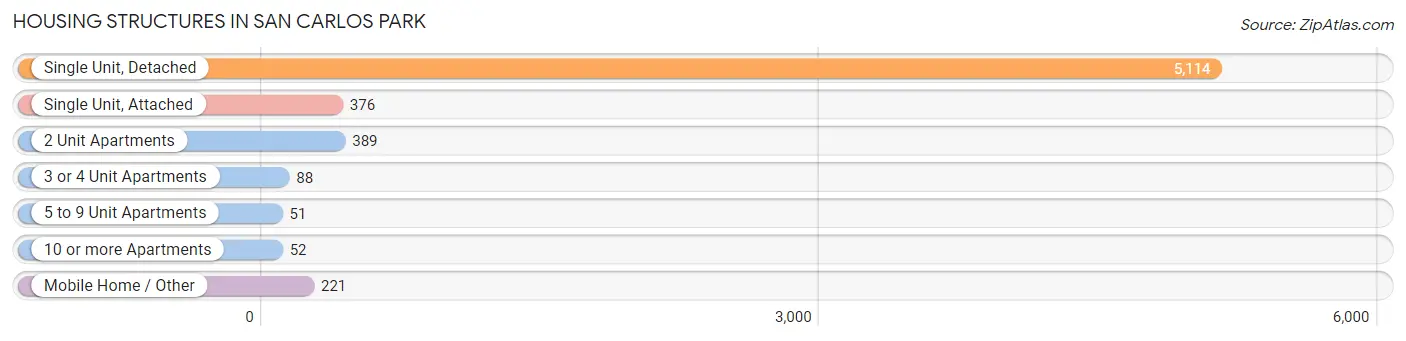
| Structure Type | # Housing Units | % Housing Units |
| Single Unit, Detached | 5,114 | 81.3% |
| Single Unit, Attached | 376 | 6.0% |
| 2 Unit Apartments | 389 | 6.2% |
| 3 or 4 Unit Apartments | 88 | 1.4% |
| 5 to 9 Unit Apartments | 51 | 0.8% |
| 10 or more Apartments | 52 | 0.8% |
| Mobile Home / Other | 221 | 3.5% |
| Total | 6,291 | 100.0% |
Housing Structures by Occupancy in San Carlos Park
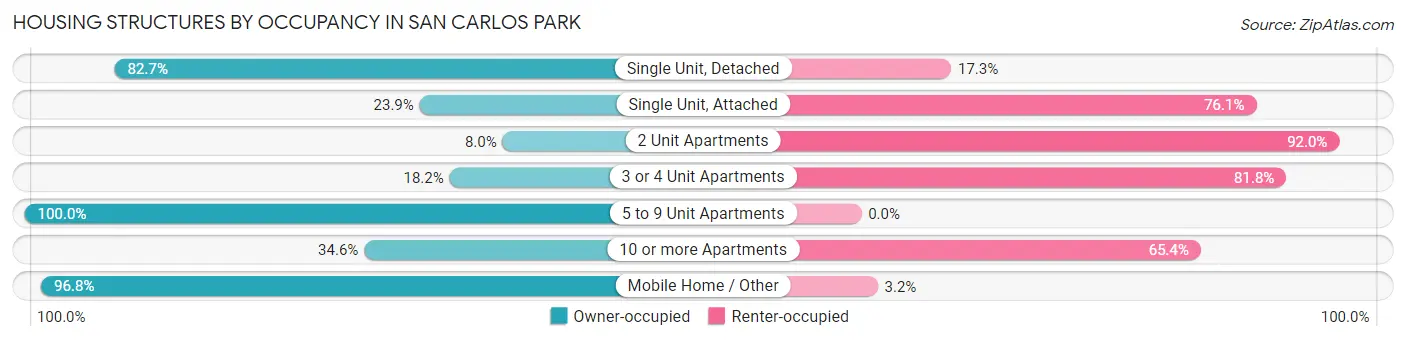
| Structure Type | Owner-occupied | Renter-occupied |
| Single Unit, Detached | 4,229 (82.7%) | 885 (17.3%) |
| Single Unit, Attached | 90 (23.9%) | 286 (76.1%) |
| 2 Unit Apartments | 31 (8.0%) | 358 (92.0%) |
| 3 or 4 Unit Apartments | 16 (18.2%) | 72 (81.8%) |
| 5 to 9 Unit Apartments | 51 (100.0%) | 0 (0.0%) |
| 10 or more Apartments | 18 (34.6%) | 34 (65.4%) |
| Mobile Home / Other | 214 (96.8%) | 7 (3.2%) |
| Total | 4,649 (73.9%) | 1,642 (26.1%) |
Housing Structures by Number of Rooms in San Carlos Park
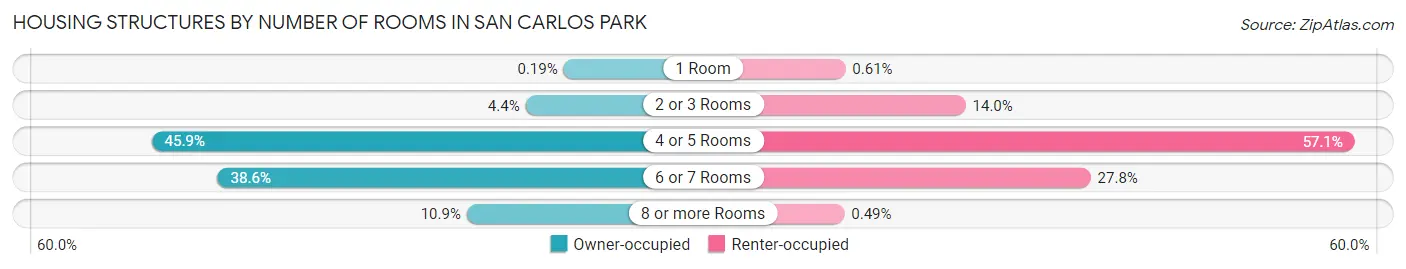
| Number of Rooms | Owner-occupied | Renter-occupied |
| 1 Room | 9 (0.2%) | 10 (0.6%) |
| 2 or 3 Rooms | 205 (4.4%) | 229 (14.0%) |
| 4 or 5 Rooms | 2,134 (45.9%) | 938 (57.1%) |
| 6 or 7 Rooms | 1,793 (38.6%) | 457 (27.8%) |
| 8 or more Rooms | 508 (10.9%) | 8 (0.5%) |
| Total | 4,649 (100.0%) | 1,642 (100.0%) |
Housing Structure by Heating Type in San Carlos Park
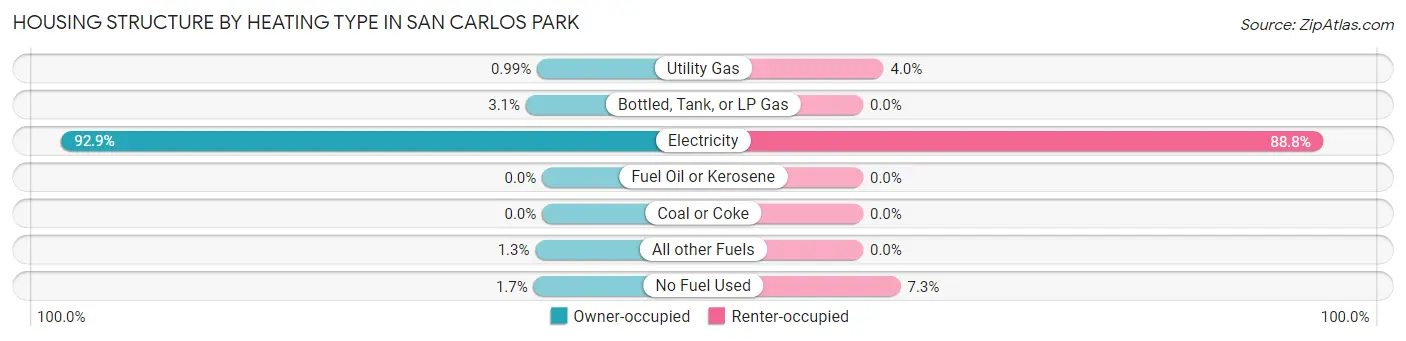
| Heating Type | Owner-occupied | Renter-occupied |
| Utility Gas | 46 (1.0%) | 65 (4.0%) |
| Bottled, Tank, or LP Gas | 146 (3.1%) | 0 (0.0%) |
| Electricity | 4,319 (92.9%) | 1,458 (88.8%) |
| Fuel Oil or Kerosene | 0 (0.0%) | 0 (0.0%) |
| Coal or Coke | 0 (0.0%) | 0 (0.0%) |
| All other Fuels | 61 (1.3%) | 0 (0.0%) |
| No Fuel Used | 77 (1.7%) | 119 (7.2%) |
| Total | 4,649 (100.0%) | 1,642 (100.0%) |
Household Vehicle Usage in San Carlos Park
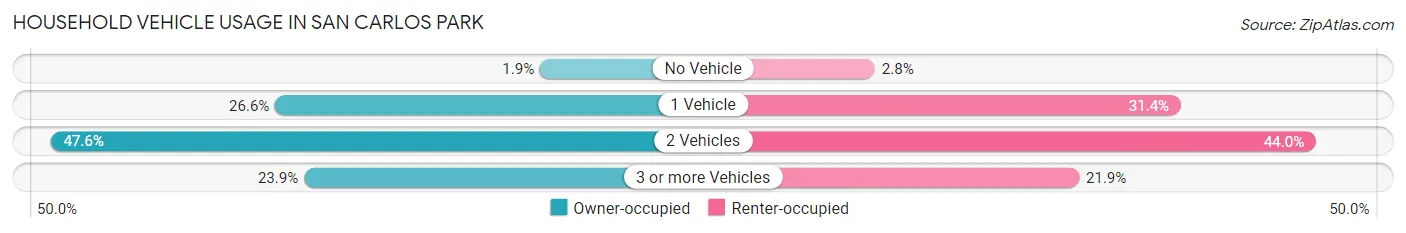
| Vehicles per Household | Owner-occupied | Renter-occupied |
| No Vehicle | 88 (1.9%) | 46 (2.8%) |
| 1 Vehicle | 1,237 (26.6%) | 515 (31.4%) |
| 2 Vehicles | 2,212 (47.6%) | 722 (44.0%) |
| 3 or more Vehicles | 1,112 (23.9%) | 359 (21.9%) |
| Total | 4,649 (100.0%) | 1,642 (100.0%) |
Real Estate & Mortgages in San Carlos Park
Real Estate and Mortgage Overview in San Carlos Park
| Characteristic | Without Mortgage | With Mortgage |
| Housing Units | 1,390 | 3,259 |
| Median Property Value | $257,900 | $270,700 |
| Median Household Income | $50,694 | $652 |
| Monthly Housing Costs | $470 | $35 |
| Real Estate Taxes | $1,403 | $200 |
Property Value by Mortgage Status in San Carlos Park
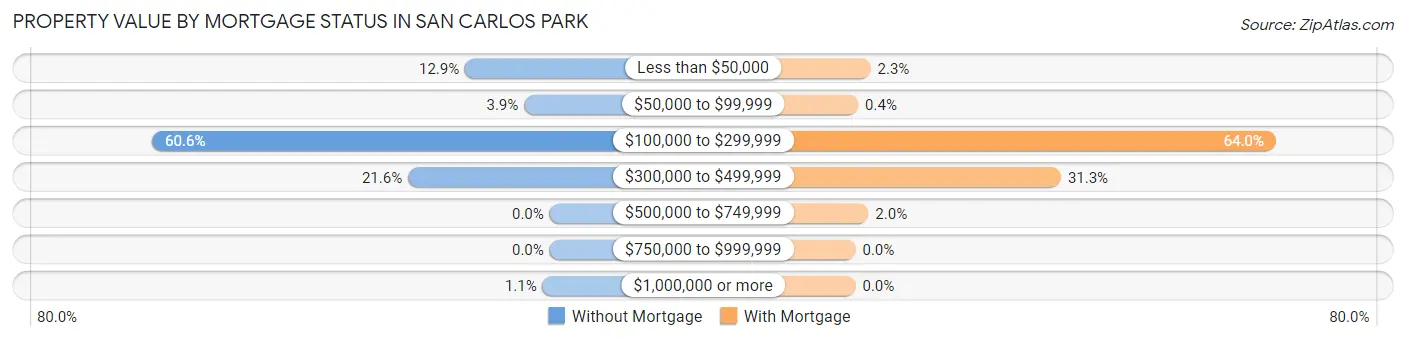
| Property Value | Without Mortgage | With Mortgage |
| Less than $50,000 | 179 (12.9%) | 75 (2.3%) |
| $50,000 to $99,999 | 54 (3.9%) | 13 (0.4%) |
| $100,000 to $299,999 | 842 (60.6%) | 2,087 (64.0%) |
| $300,000 to $499,999 | 300 (21.6%) | 1,020 (31.3%) |
| $500,000 to $749,999 | 0 (0.0%) | 64 (2.0%) |
| $750,000 to $999,999 | 0 (0.0%) | 0 (0.0%) |
| $1,000,000 or more | 15 (1.1%) | 0 (0.0%) |
| Total | 1,390 (100.0%) | 3,259 (100.0%) |
Household Income by Mortgage Status in San Carlos Park
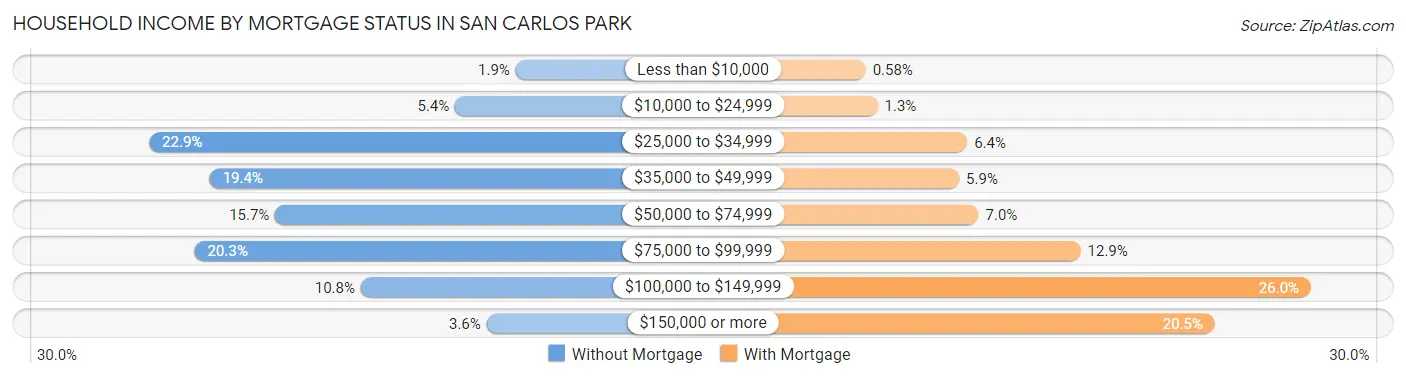
| Household Income | Without Mortgage | With Mortgage |
| Less than $10,000 | 27 (1.9%) | 19 (0.6%) |
| $10,000 to $24,999 | 75 (5.4%) | 41 (1.3%) |
| $25,000 to $34,999 | 318 (22.9%) | 208 (6.4%) |
| $35,000 to $49,999 | 270 (19.4%) | 193 (5.9%) |
| $50,000 to $74,999 | 218 (15.7%) | 229 (7.0%) |
| $75,000 to $99,999 | 282 (20.3%) | 419 (12.9%) |
| $100,000 to $149,999 | 150 (10.8%) | 848 (26.0%) |
| $150,000 or more | 50 (3.6%) | 669 (20.5%) |
| Total | 1,390 (100.0%) | 3,259 (100.0%) |
Property Value to Household Income Ratio in San Carlos Park
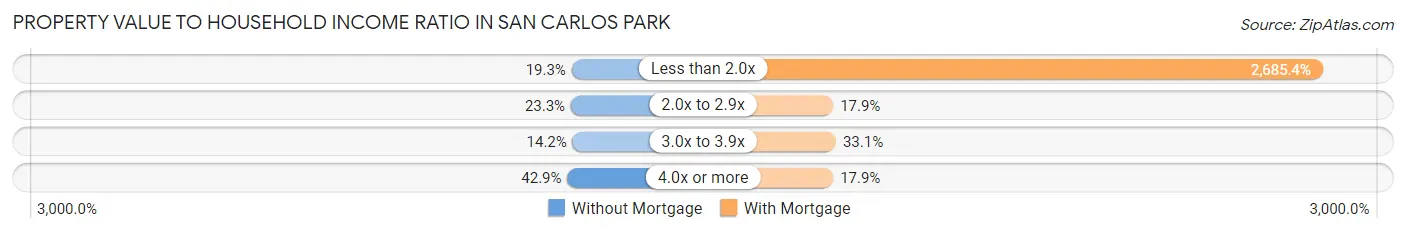
| Value-to-Income Ratio | Without Mortgage | With Mortgage |
| Less than 2.0x | 268 (19.3%) | 87,518 (2,685.4%) |
| 2.0x to 2.9x | 324 (23.3%) | 584 (17.9%) |
| 3.0x to 3.9x | 197 (14.2%) | 1,077 (33.1%) |
| 4.0x or more | 596 (42.9%) | 584 (17.9%) |
| Total | 1,390 (100.0%) | 3,259 (100.0%) |
Real Estate Taxes by Mortgage Status in San Carlos Park
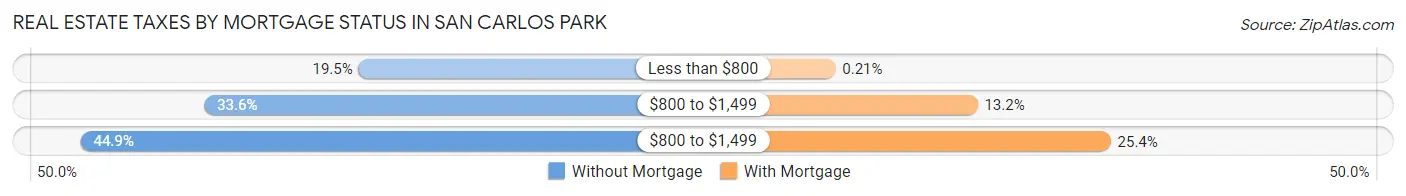
| Property Taxes | Without Mortgage | With Mortgage |
| Less than $800 | 271 (19.5%) | 7 (0.2%) |
| $800 to $1,499 | 467 (33.6%) | 430 (13.2%) |
| $800 to $1,499 | 624 (44.9%) | 826 (25.4%) |
| Total | 1,390 (100.0%) | 3,259 (100.0%) |
Health & Disability in San Carlos Park
Health Insurance Coverage by Age in San Carlos Park
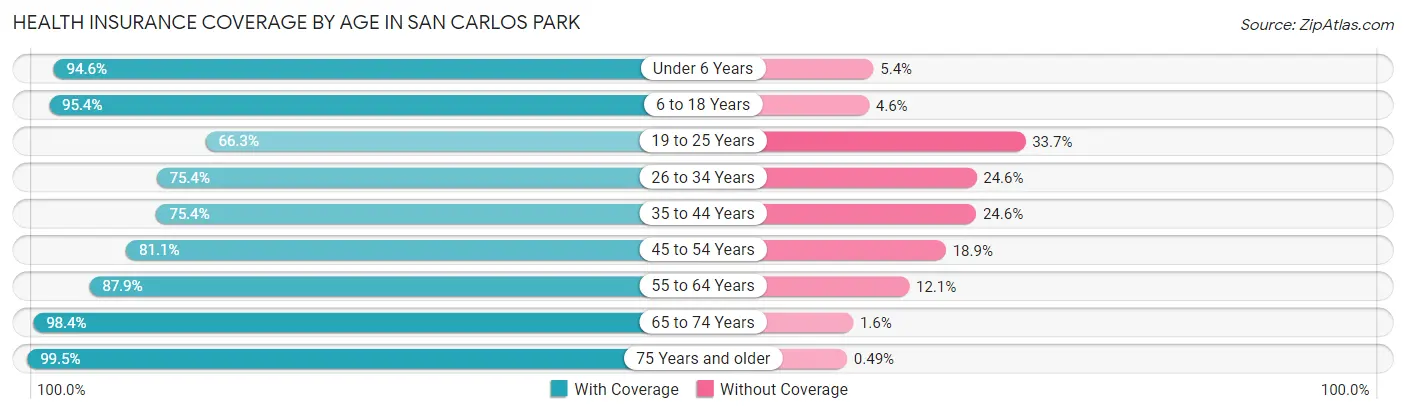
| Age Bracket | With Coverage | Without Coverage |
| Under 6 Years | 1,186 (94.6%) | 68 (5.4%) |
| 6 to 18 Years | 3,086 (95.4%) | 148 (4.6%) |
| 19 to 25 Years | 1,634 (66.3%) | 832 (33.7%) |
| 26 to 34 Years | 1,807 (75.4%) | 590 (24.6%) |
| 35 to 44 Years | 2,153 (75.4%) | 701 (24.6%) |
| 45 to 54 Years | 1,500 (81.1%) | 350 (18.9%) |
| 55 to 64 Years | 1,865 (87.9%) | 256 (12.1%) |
| 65 to 74 Years | 1,464 (98.4%) | 24 (1.6%) |
| 75 Years and older | 1,214 (99.5%) | 6 (0.5%) |
| Total | 15,909 (84.3%) | 2,975 (15.8%) |
Health Insurance Coverage by Citizenship Status in San Carlos Park
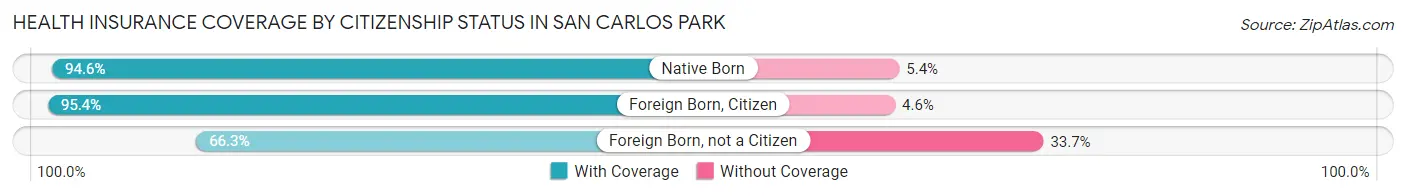
| Citizenship Status | With Coverage | Without Coverage |
| Native Born | 1,186 (94.6%) | 68 (5.4%) |
| Foreign Born, Citizen | 3,086 (95.4%) | 148 (4.6%) |
| Foreign Born, not a Citizen | 1,634 (66.3%) | 832 (33.7%) |
Health Insurance Coverage by Household Income in San Carlos Park
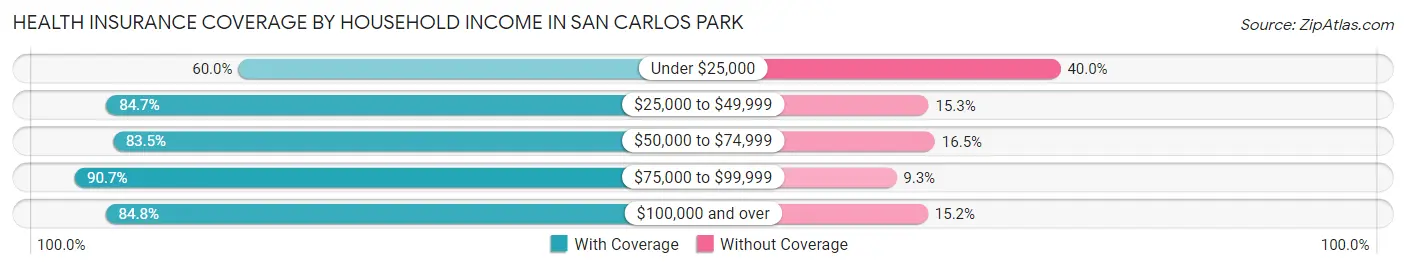
| Household Income | With Coverage | Without Coverage |
| Under $25,000 | 929 (60.0%) | 620 (40.0%) |
| $25,000 to $49,999 | 2,233 (84.7%) | 404 (15.3%) |
| $50,000 to $74,999 | 2,301 (83.5%) | 455 (16.5%) |
| $75,000 to $99,999 | 4,910 (90.7%) | 503 (9.3%) |
| $100,000 and over | 5,529 (84.8%) | 990 (15.2%) |
Public vs Private Health Insurance Coverage by Age in San Carlos Park
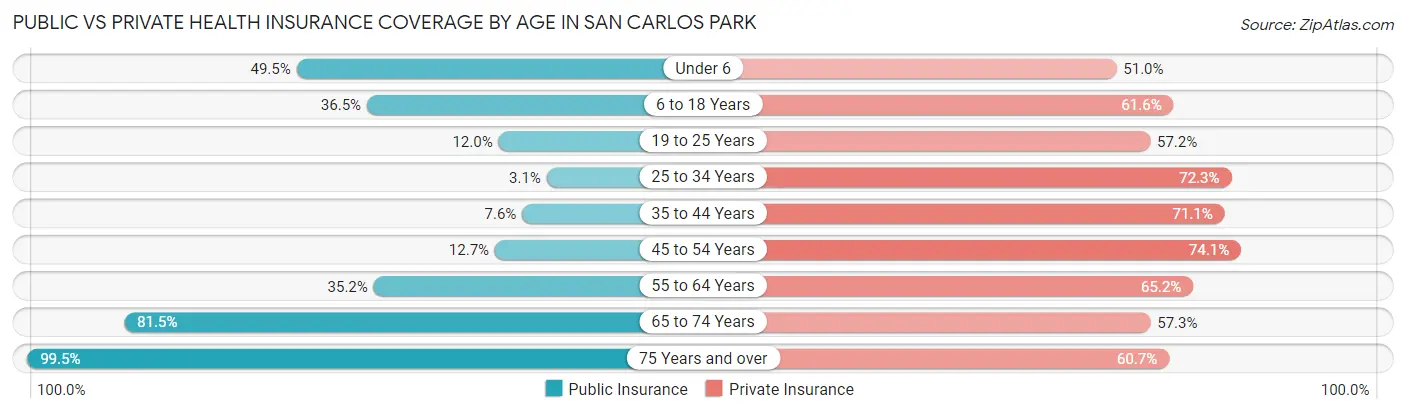
| Age Bracket | Public Insurance | Private Insurance |
| Under 6 | 621 (49.5%) | 639 (51.0%) |
| 6 to 18 Years | 1,179 (36.5%) | 1,991 (61.6%) |
| 19 to 25 Years | 297 (12.0%) | 1,411 (57.2%) |
| 25 to 34 Years | 74 (3.1%) | 1,733 (72.3%) |
| 35 to 44 Years | 218 (7.6%) | 2,028 (71.1%) |
| 45 to 54 Years | 235 (12.7%) | 1,371 (74.1%) |
| 55 to 64 Years | 747 (35.2%) | 1,383 (65.2%) |
| 65 to 74 Years | 1,213 (81.5%) | 852 (57.3%) |
| 75 Years and over | 1,214 (99.5%) | 741 (60.7%) |
| Total | 5,798 (30.7%) | 12,149 (64.3%) |
Disability Status by Sex by Age in San Carlos Park
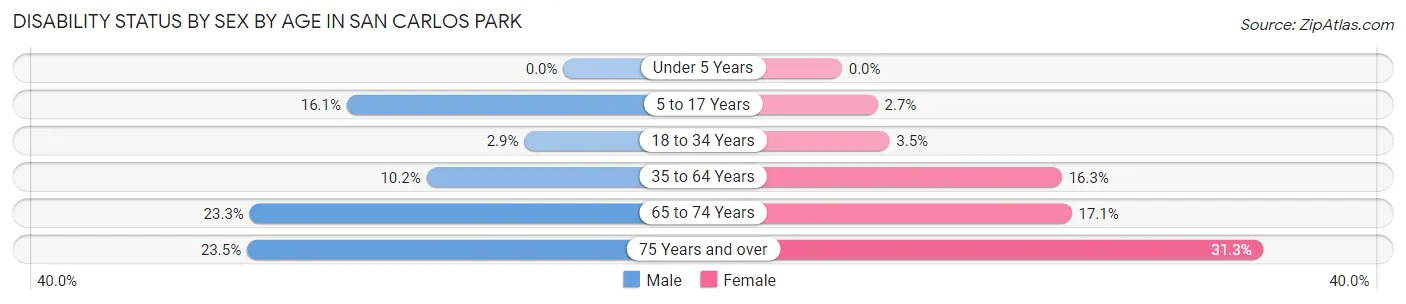
| Age Bracket | Male | Female |
| Under 5 Years | 0 (0.0%) | 0 (0.0%) |
| 5 to 17 Years | 233 (16.1%) | 40 (2.7%) |
| 18 to 34 Years | 94 (2.9%) | 73 (3.5%) |
| 35 to 64 Years | 330 (10.2%) | 584 (16.3%) |
| 65 to 74 Years | 109 (23.3%) | 174 (17.1%) |
| 75 Years and over | 159 (23.5%) | 170 (31.3%) |
Disability Class by Sex by Age in San Carlos Park
Disability Class: Hearing Difficulty
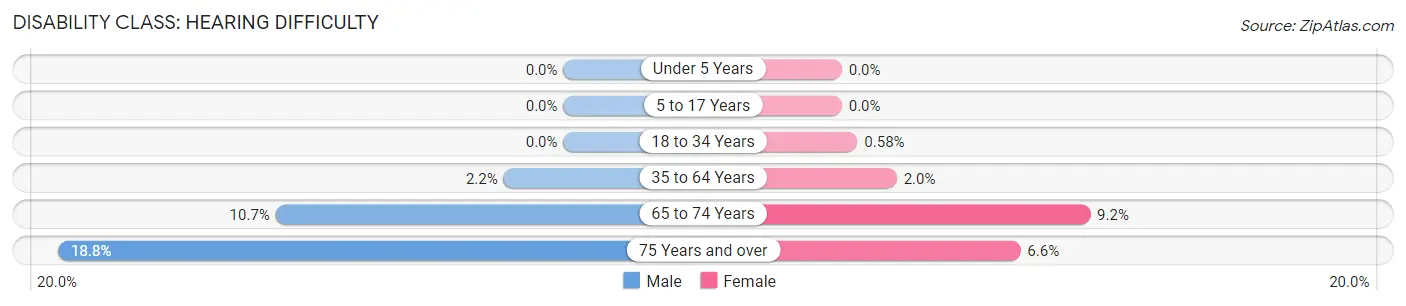
| Age Bracket | Male | Female |
| Under 5 Years | 0 (0.0%) | 0 (0.0%) |
| 5 to 17 Years | 0 (0.0%) | 0 (0.0%) |
| 18 to 34 Years | 0 (0.0%) | 12 (0.6%) |
| 35 to 64 Years | 72 (2.2%) | 73 (2.0%) |
| 65 to 74 Years | 50 (10.7%) | 94 (9.2%) |
| 75 Years and over | 127 (18.8%) | 36 (6.6%) |
Disability Class: Vision Difficulty
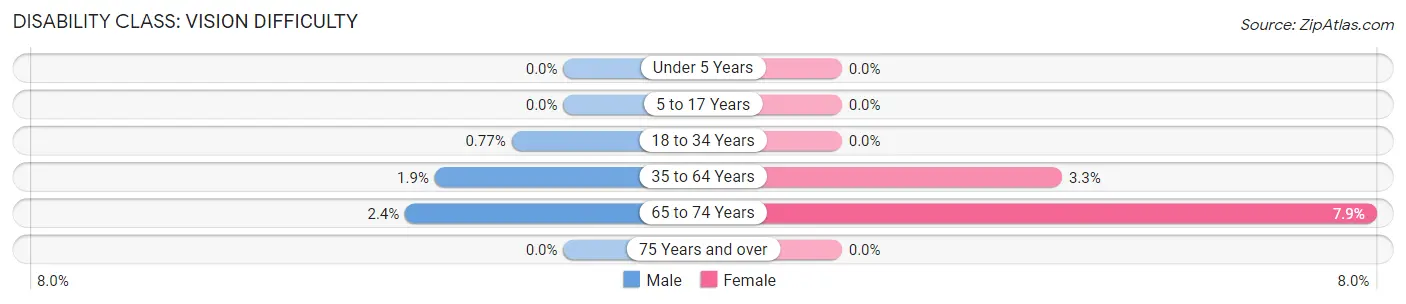
| Age Bracket | Male | Female |
| Under 5 Years | 0 (0.0%) | 0 (0.0%) |
| 5 to 17 Years | 0 (0.0%) | 0 (0.0%) |
| 18 to 34 Years | 25 (0.8%) | 0 (0.0%) |
| 35 to 64 Years | 62 (1.9%) | 117 (3.3%) |
| 65 to 74 Years | 11 (2.4%) | 81 (7.9%) |
| 75 Years and over | 0 (0.0%) | 0 (0.0%) |
Disability Class: Cognitive Difficulty

| Age Bracket | Male | Female |
| 5 to 17 Years | 233 (16.1%) | 40 (2.7%) |
| 18 to 34 Years | 94 (2.9%) | 61 (2.9%) |
| 35 to 64 Years | 52 (1.6%) | 200 (5.6%) |
| 65 to 74 Years | 29 (6.2%) | 80 (7.8%) |
| 75 Years and over | 42 (6.2%) | 66 (12.1%) |
Disability Class: Ambulatory Difficulty
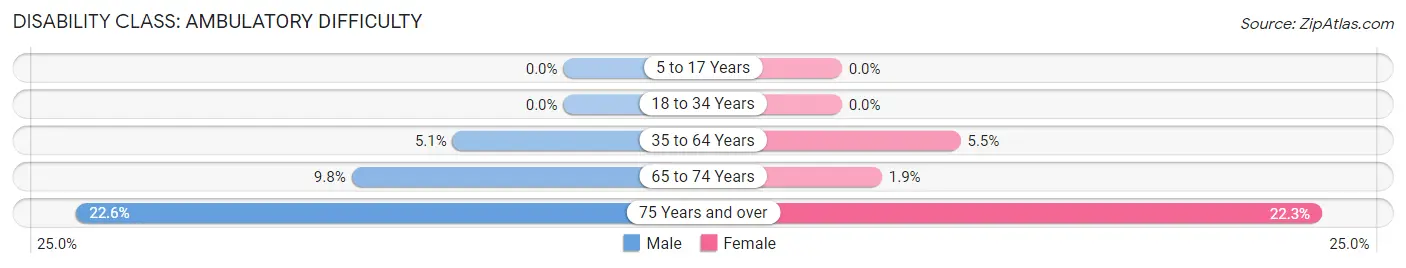
| Age Bracket | Male | Female |
| 5 to 17 Years | 0 (0.0%) | 0 (0.0%) |
| 18 to 34 Years | 0 (0.0%) | 0 (0.0%) |
| 35 to 64 Years | 167 (5.1%) | 197 (5.5%) |
| 65 to 74 Years | 46 (9.8%) | 19 (1.9%) |
| 75 Years and over | 153 (22.6%) | 121 (22.3%) |
Disability Class: Self-Care Difficulty
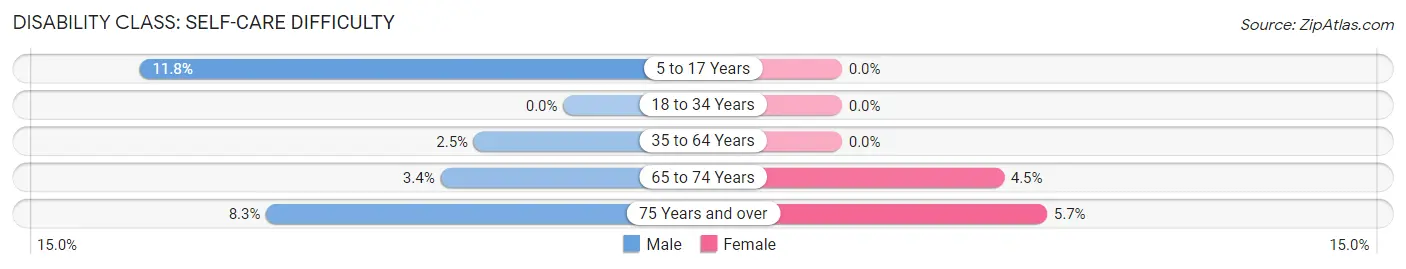
| Age Bracket | Male | Female |
| 5 to 17 Years | 171 (11.8%) | 0 (0.0%) |
| 18 to 34 Years | 0 (0.0%) | 0 (0.0%) |
| 35 to 64 Years | 81 (2.5%) | 0 (0.0%) |
| 65 to 74 Years | 16 (3.4%) | 46 (4.5%) |
| 75 Years and over | 56 (8.3%) | 31 (5.7%) |
Technology Access in San Carlos Park
Computing Device Access in San Carlos Park
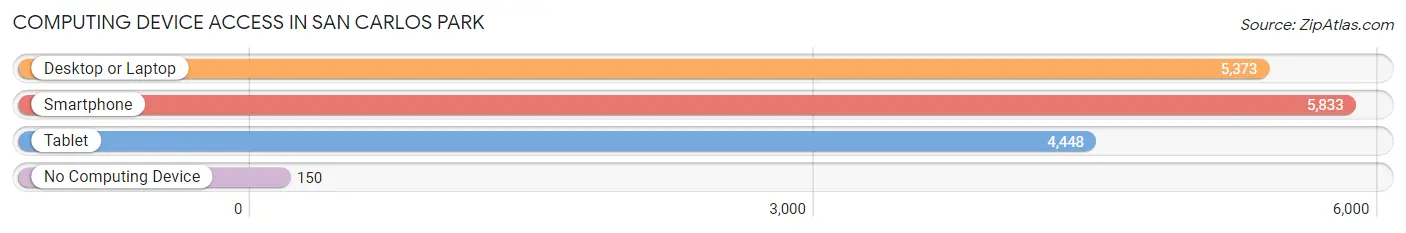
| Device Type | # Households | % Households |
| Desktop or Laptop | 5,373 | 85.4% |
| Smartphone | 5,833 | 92.7% |
| Tablet | 4,448 | 70.7% |
| No Computing Device | 150 | 2.4% |
| Total | 6,291 | 100.0% |
Internet Access in San Carlos Park
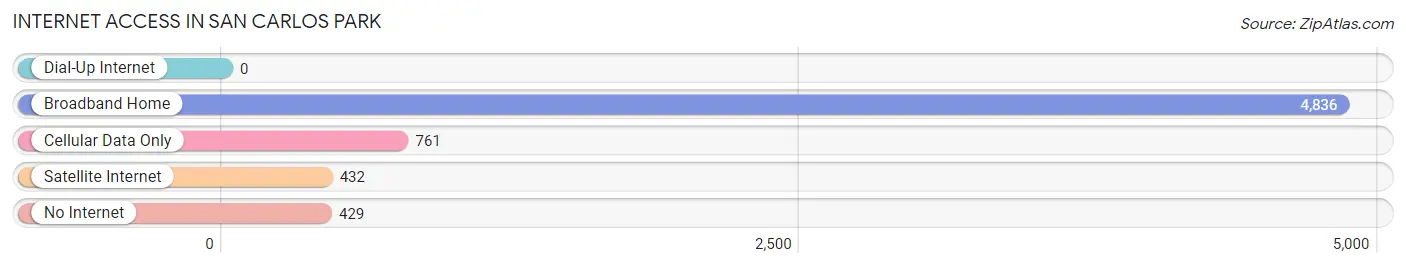
| Internet Type | # Households | % Households |
| Dial-Up Internet | 0 | 0.0% |
| Broadband Home | 4,836 | 76.9% |
| Cellular Data Only | 761 | 12.1% |
| Satellite Internet | 432 | 6.9% |
| No Internet | 429 | 6.8% |
| Total | 6,291 | 100.0% |
San Carlos Park Summary
San Carlos Park is a census-designated place (CDP) located in Lee County, Florida, United States. It is part of the Cape Coral-Fort Myers Metropolitan Statistical Area. As of the 2010 census, the population of San Carlos Park was 8,746.
History
San Carlos Park was originally part of the Seminole Indian Reservation, which was established in 1823. The area was later settled by homesteaders in the late 1800s. The first post office was established in the area in 1887. The area was known as San Carlos until the early 1900s, when it was changed to San Carlos Park.
The area was developed in the 1950s and 1960s as a residential community. The first homes were built in the area in 1954. The community was incorporated as a village in 1959, but was later dissolved in 1965.
Geography
San Carlos Park is located at 26°31'25" North, 81°50'45" West (26.523750, -81.845556). It is bordered by the city of Fort Myers to the south, the city of Cape Coral to the west, and the unincorporated community of Estero to the north.
The CDP has a total area of 8.3 square miles, of which 8.2 square miles is land and 0.1 square miles is water.
Economy
San Carlos Park is primarily a residential community, with no major employers located within the CDP. The majority of residents are employed in the nearby cities of Fort Myers and Cape Coral.
Demographics
As of the 2010 census, there were 8,746 people, 3,845 households, and 2,541 families residing in the CDP. The population density was 1,062.2 people per square mile. There were 4,093 housing units at an average density of 498.2 per square mile. The racial makeup of the CDP was 91.2% White, 3.2% African American, 0.3% Native American, 1.7% Asian, 0.1% Pacific Islander, 1.7% from other races, and 2.0% from two or more races. Hispanic or Latino of any race were 8.7% of the population.
There were 3,845 households, out of which 22.3% had children under the age of 18 living with them, 53.2% were married couples living together, 9.7% had a female householder with no husband present, and 33.2% were non-families. 27.2% of all households were made up of individuals, and 11.7% had someone living alone who was 65 years of age or older. The average household size was 2.27 and the average family size was 2.76.
In the CDP, the population was spread out, with 19.2% under the age of 18, 6.2% from 18 to 24, 24.2% from 25 to 44, 28.2% from 45 to 64, and 22.2% who were 65 years of age or older. The median age was 45 years. For every 100 females, there were 93.2 males. For every 100 females age 18 and over, there were 91.2 males.
The median income for a household in the CDP was $50,945, and the median income for a family was $60,945. Males had a median income of $41,945 versus $30,945 for females. The per capita income for the CDP was $27,945. About 4.2% of families and 6.2% of the population were below the poverty line, including 8.2% of those under age 18 and 4.2% of those age 65 or over.
Common Questions
What is Per Capita Income in San Carlos Park?
Per Capita income in San Carlos Park is $31,212.
What is the Median Family Income in San Carlos Park?
Median Family Income in San Carlos Park is $81,907.
What is the Median Household income in San Carlos Park?
Median Household Income in San Carlos Park is $78,022.
What is Income or Wage Gap in San Carlos Park?
Income or Wage Gap in San Carlos Park is 22.3%.
Women in San Carlos Park earn 77.7 cents for every dollar earned by a man.
What is Inequality or Gini Index in San Carlos Park?
Inequality or Gini Index in San Carlos Park is 0.36.
What is the Total Population of San Carlos Park?
Total Population of San Carlos Park is 18,888.
What is the Total Male Population of San Carlos Park?
Total Male Population of San Carlos Park is 9,620.
What is the Total Female Population of San Carlos Park?
Total Female Population of San Carlos Park is 9,268.
What is the Ratio of Males per 100 Females in San Carlos Park?
There are 103.80 Males per 100 Females in San Carlos Park.
What is the Ratio of Females per 100 Males in San Carlos Park?
There are 96.34 Females per 100 Males in San Carlos Park.
What is the Median Population Age in San Carlos Park?
Median Population Age in San Carlos Park is 35.3 Years.
What is the Average Family Size in San Carlos Park
Average Family Size in San Carlos Park is 3.4 People.
What is the Average Household Size in San Carlos Park
Average Household Size in San Carlos Park is 3.0 People.
How Large is the Labor Force in San Carlos Park?
There are 10,649 People in the Labor Forcein in San Carlos Park.
What is the Percentage of People in the Labor Force in San Carlos Park?
69.6% of People are in the Labor Force in San Carlos Park.
What is the Unemployment Rate in San Carlos Park?
Unemployment Rate in San Carlos Park is 2.1%.