Plantation, FL Map & Demographics
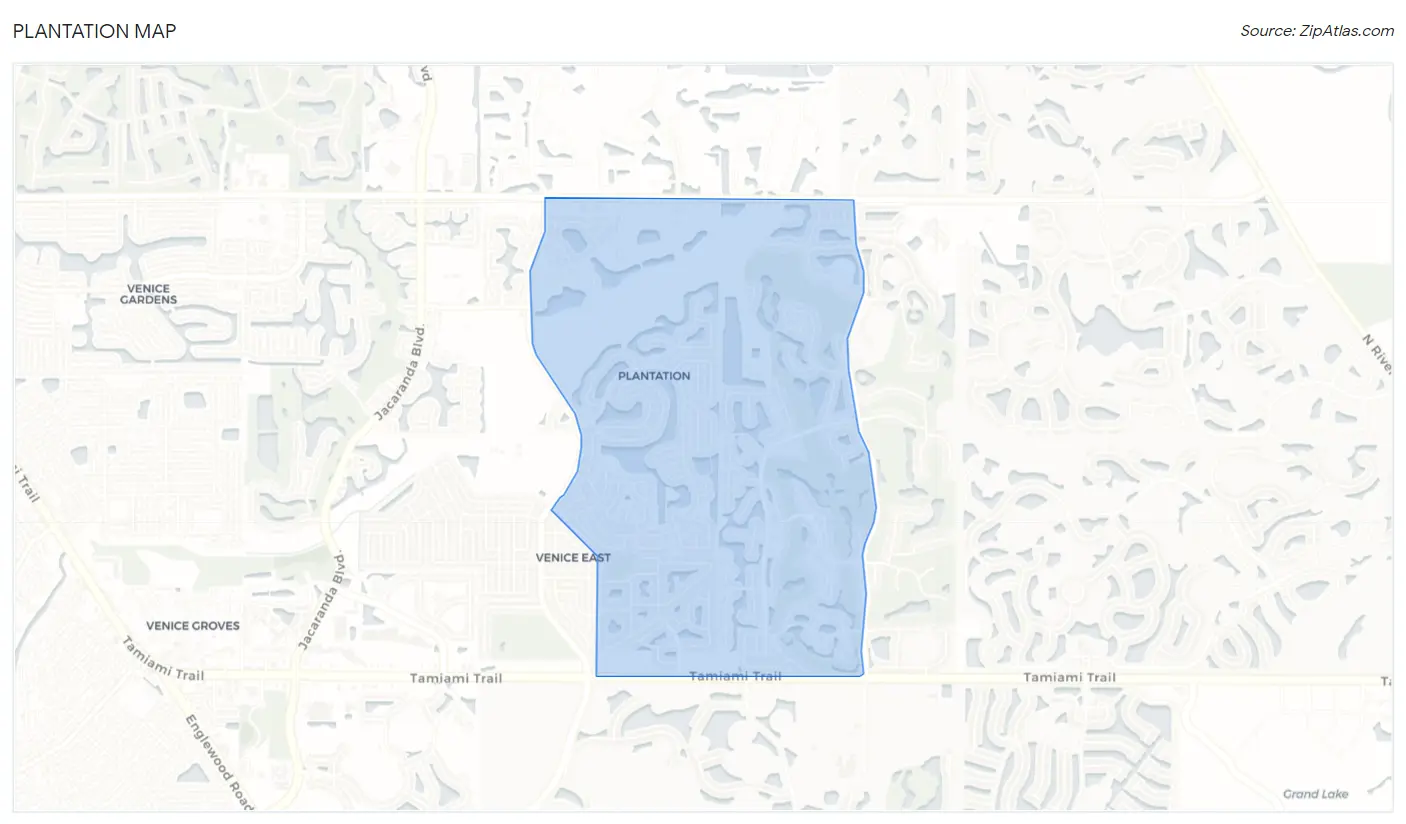
Plantation Map
Plantation Overview
$50,211
PER CAPITA INCOME
$83,403
AVG FAMILY INCOME
$72,209
AVG HOUSEHOLD INCOME
33.6%
WAGE / INCOME GAP [ % ]
66.4¢/ $1
WAGE / INCOME GAP [ $ ]
0.36
INEQUALITY / GINI INDEX
4,274
TOTAL POPULATION
1,908
MALE POPULATION
2,366
FEMALE POPULATION
80.64
MALES / 100 FEMALES
124.00
FEMALES / 100 MALES
72.6
MEDIAN AGE
2.2
AVG FAMILY SIZE
1.7
AVG HOUSEHOLD SIZE
920
LABOR FORCE [ PEOPLE ]
22.6%
PERCENT IN LABOR FORCE
1.4%
UNEMPLOYMENT RATE
Income in Plantation
Income Overview in Plantation
Per Capita Income in Plantation is $50,211, while median incomes of families and households are $83,403 and $72,209 respectively.
| Characteristic | Number | Measure |
| Per Capita Income | 4,274 | $50,211 |
| Median Family Income | 1,409 | $83,403 |
| Mean Family Income | 1,409 | $101,683 |
| Median Household Income | 2,441 | $72,209 |
| Mean Household Income | 2,441 | $88,621 |
| Income Deficit | 1,409 | $0 |
| Wage / Income Gap (%) | 4,274 | 33.63% |
| Wage / Income Gap ($) | 4,274 | 66.37¢ per $1 |
| Gini / Inequality Index | 4,274 | 0.36 |
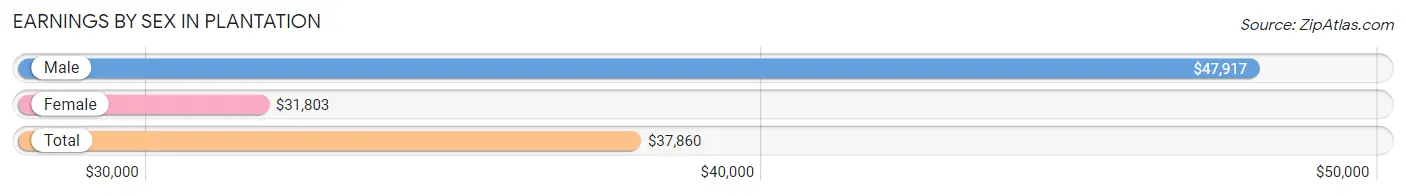
Earnings by Sex in Plantation
Average Earnings in Plantation are $37,860, $47,917 for men and $31,803 for women, a difference of 33.6%.
| Sex | Number | Average Earnings |
| Male | 498 (47.4%) | $47,917 |
| Female | 553 (52.6%) | $31,803 |
| Total | 1,051 (100.0%) | $37,860 |
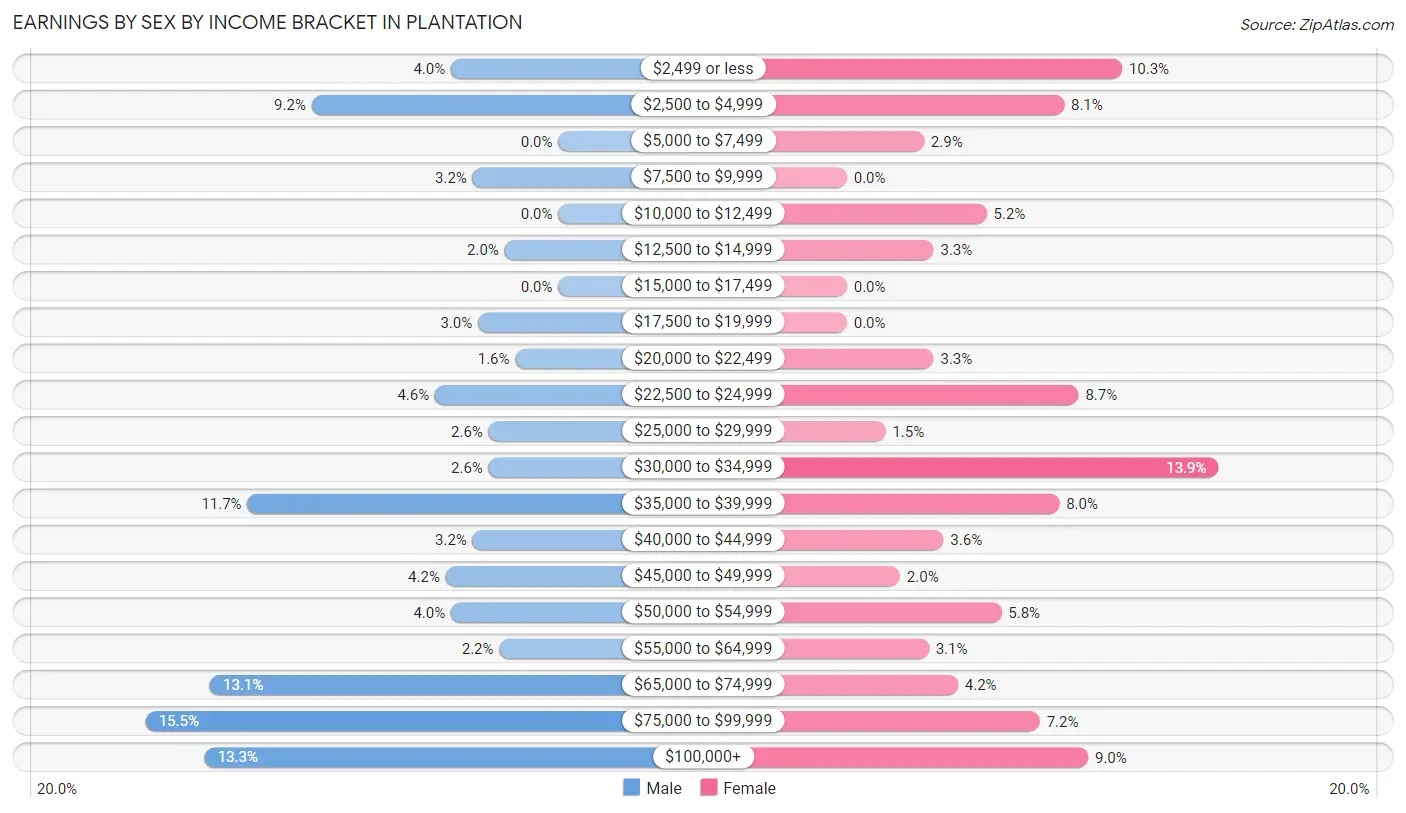
Earnings by Sex by Income Bracket in Plantation
The most common earnings brackets in Plantation are $75,000 to $99,999 for men (77 | 15.5%) and $30,000 to $34,999 for women (77 | 13.9%).
| Income | Male | Female |
| $2,499 or less | 20 (4.0%) | 57 (10.3%) |
| $2,500 to $4,999 | 46 (9.2%) | 45 (8.1%) |
| $5,000 to $7,499 | 0 (0.0%) | 16 (2.9%) |
| $7,500 to $9,999 | 16 (3.2%) | 0 (0.0%) |
| $10,000 to $12,499 | 0 (0.0%) | 29 (5.2%) |
| $12,500 to $14,999 | 10 (2.0%) | 18 (3.3%) |
| $15,000 to $17,499 | 0 (0.0%) | 0 (0.0%) |
| $17,500 to $19,999 | 15 (3.0%) | 0 (0.0%) |
| $20,000 to $22,499 | 8 (1.6%) | 18 (3.3%) |
| $22,500 to $24,999 | 23 (4.6%) | 48 (8.7%) |
| $25,000 to $29,999 | 13 (2.6%) | 8 (1.5%) |
| $30,000 to $34,999 | 13 (2.6%) | 77 (13.9%) |
| $35,000 to $39,999 | 58 (11.7%) | 44 (8.0%) |
| $40,000 to $44,999 | 16 (3.2%) | 20 (3.6%) |
| $45,000 to $49,999 | 21 (4.2%) | 11 (2.0%) |
| $50,000 to $54,999 | 20 (4.0%) | 32 (5.8%) |
| $55,000 to $64,999 | 11 (2.2%) | 17 (3.1%) |
| $65,000 to $74,999 | 65 (13.1%) | 23 (4.2%) |
| $75,000 to $99,999 | 77 (15.5%) | 40 (7.2%) |
| $100,000+ | 66 (13.3%) | 50 (9.0%) |
| Total | 498 (100.0%) | 553 (100.0%) |
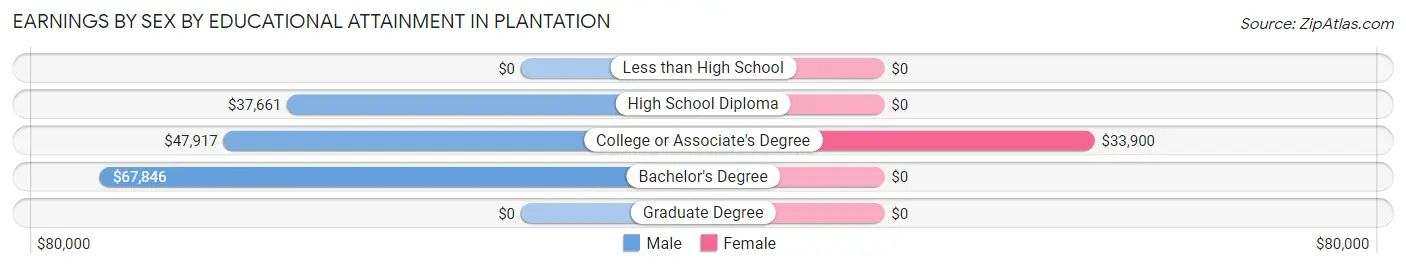
Earnings by Sex by Educational Attainment in Plantation
Average earnings in Plantation are $47,917 for men and $32,091 for women, a difference of 33.0%. Men with an educational attainment of bachelor's degree enjoy the highest average annual earnings of $67,846, while those with high school diploma education earn the least with $37,661. Women with an educational attainment of college or associate's degree earn the most with the average annual earnings of $33,900, while those with college or associate's degree education have the smallest earnings of $33,900.
| Educational Attainment | Male Income | Female Income |
| Less than High School | - | - |
| High School Diploma | $37,661 | $0 |
| College or Associate's Degree | $47,917 | $33,900 |
| Bachelor's Degree | $67,846 | $0 |
| Graduate Degree | - | - |
| Total | $47,917 | $32,091 |
Family Income in Plantation
Family Income Brackets in Plantation
According to the Plantation family income data, there are 417 families falling into the $50,000 to $74,999 income range, which is the most common income bracket and makes up 29.6% of all families.
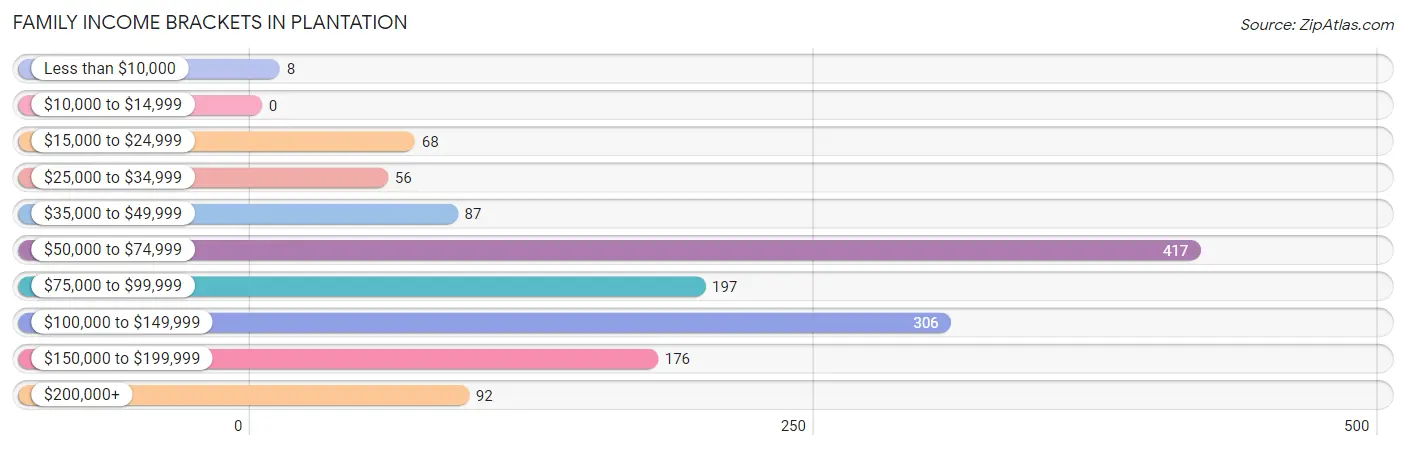
| Income Bracket | # Families | % Families |
| Less than $10,000 | 8 | 0.6% |
| $10,000 to $14,999 | 0 | 0.0% |
| $15,000 to $24,999 | 68 | 4.8% |
| $25,000 to $34,999 | 56 | 4.0% |
| $35,000 to $49,999 | 87 | 6.2% |
| $50,000 to $74,999 | 417 | 29.6% |
| $75,000 to $99,999 | 197 | 14.0% |
| $100,000 to $149,999 | 306 | 21.7% |
| $150,000 to $199,999 | 176 | 12.5% |
| $200,000+ | 92 | 6.5% |
Family Income by Famaliy Size in Plantation
4-person families (78 | 5.5%) account for the highest median family income in Plantation with $92,031 per family, while 2-person families (1,236 | 87.7%) have the highest median income of $38,810 per family member.
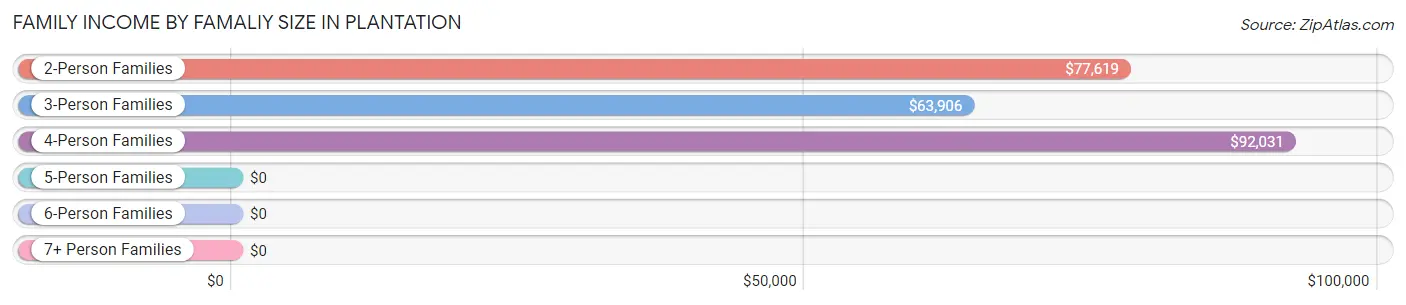
| Income Bracket | # Families | Median Income |
| 2-Person Families | 1,236 (87.7%) | $77,619 |
| 3-Person Families | 91 (6.5%) | $63,906 |
| 4-Person Families | 78 (5.5%) | $92,031 |
| 5-Person Families | 0 (0.0%) | $0 |
| 6-Person Families | 4 (0.3%) | $0 |
| 7+ Person Families | 0 (0.0%) | $0 |
| Total | 1,409 (100.0%) | $83,403 |
Family Income by Number of Earners in Plantation
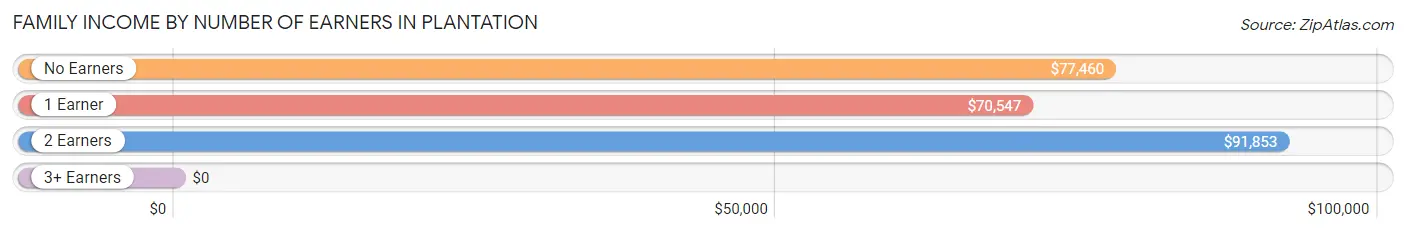
| Number of Earners | # Families | Median Income |
| No Earners | 927 (65.8%) | $77,460 |
| 1 Earner | 235 (16.7%) | $70,547 |
| 2 Earners | 247 (17.5%) | $91,853 |
| 3+ Earners | 0 (0.0%) | $0 |
| Total | 1,409 (100.0%) | $83,403 |
Household Income in Plantation
Household Income Brackets in Plantation
With 657 households falling in the category, the $50,000 to $74,999 income range is the most frequent in Plantation, accounting for 26.9% of all households. In contrast, only 12 households (0.5%) fall into the $10,000 to $14,999 income bracket, making it the least populous group.
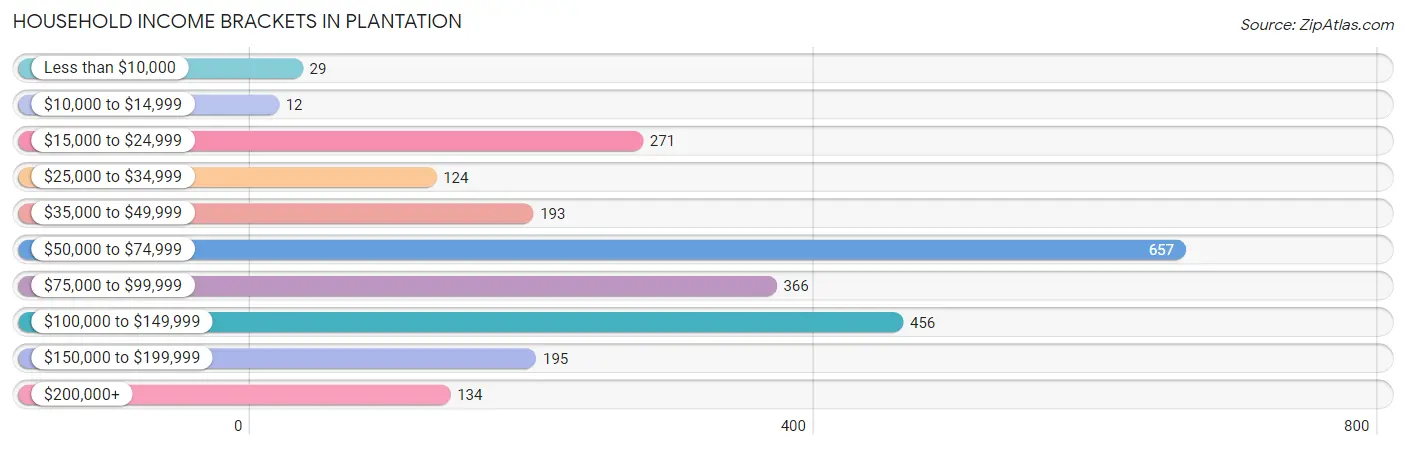
| Income Bracket | # Households | % Households |
| Less than $10,000 | 29 | 1.2% |
| $10,000 to $14,999 | 12 | 0.5% |
| $15,000 to $24,999 | 271 | 11.1% |
| $25,000 to $34,999 | 124 | 5.1% |
| $35,000 to $49,999 | 193 | 7.9% |
| $50,000 to $74,999 | 657 | 26.9% |
| $75,000 to $99,999 | 366 | 15.0% |
| $100,000 to $149,999 | 456 | 18.7% |
| $150,000 to $199,999 | 195 | 8.0% |
| $200,000+ | 134 | 5.5% |
Household Income by Householder Age in Plantation
The median household income in Plantation is $72,209, with the highest median household income of $90,365 found in the 25 to 44 years age bracket for the primary householder. A total of 136 households (5.6%) fall into this category.
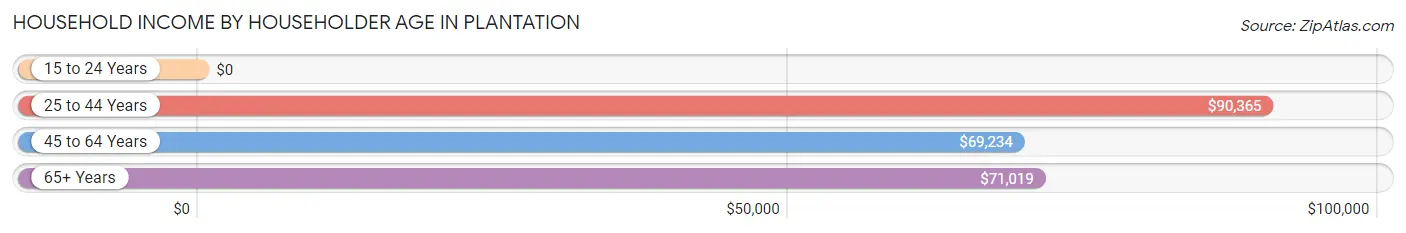
| Income Bracket | # Households | Median Income |
| 15 to 24 Years | 0 (0.0%) | $0 |
| 25 to 44 Years | 136 (5.6%) | $90,365 |
| 45 to 64 Years | 319 (13.1%) | $69,234 |
| 65+ Years | 1,986 (81.4%) | $71,019 |
| Total | 2,441 (100.0%) | $72,209 |
Poverty in Plantation
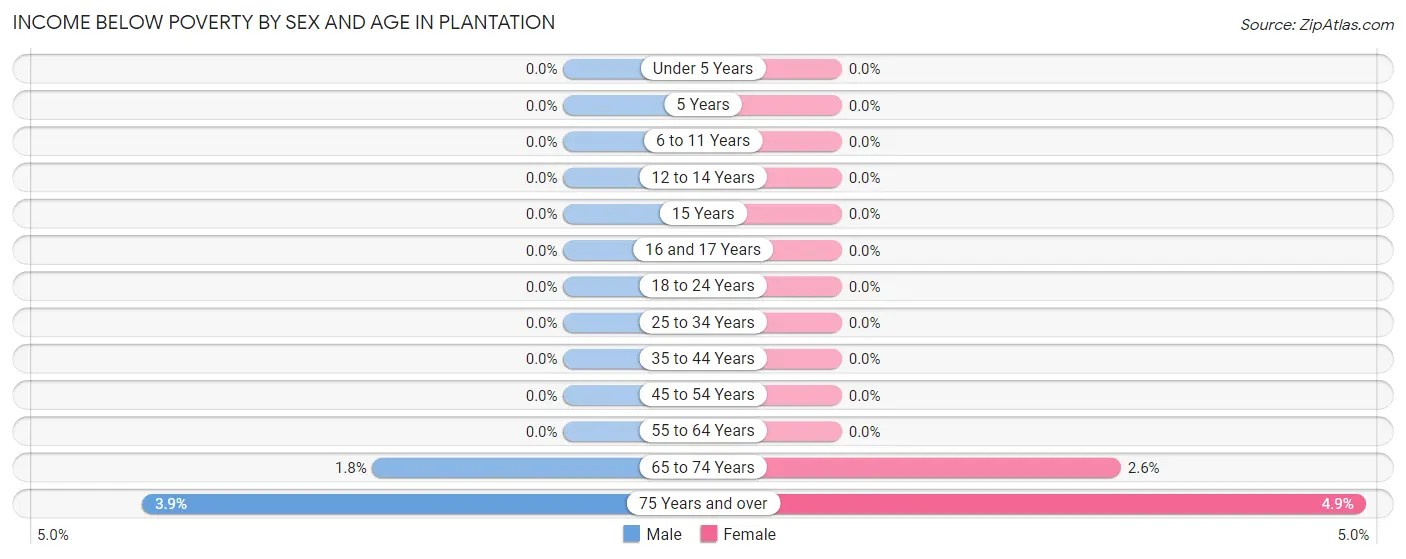
Income Below Poverty by Sex and Age in Plantation
With 2.2% poverty level for males and 2.8% for females among the residents of Plantation, 75 year old and over males and 75 year old and over females are the most vulnerable to poverty, with 34 males (3.9%) and 45 females (4.9%) in their respective age groups living below the poverty level.
| Age Bracket | Male | Female |
| Under 5 Years | 0 (0.0%) | 0 (0.0%) |
| 5 Years | 0 (0.0%) | 0 (0.0%) |
| 6 to 11 Years | 0 (0.0%) | 0 (0.0%) |
| 12 to 14 Years | 0 (0.0%) | 0 (0.0%) |
| 15 Years | 0 (0.0%) | 0 (0.0%) |
| 16 and 17 Years | 0 (0.0%) | 0 (0.0%) |
| 18 to 24 Years | 0 (0.0%) | 0 (0.0%) |
| 25 to 34 Years | 0 (0.0%) | 0 (0.0%) |
| 35 to 44 Years | 0 (0.0%) | 0 (0.0%) |
| 45 to 54 Years | 0 (0.0%) | 0 (0.0%) |
| 55 to 64 Years | 0 (0.0%) | 0 (0.0%) |
| 65 to 74 Years | 9 (1.8%) | 22 (2.6%) |
| 75 Years and over | 34 (3.9%) | 45 (4.9%) |
| Total | 43 (2.2%) | 67 (2.8%) |
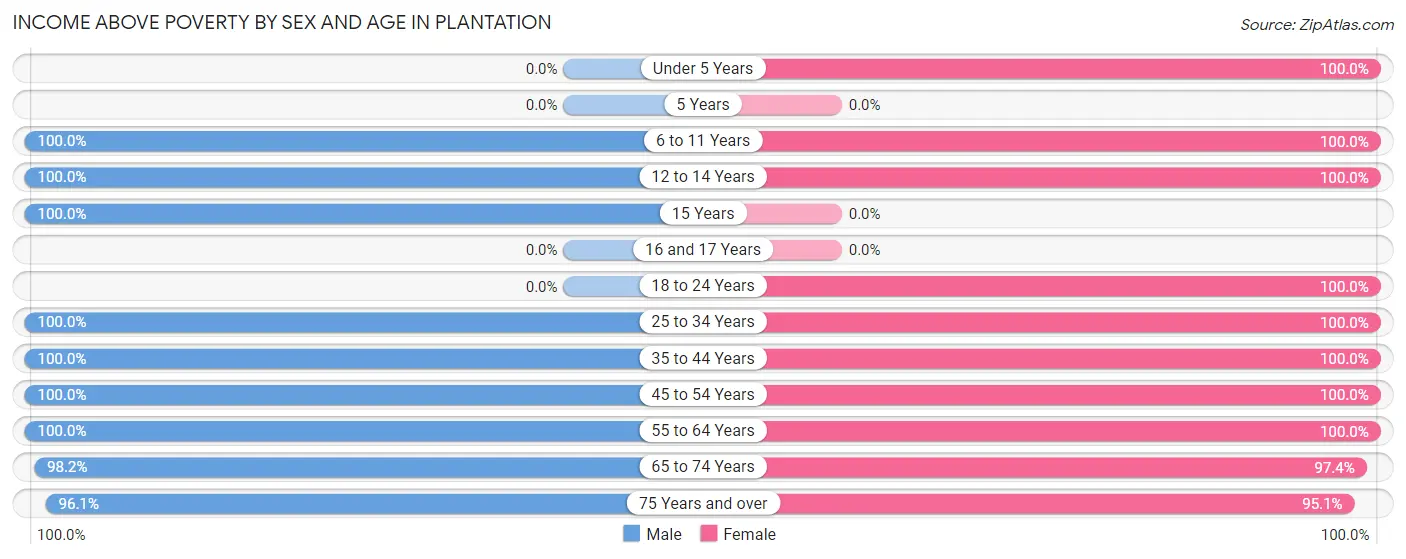
Income Above Poverty by Sex and Age in Plantation
According to the poverty statistics in Plantation, males aged 6 to 11 years and females aged under 5 years are the age groups that are most secure financially, with 100.0% of males and 100.0% of females in these age groups living above the poverty line.
| Age Bracket | Male | Female |
| Under 5 Years | 0 (0.0%) | 2 (100.0%) |
| 5 Years | 0 (0.0%) | 0 (0.0%) |
| 6 to 11 Years | 43 (100.0%) | 70 (100.0%) |
| 12 to 14 Years | 73 (100.0%) | 12 (100.0%) |
| 15 Years | 5 (100.0%) | 0 (0.0%) |
| 16 and 17 Years | 0 (0.0%) | 0 (0.0%) |
| 18 to 24 Years | 0 (0.0%) | 12 (100.0%) |
| 25 to 34 Years | 61 (100.0%) | 48 (100.0%) |
| 35 to 44 Years | 96 (100.0%) | 27 (100.0%) |
| 45 to 54 Years | 53 (100.0%) | 92 (100.0%) |
| 55 to 64 Years | 199 (100.0%) | 327 (100.0%) |
| 65 to 74 Years | 500 (98.2%) | 828 (97.4%) |
| 75 Years and over | 835 (96.1%) | 881 (95.1%) |
| Total | 1,865 (97.8%) | 2,299 (97.2%) |
Income Below Poverty Among Married-Couple Families in Plantation
The poverty statistics for married-couple families in Plantation show that 2.7% or 35 of the total 1,316 families live below the poverty line. Families with no children have the highest poverty rate of 2.9%, comprising of 35 families. On the other hand, families with 1 or 2 children have the lowest poverty rate of 0.0%, which includes 0 families.
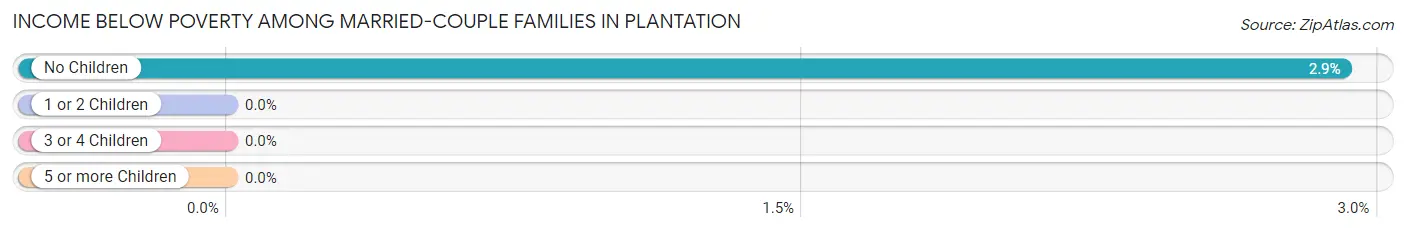
| Children | Above Poverty | Below Poverty |
| No Children | 1,167 (97.1%) | 35 (2.9%) |
| 1 or 2 Children | 110 (100.0%) | 0 (0.0%) |
| 3 or 4 Children | 4 (100.0%) | 0 (0.0%) |
| 5 or more Children | 0 (0.0%) | 0 (0.0%) |
| Total | 1,281 (97.3%) | 35 (2.7%) |
Income Below Poverty Among Single-Parent Households in Plantation
| Children | Single Father | Single Mother |
| No Children | 0 (0.0%) | 0 (0.0%) |
| 1 or 2 Children | 0 (0.0%) | 0 (0.0%) |
| 3 or 4 Children | 0 (0.0%) | 0 (0.0%) |
| 5 or more Children | 0 (0.0%) | 0 (0.0%) |
| Total | 0 (0.0%) | 0 (0.0%) |
Income Below Poverty Among Married-Couple vs Single-Parent Households in Plantation
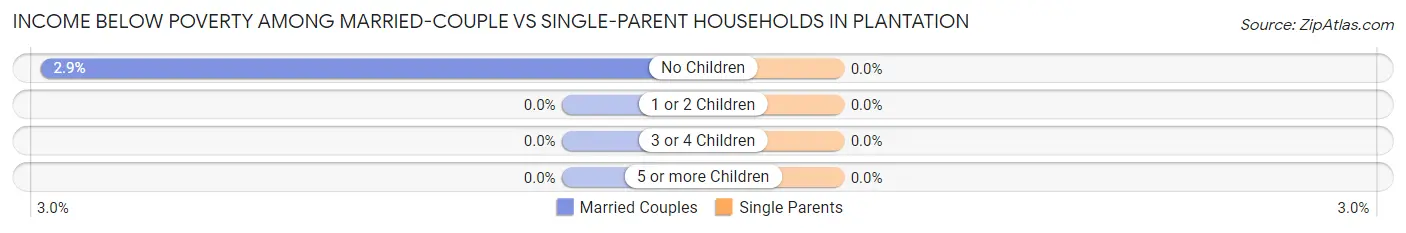
| Children | Married-Couple Families | Single-Parent Households |
| No Children | 35 (2.9%) | 0 (0.0%) |
| 1 or 2 Children | 0 (0.0%) | 0 (0.0%) |
| 3 or 4 Children | 0 (0.0%) | 0 (0.0%) |
| 5 or more Children | 0 (0.0%) | 0 (0.0%) |
| Total | 35 (2.7%) | 0 (0.0%) |
Race in Plantation
The most populous races in Plantation are White / Caucasian (4,120 | 96.4%), Hispanic or Latino (97 | 2.3%), and Two or more Races (61 | 1.4%).
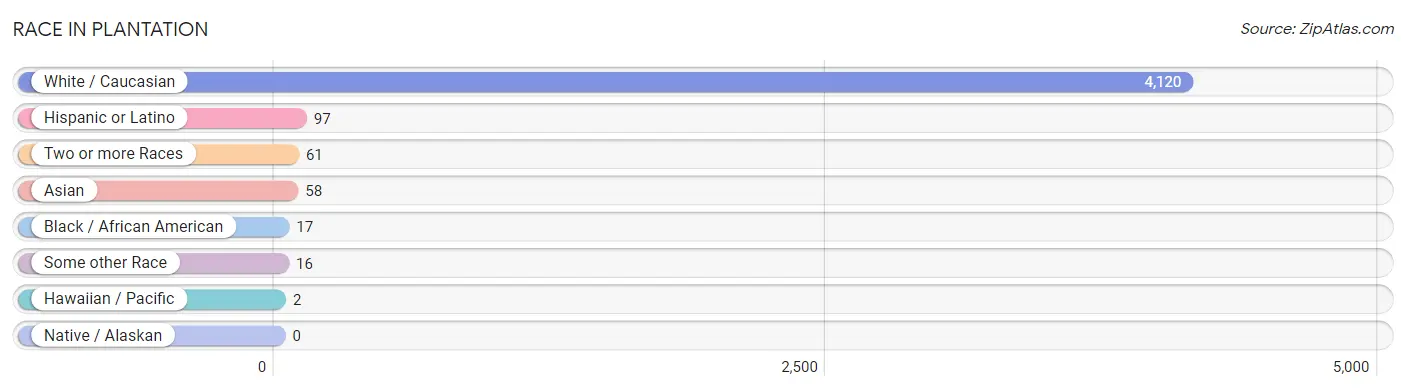
| Race | # Population | % Population |
| Asian | 58 | 1.4% |
| Black / African American | 17 | 0.4% |
| Hawaiian / Pacific | 2 | 0.1% |
| Hispanic or Latino | 97 | 2.3% |
| Native / Alaskan | 0 | 0.0% |
| White / Caucasian | 4,120 | 96.4% |
| Two or more Races | 61 | 1.4% |
| Some other Race | 16 | 0.4% |
| Total | 4,274 | 100.0% |
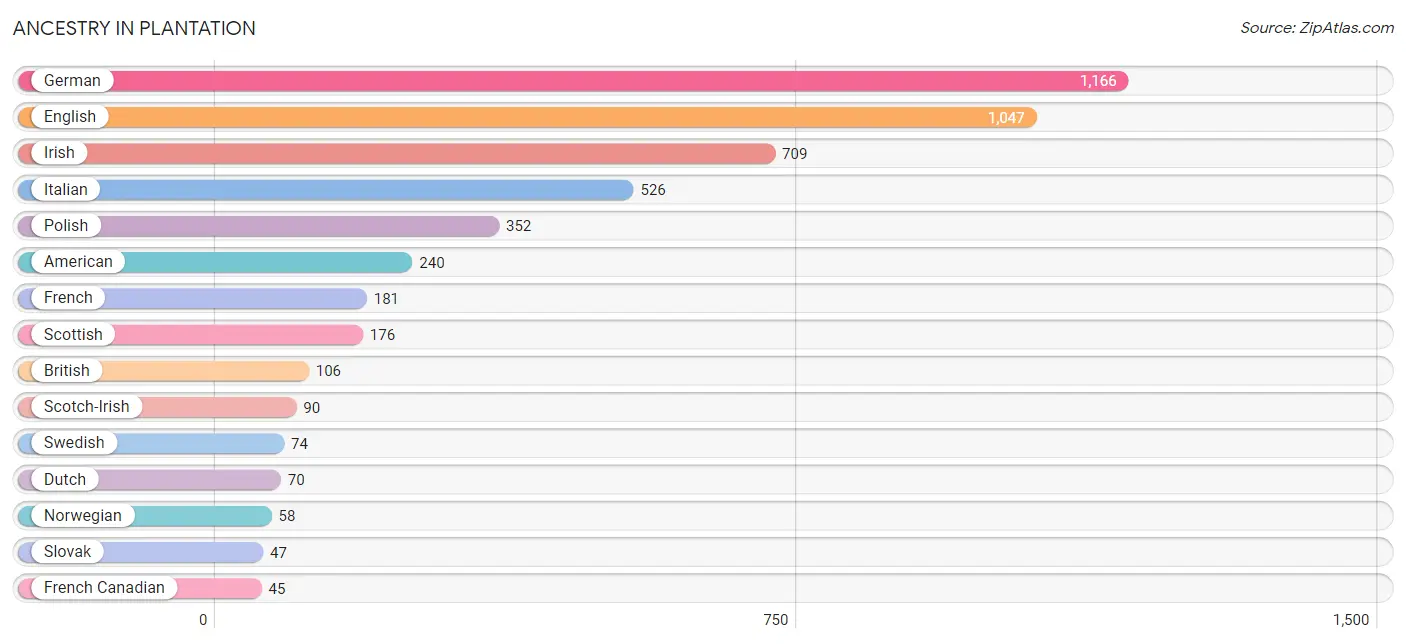
Ancestry in Plantation
The most populous ancestries reported in Plantation are German (1,166 | 27.3%), English (1,047 | 24.5%), Irish (709 | 16.6%), Italian (526 | 12.3%), and Polish (352 | 8.2%), together accounting for 88.9% of all Plantation residents.
| Ancestry | # Population | % Population |
| American | 240 | 5.6% |
| Belgian | 7 | 0.2% |
| British | 106 | 2.5% |
| Burmese | 8 | 0.2% |
| Canadian | 21 | 0.5% |
| Cherokee | 14 | 0.3% |
| Chilean | 36 | 0.8% |
| Cuban | 8 | 0.2% |
| Czech | 41 | 1.0% |
| Danish | 28 | 0.7% |
| Dutch | 70 | 1.6% |
| Eastern European | 18 | 0.4% |
| English | 1,047 | 24.5% |
| European | 8 | 0.2% |
| Finnish | 10 | 0.2% |
| French | 181 | 4.2% |
| French Canadian | 45 | 1.1% |
| German | 1,166 | 27.3% |
| Greek | 17 | 0.4% |
| Guamanian / Chamorro | 7 | 0.2% |
| Hungarian | 27 | 0.6% |
| Irish | 709 | 16.6% |
| Italian | 526 | 12.3% |
| Jamaican | 8 | 0.2% |
| Luxembourger | 15 | 0.4% |
| Northern European | 8 | 0.2% |
| Norwegian | 58 | 1.4% |
| Polish | 352 | 8.2% |
| Portuguese | 10 | 0.2% |
| Puerto Rican | 25 | 0.6% |
| Russian | 16 | 0.4% |
| Scotch-Irish | 90 | 2.1% |
| Scottish | 176 | 4.1% |
| Slovak | 47 | 1.1% |
| South African | 9 | 0.2% |
| South American | 36 | 0.8% |
| South American Indian | 12 | 0.3% |
| Spaniard | 20 | 0.5% |
| Spanish | 8 | 0.2% |
| Sri Lankan | 38 | 0.9% |
| Subsaharan African | 9 | 0.2% |
| Swedish | 74 | 1.7% |
| Swiss | 20 | 0.5% |
| Thai | 12 | 0.3% |
| Ukrainian | 11 | 0.3% |
| Welsh | 10 | 0.2% | View All 46 Rows |
Immigrants in Plantation
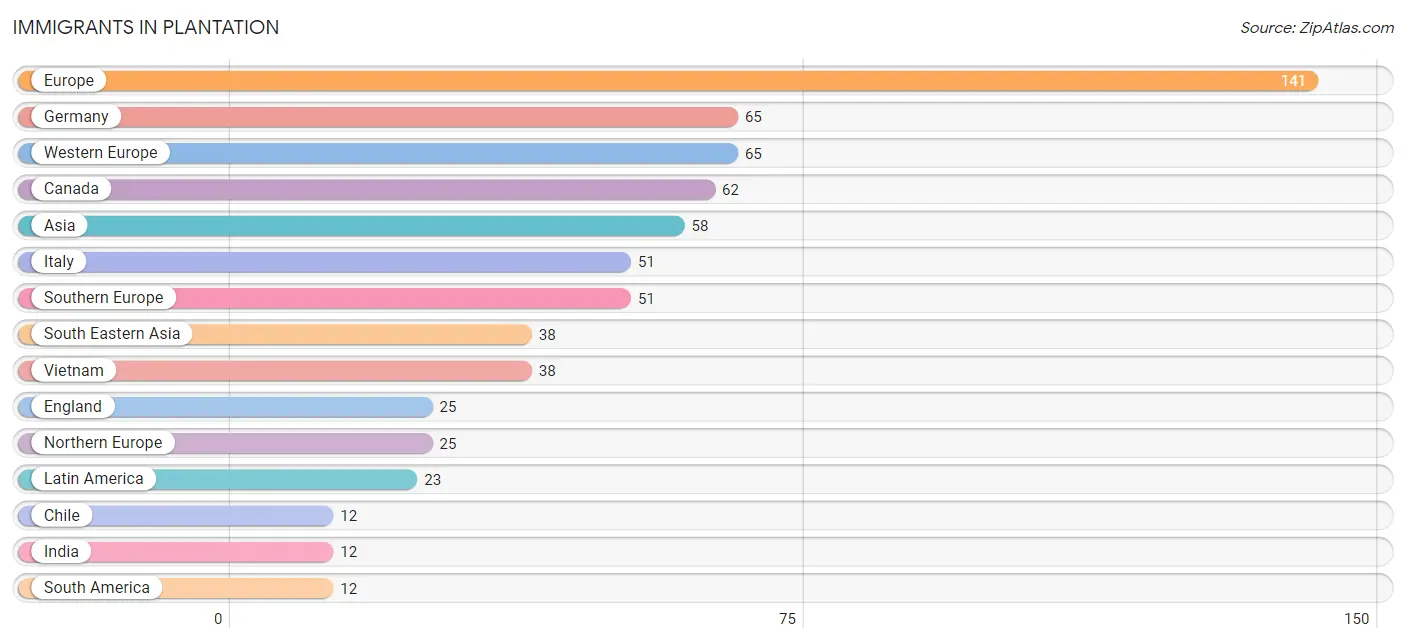
The most numerous immigrant groups reported in Plantation came from Europe (141 | 3.3%), Germany (65 | 1.5%), Western Europe (65 | 1.5%), Canada (62 | 1.5%), and Asia (58 | 1.4%), together accounting for 9.1% of all Plantation residents.
| Immigration Origin | # Population | % Population |
| Africa | 9 | 0.2% |
| Asia | 58 | 1.4% |
| Canada | 62 | 1.5% |
| Caribbean | 11 | 0.3% |
| Chile | 12 | 0.3% |
| Cuba | 3 | 0.1% |
| Eastern Asia | 8 | 0.2% |
| England | 25 | 0.6% |
| Europe | 141 | 3.3% |
| Germany | 65 | 1.5% |
| India | 12 | 0.3% |
| Italy | 51 | 1.2% |
| Jamaica | 8 | 0.2% |
| Korea | 8 | 0.2% |
| Latin America | 23 | 0.5% |
| Northern Europe | 25 | 0.6% |
| South Africa | 9 | 0.2% |
| South America | 12 | 0.3% |
| South Central Asia | 12 | 0.3% |
| South Eastern Asia | 38 | 0.9% |
| Southern Europe | 51 | 1.2% |
| Vietnam | 38 | 0.9% |
| Western Europe | 65 | 1.5% | View All 23 Rows |
Sex and Age in Plantation
Sex and Age in Plantation
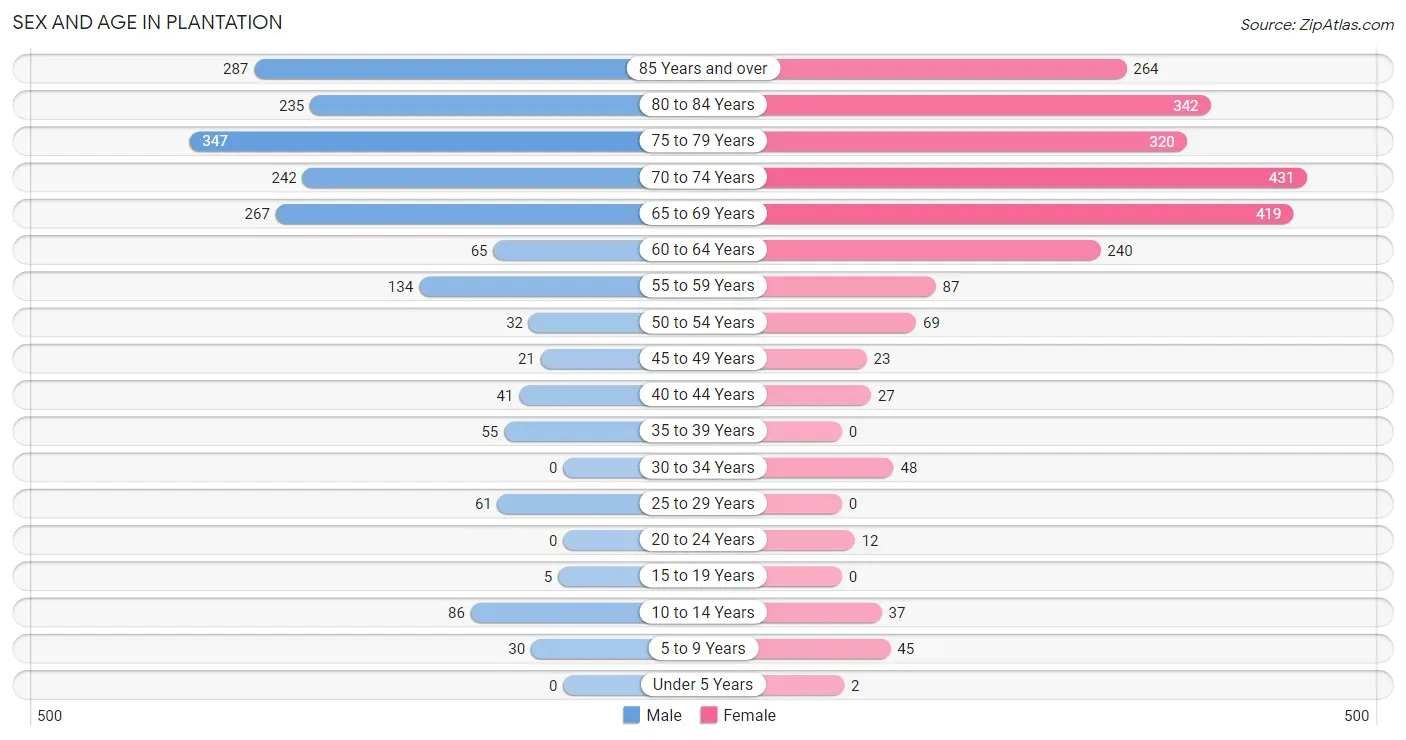
The most populous age groups in Plantation are 75 to 79 Years (347 | 18.2%) for men and 70 to 74 Years (431 | 18.2%) for women.
| Age Bracket | Male | Female |
| Under 5 Years | 0 (0.0%) | 2 (0.1%) |
| 5 to 9 Years | 30 (1.6%) | 45 (1.9%) |
| 10 to 14 Years | 86 (4.5%) | 37 (1.6%) |
| 15 to 19 Years | 5 (0.3%) | 0 (0.0%) |
| 20 to 24 Years | 0 (0.0%) | 12 (0.5%) |
| 25 to 29 Years | 61 (3.2%) | 0 (0.0%) |
| 30 to 34 Years | 0 (0.0%) | 48 (2.0%) |
| 35 to 39 Years | 55 (2.9%) | 0 (0.0%) |
| 40 to 44 Years | 41 (2.1%) | 27 (1.1%) |
| 45 to 49 Years | 21 (1.1%) | 23 (1.0%) |
| 50 to 54 Years | 32 (1.7%) | 69 (2.9%) |
| 55 to 59 Years | 134 (7.0%) | 87 (3.7%) |
| 60 to 64 Years | 65 (3.4%) | 240 (10.1%) |
| 65 to 69 Years | 267 (14.0%) | 419 (17.7%) |
| 70 to 74 Years | 242 (12.7%) | 431 (18.2%) |
| 75 to 79 Years | 347 (18.2%) | 320 (13.5%) |
| 80 to 84 Years | 235 (12.3%) | 342 (14.4%) |
| 85 Years and over | 287 (15.0%) | 264 (11.2%) |
| Total | 1,908 (100.0%) | 2,366 (100.0%) |
Families and Households in Plantation
Median Family Size in Plantation
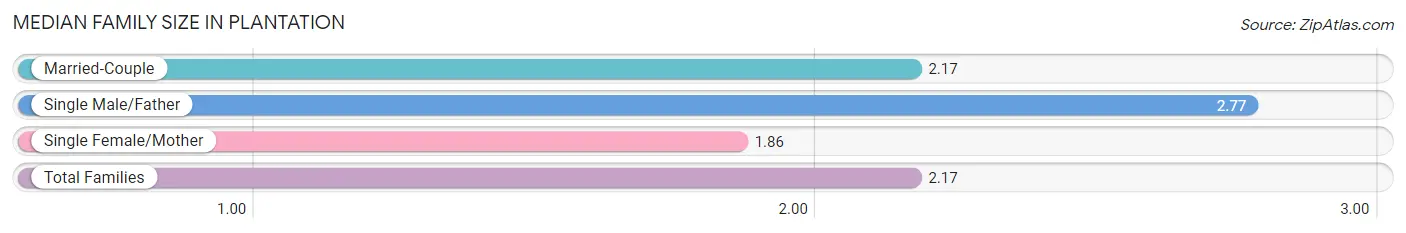
The median family size in Plantation is 2.17 persons per family, with single male/father families (22 | 1.6%) accounting for the largest median family size of 2.77 persons per family. On the other hand, single female/mother families (71 | 5.0%) represent the smallest median family size with 1.86 persons per family.
| Family Type | # Families | Family Size |
| Married-Couple | 1,316 (93.4%) | 2.17 |
| Single Male/Father | 22 (1.6%) | 2.77 |
| Single Female/Mother | 71 (5.0%) | 1.86 |
| Total Families | 1,409 (100.0%) | 2.17 |
Median Household Size in Plantation
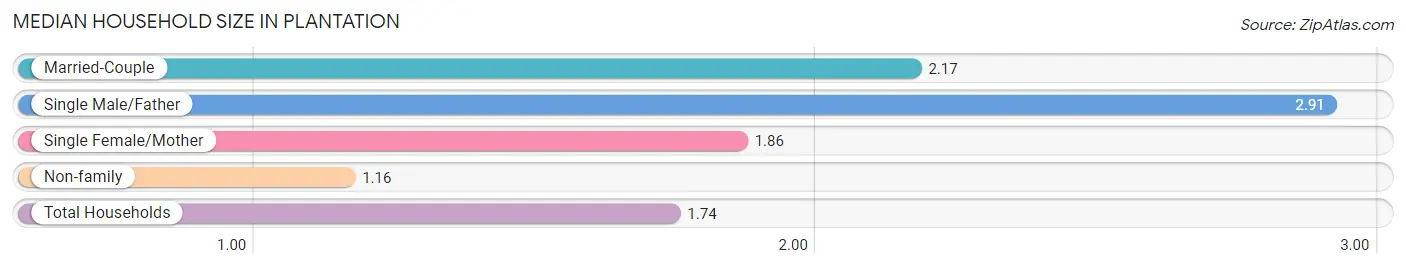
The median household size in Plantation is 1.74 persons per household, with single male/father households (22 | 0.9%) accounting for the largest median household size of 2.91 persons per household. non-family households (1,032 | 42.3%) represent the smallest median household size with 1.16 persons per household.
| Household Type | # Households | Household Size |
| Married-Couple | 1,316 (53.9%) | 2.17 |
| Single Male/Father | 22 (0.9%) | 2.91 |
| Single Female/Mother | 71 (2.9%) | 1.86 |
| Non-family | 1,032 (42.3%) | 1.16 |
| Total Households | 2,441 (100.0%) | 1.74 |
Household Size by Marriage Status in Plantation
Out of a total of 2,441 households in Plantation, 1,409 (57.7%) are family households, while 1,032 (42.3%) are nonfamily households. The most numerous type of family households are 2-person households, comprising 1,236, and the most common type of nonfamily households are 1-person households, comprising 869.
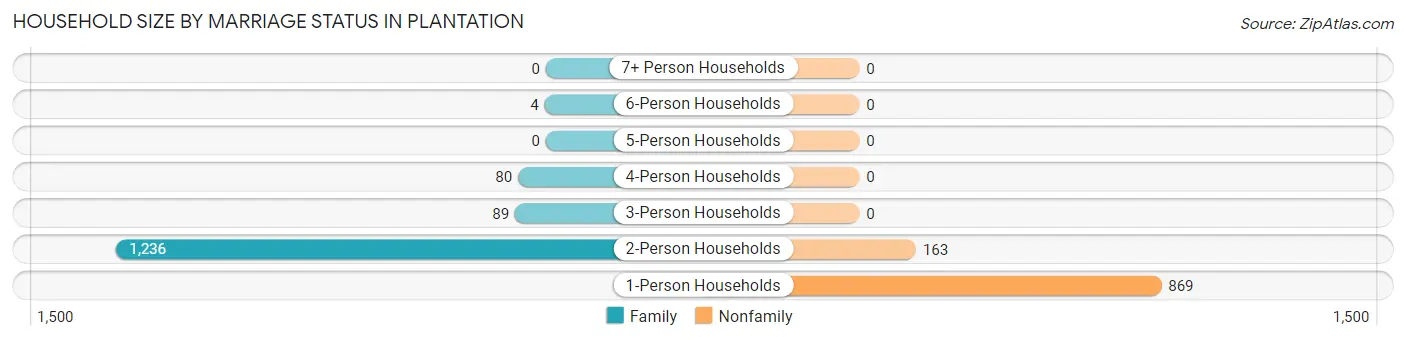
| Household Size | Family Households | Nonfamily Households |
| 1-Person Households | - | 869 (35.6%) |
| 2-Person Households | 1,236 (50.6%) | 163 (6.7%) |
| 3-Person Households | 89 (3.6%) | 0 (0.0%) |
| 4-Person Households | 80 (3.3%) | 0 (0.0%) |
| 5-Person Households | 0 (0.0%) | 0 (0.0%) |
| 6-Person Households | 4 (0.2%) | 0 (0.0%) |
| 7+ Person Households | 0 (0.0%) | 0 (0.0%) |
| Total | 1,409 (57.7%) | 1,032 (42.3%) |
Female Fertility in Plantation
Fertility by Age in Plantation
| Age Bracket | Women with Births | Births / 1,000 Women |
| 15 to 19 years | 0 (0.0%) | 0.0 |
| 20 to 34 years | 0 (0.0%) | 0.0 |
| 35 to 50 years | 0 (0.0%) | 0.0 |
| Total | 0 (0.0%) | 0.0 |
Fertility by Age by Marriage Status in Plantation
| Age Bracket | Married | Unmarried |
| 15 to 19 years | 0 (0.0%) | 0 (0.0%) |
| 20 to 34 years | 0 (0.0%) | 0 (0.0%) |
| 35 to 50 years | 0 (0.0%) | 0 (0.0%) |
| Total | 0 (0.0%) | 0 (0.0%) |
Fertility by Education in Plantation
| Educational Attainment | Women with Births | Births / 1,000 Women |
| Less than High School | 0 (0.0%) | 0.0 |
| High School Diploma | 0 (0.0%) | 0.0 |
| College or Associate's Degree | 0 (0.0%) | 0.0 |
| Bachelor's Degree | 0 (0.0%) | 0.0 |
| Graduate Degree | 0 (0.0%) | 0.0 |
| Total | 0 (0.0%) | 0.0 |
Fertility by Education by Marriage Status in Plantation
| Educational Attainment | Married | Unmarried |
| Less than High School | 0 (0.0%) | 0 (0.0%) |
| High School Diploma | 0 (0.0%) | 0 (0.0%) |
| College or Associate's Degree | 0 (0.0%) | 0 (0.0%) |
| Bachelor's Degree | 0 (0.0%) | 0 (0.0%) |
| Graduate Degree | 0 (0.0%) | 0 (0.0%) |
| Total | 0 (0.0%) | 0 (0.0%) |
Employment Characteristics in Plantation
Employment by Class of Employer in Plantation
Among the 891 employed individuals in Plantation, private company employees (570 | 64.0%), not-for-profit organizations (125 | 14.0%), and self-employed (not incorporated) (114 | 12.8%) make up the most common classes of employment.
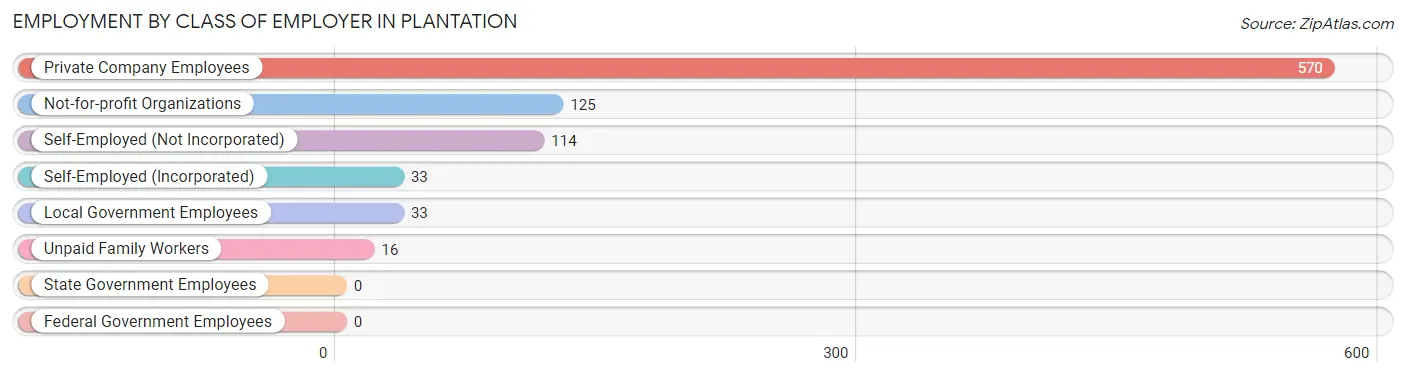
| Employer Class | # Employees | % Employees |
| Private Company Employees | 570 | 64.0% |
| Self-Employed (Incorporated) | 33 | 3.7% |
| Self-Employed (Not Incorporated) | 114 | 12.8% |
| Not-for-profit Organizations | 125 | 14.0% |
| Local Government Employees | 33 | 3.7% |
| State Government Employees | 0 | 0.0% |
| Federal Government Employees | 0 | 0.0% |
| Unpaid Family Workers | 16 | 1.8% |
| Total | 891 | 100.0% |
Employment Status by Age in Plantation
According to the labor force statistics for Plantation, out of the total population over 16 years of age (4,069), 22.6% or 920 individuals are in the labor force, with 1.4% or 13 of them unemployed. The age group with the highest labor force participation rate is 20 to 24 years, with 100.0% or 12 individuals in the labor force. Within the labor force, the 60 to 64 years age range has the highest percentage of unemployed individuals, with 8.6% or 13 of them being unemployed.
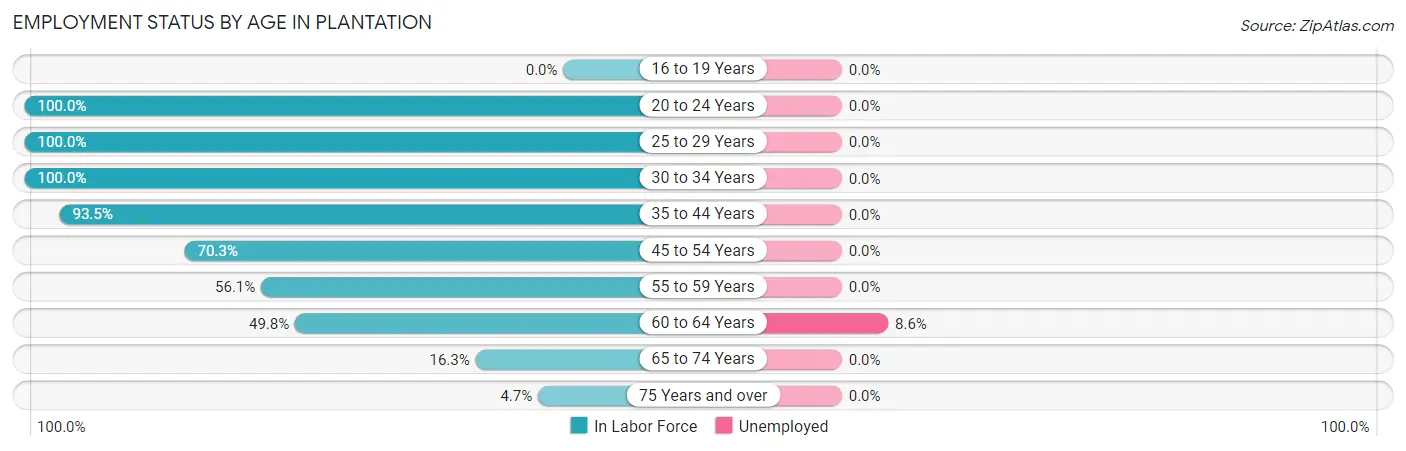
| Age Bracket | In Labor Force | Unemployed |
| 16 to 19 Years | 0 (0.0%) | 0 (0.0%) |
| 20 to 24 Years | 12 (100.0%) | 0 (0.0%) |
| 25 to 29 Years | 61 (100.0%) | 0 (0.0%) |
| 30 to 34 Years | 48 (100.0%) | 0 (0.0%) |
| 35 to 44 Years | 115 (93.5%) | 0 (0.0%) |
| 45 to 54 Years | 102 (70.3%) | 0 (0.0%) |
| 55 to 59 Years | 124 (56.1%) | 0 (0.0%) |
| 60 to 64 Years | 152 (49.8%) | 13 (8.6%) |
| 65 to 74 Years | 222 (16.3%) | 0 (0.0%) |
| 75 Years and over | 84 (4.7%) | 0 (0.0%) |
| Total | 920 (22.6%) | 13 (1.4%) |
Employment Status by Educational Attainment in Plantation
According to labor force statistics for Plantation, 66.7% of individuals (602) out of the total population between 25 and 64 years of age (903) are in the labor force, with 2.2% or 13 of them being unemployed. The group with the highest labor force participation rate are those with the educational attainment of less than high school, with 100.0% or 16 individuals in the labor force. Within the labor force, individuals with high school diploma education have the highest percentage of unemployment, with 13.1% or 13 of them being unemployed.
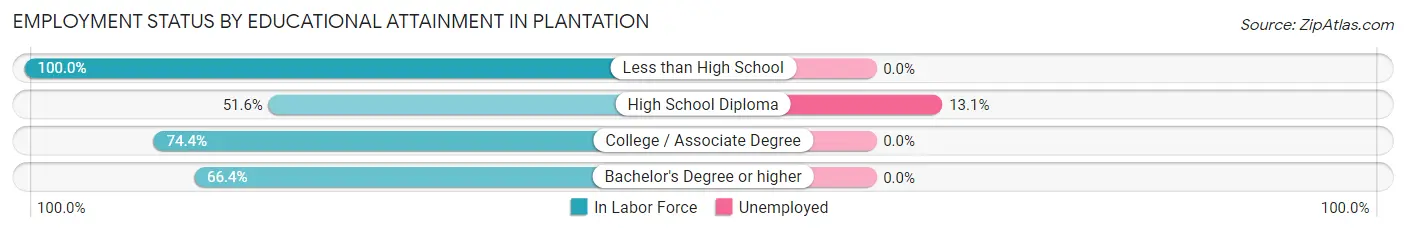
| Educational Attainment | In Labor Force | Unemployed |
| Less than High School | 16 (100.0%) | 0 (0.0%) |
| High School Diploma | 99 (51.6%) | 25 (13.1%) |
| College / Associate Degree | 238 (74.4%) | 0 (0.0%) |
| Bachelor's Degree or higher | 249 (66.4%) | 0 (0.0%) |
| Total | 602 (66.7%) | 20 (2.2%) |
Employment Occupations by Sex in Plantation
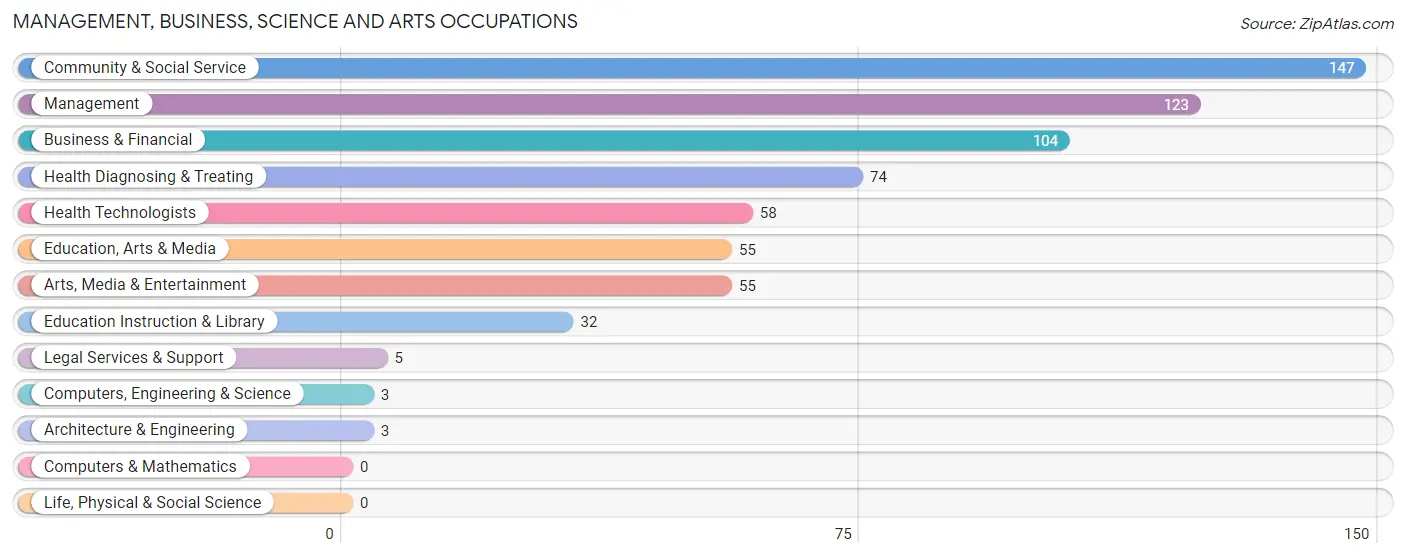
Management, Business, Science and Arts Occupations
The most common Management, Business, Science and Arts occupations in Plantation are Community & Social Service (147 | 16.2%), Management (123 | 13.6%), Business & Financial (104 | 11.5%), Health Diagnosing & Treating (74 | 8.2%), and Health Technologists (58 | 6.4%).
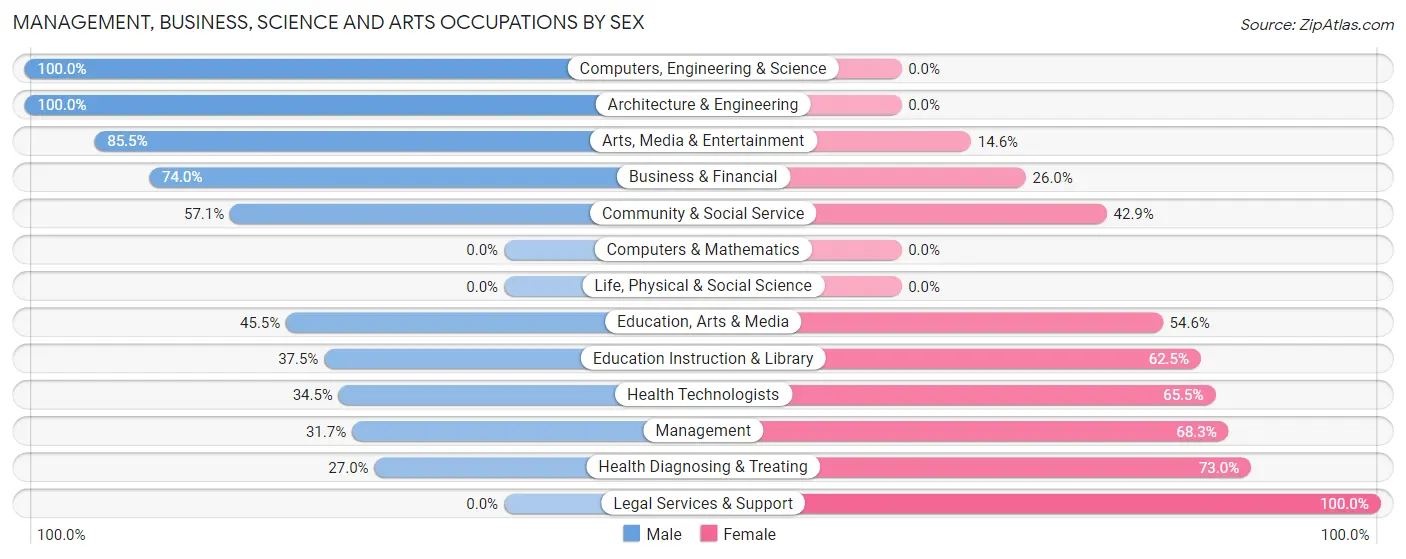
Management, Business, Science and Arts Occupations by Sex
Within the Management, Business, Science and Arts occupations in Plantation, the most male-oriented occupations are Computers, Engineering & Science (100.0%), Architecture & Engineering (100.0%), and Arts, Media & Entertainment (85.5%), while the most female-oriented occupations are Legal Services & Support (100.0%), Health Diagnosing & Treating (73.0%), and Management (68.3%).
| Occupation | Male | Female |
| Management | 39 (31.7%) | 84 (68.3%) |
| Business & Financial | 77 (74.0%) | 27 (26.0%) |
| Computers, Engineering & Science | 3 (100.0%) | 0 (0.0%) |
| Computers & Mathematics | 0 (0.0%) | 0 (0.0%) |
| Architecture & Engineering | 3 (100.0%) | 0 (0.0%) |
| Life, Physical & Social Science | 0 (0.0%) | 0 (0.0%) |
| Community & Social Service | 84 (57.1%) | 63 (42.9%) |
| Education, Arts & Media | 25 (45.5%) | 30 (54.5%) |
| Legal Services & Support | 0 (0.0%) | 5 (100.0%) |
| Education Instruction & Library | 12 (37.5%) | 20 (62.5%) |
| Arts, Media & Entertainment | 47 (85.5%) | 8 (14.5%) |
| Health Diagnosing & Treating | 20 (27.0%) | 54 (73.0%) |
| Health Technologists | 20 (34.5%) | 38 (65.5%) |
| Total (Category) | 223 (49.4%) | 228 (50.5%) |
| Total (Overall) | 422 (46.5%) | 485 (53.5%) |
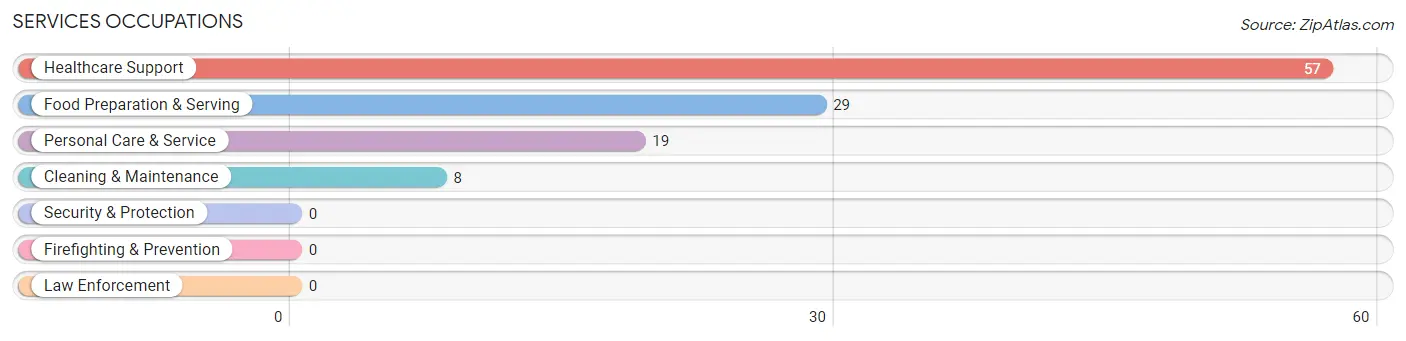
Services Occupations
The most common Services occupations in Plantation are Healthcare Support (57 | 6.3%), Food Preparation & Serving (29 | 3.2%), Personal Care & Service (19 | 2.1%), and Cleaning & Maintenance (8 | 0.9%).
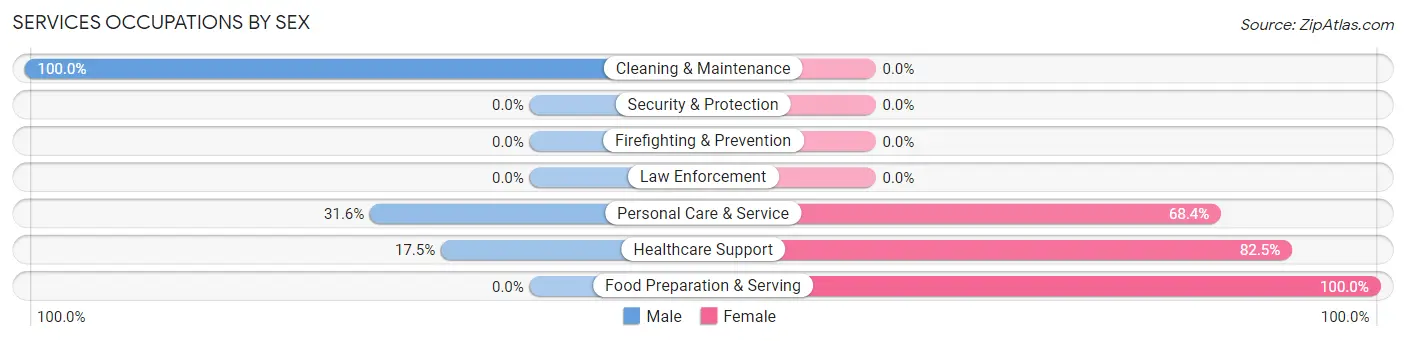
Services Occupations by Sex
Within the Services occupations in Plantation, the most male-oriented occupations are Cleaning & Maintenance (100.0%), Personal Care & Service (31.6%), and Healthcare Support (17.5%), while the most female-oriented occupations are Food Preparation & Serving (100.0%), Healthcare Support (82.5%), and Personal Care & Service (68.4%).
| Occupation | Male | Female |
| Healthcare Support | 10 (17.5%) | 47 (82.5%) |
| Security & Protection | 0 (0.0%) | 0 (0.0%) |
| Firefighting & Prevention | 0 (0.0%) | 0 (0.0%) |
| Law Enforcement | 0 (0.0%) | 0 (0.0%) |
| Food Preparation & Serving | 0 (0.0%) | 29 (100.0%) |
| Cleaning & Maintenance | 8 (100.0%) | 0 (0.0%) |
| Personal Care & Service | 6 (31.6%) | 13 (68.4%) |
| Total (Category) | 24 (21.2%) | 89 (78.8%) |
| Total (Overall) | 422 (46.5%) | 485 (53.5%) |
Sales and Office Occupations
The most common Sales and Office occupations in Plantation are Sales & Related (157 | 17.3%), and Office & Administration (101 | 11.1%).
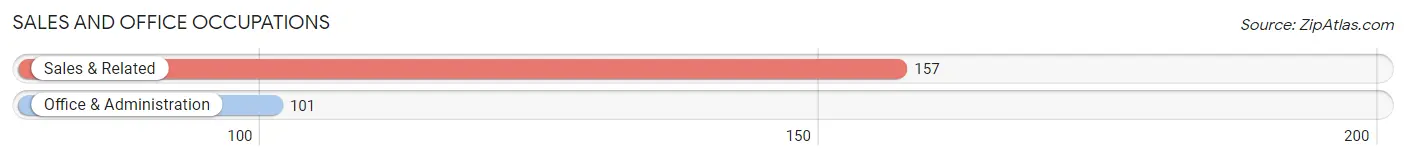
Sales and Office Occupations by Sex
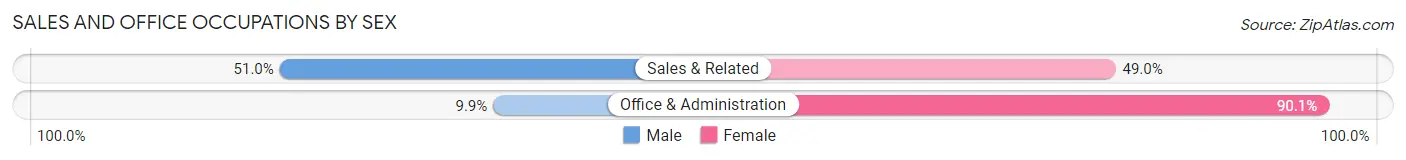
| Occupation | Male | Female |
| Sales & Related | 80 (51.0%) | 77 (49.0%) |
| Office & Administration | 10 (9.9%) | 91 (90.1%) |
| Total (Category) | 90 (34.9%) | 168 (65.1%) |
| Total (Overall) | 422 (46.5%) | 485 (53.5%) |
Natural Resources, Construction and Maintenance Occupations
The most common Natural Resources, Construction and Maintenance occupations in Plantation are Installation, Maintenance & Repair (9 | 1.0%), and Construction & Extraction (7 | 0.8%).
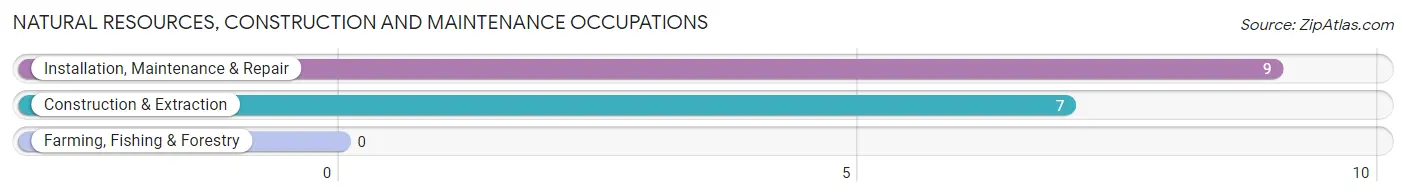
Natural Resources, Construction and Maintenance Occupations by Sex
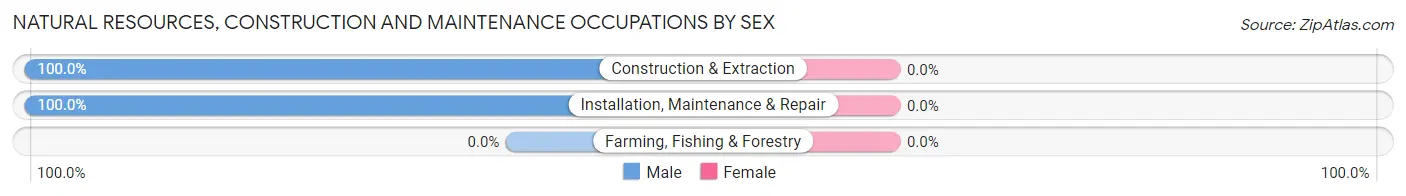
| Occupation | Male | Female |
| Farming, Fishing & Forestry | 0 (0.0%) | 0 (0.0%) |
| Construction & Extraction | 7 (100.0%) | 0 (0.0%) |
| Installation, Maintenance & Repair | 9 (100.0%) | 0 (0.0%) |
| Total (Category) | 16 (100.0%) | 0 (0.0%) |
| Total (Overall) | 422 (46.5%) | 485 (53.5%) |
Production, Transportation and Moving Occupations
The most common Production, Transportation and Moving occupations in Plantation are Production (48 | 5.3%), Material Moving (13 | 1.4%), and Transportation (8 | 0.9%).
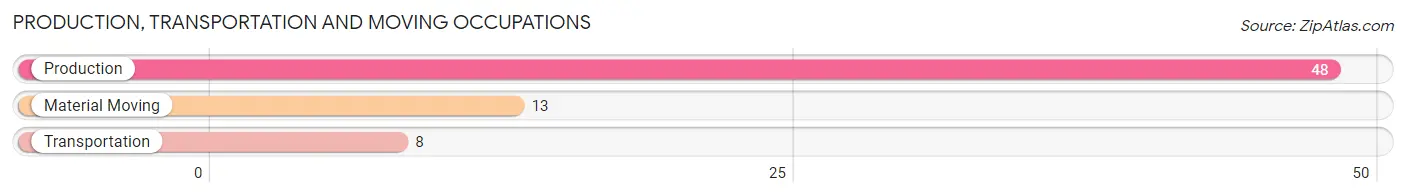
Production, Transportation and Moving Occupations by Sex
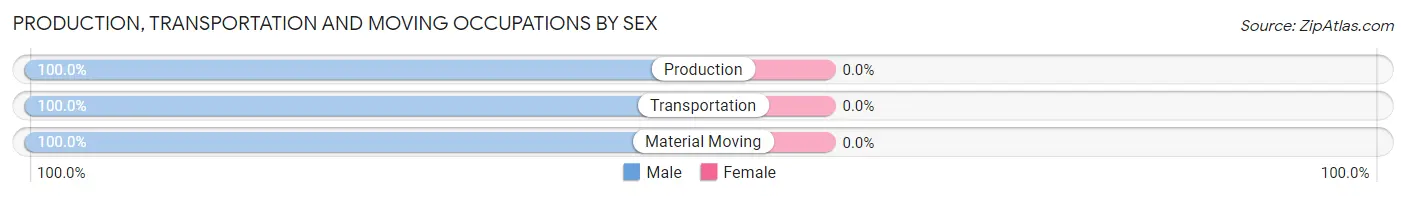
| Occupation | Male | Female |
| Production | 48 (100.0%) | 0 (0.0%) |
| Transportation | 8 (100.0%) | 0 (0.0%) |
| Material Moving | 13 (100.0%) | 0 (0.0%) |
| Total (Category) | 69 (100.0%) | 0 (0.0%) |
| Total (Overall) | 422 (46.5%) | 485 (53.5%) |
Employment Industries by Sex in Plantation
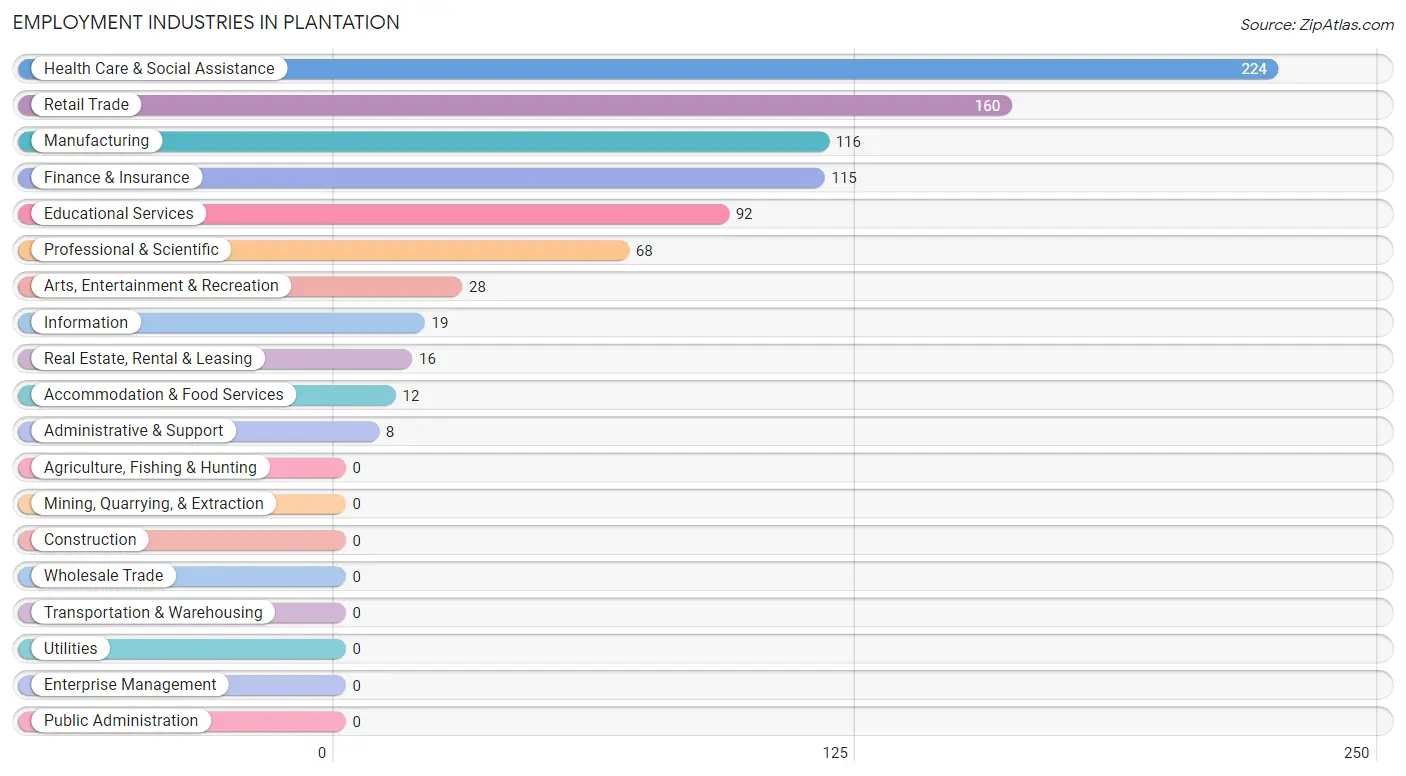
Employment Industries in Plantation
The major employment industries in Plantation include Health Care & Social Assistance (224 | 24.7%), Retail Trade (160 | 17.6%), Manufacturing (116 | 12.8%), Finance & Insurance (115 | 12.7%), and Educational Services (92 | 10.1%).
Employment Industries by Sex in Plantation
The Plantation industries that see more men than women are Information (100.0%), Administrative & Support (100.0%), and Manufacturing (91.4%), whereas the industries that tend to have a higher number of women are Real Estate, Rental & Leasing (100.0%), Accommodation & Food Services (100.0%), and Educational Services (87.0%).
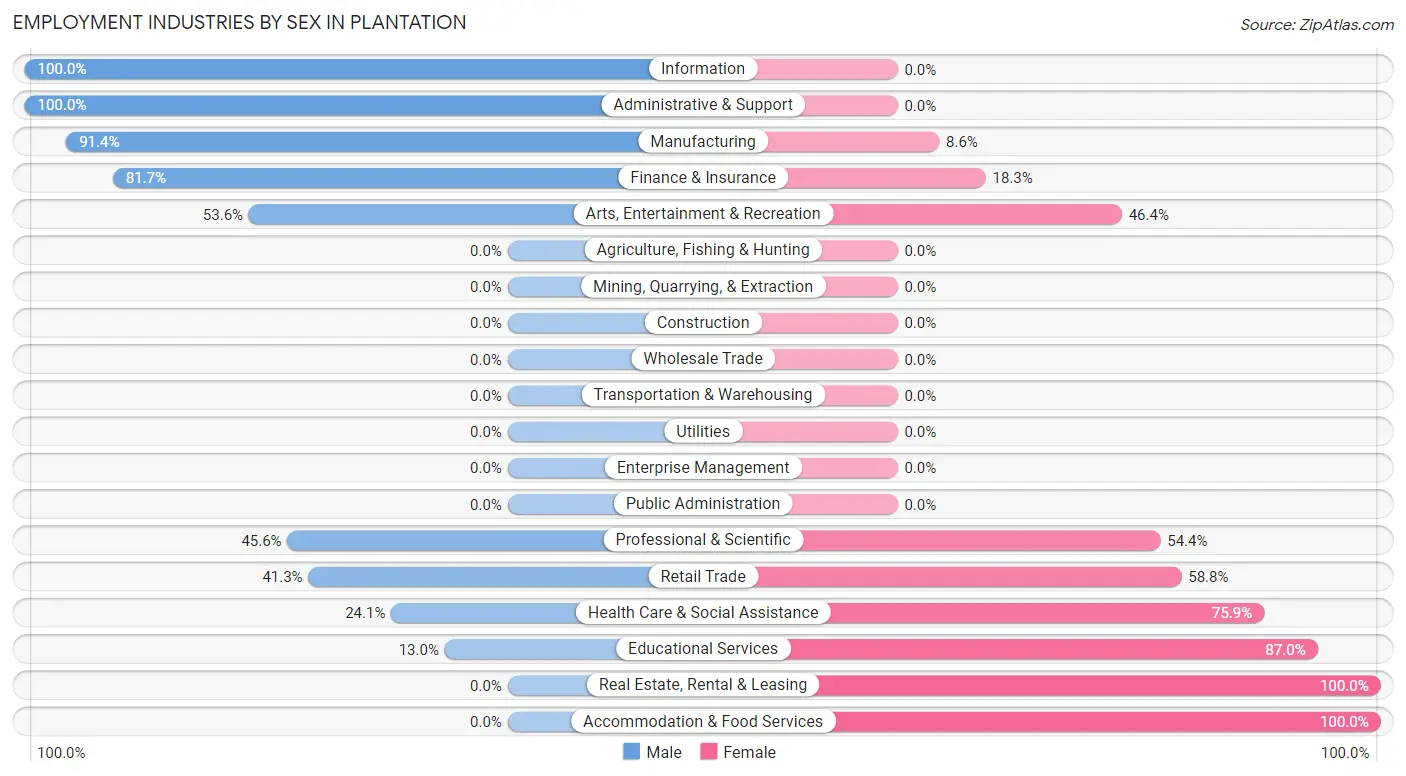
| Industry | Male | Female |
| Agriculture, Fishing & Hunting | 0 (0.0%) | 0 (0.0%) |
| Mining, Quarrying, & Extraction | 0 (0.0%) | 0 (0.0%) |
| Construction | 0 (0.0%) | 0 (0.0%) |
| Manufacturing | 106 (91.4%) | 10 (8.6%) |
| Wholesale Trade | 0 (0.0%) | 0 (0.0%) |
| Retail Trade | 66 (41.2%) | 94 (58.8%) |
| Transportation & Warehousing | 0 (0.0%) | 0 (0.0%) |
| Utilities | 0 (0.0%) | 0 (0.0%) |
| Information | 19 (100.0%) | 0 (0.0%) |
| Finance & Insurance | 94 (81.7%) | 21 (18.3%) |
| Real Estate, Rental & Leasing | 0 (0.0%) | 16 (100.0%) |
| Professional & Scientific | 31 (45.6%) | 37 (54.4%) |
| Enterprise Management | 0 (0.0%) | 0 (0.0%) |
| Administrative & Support | 8 (100.0%) | 0 (0.0%) |
| Educational Services | 12 (13.0%) | 80 (87.0%) |
| Health Care & Social Assistance | 54 (24.1%) | 170 (75.9%) |
| Arts, Entertainment & Recreation | 15 (53.6%) | 13 (46.4%) |
| Accommodation & Food Services | 0 (0.0%) | 12 (100.0%) |
| Public Administration | 0 (0.0%) | 0 (0.0%) |
| Total | 422 (46.5%) | 485 (53.5%) |
Education in Plantation
School Enrollment in Plantation
The most common levels of schooling among the 233 students in Plantation are middle school (97 | 41.6%), elementary school (85 | 36.5%), and graduate / professional (20 | 8.6%).
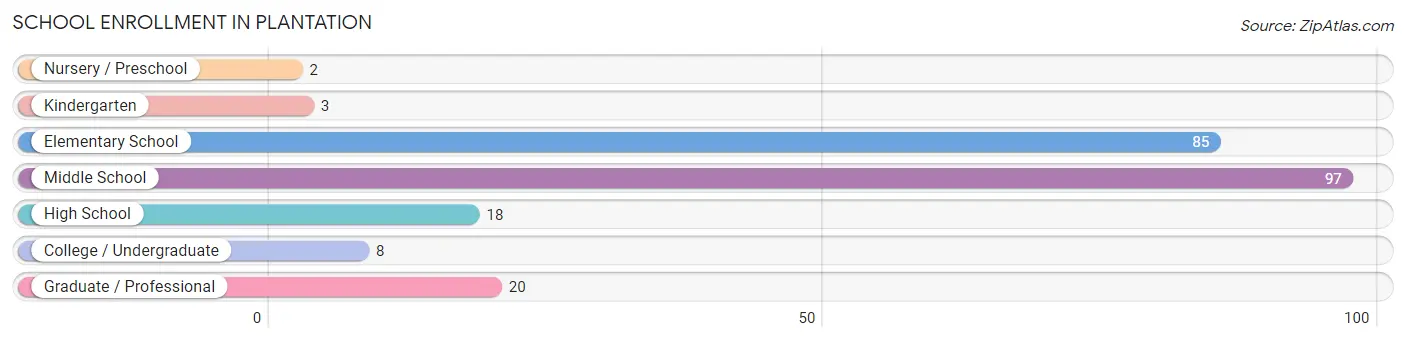
| School Level | # Students | % Students |
| Nursery / Preschool | 2 | 0.9% |
| Kindergarten | 3 | 1.3% |
| Elementary School | 85 | 36.5% |
| Middle School | 97 | 41.6% |
| High School | 18 | 7.7% |
| College / Undergraduate | 8 | 3.4% |
| Graduate / Professional | 20 | 8.6% |
| Total | 233 | 100.0% |
School Enrollment by Age by Funding Source in Plantation
Out of a total of 233 students who are enrolled in schools in Plantation, 70 (30.0%) attend a private institution, while the remaining 163 (70.0%) are enrolled in public schools. The age group of 35 years and over has the highest likelihood of being enrolled in private schools, with 28 (100.0% in the age bracket) enrolled. Conversely, the age group of 3 to 4 year olds has the lowest likelihood of being enrolled in a private school, with 2 (100.0% in the age bracket) attending a public institution.
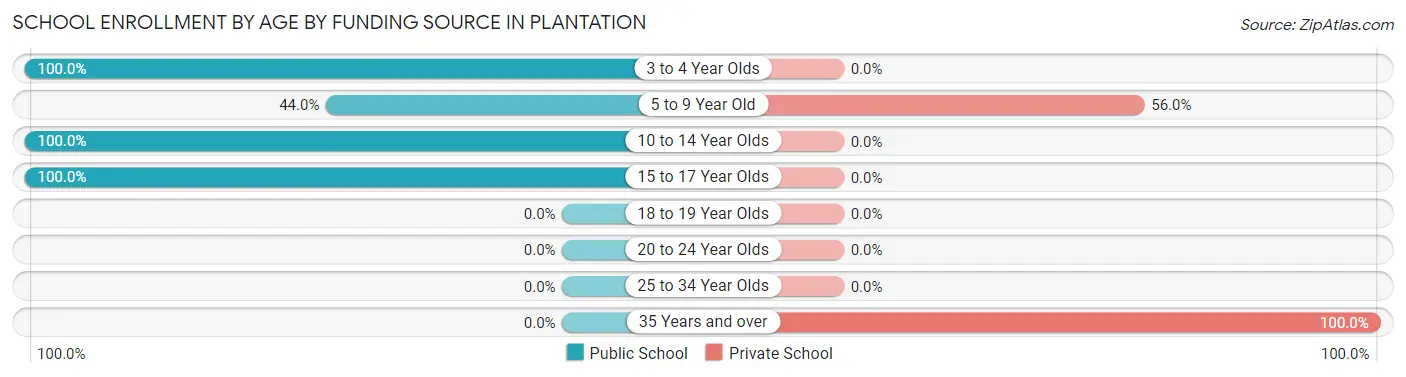
| Age Bracket | Public School | Private School |
| 3 to 4 Year Olds | 2 (100.0%) | 0 (0.0%) |
| 5 to 9 Year Old | 33 (44.0%) | 42 (56.0%) |
| 10 to 14 Year Olds | 123 (100.0%) | 0 (0.0%) |
| 15 to 17 Year Olds | 5 (100.0%) | 0 (0.0%) |
| 18 to 19 Year Olds | 0 (0.0%) | 0 (0.0%) |
| 20 to 24 Year Olds | 0 (0.0%) | 0 (0.0%) |
| 25 to 34 Year Olds | 0 (0.0%) | 0 (0.0%) |
| 35 Years and over | 0 (0.0%) | 28 (100.0%) |
| Total | 163 (70.0%) | 70 (30.0%) |
Educational Attainment by Field of Study in Plantation
Business (588 | 27.9%), education (396 | 18.8%), social sciences (176 | 8.4%), engineering (158 | 7.5%), and visual & performing arts (150 | 7.1%) are the most common fields of study among 2,107 individuals in Plantation who have obtained a bachelor's degree or higher.
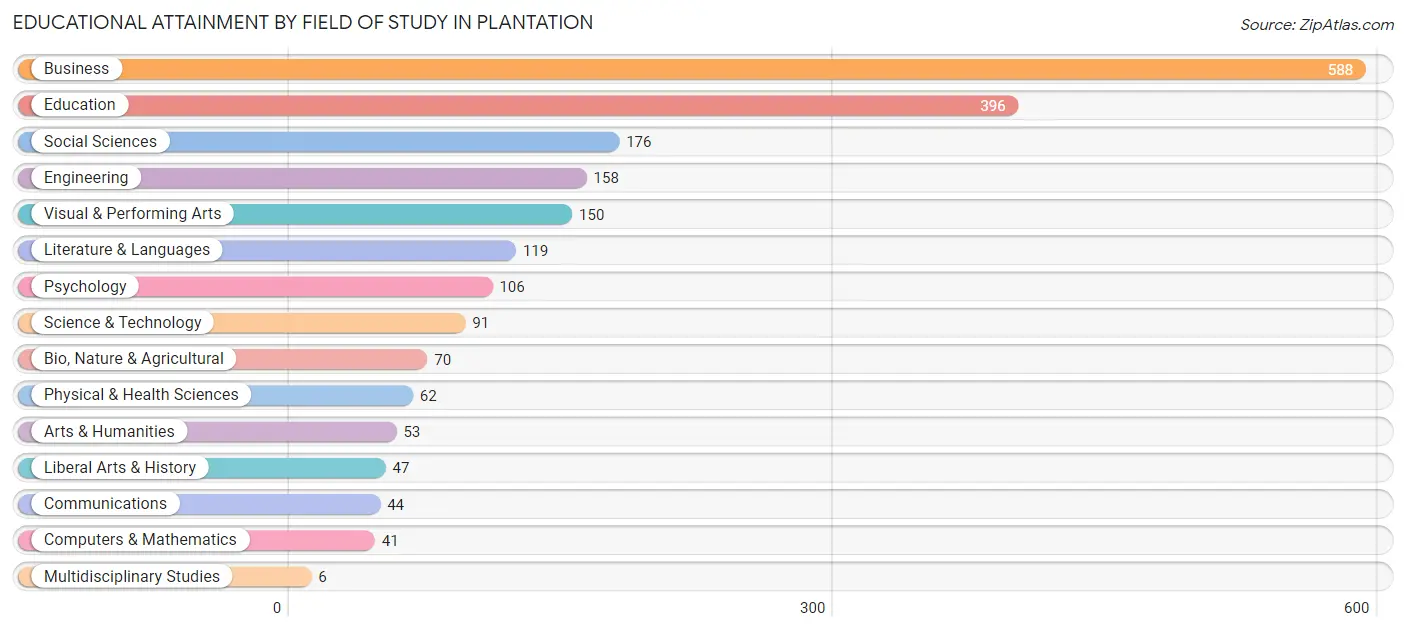
| Field of Study | # Graduates | % Graduates |
| Computers & Mathematics | 41 | 1.9% |
| Bio, Nature & Agricultural | 70 | 3.3% |
| Physical & Health Sciences | 62 | 2.9% |
| Psychology | 106 | 5.0% |
| Social Sciences | 176 | 8.4% |
| Engineering | 158 | 7.5% |
| Multidisciplinary Studies | 6 | 0.3% |
| Science & Technology | 91 | 4.3% |
| Business | 588 | 27.9% |
| Education | 396 | 18.8% |
| Literature & Languages | 119 | 5.7% |
| Liberal Arts & History | 47 | 2.2% |
| Visual & Performing Arts | 150 | 7.1% |
| Communications | 44 | 2.1% |
| Arts & Humanities | 53 | 2.5% |
| Total | 2,107 | 100.0% |
Transportation & Commute in Plantation
Vehicle Availability by Sex in Plantation
The most prevalent vehicle ownership categories in Plantation are males with 2 vehicles (268, accounting for 66.0%) and females with 2 vehicles (314, making up 57.1%).
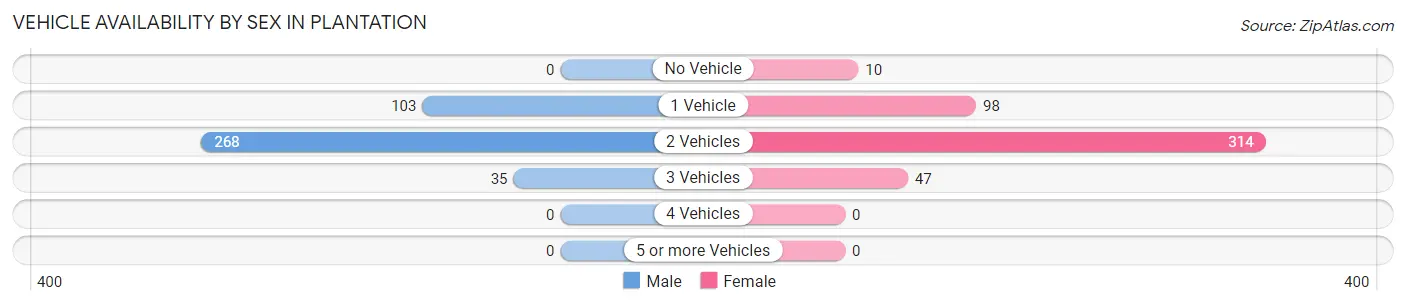
| Vehicles Available | Male | Female |
| No Vehicle | 0 (0.0%) | 10 (2.1%) |
| 1 Vehicle | 103 (25.4%) | 98 (20.9%) |
| 2 Vehicles | 268 (66.0%) | 314 (66.9%) |
| 3 Vehicles | 35 (8.6%) | 47 (10.0%) |
| 4 Vehicles | 0 (0.0%) | 0 (0.0%) |
| 5 or more Vehicles | 0 (0.0%) | 0 (0.0%) |
| Total | 406 (100.0%) | 469 (100.0%) |
Commute Time in Plantation
The most frequently occuring commute durations in Plantation are 20 to 24 minutes (230 commuters, 33.6%), 10 to 14 minutes (149 commuters, 21.8%), and 45 to 59 minutes (99 commuters, 14.5%).
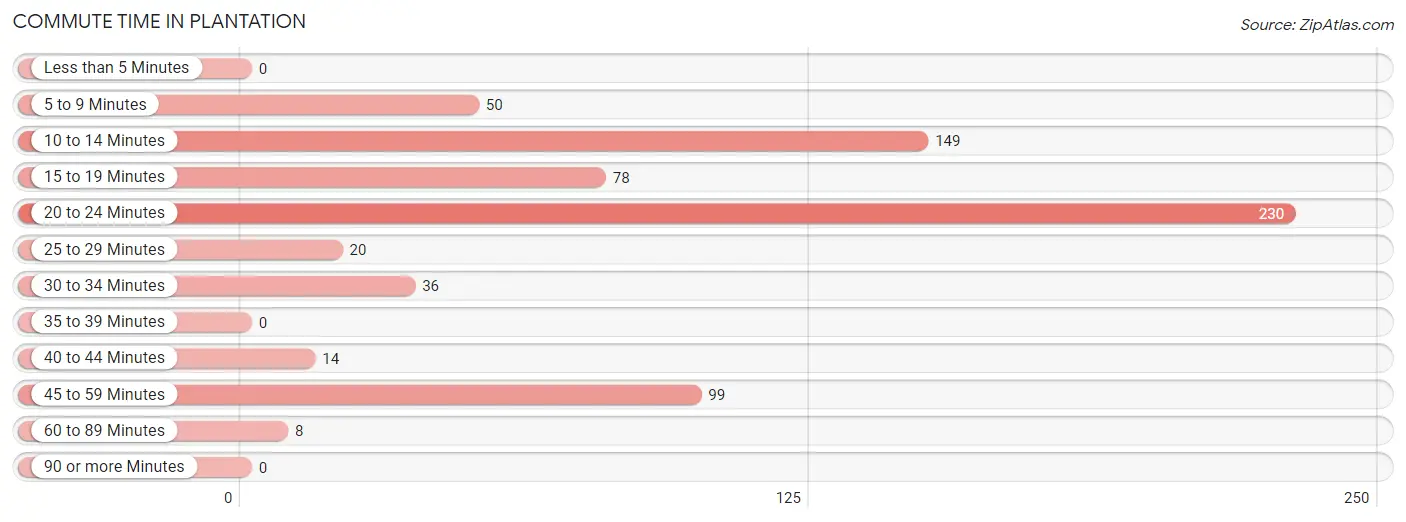
| Commute Time | # Commuters | % Commuters |
| Less than 5 Minutes | 0 | 0.0% |
| 5 to 9 Minutes | 50 | 7.3% |
| 10 to 14 Minutes | 149 | 21.8% |
| 15 to 19 Minutes | 78 | 11.4% |
| 20 to 24 Minutes | 230 | 33.6% |
| 25 to 29 Minutes | 20 | 2.9% |
| 30 to 34 Minutes | 36 | 5.3% |
| 35 to 39 Minutes | 0 | 0.0% |
| 40 to 44 Minutes | 14 | 2.1% |
| 45 to 59 Minutes | 99 | 14.5% |
| 60 to 89 Minutes | 8 | 1.2% |
| 90 or more Minutes | 0 | 0.0% |
Commute Time by Sex in Plantation
The most common commute times in Plantation are 20 to 24 minutes (115 commuters, 42.6%) for males and 10 to 14 minutes (132 commuters, 31.9%) for females.
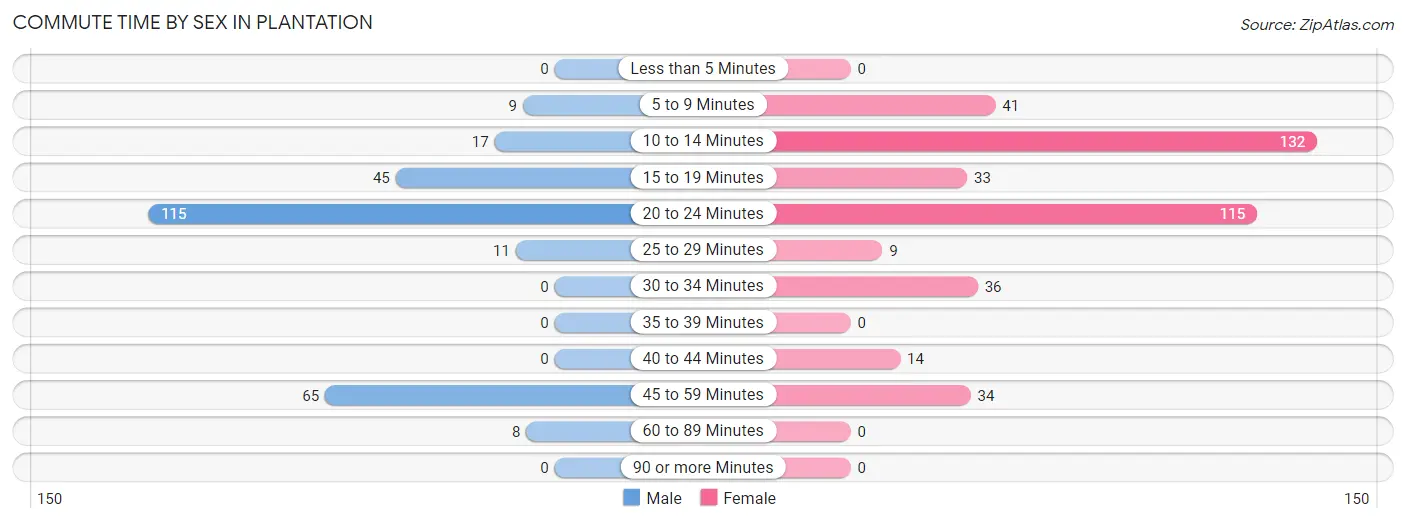
| Commute Time | Male | Female |
| Less than 5 Minutes | 0 (0.0%) | 0 (0.0%) |
| 5 to 9 Minutes | 9 (3.3%) | 41 (9.9%) |
| 10 to 14 Minutes | 17 (6.3%) | 132 (31.9%) |
| 15 to 19 Minutes | 45 (16.7%) | 33 (8.0%) |
| 20 to 24 Minutes | 115 (42.6%) | 115 (27.8%) |
| 25 to 29 Minutes | 11 (4.1%) | 9 (2.2%) |
| 30 to 34 Minutes | 0 (0.0%) | 36 (8.7%) |
| 35 to 39 Minutes | 0 (0.0%) | 0 (0.0%) |
| 40 to 44 Minutes | 0 (0.0%) | 14 (3.4%) |
| 45 to 59 Minutes | 65 (24.1%) | 34 (8.2%) |
| 60 to 89 Minutes | 8 (3.0%) | 0 (0.0%) |
| 90 or more Minutes | 0 (0.0%) | 0 (0.0%) |
Time of Departure to Work by Sex in Plantation
The most frequent times of departure to work in Plantation are 7:00 AM to 7:29 AM (91, 33.7%) for males and 8:00 AM to 8:29 AM (119, 28.7%) for females.
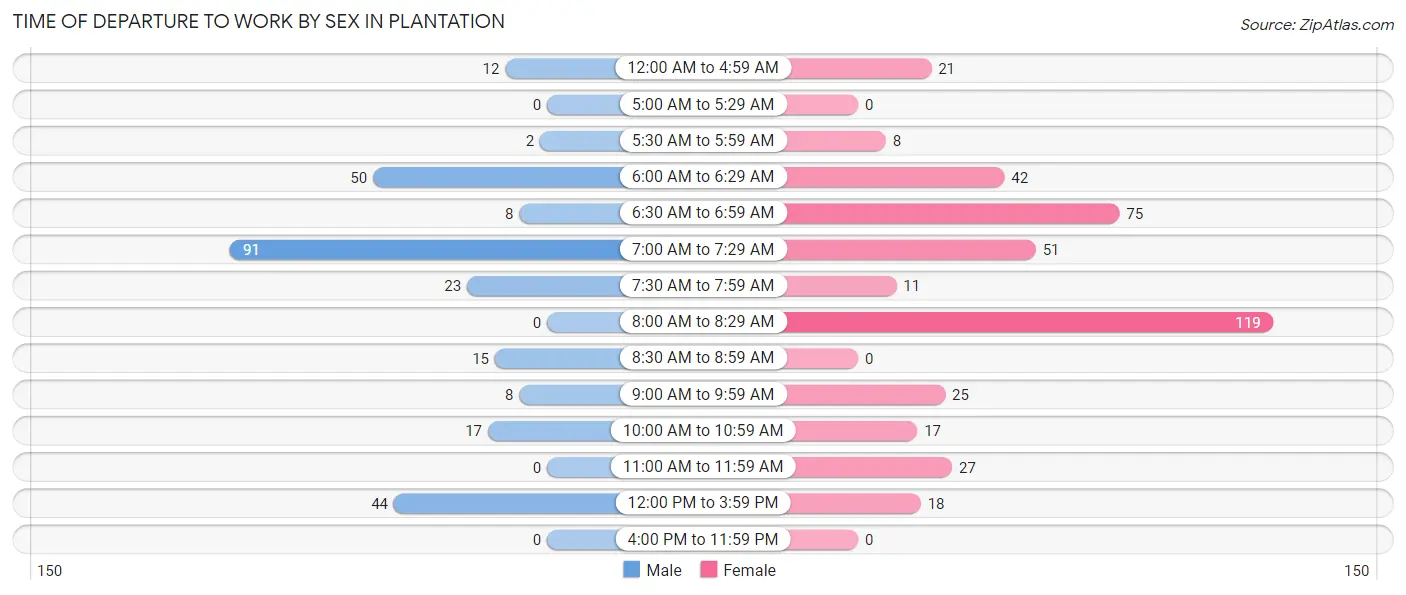
| Time of Departure | Male | Female |
| 12:00 AM to 4:59 AM | 12 (4.4%) | 21 (5.1%) |
| 5:00 AM to 5:29 AM | 0 (0.0%) | 0 (0.0%) |
| 5:30 AM to 5:59 AM | 2 (0.7%) | 8 (1.9%) |
| 6:00 AM to 6:29 AM | 50 (18.5%) | 42 (10.1%) |
| 6:30 AM to 6:59 AM | 8 (3.0%) | 75 (18.1%) |
| 7:00 AM to 7:29 AM | 91 (33.7%) | 51 (12.3%) |
| 7:30 AM to 7:59 AM | 23 (8.5%) | 11 (2.7%) |
| 8:00 AM to 8:29 AM | 0 (0.0%) | 119 (28.7%) |
| 8:30 AM to 8:59 AM | 15 (5.6%) | 0 (0.0%) |
| 9:00 AM to 9:59 AM | 8 (3.0%) | 25 (6.0%) |
| 10:00 AM to 10:59 AM | 17 (6.3%) | 17 (4.1%) |
| 11:00 AM to 11:59 AM | 0 (0.0%) | 27 (6.5%) |
| 12:00 PM to 3:59 PM | 44 (16.3%) | 18 (4.3%) |
| 4:00 PM to 11:59 PM | 0 (0.0%) | 0 (0.0%) |
| Total | 270 (100.0%) | 414 (100.0%) |
Housing Occupancy in Plantation
Occupancy by Ownership in Plantation
Of the total 2,441 dwellings in Plantation, owner-occupied units account for 2,282 (93.5%), while renter-occupied units make up 159 (6.5%).
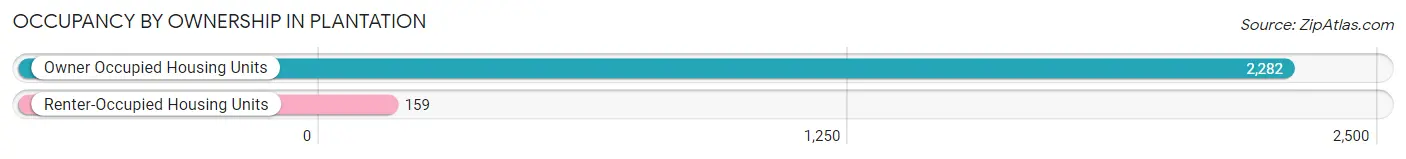
| Occupancy | # Housing Units | % Housing Units |
| Owner Occupied Housing Units | 2,282 | 93.5% |
| Renter-Occupied Housing Units | 159 | 6.5% |
| Total Occupied Housing Units | 2,441 | 100.0% |
Occupancy by Household Size in Plantation
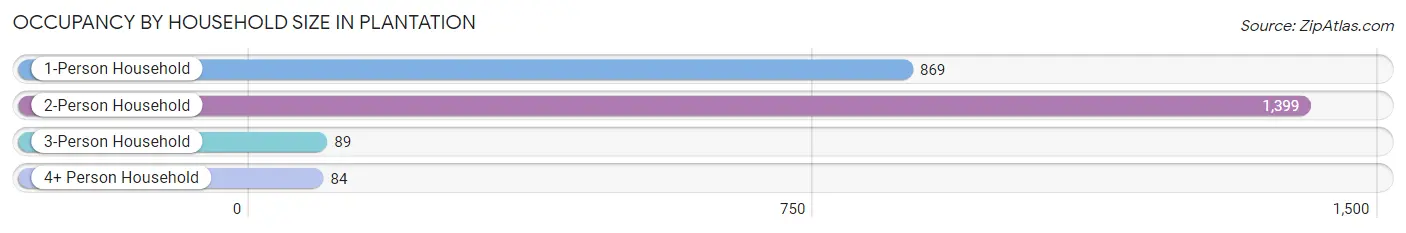
| Household Size | # Housing Units | % Housing Units |
| 1-Person Household | 869 | 35.6% |
| 2-Person Household | 1,399 | 57.3% |
| 3-Person Household | 89 | 3.6% |
| 4+ Person Household | 84 | 3.4% |
| Total Housing Units | 2,441 | 100.0% |
Occupancy by Ownership by Household Size in Plantation
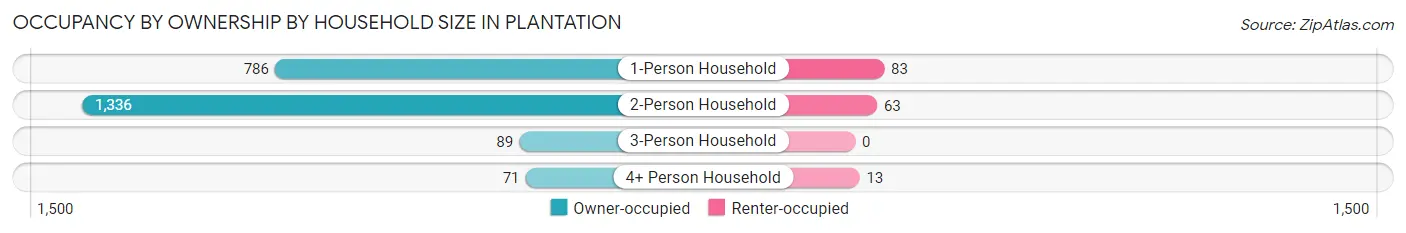
| Household Size | Owner-occupied | Renter-occupied |
| 1-Person Household | 786 (90.4%) | 83 (9.6%) |
| 2-Person Household | 1,336 (95.5%) | 63 (4.5%) |
| 3-Person Household | 89 (100.0%) | 0 (0.0%) |
| 4+ Person Household | 71 (84.5%) | 13 (15.5%) |
| Total Housing Units | 2,282 (93.5%) | 159 (6.5%) |
Occupancy by Educational Attainment in Plantation
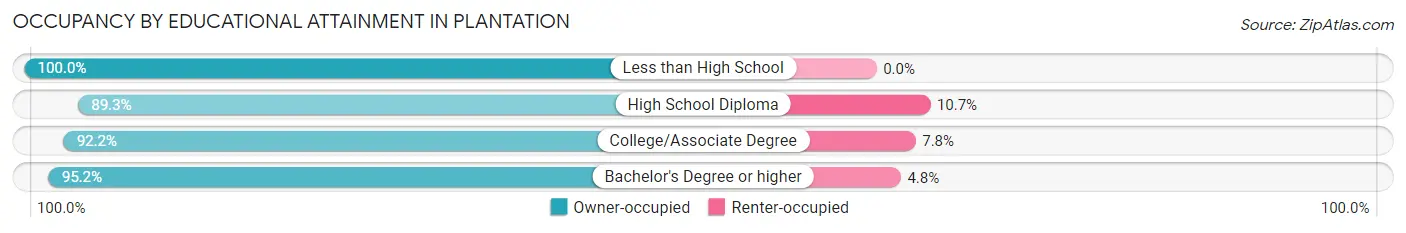
| Household Size | Owner-occupied | Renter-occupied |
| Less than High School | 24 (100.0%) | 0 (0.0%) |
| High School Diploma | 310 (89.3%) | 37 (10.7%) |
| College/Associate Degree | 701 (92.2%) | 59 (7.8%) |
| Bachelor's Degree or higher | 1,247 (95.2%) | 63 (4.8%) |
Occupancy by Age of Householder in Plantation
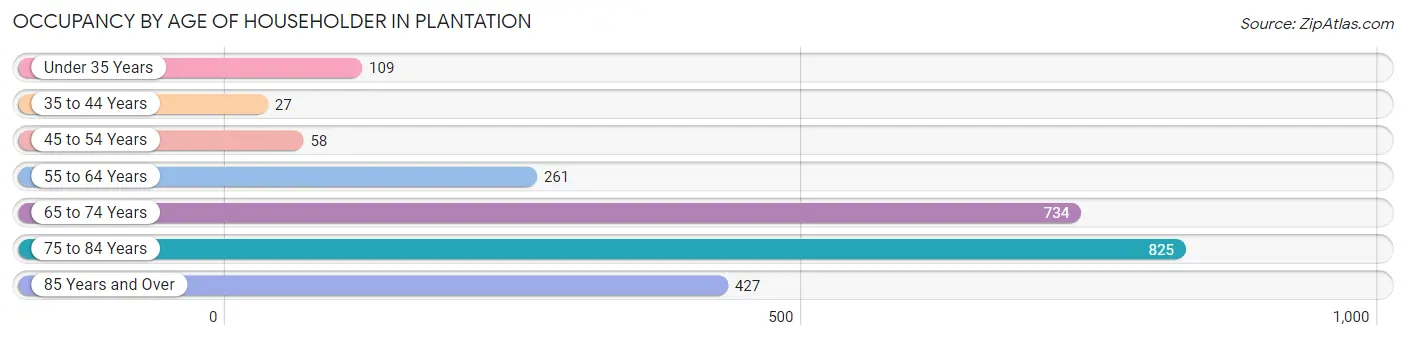
| Age Bracket | # Households | % Households |
| Under 35 Years | 109 | 4.5% |
| 35 to 44 Years | 27 | 1.1% |
| 45 to 54 Years | 58 | 2.4% |
| 55 to 64 Years | 261 | 10.7% |
| 65 to 74 Years | 734 | 30.1% |
| 75 to 84 Years | 825 | 33.8% |
| 85 Years and Over | 427 | 17.5% |
| Total | 2,441 | 100.0% |
Housing Finances in Plantation
Median Income by Occupancy in Plantation
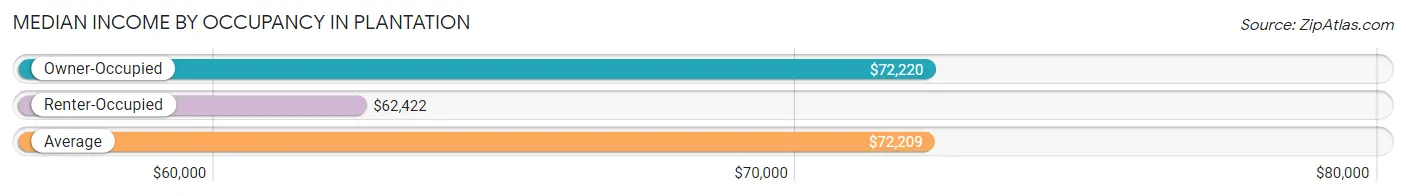
| Occupancy Type | # Households | Median Income |
| Owner-Occupied | 2,282 (93.5%) | $72,220 |
| Renter-Occupied | 159 (6.5%) | $62,422 |
| Average | 2,441 (100.0%) | $72,209 |
Occupancy by Householder Income Bracket in Plantation
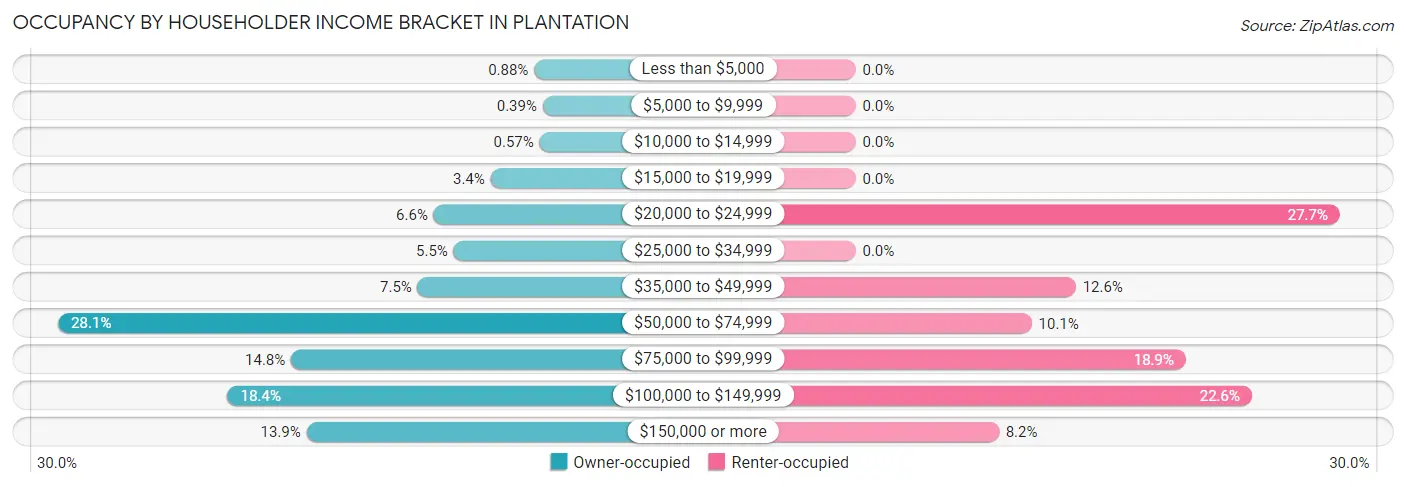
| Income Bracket | Owner-occupied | Renter-occupied |
| Less than $5,000 | 20 (0.9%) | 0 (0.0%) |
| $5,000 to $9,999 | 9 (0.4%) | 0 (0.0%) |
| $10,000 to $14,999 | 13 (0.6%) | 0 (0.0%) |
| $15,000 to $19,999 | 77 (3.4%) | 0 (0.0%) |
| $20,000 to $24,999 | 151 (6.6%) | 44 (27.7%) |
| $25,000 to $34,999 | 125 (5.5%) | 0 (0.0%) |
| $35,000 to $49,999 | 172 (7.5%) | 20 (12.6%) |
| $50,000 to $74,999 | 641 (28.1%) | 16 (10.1%) |
| $75,000 to $99,999 | 337 (14.8%) | 30 (18.9%) |
| $100,000 to $149,999 | 420 (18.4%) | 36 (22.6%) |
| $150,000 or more | 317 (13.9%) | 13 (8.2%) |
| Total | 2,282 (100.0%) | 159 (100.0%) |
Monthly Housing Cost Tiers in Plantation
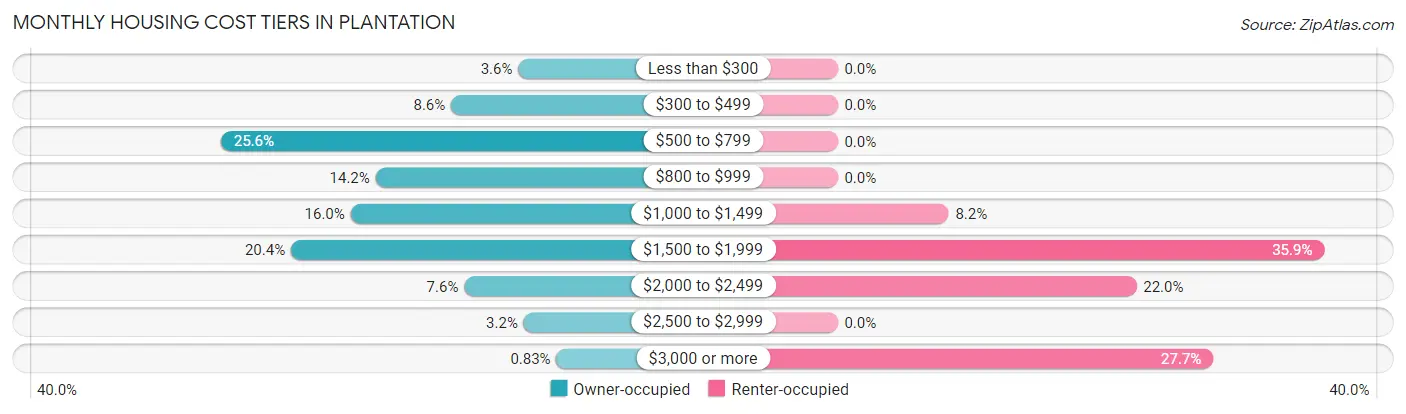
| Monthly Cost | Owner-occupied | Renter-occupied |
| Less than $300 | 83 (3.6%) | 0 (0.0%) |
| $300 to $499 | 196 (8.6%) | 0 (0.0%) |
| $500 to $799 | 583 (25.6%) | 0 (0.0%) |
| $800 to $999 | 323 (14.1%) | 0 (0.0%) |
| $1,000 to $1,499 | 365 (16.0%) | 13 (8.2%) |
| $1,500 to $1,999 | 465 (20.4%) | 57 (35.8%) |
| $2,000 to $2,499 | 174 (7.6%) | 35 (22.0%) |
| $2,500 to $2,999 | 74 (3.2%) | 0 (0.0%) |
| $3,000 or more | 19 (0.8%) | 44 (27.7%) |
| Total | 2,282 (100.0%) | 159 (100.0%) |
Physical Housing Characteristics in Plantation
Housing Structures in Plantation
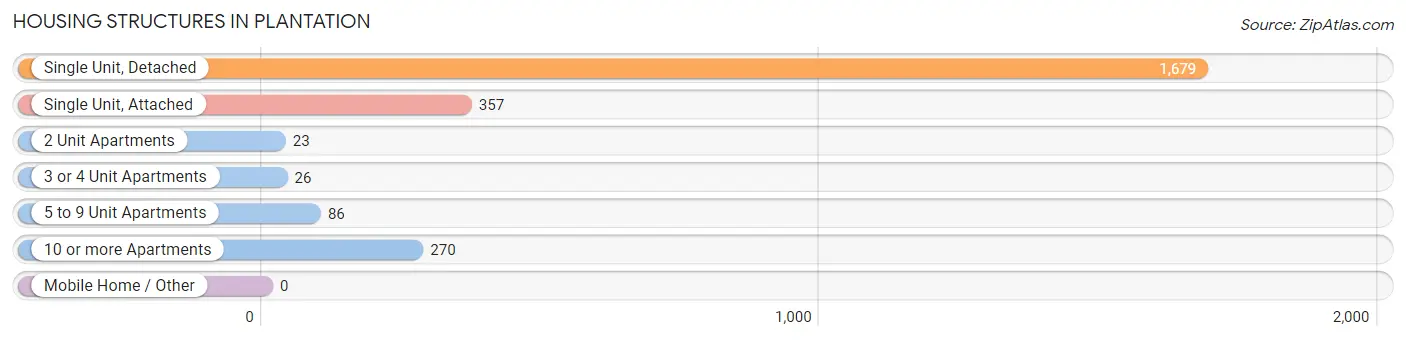
| Structure Type | # Housing Units | % Housing Units |
| Single Unit, Detached | 1,679 | 68.8% |
| Single Unit, Attached | 357 | 14.6% |
| 2 Unit Apartments | 23 | 0.9% |
| 3 or 4 Unit Apartments | 26 | 1.1% |
| 5 to 9 Unit Apartments | 86 | 3.5% |
| 10 or more Apartments | 270 | 11.1% |
| Mobile Home / Other | 0 | 0.0% |
| Total | 2,441 | 100.0% |
Housing Structures by Occupancy in Plantation
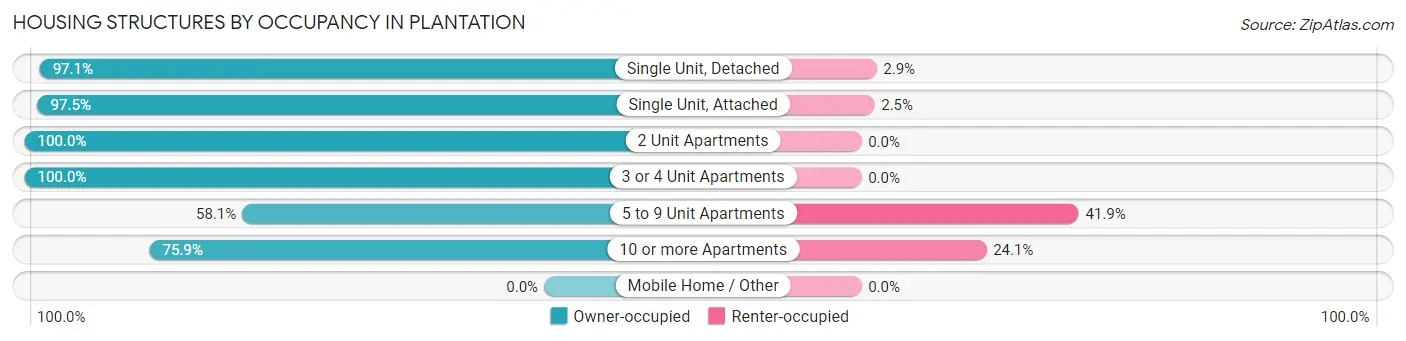
| Structure Type | Owner-occupied | Renter-occupied |
| Single Unit, Detached | 1,630 (97.1%) | 49 (2.9%) |
| Single Unit, Attached | 348 (97.5%) | 9 (2.5%) |
| 2 Unit Apartments | 23 (100.0%) | 0 (0.0%) |
| 3 or 4 Unit Apartments | 26 (100.0%) | 0 (0.0%) |
| 5 to 9 Unit Apartments | 50 (58.1%) | 36 (41.9%) |
| 10 or more Apartments | 205 (75.9%) | 65 (24.1%) |
| Mobile Home / Other | 0 (0.0%) | 0 (0.0%) |
| Total | 2,282 (93.5%) | 159 (6.5%) |
Housing Structures by Number of Rooms in Plantation
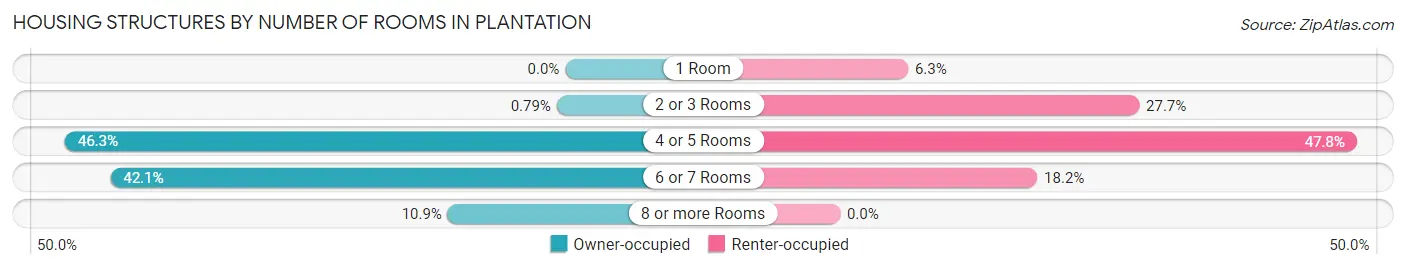
| Number of Rooms | Owner-occupied | Renter-occupied |
| 1 Room | 0 (0.0%) | 10 (6.3%) |
| 2 or 3 Rooms | 18 (0.8%) | 44 (27.7%) |
| 4 or 5 Rooms | 1,056 (46.3%) | 76 (47.8%) |
| 6 or 7 Rooms | 960 (42.1%) | 29 (18.2%) |
| 8 or more Rooms | 248 (10.9%) | 0 (0.0%) |
| Total | 2,282 (100.0%) | 159 (100.0%) |
Housing Structure by Heating Type in Plantation
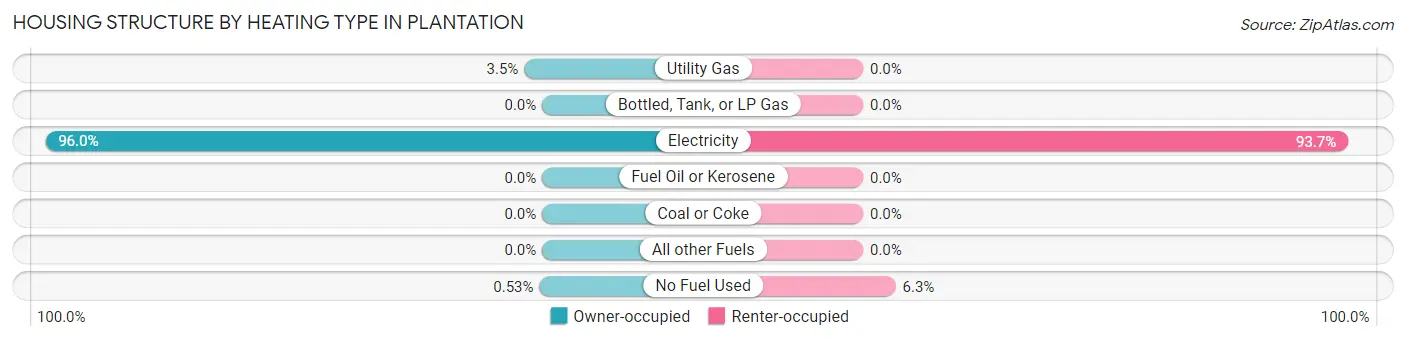
| Heating Type | Owner-occupied | Renter-occupied |
| Utility Gas | 79 (3.5%) | 0 (0.0%) |
| Bottled, Tank, or LP Gas | 0 (0.0%) | 0 (0.0%) |
| Electricity | 2,191 (96.0%) | 149 (93.7%) |
| Fuel Oil or Kerosene | 0 (0.0%) | 0 (0.0%) |
| Coal or Coke | 0 (0.0%) | 0 (0.0%) |
| All other Fuels | 0 (0.0%) | 0 (0.0%) |
| No Fuel Used | 12 (0.5%) | 10 (6.3%) |
| Total | 2,282 (100.0%) | 159 (100.0%) |
Household Vehicle Usage in Plantation
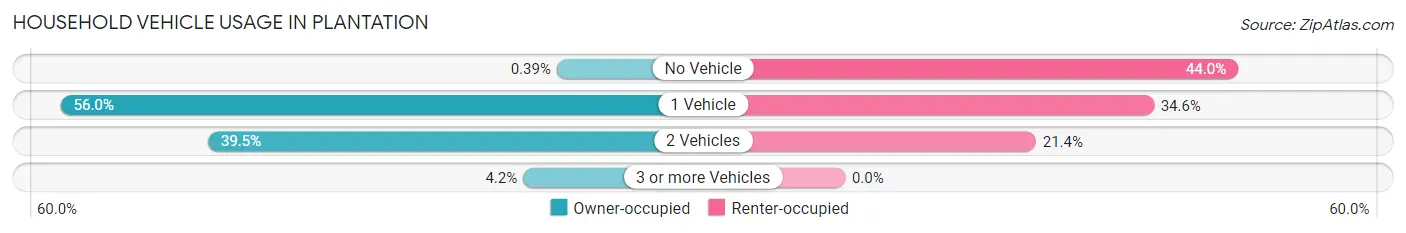
| Vehicles per Household | Owner-occupied | Renter-occupied |
| No Vehicle | 9 (0.4%) | 70 (44.0%) |
| 1 Vehicle | 1,277 (56.0%) | 55 (34.6%) |
| 2 Vehicles | 901 (39.5%) | 34 (21.4%) |
| 3 or more Vehicles | 95 (4.2%) | 0 (0.0%) |
| Total | 2,282 (100.0%) | 159 (100.0%) |
Real Estate & Mortgages in Plantation
Real Estate and Mortgage Overview in Plantation
| Characteristic | Without Mortgage | With Mortgage |
| Housing Units | 1,297 | 985 |
| Median Property Value | $341,600 | $347,500 |
| Median Household Income | $66,074 | $158 |
| Monthly Housing Costs | $703 | $9 |
| Real Estate Taxes | $2,695 | $42 |
Property Value by Mortgage Status in Plantation
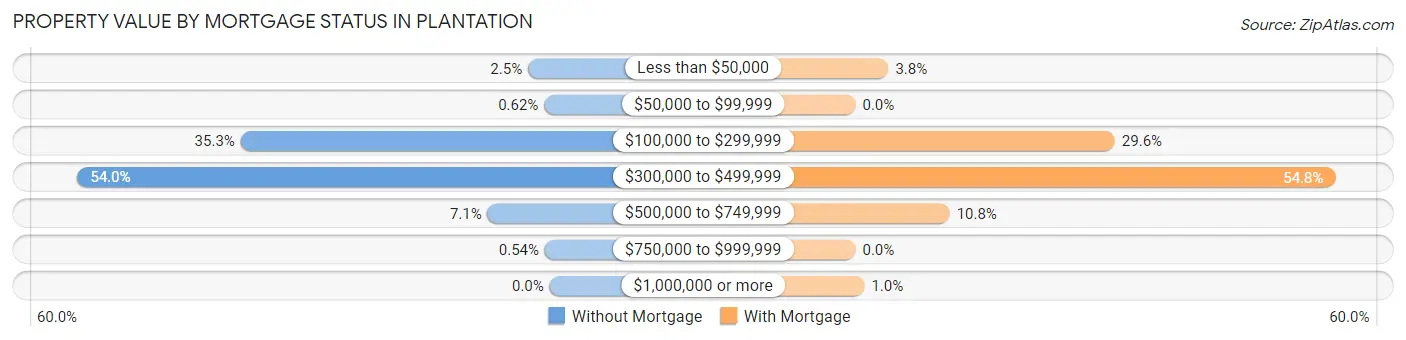
| Property Value | Without Mortgage | With Mortgage |
| Less than $50,000 | 32 (2.5%) | 37 (3.8%) |
| $50,000 to $99,999 | 8 (0.6%) | 0 (0.0%) |
| $100,000 to $299,999 | 458 (35.3%) | 292 (29.6%) |
| $300,000 to $499,999 | 700 (54.0%) | 540 (54.8%) |
| $500,000 to $749,999 | 92 (7.1%) | 106 (10.8%) |
| $750,000 to $999,999 | 7 (0.5%) | 0 (0.0%) |
| $1,000,000 or more | 0 (0.0%) | 10 (1.0%) |
| Total | 1,297 (100.0%) | 985 (100.0%) |
Household Income by Mortgage Status in Plantation
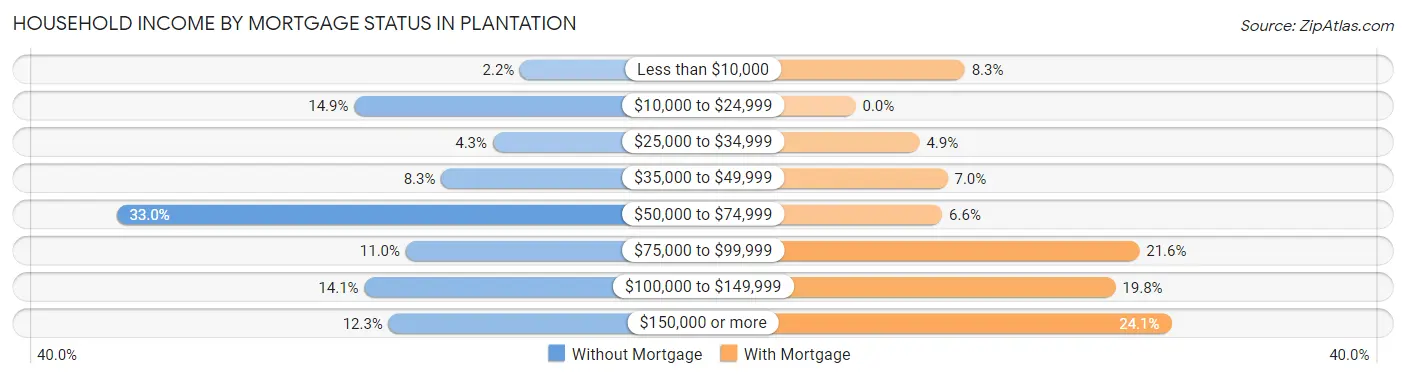
| Household Income | Without Mortgage | With Mortgage |
| Less than $10,000 | 29 (2.2%) | 82 (8.3%) |
| $10,000 to $24,999 | 193 (14.9%) | 0 (0.0%) |
| $25,000 to $34,999 | 56 (4.3%) | 48 (4.9%) |
| $35,000 to $49,999 | 107 (8.3%) | 69 (7.0%) |
| $50,000 to $74,999 | 428 (33.0%) | 65 (6.6%) |
| $75,000 to $99,999 | 142 (11.0%) | 213 (21.6%) |
| $100,000 to $149,999 | 183 (14.1%) | 195 (19.8%) |
| $150,000 or more | 159 (12.3%) | 237 (24.1%) |
| Total | 1,297 (100.0%) | 985 (100.0%) |
Property Value to Household Income Ratio in Plantation
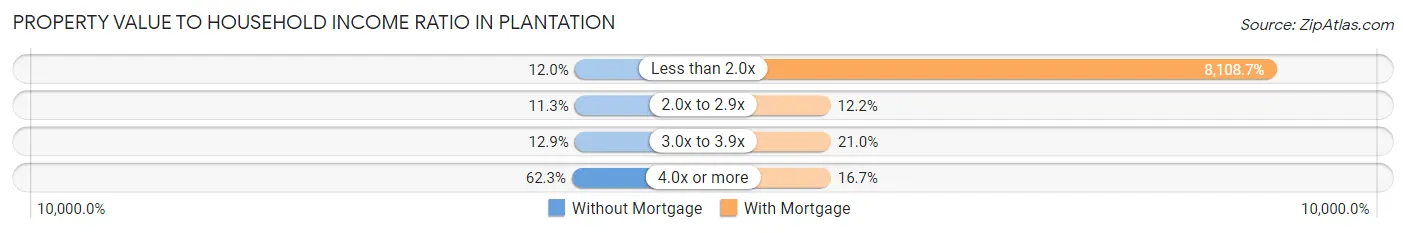
| Value-to-Income Ratio | Without Mortgage | With Mortgage |
| Less than 2.0x | 155 (11.9%) | 79,871 (8,108.7%) |
| 2.0x to 2.9x | 147 (11.3%) | 120 (12.2%) |
| 3.0x to 3.9x | 167 (12.9%) | 207 (21.0%) |
| 4.0x or more | 808 (62.3%) | 164 (16.7%) |
| Total | 1,297 (100.0%) | 985 (100.0%) |
Real Estate Taxes by Mortgage Status in Plantation
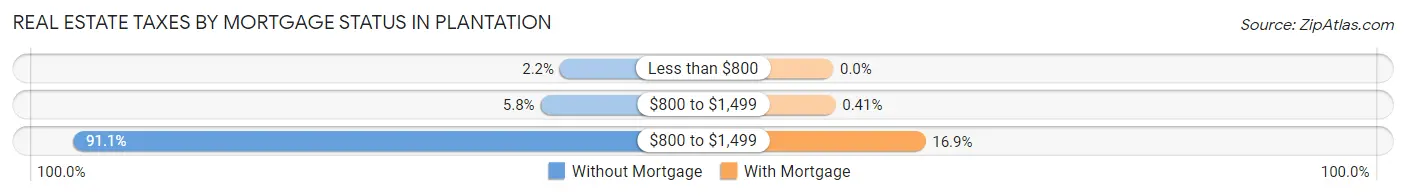
| Property Taxes | Without Mortgage | With Mortgage |
| Less than $800 | 29 (2.2%) | 0 (0.0%) |
| $800 to $1,499 | 75 (5.8%) | 4 (0.4%) |
| $800 to $1,499 | 1,182 (91.1%) | 166 (16.9%) |
| Total | 1,297 (100.0%) | 985 (100.0%) |
Health & Disability in Plantation
Health Insurance Coverage by Age in Plantation
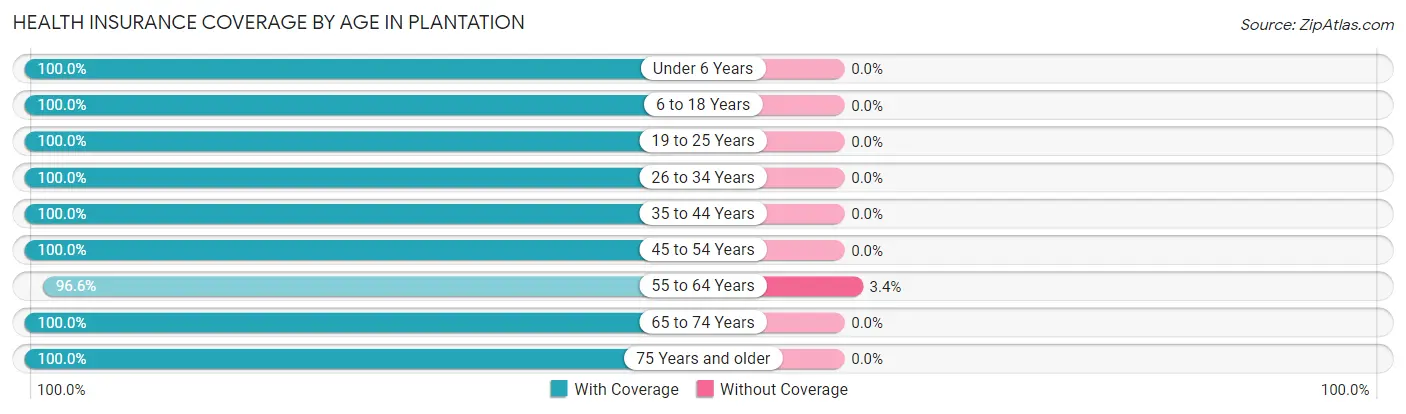
| Age Bracket | With Coverage | Without Coverage |
| Under 6 Years | 2 (100.0%) | 0 (0.0%) |
| 6 to 18 Years | 203 (100.0%) | 0 (0.0%) |
| 19 to 25 Years | 12 (100.0%) | 0 (0.0%) |
| 26 to 34 Years | 109 (100.0%) | 0 (0.0%) |
| 35 to 44 Years | 123 (100.0%) | 0 (0.0%) |
| 45 to 54 Years | 145 (100.0%) | 0 (0.0%) |
| 55 to 64 Years | 508 (96.6%) | 18 (3.4%) |
| 65 to 74 Years | 1,359 (100.0%) | 0 (0.0%) |
| 75 Years and older | 1,795 (100.0%) | 0 (0.0%) |
| Total | 4,256 (99.6%) | 18 (0.4%) |
Health Insurance Coverage by Citizenship Status in Plantation
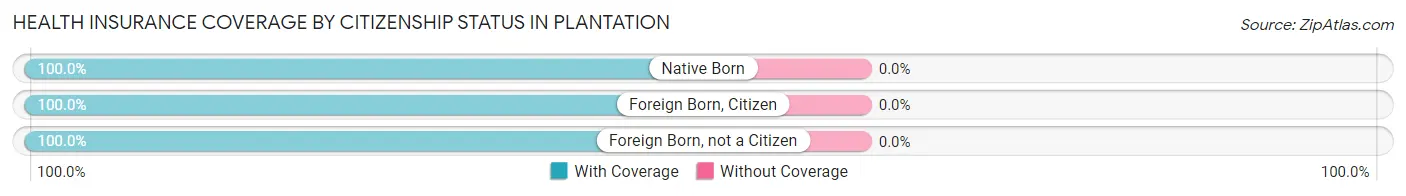
| Citizenship Status | With Coverage | Without Coverage |
| Native Born | 2 (100.0%) | 0 (0.0%) |
| Foreign Born, Citizen | 203 (100.0%) | 0 (0.0%) |
| Foreign Born, not a Citizen | 12 (100.0%) | 0 (0.0%) |
Health Insurance Coverage by Household Income in Plantation
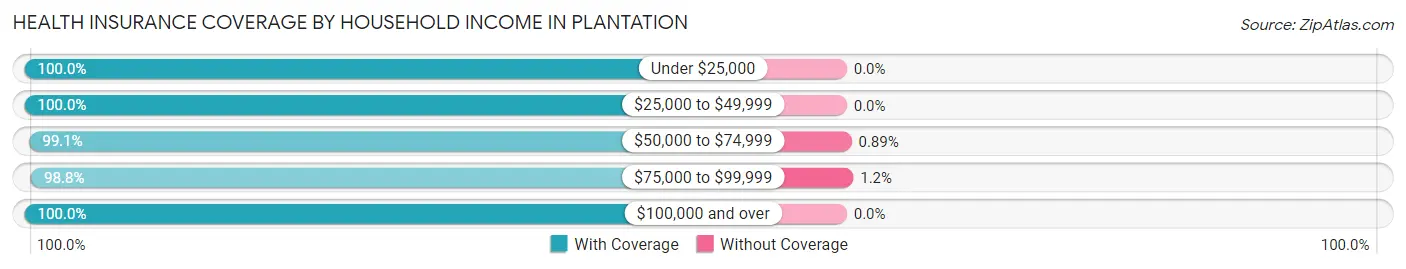
| Household Income | With Coverage | Without Coverage |
| Under $25,000 | 395 (100.0%) | 0 (0.0%) |
| $25,000 to $49,999 | 474 (100.0%) | 0 (0.0%) |
| $50,000 to $74,999 | 1,110 (99.1%) | 10 (0.9%) |
| $75,000 to $99,999 | 649 (98.8%) | 8 (1.2%) |
| $100,000 and over | 1,612 (100.0%) | 0 (0.0%) |
Public vs Private Health Insurance Coverage by Age in Plantation
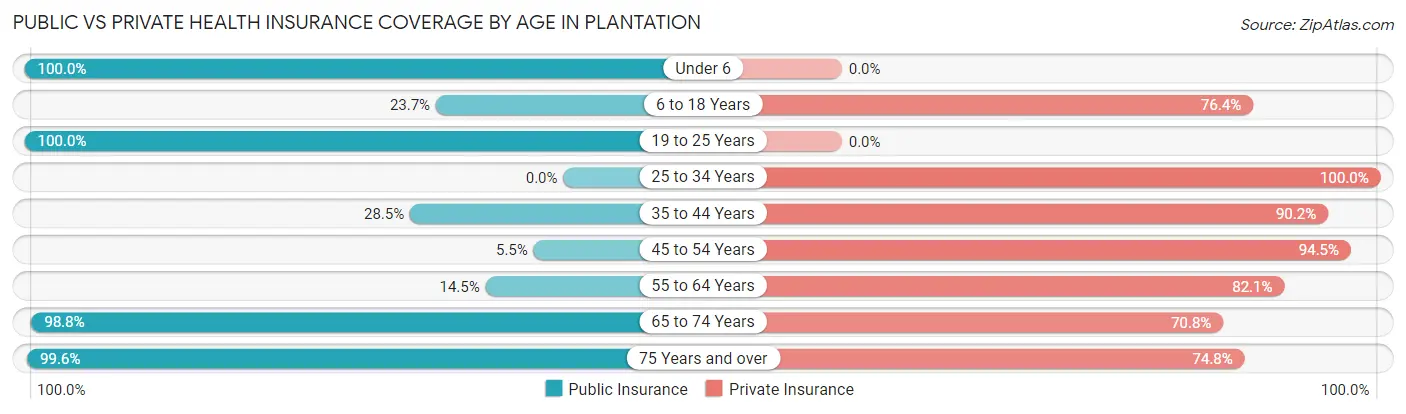
| Age Bracket | Public Insurance | Private Insurance |
| Under 6 | 2 (100.0%) | 0 (0.0%) |
| 6 to 18 Years | 48 (23.6%) | 155 (76.3%) |
| 19 to 25 Years | 12 (100.0%) | 0 (0.0%) |
| 25 to 34 Years | 0 (0.0%) | 109 (100.0%) |
| 35 to 44 Years | 35 (28.5%) | 111 (90.2%) |
| 45 to 54 Years | 8 (5.5%) | 137 (94.5%) |
| 55 to 64 Years | 76 (14.4%) | 432 (82.1%) |
| 65 to 74 Years | 1,342 (98.8%) | 962 (70.8%) |
| 75 Years and over | 1,787 (99.6%) | 1,342 (74.8%) |
| Total | 3,310 (77.4%) | 3,248 (76.0%) |
Disability Status by Sex by Age in Plantation
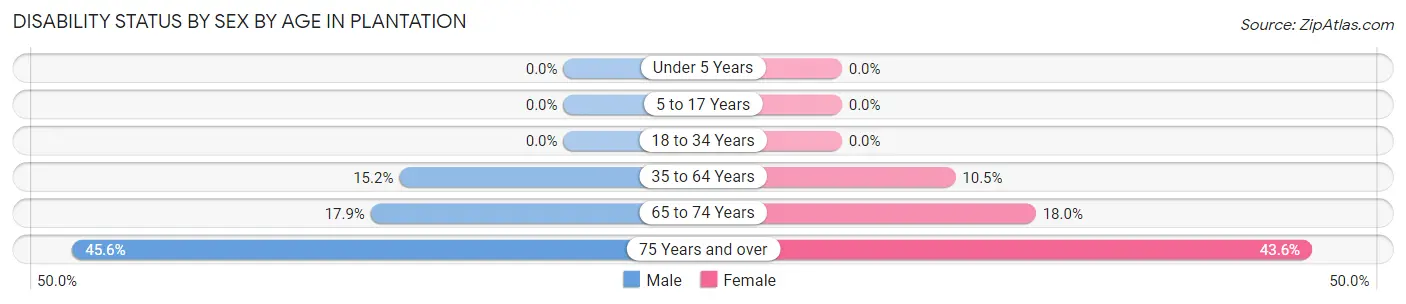
| Age Bracket | Male | Female |
| Under 5 Years | 0 (0.0%) | 0 (0.0%) |
| 5 to 17 Years | 0 (0.0%) | 0 (0.0%) |
| 18 to 34 Years | 0 (0.0%) | 0 (0.0%) |
| 35 to 64 Years | 53 (15.2%) | 47 (10.5%) |
| 65 to 74 Years | 91 (17.9%) | 153 (18.0%) |
| 75 Years and over | 396 (45.6%) | 404 (43.6%) |
Disability Class by Sex by Age in Plantation
Disability Class: Hearing Difficulty
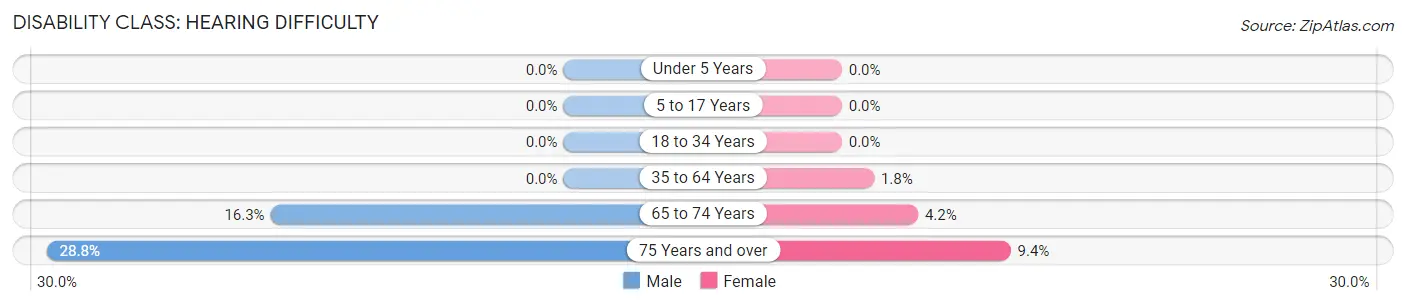
| Age Bracket | Male | Female |
| Under 5 Years | 0 (0.0%) | 0 (0.0%) |
| 5 to 17 Years | 0 (0.0%) | 0 (0.0%) |
| 18 to 34 Years | 0 (0.0%) | 0 (0.0%) |
| 35 to 64 Years | 0 (0.0%) | 8 (1.8%) |
| 65 to 74 Years | 83 (16.3%) | 36 (4.2%) |
| 75 Years and over | 250 (28.8%) | 87 (9.4%) |
Disability Class: Vision Difficulty
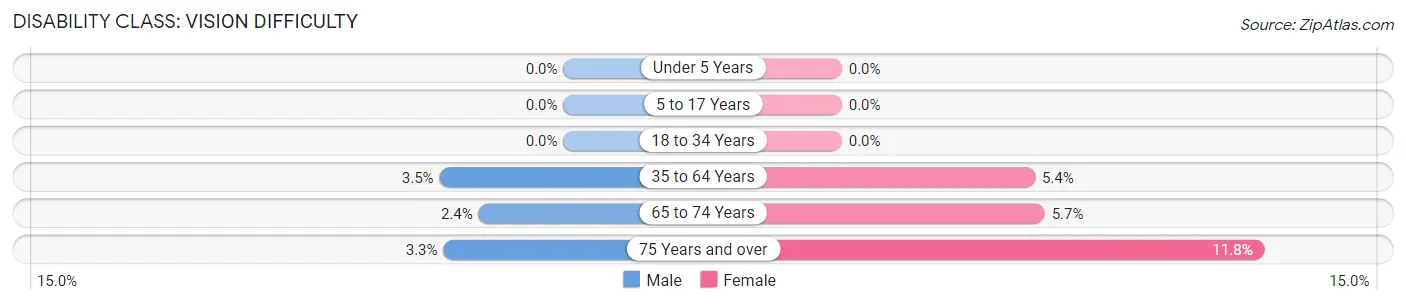
| Age Bracket | Male | Female |
| Under 5 Years | 0 (0.0%) | 0 (0.0%) |
| 5 to 17 Years | 0 (0.0%) | 0 (0.0%) |
| 18 to 34 Years | 0 (0.0%) | 0 (0.0%) |
| 35 to 64 Years | 12 (3.5%) | 24 (5.4%) |
| 65 to 74 Years | 12 (2.4%) | 48 (5.7%) |
| 75 Years and over | 29 (3.3%) | 109 (11.8%) |
Disability Class: Cognitive Difficulty
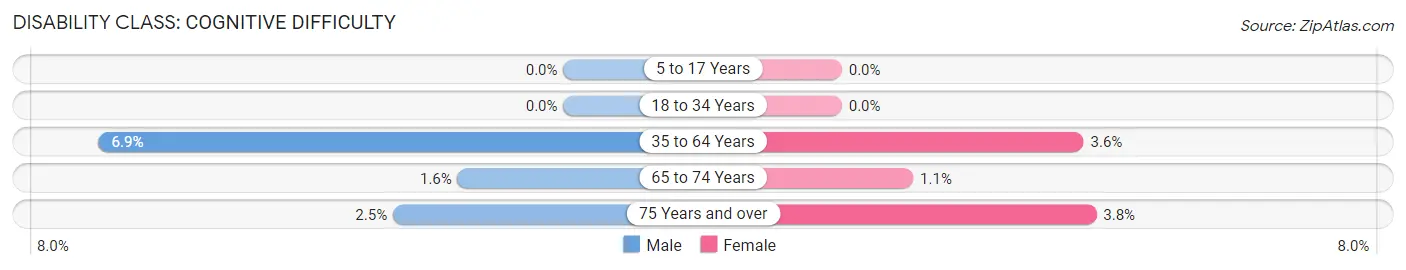
| Age Bracket | Male | Female |
| 5 to 17 Years | 0 (0.0%) | 0 (0.0%) |
| 18 to 34 Years | 0 (0.0%) | 0 (0.0%) |
| 35 to 64 Years | 24 (6.9%) | 16 (3.6%) |
| 65 to 74 Years | 8 (1.6%) | 9 (1.1%) |
| 75 Years and over | 22 (2.5%) | 35 (3.8%) |
Disability Class: Ambulatory Difficulty
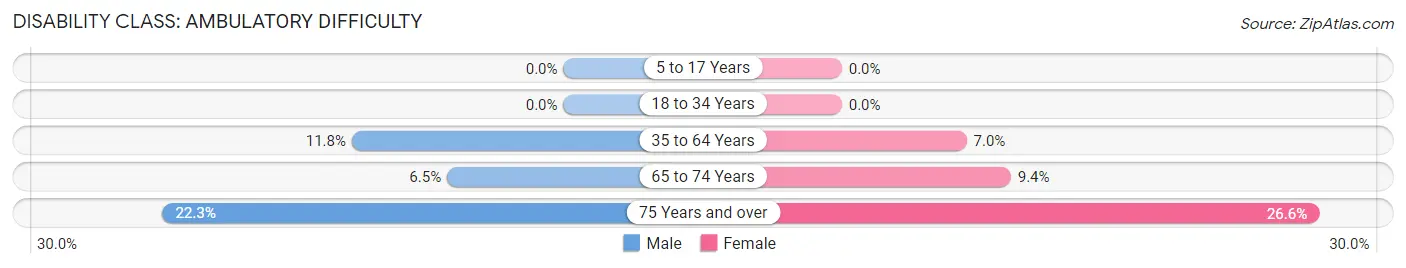
| Age Bracket | Male | Female |
| 5 to 17 Years | 0 (0.0%) | 0 (0.0%) |
| 18 to 34 Years | 0 (0.0%) | 0 (0.0%) |
| 35 to 64 Years | 41 (11.8%) | 31 (7.0%) |
| 65 to 74 Years | 33 (6.5%) | 80 (9.4%) |
| 75 Years and over | 194 (22.3%) | 246 (26.6%) |
Disability Class: Self-Care Difficulty
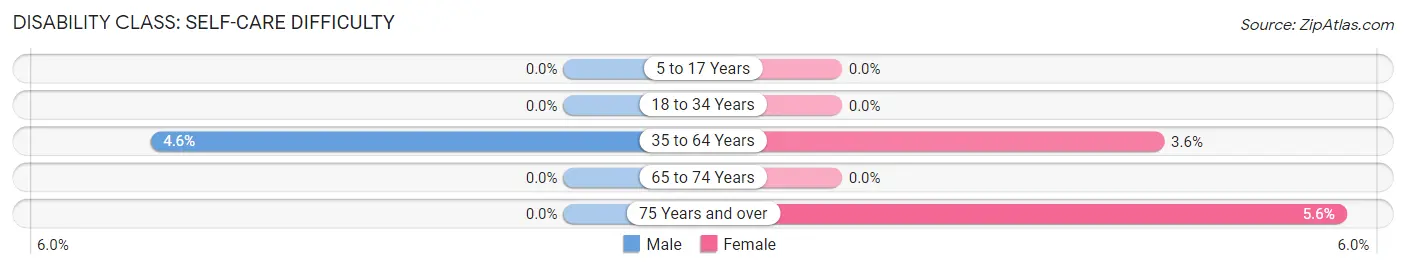
| Age Bracket | Male | Female |
| 5 to 17 Years | 0 (0.0%) | 0 (0.0%) |
| 18 to 34 Years | 0 (0.0%) | 0 (0.0%) |
| 35 to 64 Years | 16 (4.6%) | 16 (3.6%) |
| 65 to 74 Years | 0 (0.0%) | 0 (0.0%) |
| 75 Years and over | 0 (0.0%) | 52 (5.6%) |
Technology Access in Plantation
Computing Device Access in Plantation
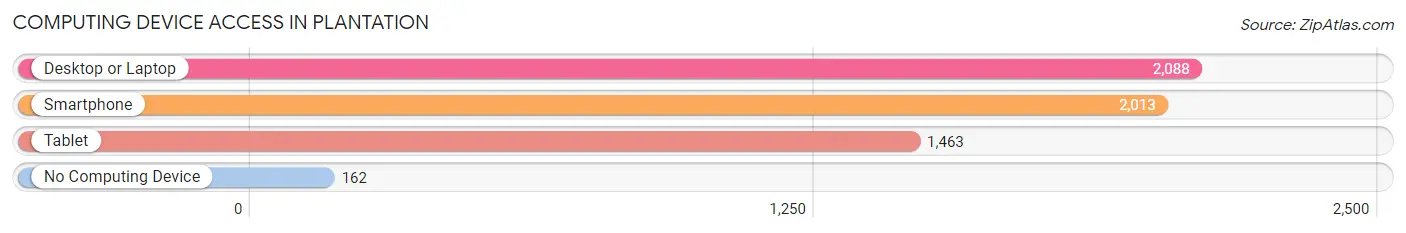
| Device Type | # Households | % Households |
| Desktop or Laptop | 2,088 | 85.5% |
| Smartphone | 2,013 | 82.5% |
| Tablet | 1,463 | 59.9% |
| No Computing Device | 162 | 6.6% |
| Total | 2,441 | 100.0% |
Internet Access in Plantation
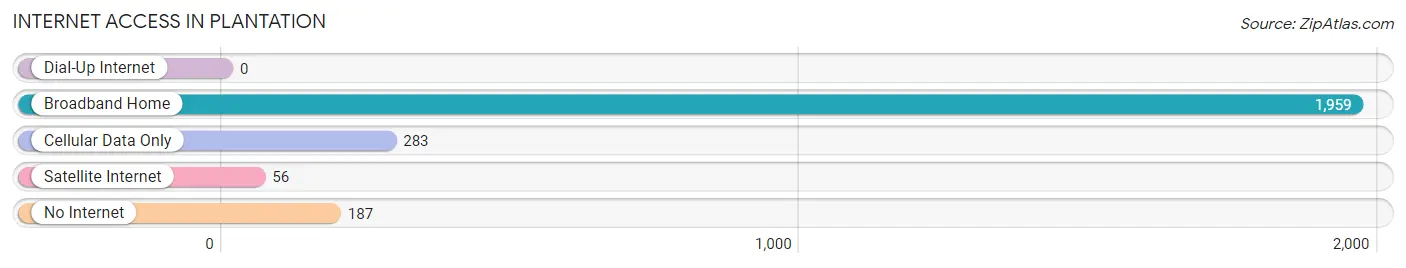
| Internet Type | # Households | % Households |
| Dial-Up Internet | 0 | 0.0% |
| Broadband Home | 1,959 | 80.2% |
| Cellular Data Only | 283 | 11.6% |
| Satellite Internet | 56 | 2.3% |
| No Internet | 187 | 7.7% |
| Total | 2,441 | 100.0% |
Plantation Summary
Plantation is a city located in Broward County, Florida, United States. It is part of the Miami metropolitan area, which was home to an estimated 6,012,331 people in 2015. The city is located in the heart of Broward County, just west of Fort Lauderdale. Plantation is a vibrant and diverse city with a population of approximately 90,000 people.
Geography
Plantation is located in the southeastern part of Florida, in Broward County. It is situated between the Everglades and the Atlantic Ocean. The city is bordered by the cities of Lauderhill, Sunrise, Davie, and Fort Lauderdale. Plantation is located approximately 25 miles north of Miami and is part of the Miami metropolitan area. The city covers an area of approximately 15.6 square miles and has a population density of 5,845 people per square mile.
Climate
Plantation has a tropical climate with hot and humid summers and mild winters. The average temperature in the summer is around 90°F and the average temperature in the winter is around 70°F. The city receives an average of 60 inches of rain per year, with the majority of the rain falling in the summer months.
Economy
Plantation is home to a variety of businesses and industries. The city is home to several large corporations, including American Express, Motorola, and Citrix Systems. The city is also home to several smaller businesses, including restaurants, retail stores, and professional services. The city’s economy is largely driven by tourism, with many visitors coming to the city to enjoy its beaches, parks, and other attractions.
Demographics
As of the 2010 census, Plantation had a population of 84,955 people. The racial makeup of the city was 57.2% White, 24.3% African American, 0.4% Native American, 5.2% Asian, 0.1% Pacific Islander, 10.2% from other races, and 2.6% from two or more races. Hispanic or Latino of any race were 24.3% of the population.
The median income for a household in the city was $50,945, and the median income for a family was $60,945. The per capita income for the city was $25,945. About 8.2% of families and 10.3% of the population were below the poverty line, including 14.2% of those under age 18 and 8.2% of those age 65 or over.
Conclusion
Plantation is a vibrant and diverse city located in Broward County, Florida. The city is home to a variety of businesses and industries, and its economy is largely driven by tourism. The city has a population of approximately 90,000 people, with a diverse racial makeup. The city has a tropical climate with hot and humid summers and mild winters. Plantation is a great place to live, work, and visit.
Common Questions
What is Per Capita Income in Plantation?
Per Capita income in Plantation is $50,211.
What is the Median Family Income in Plantation?
Median Family Income in Plantation is $83,403.
What is the Median Household income in Plantation?
Median Household Income in Plantation is $72,209.
What is Income or Wage Gap in Plantation?
Income or Wage Gap in Plantation is 33.6%.
Women in Plantation earn 66.4 cents for every dollar earned by a man.
What is Inequality or Gini Index in Plantation?
Inequality or Gini Index in Plantation is 0.36.
What is the Total Population of Plantation?
Total Population of Plantation is 4,274.
What is the Total Male Population of Plantation?
Total Male Population of Plantation is 1,908.
What is the Total Female Population of Plantation?
Total Female Population of Plantation is 2,366.
What is the Ratio of Males per 100 Females in Plantation?
There are 80.64 Males per 100 Females in Plantation.
What is the Ratio of Females per 100 Males in Plantation?
There are 124.00 Females per 100 Males in Plantation.
What is the Median Population Age in Plantation?
Median Population Age in Plantation is 72.6 Years.
What is the Average Family Size in Plantation
Average Family Size in Plantation is 2.2 People.
What is the Average Household Size in Plantation
Average Household Size in Plantation is 1.7 People.
How Large is the Labor Force in Plantation?
There are 920 People in the Labor Forcein in Plantation.
What is the Percentage of People in the Labor Force in Plantation?
22.6% of People are in the Labor Force in Plantation.
What is the Unemployment Rate in Plantation?
Unemployment Rate in Plantation is 1.4%.