Wekiwa Springs, FL Map & Demographics
Wekiwa Springs Map
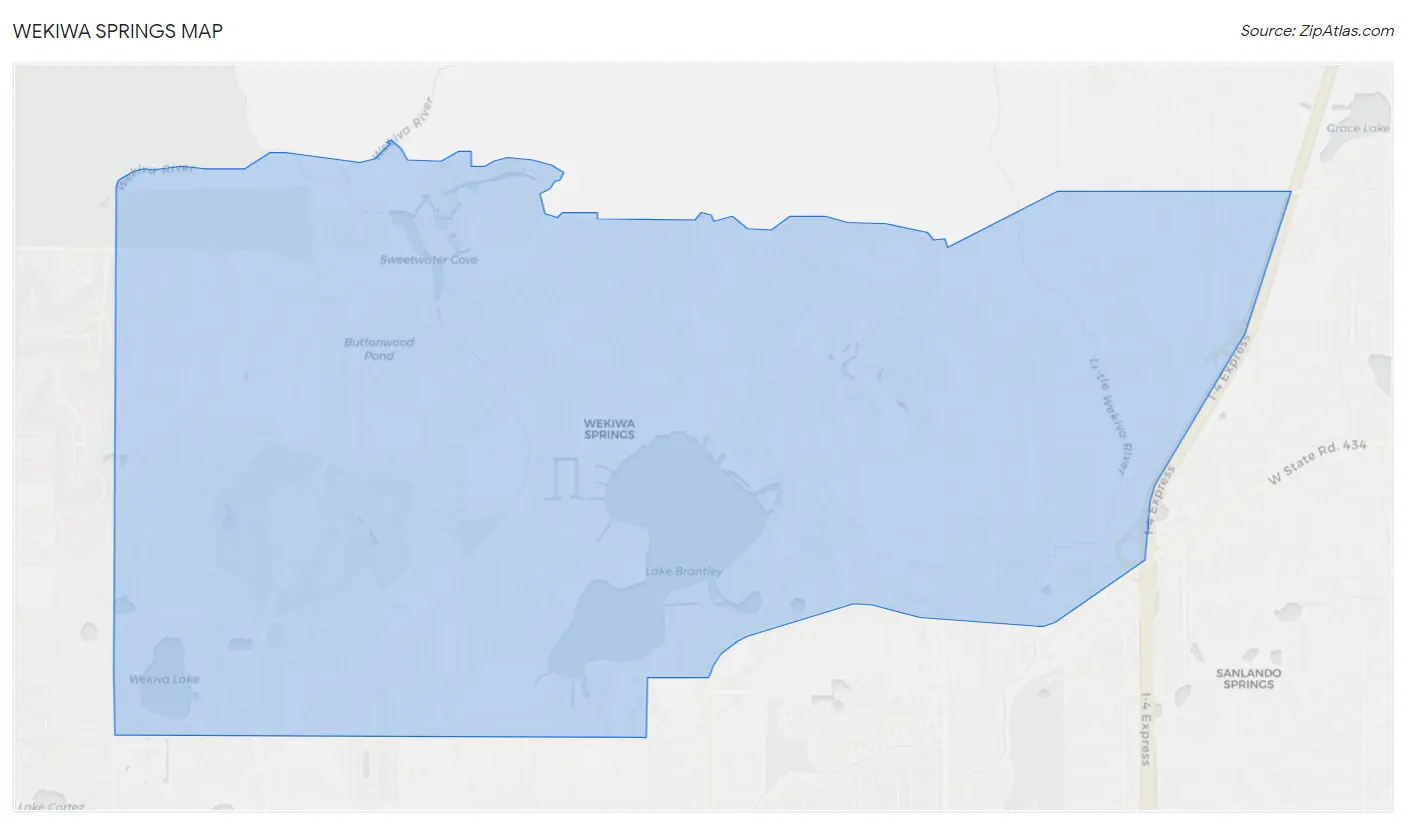
Wekiwa Springs Overview
$53,405
PER CAPITA INCOME
$116,109
AVG FAMILY INCOME
$102,914
AVG HOUSEHOLD INCOME
33.1%
WAGE / INCOME GAP [ % ]
66.9¢/ $1
WAGE / INCOME GAP [ $ ]
0.44
INEQUALITY / GINI INDEX
24,270
TOTAL POPULATION
11,535
MALE POPULATION
12,735
FEMALE POPULATION
90.58
MALES / 100 FEMALES
110.40
FEMALES / 100 MALES
45.7
MEDIAN AGE
3.0
AVG FAMILY SIZE
2.5
AVG HOUSEHOLD SIZE
12,772
LABOR FORCE [ PEOPLE ]
63.4%
PERCENT IN LABOR FORCE
4.1%
UNEMPLOYMENT RATE
Income in Wekiwa Springs
Income Overview in Wekiwa Springs
Per Capita Income in Wekiwa Springs is $53,405, while median incomes of families and households are $116,109 and $102,914 respectively.
| Characteristic | Number | Measure |
| Per Capita Income | 24,270 | $53,405 |
| Median Family Income | 7,002 | $116,109 |
| Mean Family Income | 7,002 | $155,193 |
| Median Household Income | 9,472 | $102,914 |
| Mean Household Income | 9,472 | $134,730 |
| Income Deficit | 7,002 | $0 |
| Wage / Income Gap (%) | 24,270 | 33.06% |
| Wage / Income Gap ($) | 24,270 | 66.94¢ per $1 |
| Gini / Inequality Index | 24,270 | 0.44 |
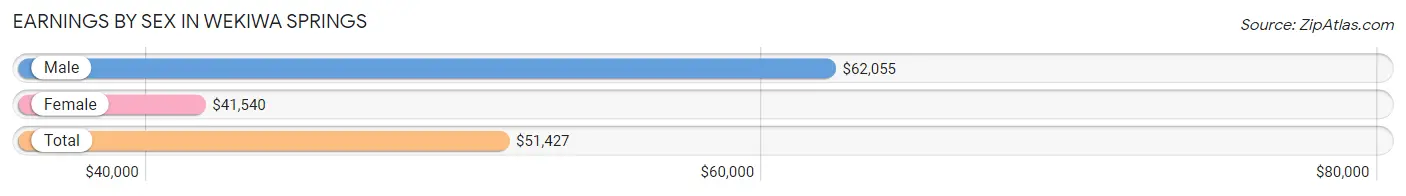
Earnings by Sex in Wekiwa Springs
Average Earnings in Wekiwa Springs are $51,427, $62,055 for men and $41,540 for women, a difference of 33.1%.
| Sex | Number | Average Earnings |
| Male | 6,654 (51.0%) | $62,055 |
| Female | 6,388 (49.0%) | $41,540 |
| Total | 13,042 (100.0%) | $51,427 |
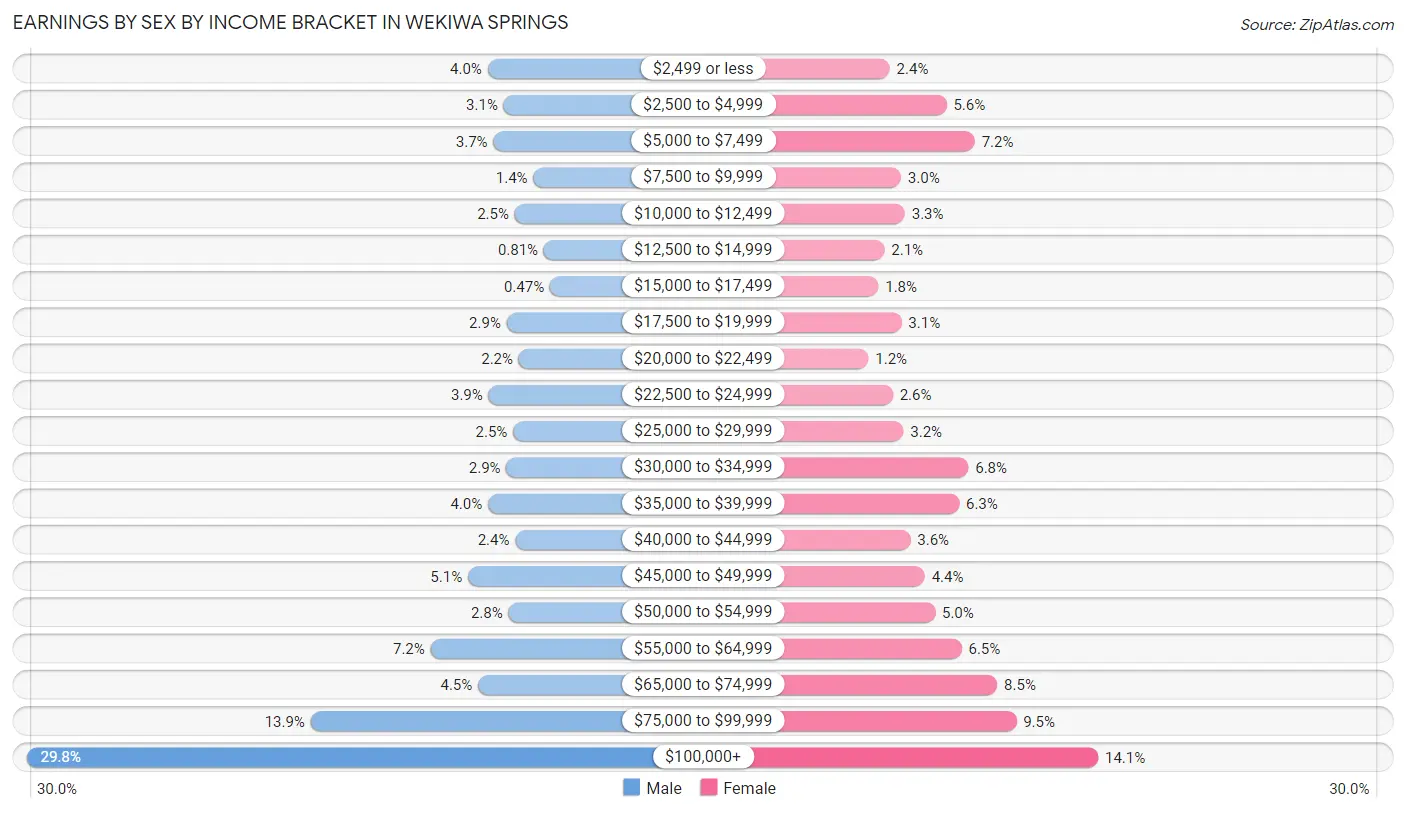
Earnings by Sex by Income Bracket in Wekiwa Springs
The most common earnings brackets in Wekiwa Springs are $100,000+ for men (1,985 | 29.8%) and $100,000+ for women (902 | 14.1%).
| Income | Male | Female |
| $2,499 or less | 264 (4.0%) | 154 (2.4%) |
| $2,500 to $4,999 | 204 (3.1%) | 358 (5.6%) |
| $5,000 to $7,499 | 243 (3.6%) | 459 (7.2%) |
| $7,500 to $9,999 | 93 (1.4%) | 194 (3.0%) |
| $10,000 to $12,499 | 163 (2.5%) | 208 (3.3%) |
| $12,500 to $14,999 | 54 (0.8%) | 135 (2.1%) |
| $15,000 to $17,499 | 31 (0.5%) | 113 (1.8%) |
| $17,500 to $19,999 | 193 (2.9%) | 196 (3.1%) |
| $20,000 to $22,499 | 148 (2.2%) | 77 (1.2%) |
| $22,500 to $24,999 | 261 (3.9%) | 165 (2.6%) |
| $25,000 to $29,999 | 169 (2.5%) | 203 (3.2%) |
| $30,000 to $34,999 | 194 (2.9%) | 436 (6.8%) |
| $35,000 to $39,999 | 263 (4.0%) | 403 (6.3%) |
| $40,000 to $44,999 | 161 (2.4%) | 228 (3.6%) |
| $45,000 to $49,999 | 338 (5.1%) | 280 (4.4%) |
| $50,000 to $54,999 | 186 (2.8%) | 317 (5.0%) |
| $55,000 to $64,999 | 478 (7.2%) | 412 (6.5%) |
| $65,000 to $74,999 | 300 (4.5%) | 540 (8.5%) |
| $75,000 to $99,999 | 926 (13.9%) | 608 (9.5%) |
| $100,000+ | 1,985 (29.8%) | 902 (14.1%) |
| Total | 6,654 (100.0%) | 6,388 (100.0%) |
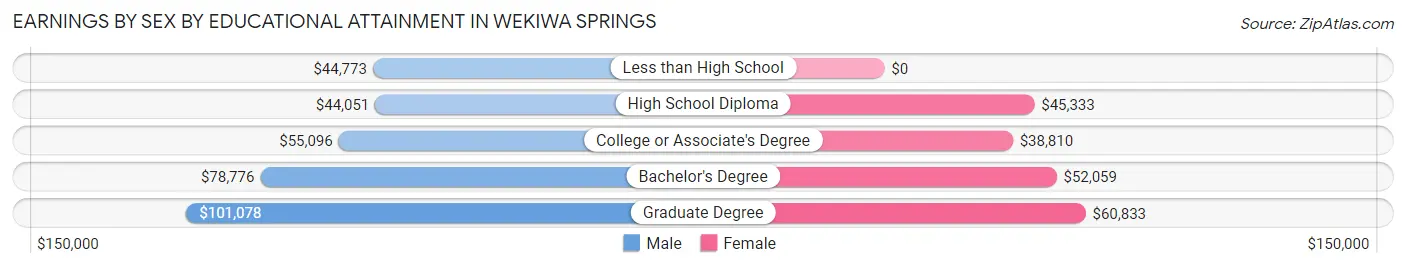
Earnings by Sex by Educational Attainment in Wekiwa Springs
Average earnings in Wekiwa Springs are $70,594 for men and $47,665 for women, a difference of 32.5%. Men with an educational attainment of graduate degree enjoy the highest average annual earnings of $101,078, while those with high school diploma education earn the least with $44,051. Women with an educational attainment of graduate degree earn the most with the average annual earnings of $60,833, while those with college or associate's degree education have the smallest earnings of $38,810.
| Educational Attainment | Male Income | Female Income |
| Less than High School | $44,773 | $0 |
| High School Diploma | $44,051 | $45,333 |
| College or Associate's Degree | $55,096 | $38,810 |
| Bachelor's Degree | $78,776 | $52,059 |
| Graduate Degree | $101,078 | $60,833 |
| Total | $70,594 | $47,665 |
Family Income in Wekiwa Springs
Family Income Brackets in Wekiwa Springs
According to the Wekiwa Springs family income data, there are 1,631 families falling into the $100,000 to $149,999 income range, which is the most common income bracket and makes up 23.3% of all families. Conversely, the less than $10,000 income bracket is the least frequent group with only 63 families (0.9%) belonging to this category.
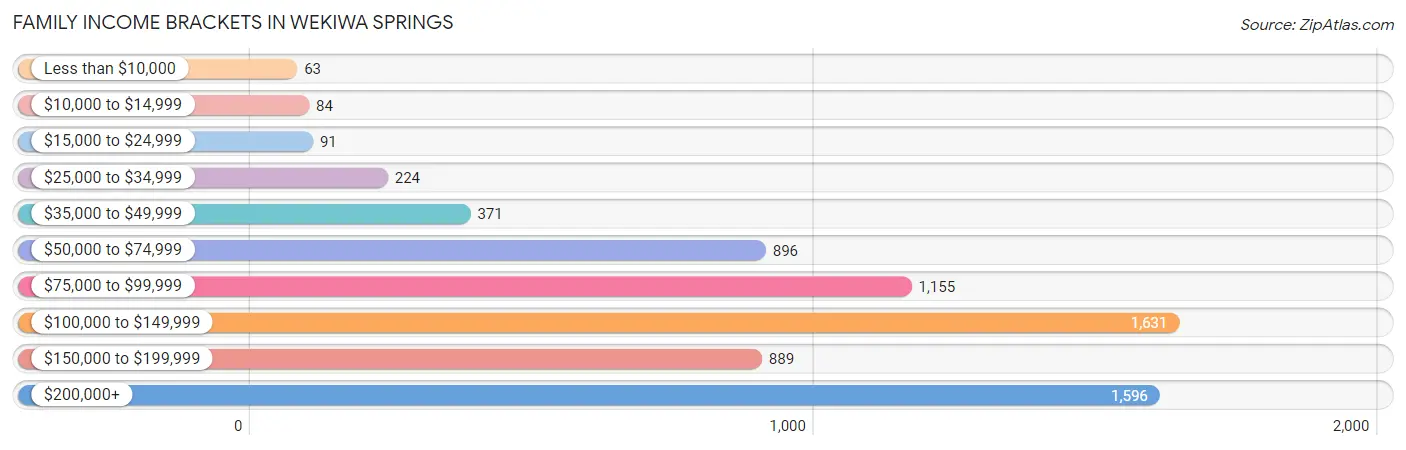
| Income Bracket | # Families | % Families |
| Less than $10,000 | 63 | 0.9% |
| $10,000 to $14,999 | 84 | 1.2% |
| $15,000 to $24,999 | 91 | 1.3% |
| $25,000 to $34,999 | 224 | 3.2% |
| $35,000 to $49,999 | 371 | 5.3% |
| $50,000 to $74,999 | 896 | 12.8% |
| $75,000 to $99,999 | 1,155 | 16.5% |
| $100,000 to $149,999 | 1,631 | 23.3% |
| $150,000 to $199,999 | 889 | 12.7% |
| $200,000+ | 1,596 | 22.8% |
Family Income by Famaliy Size in Wekiwa Springs
5-person families (409 | 5.8%) account for the highest median family income in Wekiwa Springs with $186,726 per family, while 2-person families (3,245 | 46.3%) have the highest median income of $49,914 per family member.
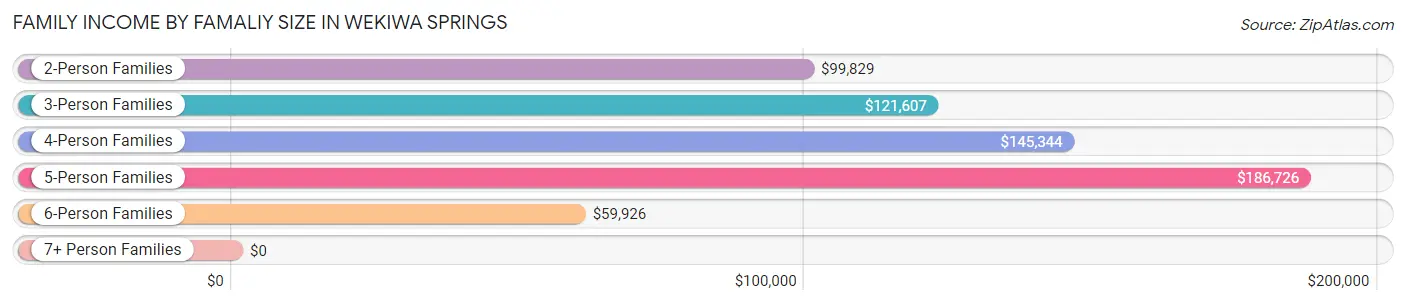
| Income Bracket | # Families | Median Income |
| 2-Person Families | 3,245 (46.3%) | $99,829 |
| 3-Person Families | 1,816 (25.9%) | $121,607 |
| 4-Person Families | 1,383 (19.8%) | $145,344 |
| 5-Person Families | 409 (5.8%) | $186,726 |
| 6-Person Families | 122 (1.7%) | $59,926 |
| 7+ Person Families | 27 (0.4%) | $0 |
| Total | 7,002 (100.0%) | $116,109 |
Family Income by Number of Earners in Wekiwa Springs
The median family income in Wekiwa Springs is $116,109, with families comprising 2 earners (3,104) having the highest median family income of $144,097, while families with no earners (1,119) have the lowest median family income of $90,583, accounting for 44.3% and 16.0% of families, respectively.
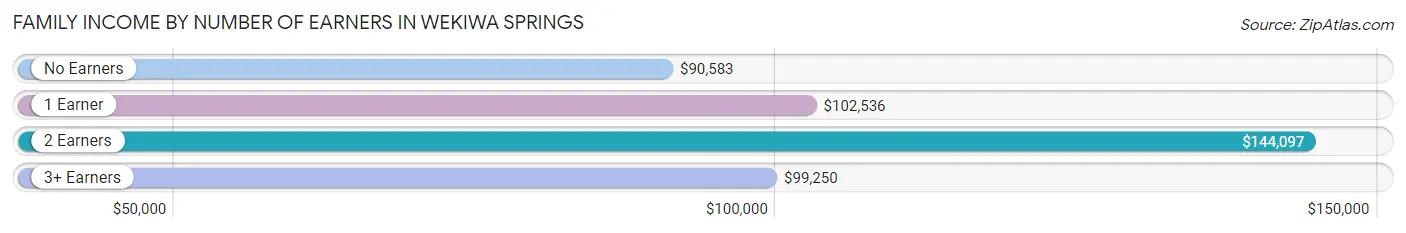
| Number of Earners | # Families | Median Income |
| No Earners | 1,119 (16.0%) | $90,583 |
| 1 Earner | 1,950 (27.9%) | $102,536 |
| 2 Earners | 3,104 (44.3%) | $144,097 |
| 3+ Earners | 829 (11.8%) | $99,250 |
| Total | 7,002 (100.0%) | $116,109 |
Household Income in Wekiwa Springs
Household Income Brackets in Wekiwa Springs
With 1,989 households falling in the category, the $100,000 to $149,999 income range is the most frequent in Wekiwa Springs, accounting for 21.0% of all households. In contrast, only 161 households (1.7%) fall into the $10,000 to $14,999 income bracket, making it the least populous group.
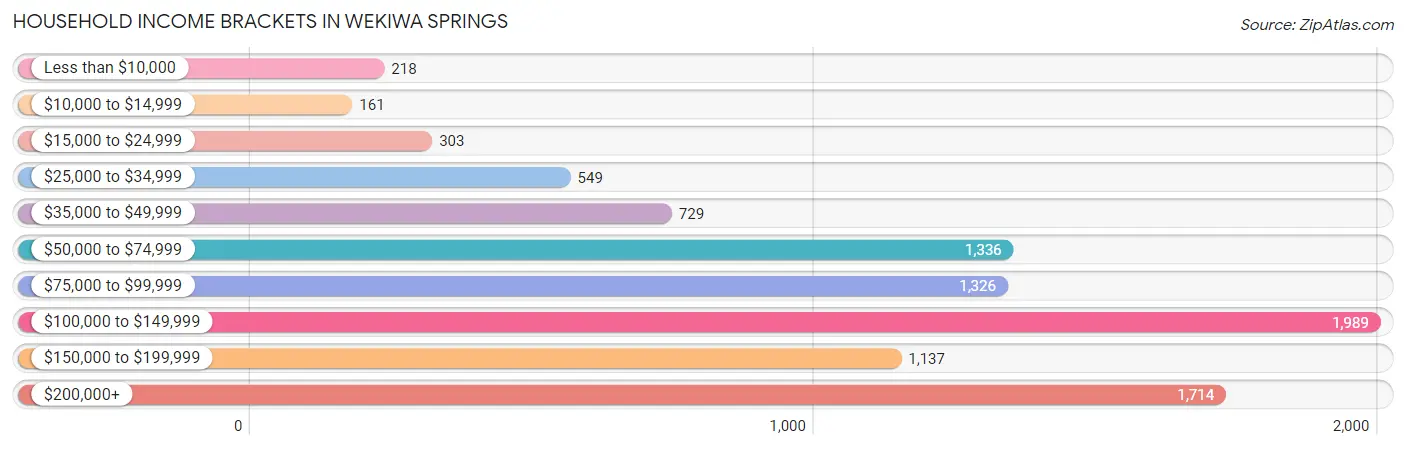
| Income Bracket | # Households | % Households |
| Less than $10,000 | 218 | 2.3% |
| $10,000 to $14,999 | 161 | 1.7% |
| $15,000 to $24,999 | 303 | 3.2% |
| $25,000 to $34,999 | 549 | 5.8% |
| $35,000 to $49,999 | 729 | 7.7% |
| $50,000 to $74,999 | 1,336 | 14.1% |
| $75,000 to $99,999 | 1,326 | 14.0% |
| $100,000 to $149,999 | 1,989 | 21.0% |
| $150,000 to $199,999 | 1,137 | 12.0% |
| $200,000+ | 1,714 | 18.1% |
Household Income by Householder Age in Wekiwa Springs
The median household income in Wekiwa Springs is $102,914, with the highest median household income of $126,458 found in the 25 to 44 years age bracket for the primary householder. A total of 2,597 households (27.4%) fall into this category. Meanwhile, the 15 to 24 years age bracket for the primary householder has the lowest median household income of $46,023, with 131 households (1.4%) in this group.
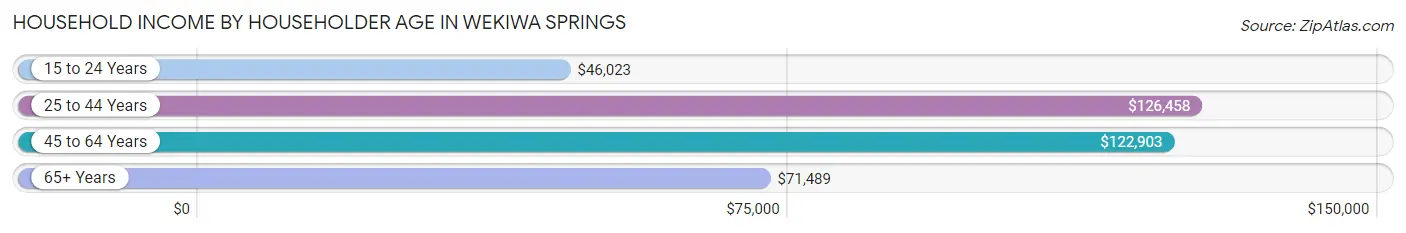
| Income Bracket | # Households | Median Income |
| 15 to 24 Years | 131 (1.4%) | $46,023 |
| 25 to 44 Years | 2,597 (27.4%) | $126,458 |
| 45 to 64 Years | 3,682 (38.9%) | $122,903 |
| 65+ Years | 3,062 (32.3%) | $71,489 |
| Total | 9,472 (100.0%) | $102,914 |
Poverty in Wekiwa Springs
Income Below Poverty by Sex and Age in Wekiwa Springs
With 4.5% poverty level for males and 5.5% for females among the residents of Wekiwa Springs, 18 to 24 year old males and 15 year old females are the most vulnerable to poverty, with 141 males (20.4%) and 22 females (10.6%) in their respective age groups living below the poverty level.
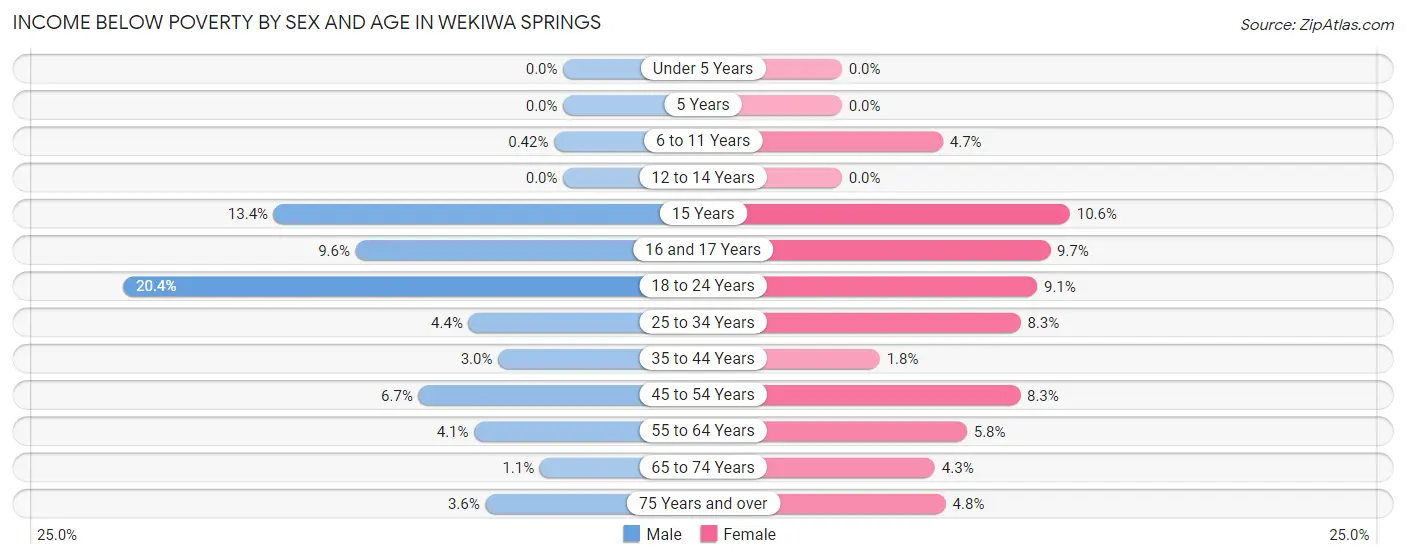
| Age Bracket | Male | Female |
| Under 5 Years | 0 (0.0%) | 0 (0.0%) |
| 5 Years | 0 (0.0%) | 0 (0.0%) |
| 6 to 11 Years | 4 (0.4%) | 40 (4.7%) |
| 12 to 14 Years | 0 (0.0%) | 0 (0.0%) |
| 15 Years | 9 (13.4%) | 22 (10.6%) |
| 16 and 17 Years | 29 (9.6%) | 42 (9.7%) |
| 18 to 24 Years | 141 (20.4%) | 70 (9.1%) |
| 25 to 34 Years | 46 (4.4%) | 90 (8.3%) |
| 35 to 44 Years | 57 (3.0%) | 29 (1.8%) |
| 45 to 54 Years | 115 (6.7%) | 164 (8.3%) |
| 55 to 64 Years | 64 (4.1%) | 104 (5.8%) |
| 65 to 74 Years | 12 (1.1%) | 60 (4.3%) |
| 75 Years and over | 40 (3.6%) | 74 (4.8%) |
| Total | 517 (4.5%) | 695 (5.5%) |
Income Above Poverty by Sex and Age in Wekiwa Springs
According to the poverty statistics in Wekiwa Springs, males aged under 5 years and females aged under 5 years are the age groups that are most secure financially, with 100.0% of males and 100.0% of females in these age groups living above the poverty line.
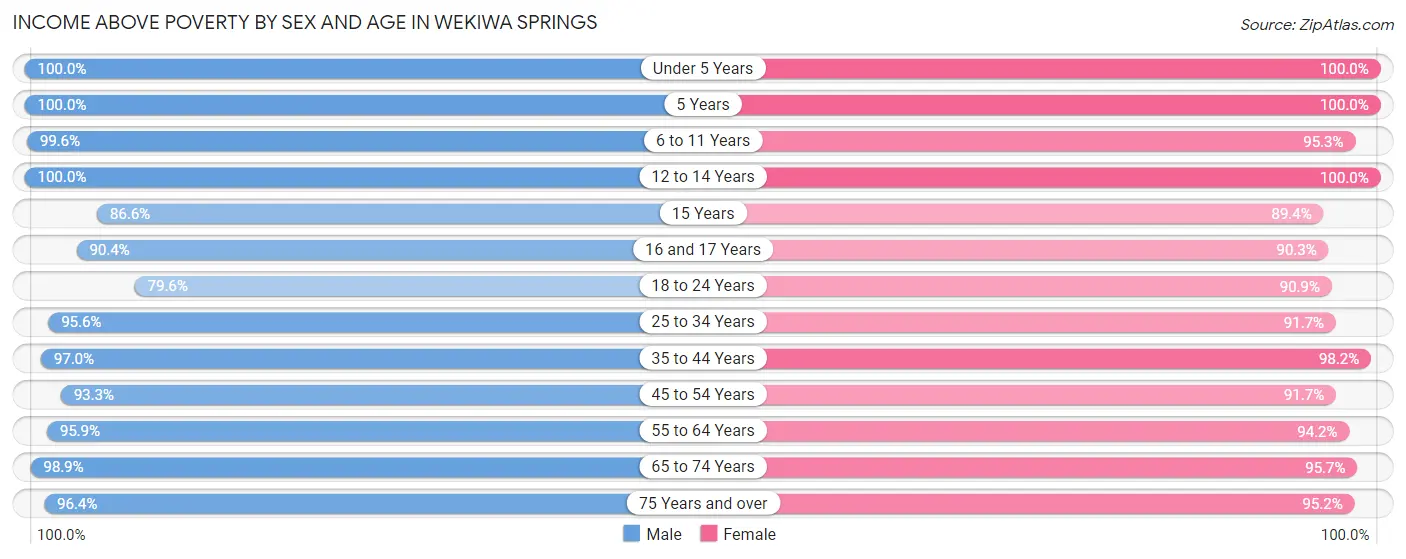
| Age Bracket | Male | Female |
| Under 5 Years | 480 (100.0%) | 434 (100.0%) |
| 5 Years | 141 (100.0%) | 113 (100.0%) |
| 6 to 11 Years | 950 (99.6%) | 812 (95.3%) |
| 12 to 14 Years | 458 (100.0%) | 393 (100.0%) |
| 15 Years | 58 (86.6%) | 186 (89.4%) |
| 16 and 17 Years | 272 (90.4%) | 393 (90.3%) |
| 18 to 24 Years | 549 (79.6%) | 703 (90.9%) |
| 25 to 34 Years | 1,002 (95.6%) | 996 (91.7%) |
| 35 to 44 Years | 1,832 (97.0%) | 1,616 (98.2%) |
| 45 to 54 Years | 1,599 (93.3%) | 1,820 (91.7%) |
| 55 to 64 Years | 1,485 (95.9%) | 1,688 (94.2%) |
| 65 to 74 Years | 1,098 (98.9%) | 1,330 (95.7%) |
| 75 Years and over | 1,069 (96.4%) | 1,460 (95.2%) |
| Total | 10,993 (95.5%) | 11,944 (94.5%) |
Income Below Poverty Among Married-Couple Families in Wekiwa Springs
The poverty statistics for married-couple families in Wekiwa Springs show that 2.4% or 142 of the total 5,907 families live below the poverty line. Families with no children have the highest poverty rate of 2.8%, comprising of 102 families. On the other hand, families with 3 or 4 children have the lowest poverty rate of 0.0%, which includes 0 families.
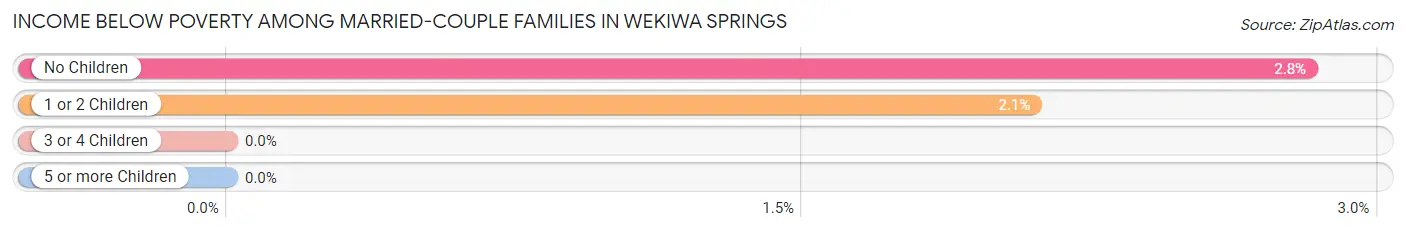
| Children | Above Poverty | Below Poverty |
| No Children | 3,513 (97.2%) | 102 (2.8%) |
| 1 or 2 Children | 1,861 (97.9%) | 40 (2.1%) |
| 3 or 4 Children | 391 (100.0%) | 0 (0.0%) |
| 5 or more Children | 0 (0.0%) | 0 (0.0%) |
| Total | 5,765 (97.6%) | 142 (2.4%) |
Income Below Poverty Among Single-Parent Households in Wekiwa Springs
According to the poverty data in Wekiwa Springs, 2.3% or 9 single-father households and 12.9% or 90 single-mother households are living below the poverty line. Among single-father households, those with no children have the highest poverty rate, with 9 households (6.6%) experiencing poverty. Likewise, among single-mother households, those with 3 or 4 children have the highest poverty rate, with 8 households (28.6%) falling below the poverty line.
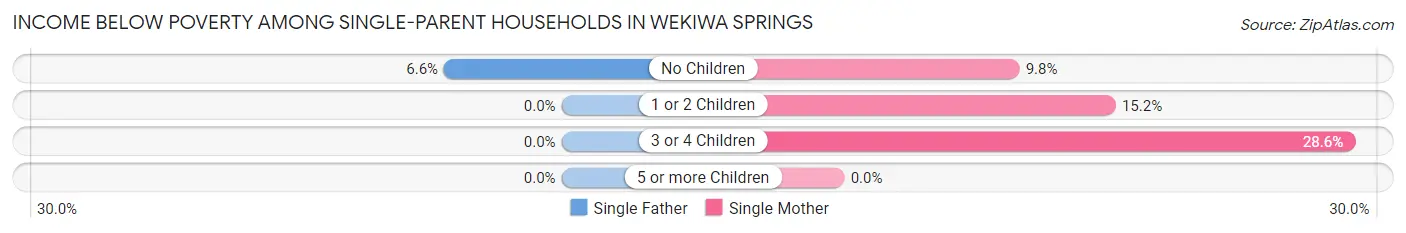
| Children | Single Father | Single Mother |
| No Children | 9 (6.6%) | 35 (9.8%) |
| 1 or 2 Children | 0 (0.0%) | 47 (15.2%) |
| 3 or 4 Children | 0 (0.0%) | 8 (28.6%) |
| 5 or more Children | 0 (0.0%) | 0 (0.0%) |
| Total | 9 (2.3%) | 90 (12.9%) |
Income Below Poverty Among Married-Couple vs Single-Parent Households in Wekiwa Springs
The poverty data for Wekiwa Springs shows that 142 of the married-couple family households (2.4%) and 99 of the single-parent households (9.0%) are living below the poverty level. Within the married-couple family households, those with no children have the highest poverty rate, with 102 households (2.8%) falling below the poverty line. Among the single-parent households, those with 3 or 4 children have the highest poverty rate, with 8 household (16.3%) living below poverty.
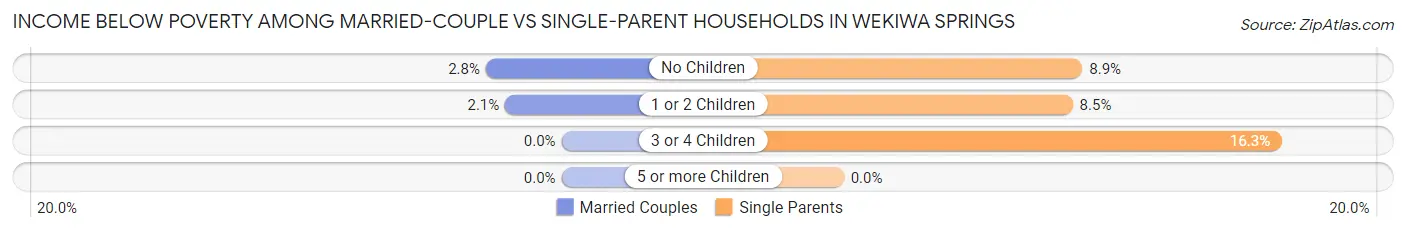
| Children | Married-Couple Families | Single-Parent Households |
| No Children | 102 (2.8%) | 44 (8.9%) |
| 1 or 2 Children | 40 (2.1%) | 47 (8.5%) |
| 3 or 4 Children | 0 (0.0%) | 8 (16.3%) |
| 5 or more Children | 0 (0.0%) | 0 (0.0%) |
| Total | 142 (2.4%) | 99 (9.0%) |
Race in Wekiwa Springs
The most populous races in Wekiwa Springs are White / Caucasian (20,196 | 83.2%), Hispanic or Latino (3,949 | 16.3%), and Two or more Races (1,993 | 8.2%).
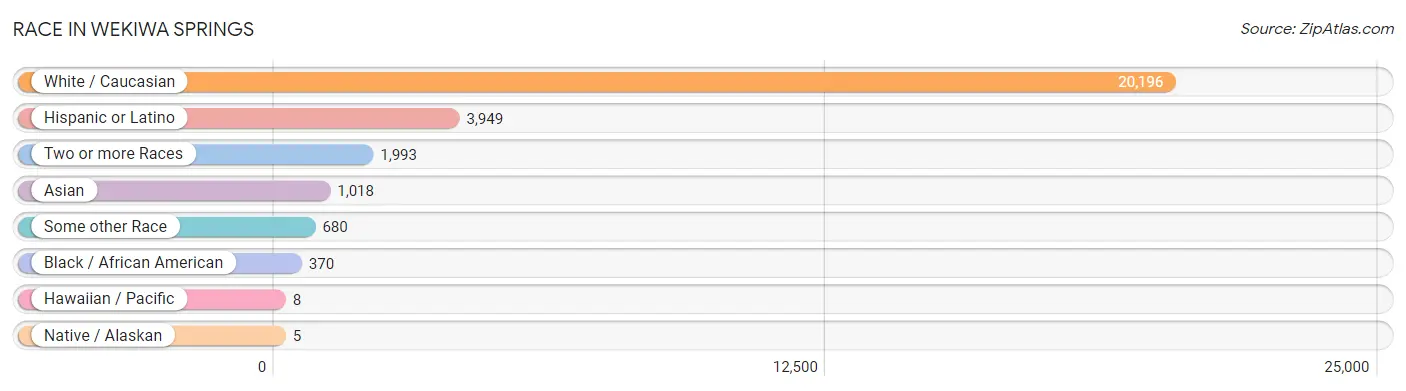
| Race | # Population | % Population |
| Asian | 1,018 | 4.2% |
| Black / African American | 370 | 1.5% |
| Hawaiian / Pacific | 8 | 0.0% |
| Hispanic or Latino | 3,949 | 16.3% |
| Native / Alaskan | 5 | 0.0% |
| White / Caucasian | 20,196 | 83.2% |
| Two or more Races | 1,993 | 8.2% |
| Some other Race | 680 | 2.8% |
| Total | 24,270 | 100.0% |
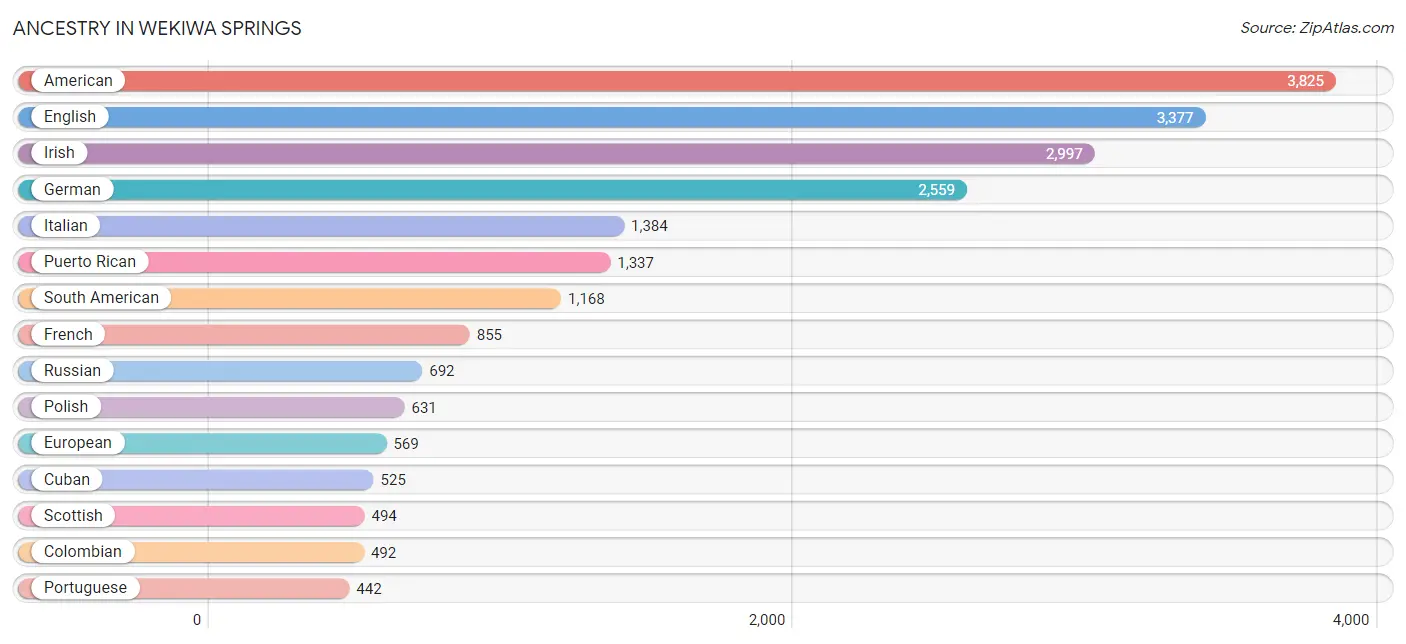
Ancestry in Wekiwa Springs
The most populous ancestries reported in Wekiwa Springs are American (3,825 | 15.8%), English (3,377 | 13.9%), Irish (2,997 | 12.3%), German (2,559 | 10.5%), and Italian (1,384 | 5.7%), together accounting for 58.3% of all Wekiwa Springs residents.
| Ancestry | # Population | % Population |
| African | 5 | 0.0% |
| American | 3,825 | 15.8% |
| Arab | 140 | 0.6% |
| Argentinean | 137 | 0.6% |
| Armenian | 22 | 0.1% |
| Austrian | 93 | 0.4% |
| Belgian | 26 | 0.1% |
| Bhutanese | 58 | 0.2% |
| Bolivian | 7 | 0.0% |
| Brazilian | 40 | 0.2% |
| British | 211 | 0.9% |
| Bulgarian | 78 | 0.3% |
| Burmese | 191 | 0.8% |
| Canadian | 61 | 0.3% |
| Central American | 85 | 0.4% |
| Central American Indian | 11 | 0.1% |
| Cherokee | 3 | 0.0% |
| Chilean | 45 | 0.2% |
| Choctaw | 8 | 0.0% |
| Colombian | 492 | 2.0% |
| Costa Rican | 6 | 0.0% |
| Croatian | 19 | 0.1% |
| Cuban | 525 | 2.2% |
| Cypriot | 18 | 0.1% |
| Czech | 64 | 0.3% |
| Czechoslovakian | 81 | 0.3% |
| Danish | 79 | 0.3% |
| Dominican | 70 | 0.3% |
| Dutch | 191 | 0.8% |
| Dutch West Indian | 5 | 0.0% |
| Eastern European | 155 | 0.6% |
| Ecuadorian | 145 | 0.6% |
| Egyptian | 61 | 0.3% |
| English | 3,377 | 13.9% |
| Estonian | 8 | 0.0% |
| European | 569 | 2.3% |
| Filipino | 8 | 0.0% |
| Finnish | 95 | 0.4% |
| French | 855 | 3.5% |
| French Canadian | 166 | 0.7% |
| German | 2,559 | 10.5% |
| Greek | 145 | 0.6% |
| Guatemalan | 38 | 0.2% |
| Guyanese | 30 | 0.1% |
| Haitian | 42 | 0.2% |
| Honduran | 9 | 0.0% |
| Hungarian | 78 | 0.3% |
| Icelander | 8 | 0.0% |
| Indian (Asian) | 169 | 0.7% |
| Iranian | 55 | 0.2% |
| Irish | 2,997 | 12.3% |
| Iroquois | 7 | 0.0% |
| Israeli | 21 | 0.1% |
| Italian | 1,384 | 5.7% |
| Jamaican | 159 | 0.7% |
| Korean | 235 | 1.0% |
| Latvian | 27 | 0.1% |
| Lebanese | 70 | 0.3% |
| Lithuanian | 23 | 0.1% |
| Mexican | 433 | 1.8% |
| Native Hawaiian | 8 | 0.0% |
| Nicaraguan | 21 | 0.1% |
| Nigerian | 22 | 0.1% |
| Northern European | 23 | 0.1% |
| Norwegian | 220 | 0.9% |
| Pakistani | 30 | 0.1% |
| Palestinian | 9 | 0.0% |
| Panamanian | 4 | 0.0% |
| Paraguayan | 5 | 0.0% |
| Pennsylvania German | 7 | 0.0% |
| Peruvian | 83 | 0.3% |
| Polish | 631 | 2.6% |
| Portuguese | 442 | 1.8% |
| Puerto Rican | 1,337 | 5.5% |
| Romanian | 54 | 0.2% |
| Russian | 692 | 2.9% |
| Salvadoran | 7 | 0.0% |
| Scandinavian | 197 | 0.8% |
| Scotch-Irish | 254 | 1.1% |
| Scottish | 494 | 2.0% |
| Slovak | 32 | 0.1% |
| Slovene | 7 | 0.0% |
| South American | 1,168 | 4.8% |
| Spaniard | 152 | 0.6% |
| Spanish | 75 | 0.3% |
| Sri Lankan | 250 | 1.0% |
| Subsaharan African | 54 | 0.2% |
| Swedish | 414 | 1.7% |
| Swiss | 111 | 0.5% |
| Thai | 259 | 1.1% |
| Ukrainian | 54 | 0.2% |
| Uruguayan | 4 | 0.0% |
| Venezuelan | 250 | 1.0% |
| Vietnamese | 54 | 0.2% |
| Welsh | 90 | 0.4% |
| Yugoslavian | 2 | 0.0% | View All 96 Rows |
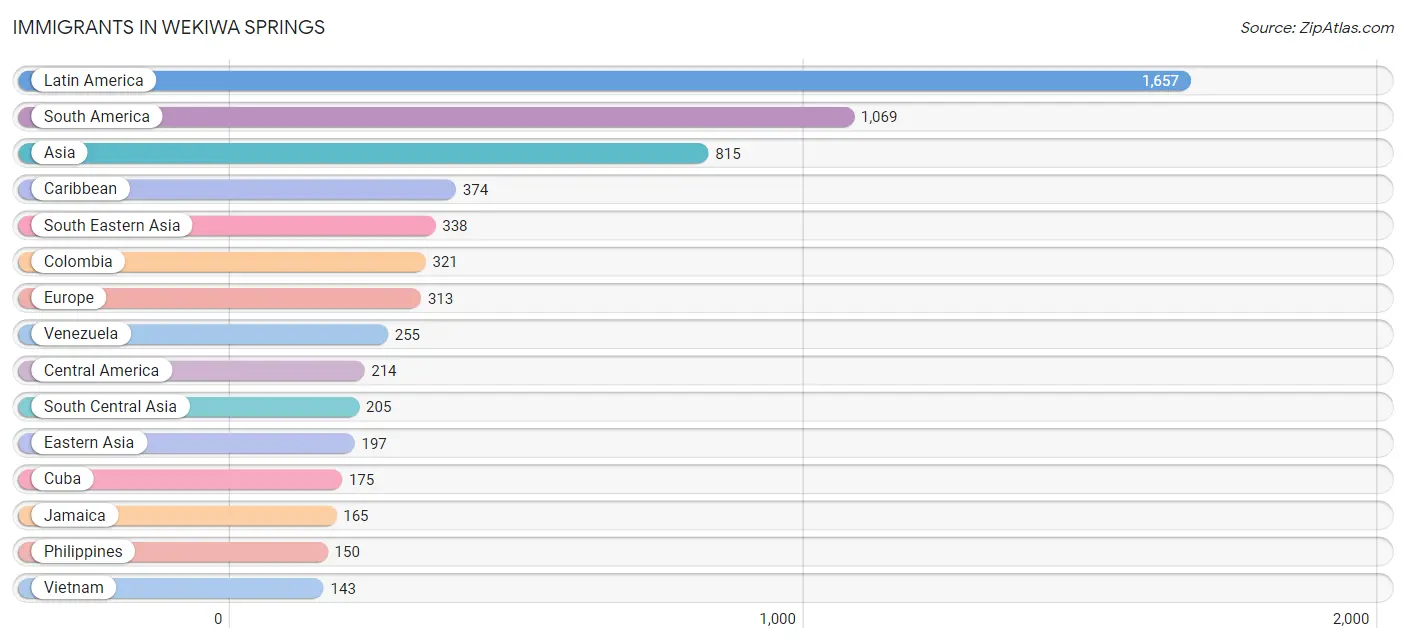
Immigrants in Wekiwa Springs
The most numerous immigrant groups reported in Wekiwa Springs came from Latin America (1,657 | 6.8%), South America (1,069 | 4.4%), Asia (815 | 3.4%), Caribbean (374 | 1.5%), and South Eastern Asia (338 | 1.4%), together accounting for 17.5% of all Wekiwa Springs residents.
| Immigration Origin | # Population | % Population |
| Africa | 97 | 0.4% |
| Albania | 13 | 0.1% |
| Argentina | 62 | 0.3% |
| Asia | 815 | 3.4% |
| Austria | 11 | 0.1% |
| Bangladesh | 44 | 0.2% |
| Bolivia | 25 | 0.1% |
| Brazil | 139 | 0.6% |
| Bulgaria | 26 | 0.1% |
| Canada | 57 | 0.2% |
| Caribbean | 374 | 1.5% |
| Central America | 214 | 0.9% |
| Chile | 45 | 0.2% |
| China | 78 | 0.3% |
| Colombia | 321 | 1.3% |
| Costa Rica | 46 | 0.2% |
| Cuba | 175 | 0.7% |
| Dominican Republic | 16 | 0.1% |
| Eastern Africa | 39 | 0.2% |
| Eastern Asia | 197 | 0.8% |
| Eastern Europe | 130 | 0.5% |
| Ecuador | 81 | 0.3% |
| Egypt | 58 | 0.2% |
| El Salvador | 20 | 0.1% |
| England | 47 | 0.2% |
| Europe | 313 | 1.3% |
| Germany | 73 | 0.3% |
| Guatemala | 38 | 0.2% |
| Guyana | 12 | 0.1% |
| Haiti | 18 | 0.1% |
| Honduras | 20 | 0.1% |
| Hong Kong | 19 | 0.1% |
| India | 124 | 0.5% |
| Iran | 18 | 0.1% |
| Ireland | 9 | 0.0% |
| Israel | 54 | 0.2% |
| Italy | 14 | 0.1% |
| Jamaica | 165 | 0.7% |
| Japan | 42 | 0.2% |
| Kazakhstan | 5 | 0.0% |
| Kenya | 16 | 0.1% |
| Korea | 77 | 0.3% |
| Latin America | 1,657 | 6.8% |
| Lebanon | 1 | 0.0% |
| Lithuania | 9 | 0.0% |
| Malaysia | 15 | 0.1% |
| Mexico | 44 | 0.2% |
| Netherlands | 8 | 0.0% |
| Nicaragua | 21 | 0.1% |
| Northern Africa | 58 | 0.2% |
| Northern Europe | 77 | 0.3% |
| Pakistan | 14 | 0.1% |
| Panama | 25 | 0.1% |
| Peru | 120 | 0.5% |
| Philippines | 150 | 0.6% |
| Poland | 21 | 0.1% |
| Russia | 34 | 0.1% |
| South America | 1,069 | 4.4% |
| South Central Asia | 205 | 0.8% |
| South Eastern Asia | 338 | 1.4% |
| Southern Europe | 14 | 0.1% |
| Thailand | 30 | 0.1% |
| Turkey | 20 | 0.1% |
| Uganda | 13 | 0.1% |
| Ukraine | 27 | 0.1% |
| Uruguay | 4 | 0.0% |
| Venezuela | 255 | 1.1% |
| Vietnam | 143 | 0.6% |
| Western Asia | 75 | 0.3% |
| Western Europe | 92 | 0.4% | View All 70 Rows |
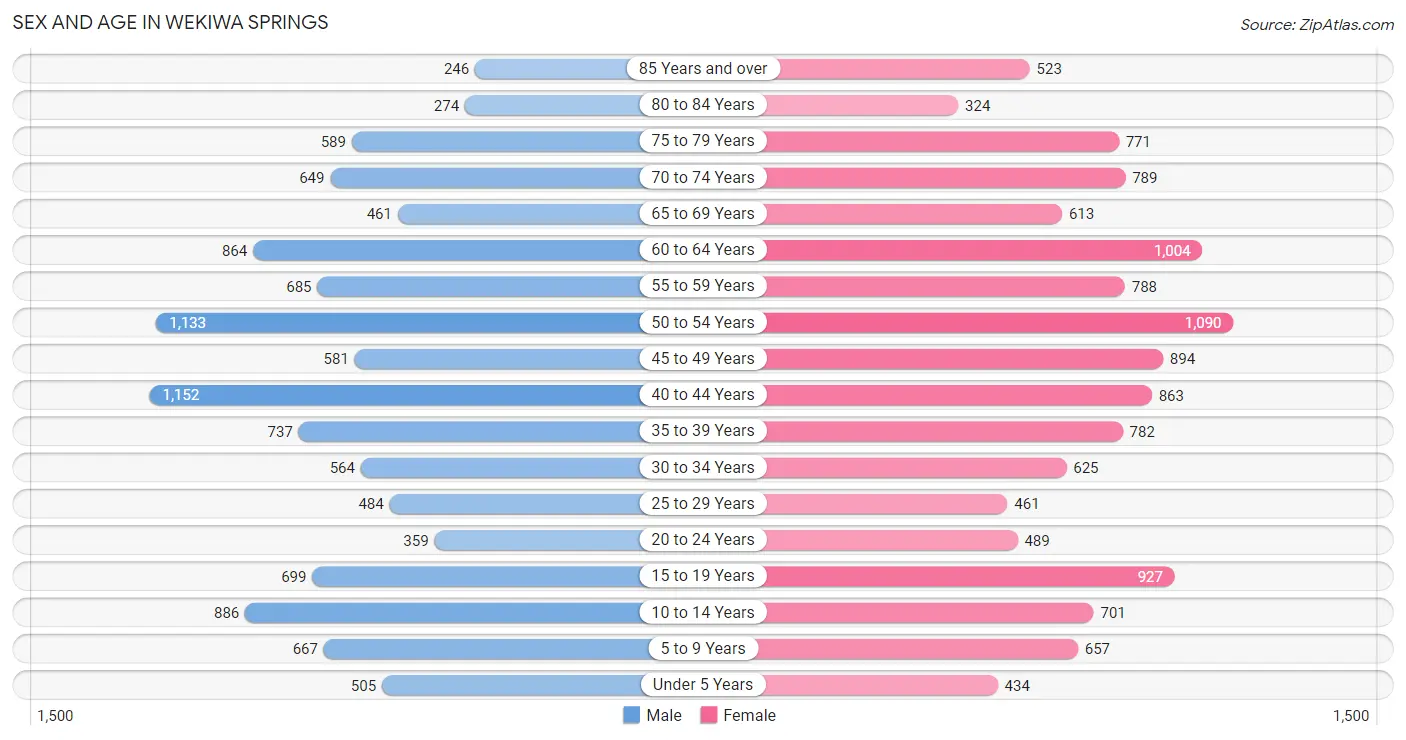
Sex and Age in Wekiwa Springs
Sex and Age in Wekiwa Springs
The most populous age groups in Wekiwa Springs are 40 to 44 Years (1,152 | 10.0%) for men and 50 to 54 Years (1,090 | 8.6%) for women.
| Age Bracket | Male | Female |
| Under 5 Years | 505 (4.4%) | 434 (3.4%) |
| 5 to 9 Years | 667 (5.8%) | 657 (5.2%) |
| 10 to 14 Years | 886 (7.7%) | 701 (5.5%) |
| 15 to 19 Years | 699 (6.1%) | 927 (7.3%) |
| 20 to 24 Years | 359 (3.1%) | 489 (3.8%) |
| 25 to 29 Years | 484 (4.2%) | 461 (3.6%) |
| 30 to 34 Years | 564 (4.9%) | 625 (4.9%) |
| 35 to 39 Years | 737 (6.4%) | 782 (6.1%) |
| 40 to 44 Years | 1,152 (10.0%) | 863 (6.8%) |
| 45 to 49 Years | 581 (5.0%) | 894 (7.0%) |
| 50 to 54 Years | 1,133 (9.8%) | 1,090 (8.6%) |
| 55 to 59 Years | 685 (5.9%) | 788 (6.2%) |
| 60 to 64 Years | 864 (7.5%) | 1,004 (7.9%) |
| 65 to 69 Years | 461 (4.0%) | 613 (4.8%) |
| 70 to 74 Years | 649 (5.6%) | 789 (6.2%) |
| 75 to 79 Years | 589 (5.1%) | 771 (6.0%) |
| 80 to 84 Years | 274 (2.4%) | 324 (2.5%) |
| 85 Years and over | 246 (2.1%) | 523 (4.1%) |
| Total | 11,535 (100.0%) | 12,735 (100.0%) |
Families and Households in Wekiwa Springs
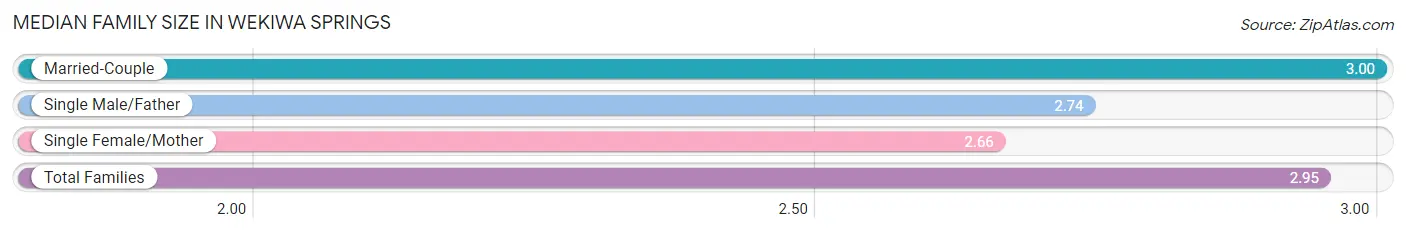
Median Family Size in Wekiwa Springs
The median family size in Wekiwa Springs is 2.95 persons per family, with married-couple families (5,907 | 84.4%) accounting for the largest median family size of 3 persons per family. On the other hand, single female/mother families (696 | 9.9%) represent the smallest median family size with 2.66 persons per family.
| Family Type | # Families | Family Size |
| Married-Couple | 5,907 (84.4%) | 3.00 |
| Single Male/Father | 399 (5.7%) | 2.74 |
| Single Female/Mother | 696 (9.9%) | 2.66 |
| Total Families | 7,002 (100.0%) | 2.95 |
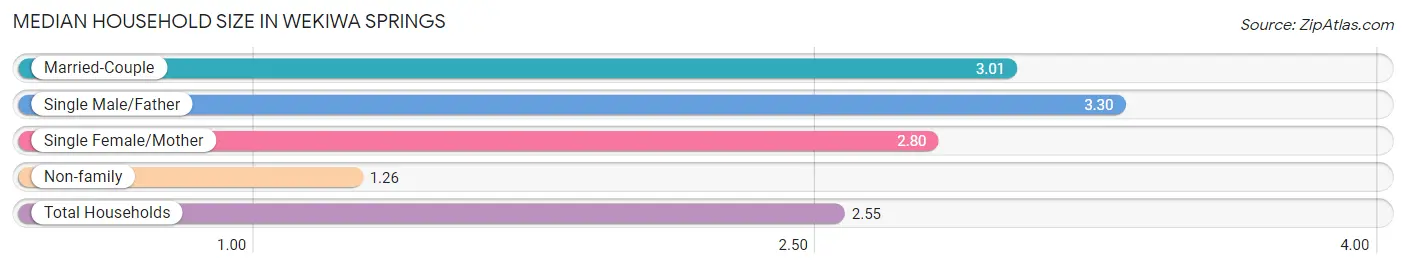
Median Household Size in Wekiwa Springs
The median household size in Wekiwa Springs is 2.55 persons per household, with single male/father households (399 | 4.2%) accounting for the largest median household size of 3.3 persons per household. non-family households (2,470 | 26.1%) represent the smallest median household size with 1.26 persons per household.
| Household Type | # Households | Household Size |
| Married-Couple | 5,907 (62.4%) | 3.01 |
| Single Male/Father | 399 (4.2%) | 3.30 |
| Single Female/Mother | 696 (7.3%) | 2.80 |
| Non-family | 2,470 (26.1%) | 1.26 |
| Total Households | 9,472 (100.0%) | 2.55 |
Household Size by Marriage Status in Wekiwa Springs
Out of a total of 9,472 households in Wekiwa Springs, 7,002 (73.9%) are family households, while 2,470 (26.1%) are nonfamily households. The most numerous type of family households are 2-person households, comprising 3,043, and the most common type of nonfamily households are 1-person households, comprising 1,964.
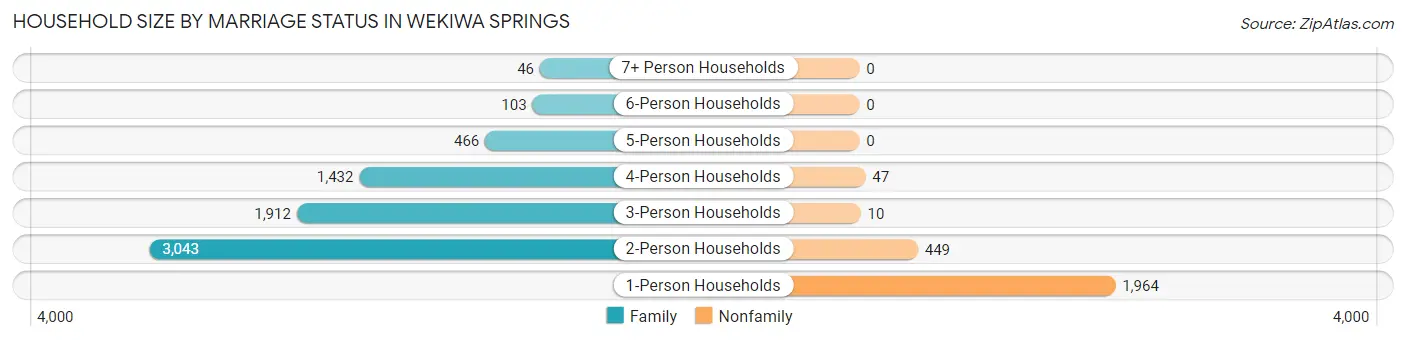
| Household Size | Family Households | Nonfamily Households |
| 1-Person Households | - | 1,964 (20.7%) |
| 2-Person Households | 3,043 (32.1%) | 449 (4.7%) |
| 3-Person Households | 1,912 (20.2%) | 10 (0.1%) |
| 4-Person Households | 1,432 (15.1%) | 47 (0.5%) |
| 5-Person Households | 466 (4.9%) | 0 (0.0%) |
| 6-Person Households | 103 (1.1%) | 0 (0.0%) |
| 7+ Person Households | 46 (0.5%) | 0 (0.0%) |
| Total | 7,002 (73.9%) | 2,470 (26.1%) |
Female Fertility in Wekiwa Springs
Fertility by Age in Wekiwa Springs
Average fertility rate in Wekiwa Springs is 28.0 births per 1,000 women. Women in the age bracket of 20 to 34 years have the highest fertility rate with 57.0 births per 1,000 women. Women in the age bracket of 20 to 34 years acount for 61.4% of all women with births.
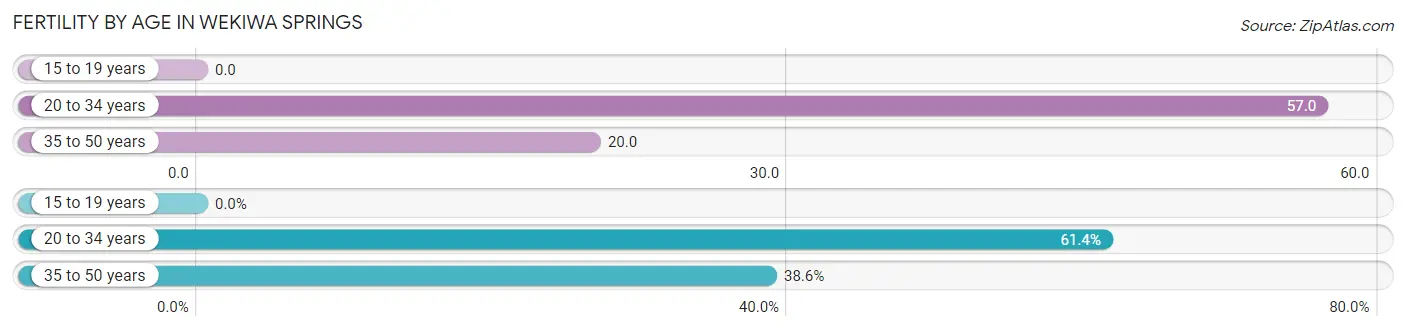
| Age Bracket | Women with Births | Births / 1,000 Women |
| 15 to 19 years | 0 (0.0%) | 0.0 |
| 20 to 34 years | 89 (61.4%) | 57.0 |
| 35 to 50 years | 56 (38.6%) | 20.0 |
| Total | 145 (100.0%) | 28.0 |
Fertility by Age by Marriage Status in Wekiwa Springs
84.1% of women with births (145) in Wekiwa Springs are married. The highest percentage of unmarried women with births falls into 20 to 34 years age bracket with 25.8% of them unmarried at the time of birth, while the lowest percentage of unmarried women with births belong to 35 to 50 years age bracket with 0.0% of them unmarried.
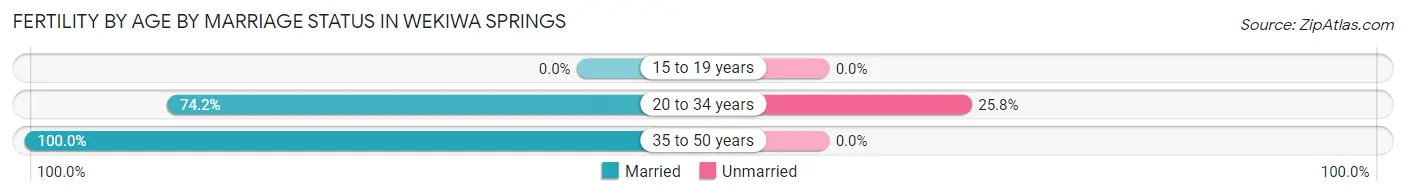
| Age Bracket | Married | Unmarried |
| 15 to 19 years | 0 (0.0%) | 0 (0.0%) |
| 20 to 34 years | 66 (74.2%) | 23 (25.8%) |
| 35 to 50 years | 56 (100.0%) | 0 (0.0%) |
| Total | 122 (84.1%) | 23 (15.9%) |
Fertility by Education in Wekiwa Springs
Average fertility rate in Wekiwa Springs is 28.0 births per 1,000 women. Women with the education attainment of graduate degree have the highest fertility rate of 129.0 births per 1,000 women, while women with the education attainment of high school diploma have the lowest fertility at 9.0 births per 1,000 women. Women with the education attainment of graduate degree represent 53.1% of all women with births.
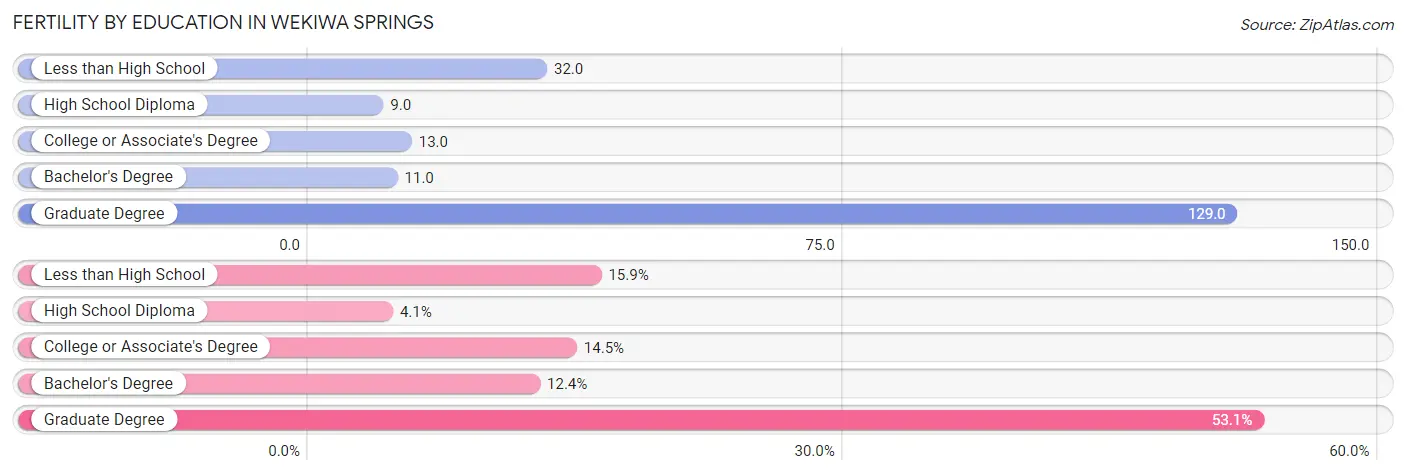
| Educational Attainment | Women with Births | Births / 1,000 Women |
| Less than High School | 23 (15.9%) | 32.0 |
| High School Diploma | 6 (4.1%) | 9.0 |
| College or Associate's Degree | 21 (14.5%) | 13.0 |
| Bachelor's Degree | 18 (12.4%) | 11.0 |
| Graduate Degree | 77 (53.1%) | 129.0 |
| Total | 145 (100.0%) | 28.0 |
Fertility by Education by Marriage Status in Wekiwa Springs
15.9% of women with births in Wekiwa Springs are unmarried. Women with the educational attainment of high school diploma are most likely to be married with 100.0% of them married at childbirth, while women with the educational attainment of less than high school are least likely to be married with 100.0% of them unmarried at childbirth.
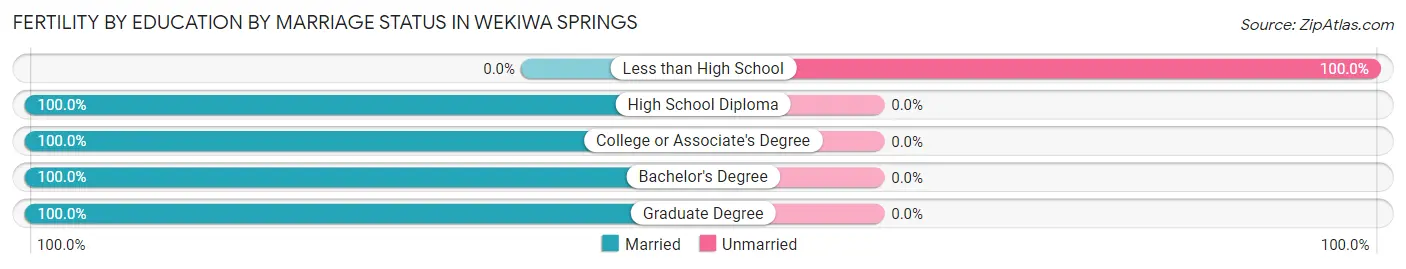
| Educational Attainment | Married | Unmarried |
| Less than High School | 0 (0.0%) | 23 (100.0%) |
| High School Diploma | 6 (100.0%) | 0 (0.0%) |
| College or Associate's Degree | 21 (100.0%) | 0 (0.0%) |
| Bachelor's Degree | 18 (100.0%) | 0 (0.0%) |
| Graduate Degree | 77 (100.0%) | 0 (0.0%) |
| Total | 122 (84.1%) | 23 (15.9%) |
Employment Characteristics in Wekiwa Springs
Employment by Class of Employer in Wekiwa Springs
Among the 12,155 employed individuals in Wekiwa Springs, private company employees (8,450 | 69.5%), not-for-profit organizations (1,188 | 9.8%), and self-employed (incorporated) (818 | 6.7%) make up the most common classes of employment.
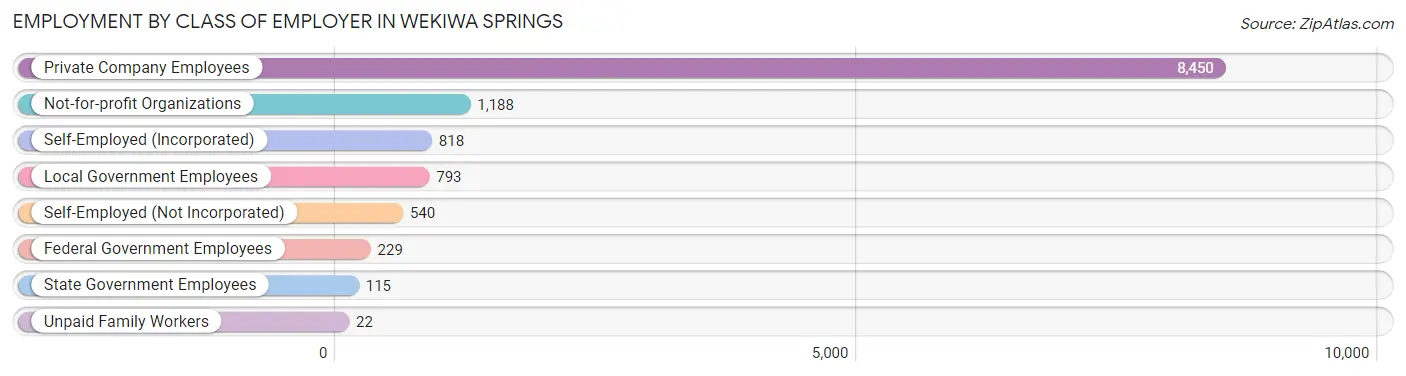
| Employer Class | # Employees | % Employees |
| Private Company Employees | 8,450 | 69.5% |
| Self-Employed (Incorporated) | 818 | 6.7% |
| Self-Employed (Not Incorporated) | 540 | 4.4% |
| Not-for-profit Organizations | 1,188 | 9.8% |
| Local Government Employees | 793 | 6.5% |
| State Government Employees | 115 | 0.9% |
| Federal Government Employees | 229 | 1.9% |
| Unpaid Family Workers | 22 | 0.2% |
| Total | 12,155 | 100.0% |
Employment Status by Age in Wekiwa Springs
According to the labor force statistics for Wekiwa Springs, out of the total population over 16 years of age (20,145), 63.4% or 12,772 individuals are in the labor force, with 4.1% or 524 of them unemployed. The age group with the highest labor force participation rate is 25 to 29 years, with 87.3% or 825 individuals in the labor force. Within the labor force, the 16 to 19 years age range has the highest percentage of unemployed individuals, with 22.8% or 158 of them being unemployed.
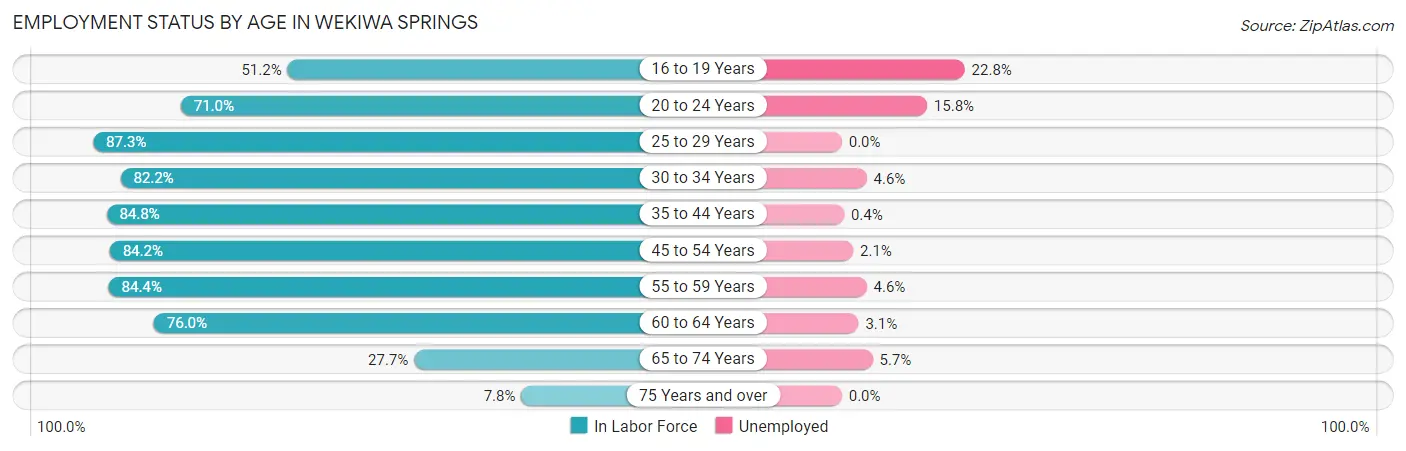
| Age Bracket | In Labor Force | Unemployed |
| 16 to 19 Years | 692 (51.2%) | 158 (22.8%) |
| 20 to 24 Years | 602 (71.0%) | 95 (15.8%) |
| 25 to 29 Years | 825 (87.3%) | 0 (0.0%) |
| 30 to 34 Years | 977 (82.2%) | 45 (4.6%) |
| 35 to 44 Years | 2,997 (84.8%) | 12 (0.4%) |
| 45 to 54 Years | 3,114 (84.2%) | 65 (2.1%) |
| 55 to 59 Years | 1,243 (84.4%) | 57 (4.6%) |
| 60 to 64 Years | 1,420 (76.0%) | 44 (3.1%) |
| 65 to 74 Years | 696 (27.7%) | 40 (5.7%) |
| 75 Years and over | 213 (7.8%) | 0 (0.0%) |
| Total | 12,772 (63.4%) | 524 (4.1%) |
Employment Status by Educational Attainment in Wekiwa Springs
According to labor force statistics for Wekiwa Springs, 83.2% of individuals (10,572) out of the total population between 25 and 64 years of age (12,707) are in the labor force, with 2.1% or 222 of them being unemployed. The group with the highest labor force participation rate are those with the educational attainment of bachelor's degree or higher, with 86.7% or 6,020 individuals in the labor force. Within the labor force, individuals with less than high school education have the highest percentage of unemployment, with 7.9% or 19 of them being unemployed.
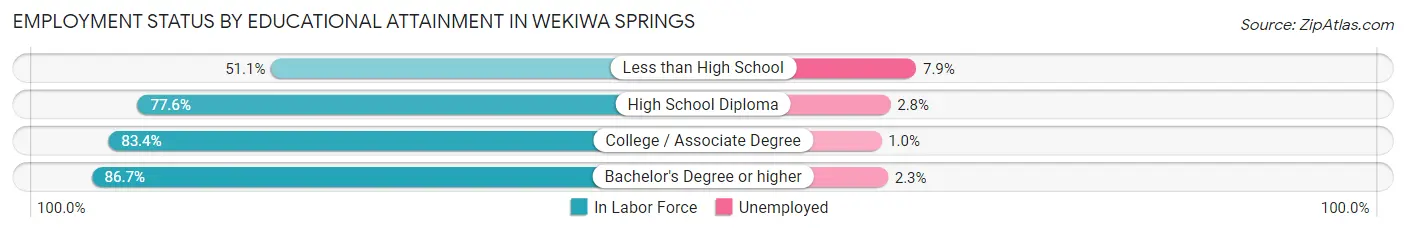
| Educational Attainment | In Labor Force | Unemployed |
| Less than High School | 240 (51.1%) | 37 (7.9%) |
| High School Diploma | 1,332 (77.6%) | 48 (2.8%) |
| College / Associate Degree | 2,982 (83.4%) | 36 (1.0%) |
| Bachelor's Degree or higher | 6,020 (86.7%) | 160 (2.3%) |
| Total | 10,572 (83.2%) | 267 (2.1%) |
Employment Occupations by Sex in Wekiwa Springs
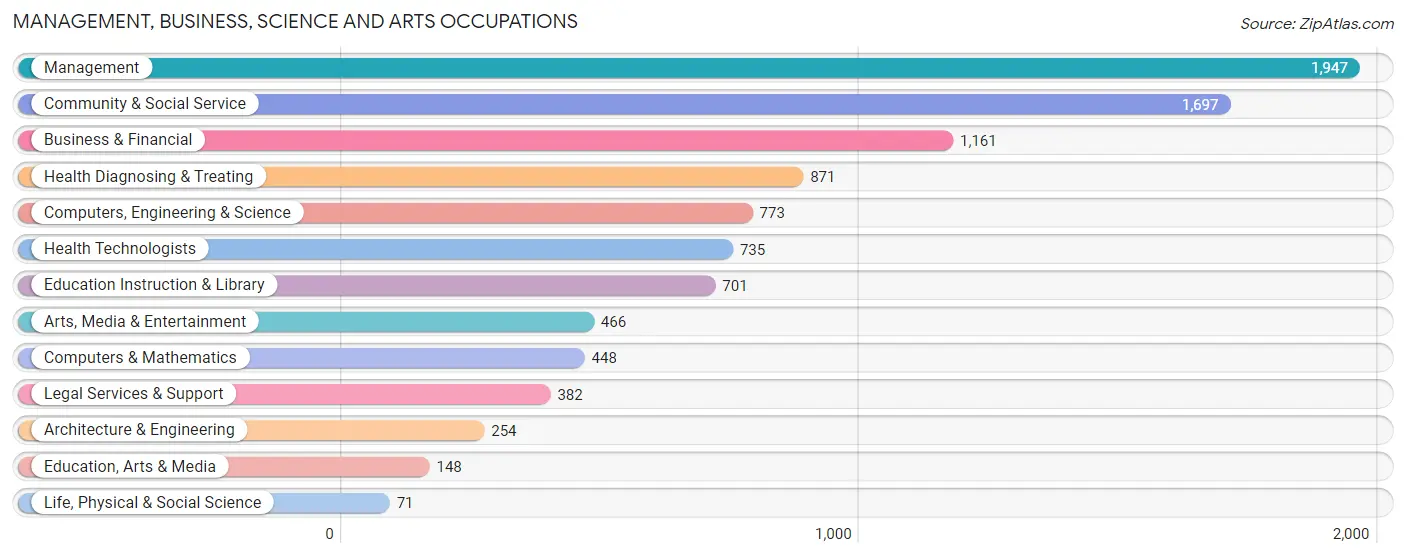
Management, Business, Science and Arts Occupations
The most common Management, Business, Science and Arts occupations in Wekiwa Springs are Management (1,947 | 15.9%), Community & Social Service (1,697 | 13.9%), Business & Financial (1,161 | 9.5%), Health Diagnosing & Treating (871 | 7.1%), and Computers, Engineering & Science (773 | 6.3%).
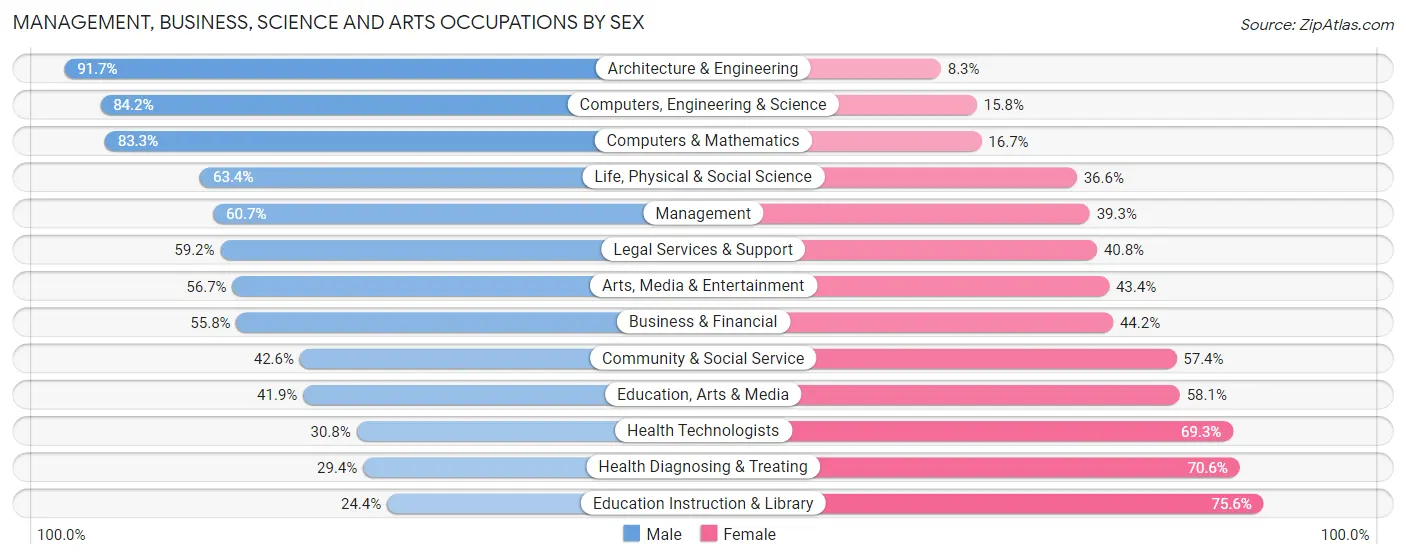
Management, Business, Science and Arts Occupations by Sex
Within the Management, Business, Science and Arts occupations in Wekiwa Springs, the most male-oriented occupations are Architecture & Engineering (91.7%), Computers, Engineering & Science (84.2%), and Computers & Mathematics (83.3%), while the most female-oriented occupations are Education Instruction & Library (75.6%), Health Diagnosing & Treating (70.6%), and Health Technologists (69.3%).
| Occupation | Male | Female |
| Management | 1,181 (60.7%) | 766 (39.3%) |
| Business & Financial | 648 (55.8%) | 513 (44.2%) |
| Computers, Engineering & Science | 651 (84.2%) | 122 (15.8%) |
| Computers & Mathematics | 373 (83.3%) | 75 (16.7%) |
| Architecture & Engineering | 233 (91.7%) | 21 (8.3%) |
| Life, Physical & Social Science | 45 (63.4%) | 26 (36.6%) |
| Community & Social Service | 723 (42.6%) | 974 (57.4%) |
| Education, Arts & Media | 62 (41.9%) | 86 (58.1%) |
| Legal Services & Support | 226 (59.2%) | 156 (40.8%) |
| Education Instruction & Library | 171 (24.4%) | 530 (75.6%) |
| Arts, Media & Entertainment | 264 (56.7%) | 202 (43.3%) |
| Health Diagnosing & Treating | 256 (29.4%) | 615 (70.6%) |
| Health Technologists | 226 (30.7%) | 509 (69.3%) |
| Total (Category) | 3,459 (53.6%) | 2,990 (46.4%) |
| Total (Overall) | 6,322 (51.7%) | 5,909 (48.3%) |
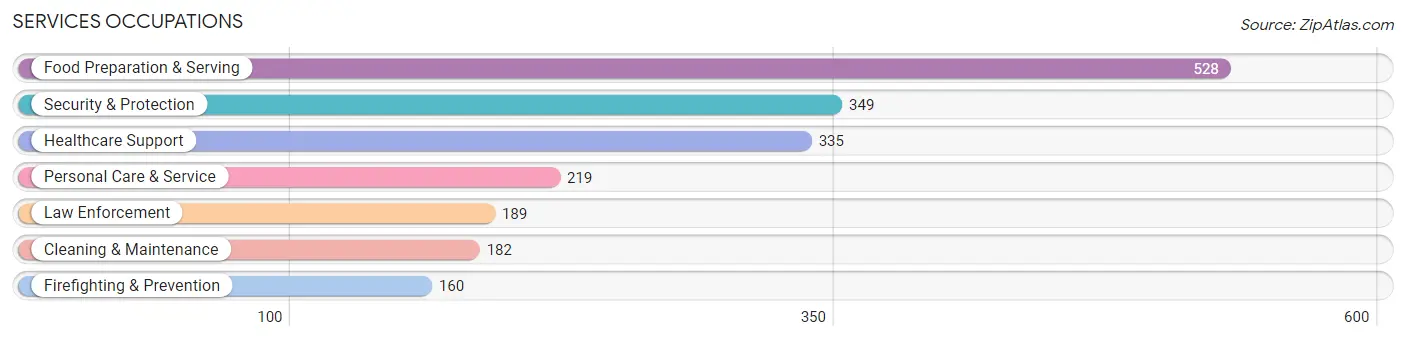
Services Occupations
The most common Services occupations in Wekiwa Springs are Food Preparation & Serving (528 | 4.3%), Security & Protection (349 | 2.9%), Healthcare Support (335 | 2.7%), Personal Care & Service (219 | 1.8%), and Law Enforcement (189 | 1.5%).
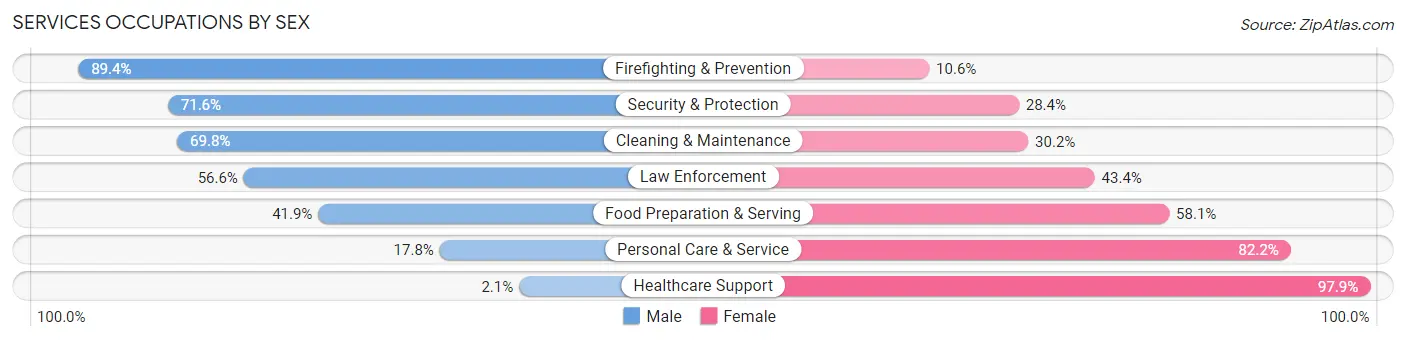
Services Occupations by Sex
Within the Services occupations in Wekiwa Springs, the most male-oriented occupations are Firefighting & Prevention (89.4%), Security & Protection (71.6%), and Cleaning & Maintenance (69.8%), while the most female-oriented occupations are Healthcare Support (97.9%), Personal Care & Service (82.2%), and Food Preparation & Serving (58.1%).
| Occupation | Male | Female |
| Healthcare Support | 7 (2.1%) | 328 (97.9%) |
| Security & Protection | 250 (71.6%) | 99 (28.4%) |
| Firefighting & Prevention | 143 (89.4%) | 17 (10.6%) |
| Law Enforcement | 107 (56.6%) | 82 (43.4%) |
| Food Preparation & Serving | 221 (41.9%) | 307 (58.1%) |
| Cleaning & Maintenance | 127 (69.8%) | 55 (30.2%) |
| Personal Care & Service | 39 (17.8%) | 180 (82.2%) |
| Total (Category) | 644 (39.9%) | 969 (60.1%) |
| Total (Overall) | 6,322 (51.7%) | 5,909 (48.3%) |
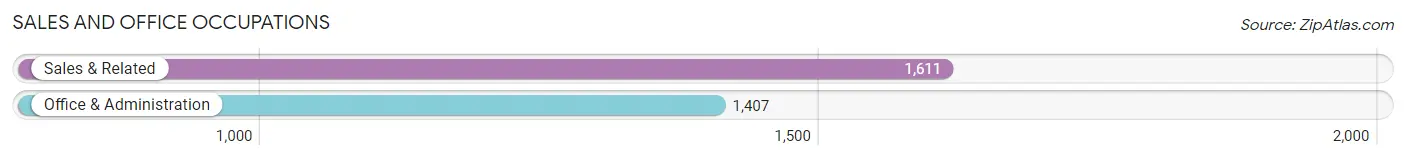
Sales and Office Occupations
The most common Sales and Office occupations in Wekiwa Springs are Sales & Related (1,611 | 13.2%), and Office & Administration (1,407 | 11.5%).
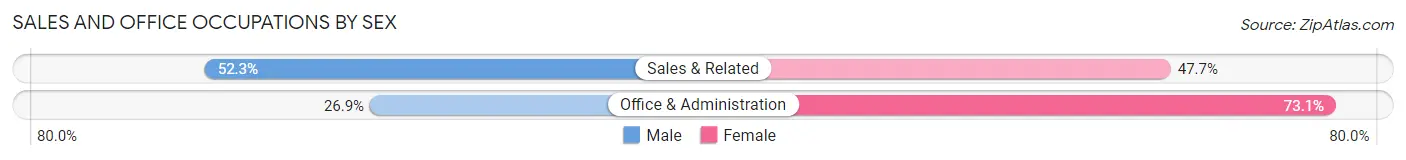
Sales and Office Occupations by Sex
| Occupation | Male | Female |
| Sales & Related | 842 (52.3%) | 769 (47.7%) |
| Office & Administration | 378 (26.9%) | 1,029 (73.1%) |
| Total (Category) | 1,220 (40.4%) | 1,798 (59.6%) |
| Total (Overall) | 6,322 (51.7%) | 5,909 (48.3%) |
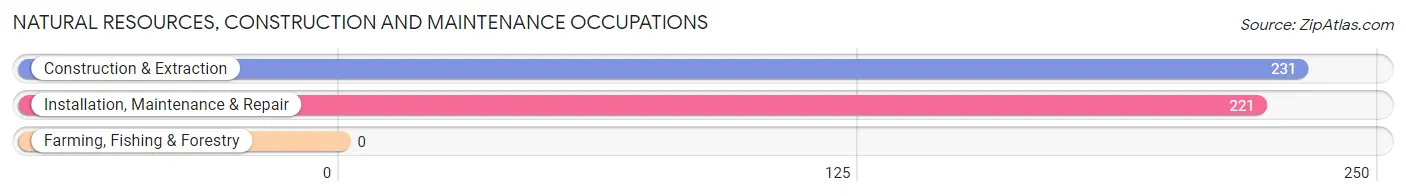
Natural Resources, Construction and Maintenance Occupations
The most common Natural Resources, Construction and Maintenance occupations in Wekiwa Springs are Construction & Extraction (231 | 1.9%), and Installation, Maintenance & Repair (221 | 1.8%).
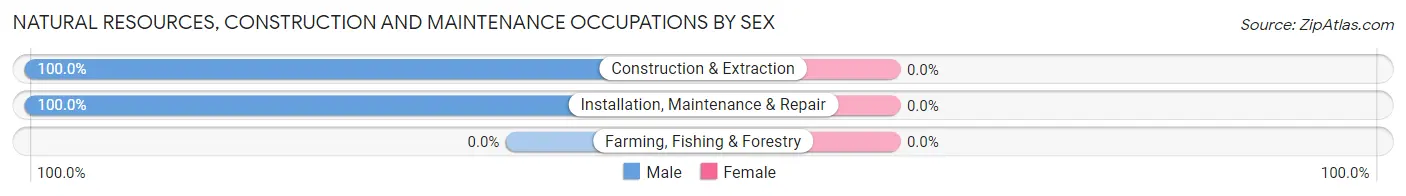
Natural Resources, Construction and Maintenance Occupations by Sex
| Occupation | Male | Female |
| Farming, Fishing & Forestry | 0 (0.0%) | 0 (0.0%) |
| Construction & Extraction | 231 (100.0%) | 0 (0.0%) |
| Installation, Maintenance & Repair | 221 (100.0%) | 0 (0.0%) |
| Total (Category) | 452 (100.0%) | 0 (0.0%) |
| Total (Overall) | 6,322 (51.7%) | 5,909 (48.3%) |
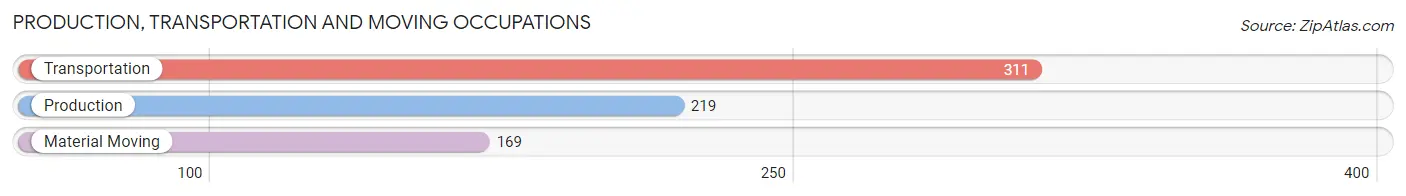
Production, Transportation and Moving Occupations
The most common Production, Transportation and Moving occupations in Wekiwa Springs are Transportation (311 | 2.5%), Production (219 | 1.8%), and Material Moving (169 | 1.4%).
Production, Transportation and Moving Occupations by Sex
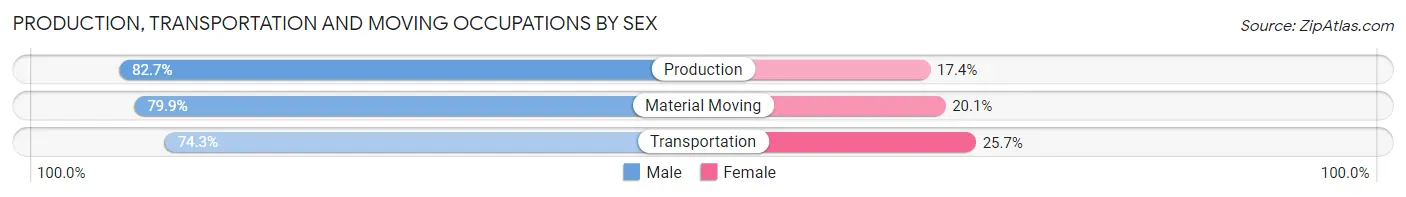
| Occupation | Male | Female |
| Production | 181 (82.7%) | 38 (17.3%) |
| Transportation | 231 (74.3%) | 80 (25.7%) |
| Material Moving | 135 (79.9%) | 34 (20.1%) |
| Total (Category) | 547 (78.2%) | 152 (21.7%) |
| Total (Overall) | 6,322 (51.7%) | 5,909 (48.3%) |
Employment Industries by Sex in Wekiwa Springs
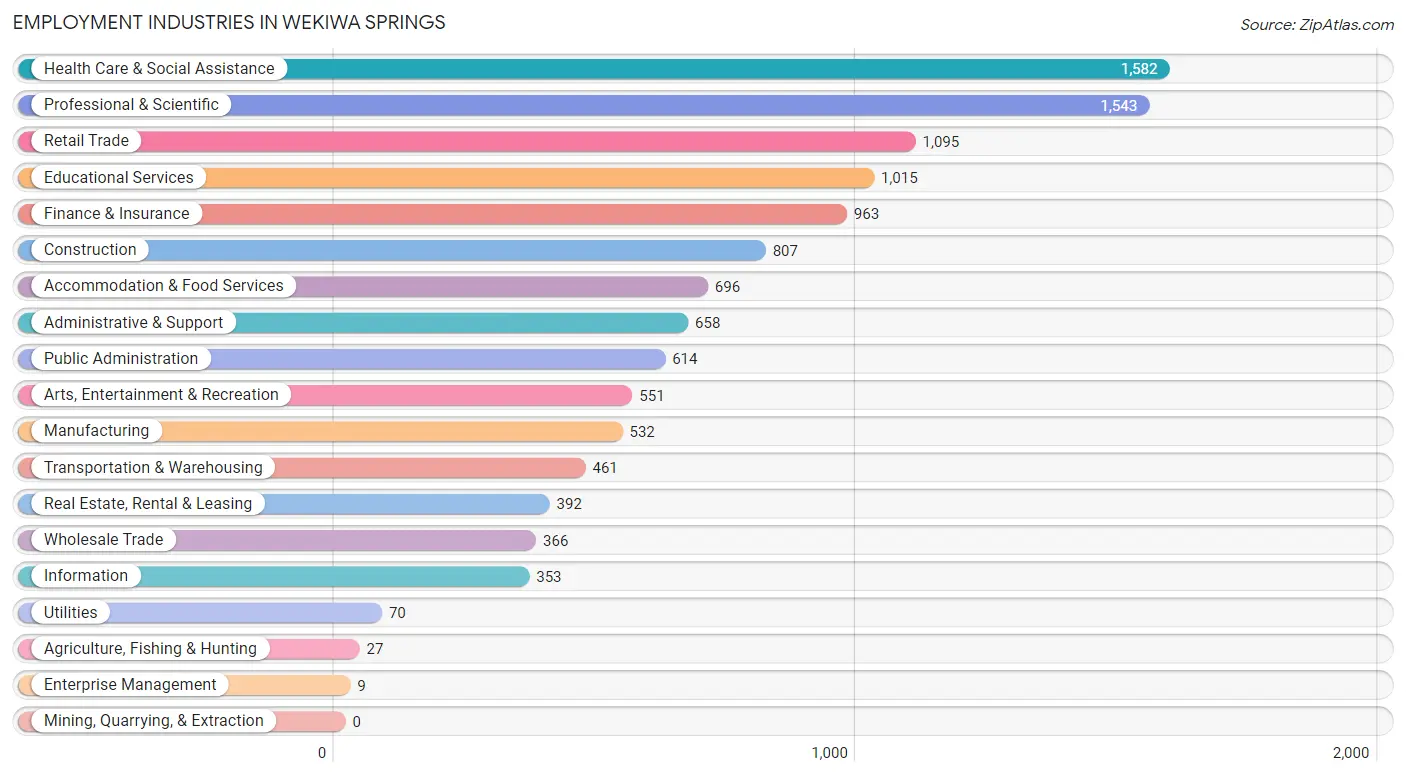
Employment Industries in Wekiwa Springs
The major employment industries in Wekiwa Springs include Health Care & Social Assistance (1,582 | 12.9%), Professional & Scientific (1,543 | 12.6%), Retail Trade (1,095 | 8.9%), Educational Services (1,015 | 8.3%), and Finance & Insurance (963 | 7.9%).
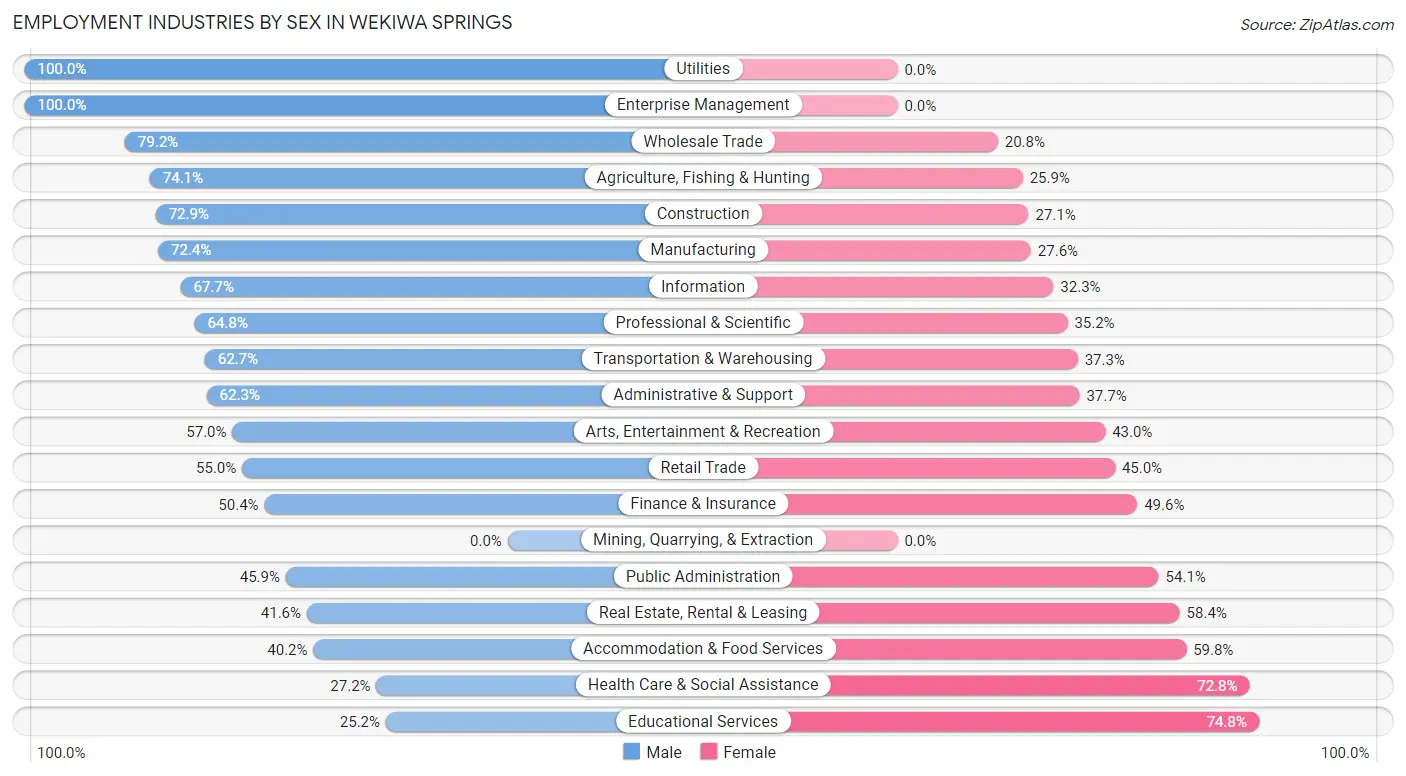
Employment Industries by Sex in Wekiwa Springs
The Wekiwa Springs industries that see more men than women are Utilities (100.0%), Enterprise Management (100.0%), and Wholesale Trade (79.2%), whereas the industries that tend to have a higher number of women are Educational Services (74.8%), Health Care & Social Assistance (72.8%), and Accommodation & Food Services (59.8%).
| Industry | Male | Female |
| Agriculture, Fishing & Hunting | 20 (74.1%) | 7 (25.9%) |
| Mining, Quarrying, & Extraction | 0 (0.0%) | 0 (0.0%) |
| Construction | 588 (72.9%) | 219 (27.1%) |
| Manufacturing | 385 (72.4%) | 147 (27.6%) |
| Wholesale Trade | 290 (79.2%) | 76 (20.8%) |
| Retail Trade | 602 (55.0%) | 493 (45.0%) |
| Transportation & Warehousing | 289 (62.7%) | 172 (37.3%) |
| Utilities | 70 (100.0%) | 0 (0.0%) |
| Information | 239 (67.7%) | 114 (32.3%) |
| Finance & Insurance | 485 (50.4%) | 478 (49.6%) |
| Real Estate, Rental & Leasing | 163 (41.6%) | 229 (58.4%) |
| Professional & Scientific | 1,000 (64.8%) | 543 (35.2%) |
| Enterprise Management | 9 (100.0%) | 0 (0.0%) |
| Administrative & Support | 410 (62.3%) | 248 (37.7%) |
| Educational Services | 256 (25.2%) | 759 (74.8%) |
| Health Care & Social Assistance | 430 (27.2%) | 1,152 (72.8%) |
| Arts, Entertainment & Recreation | 314 (57.0%) | 237 (43.0%) |
| Accommodation & Food Services | 280 (40.2%) | 416 (59.8%) |
| Public Administration | 282 (45.9%) | 332 (54.1%) |
| Total | 6,322 (51.7%) | 5,909 (48.3%) |
Education in Wekiwa Springs
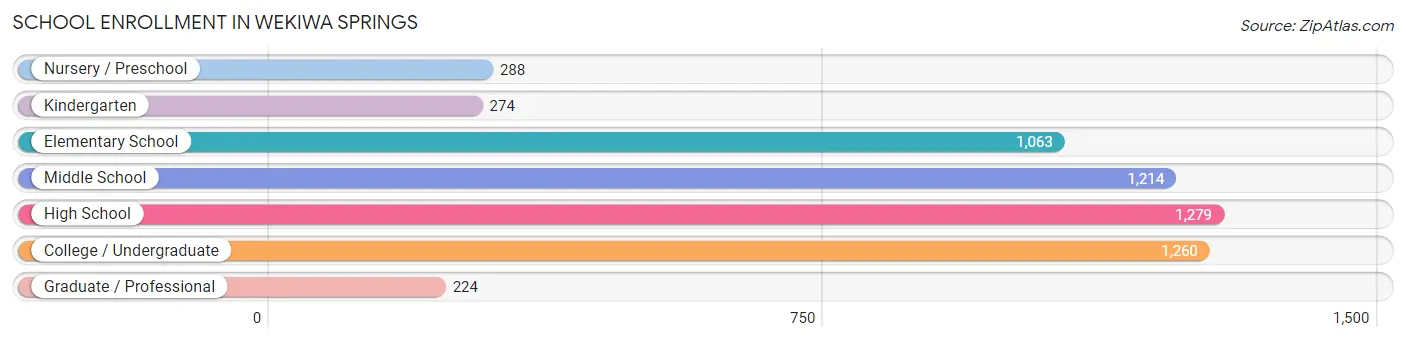
School Enrollment in Wekiwa Springs
The most common levels of schooling among the 5,602 students in Wekiwa Springs are high school (1,279 | 22.8%), college / undergraduate (1,260 | 22.5%), and middle school (1,214 | 21.7%).
| School Level | # Students | % Students |
| Nursery / Preschool | 288 | 5.1% |
| Kindergarten | 274 | 4.9% |
| Elementary School | 1,063 | 19.0% |
| Middle School | 1,214 | 21.7% |
| High School | 1,279 | 22.8% |
| College / Undergraduate | 1,260 | 22.5% |
| Graduate / Professional | 224 | 4.0% |
| Total | 5,602 | 100.0% |
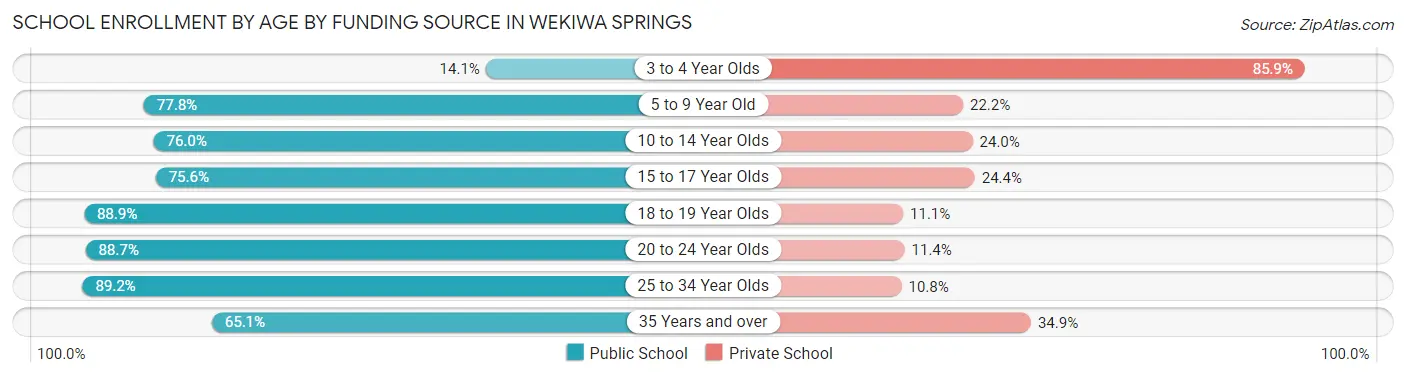
School Enrollment by Age by Funding Source in Wekiwa Springs
Out of a total of 5,602 students who are enrolled in schools in Wekiwa Springs, 1,389 (24.8%) attend a private institution, while the remaining 4,213 (75.2%) are enrolled in public schools. The age group of 3 to 4 year olds has the highest likelihood of being enrolled in private schools, with 225 (85.9% in the age bracket) enrolled. Conversely, the age group of 25 to 34 year olds has the lowest likelihood of being enrolled in a private school, with 207 (89.2% in the age bracket) attending a public institution.
| Age Bracket | Public School | Private School |
| 3 to 4 Year Olds | 37 (14.1%) | 225 (85.9%) |
| 5 to 9 Year Old | 927 (77.8%) | 265 (22.2%) |
| 10 to 14 Year Olds | 1,177 (76.0%) | 372 (24.0%) |
| 15 to 17 Year Olds | 764 (75.6%) | 247 (24.4%) |
| 18 to 19 Year Olds | 458 (88.9%) | 57 (11.1%) |
| 20 to 24 Year Olds | 367 (88.6%) | 47 (11.4%) |
| 25 to 34 Year Olds | 207 (89.2%) | 25 (10.8%) |
| 35 Years and over | 278 (65.1%) | 149 (34.9%) |
| Total | 4,213 (75.2%) | 1,389 (24.8%) |
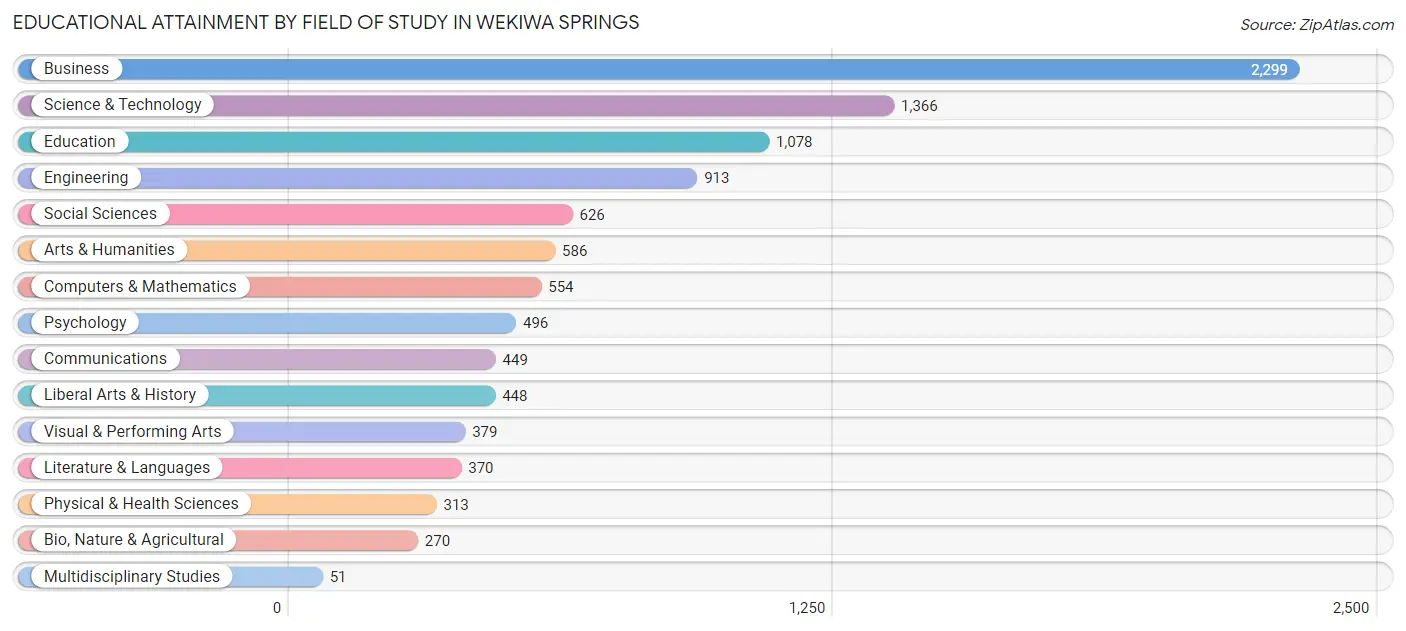
Educational Attainment by Field of Study in Wekiwa Springs
Business (2,299 | 22.5%), science & technology (1,366 | 13.4%), education (1,078 | 10.6%), engineering (913 | 8.9%), and social sciences (626 | 6.1%) are the most common fields of study among 10,198 individuals in Wekiwa Springs who have obtained a bachelor's degree or higher.
| Field of Study | # Graduates | % Graduates |
| Computers & Mathematics | 554 | 5.4% |
| Bio, Nature & Agricultural | 270 | 2.6% |
| Physical & Health Sciences | 313 | 3.1% |
| Psychology | 496 | 4.9% |
| Social Sciences | 626 | 6.1% |
| Engineering | 913 | 8.9% |
| Multidisciplinary Studies | 51 | 0.5% |
| Science & Technology | 1,366 | 13.4% |
| Business | 2,299 | 22.5% |
| Education | 1,078 | 10.6% |
| Literature & Languages | 370 | 3.6% |
| Liberal Arts & History | 448 | 4.4% |
| Visual & Performing Arts | 379 | 3.7% |
| Communications | 449 | 4.4% |
| Arts & Humanities | 586 | 5.8% |
| Total | 10,198 | 100.0% |
Transportation & Commute in Wekiwa Springs
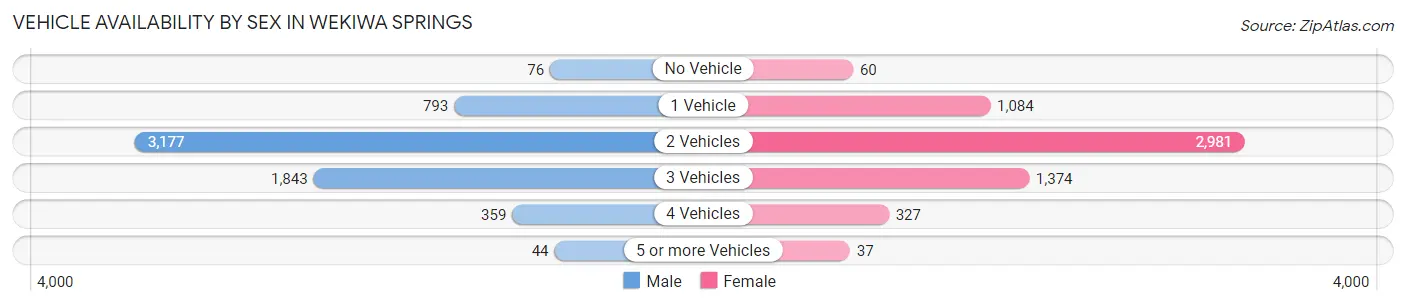
Vehicle Availability by Sex in Wekiwa Springs
The most prevalent vehicle ownership categories in Wekiwa Springs are males with 2 vehicles (3,177, accounting for 50.5%) and females with 2 vehicles (2,981, making up 54.2%).
| Vehicles Available | Male | Female |
| No Vehicle | 76 (1.2%) | 60 (1.0%) |
| 1 Vehicle | 793 (12.6%) | 1,084 (18.5%) |
| 2 Vehicles | 3,177 (50.5%) | 2,981 (50.8%) |
| 3 Vehicles | 1,843 (29.3%) | 1,374 (23.4%) |
| 4 Vehicles | 359 (5.7%) | 327 (5.6%) |
| 5 or more Vehicles | 44 (0.7%) | 37 (0.6%) |
| Total | 6,292 (100.0%) | 5,863 (100.0%) |
Commute Time in Wekiwa Springs
The most frequently occuring commute durations in Wekiwa Springs are 20 to 24 minutes (1,916 commuters, 19.8%), 30 to 34 minutes (1,723 commuters, 17.8%), and 15 to 19 minutes (1,292 commuters, 13.3%).
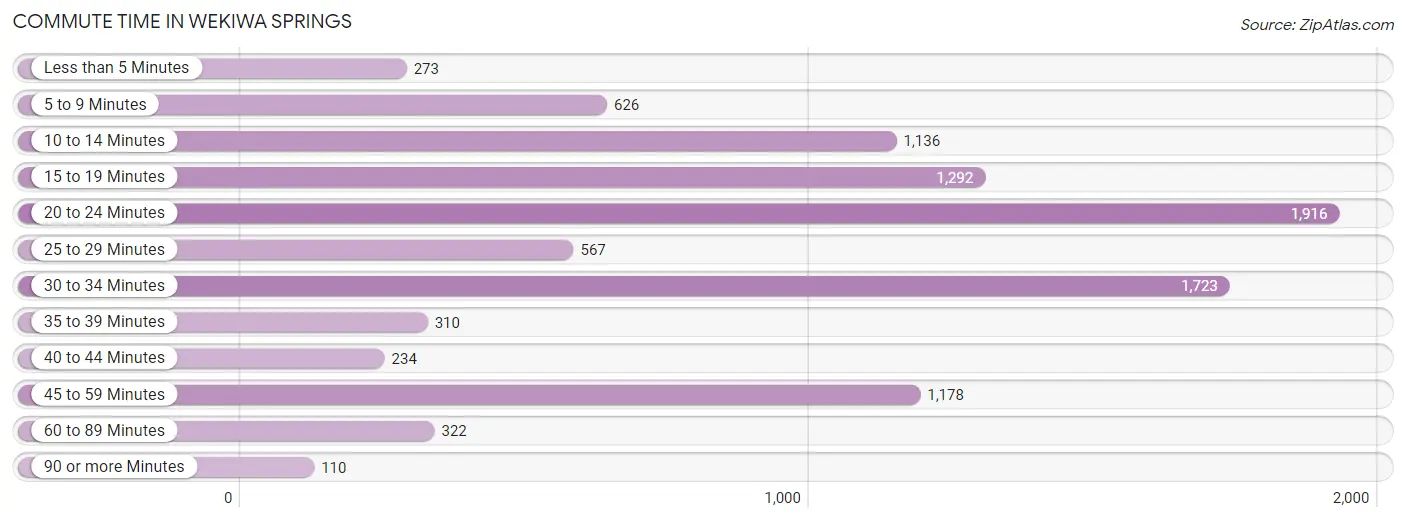
| Commute Time | # Commuters | % Commuters |
| Less than 5 Minutes | 273 | 2.8% |
| 5 to 9 Minutes | 626 | 6.5% |
| 10 to 14 Minutes | 1,136 | 11.7% |
| 15 to 19 Minutes | 1,292 | 13.3% |
| 20 to 24 Minutes | 1,916 | 19.8% |
| 25 to 29 Minutes | 567 | 5.9% |
| 30 to 34 Minutes | 1,723 | 17.8% |
| 35 to 39 Minutes | 310 | 3.2% |
| 40 to 44 Minutes | 234 | 2.4% |
| 45 to 59 Minutes | 1,178 | 12.2% |
| 60 to 89 Minutes | 322 | 3.3% |
| 90 or more Minutes | 110 | 1.1% |
Commute Time by Sex in Wekiwa Springs
The most common commute times in Wekiwa Springs are 20 to 24 minutes (1,135 commuters, 22.8%) for males and 30 to 34 minutes (913 commuters, 19.4%) for females.
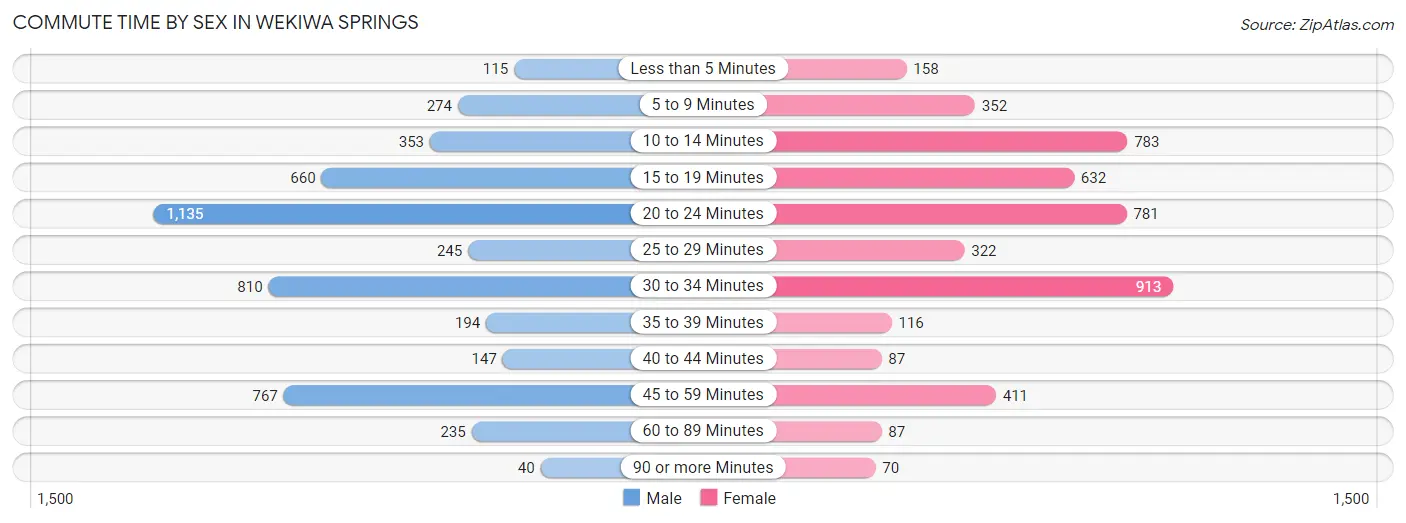
| Commute Time | Male | Female |
| Less than 5 Minutes | 115 (2.3%) | 158 (3.4%) |
| 5 to 9 Minutes | 274 (5.5%) | 352 (7.5%) |
| 10 to 14 Minutes | 353 (7.1%) | 783 (16.6%) |
| 15 to 19 Minutes | 660 (13.3%) | 632 (13.4%) |
| 20 to 24 Minutes | 1,135 (22.8%) | 781 (16.6%) |
| 25 to 29 Minutes | 245 (4.9%) | 322 (6.8%) |
| 30 to 34 Minutes | 810 (16.3%) | 913 (19.4%) |
| 35 to 39 Minutes | 194 (3.9%) | 116 (2.5%) |
| 40 to 44 Minutes | 147 (2.9%) | 87 (1.8%) |
| 45 to 59 Minutes | 767 (15.4%) | 411 (8.7%) |
| 60 to 89 Minutes | 235 (4.7%) | 87 (1.8%) |
| 90 or more Minutes | 40 (0.8%) | 70 (1.5%) |
Time of Departure to Work by Sex in Wekiwa Springs
The most frequent times of departure to work in Wekiwa Springs are 8:00 AM to 8:29 AM (755, 15.2%) for males and 7:30 AM to 7:59 AM (799, 17.0%) for females.
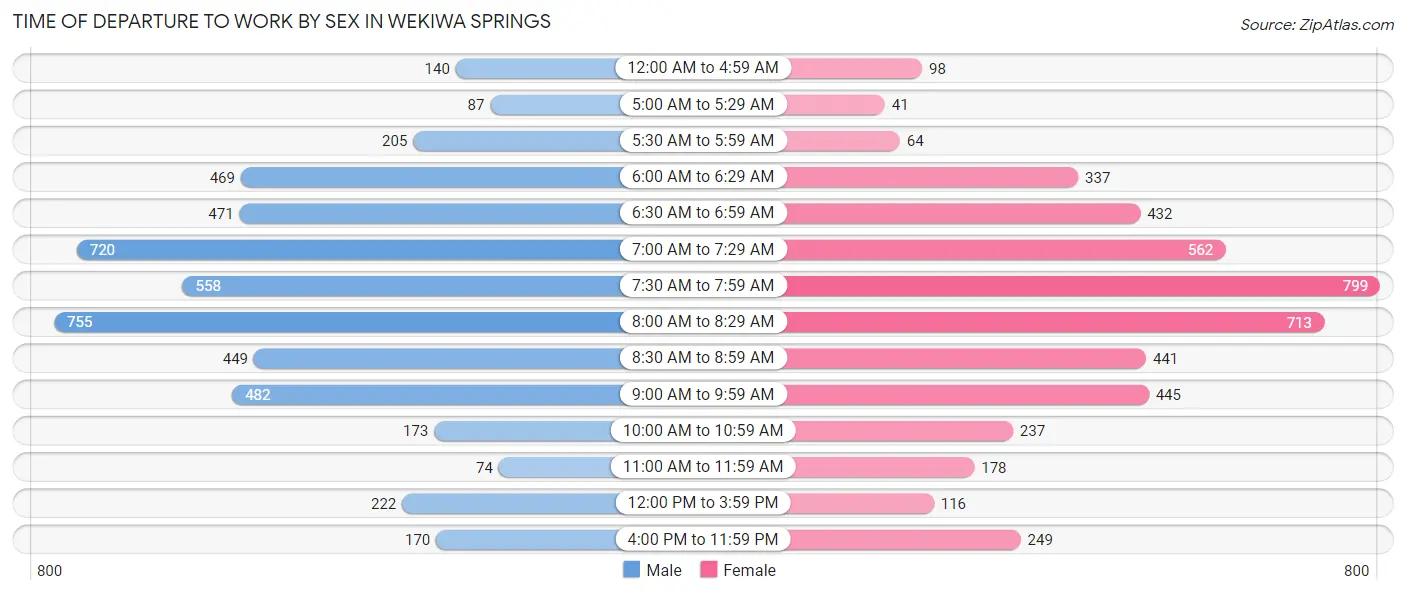
| Time of Departure | Male | Female |
| 12:00 AM to 4:59 AM | 140 (2.8%) | 98 (2.1%) |
| 5:00 AM to 5:29 AM | 87 (1.8%) | 41 (0.9%) |
| 5:30 AM to 5:59 AM | 205 (4.1%) | 64 (1.4%) |
| 6:00 AM to 6:29 AM | 469 (9.4%) | 337 (7.1%) |
| 6:30 AM to 6:59 AM | 471 (9.5%) | 432 (9.2%) |
| 7:00 AM to 7:29 AM | 720 (14.5%) | 562 (11.9%) |
| 7:30 AM to 7:59 AM | 558 (11.2%) | 799 (17.0%) |
| 8:00 AM to 8:29 AM | 755 (15.2%) | 713 (15.1%) |
| 8:30 AM to 8:59 AM | 449 (9.0%) | 441 (9.4%) |
| 9:00 AM to 9:59 AM | 482 (9.7%) | 445 (9.4%) |
| 10:00 AM to 10:59 AM | 173 (3.5%) | 237 (5.0%) |
| 11:00 AM to 11:59 AM | 74 (1.5%) | 178 (3.8%) |
| 12:00 PM to 3:59 PM | 222 (4.5%) | 116 (2.5%) |
| 4:00 PM to 11:59 PM | 170 (3.4%) | 249 (5.3%) |
| Total | 4,975 (100.0%) | 4,712 (100.0%) |
Housing Occupancy in Wekiwa Springs
Occupancy by Ownership in Wekiwa Springs
Of the total 9,472 dwellings in Wekiwa Springs, owner-occupied units account for 7,346 (77.5%), while renter-occupied units make up 2,126 (22.5%).
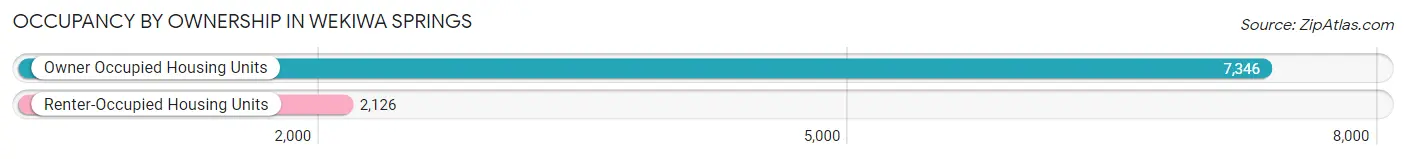
| Occupancy | # Housing Units | % Housing Units |
| Owner Occupied Housing Units | 7,346 | 77.5% |
| Renter-Occupied Housing Units | 2,126 | 22.5% |
| Total Occupied Housing Units | 9,472 | 100.0% |
Occupancy by Household Size in Wekiwa Springs
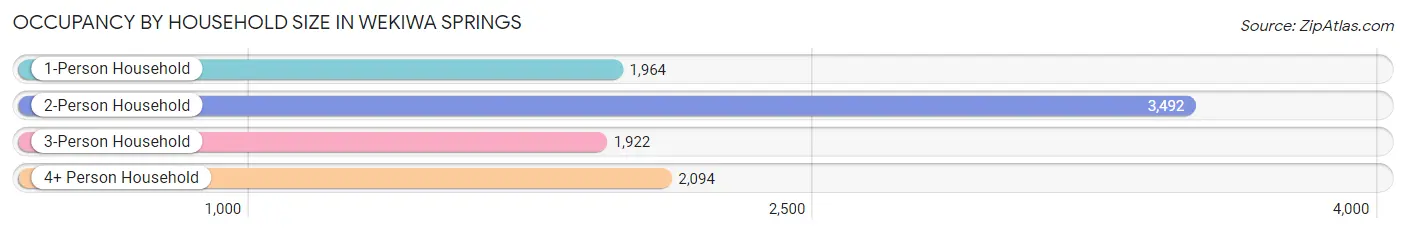
| Household Size | # Housing Units | % Housing Units |
| 1-Person Household | 1,964 | 20.7% |
| 2-Person Household | 3,492 | 36.9% |
| 3-Person Household | 1,922 | 20.3% |
| 4+ Person Household | 2,094 | 22.1% |
| Total Housing Units | 9,472 | 100.0% |
Occupancy by Ownership by Household Size in Wekiwa Springs
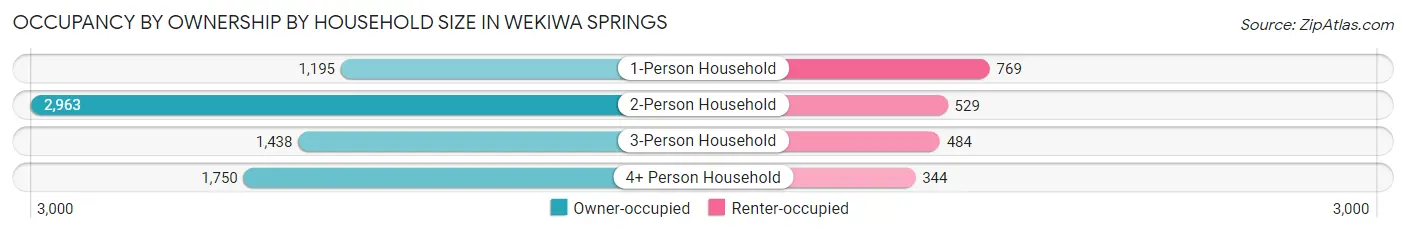
| Household Size | Owner-occupied | Renter-occupied |
| 1-Person Household | 1,195 (60.9%) | 769 (39.2%) |
| 2-Person Household | 2,963 (84.9%) | 529 (15.1%) |
| 3-Person Household | 1,438 (74.8%) | 484 (25.2%) |
| 4+ Person Household | 1,750 (83.6%) | 344 (16.4%) |
| Total Housing Units | 7,346 (77.5%) | 2,126 (22.5%) |
Occupancy by Educational Attainment in Wekiwa Springs
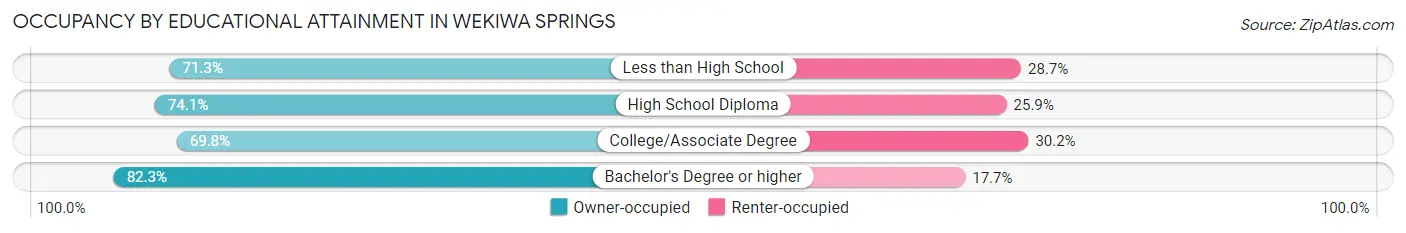
| Household Size | Owner-occupied | Renter-occupied |
| Less than High School | 124 (71.3%) | 50 (28.7%) |
| High School Diploma | 926 (74.1%) | 323 (25.9%) |
| College/Associate Degree | 1,845 (69.8%) | 798 (30.2%) |
| Bachelor's Degree or higher | 4,451 (82.3%) | 955 (17.7%) |
Occupancy by Age of Householder in Wekiwa Springs
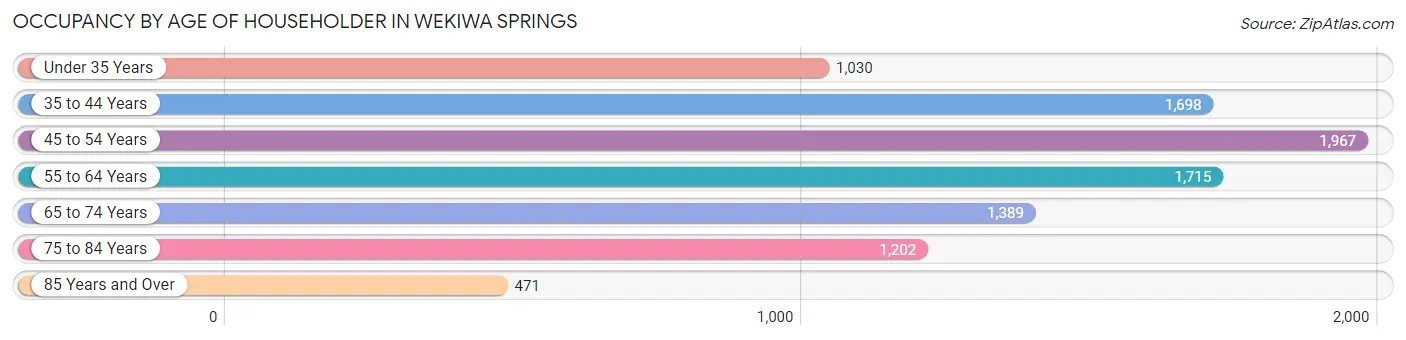
| Age Bracket | # Households | % Households |
| Under 35 Years | 1,030 | 10.9% |
| 35 to 44 Years | 1,698 | 17.9% |
| 45 to 54 Years | 1,967 | 20.8% |
| 55 to 64 Years | 1,715 | 18.1% |
| 65 to 74 Years | 1,389 | 14.7% |
| 75 to 84 Years | 1,202 | 12.7% |
| 85 Years and Over | 471 | 5.0% |
| Total | 9,472 | 100.0% |
Housing Finances in Wekiwa Springs
Median Income by Occupancy in Wekiwa Springs
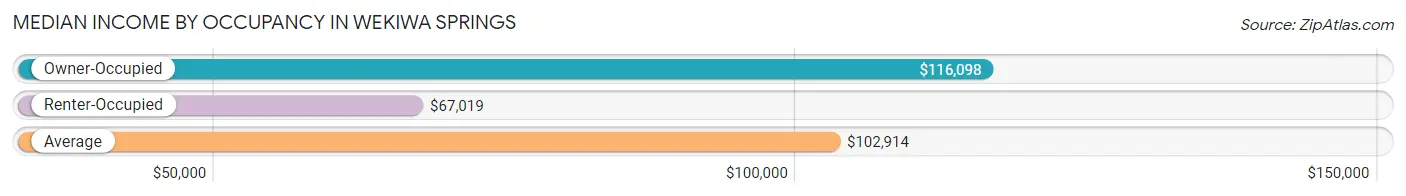
| Occupancy Type | # Households | Median Income |
| Owner-Occupied | 7,346 (77.5%) | $116,098 |
| Renter-Occupied | 2,126 (22.5%) | $67,019 |
| Average | 9,472 (100.0%) | $102,914 |
Occupancy by Householder Income Bracket in Wekiwa Springs
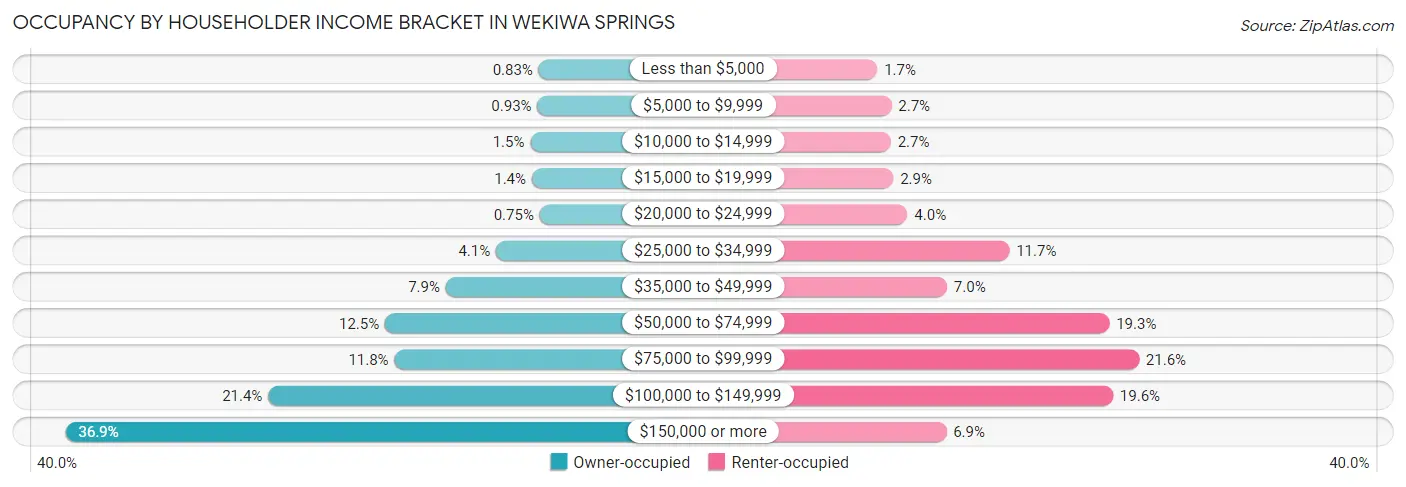
| Income Bracket | Owner-occupied | Renter-occupied |
| Less than $5,000 | 61 (0.8%) | 35 (1.7%) |
| $5,000 to $9,999 | 68 (0.9%) | 58 (2.7%) |
| $10,000 to $14,999 | 108 (1.5%) | 57 (2.7%) |
| $15,000 to $19,999 | 99 (1.3%) | 61 (2.9%) |
| $20,000 to $24,999 | 55 (0.7%) | 84 (4.0%) |
| $25,000 to $34,999 | 300 (4.1%) | 249 (11.7%) |
| $35,000 to $49,999 | 581 (7.9%) | 148 (7.0%) |
| $50,000 to $74,999 | 921 (12.5%) | 411 (19.3%) |
| $75,000 to $99,999 | 868 (11.8%) | 459 (21.6%) |
| $100,000 to $149,999 | 1,575 (21.4%) | 417 (19.6%) |
| $150,000 or more | 2,710 (36.9%) | 147 (6.9%) |
| Total | 7,346 (100.0%) | 2,126 (100.0%) |
Monthly Housing Cost Tiers in Wekiwa Springs
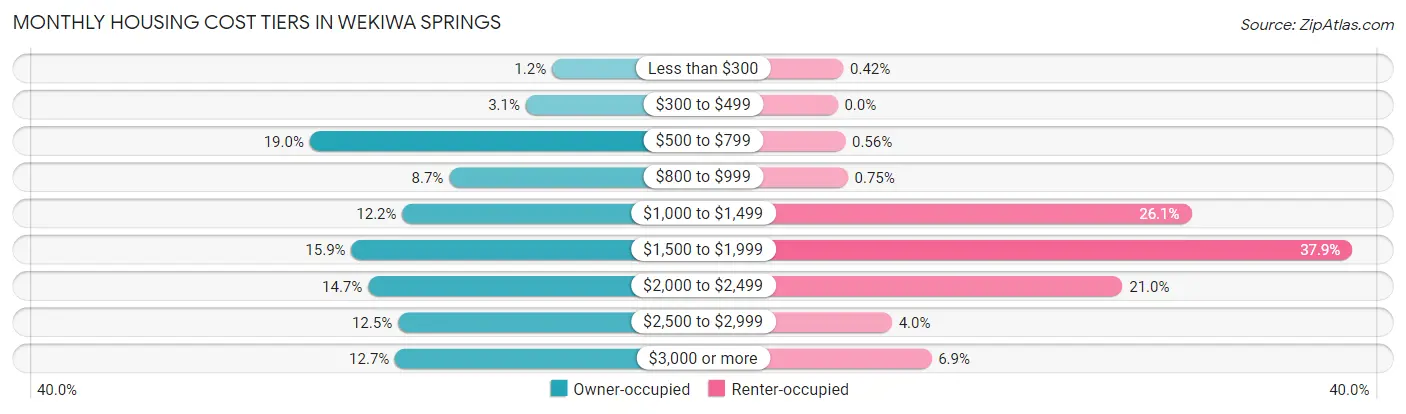
| Monthly Cost | Owner-occupied | Renter-occupied |
| Less than $300 | 85 (1.2%) | 9 (0.4%) |
| $300 to $499 | 227 (3.1%) | 0 (0.0%) |
| $500 to $799 | 1,396 (19.0%) | 12 (0.6%) |
| $800 to $999 | 641 (8.7%) | 16 (0.7%) |
| $1,000 to $1,499 | 895 (12.2%) | 554 (26.1%) |
| $1,500 to $1,999 | 1,170 (15.9%) | 806 (37.9%) |
| $2,000 to $2,499 | 1,080 (14.7%) | 446 (21.0%) |
| $2,500 to $2,999 | 918 (12.5%) | 85 (4.0%) |
| $3,000 or more | 934 (12.7%) | 147 (6.9%) |
| Total | 7,346 (100.0%) | 2,126 (100.0%) |
Physical Housing Characteristics in Wekiwa Springs
Housing Structures in Wekiwa Springs
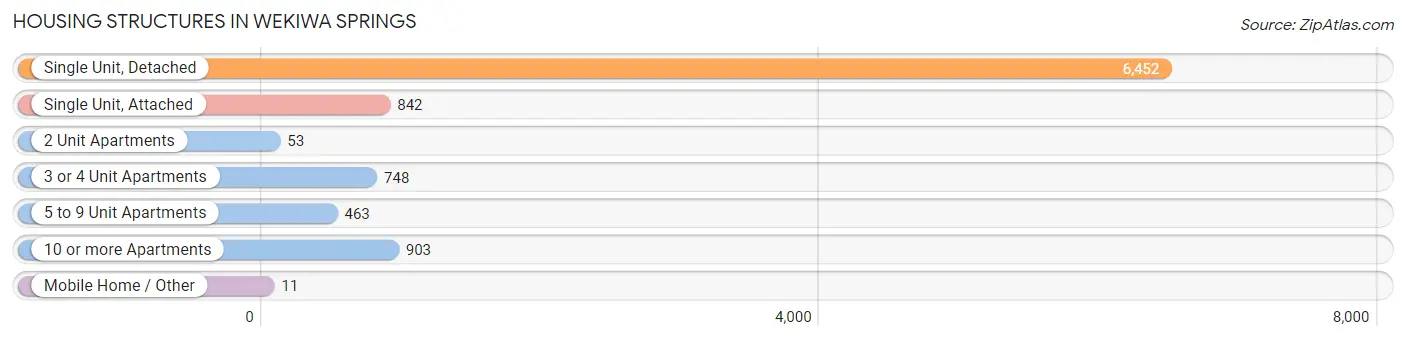
| Structure Type | # Housing Units | % Housing Units |
| Single Unit, Detached | 6,452 | 68.1% |
| Single Unit, Attached | 842 | 8.9% |
| 2 Unit Apartments | 53 | 0.6% |
| 3 or 4 Unit Apartments | 748 | 7.9% |
| 5 to 9 Unit Apartments | 463 | 4.9% |
| 10 or more Apartments | 903 | 9.5% |
| Mobile Home / Other | 11 | 0.1% |
| Total | 9,472 | 100.0% |
Housing Structures by Occupancy in Wekiwa Springs
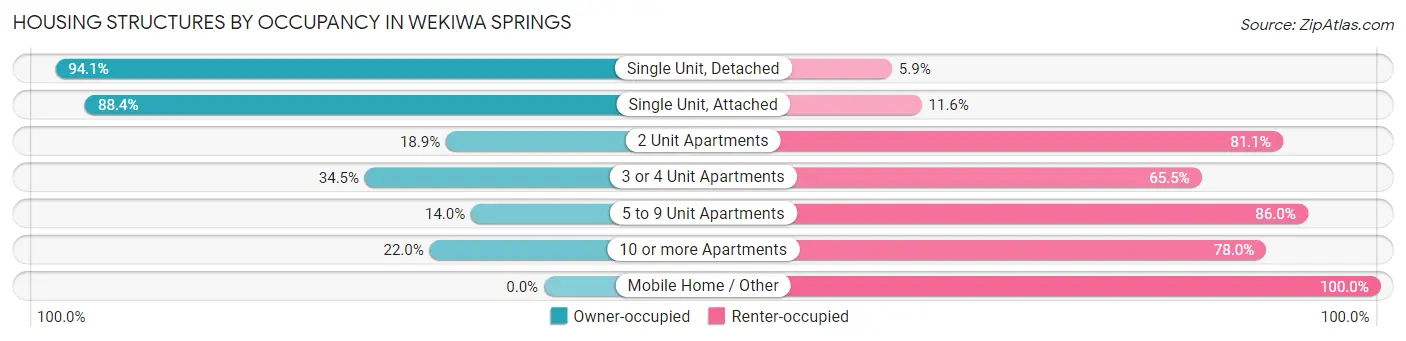
| Structure Type | Owner-occupied | Renter-occupied |
| Single Unit, Detached | 6,070 (94.1%) | 382 (5.9%) |
| Single Unit, Attached | 744 (88.4%) | 98 (11.6%) |
| 2 Unit Apartments | 10 (18.9%) | 43 (81.1%) |
| 3 or 4 Unit Apartments | 258 (34.5%) | 490 (65.5%) |
| 5 to 9 Unit Apartments | 65 (14.0%) | 398 (86.0%) |
| 10 or more Apartments | 199 (22.0%) | 704 (78.0%) |
| Mobile Home / Other | 0 (0.0%) | 11 (100.0%) |
| Total | 7,346 (77.5%) | 2,126 (22.5%) |
Housing Structures by Number of Rooms in Wekiwa Springs
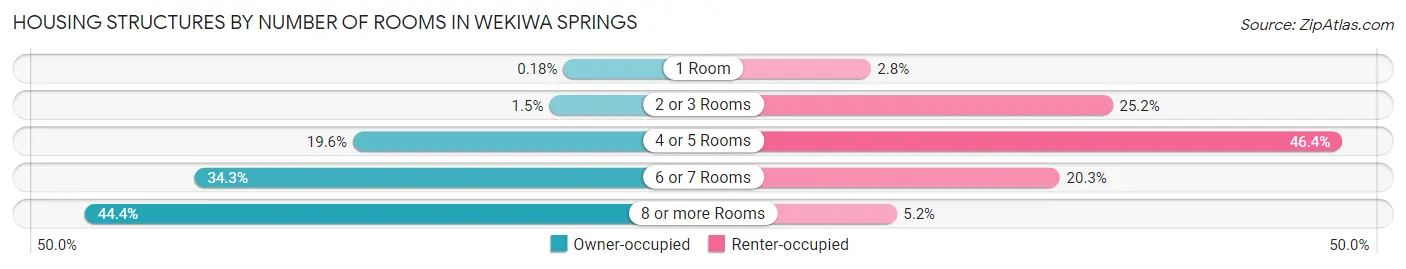
| Number of Rooms | Owner-occupied | Renter-occupied |
| 1 Room | 13 (0.2%) | 60 (2.8%) |
| 2 or 3 Rooms | 109 (1.5%) | 536 (25.2%) |
| 4 or 5 Rooms | 1,443 (19.6%) | 987 (46.4%) |
| 6 or 7 Rooms | 2,518 (34.3%) | 432 (20.3%) |
| 8 or more Rooms | 3,263 (44.4%) | 111 (5.2%) |
| Total | 7,346 (100.0%) | 2,126 (100.0%) |
Housing Structure by Heating Type in Wekiwa Springs
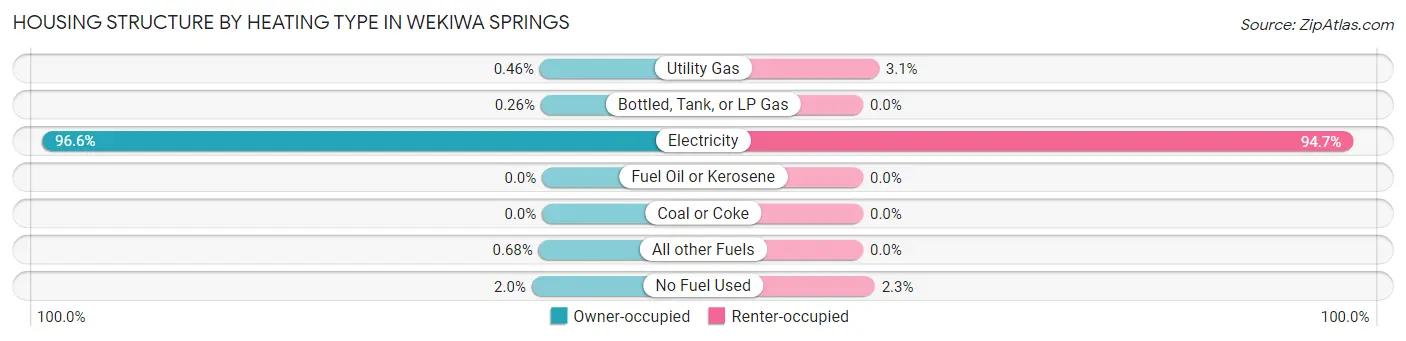
| Heating Type | Owner-occupied | Renter-occupied |
| Utility Gas | 34 (0.5%) | 65 (3.1%) |
| Bottled, Tank, or LP Gas | 19 (0.3%) | 0 (0.0%) |
| Electricity | 7,096 (96.6%) | 2,013 (94.7%) |
| Fuel Oil or Kerosene | 0 (0.0%) | 0 (0.0%) |
| Coal or Coke | 0 (0.0%) | 0 (0.0%) |
| All other Fuels | 50 (0.7%) | 0 (0.0%) |
| No Fuel Used | 147 (2.0%) | 48 (2.3%) |
| Total | 7,346 (100.0%) | 2,126 (100.0%) |
Household Vehicle Usage in Wekiwa Springs
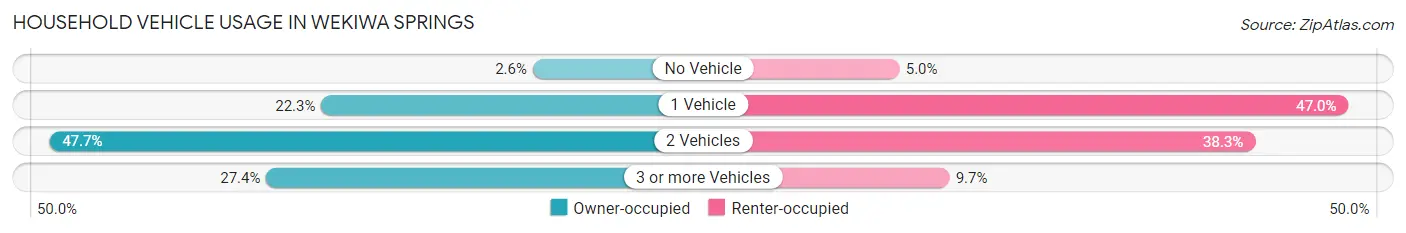
| Vehicles per Household | Owner-occupied | Renter-occupied |
| No Vehicle | 188 (2.6%) | 107 (5.0%) |
| 1 Vehicle | 1,638 (22.3%) | 999 (47.0%) |
| 2 Vehicles | 3,504 (47.7%) | 814 (38.3%) |
| 3 or more Vehicles | 2,016 (27.4%) | 206 (9.7%) |
| Total | 7,346 (100.0%) | 2,126 (100.0%) |
Real Estate & Mortgages in Wekiwa Springs
Real Estate and Mortgage Overview in Wekiwa Springs
| Characteristic | Without Mortgage | With Mortgage |
| Housing Units | 2,610 | 4,736 |
| Median Property Value | $351,800 | $401,000 |
| Median Household Income | $94,561 | $2,063 |
| Monthly Housing Costs | $715 | $934 |
| Real Estate Taxes | $2,472 | $132 |
Property Value by Mortgage Status in Wekiwa Springs
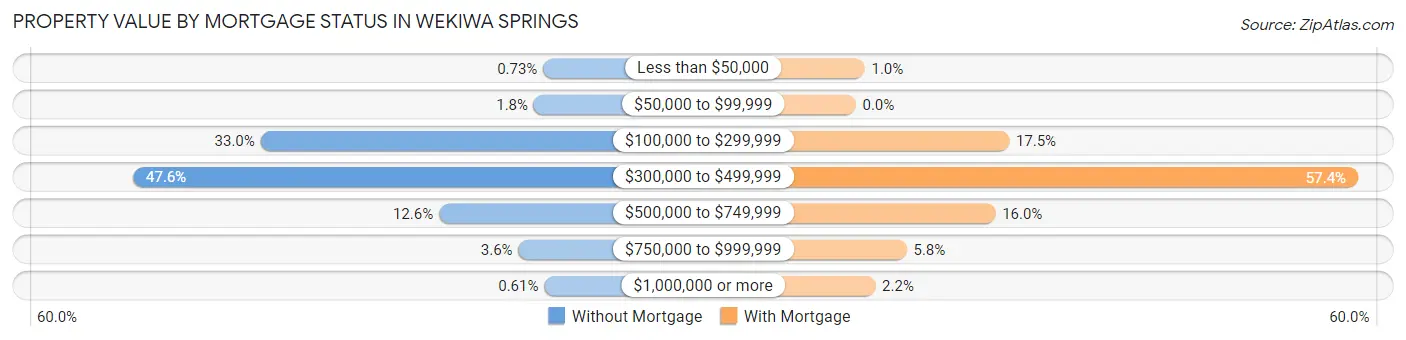
| Property Value | Without Mortgage | With Mortgage |
| Less than $50,000 | 19 (0.7%) | 49 (1.0%) |
| $50,000 to $99,999 | 47 (1.8%) | 0 (0.0%) |
| $100,000 to $299,999 | 862 (33.0%) | 830 (17.5%) |
| $300,000 to $499,999 | 1,243 (47.6%) | 2,719 (57.4%) |
| $500,000 to $749,999 | 330 (12.6%) | 756 (16.0%) |
| $750,000 to $999,999 | 93 (3.6%) | 276 (5.8%) |
| $1,000,000 or more | 16 (0.6%) | 106 (2.2%) |
| Total | 2,610 (100.0%) | 4,736 (100.0%) |
Household Income by Mortgage Status in Wekiwa Springs
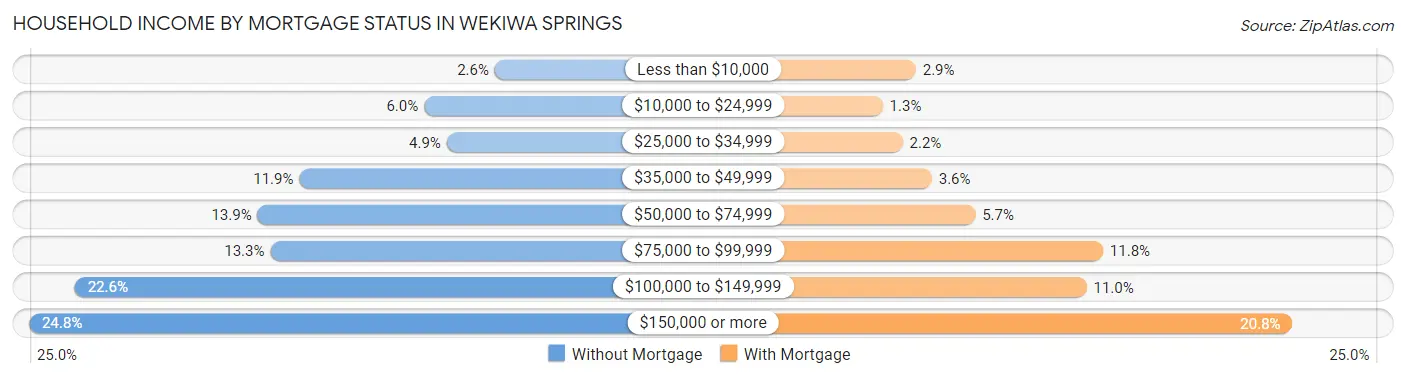
| Household Income | Without Mortgage | With Mortgage |
| Less than $10,000 | 68 (2.6%) | 136 (2.9%) |
| $10,000 to $24,999 | 156 (6.0%) | 61 (1.3%) |
| $25,000 to $34,999 | 128 (4.9%) | 106 (2.2%) |
| $35,000 to $49,999 | 311 (11.9%) | 172 (3.6%) |
| $50,000 to $74,999 | 363 (13.9%) | 270 (5.7%) |
| $75,000 to $99,999 | 347 (13.3%) | 558 (11.8%) |
| $100,000 to $149,999 | 590 (22.6%) | 521 (11.0%) |
| $150,000 or more | 647 (24.8%) | 985 (20.8%) |
| Total | 2,610 (100.0%) | 4,736 (100.0%) |
Property Value to Household Income Ratio in Wekiwa Springs
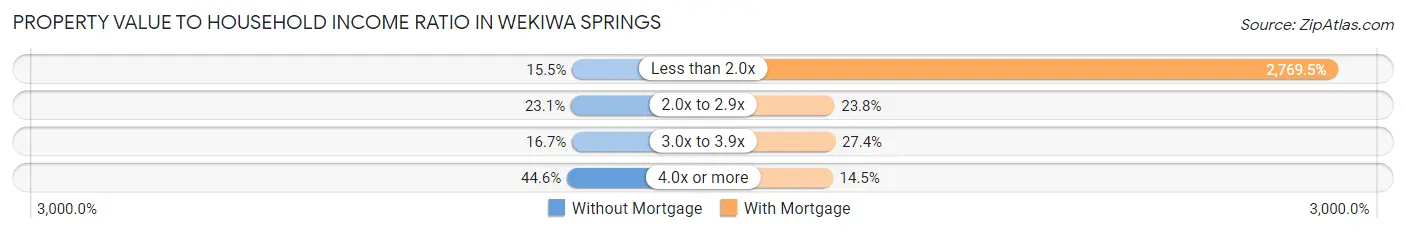
| Value-to-Income Ratio | Without Mortgage | With Mortgage |
| Less than 2.0x | 405 (15.5%) | 131,165 (2,769.5%) |
| 2.0x to 2.9x | 604 (23.1%) | 1,128 (23.8%) |
| 3.0x to 3.9x | 436 (16.7%) | 1,296 (27.4%) |
| 4.0x or more | 1,165 (44.6%) | 688 (14.5%) |
| Total | 2,610 (100.0%) | 4,736 (100.0%) |
Real Estate Taxes by Mortgage Status in Wekiwa Springs
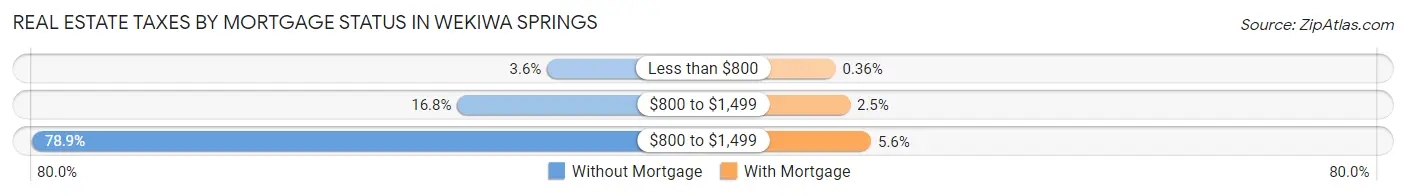
| Property Taxes | Without Mortgage | With Mortgage |
| Less than $800 | 95 (3.6%) | 17 (0.4%) |
| $800 to $1,499 | 438 (16.8%) | 117 (2.5%) |
| $800 to $1,499 | 2,060 (78.9%) | 263 (5.6%) |
| Total | 2,610 (100.0%) | 4,736 (100.0%) |
Health & Disability in Wekiwa Springs
Health Insurance Coverage by Age in Wekiwa Springs
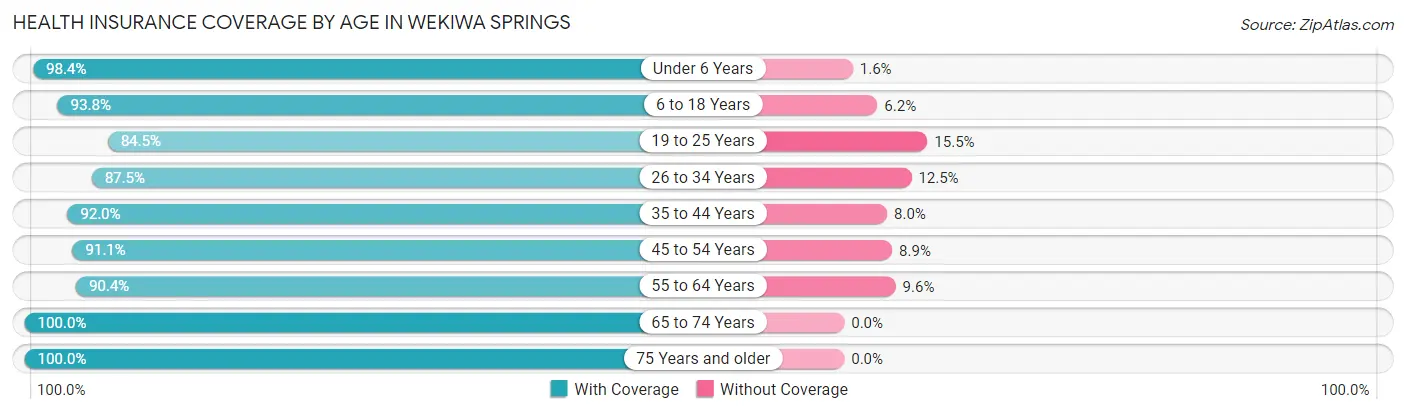
| Age Bracket | With Coverage | Without Coverage |
| Under 6 Years | 1,174 (98.4%) | 19 (1.6%) |
| 6 to 18 Years | 3,650 (93.8%) | 240 (6.2%) |
| 19 to 25 Years | 1,205 (84.5%) | 221 (15.5%) |
| 26 to 34 Years | 1,705 (87.5%) | 244 (12.5%) |
| 35 to 44 Years | 3,252 (92.0%) | 282 (8.0%) |
| 45 to 54 Years | 3,340 (91.1%) | 327 (8.9%) |
| 55 to 64 Years | 3,021 (90.4%) | 320 (9.6%) |
| 65 to 74 Years | 2,500 (100.0%) | 0 (0.0%) |
| 75 Years and older | 2,643 (100.0%) | 0 (0.0%) |
| Total | 22,490 (93.1%) | 1,653 (6.9%) |
Health Insurance Coverage by Citizenship Status in Wekiwa Springs
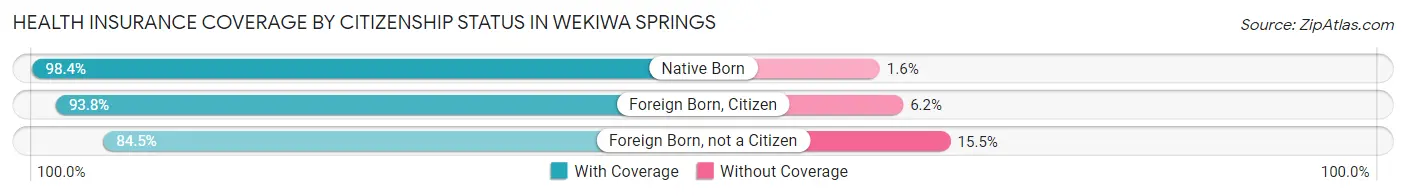
| Citizenship Status | With Coverage | Without Coverage |
| Native Born | 1,174 (98.4%) | 19 (1.6%) |
| Foreign Born, Citizen | 3,650 (93.8%) | 240 (6.2%) |
| Foreign Born, not a Citizen | 1,205 (84.5%) | 221 (15.5%) |
Health Insurance Coverage by Household Income in Wekiwa Springs
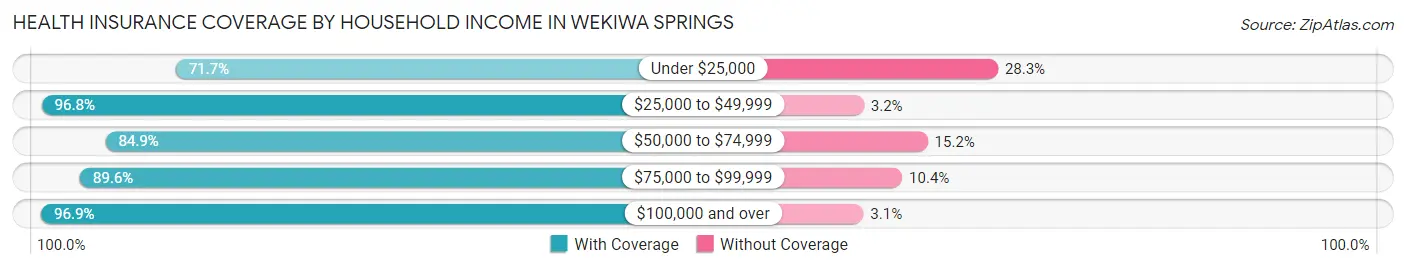
| Household Income | With Coverage | Without Coverage |
| Under $25,000 | 777 (71.7%) | 307 (28.3%) |
| $25,000 to $49,999 | 2,054 (96.8%) | 68 (3.2%) |
| $50,000 to $74,999 | 2,577 (84.9%) | 460 (15.1%) |
| $75,000 to $99,999 | 3,234 (89.6%) | 374 (10.4%) |
| $100,000 and over | 13,848 (96.9%) | 444 (3.1%) |
Public vs Private Health Insurance Coverage by Age in Wekiwa Springs
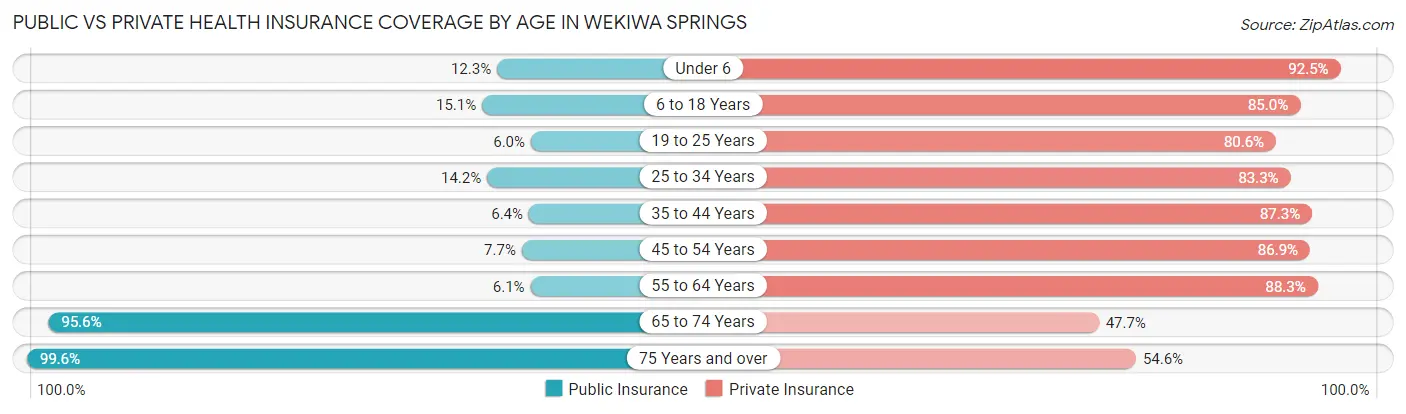
| Age Bracket | Public Insurance | Private Insurance |
| Under 6 | 147 (12.3%) | 1,104 (92.5%) |
| 6 to 18 Years | 587 (15.1%) | 3,308 (85.0%) |
| 19 to 25 Years | 86 (6.0%) | 1,149 (80.6%) |
| 25 to 34 Years | 276 (14.2%) | 1,623 (83.3%) |
| 35 to 44 Years | 226 (6.4%) | 3,084 (87.3%) |
| 45 to 54 Years | 283 (7.7%) | 3,186 (86.9%) |
| 55 to 64 Years | 204 (6.1%) | 2,950 (88.3%) |
| 65 to 74 Years | 2,390 (95.6%) | 1,192 (47.7%) |
| 75 Years and over | 2,632 (99.6%) | 1,443 (54.6%) |
| Total | 6,831 (28.3%) | 19,039 (78.9%) |
Disability Status by Sex by Age in Wekiwa Springs
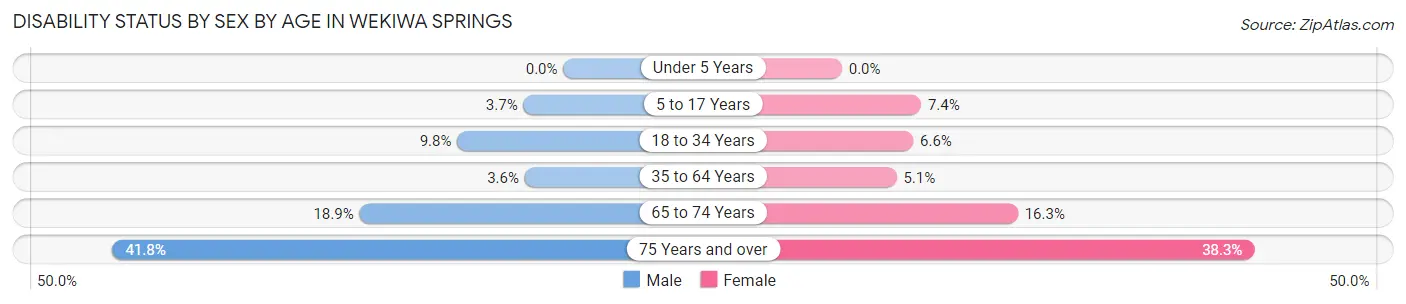
| Age Bracket | Male | Female |
| Under 5 Years | 0 (0.0%) | 0 (0.0%) |
| 5 to 17 Years | 71 (3.7%) | 147 (7.3%) |
| 18 to 34 Years | 171 (9.8%) | 123 (6.6%) |
| 35 to 64 Years | 184 (3.6%) | 274 (5.1%) |
| 65 to 74 Years | 210 (18.9%) | 227 (16.3%) |
| 75 Years and over | 464 (41.8%) | 587 (38.3%) |
Disability Class by Sex by Age in Wekiwa Springs
Disability Class: Hearing Difficulty
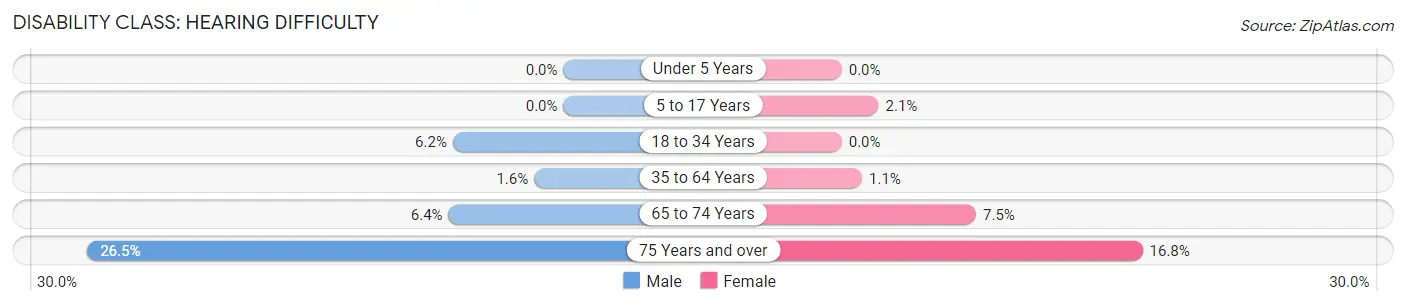
| Age Bracket | Male | Female |
| Under 5 Years | 0 (0.0%) | 0 (0.0%) |
| 5 to 17 Years | 0 (0.0%) | 41 (2.1%) |
| 18 to 34 Years | 107 (6.2%) | 0 (0.0%) |
| 35 to 64 Years | 84 (1.6%) | 61 (1.1%) |
| 65 to 74 Years | 71 (6.4%) | 104 (7.5%) |
| 75 Years and over | 294 (26.5%) | 257 (16.8%) |
Disability Class: Vision Difficulty
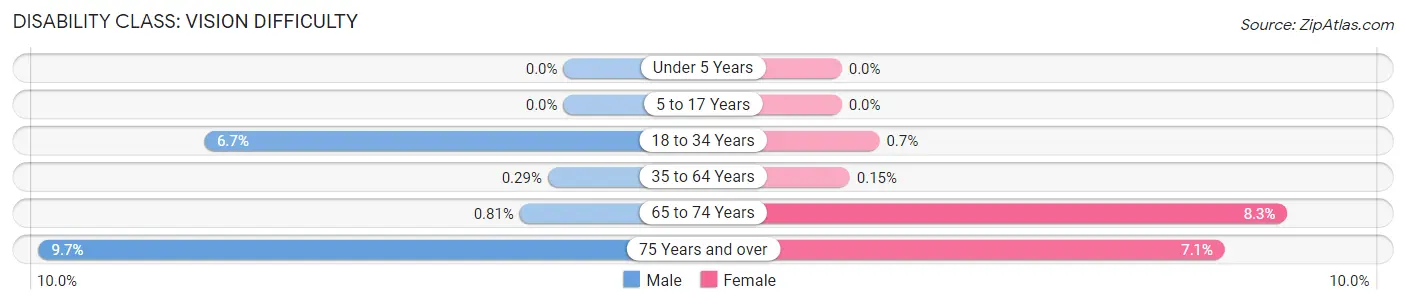
| Age Bracket | Male | Female |
| Under 5 Years | 0 (0.0%) | 0 (0.0%) |
| 5 to 17 Years | 0 (0.0%) | 0 (0.0%) |
| 18 to 34 Years | 116 (6.7%) | 13 (0.7%) |
| 35 to 64 Years | 15 (0.3%) | 8 (0.2%) |
| 65 to 74 Years | 9 (0.8%) | 115 (8.3%) |
| 75 Years and over | 108 (9.7%) | 109 (7.1%) |
Disability Class: Cognitive Difficulty
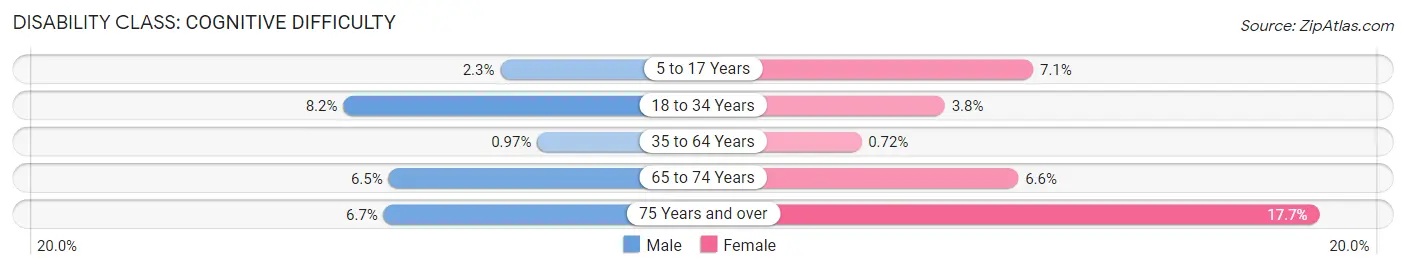
| Age Bracket | Male | Female |
| 5 to 17 Years | 45 (2.3%) | 142 (7.1%) |
| 18 to 34 Years | 142 (8.2%) | 71 (3.8%) |
| 35 to 64 Years | 50 (1.0%) | 39 (0.7%) |
| 65 to 74 Years | 72 (6.5%) | 91 (6.6%) |
| 75 Years and over | 74 (6.7%) | 272 (17.7%) |
Disability Class: Ambulatory Difficulty
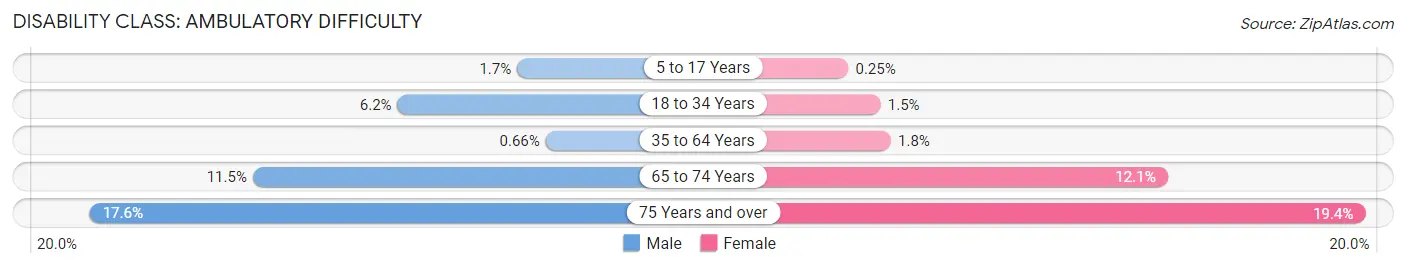
| Age Bracket | Male | Female |
| 5 to 17 Years | 33 (1.7%) | 5 (0.3%) |
| 18 to 34 Years | 107 (6.2%) | 27 (1.5%) |
| 35 to 64 Years | 34 (0.7%) | 99 (1.8%) |
| 65 to 74 Years | 128 (11.5%) | 168 (12.1%) |
| 75 Years and over | 195 (17.6%) | 298 (19.4%) |
Disability Class: Self-Care Difficulty
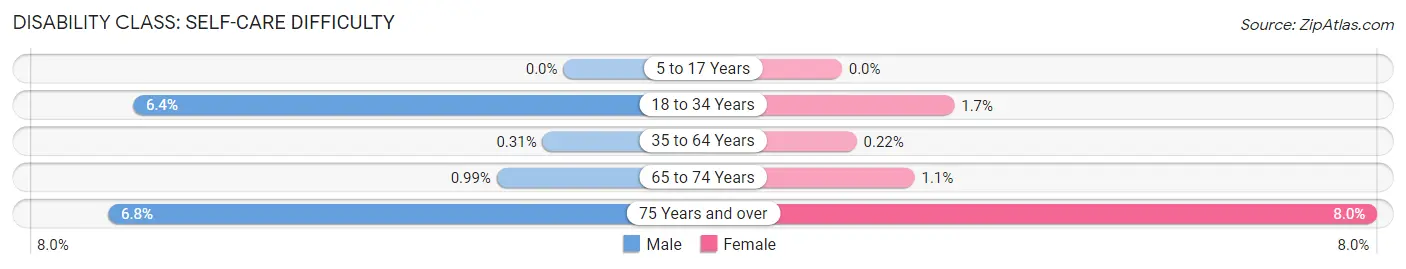
| Age Bracket | Male | Female |
| 5 to 17 Years | 0 (0.0%) | 0 (0.0%) |
| 18 to 34 Years | 111 (6.4%) | 31 (1.7%) |
| 35 to 64 Years | 16 (0.3%) | 12 (0.2%) |
| 65 to 74 Years | 11 (1.0%) | 15 (1.1%) |
| 75 Years and over | 75 (6.8%) | 122 (8.0%) |
Technology Access in Wekiwa Springs
Computing Device Access in Wekiwa Springs
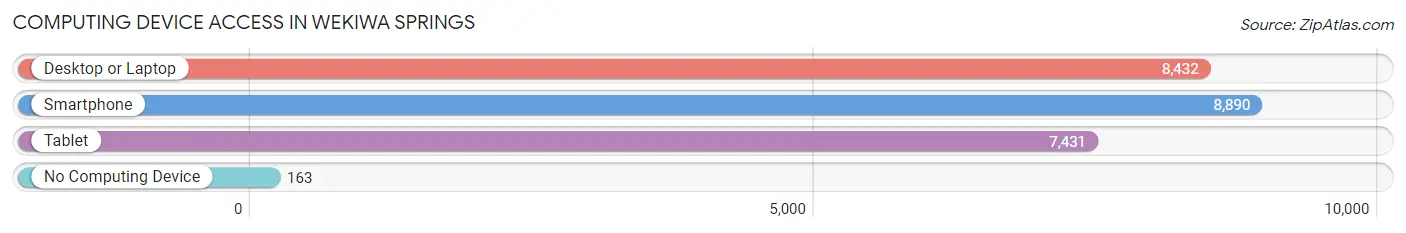
| Device Type | # Households | % Households |
| Desktop or Laptop | 8,432 | 89.0% |
| Smartphone | 8,890 | 93.9% |
| Tablet | 7,431 | 78.4% |
| No Computing Device | 163 | 1.7% |
| Total | 9,472 | 100.0% |
Internet Access in Wekiwa Springs
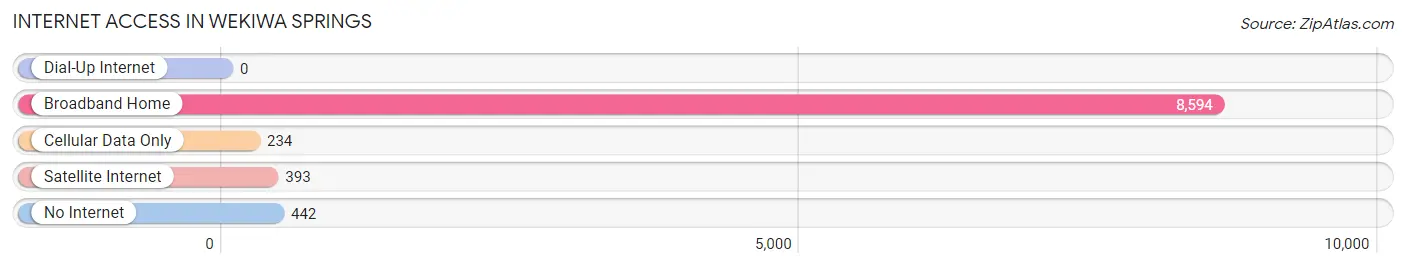
| Internet Type | # Households | % Households |
| Dial-Up Internet | 0 | 0.0% |
| Broadband Home | 8,594 | 90.7% |
| Cellular Data Only | 234 | 2.5% |
| Satellite Internet | 393 | 4.2% |
| No Internet | 442 | 4.7% |
| Total | 9,472 | 100.0% |
Wekiwa Springs Summary
Wekiwa Springs is a small town located in Seminole County, Florida. It is situated on the Wekiva River, which is a tributary of the St. Johns River. The town is located about 20 miles north of Orlando and is part of the Orlando-Kissimmee-Sanford Metropolitan Statistical Area. The population of Wekiwa Springs was estimated to be 1,845 in 2019.
History
The area around Wekiwa Springs has been inhabited for thousands of years. The Timucua people were the first known inhabitants of the area, and they lived in the area until the mid-1700s. The area was then settled by European settlers in the early 1800s. The town was originally known as Wekiwa Springs Station, and it was established in 1883 when the Florida Midland Railroad was built through the area. The town was renamed Wekiwa Springs in 1887.
The town was a popular destination for tourists in the early 1900s, and it was known for its natural springs and mineral baths. The town was also home to a number of resorts, including the Wekiwa Springs Hotel, which was built in the early 1900s. The hotel was destroyed by a fire in the 1950s.
Geography
Wekiwa Springs is located in Seminole County, Florida. It is situated on the Wekiva River, which is a tributary of the St. Johns River. The town is located about 20 miles north of Orlando and is part of the Orlando-Kissimmee-Sanford Metropolitan Statistical Area. The town is located in a rural area and is surrounded by forests and wetlands.
Economy
The economy of Wekiwa Springs is largely based on tourism. The town is home to Wekiwa Springs State Park, which is a popular destination for visitors. The park offers a variety of activities, including swimming, canoeing, kayaking, fishing, and hiking. The park also has a campground and picnic areas.
The town is also home to a number of businesses, including restaurants, shops, and a post office. The town is also home to a number of small businesses, including a gas station, a grocery store, and a hardware store.
Demographics
The population of Wekiwa Springs was estimated to be 1,845 in 2019. The town has a median age of 44.7 years, and the median household income is $50,945. The town is predominantly white, with 87.3% of the population identifying as white. The town also has a small Hispanic population, with 8.3% of the population identifying as Hispanic or Latino. The town also has a small African American population, with 2.2% of the population identifying as African American.
Common Questions
What is Per Capita Income in Wekiwa Springs?
Per Capita income in Wekiwa Springs is $53,405.
What is the Median Family Income in Wekiwa Springs?
Median Family Income in Wekiwa Springs is $116,109.
What is the Median Household income in Wekiwa Springs?
Median Household Income in Wekiwa Springs is $102,914.
What is Income or Wage Gap in Wekiwa Springs?
Income or Wage Gap in Wekiwa Springs is 33.1%.
Women in Wekiwa Springs earn 66.9 cents for every dollar earned by a man.
What is Inequality or Gini Index in Wekiwa Springs?
Inequality or Gini Index in Wekiwa Springs is 0.44.
What is the Total Population of Wekiwa Springs?
Total Population of Wekiwa Springs is 24,270.
What is the Total Male Population of Wekiwa Springs?
Total Male Population of Wekiwa Springs is 11,535.
What is the Total Female Population of Wekiwa Springs?
Total Female Population of Wekiwa Springs is 12,735.
What is the Ratio of Males per 100 Females in Wekiwa Springs?
There are 90.58 Males per 100 Females in Wekiwa Springs.
What is the Ratio of Females per 100 Males in Wekiwa Springs?
There are 110.40 Females per 100 Males in Wekiwa Springs.
What is the Median Population Age in Wekiwa Springs?
Median Population Age in Wekiwa Springs is 45.7 Years.
What is the Average Family Size in Wekiwa Springs
Average Family Size in Wekiwa Springs is 3.0 People.
What is the Average Household Size in Wekiwa Springs
Average Household Size in Wekiwa Springs is 2.5 People.
How Large is the Labor Force in Wekiwa Springs?
There are 12,772 People in the Labor Forcein in Wekiwa Springs.
What is the Percentage of People in the Labor Force in Wekiwa Springs?
63.4% of People are in the Labor Force in Wekiwa Springs.
What is the Unemployment Rate in Wekiwa Springs?
Unemployment Rate in Wekiwa Springs is 4.1%.