Naples, FL Map & Demographics
Naples Map
Naples Overview
$141,245
PER CAPITA INCOME
$185,223
AVG FAMILY INCOME
$135,657
AVG HOUSEHOLD INCOME
54.8%
WAGE / INCOME GAP [ % ]
45.2¢/ $1
WAGE / INCOME GAP [ $ ]
0.61
INEQUALITY / GINI INDEX
19,315
TOTAL POPULATION
9,017
MALE POPULATION
10,298
FEMALE POPULATION
87.56
MALES / 100 FEMALES
114.21
FEMALES / 100 MALES
66.9
MEDIAN AGE
2.5
AVG FAMILY SIZE
2.0
AVG HOUSEHOLD SIZE
6,464
LABOR FORCE [ PEOPLE ]
36.6%
PERCENT IN LABOR FORCE
2.5%
UNEMPLOYMENT RATE
Naples Zip Codes
Naples Area Codes
Income in Naples
Income Overview in Naples
Per Capita Income in Naples is $141,245, while median incomes of families and households are $185,223 and $135,657 respectively.
| Characteristic | Number | Measure |
| Per Capita Income | 19,315 | $141,245 |
| Median Family Income | 5,651 | $185,223 |
| Mean Family Income | 5,651 | $361,792 |
| Median Household Income | 9,583 | $135,657 |
| Mean Household Income | 9,583 | $277,872 |
| Income Deficit | 5,651 | $0 |
| Wage / Income Gap (%) | 19,315 | 54.78% |
| Wage / Income Gap ($) | 19,315 | 45.22¢ per $1 |
| Gini / Inequality Index | 19,315 | 0.61 |
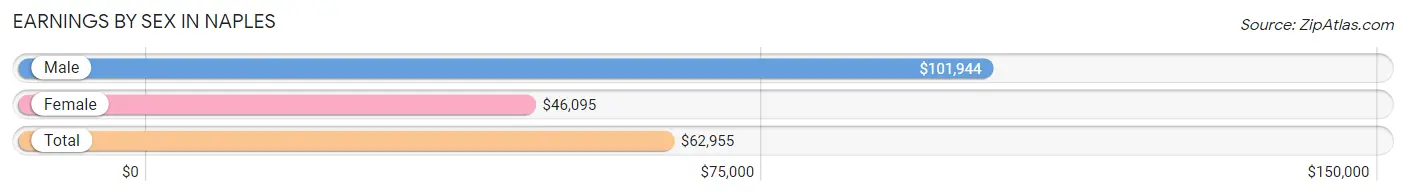
Earnings by Sex in Naples
Average Earnings in Naples are $62,955, $101,944 for men and $46,095 for women, a difference of 54.8%.
| Sex | Number | Average Earnings |
| Male | 3,818 (55.7%) | $101,944 |
| Female | 3,038 (44.3%) | $46,095 |
| Total | 6,856 (100.0%) | $62,955 |
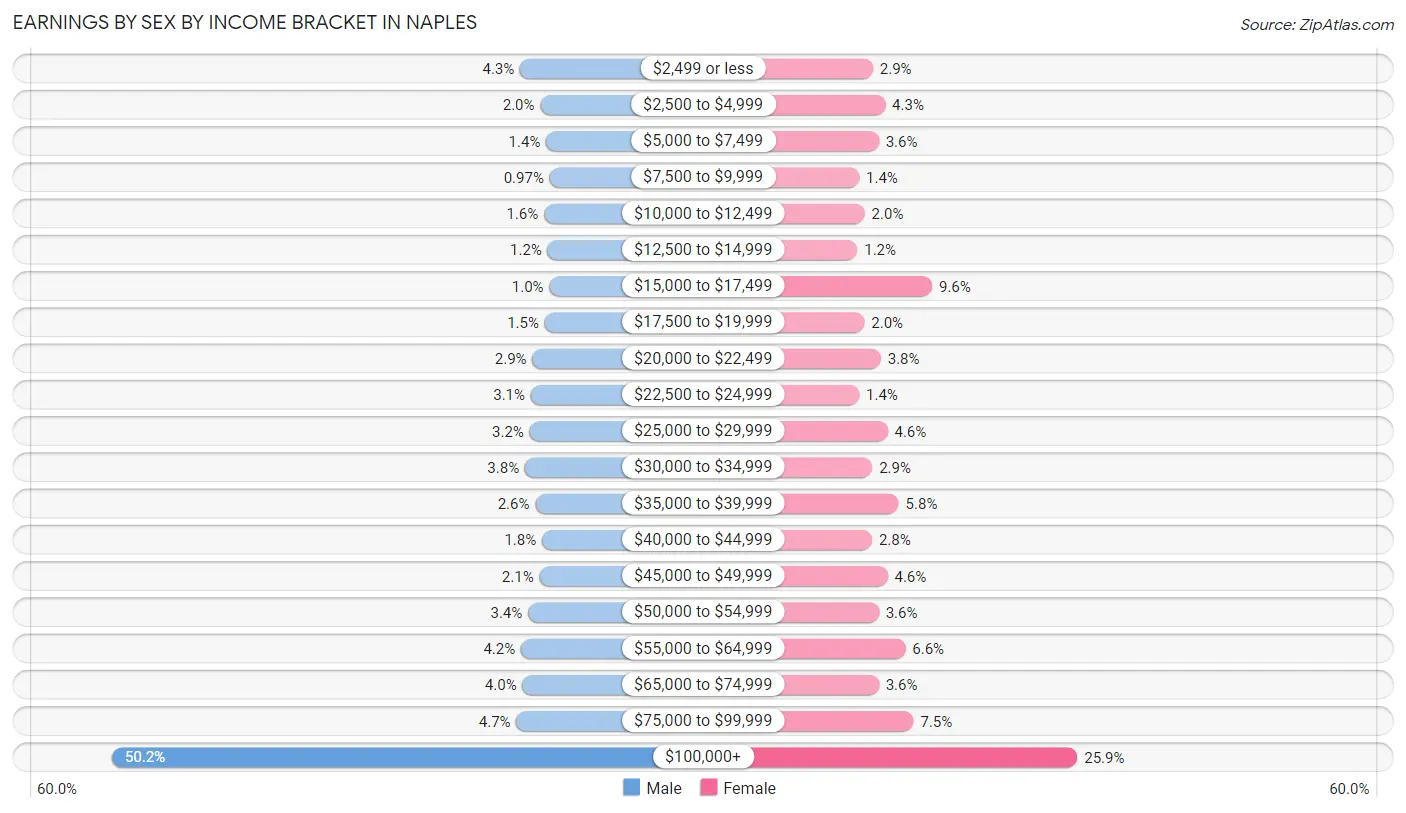
Earnings by Sex by Income Bracket in Naples
The most common earnings brackets in Naples are $100,000+ for men (1,916 | 50.2%) and $100,000+ for women (787 | 25.9%).
| Income | Male | Female |
| $2,499 or less | 164 (4.3%) | 89 (2.9%) |
| $2,500 to $4,999 | 77 (2.0%) | 131 (4.3%) |
| $5,000 to $7,499 | 52 (1.4%) | 109 (3.6%) |
| $7,500 to $9,999 | 37 (1.0%) | 42 (1.4%) |
| $10,000 to $12,499 | 61 (1.6%) | 61 (2.0%) |
| $12,500 to $14,999 | 46 (1.2%) | 36 (1.2%) |
| $15,000 to $17,499 | 38 (1.0%) | 291 (9.6%) |
| $17,500 to $19,999 | 58 (1.5%) | 60 (2.0%) |
| $20,000 to $22,499 | 111 (2.9%) | 116 (3.8%) |
| $22,500 to $24,999 | 118 (3.1%) | 42 (1.4%) |
| $25,000 to $29,999 | 123 (3.2%) | 139 (4.6%) |
| $30,000 to $34,999 | 143 (3.7%) | 87 (2.9%) |
| $35,000 to $39,999 | 99 (2.6%) | 177 (5.8%) |
| $40,000 to $44,999 | 70 (1.8%) | 86 (2.8%) |
| $45,000 to $49,999 | 81 (2.1%) | 139 (4.6%) |
| $50,000 to $54,999 | 130 (3.4%) | 109 (3.6%) |
| $55,000 to $64,999 | 160 (4.2%) | 200 (6.6%) |
| $65,000 to $74,999 | 154 (4.0%) | 109 (3.6%) |
| $75,000 to $99,999 | 180 (4.7%) | 228 (7.5%) |
| $100,000+ | 1,916 (50.2%) | 787 (25.9%) |
| Total | 3,818 (100.0%) | 3,038 (100.0%) |
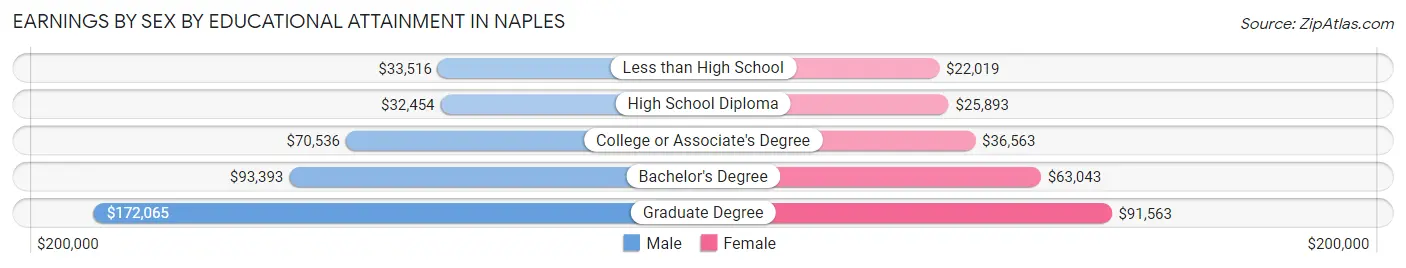
Earnings by Sex by Educational Attainment in Naples
Average earnings in Naples are $116,136 for men and $54,643 for women, a difference of 52.9%. Men with an educational attainment of graduate degree enjoy the highest average annual earnings of $172,065, while those with high school diploma education earn the least with $32,454. Women with an educational attainment of graduate degree earn the most with the average annual earnings of $91,563, while those with less than high school education have the smallest earnings of $22,019.
| Educational Attainment | Male Income | Female Income |
| Less than High School | $33,516 | $22,019 |
| High School Diploma | $32,454 | $25,893 |
| College or Associate's Degree | $70,536 | $36,563 |
| Bachelor's Degree | $93,393 | $63,043 |
| Graduate Degree | $172,065 | $91,563 |
| Total | $116,136 | $54,643 |
Family Income in Naples
Family Income Brackets in Naples
According to the Naples family income data, there are 2,645 families falling into the $200,000+ income range, which is the most common income bracket and makes up 46.8% of all families. Conversely, the $10,000 to $14,999 income bracket is the least frequent group with only 45 families (0.8%) belonging to this category.
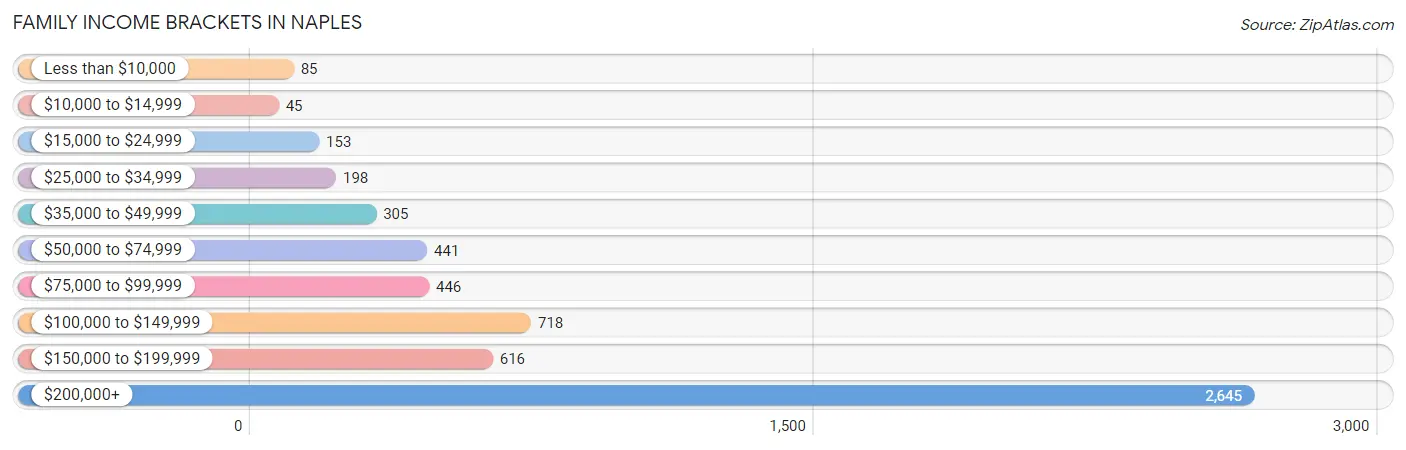
| Income Bracket | # Families | % Families |
| Less than $10,000 | 85 | 1.5% |
| $10,000 to $14,999 | 45 | 0.8% |
| $15,000 to $24,999 | 153 | 2.7% |
| $25,000 to $34,999 | 198 | 3.5% |
| $35,000 to $49,999 | 305 | 5.4% |
| $50,000 to $74,999 | 441 | 7.8% |
| $75,000 to $99,999 | 446 | 7.9% |
| $100,000 to $149,999 | 718 | 12.7% |
| $150,000 to $199,999 | 616 | 10.9% |
| $200,000+ | 2,645 | 46.8% |
Family Income by Famaliy Size in Naples
2-person families (4,610 | 81.6%) account for the highest median family income in Naples with $199,583 per family, while 2-person families (4,610 | 81.6%) have the highest median income of $99,792 per family member.
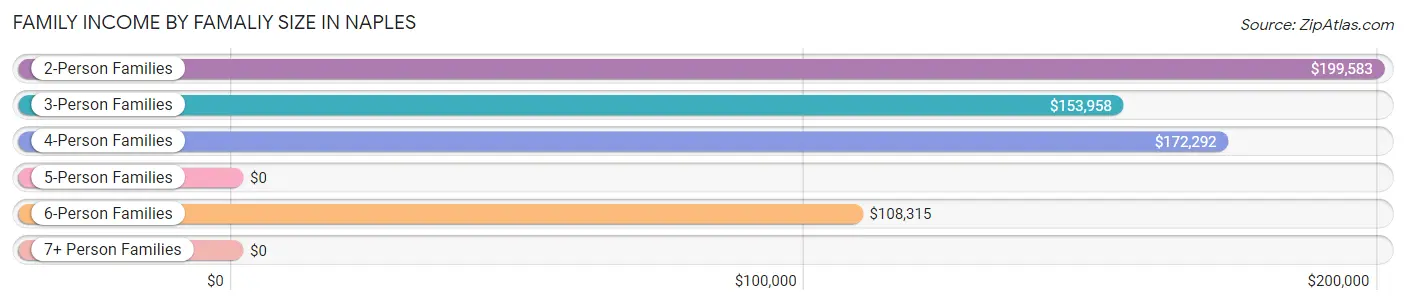
| Income Bracket | # Families | Median Income |
| 2-Person Families | 4,610 (81.6%) | $199,583 |
| 3-Person Families | 517 (9.1%) | $153,958 |
| 4-Person Families | 335 (5.9%) | $172,292 |
| 5-Person Families | 129 (2.3%) | $0 |
| 6-Person Families | 55 (1.0%) | $108,315 |
| 7+ Person Families | 5 (0.1%) | $0 |
| Total | 5,651 (100.0%) | $185,223 |
Family Income by Number of Earners in Naples
The median family income in Naples is $185,223, with families comprising 2 earners (1,219) having the highest median family income of $228,850, while families with no earners (2,554) have the lowest median family income of $148,284, accounting for 21.6% and 45.2% of families, respectively.
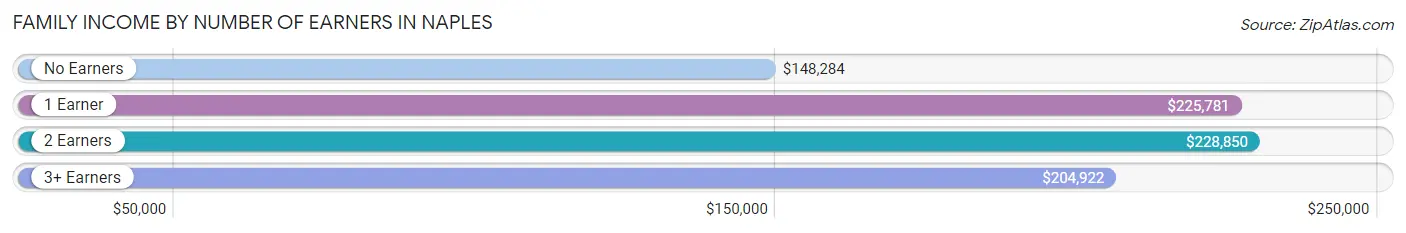
| Number of Earners | # Families | Median Income |
| No Earners | 2,554 (45.2%) | $148,284 |
| 1 Earner | 1,791 (31.7%) | $225,781 |
| 2 Earners | 1,219 (21.6%) | $228,850 |
| 3+ Earners | 87 (1.5%) | $204,922 |
| Total | 5,651 (100.0%) | $185,223 |
Household Income in Naples
Household Income Brackets in Naples
With 3,364 households falling in the category, the $200,000+ income range is the most frequent in Naples, accounting for 35.1% of all households. In contrast, only 134 households (1.4%) fall into the $10,000 to $14,999 income bracket, making it the least populous group.
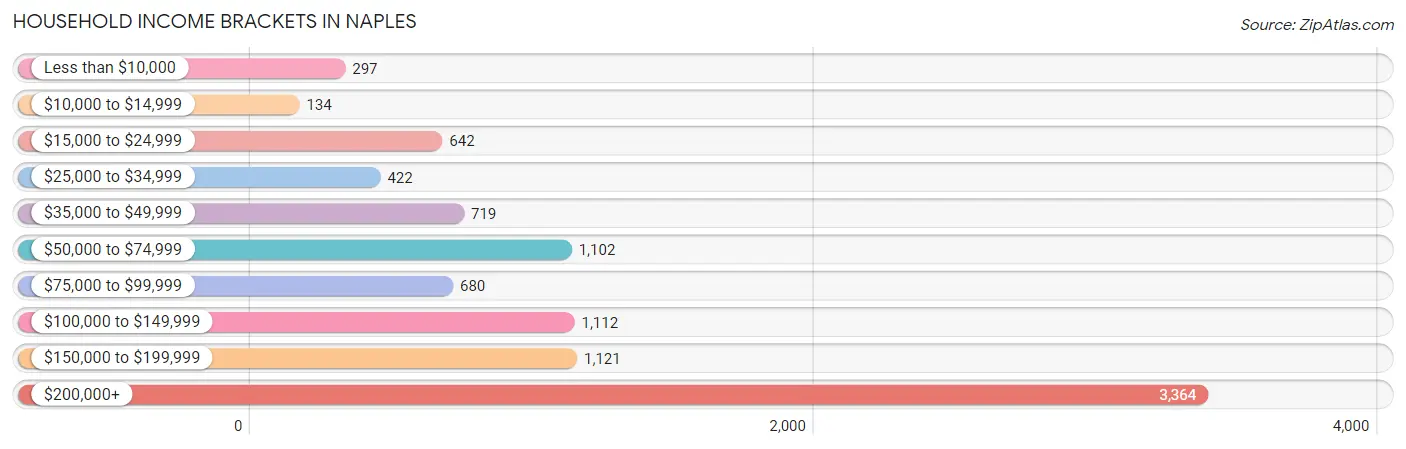
| Income Bracket | # Households | % Households |
| Less than $10,000 | 297 | 3.1% |
| $10,000 to $14,999 | 134 | 1.4% |
| $15,000 to $24,999 | 642 | 6.7% |
| $25,000 to $34,999 | 422 | 4.4% |
| $35,000 to $49,999 | 719 | 7.5% |
| $50,000 to $74,999 | 1,102 | 11.5% |
| $75,000 to $99,999 | 680 | 7.1% |
| $100,000 to $149,999 | 1,112 | 11.6% |
| $150,000 to $199,999 | 1,121 | 11.7% |
| $200,000+ | 3,364 | 35.1% |
Household Income by Householder Age in Naples
The median household income in Naples is $135,657, with the highest median household income of $172,211 found in the 45 to 64 years age bracket for the primary householder. A total of 2,813 households (29.3%) fall into this category. Meanwhile, the 15 to 24 years age bracket for the primary householder has the lowest median household income of $0, with 47 households (0.5%) in this group.
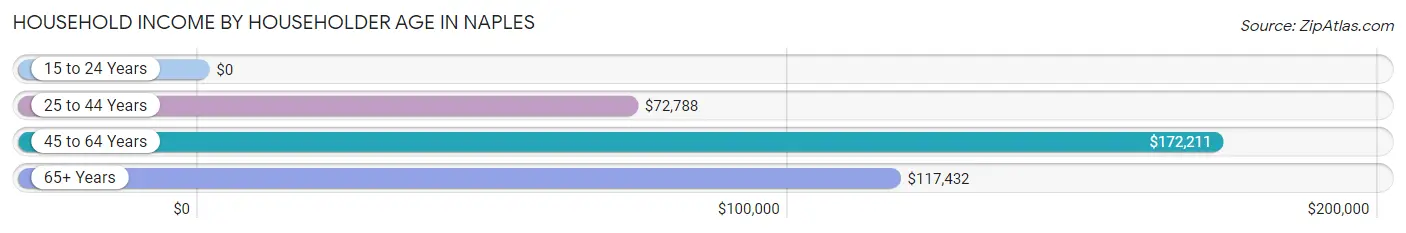
| Income Bracket | # Households | Median Income |
| 15 to 24 Years | 47 (0.5%) | $0 |
| 25 to 44 Years | 565 (5.9%) | $72,788 |
| 45 to 64 Years | 2,813 (29.3%) | $172,211 |
| 65+ Years | 6,158 (64.3%) | $117,432 |
| Total | 9,583 (100.0%) | $135,657 |
Poverty in Naples
Income Below Poverty by Sex and Age in Naples
With 6.3% poverty level for males and 5.8% for females among the residents of Naples, 5 year old males and under 5 year old females are the most vulnerable to poverty, with 60 males (53.6%) and 70 females (23.9%) in their respective age groups living below the poverty level.
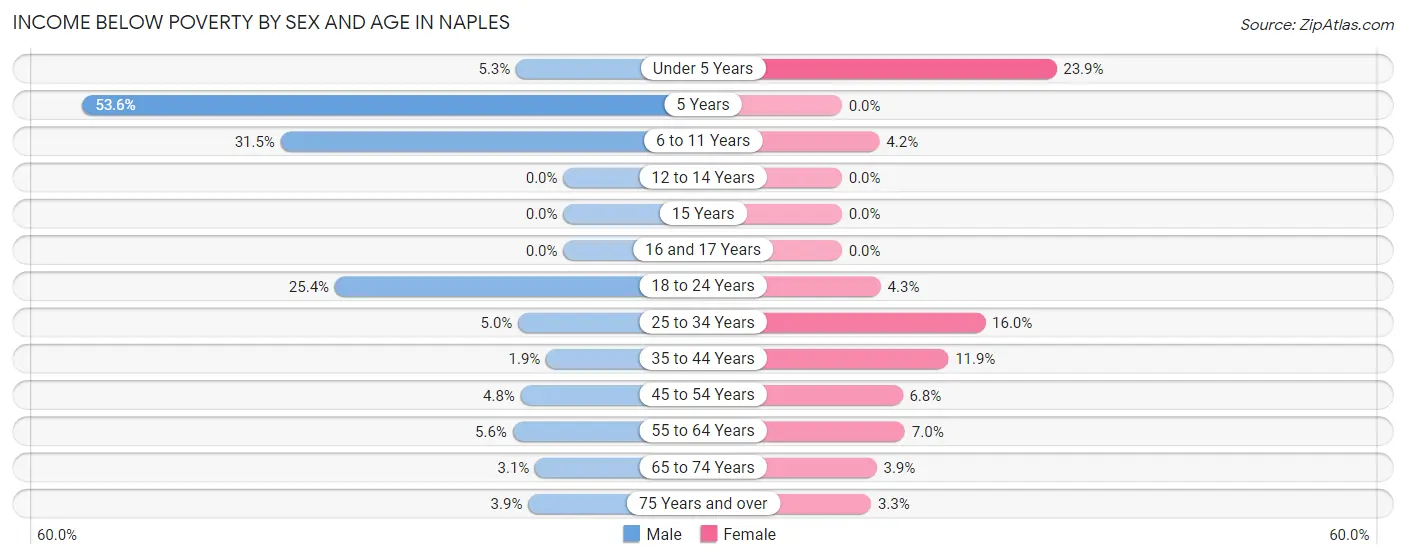
| Age Bracket | Male | Female |
| Under 5 Years | 7 (5.3%) | 70 (23.9%) |
| 5 Years | 60 (53.6%) | 0 (0.0%) |
| 6 to 11 Years | 102 (31.5%) | 14 (4.2%) |
| 12 to 14 Years | 0 (0.0%) | 0 (0.0%) |
| 15 Years | 0 (0.0%) | 0 (0.0%) |
| 16 and 17 Years | 0 (0.0%) | 0 (0.0%) |
| 18 to 24 Years | 73 (25.4%) | 19 (4.3%) |
| 25 to 34 Years | 15 (5.0%) | 68 (16.0%) |
| 35 to 44 Years | 5 (1.9%) | 48 (11.8%) |
| 45 to 54 Years | 44 (4.8%) | 60 (6.8%) |
| 55 to 64 Years | 78 (5.6%) | 110 (7.0%) |
| 65 to 74 Years | 66 (3.1%) | 91 (3.9%) |
| 75 Years and over | 103 (3.9%) | 102 (3.3%) |
| Total | 553 (6.3%) | 582 (5.8%) |
Income Above Poverty by Sex and Age in Naples
According to the poverty statistics in Naples, males aged 12 to 14 years and females aged 5 years are the age groups that are most secure financially, with 100.0% of males and 100.0% of females in these age groups living above the poverty line.
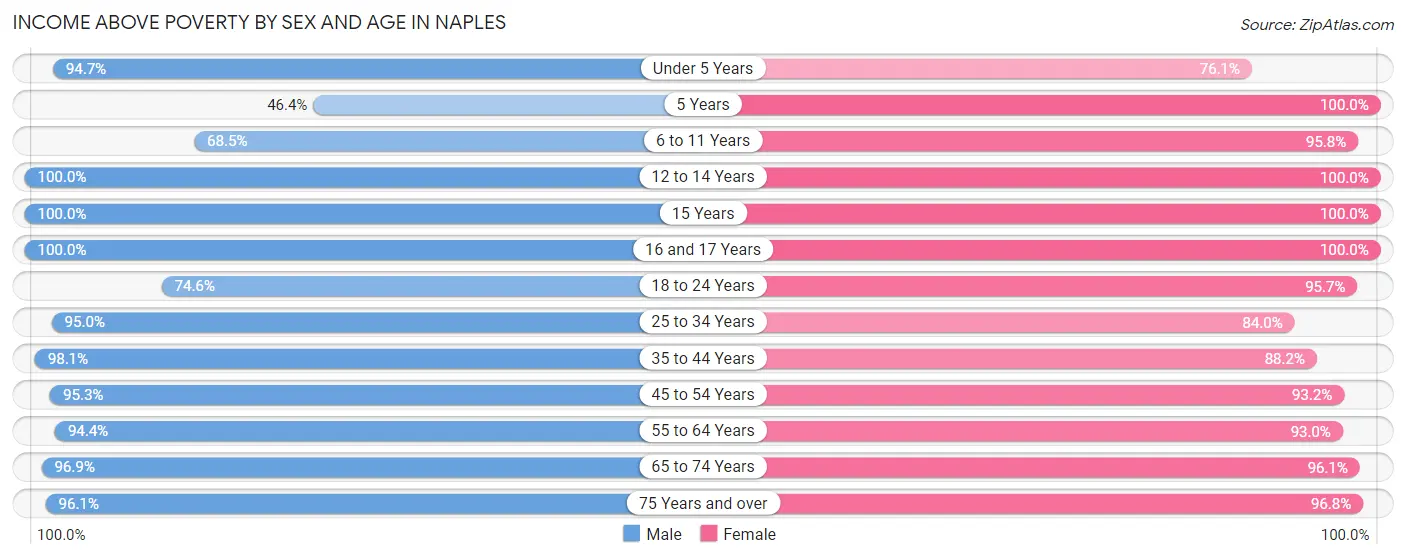
| Age Bracket | Male | Female |
| Under 5 Years | 126 (94.7%) | 223 (76.1%) |
| 5 Years | 52 (46.4%) | 46 (100.0%) |
| 6 to 11 Years | 222 (68.5%) | 320 (95.8%) |
| 12 to 14 Years | 195 (100.0%) | 144 (100.0%) |
| 15 Years | 28 (100.0%) | 18 (100.0%) |
| 16 and 17 Years | 94 (100.0%) | 56 (100.0%) |
| 18 to 24 Years | 214 (74.6%) | 420 (95.7%) |
| 25 to 34 Years | 283 (95.0%) | 358 (84.0%) |
| 35 to 44 Years | 257 (98.1%) | 357 (88.1%) |
| 45 to 54 Years | 882 (95.3%) | 827 (93.2%) |
| 55 to 64 Years | 1,306 (94.4%) | 1,455 (93.0%) |
| 65 to 74 Years | 2,039 (96.9%) | 2,258 (96.1%) |
| 75 Years and over | 2,528 (96.1%) | 3,036 (96.8%) |
| Total | 8,226 (93.7%) | 9,518 (94.2%) |
Income Below Poverty Among Married-Couple Families in Naples
The poverty statistics for married-couple families in Naples show that 2.4% or 126 of the total 5,192 families live below the poverty line. Families with 3 or 4 children have the highest poverty rate of 8.1%, comprising of 8 families. On the other hand, families with 5 or more children have the lowest poverty rate of 0.0%, which includes 0 families.
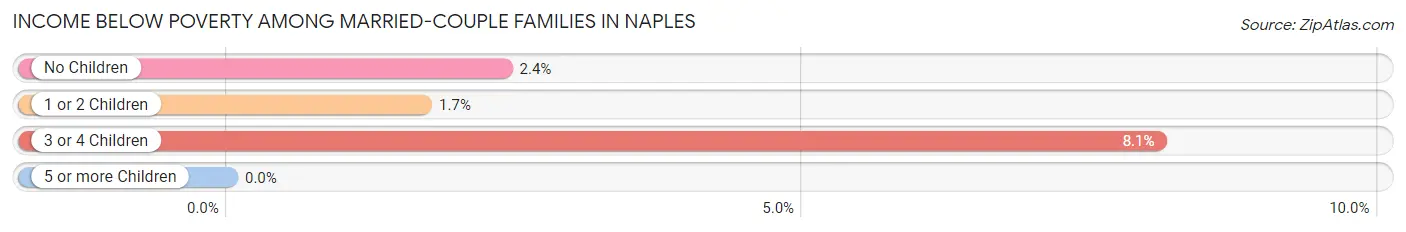
| Children | Above Poverty | Below Poverty |
| No Children | 4,448 (97.6%) | 109 (2.4%) |
| 1 or 2 Children | 522 (98.3%) | 9 (1.7%) |
| 3 or 4 Children | 91 (91.9%) | 8 (8.1%) |
| 5 or more Children | 5 (100.0%) | 0 (0.0%) |
| Total | 5,066 (97.6%) | 126 (2.4%) |
Income Below Poverty Among Single-Parent Households in Naples
According to the poverty data in Naples, 14.9% or 25 single-father households and 15.5% or 45 single-mother households are living below the poverty line. Among single-father households, those with no children have the highest poverty rate, with 25 households (26.6%) experiencing poverty. Likewise, among single-mother households, those with 1 or 2 children have the highest poverty rate, with 45 households (42.1%) falling below the poverty line.
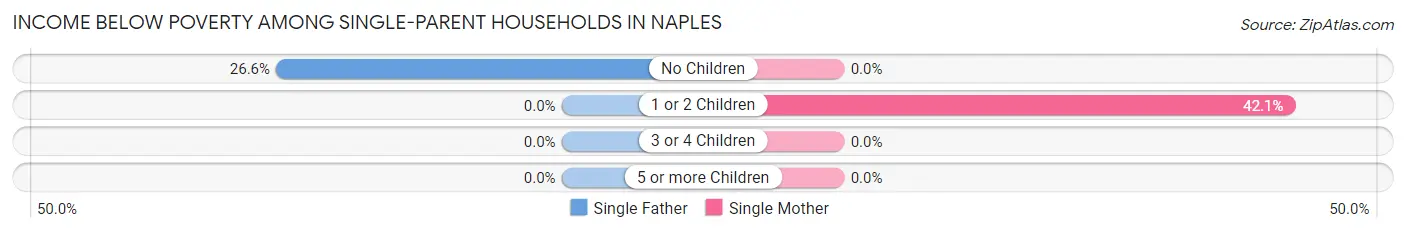
| Children | Single Father | Single Mother |
| No Children | 25 (26.6%) | 0 (0.0%) |
| 1 or 2 Children | 0 (0.0%) | 45 (42.1%) |
| 3 or 4 Children | 0 (0.0%) | 0 (0.0%) |
| 5 or more Children | 0 (0.0%) | 0 (0.0%) |
| Total | 25 (14.9%) | 45 (15.5%) |
Income Below Poverty Among Married-Couple vs Single-Parent Households in Naples
The poverty data for Naples shows that 126 of the married-couple family households (2.4%) and 70 of the single-parent households (15.2%) are living below the poverty level. Within the married-couple family households, those with 3 or 4 children have the highest poverty rate, with 8 households (8.1%) falling below the poverty line. Among the single-parent households, those with 1 or 2 children have the highest poverty rate, with 45 household (24.9%) living below poverty.
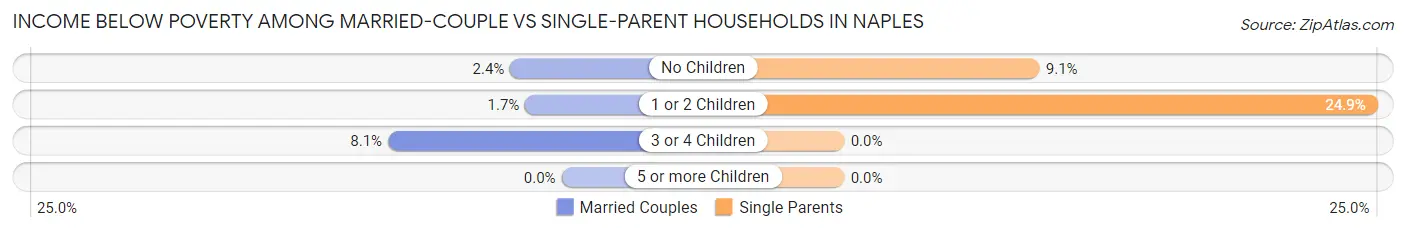
| Children | Married-Couple Families | Single-Parent Households |
| No Children | 109 (2.4%) | 25 (9.1%) |
| 1 or 2 Children | 9 (1.7%) | 45 (24.9%) |
| 3 or 4 Children | 8 (8.1%) | 0 (0.0%) |
| 5 or more Children | 0 (0.0%) | 0 (0.0%) |
| Total | 126 (2.4%) | 70 (15.2%) |
Race in Naples
The most populous races in Naples are White / Caucasian (17,289 | 89.5%), Black / African American (952 | 4.9%), and Hispanic or Latino (851 | 4.4%).
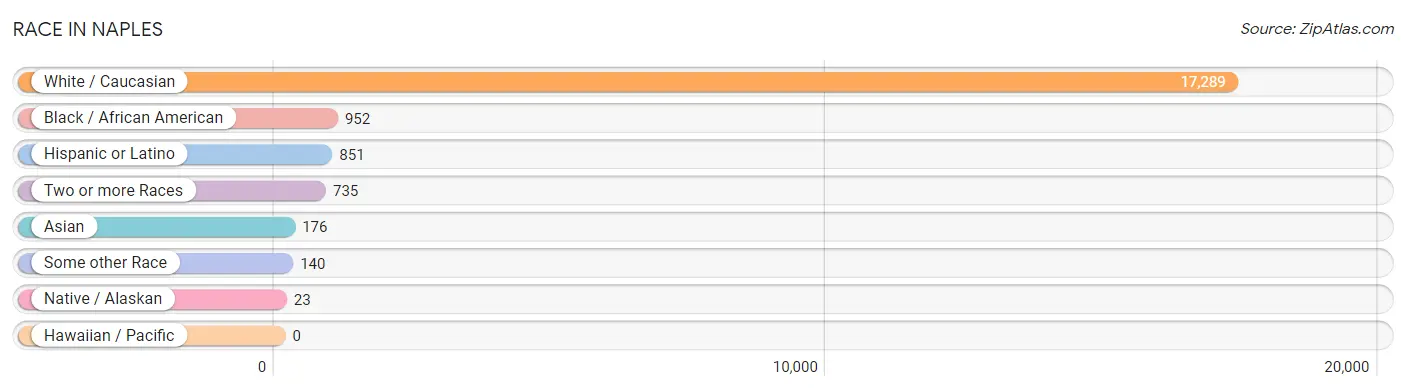
| Race | # Population | % Population |
| Asian | 176 | 0.9% |
| Black / African American | 952 | 4.9% |
| Hawaiian / Pacific | 0 | 0.0% |
| Hispanic or Latino | 851 | 4.4% |
| Native / Alaskan | 23 | 0.1% |
| White / Caucasian | 17,289 | 89.5% |
| Two or more Races | 735 | 3.8% |
| Some other Race | 140 | 0.7% |
| Total | 19,315 | 100.0% |
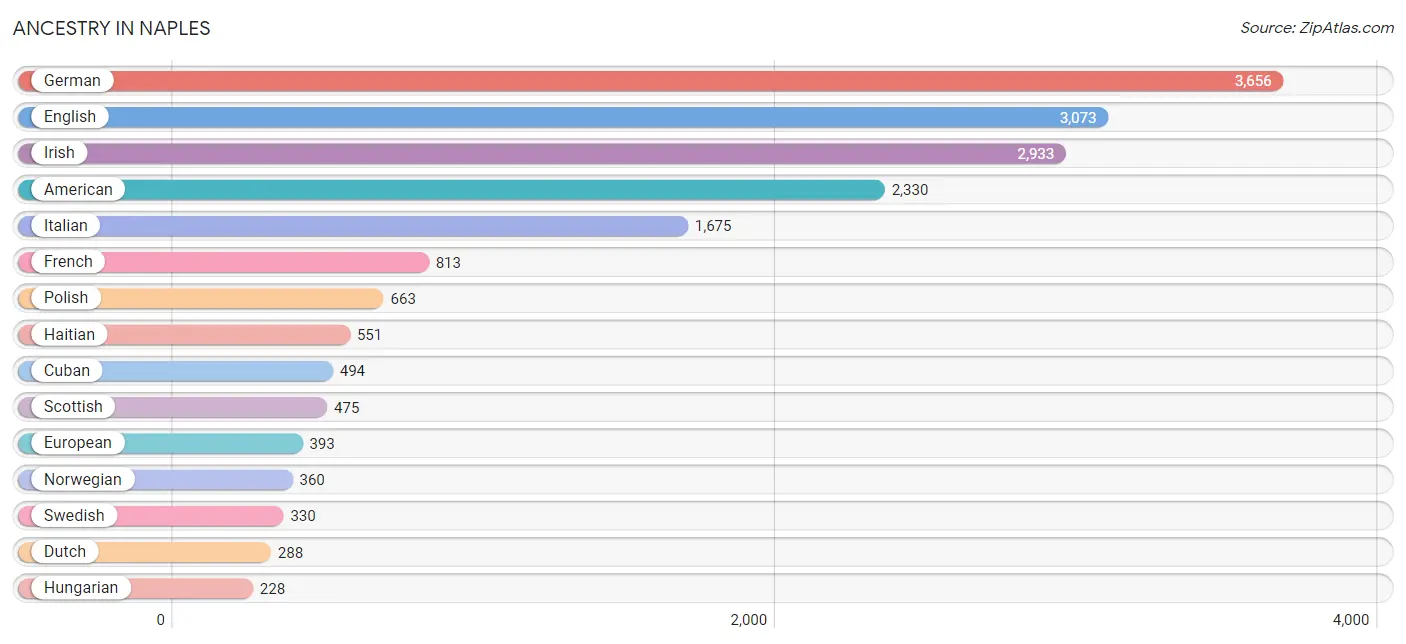
Ancestry in Naples
The most populous ancestries reported in Naples are German (3,656 | 18.9%), English (3,073 | 15.9%), Irish (2,933 | 15.2%), American (2,330 | 12.1%), and Italian (1,675 | 8.7%), together accounting for 70.8% of all Naples residents.
| Ancestry | # Population | % Population |
| Albanian | 109 | 0.6% |
| American | 2,330 | 12.1% |
| Arab | 100 | 0.5% |
| Armenian | 6 | 0.0% |
| Austrian | 68 | 0.4% |
| Belgian | 16 | 0.1% |
| Belizean | 40 | 0.2% |
| Bhutanese | 27 | 0.1% |
| Bolivian | 23 | 0.1% |
| Brazilian | 21 | 0.1% |
| British | 215 | 1.1% |
| Burmese | 5 | 0.0% |
| Cajun | 13 | 0.1% |
| Canadian | 89 | 0.5% |
| Central American | 53 | 0.3% |
| Central American Indian | 16 | 0.1% |
| Choctaw | 15 | 0.1% |
| Colombian | 15 | 0.1% |
| Croatian | 48 | 0.3% |
| Cuban | 494 | 2.6% |
| Czech | 64 | 0.3% |
| Czechoslovakian | 24 | 0.1% |
| Danish | 13 | 0.1% |
| Delaware | 5 | 0.0% |
| Dominican | 14 | 0.1% |
| Dutch | 288 | 1.5% |
| Eastern European | 59 | 0.3% |
| Ecuadorian | 17 | 0.1% |
| Egyptian | 4 | 0.0% |
| English | 3,073 | 15.9% |
| European | 393 | 2.0% |
| Finnish | 4 | 0.0% |
| French | 813 | 4.2% |
| French Canadian | 94 | 0.5% |
| German | 3,656 | 18.9% |
| Greek | 109 | 0.6% |
| Guatemalan | 37 | 0.2% |
| Haitian | 551 | 2.9% |
| Hungarian | 228 | 1.2% |
| Indian (Asian) | 5 | 0.0% |
| Iranian | 3 | 0.0% |
| Irish | 2,933 | 15.2% |
| Israeli | 6 | 0.0% |
| Italian | 1,675 | 8.7% |
| Jamaican | 33 | 0.2% |
| Jordanian | 19 | 0.1% |
| Korean | 84 | 0.4% |
| Lebanese | 48 | 0.3% |
| Lithuanian | 78 | 0.4% |
| Luxembourger | 10 | 0.1% |
| Macedonian | 17 | 0.1% |
| Mexican | 3 | 0.0% |
| Nicaraguan | 15 | 0.1% |
| Northern European | 43 | 0.2% |
| Norwegian | 360 | 1.9% |
| Pakistani | 6 | 0.0% |
| Panamanian | 1 | 0.0% |
| Peruvian | 7 | 0.0% |
| Polish | 663 | 3.4% |
| Portuguese | 46 | 0.2% |
| Puerto Rican | 87 | 0.4% |
| Romanian | 45 | 0.2% |
| Russian | 182 | 0.9% |
| Scandinavian | 74 | 0.4% |
| Scotch-Irish | 159 | 0.8% |
| Scottish | 475 | 2.5% |
| Seminole | 3 | 0.0% |
| Serbian | 23 | 0.1% |
| Slavic | 18 | 0.1% |
| Slovak | 56 | 0.3% |
| Slovene | 15 | 0.1% |
| South American | 79 | 0.4% |
| Spaniard | 60 | 0.3% |
| Spanish | 15 | 0.1% |
| Sri Lankan | 19 | 0.1% |
| Subsaharan African | 19 | 0.1% |
| Swedish | 330 | 1.7% |
| Swiss | 134 | 0.7% |
| Syrian | 17 | 0.1% |
| Thai | 64 | 0.3% |
| Turkish | 18 | 0.1% |
| Ukrainian | 97 | 0.5% |
| Venezuelan | 17 | 0.1% |
| Welsh | 223 | 1.1% |
| West Indian | 5 | 0.0% |
| Yaqui | 8 | 0.0% |
| Yugoslavian | 6 | 0.0% | View All 87 Rows |
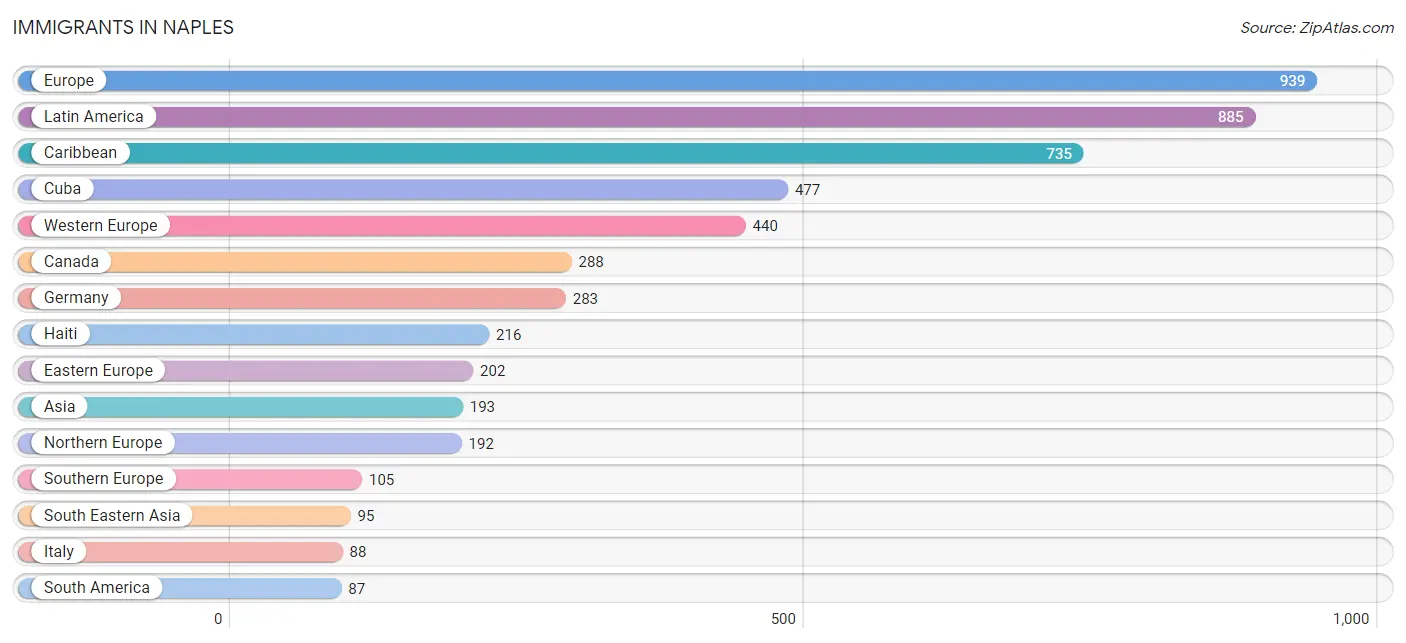
Immigrants in Naples
The most numerous immigrant groups reported in Naples came from Europe (939 | 4.9%), Latin America (885 | 4.6%), Caribbean (735 | 3.8%), Cuba (477 | 2.5%), and Western Europe (440 | 2.3%), together accounting for 18.0% of all Naples residents.
| Immigration Origin | # Population | % Population |
| Africa | 64 | 0.3% |
| Albania | 73 | 0.4% |
| Argentina | 5 | 0.0% |
| Asia | 193 | 1.0% |
| Austria | 10 | 0.1% |
| Belgium | 11 | 0.1% |
| Belize | 12 | 0.1% |
| Bolivia | 10 | 0.1% |
| Brazil | 11 | 0.1% |
| Cambodia | 6 | 0.0% |
| Canada | 288 | 1.5% |
| Caribbean | 735 | 3.8% |
| Central America | 63 | 0.3% |
| China | 5 | 0.0% |
| Colombia | 17 | 0.1% |
| Cuba | 477 | 2.5% |
| Dominican Republic | 4 | 0.0% |
| Eastern Africa | 26 | 0.1% |
| Eastern Asia | 27 | 0.1% |
| Eastern Europe | 202 | 1.1% |
| Ecuador | 9 | 0.1% |
| Egypt | 21 | 0.1% |
| England | 64 | 0.3% |
| Europe | 939 | 4.9% |
| France | 15 | 0.1% |
| Germany | 283 | 1.5% |
| Guatemala | 9 | 0.1% |
| Haiti | 216 | 1.1% |
| Hungary | 43 | 0.2% |
| India | 6 | 0.0% |
| Iran | 3 | 0.0% |
| Ireland | 12 | 0.1% |
| Israel | 15 | 0.1% |
| Italy | 88 | 0.5% |
| Jamaica | 38 | 0.2% |
| Japan | 22 | 0.1% |
| Jordan | 22 | 0.1% |
| Latin America | 885 | 4.6% |
| Lebanon | 6 | 0.0% |
| Mexico | 24 | 0.1% |
| Netherlands | 59 | 0.3% |
| Nicaragua | 15 | 0.1% |
| Northern Africa | 21 | 0.1% |
| Northern Europe | 192 | 1.0% |
| Norway | 16 | 0.1% |
| Oceania | 4 | 0.0% |
| Panama | 3 | 0.0% |
| Peru | 7 | 0.0% |
| Philippines | 64 | 0.3% |
| Poland | 29 | 0.2% |
| Romania | 34 | 0.2% |
| Russia | 7 | 0.0% |
| South Africa | 17 | 0.1% |
| South America | 87 | 0.4% |
| South Central Asia | 20 | 0.1% |
| South Eastern Asia | 95 | 0.5% |
| Southern Europe | 105 | 0.5% |
| Spain | 17 | 0.1% |
| Sweden | 15 | 0.1% |
| Switzerland | 52 | 0.3% |
| Thailand | 6 | 0.0% |
| Turkey | 8 | 0.0% |
| Ukraine | 16 | 0.1% |
| Uruguay | 11 | 0.1% |
| Venezuela | 17 | 0.1% |
| Vietnam | 19 | 0.1% |
| Western Asia | 51 | 0.3% |
| Western Europe | 440 | 2.3% |
| Zimbabwe | 7 | 0.0% | View All 69 Rows |
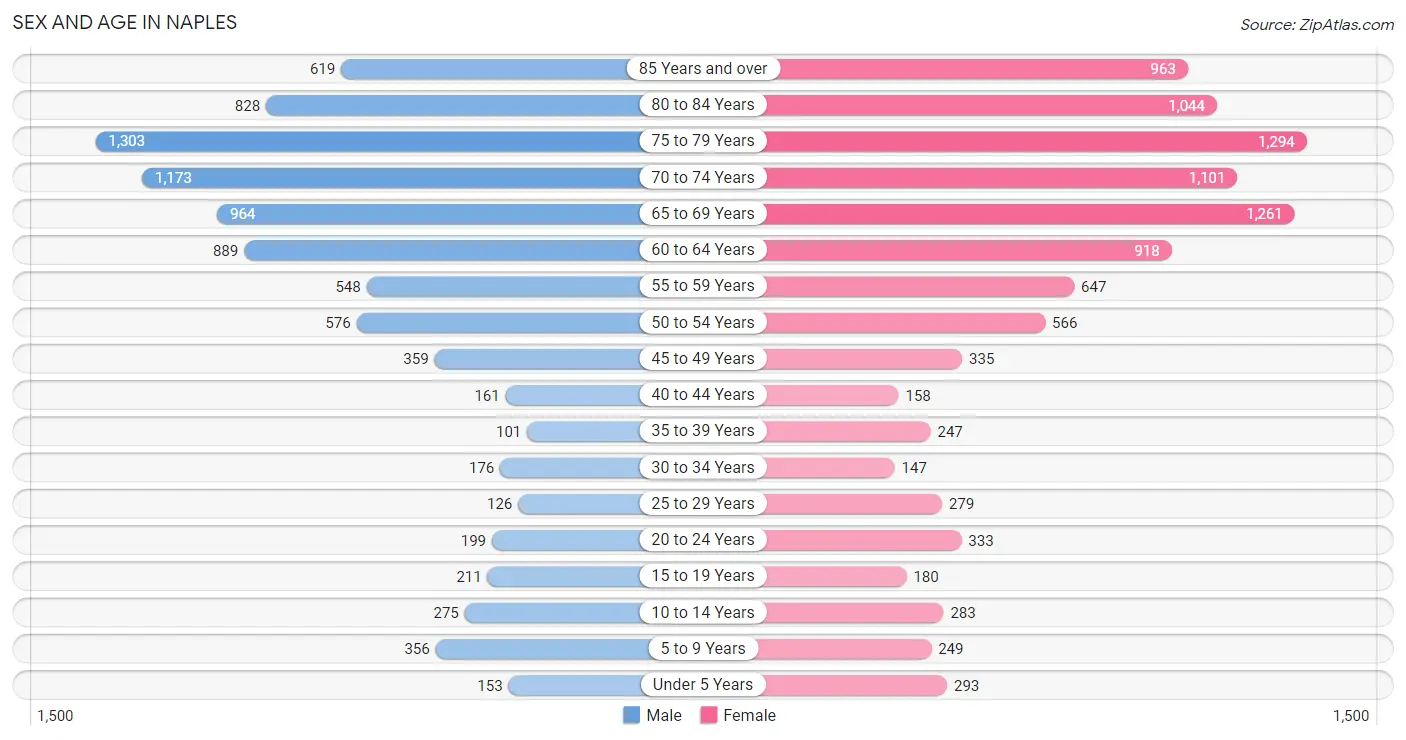
Sex and Age in Naples
Sex and Age in Naples
The most populous age groups in Naples are 75 to 79 Years (1,303 | 14.4%) for men and 75 to 79 Years (1,294 | 12.6%) for women.
| Age Bracket | Male | Female |
| Under 5 Years | 153 (1.7%) | 293 (2.9%) |
| 5 to 9 Years | 356 (4.0%) | 249 (2.4%) |
| 10 to 14 Years | 275 (3.0%) | 283 (2.8%) |
| 15 to 19 Years | 211 (2.3%) | 180 (1.8%) |
| 20 to 24 Years | 199 (2.2%) | 333 (3.2%) |
| 25 to 29 Years | 126 (1.4%) | 279 (2.7%) |
| 30 to 34 Years | 176 (1.9%) | 147 (1.4%) |
| 35 to 39 Years | 101 (1.1%) | 247 (2.4%) |
| 40 to 44 Years | 161 (1.8%) | 158 (1.5%) |
| 45 to 49 Years | 359 (4.0%) | 335 (3.3%) |
| 50 to 54 Years | 576 (6.4%) | 566 (5.5%) |
| 55 to 59 Years | 548 (6.1%) | 647 (6.3%) |
| 60 to 64 Years | 889 (9.9%) | 918 (8.9%) |
| 65 to 69 Years | 964 (10.7%) | 1,261 (12.2%) |
| 70 to 74 Years | 1,173 (13.0%) | 1,101 (10.7%) |
| 75 to 79 Years | 1,303 (14.4%) | 1,294 (12.6%) |
| 80 to 84 Years | 828 (9.2%) | 1,044 (10.1%) |
| 85 Years and over | 619 (6.9%) | 963 (9.3%) |
| Total | 9,017 (100.0%) | 10,298 (100.0%) |
Families and Households in Naples
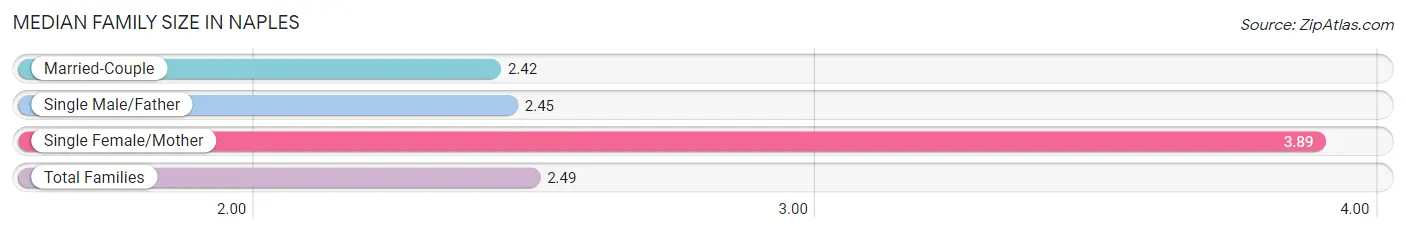
Median Family Size in Naples
The median family size in Naples is 2.49 persons per family, with single female/mother families (291 | 5.1%) accounting for the largest median family size of 3.89 persons per family. On the other hand, married-couple families (5,192 | 91.9%) represent the smallest median family size with 2.42 persons per family.
| Family Type | # Families | Family Size |
| Married-Couple | 5,192 (91.9%) | 2.42 |
| Single Male/Father | 168 (3.0%) | 2.45 |
| Single Female/Mother | 291 (5.1%) | 3.89 |
| Total Families | 5,651 (100.0%) | 2.49 |
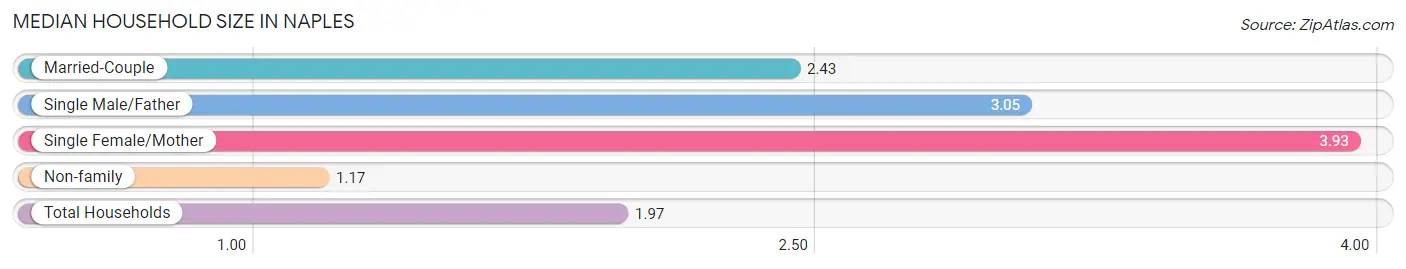
Median Household Size in Naples
The median household size in Naples is 1.97 persons per household, with single female/mother households (291 | 3.0%) accounting for the largest median household size of 3.93 persons per household. non-family households (3,932 | 41.0%) represent the smallest median household size with 1.17 persons per household.
| Household Type | # Households | Household Size |
| Married-Couple | 5,192 (54.2%) | 2.43 |
| Single Male/Father | 168 (1.8%) | 3.05 |
| Single Female/Mother | 291 (3.0%) | 3.93 |
| Non-family | 3,932 (41.0%) | 1.17 |
| Total Households | 9,583 (100.0%) | 1.97 |
Household Size by Marriage Status in Naples
Out of a total of 9,583 households in Naples, 5,651 (59.0%) are family households, while 3,932 (41.0%) are nonfamily households. The most numerous type of family households are 2-person households, comprising 4,522, and the most common type of nonfamily households are 1-person households, comprising 3,499.
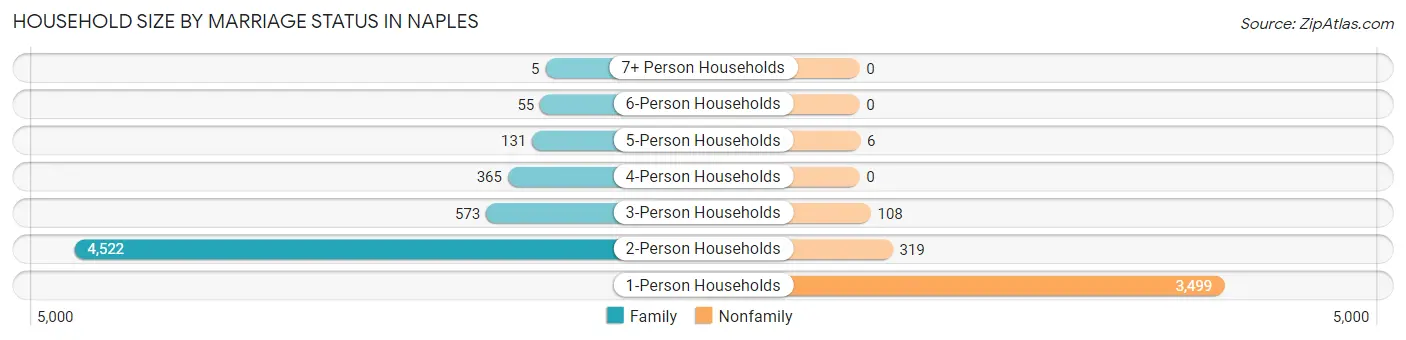
| Household Size | Family Households | Nonfamily Households |
| 1-Person Households | - | 3,499 (36.5%) |
| 2-Person Households | 4,522 (47.2%) | 319 (3.3%) |
| 3-Person Households | 573 (6.0%) | 108 (1.1%) |
| 4-Person Households | 365 (3.8%) | 0 (0.0%) |
| 5-Person Households | 131 (1.4%) | 6 (0.1%) |
| 6-Person Households | 55 (0.6%) | 0 (0.0%) |
| 7+ Person Households | 5 (0.1%) | 0 (0.0%) |
| Total | 5,651 (59.0%) | 3,932 (41.0%) |
Female Fertility in Naples
Fertility by Age in Naples
Average fertility rate in Naples is 70.0 births per 1,000 women. Women in the age bracket of 35 to 50 years have the highest fertility rate with 88.0 births per 1,000 women. Women in the age bracket of 35 to 50 years acount for 59.4% of all women with births.
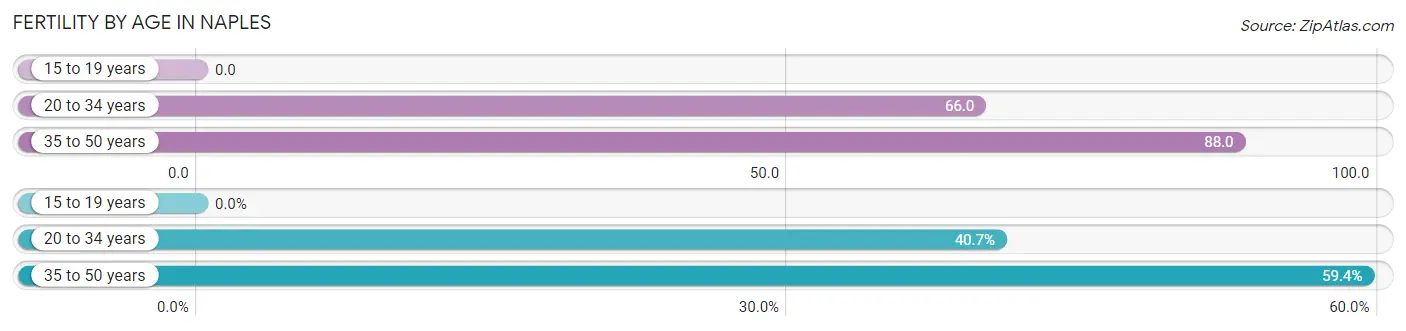
| Age Bracket | Women with Births | Births / 1,000 Women |
| 15 to 19 years | 0 (0.0%) | 0.0 |
| 20 to 34 years | 50 (40.6%) | 66.0 |
| 35 to 50 years | 73 (59.4%) | 88.0 |
| Total | 123 (100.0%) | 70.0 |
Fertility by Age by Marriage Status in Naples
61.8% of women with births (123) in Naples are married. The highest percentage of unmarried women with births falls into 35 to 50 years age bracket with 64.4% of them unmarried at the time of birth, while the lowest percentage of unmarried women with births belong to 20 to 34 years age bracket with 0.0% of them unmarried.
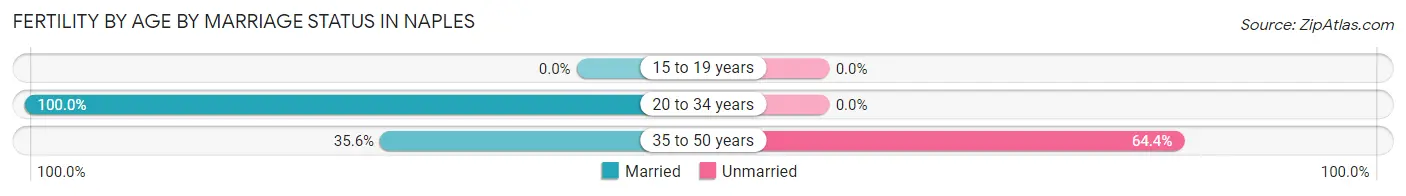
| Age Bracket | Married | Unmarried |
| 15 to 19 years | 0 (0.0%) | 0 (0.0%) |
| 20 to 34 years | 50 (100.0%) | 0 (0.0%) |
| 35 to 50 years | 26 (35.6%) | 47 (64.4%) |
| Total | 76 (61.8%) | 47 (38.2%) |
Fertility by Education in Naples
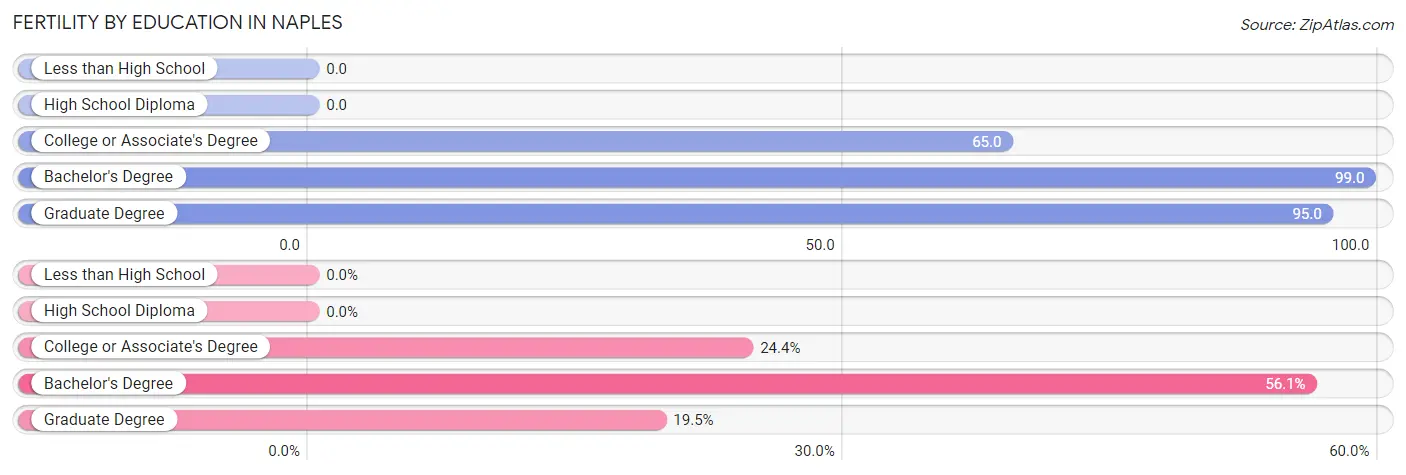
| Educational Attainment | Women with Births | Births / 1,000 Women |
| Less than High School | 0 (0.0%) | 0.0 |
| High School Diploma | 0 (0.0%) | 0.0 |
| College or Associate's Degree | 30 (24.4%) | 65.0 |
| Bachelor's Degree | 69 (56.1%) | 99.0 |
| Graduate Degree | 24 (19.5%) | 95.0 |
| Total | 123 (100.0%) | 70.0 |
Fertility by Education by Marriage Status in Naples
38.2% of women with births in Naples are unmarried. Women with the educational attainment of college or associate's degree are most likely to be married with 100.0% of them married at childbirth, while women with the educational attainment of bachelor's degree are least likely to be married with 68.1% of them unmarried at childbirth.
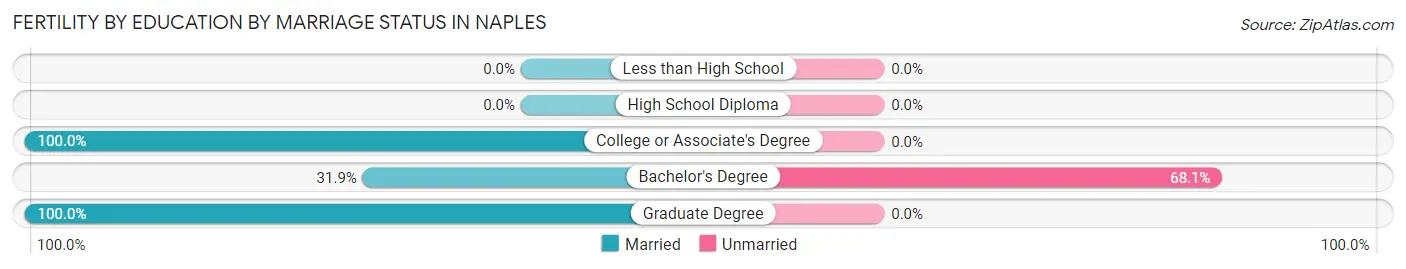
| Educational Attainment | Married | Unmarried |
| Less than High School | 0 (0.0%) | 0 (0.0%) |
| High School Diploma | 0 (0.0%) | 0 (0.0%) |
| College or Associate's Degree | 30 (100.0%) | 0 (0.0%) |
| Bachelor's Degree | 22 (31.9%) | 47 (68.1%) |
| Graduate Degree | 24 (100.0%) | 0 (0.0%) |
| Total | 76 (61.8%) | 47 (38.2%) |
Employment Characteristics in Naples
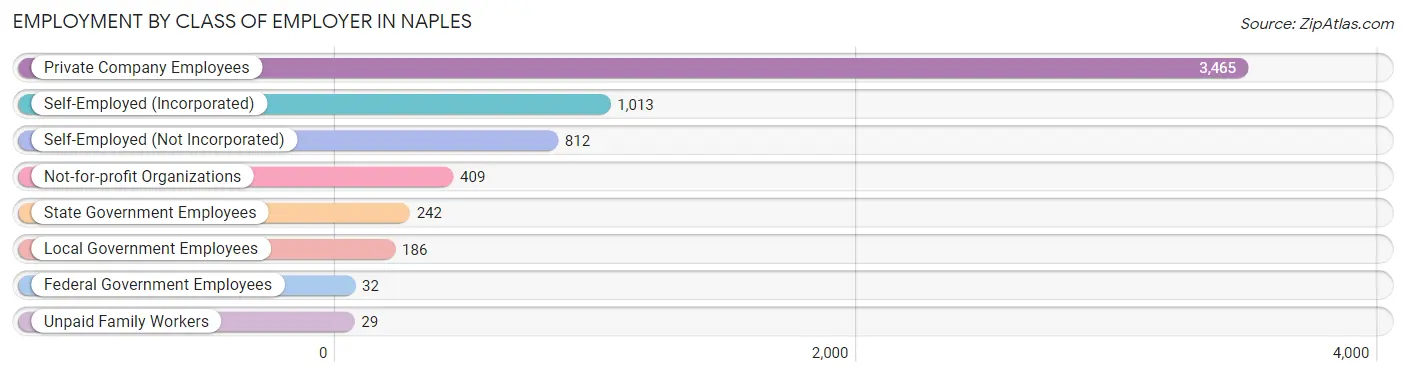
Employment by Class of Employer in Naples
Among the 6,188 employed individuals in Naples, private company employees (3,465 | 56.0%), self-employed (incorporated) (1,013 | 16.4%), and self-employed (not incorporated) (812 | 13.1%) make up the most common classes of employment.
| Employer Class | # Employees | % Employees |
| Private Company Employees | 3,465 | 56.0% |
| Self-Employed (Incorporated) | 1,013 | 16.4% |
| Self-Employed (Not Incorporated) | 812 | 13.1% |
| Not-for-profit Organizations | 409 | 6.6% |
| Local Government Employees | 186 | 3.0% |
| State Government Employees | 242 | 3.9% |
| Federal Government Employees | 32 | 0.5% |
| Unpaid Family Workers | 29 | 0.5% |
| Total | 6,188 | 100.0% |
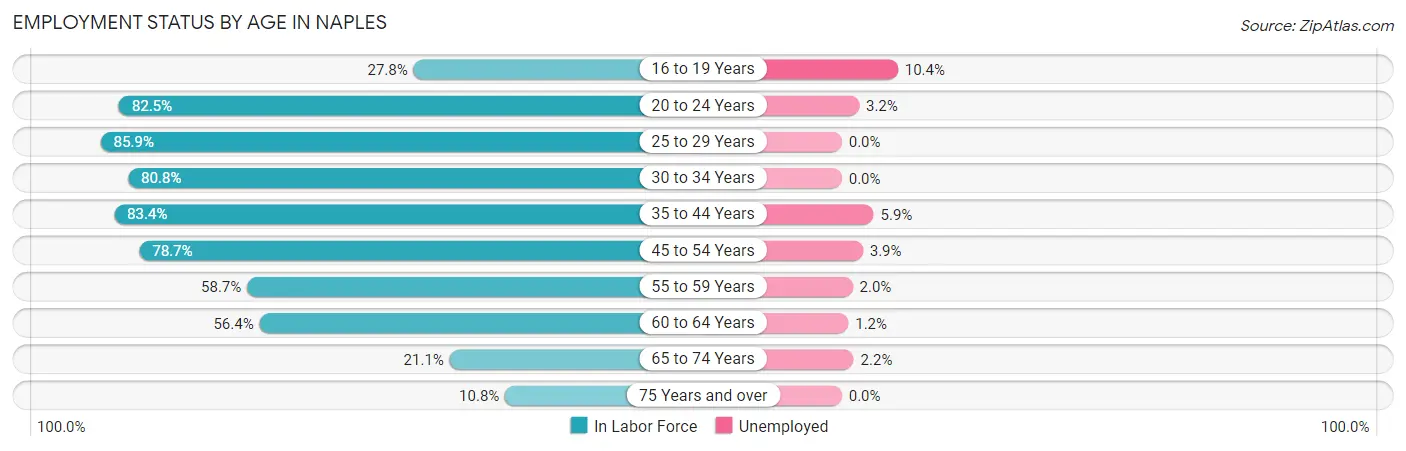
Employment Status by Age in Naples
According to the labor force statistics for Naples, out of the total population over 16 years of age (17,660), 36.6% or 6,464 individuals are in the labor force, with 2.5% or 162 of them unemployed. The age group with the highest labor force participation rate is 25 to 29 years, with 85.9% or 348 individuals in the labor force. Within the labor force, the 16 to 19 years age range has the highest percentage of unemployed individuals, with 10.4% or 10 of them being unemployed.
| Age Bracket | In Labor Force | Unemployed |
| 16 to 19 Years | 96 (27.8%) | 10 (10.4%) |
| 20 to 24 Years | 439 (82.5%) | 14 (3.2%) |
| 25 to 29 Years | 348 (85.9%) | 0 (0.0%) |
| 30 to 34 Years | 261 (80.8%) | 0 (0.0%) |
| 35 to 44 Years | 556 (83.4%) | 33 (5.9%) |
| 45 to 54 Years | 1,445 (78.7%) | 56 (3.9%) |
| 55 to 59 Years | 701 (58.7%) | 14 (2.0%) |
| 60 to 64 Years | 1,019 (56.4%) | 12 (1.2%) |
| 65 to 74 Years | 949 (21.1%) | 21 (2.2%) |
| 75 Years and over | 654 (10.8%) | 0 (0.0%) |
| Total | 6,464 (36.6%) | 162 (2.5%) |
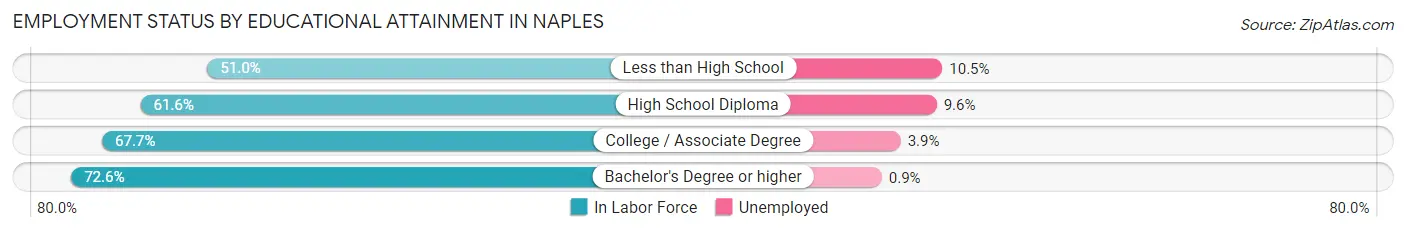
Employment Status by Educational Attainment in Naples
According to labor force statistics for Naples, 69.5% of individuals (4,332) out of the total population between 25 and 64 years of age (6,233) are in the labor force, with 2.7% or 117 of them being unemployed. The group with the highest labor force participation rate are those with the educational attainment of bachelor's degree or higher, with 72.6% or 2,951 individuals in the labor force. Within the labor force, individuals with less than high school education have the highest percentage of unemployment, with 10.5% or 13 of them being unemployed.
| Educational Attainment | In Labor Force | Unemployed |
| Less than High School | 124 (51.0%) | 26 (10.5%) |
| High School Diploma | 490 (61.6%) | 76 (9.6%) |
| College / Associate Degree | 765 (67.7%) | 44 (3.9%) |
| Bachelor's Degree or higher | 2,951 (72.6%) | 37 (0.9%) |
| Total | 4,332 (69.5%) | 168 (2.7%) |
Employment Occupations by Sex in Naples
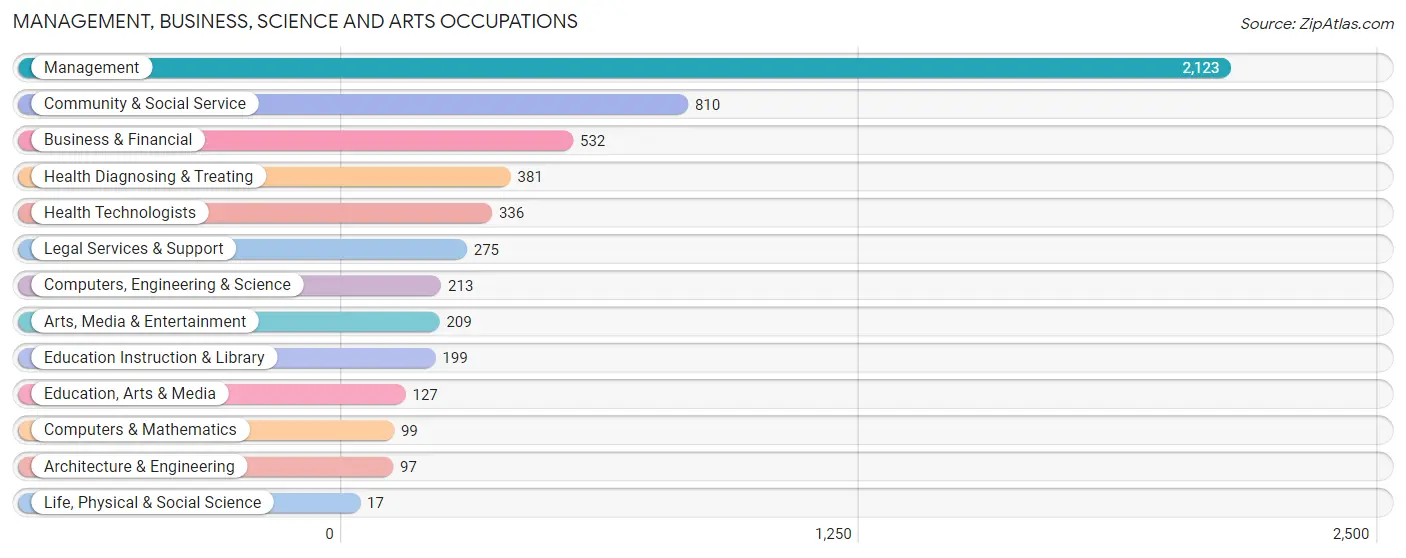
Management, Business, Science and Arts Occupations
The most common Management, Business, Science and Arts occupations in Naples are Management (2,123 | 33.7%), Community & Social Service (810 | 12.8%), Business & Financial (532 | 8.4%), Health Diagnosing & Treating (381 | 6.0%), and Health Technologists (336 | 5.3%).
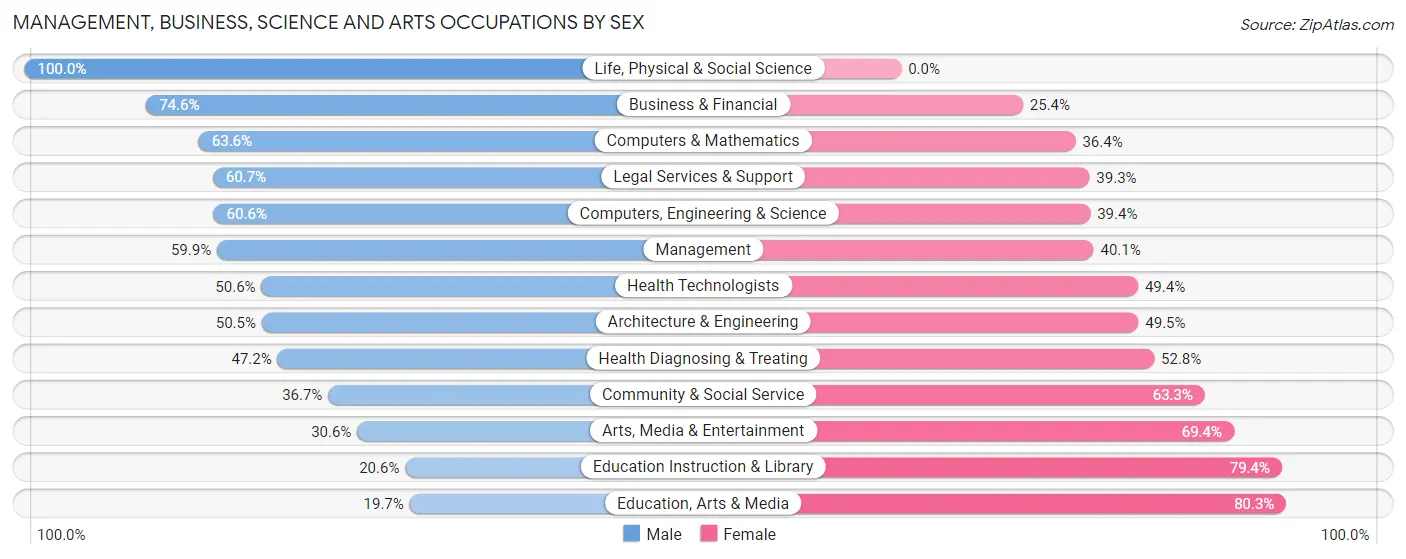
Management, Business, Science and Arts Occupations by Sex
Within the Management, Business, Science and Arts occupations in Naples, the most male-oriented occupations are Life, Physical & Social Science (100.0%), Business & Financial (74.6%), and Computers & Mathematics (63.6%), while the most female-oriented occupations are Education, Arts & Media (80.3%), Education Instruction & Library (79.4%), and Arts, Media & Entertainment (69.4%).
| Occupation | Male | Female |
| Management | 1,271 (59.9%) | 852 (40.1%) |
| Business & Financial | 397 (74.6%) | 135 (25.4%) |
| Computers, Engineering & Science | 129 (60.6%) | 84 (39.4%) |
| Computers & Mathematics | 63 (63.6%) | 36 (36.4%) |
| Architecture & Engineering | 49 (50.5%) | 48 (49.5%) |
| Life, Physical & Social Science | 17 (100.0%) | 0 (0.0%) |
| Community & Social Service | 297 (36.7%) | 513 (63.3%) |
| Education, Arts & Media | 25 (19.7%) | 102 (80.3%) |
| Legal Services & Support | 167 (60.7%) | 108 (39.3%) |
| Education Instruction & Library | 41 (20.6%) | 158 (79.4%) |
| Arts, Media & Entertainment | 64 (30.6%) | 145 (69.4%) |
| Health Diagnosing & Treating | 180 (47.2%) | 201 (52.8%) |
| Health Technologists | 170 (50.6%) | 166 (49.4%) |
| Total (Category) | 2,274 (56.0%) | 1,785 (44.0%) |
| Total (Overall) | 3,518 (55.7%) | 2,792 (44.3%) |
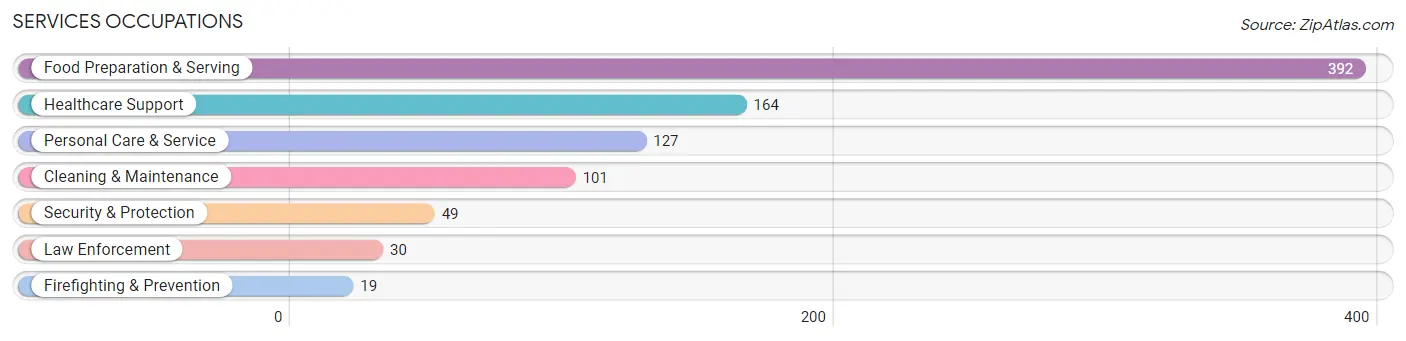
Services Occupations
The most common Services occupations in Naples are Food Preparation & Serving (392 | 6.2%), Healthcare Support (164 | 2.6%), Personal Care & Service (127 | 2.0%), Cleaning & Maintenance (101 | 1.6%), and Security & Protection (49 | 0.8%).
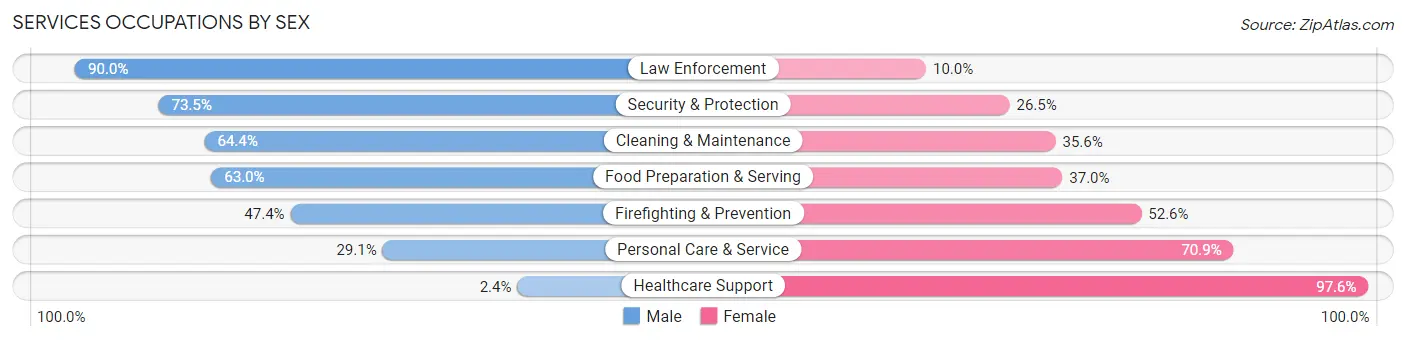
Services Occupations by Sex
Within the Services occupations in Naples, the most male-oriented occupations are Law Enforcement (90.0%), Security & Protection (73.5%), and Cleaning & Maintenance (64.4%), while the most female-oriented occupations are Healthcare Support (97.6%), Personal Care & Service (70.9%), and Firefighting & Prevention (52.6%).
| Occupation | Male | Female |
| Healthcare Support | 4 (2.4%) | 160 (97.6%) |
| Security & Protection | 36 (73.5%) | 13 (26.5%) |
| Firefighting & Prevention | 9 (47.4%) | 10 (52.6%) |
| Law Enforcement | 27 (90.0%) | 3 (10.0%) |
| Food Preparation & Serving | 247 (63.0%) | 145 (37.0%) |
| Cleaning & Maintenance | 65 (64.4%) | 36 (35.6%) |
| Personal Care & Service | 37 (29.1%) | 90 (70.9%) |
| Total (Category) | 389 (46.7%) | 444 (53.3%) |
| Total (Overall) | 3,518 (55.7%) | 2,792 (44.3%) |
Sales and Office Occupations
The most common Sales and Office occupations in Naples are Sales & Related (892 | 14.1%), and Office & Administration (179 | 2.8%).
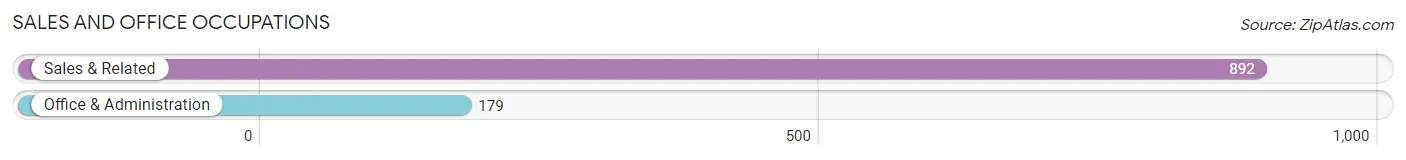
Sales and Office Occupations by Sex

| Occupation | Male | Female |
| Sales & Related | 503 (56.4%) | 389 (43.6%) |
| Office & Administration | 35 (19.6%) | 144 (80.4%) |
| Total (Category) | 538 (50.2%) | 533 (49.8%) |
| Total (Overall) | 3,518 (55.7%) | 2,792 (44.3%) |
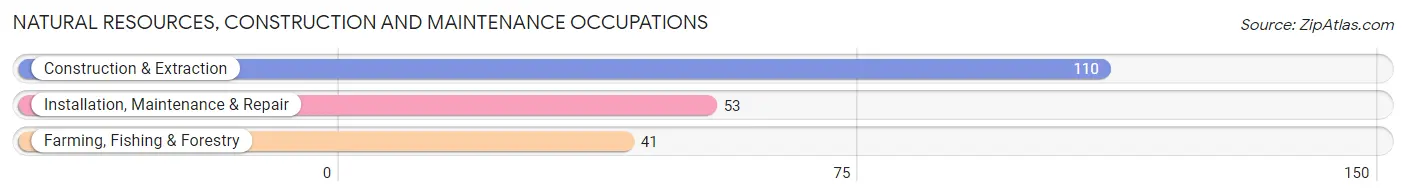
Natural Resources, Construction and Maintenance Occupations
The most common Natural Resources, Construction and Maintenance occupations in Naples are Construction & Extraction (110 | 1.7%), Installation, Maintenance & Repair (53 | 0.8%), and Farming, Fishing & Forestry (41 | 0.6%).
Natural Resources, Construction and Maintenance Occupations by Sex
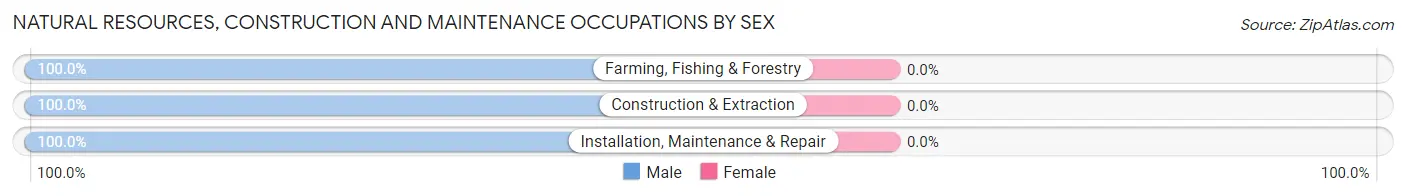
| Occupation | Male | Female |
| Farming, Fishing & Forestry | 41 (100.0%) | 0 (0.0%) |
| Construction & Extraction | 110 (100.0%) | 0 (0.0%) |
| Installation, Maintenance & Repair | 53 (100.0%) | 0 (0.0%) |
| Total (Category) | 204 (100.0%) | 0 (0.0%) |
| Total (Overall) | 3,518 (55.7%) | 2,792 (44.3%) |
Production, Transportation and Moving Occupations
The most common Production, Transportation and Moving occupations in Naples are Transportation (74 | 1.2%), Production (39 | 0.6%), and Material Moving (30 | 0.5%).
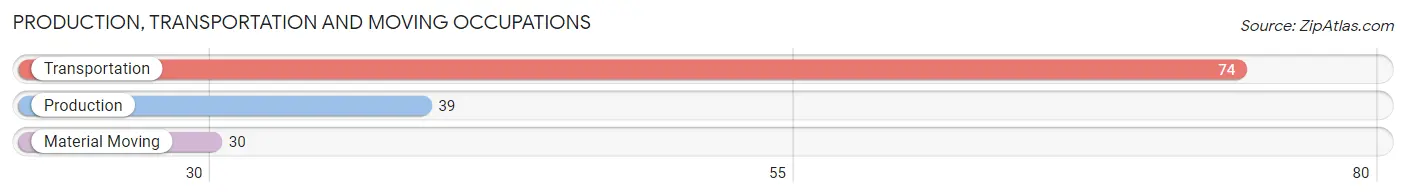
Production, Transportation and Moving Occupations by Sex
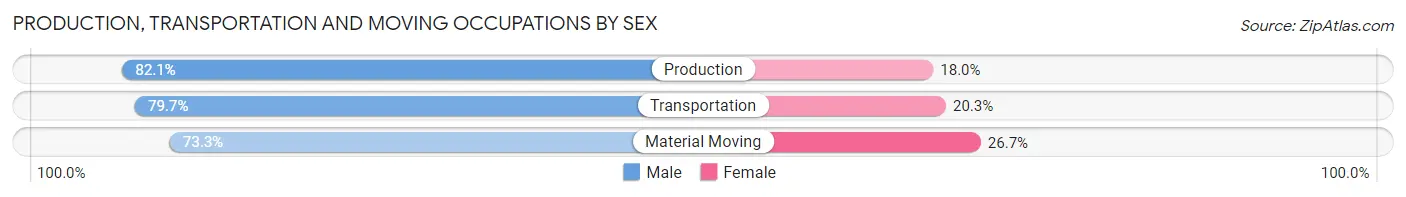
| Occupation | Male | Female |
| Production | 32 (82.1%) | 7 (17.9%) |
| Transportation | 59 (79.7%) | 15 (20.3%) |
| Material Moving | 22 (73.3%) | 8 (26.7%) |
| Total (Category) | 113 (79.0%) | 30 (21.0%) |
| Total (Overall) | 3,518 (55.7%) | 2,792 (44.3%) |
Employment Industries by Sex in Naples
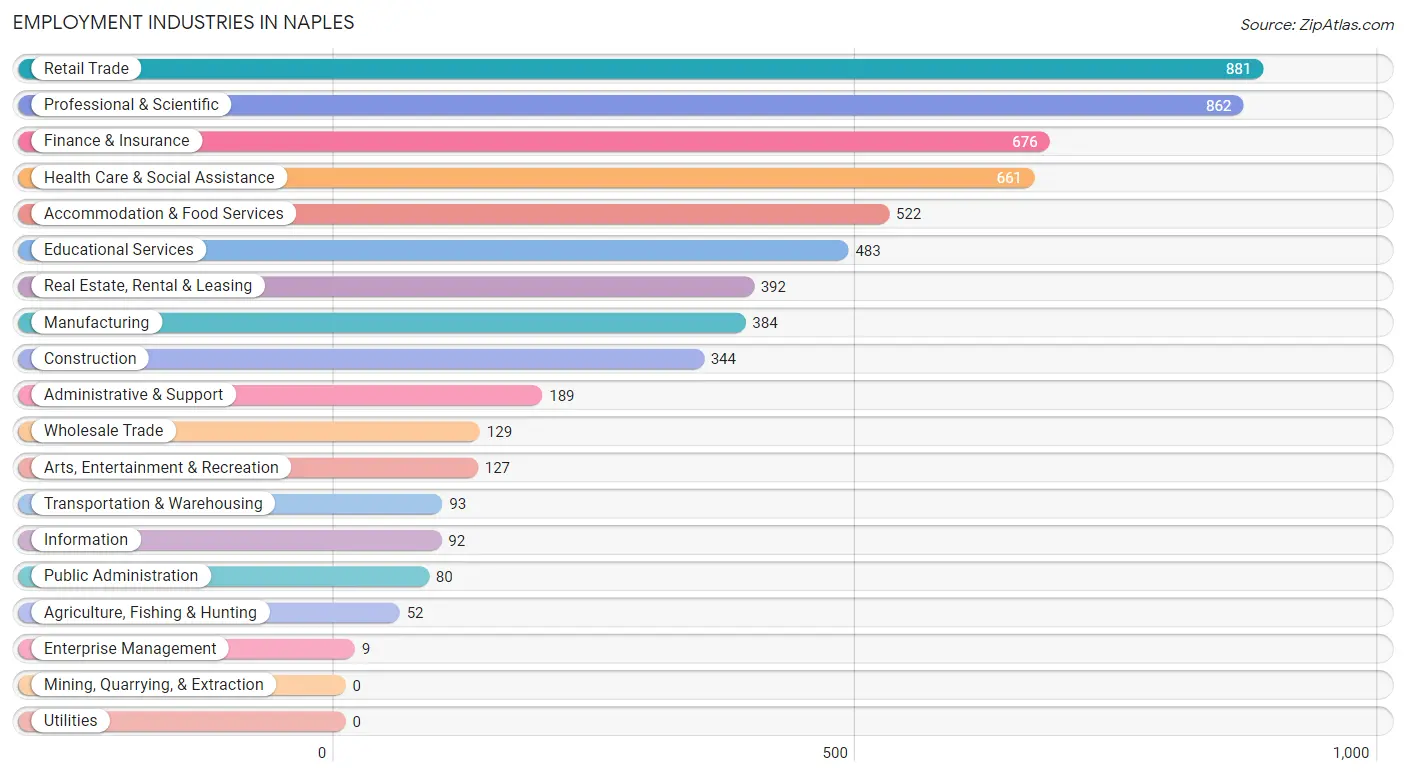
Employment Industries in Naples
The major employment industries in Naples include Retail Trade (881 | 14.0%), Professional & Scientific (862 | 13.7%), Finance & Insurance (676 | 10.7%), Health Care & Social Assistance (661 | 10.5%), and Accommodation & Food Services (522 | 8.3%).
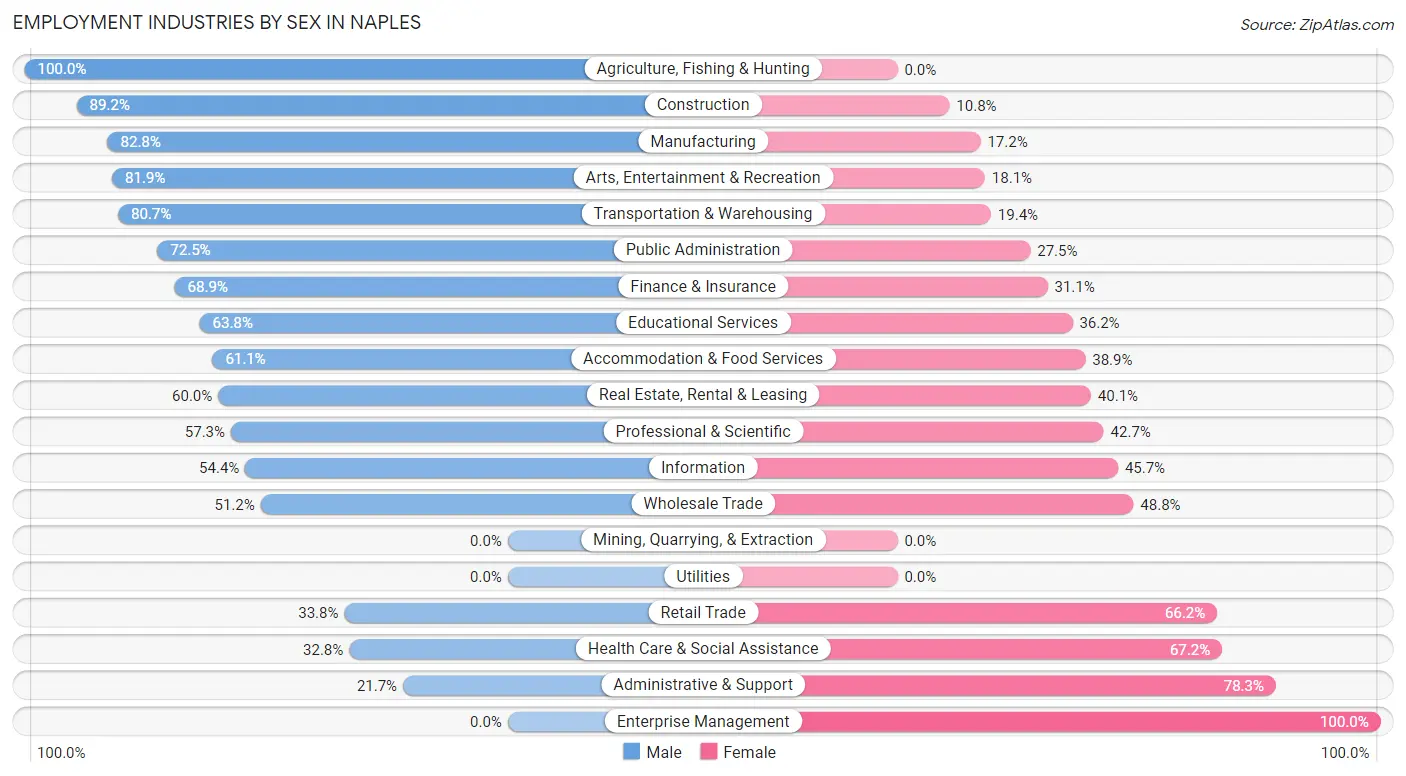
Employment Industries by Sex in Naples
The Naples industries that see more men than women are Agriculture, Fishing & Hunting (100.0%), Construction (89.2%), and Manufacturing (82.8%), whereas the industries that tend to have a higher number of women are Enterprise Management (100.0%), Administrative & Support (78.3%), and Health Care & Social Assistance (67.2%).
| Industry | Male | Female |
| Agriculture, Fishing & Hunting | 52 (100.0%) | 0 (0.0%) |
| Mining, Quarrying, & Extraction | 0 (0.0%) | 0 (0.0%) |
| Construction | 307 (89.2%) | 37 (10.8%) |
| Manufacturing | 318 (82.8%) | 66 (17.2%) |
| Wholesale Trade | 66 (51.2%) | 63 (48.8%) |
| Retail Trade | 298 (33.8%) | 583 (66.2%) |
| Transportation & Warehousing | 75 (80.6%) | 18 (19.4%) |
| Utilities | 0 (0.0%) | 0 (0.0%) |
| Information | 50 (54.3%) | 42 (45.7%) |
| Finance & Insurance | 466 (68.9%) | 210 (31.1%) |
| Real Estate, Rental & Leasing | 235 (60.0%) | 157 (40.1%) |
| Professional & Scientific | 494 (57.3%) | 368 (42.7%) |
| Enterprise Management | 0 (0.0%) | 9 (100.0%) |
| Administrative & Support | 41 (21.7%) | 148 (78.3%) |
| Educational Services | 308 (63.8%) | 175 (36.2%) |
| Health Care & Social Assistance | 217 (32.8%) | 444 (67.2%) |
| Arts, Entertainment & Recreation | 104 (81.9%) | 23 (18.1%) |
| Accommodation & Food Services | 319 (61.1%) | 203 (38.9%) |
| Public Administration | 58 (72.5%) | 22 (27.5%) |
| Total | 3,518 (55.7%) | 2,792 (44.3%) |
Education in Naples
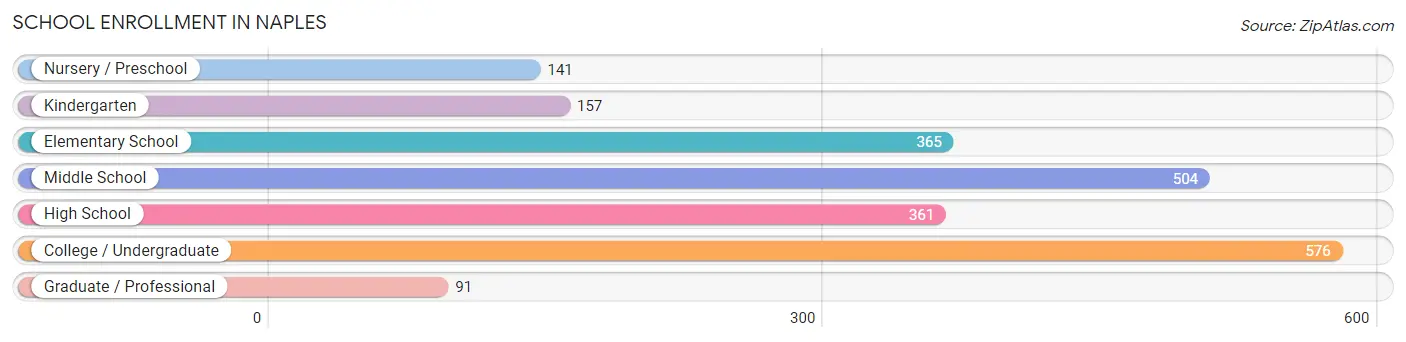
School Enrollment in Naples
The most common levels of schooling among the 2,195 students in Naples are college / undergraduate (576 | 26.2%), middle school (504 | 23.0%), and elementary school (365 | 16.6%).
| School Level | # Students | % Students |
| Nursery / Preschool | 141 | 6.4% |
| Kindergarten | 157 | 7.1% |
| Elementary School | 365 | 16.6% |
| Middle School | 504 | 23.0% |
| High School | 361 | 16.5% |
| College / Undergraduate | 576 | 26.2% |
| Graduate / Professional | 91 | 4.2% |
| Total | 2,195 | 100.0% |
School Enrollment by Age by Funding Source in Naples
Out of a total of 2,195 students who are enrolled in schools in Naples, 700 (31.9%) attend a private institution, while the remaining 1,495 (68.1%) are enrolled in public schools. The age group of 20 to 24 year olds has the highest likelihood of being enrolled in private schools, with 277 (78.2% in the age bracket) enrolled. Conversely, the age group of 5 to 9 year old has the lowest likelihood of being enrolled in a private school, with 485 (87.7% in the age bracket) attending a public institution.
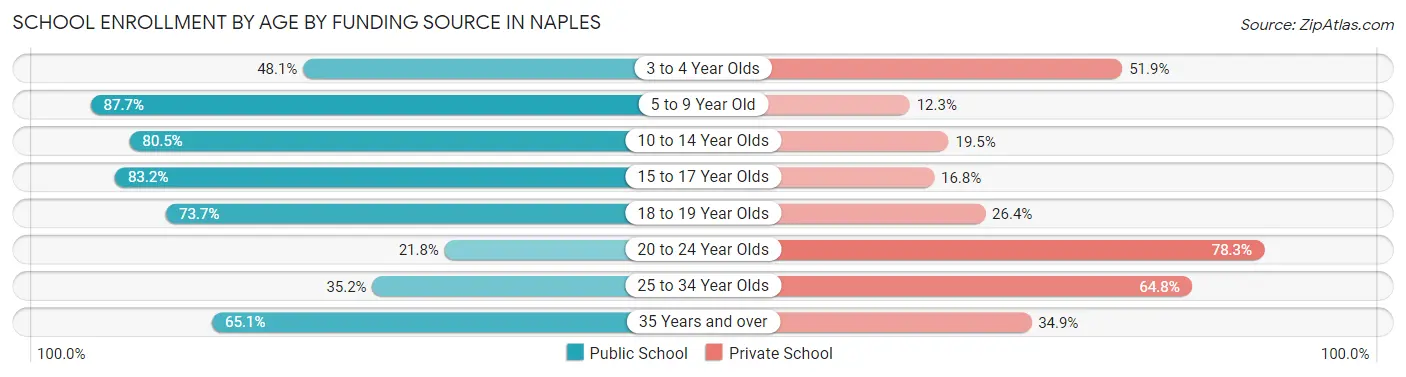
| Age Bracket | Public School | Private School |
| 3 to 4 Year Olds | 51 (48.1%) | 55 (51.9%) |
| 5 to 9 Year Old | 485 (87.7%) | 68 (12.3%) |
| 10 to 14 Year Olds | 449 (80.5%) | 109 (19.5%) |
| 15 to 17 Year Olds | 163 (83.2%) | 33 (16.8%) |
| 18 to 19 Year Olds | 109 (73.7%) | 39 (26.4%) |
| 20 to 24 Year Olds | 77 (21.7%) | 277 (78.2%) |
| 25 to 34 Year Olds | 25 (35.2%) | 46 (64.8%) |
| 35 Years and over | 136 (65.1%) | 73 (34.9%) |
| Total | 1,495 (68.1%) | 700 (31.9%) |
Educational Attainment by Field of Study in Naples
Business (2,742 | 24.4%), education (1,306 | 11.6%), social sciences (1,226 | 10.9%), science & technology (1,157 | 10.3%), and engineering (1,122 | 10.0%) are the most common fields of study among 11,228 individuals in Naples who have obtained a bachelor's degree or higher.
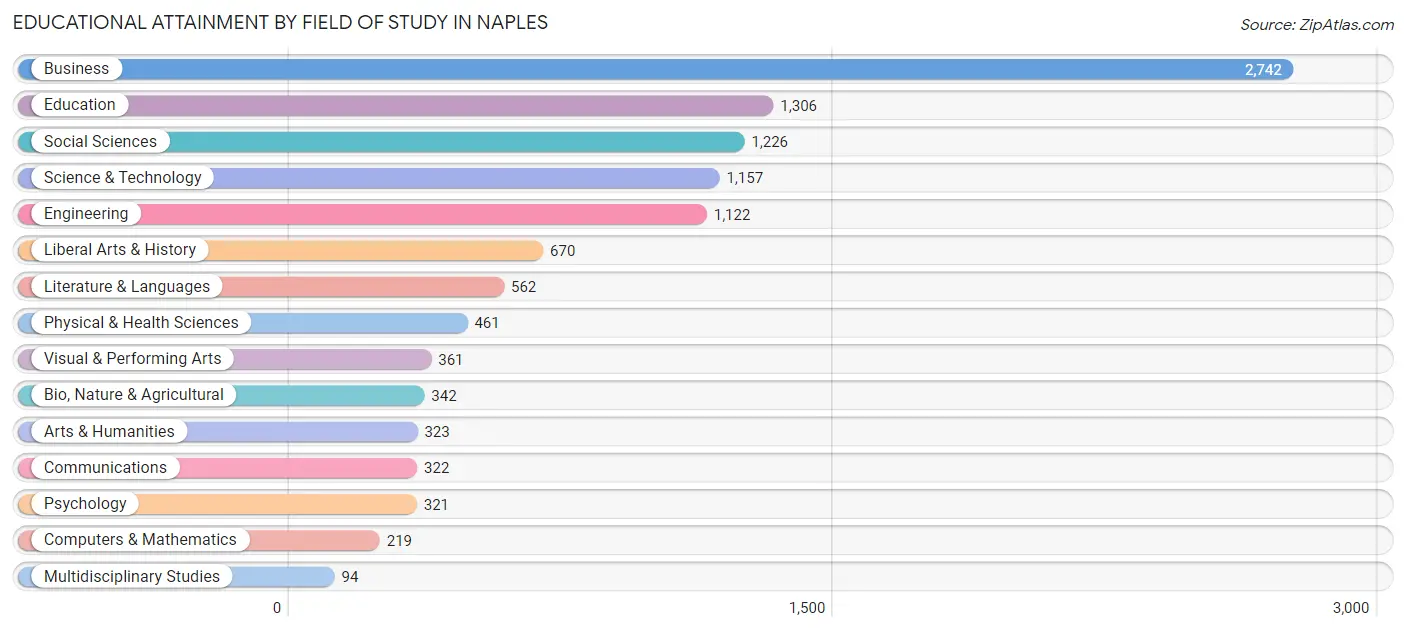
| Field of Study | # Graduates | % Graduates |
| Computers & Mathematics | 219 | 1.9% |
| Bio, Nature & Agricultural | 342 | 3.0% |
| Physical & Health Sciences | 461 | 4.1% |
| Psychology | 321 | 2.9% |
| Social Sciences | 1,226 | 10.9% |
| Engineering | 1,122 | 10.0% |
| Multidisciplinary Studies | 94 | 0.8% |
| Science & Technology | 1,157 | 10.3% |
| Business | 2,742 | 24.4% |
| Education | 1,306 | 11.6% |
| Literature & Languages | 562 | 5.0% |
| Liberal Arts & History | 670 | 6.0% |
| Visual & Performing Arts | 361 | 3.2% |
| Communications | 322 | 2.9% |
| Arts & Humanities | 323 | 2.9% |
| Total | 11,228 | 100.0% |
Transportation & Commute in Naples
Vehicle Availability by Sex in Naples
The most prevalent vehicle ownership categories in Naples are males with 2 vehicles (1,696, accounting for 49.0%) and females with 2 vehicles (1,311, making up 62.4%).
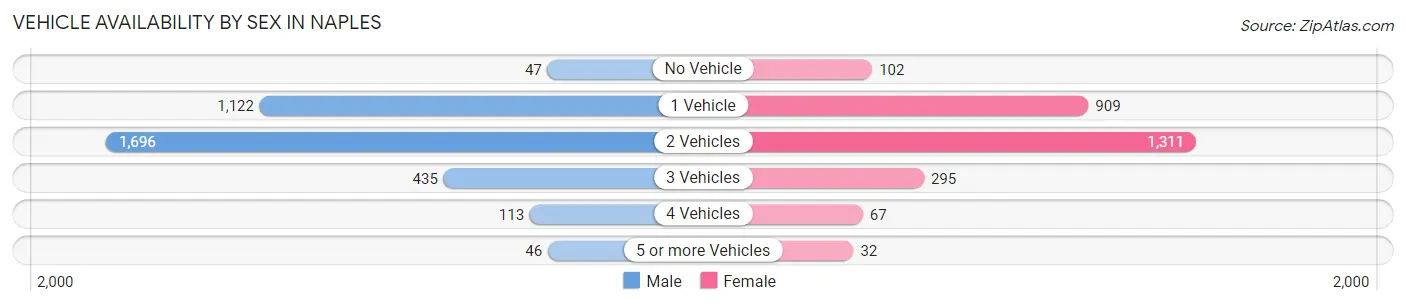
| Vehicles Available | Male | Female |
| No Vehicle | 47 (1.4%) | 102 (3.8%) |
| 1 Vehicle | 1,122 (32.4%) | 909 (33.5%) |
| 2 Vehicles | 1,696 (49.0%) | 1,311 (48.3%) |
| 3 Vehicles | 435 (12.6%) | 295 (10.9%) |
| 4 Vehicles | 113 (3.3%) | 67 (2.5%) |
| 5 or more Vehicles | 46 (1.3%) | 32 (1.2%) |
| Total | 3,459 (100.0%) | 2,716 (100.0%) |
Commute Time in Naples
The most frequently occuring commute durations in Naples are 5 to 9 minutes (1,073 commuters, 25.3%), 10 to 14 minutes (720 commuters, 17.0%), and 15 to 19 minutes (674 commuters, 15.9%).
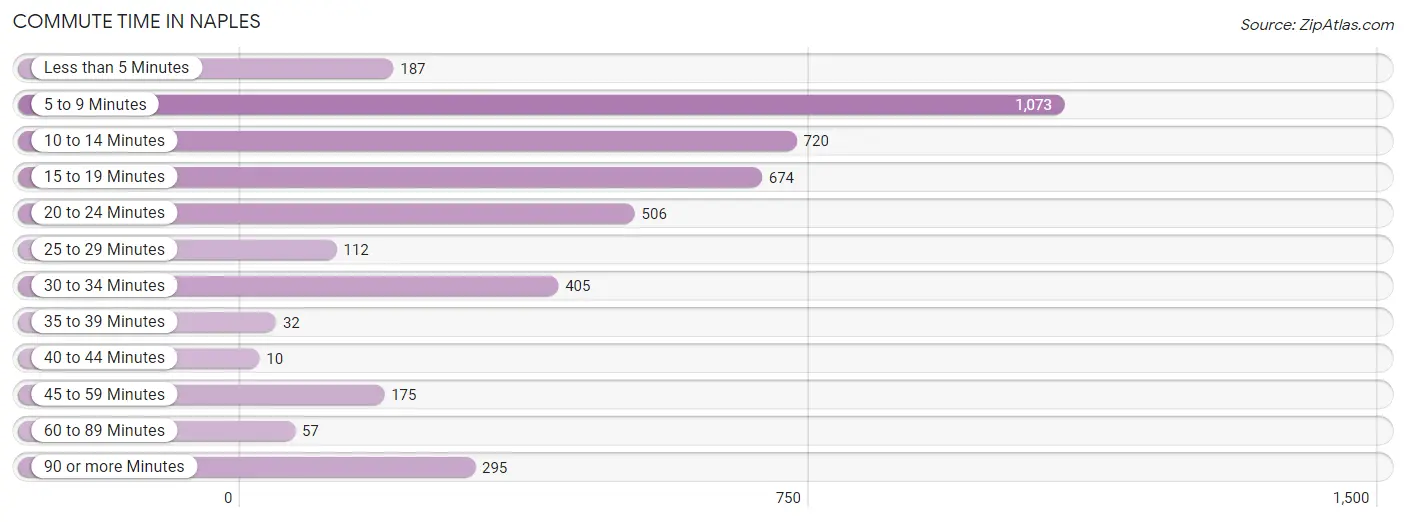
| Commute Time | # Commuters | % Commuters |
| Less than 5 Minutes | 187 | 4.4% |
| 5 to 9 Minutes | 1,073 | 25.3% |
| 10 to 14 Minutes | 720 | 17.0% |
| 15 to 19 Minutes | 674 | 15.9% |
| 20 to 24 Minutes | 506 | 11.9% |
| 25 to 29 Minutes | 112 | 2.6% |
| 30 to 34 Minutes | 405 | 9.5% |
| 35 to 39 Minutes | 32 | 0.7% |
| 40 to 44 Minutes | 10 | 0.2% |
| 45 to 59 Minutes | 175 | 4.1% |
| 60 to 89 Minutes | 57 | 1.3% |
| 90 or more Minutes | 295 | 7.0% |
Commute Time by Sex in Naples
The most common commute times in Naples are 10 to 14 minutes (452 commuters, 19.8%) for males and 5 to 9 minutes (725 commuters, 36.9%) for females.
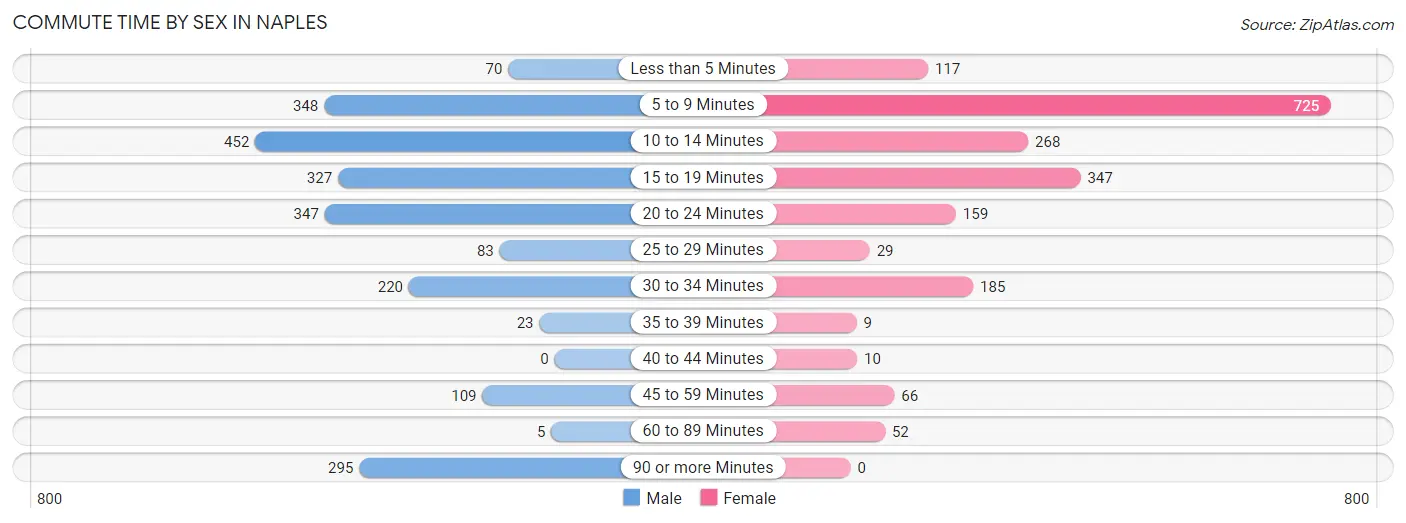
| Commute Time | Male | Female |
| Less than 5 Minutes | 70 (3.1%) | 117 (5.9%) |
| 5 to 9 Minutes | 348 (15.3%) | 725 (36.9%) |
| 10 to 14 Minutes | 452 (19.8%) | 268 (13.6%) |
| 15 to 19 Minutes | 327 (14.3%) | 347 (17.6%) |
| 20 to 24 Minutes | 347 (15.2%) | 159 (8.1%) |
| 25 to 29 Minutes | 83 (3.6%) | 29 (1.5%) |
| 30 to 34 Minutes | 220 (9.7%) | 185 (9.4%) |
| 35 to 39 Minutes | 23 (1.0%) | 9 (0.5%) |
| 40 to 44 Minutes | 0 (0.0%) | 10 (0.5%) |
| 45 to 59 Minutes | 109 (4.8%) | 66 (3.4%) |
| 60 to 89 Minutes | 5 (0.2%) | 52 (2.6%) |
| 90 or more Minutes | 295 (12.9%) | 0 (0.0%) |
Time of Departure to Work by Sex in Naples
The most frequent times of departure to work in Naples are 6:30 AM to 6:59 AM (455, 20.0%) for males and 9:00 AM to 9:59 AM (491, 25.0%) for females.
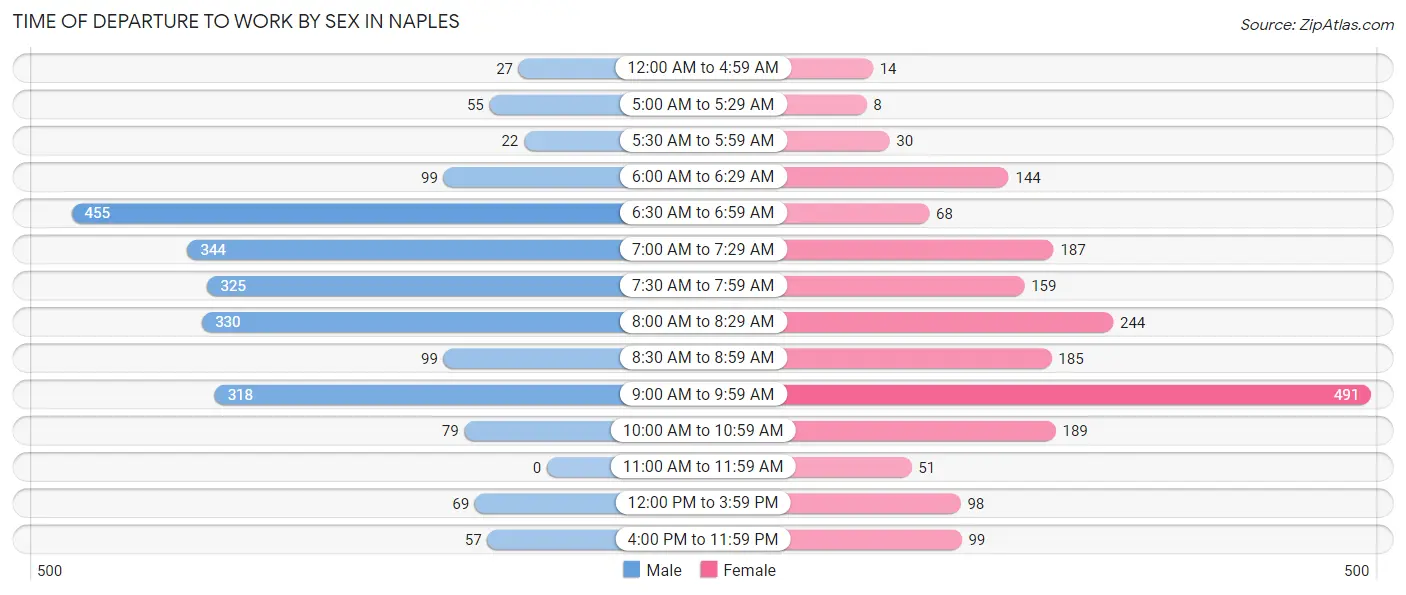
| Time of Departure | Male | Female |
| 12:00 AM to 4:59 AM | 27 (1.2%) | 14 (0.7%) |
| 5:00 AM to 5:29 AM | 55 (2.4%) | 8 (0.4%) |
| 5:30 AM to 5:59 AM | 22 (1.0%) | 30 (1.5%) |
| 6:00 AM to 6:29 AM | 99 (4.3%) | 144 (7.3%) |
| 6:30 AM to 6:59 AM | 455 (20.0%) | 68 (3.5%) |
| 7:00 AM to 7:29 AM | 344 (15.1%) | 187 (9.5%) |
| 7:30 AM to 7:59 AM | 325 (14.3%) | 159 (8.1%) |
| 8:00 AM to 8:29 AM | 330 (14.5%) | 244 (12.4%) |
| 8:30 AM to 8:59 AM | 99 (4.3%) | 185 (9.4%) |
| 9:00 AM to 9:59 AM | 318 (14.0%) | 491 (25.0%) |
| 10:00 AM to 10:59 AM | 79 (3.5%) | 189 (9.6%) |
| 11:00 AM to 11:59 AM | 0 (0.0%) | 51 (2.6%) |
| 12:00 PM to 3:59 PM | 69 (3.0%) | 98 (5.0%) |
| 4:00 PM to 11:59 PM | 57 (2.5%) | 99 (5.0%) |
| Total | 2,279 (100.0%) | 1,967 (100.0%) |
Housing Occupancy in Naples
Occupancy by Ownership in Naples
Of the total 9,583 dwellings in Naples, owner-occupied units account for 7,916 (82.6%), while renter-occupied units make up 1,667 (17.4%).
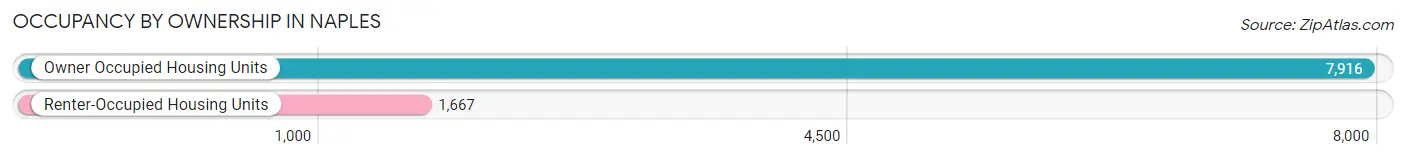
| Occupancy | # Housing Units | % Housing Units |
| Owner Occupied Housing Units | 7,916 | 82.6% |
| Renter-Occupied Housing Units | 1,667 | 17.4% |
| Total Occupied Housing Units | 9,583 | 100.0% |
Occupancy by Household Size in Naples
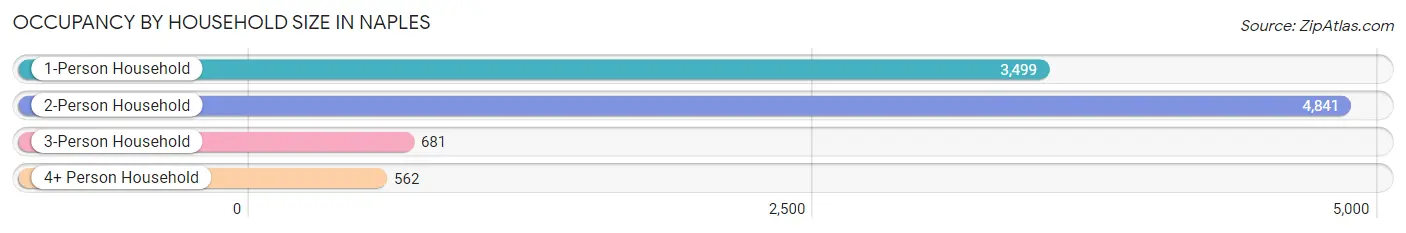
| Household Size | # Housing Units | % Housing Units |
| 1-Person Household | 3,499 | 36.5% |
| 2-Person Household | 4,841 | 50.5% |
| 3-Person Household | 681 | 7.1% |
| 4+ Person Household | 562 | 5.9% |
| Total Housing Units | 9,583 | 100.0% |
Occupancy by Ownership by Household Size in Naples
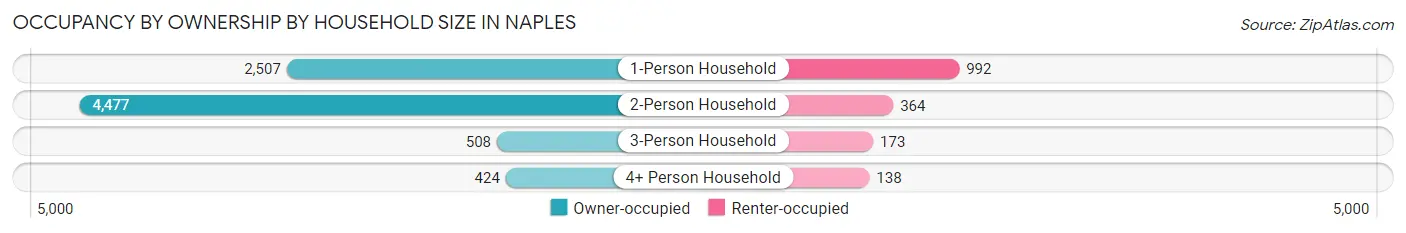
| Household Size | Owner-occupied | Renter-occupied |
| 1-Person Household | 2,507 (71.7%) | 992 (28.3%) |
| 2-Person Household | 4,477 (92.5%) | 364 (7.5%) |
| 3-Person Household | 508 (74.6%) | 173 (25.4%) |
| 4+ Person Household | 424 (75.4%) | 138 (24.6%) |
| Total Housing Units | 7,916 (82.6%) | 1,667 (17.4%) |
Occupancy by Educational Attainment in Naples
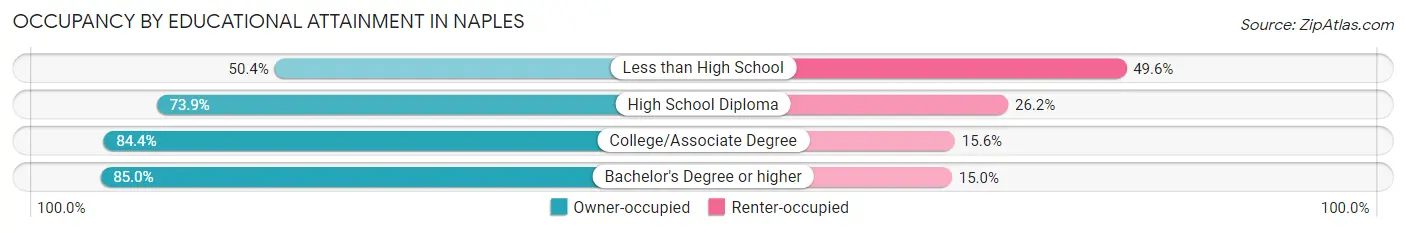
| Household Size | Owner-occupied | Renter-occupied |
| Less than High School | 116 (50.4%) | 114 (49.6%) |
| High School Diploma | 929 (73.9%) | 329 (26.2%) |
| College/Associate Degree | 1,379 (84.4%) | 255 (15.6%) |
| Bachelor's Degree or higher | 5,492 (85.0%) | 969 (15.0%) |
Occupancy by Age of Householder in Naples
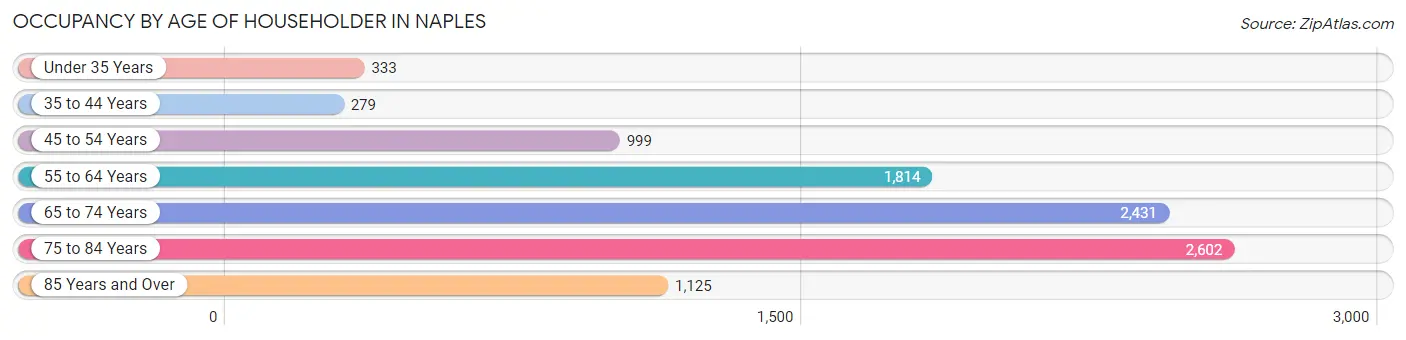
| Age Bracket | # Households | % Households |
| Under 35 Years | 333 | 3.5% |
| 35 to 44 Years | 279 | 2.9% |
| 45 to 54 Years | 999 | 10.4% |
| 55 to 64 Years | 1,814 | 18.9% |
| 65 to 74 Years | 2,431 | 25.4% |
| 75 to 84 Years | 2,602 | 27.2% |
| 85 Years and Over | 1,125 | 11.7% |
| Total | 9,583 | 100.0% |
Housing Finances in Naples
Median Income by Occupancy in Naples
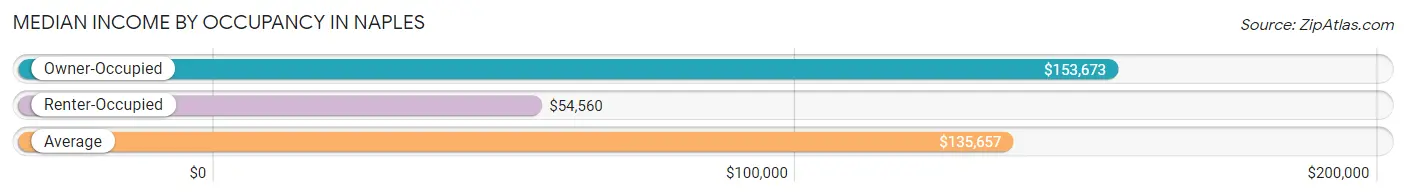
| Occupancy Type | # Households | Median Income |
| Owner-Occupied | 7,916 (82.6%) | $153,673 |
| Renter-Occupied | 1,667 (17.4%) | $54,560 |
| Average | 9,583 (100.0%) | $135,657 |
Occupancy by Householder Income Bracket in Naples
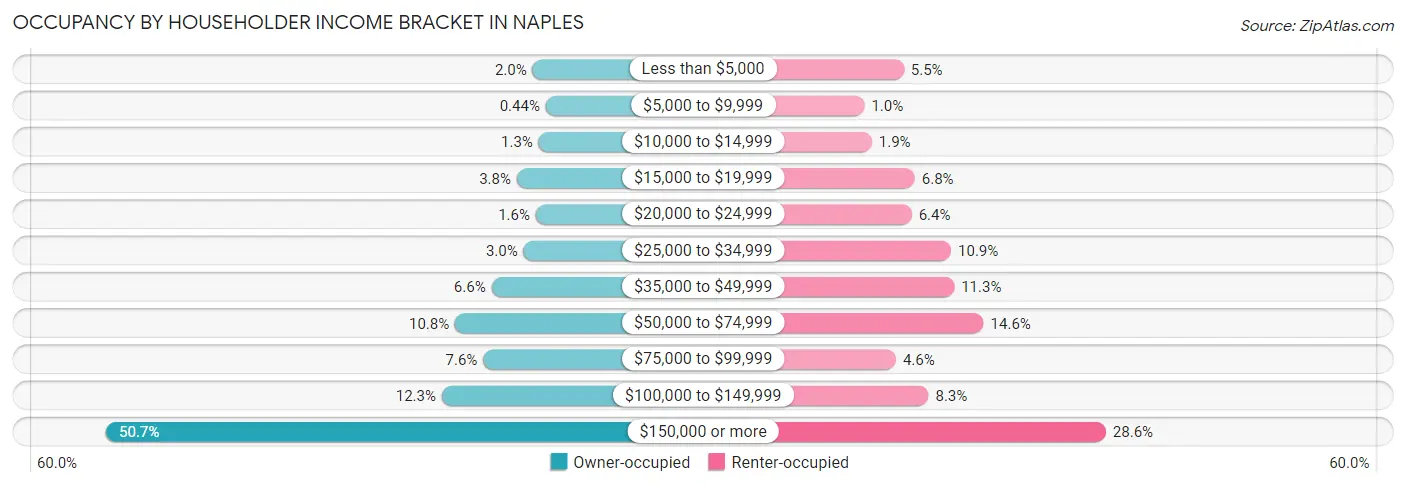
| Income Bracket | Owner-occupied | Renter-occupied |
| Less than $5,000 | 154 (1.9%) | 92 (5.5%) |
| $5,000 to $9,999 | 35 (0.4%) | 17 (1.0%) |
| $10,000 to $14,999 | 99 (1.3%) | 31 (1.9%) |
| $15,000 to $19,999 | 297 (3.7%) | 113 (6.8%) |
| $20,000 to $24,999 | 125 (1.6%) | 107 (6.4%) |
| $25,000 to $34,999 | 236 (3.0%) | 182 (10.9%) |
| $35,000 to $49,999 | 526 (6.6%) | 188 (11.3%) |
| $50,000 to $74,999 | 856 (10.8%) | 244 (14.6%) |
| $75,000 to $99,999 | 601 (7.6%) | 77 (4.6%) |
| $100,000 to $149,999 | 975 (12.3%) | 139 (8.3%) |
| $150,000 or more | 4,012 (50.7%) | 477 (28.6%) |
| Total | 7,916 (100.0%) | 1,667 (100.0%) |
Monthly Housing Cost Tiers in Naples
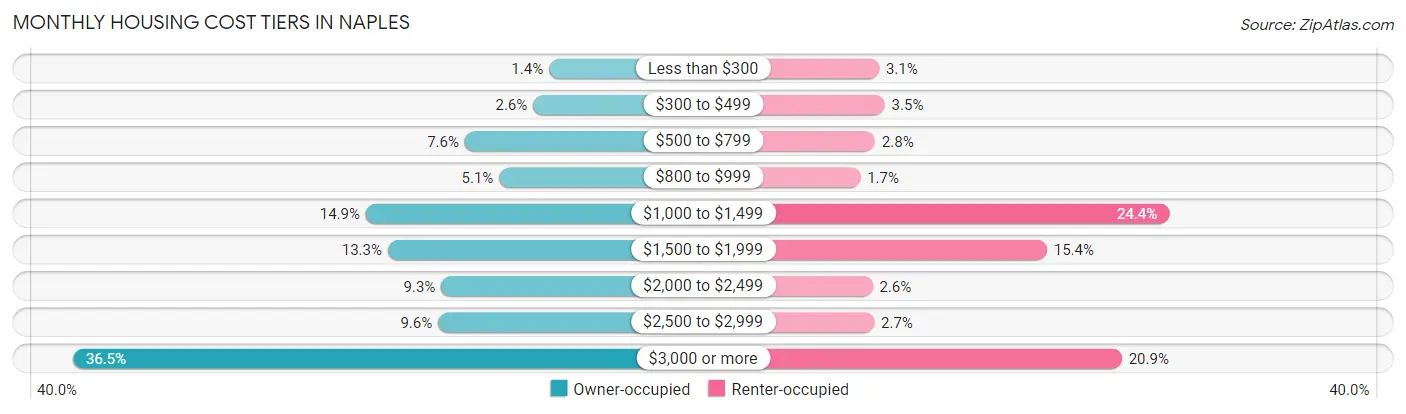
| Monthly Cost | Owner-occupied | Renter-occupied |
| Less than $300 | 109 (1.4%) | 51 (3.1%) |
| $300 to $499 | 202 (2.5%) | 58 (3.5%) |
| $500 to $799 | 600 (7.6%) | 46 (2.8%) |
| $800 to $999 | 400 (5.1%) | 28 (1.7%) |
| $1,000 to $1,499 | 1,177 (14.9%) | 407 (24.4%) |
| $1,500 to $1,999 | 1,049 (13.3%) | 257 (15.4%) |
| $2,000 to $2,499 | 738 (9.3%) | 43 (2.6%) |
| $2,500 to $2,999 | 756 (9.6%) | 45 (2.7%) |
| $3,000 or more | 2,885 (36.4%) | 349 (20.9%) |
| Total | 7,916 (100.0%) | 1,667 (100.0%) |
Physical Housing Characteristics in Naples
Housing Structures in Naples
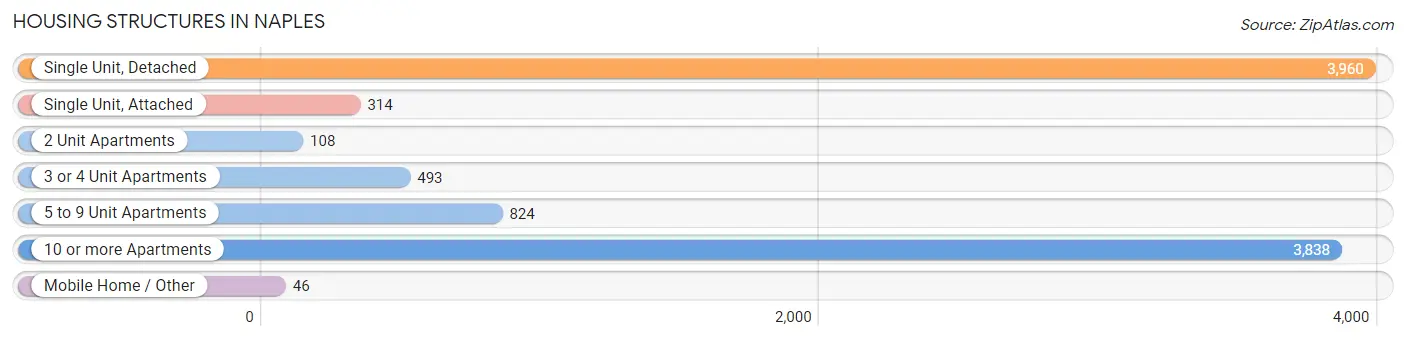
| Structure Type | # Housing Units | % Housing Units |
| Single Unit, Detached | 3,960 | 41.3% |
| Single Unit, Attached | 314 | 3.3% |
| 2 Unit Apartments | 108 | 1.1% |
| 3 or 4 Unit Apartments | 493 | 5.1% |
| 5 to 9 Unit Apartments | 824 | 8.6% |
| 10 or more Apartments | 3,838 | 40.1% |
| Mobile Home / Other | 46 | 0.5% |
| Total | 9,583 | 100.0% |
Housing Structures by Occupancy in Naples
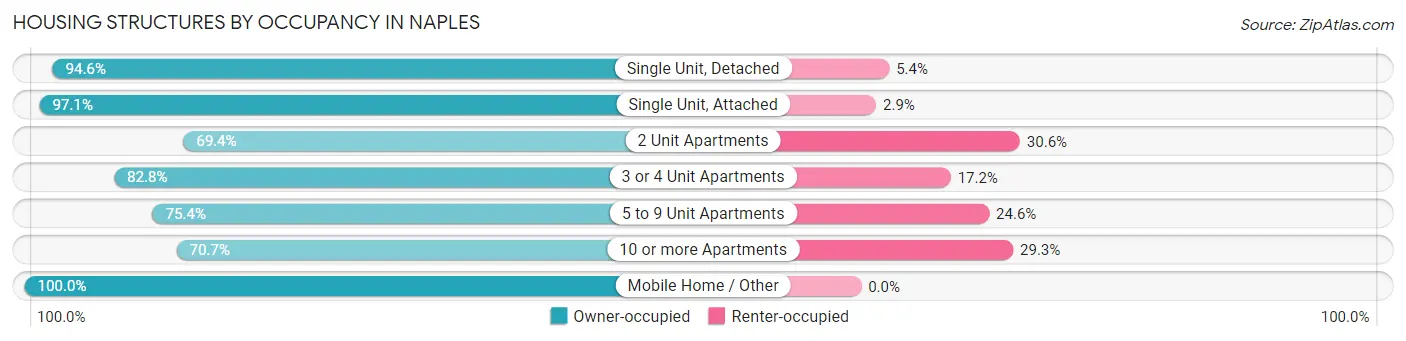
| Structure Type | Owner-occupied | Renter-occupied |
| Single Unit, Detached | 3,746 (94.6%) | 214 (5.4%) |
| Single Unit, Attached | 305 (97.1%) | 9 (2.9%) |
| 2 Unit Apartments | 75 (69.4%) | 33 (30.6%) |
| 3 or 4 Unit Apartments | 408 (82.8%) | 85 (17.2%) |
| 5 to 9 Unit Apartments | 621 (75.4%) | 203 (24.6%) |
| 10 or more Apartments | 2,715 (70.7%) | 1,123 (29.3%) |
| Mobile Home / Other | 46 (100.0%) | 0 (0.0%) |
| Total | 7,916 (82.6%) | 1,667 (17.4%) |
Housing Structures by Number of Rooms in Naples
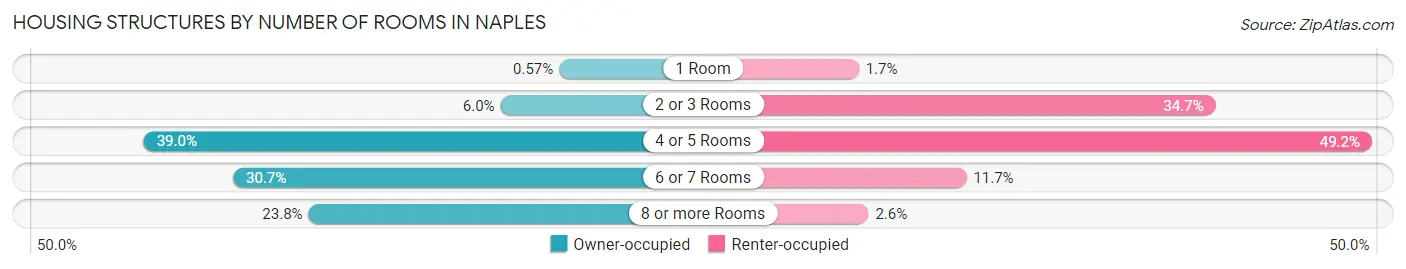
| Number of Rooms | Owner-occupied | Renter-occupied |
| 1 Room | 45 (0.6%) | 29 (1.7%) |
| 2 or 3 Rooms | 474 (6.0%) | 579 (34.7%) |
| 4 or 5 Rooms | 3,086 (39.0%) | 820 (49.2%) |
| 6 or 7 Rooms | 2,431 (30.7%) | 195 (11.7%) |
| 8 or more Rooms | 1,880 (23.7%) | 44 (2.6%) |
| Total | 7,916 (100.0%) | 1,667 (100.0%) |
Housing Structure by Heating Type in Naples
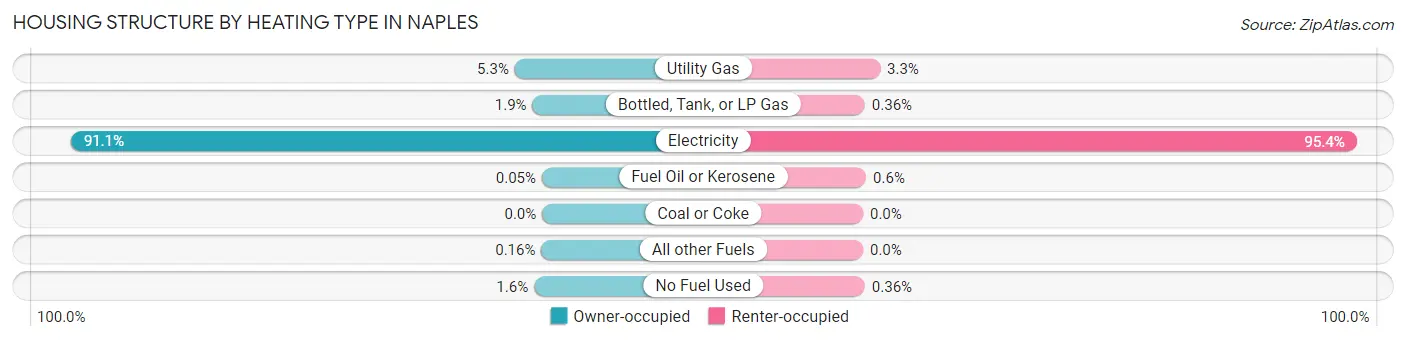
| Heating Type | Owner-occupied | Renter-occupied |
| Utility Gas | 419 (5.3%) | 55 (3.3%) |
| Bottled, Tank, or LP Gas | 148 (1.9%) | 6 (0.4%) |
| Electricity | 7,208 (91.1%) | 1,590 (95.4%) |
| Fuel Oil or Kerosene | 4 (0.1%) | 10 (0.6%) |
| Coal or Coke | 0 (0.0%) | 0 (0.0%) |
| All other Fuels | 13 (0.2%) | 0 (0.0%) |
| No Fuel Used | 124 (1.6%) | 6 (0.4%) |
| Total | 7,916 (100.0%) | 1,667 (100.0%) |
Household Vehicle Usage in Naples
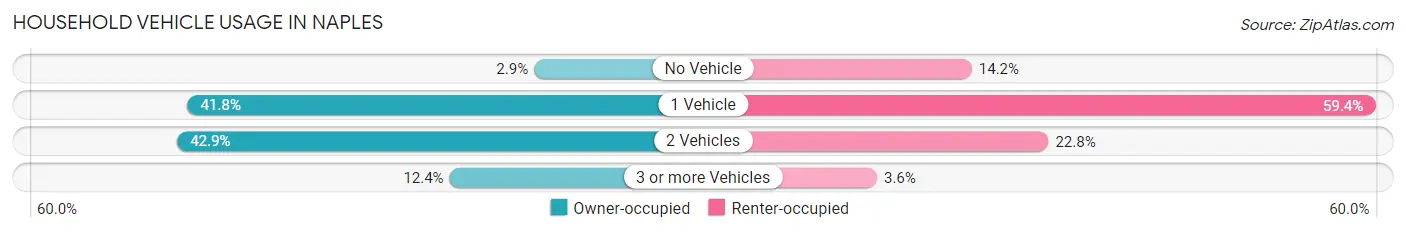
| Vehicles per Household | Owner-occupied | Renter-occupied |
| No Vehicle | 233 (2.9%) | 237 (14.2%) |
| 1 Vehicle | 3,305 (41.7%) | 990 (59.4%) |
| 2 Vehicles | 3,396 (42.9%) | 380 (22.8%) |
| 3 or more Vehicles | 982 (12.4%) | 60 (3.6%) |
| Total | 7,916 (100.0%) | 1,667 (100.0%) |
Real Estate & Mortgages in Naples
Real Estate and Mortgage Overview in Naples
| Characteristic | Without Mortgage | With Mortgage |
| Housing Units | 5,406 | 2,510 |
| Median Property Value | $1,203,200 | $1,194,600 |
| Median Household Income | $124,054 | $1,579 |
| Monthly Housing Costs | $1,501 | $1,563 |
| Real Estate Taxes | $7,377 | $47 |
Property Value by Mortgage Status in Naples
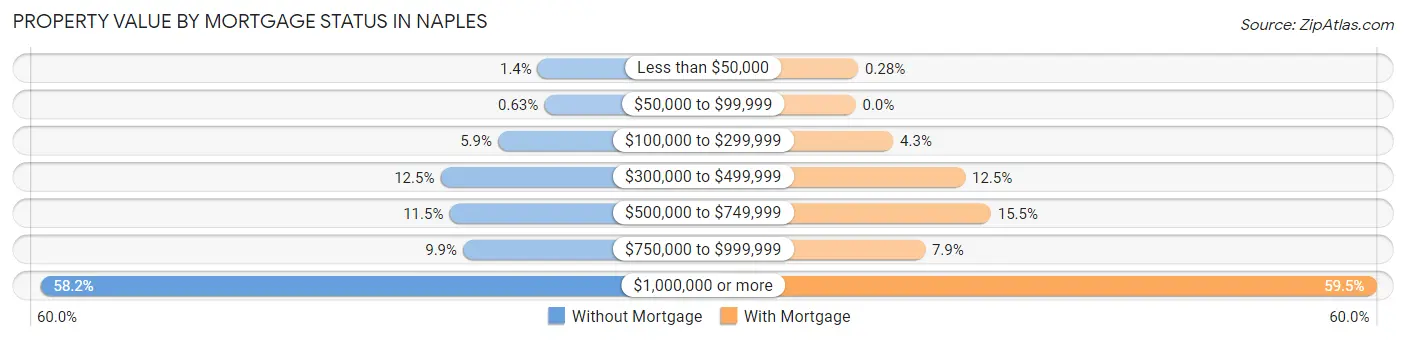
| Property Value | Without Mortgage | With Mortgage |
| Less than $50,000 | 74 (1.4%) | 7 (0.3%) |
| $50,000 to $99,999 | 34 (0.6%) | 0 (0.0%) |
| $100,000 to $299,999 | 320 (5.9%) | 108 (4.3%) |
| $300,000 to $499,999 | 676 (12.5%) | 314 (12.5%) |
| $500,000 to $749,999 | 620 (11.5%) | 388 (15.5%) |
| $750,000 to $999,999 | 536 (9.9%) | 199 (7.9%) |
| $1,000,000 or more | 3,146 (58.2%) | 1,494 (59.5%) |
| Total | 5,406 (100.0%) | 2,510 (100.0%) |
Household Income by Mortgage Status in Naples
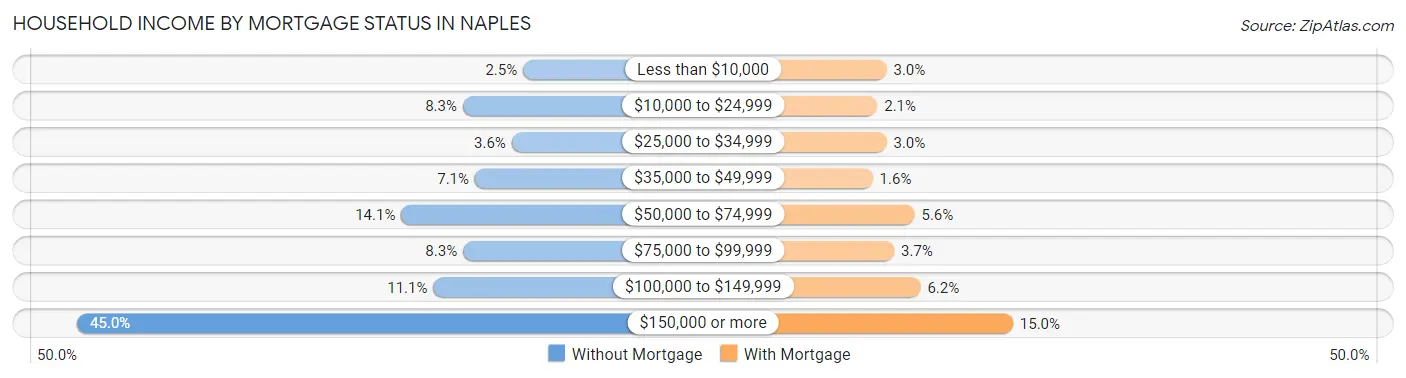
| Household Income | Without Mortgage | With Mortgage |
| Less than $10,000 | 137 (2.5%) | 74 (2.9%) |
| $10,000 to $24,999 | 447 (8.3%) | 52 (2.1%) |
| $25,000 to $34,999 | 195 (3.6%) | 74 (2.9%) |
| $35,000 to $49,999 | 385 (7.1%) | 41 (1.6%) |
| $50,000 to $74,999 | 764 (14.1%) | 141 (5.6%) |
| $75,000 to $99,999 | 446 (8.3%) | 92 (3.7%) |
| $100,000 to $149,999 | 599 (11.1%) | 155 (6.2%) |
| $150,000 or more | 2,433 (45.0%) | 376 (15.0%) |
| Total | 5,406 (100.0%) | 2,510 (100.0%) |
Property Value to Household Income Ratio in Naples
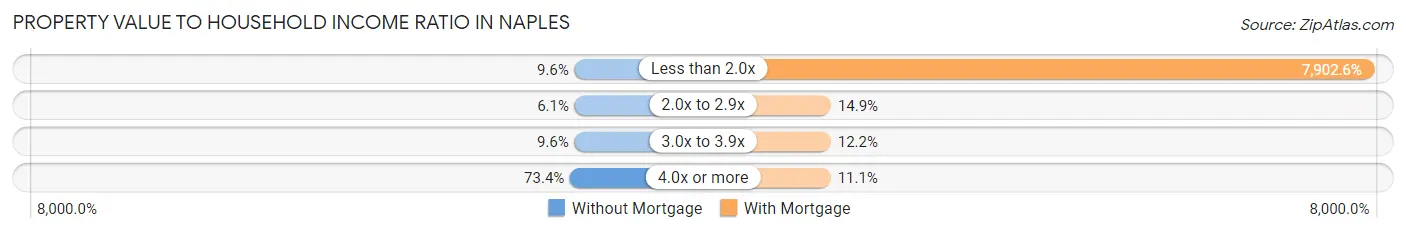
| Value-to-Income Ratio | Without Mortgage | With Mortgage |
| Less than 2.0x | 517 (9.6%) | 198,354 (7,902.5%) |
| 2.0x to 2.9x | 329 (6.1%) | 374 (14.9%) |
| 3.0x to 3.9x | 519 (9.6%) | 307 (12.2%) |
| 4.0x or more | 3,969 (73.4%) | 279 (11.1%) |
| Total | 5,406 (100.0%) | 2,510 (100.0%) |
Real Estate Taxes by Mortgage Status in Naples
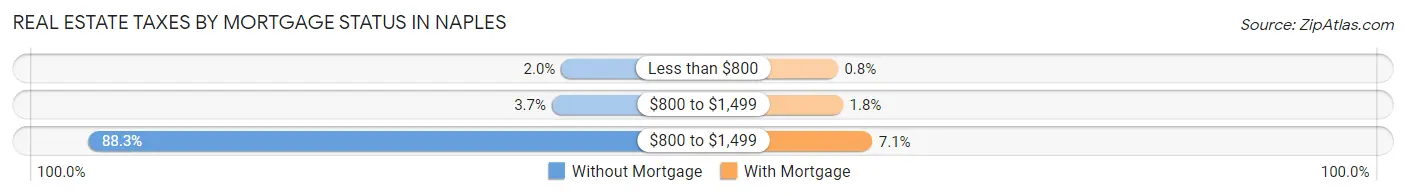
| Property Taxes | Without Mortgage | With Mortgage |
| Less than $800 | 108 (2.0%) | 20 (0.8%) |
| $800 to $1,499 | 200 (3.7%) | 44 (1.8%) |
| $800 to $1,499 | 4,771 (88.2%) | 178 (7.1%) |
| Total | 5,406 (100.0%) | 2,510 (100.0%) |
Health & Disability in Naples
Health Insurance Coverage by Age in Naples
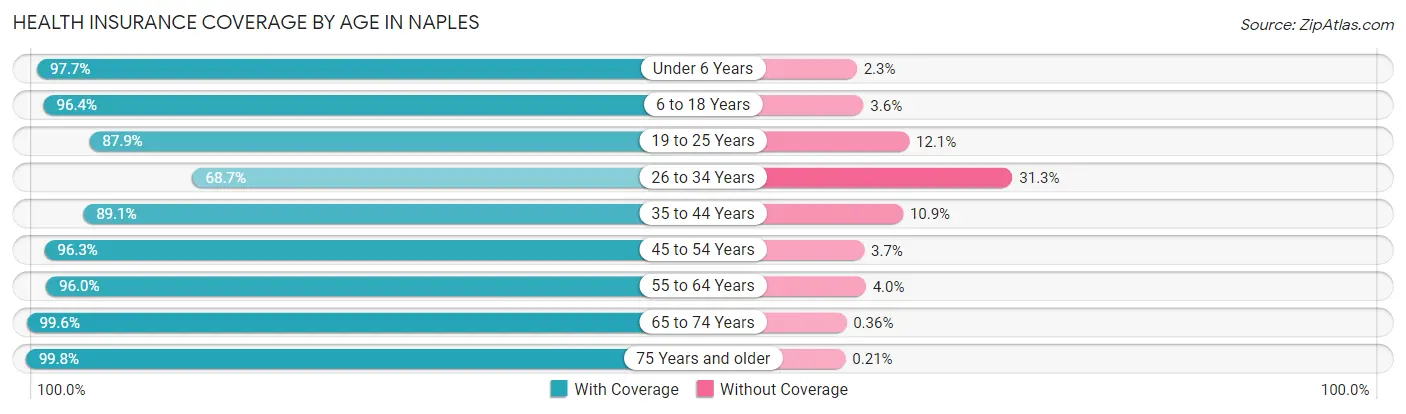
| Age Bracket | With Coverage | Without Coverage |
| Under 6 Years | 590 (97.7%) | 14 (2.3%) |
| 6 to 18 Years | 1,274 (96.4%) | 47 (3.6%) |
| 19 to 25 Years | 611 (87.9%) | 84 (12.1%) |
| 26 to 34 Years | 436 (68.7%) | 199 (31.3%) |
| 35 to 44 Years | 594 (89.1%) | 73 (10.9%) |
| 45 to 54 Years | 1,746 (96.3%) | 67 (3.7%) |
| 55 to 64 Years | 2,831 (96.0%) | 118 (4.0%) |
| 65 to 74 Years | 4,438 (99.6%) | 16 (0.4%) |
| 75 Years and older | 5,757 (99.8%) | 12 (0.2%) |
| Total | 18,277 (96.7%) | 630 (3.3%) |
Health Insurance Coverage by Citizenship Status in Naples
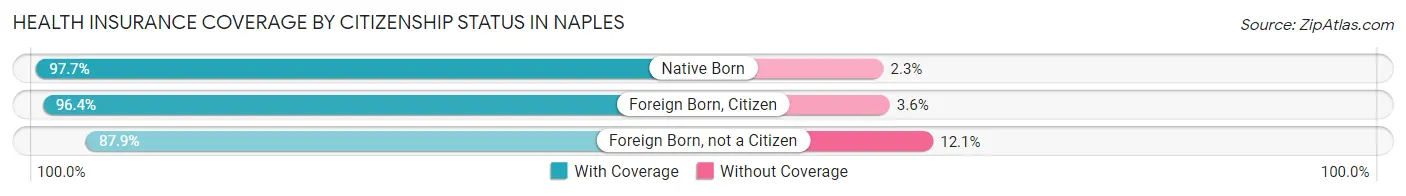
| Citizenship Status | With Coverage | Without Coverage |
| Native Born | 590 (97.7%) | 14 (2.3%) |
| Foreign Born, Citizen | 1,274 (96.4%) | 47 (3.6%) |
| Foreign Born, not a Citizen | 611 (87.9%) | 84 (12.1%) |
Health Insurance Coverage by Household Income in Naples
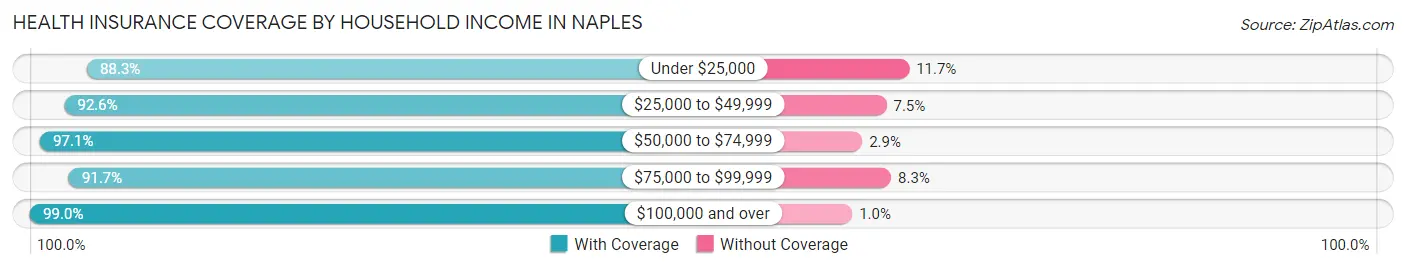
| Household Income | With Coverage | Without Coverage |
| Under $25,000 | 1,315 (88.3%) | 174 (11.7%) |
| $25,000 to $49,999 | 1,826 (92.5%) | 147 (7.4%) |
| $50,000 to $74,999 | 1,846 (97.1%) | 55 (2.9%) |
| $75,000 to $99,999 | 1,314 (91.7%) | 119 (8.3%) |
| $100,000 and over | 11,952 (99.0%) | 123 (1.0%) |
Public vs Private Health Insurance Coverage by Age in Naples
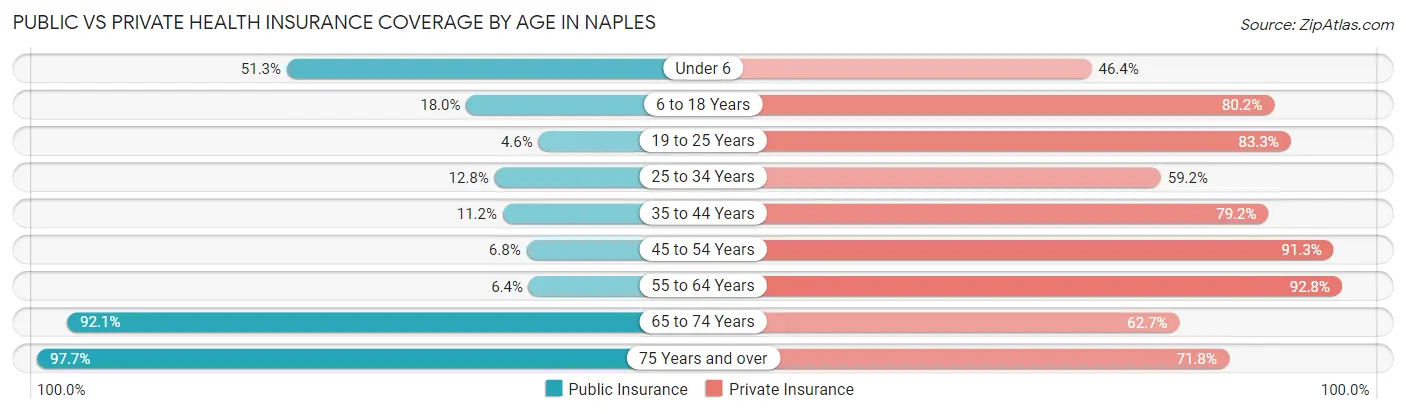
| Age Bracket | Public Insurance | Private Insurance |
| Under 6 | 310 (51.3%) | 280 (46.4%) |
| 6 to 18 Years | 238 (18.0%) | 1,060 (80.2%) |
| 19 to 25 Years | 32 (4.6%) | 579 (83.3%) |
| 25 to 34 Years | 81 (12.8%) | 376 (59.2%) |
| 35 to 44 Years | 75 (11.2%) | 528 (79.2%) |
| 45 to 54 Years | 124 (6.8%) | 1,655 (91.3%) |
| 55 to 64 Years | 189 (6.4%) | 2,737 (92.8%) |
| 65 to 74 Years | 4,103 (92.1%) | 2,791 (62.7%) |
| 75 Years and over | 5,635 (97.7%) | 4,143 (71.8%) |
| Total | 10,787 (57.1%) | 14,149 (74.8%) |
Disability Status by Sex by Age in Naples
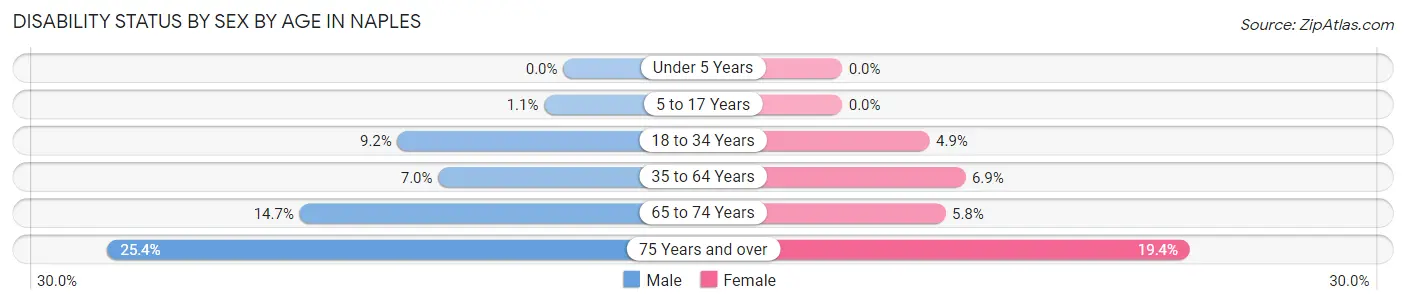
| Age Bracket | Male | Female |
| Under 5 Years | 0 (0.0%) | 0 (0.0%) |
| 5 to 17 Years | 8 (1.1%) | 0 (0.0%) |
| 18 to 34 Years | 54 (9.2%) | 42 (4.9%) |
| 35 to 64 Years | 179 (7.0%) | 196 (6.9%) |
| 65 to 74 Years | 309 (14.7%) | 135 (5.8%) |
| 75 Years and over | 668 (25.4%) | 608 (19.4%) |
Disability Class by Sex by Age in Naples
Disability Class: Hearing Difficulty
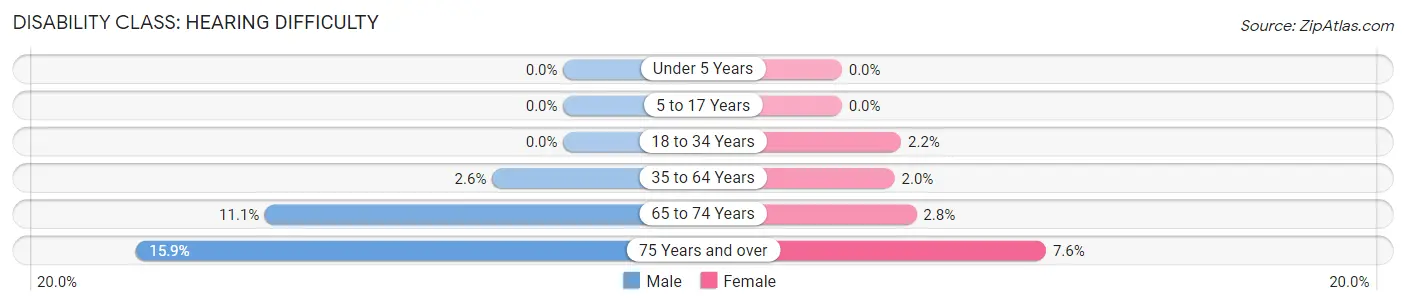
| Age Bracket | Male | Female |
| Under 5 Years | 0 (0.0%) | 0 (0.0%) |
| 5 to 17 Years | 0 (0.0%) | 0 (0.0%) |
| 18 to 34 Years | 0 (0.0%) | 19 (2.2%) |
| 35 to 64 Years | 68 (2.6%) | 56 (2.0%) |
| 65 to 74 Years | 233 (11.1%) | 65 (2.8%) |
| 75 Years and over | 417 (15.9%) | 238 (7.6%) |
Disability Class: Vision Difficulty
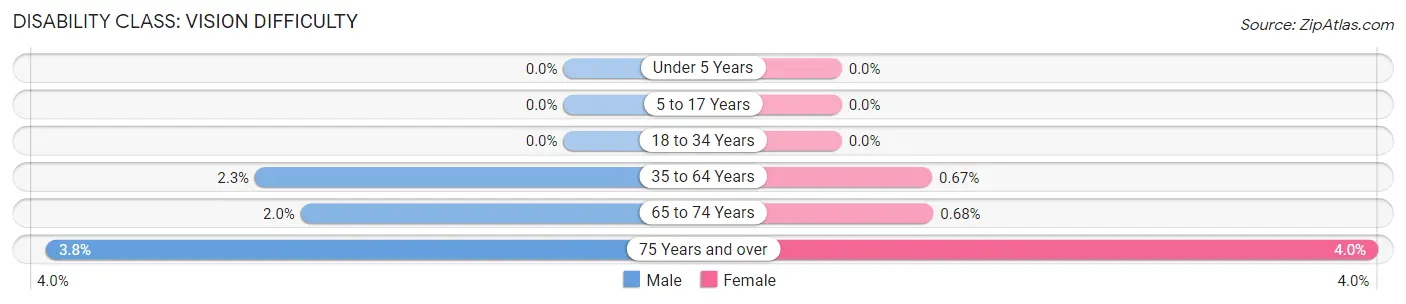
| Age Bracket | Male | Female |
| Under 5 Years | 0 (0.0%) | 0 (0.0%) |
| 5 to 17 Years | 0 (0.0%) | 0 (0.0%) |
| 18 to 34 Years | 0 (0.0%) | 0 (0.0%) |
| 35 to 64 Years | 59 (2.3%) | 19 (0.7%) |
| 65 to 74 Years | 41 (1.9%) | 16 (0.7%) |
| 75 Years and over | 101 (3.8%) | 125 (4.0%) |
Disability Class: Cognitive Difficulty
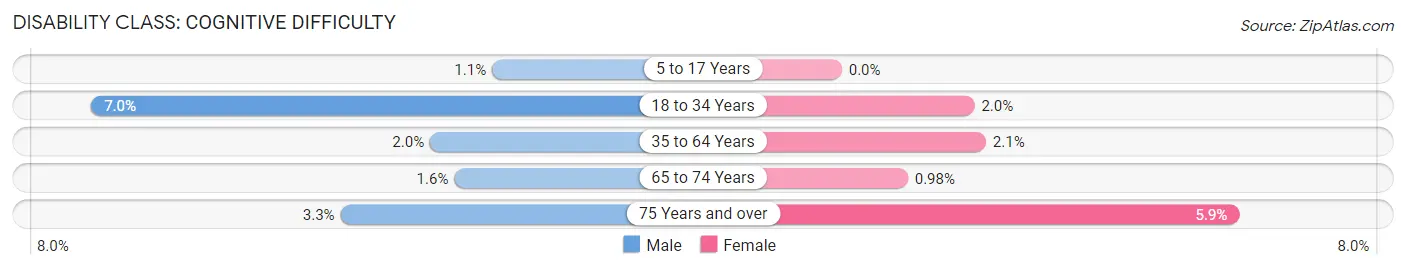
| Age Bracket | Male | Female |
| 5 to 17 Years | 8 (1.1%) | 0 (0.0%) |
| 18 to 34 Years | 41 (7.0%) | 17 (2.0%) |
| 35 to 64 Years | 51 (2.0%) | 61 (2.1%) |
| 65 to 74 Years | 34 (1.6%) | 23 (1.0%) |
| 75 Years and over | 87 (3.3%) | 185 (5.9%) |
Disability Class: Ambulatory Difficulty
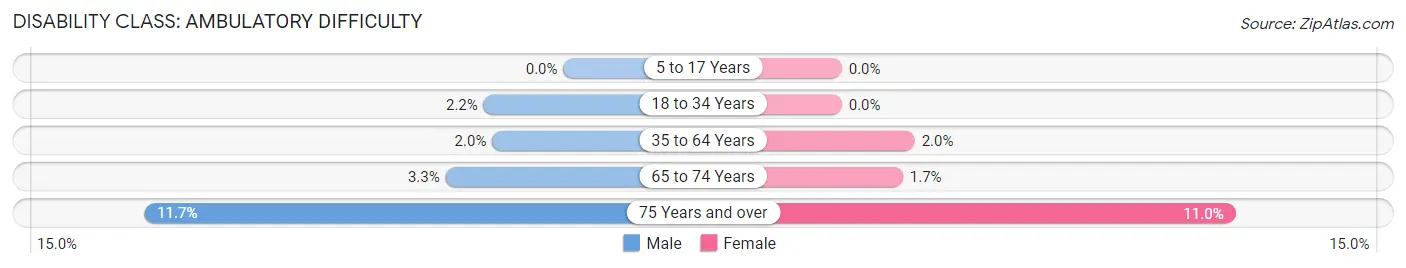
| Age Bracket | Male | Female |
| 5 to 17 Years | 0 (0.0%) | 0 (0.0%) |
| 18 to 34 Years | 13 (2.2%) | 0 (0.0%) |
| 35 to 64 Years | 51 (2.0%) | 58 (2.0%) |
| 65 to 74 Years | 69 (3.3%) | 40 (1.7%) |
| 75 Years and over | 307 (11.7%) | 344 (11.0%) |
Disability Class: Self-Care Difficulty
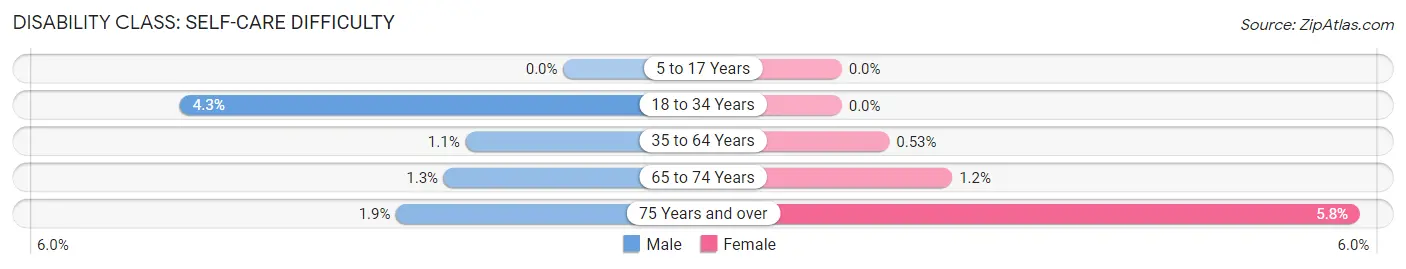
| Age Bracket | Male | Female |
| 5 to 17 Years | 0 (0.0%) | 0 (0.0%) |
| 18 to 34 Years | 25 (4.3%) | 0 (0.0%) |
| 35 to 64 Years | 28 (1.1%) | 15 (0.5%) |
| 65 to 74 Years | 28 (1.3%) | 29 (1.2%) |
| 75 Years and over | 49 (1.9%) | 181 (5.8%) |
Technology Access in Naples
Computing Device Access in Naples
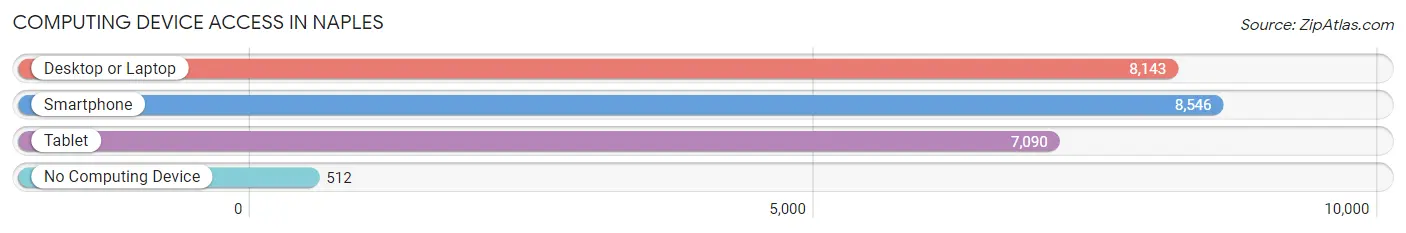
| Device Type | # Households | % Households |
| Desktop or Laptop | 8,143 | 85.0% |
| Smartphone | 8,546 | 89.2% |
| Tablet | 7,090 | 74.0% |
| No Computing Device | 512 | 5.3% |
| Total | 9,583 | 100.0% |
Internet Access in Naples
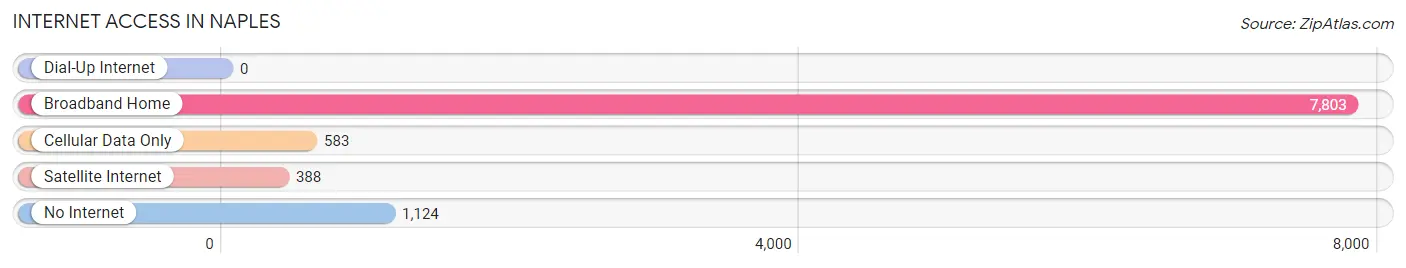
| Internet Type | # Households | % Households |
| Dial-Up Internet | 0 | 0.0% |
| Broadband Home | 7,803 | 81.4% |
| Cellular Data Only | 583 | 6.1% |
| Satellite Internet | 388 | 4.1% |
| No Internet | 1,124 | 11.7% |
| Total | 9,583 | 100.0% |
Naples Summary
Naples, Florida is a city located in Collier County, Florida, United States. It is the county seat of Collier County and is located on the Gulf of Mexico. As of the 2010 census, the city had a population of 19,537. Naples is a principal city of the Naples-Marco Island Metropolitan Statistical Area, which had a population of 322,000 as of 2015.
Geography
Naples is located in southwestern Florida, on the Gulf of Mexico. It is situated on the northern end of the Gulf Coast, about 25 miles south of Fort Myers and 95 miles north of Miami. The city is located on the western edge of the Everglades, and is bordered by the Big Cypress National Preserve to the east. The city is located on a barrier island, and is surrounded by several bodies of water, including the Gulf of Mexico, Naples Bay, and several smaller bays and estuaries.
Climate
Naples has a humid subtropical climate, with hot, humid summers and mild, dry winters. The average annual temperature is 75.5°F (24.2°C). The average high temperature in July is 90°F (32°C), and the average low temperature in January is 54°F (12°C). The average annual precipitation is 54.3 inches (137.9 cm).
Demographics
As of the 2010 census, there were 19,537 people, 9,845 households, and 5,845 families residing in the city. The population density was 1,845.3 people per square mile (711.9/km2). There were 11,845 housing units at an average density of 1,093.3 per square mile (422.2/km2). The racial makeup of the city was 94.2% White, 2.2% African American, 0.2% Native American, 1.3% Asian, 0.1% Pacific Islander, 1.2% from other races, and 0.9% from two or more races. Hispanic or Latino of any race were 6.3% of the population.
Economy
Naples is a major tourist destination, and the city's economy is heavily reliant on tourism. The city is home to several resorts, hotels, and golf courses, and is a popular destination for golfers, beachgoers, and nature lovers. The city is also home to several corporate headquarters, including Arthrex, Chico's, and Hertz. The city is also home to several medical centers, including the NCH Healthcare System and the Naples Community Hospital.
Naples is also home to several shopping centers, including the Waterside Shops, the Coastland Center, and the Mercato. The city is also home to several art galleries, museums, and theaters, including the Naples Museum of Art, the Naples Philharmonic, and the Sugden Community Theatre.
Conclusion
Naples, Florida is a city located in Collier County, Florida, United States. It is the county seat of Collier County and is located on the Gulf of Mexico. As of the 2010 census, the city had a population of 19,537. Naples is a principal city of the Naples-Marco Island Metropolitan Statistical Area, which had a population of 322,000 as of 2015. The city has a humid subtropical climate, with hot, humid summers and mild, dry winters. The city's economy is heavily reliant on tourism, and is home to several resorts, hotels, and golf courses. The city is also home to several corporate headquarters, medical centers, shopping centers, art galleries, museums, and theaters.
Common Questions
What is Per Capita Income in Naples?
Per Capita income in Naples is $141,245.
What is the Median Family Income in Naples?
Median Family Income in Naples is $185,223.
What is the Median Household income in Naples?
Median Household Income in Naples is $135,657.
What is Income or Wage Gap in Naples?
Income or Wage Gap in Naples is 54.8%.
Women in Naples earn 45.2 cents for every dollar earned by a man.
What is Inequality or Gini Index in Naples?
Inequality or Gini Index in Naples is 0.61.
What is the Total Population of Naples?
Total Population of Naples is 19,315.
What is the Total Male Population of Naples?
Total Male Population of Naples is 9,017.
What is the Total Female Population of Naples?
Total Female Population of Naples is 10,298.
What is the Ratio of Males per 100 Females in Naples?
There are 87.56 Males per 100 Females in Naples.
What is the Ratio of Females per 100 Males in Naples?
There are 114.21 Females per 100 Males in Naples.
What is the Median Population Age in Naples?
Median Population Age in Naples is 66.9 Years.
What is the Average Family Size in Naples
Average Family Size in Naples is 2.5 People.
What is the Average Household Size in Naples
Average Household Size in Naples is 2.0 People.
How Large is the Labor Force in Naples?
There are 6,464 People in the Labor Forcein in Naples.
What is the Percentage of People in the Labor Force in Naples?
36.6% of People are in the Labor Force in Naples.
What is the Unemployment Rate in Naples?
Unemployment Rate in Naples is 2.5%.