Fish Hawk, FL Map & Demographics
Fish Hawk Map
Fish Hawk Overview
$47,021
PER CAPITA INCOME
$138,333
AVG FAMILY INCOME
$129,580
AVG HOUSEHOLD INCOME
51.9%
WAGE / INCOME GAP [ % ]
48.1¢/ $1
WAGE / INCOME GAP [ $ ]
$14,706
FAMILY INCOME DEFICIT
0.40
INEQUALITY / GINI INDEX
25,179
TOTAL POPULATION
11,900
MALE POPULATION
13,279
FEMALE POPULATION
89.62
MALES / 100 FEMALES
111.59
FEMALES / 100 MALES
35.3
MEDIAN AGE
3.5
AVG FAMILY SIZE
3.3
AVG HOUSEHOLD SIZE
11,938
LABOR FORCE [ PEOPLE ]
68.2%
PERCENT IN LABOR FORCE
5.6%
UNEMPLOYMENT RATE
Income in Fish Hawk
Income Overview in Fish Hawk
Per Capita Income in Fish Hawk is $47,021, while median incomes of families and households are $138,333 and $129,580 respectively.
| Characteristic | Number | Measure |
| Per Capita Income | 25,179 | $47,021 |
| Median Family Income | 6,806 | $138,333 |
| Mean Family Income | 6,806 | $162,290 |
| Median Household Income | 7,697 | $129,580 |
| Mean Household Income | 7,697 | $152,638 |
| Income Deficit | 6,806 | $14,706 |
| Wage / Income Gap (%) | 25,179 | 51.86% |
| Wage / Income Gap ($) | 25,179 | 48.14¢ per $1 |
| Gini / Inequality Index | 25,179 | 0.40 |
Earnings by Sex in Fish Hawk
Average Earnings in Fish Hawk are $61,614, $93,625 for men and $45,074 for women, a difference of 51.9%.
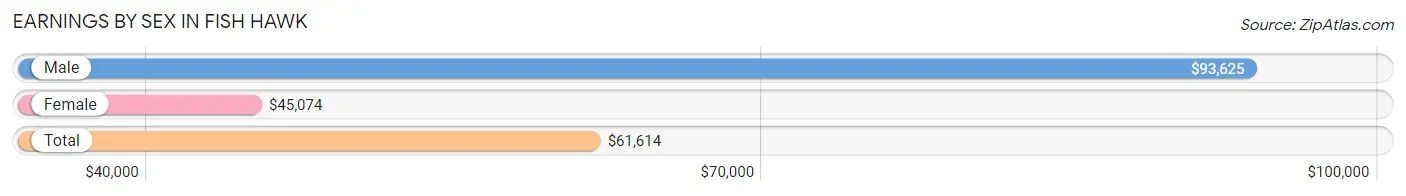
| Sex | Number | Average Earnings |
| Male | 6,032 (49.8%) | $93,625 |
| Female | 6,086 (50.2%) | $45,074 |
| Total | 12,118 (100.0%) | $61,614 |
Earnings by Sex by Income Bracket in Fish Hawk
The most common earnings brackets in Fish Hawk are $100,000+ for men (2,850 | 47.2%) and $100,000+ for women (1,034 | 17.0%).
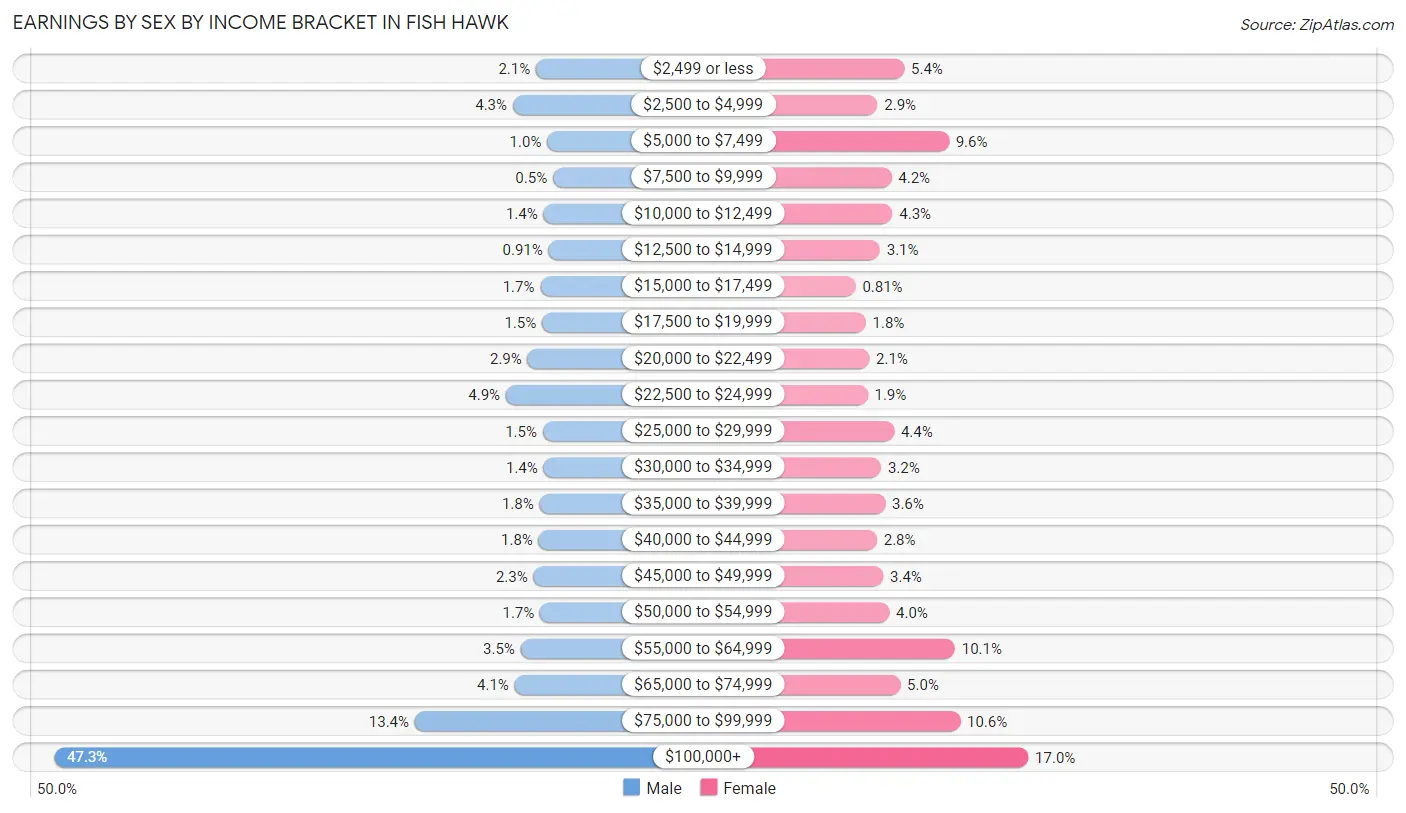
| Income | Male | Female |
| $2,499 or less | 126 (2.1%) | 327 (5.4%) |
| $2,500 to $4,999 | 257 (4.3%) | 174 (2.9%) |
| $5,000 to $7,499 | 63 (1.0%) | 581 (9.6%) |
| $7,500 to $9,999 | 30 (0.5%) | 254 (4.2%) |
| $10,000 to $12,499 | 84 (1.4%) | 260 (4.3%) |
| $12,500 to $14,999 | 55 (0.9%) | 188 (3.1%) |
| $15,000 to $17,499 | 102 (1.7%) | 49 (0.8%) |
| $17,500 to $19,999 | 92 (1.5%) | 107 (1.8%) |
| $20,000 to $22,499 | 174 (2.9%) | 127 (2.1%) |
| $22,500 to $24,999 | 296 (4.9%) | 118 (1.9%) |
| $25,000 to $29,999 | 88 (1.5%) | 269 (4.4%) |
| $30,000 to $34,999 | 84 (1.4%) | 195 (3.2%) |
| $35,000 to $39,999 | 106 (1.8%) | 218 (3.6%) |
| $40,000 to $44,999 | 111 (1.8%) | 171 (2.8%) |
| $45,000 to $49,999 | 140 (2.3%) | 207 (3.4%) |
| $50,000 to $54,999 | 103 (1.7%) | 241 (4.0%) |
| $55,000 to $64,999 | 213 (3.5%) | 616 (10.1%) |
| $65,000 to $74,999 | 247 (4.1%) | 304 (5.0%) |
| $75,000 to $99,999 | 811 (13.4%) | 646 (10.6%) |
| $100,000+ | 2,850 (47.2%) | 1,034 (17.0%) |
| Total | 6,032 (100.0%) | 6,086 (100.0%) |
Earnings by Sex by Educational Attainment in Fish Hawk
Average earnings in Fish Hawk are $102,464 for men and $51,994 for women, a difference of 49.3%. Men with an educational attainment of graduate degree enjoy the highest average annual earnings of $142,037, while those with less than high school education earn the least with $21,875. Women with an educational attainment of graduate degree earn the most with the average annual earnings of $84,028, while those with college or associate's degree education have the smallest earnings of $34,792.
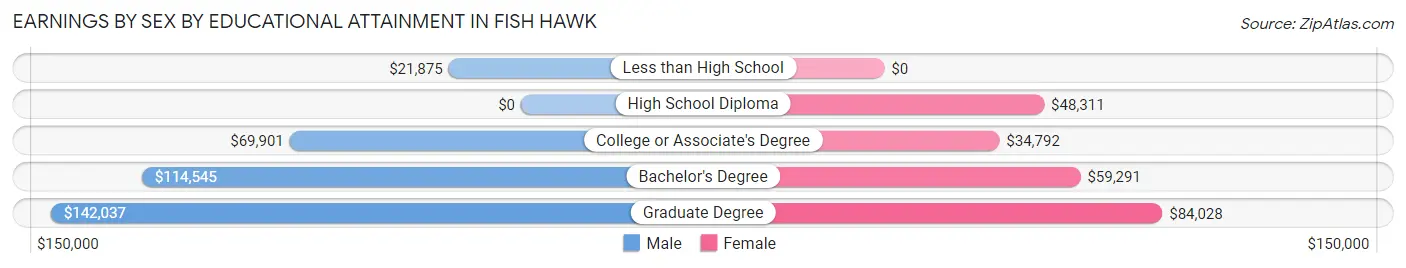
| Educational Attainment | Male Income | Female Income |
| Less than High School | $21,875 | $0 |
| High School Diploma | - | - |
| College or Associate's Degree | $69,901 | $34,792 |
| Bachelor's Degree | $114,545 | $59,291 |
| Graduate Degree | $142,037 | $84,028 |
| Total | $102,464 | $51,994 |
Family Income in Fish Hawk
Family Income Brackets in Fish Hawk
According to the Fish Hawk family income data, there are 1,974 families falling into the $200,000+ income range, which is the most common income bracket and makes up 29.0% of all families. Conversely, the $10,000 to $14,999 income bracket is the least frequent group with only 27 families (0.4%) belonging to this category.
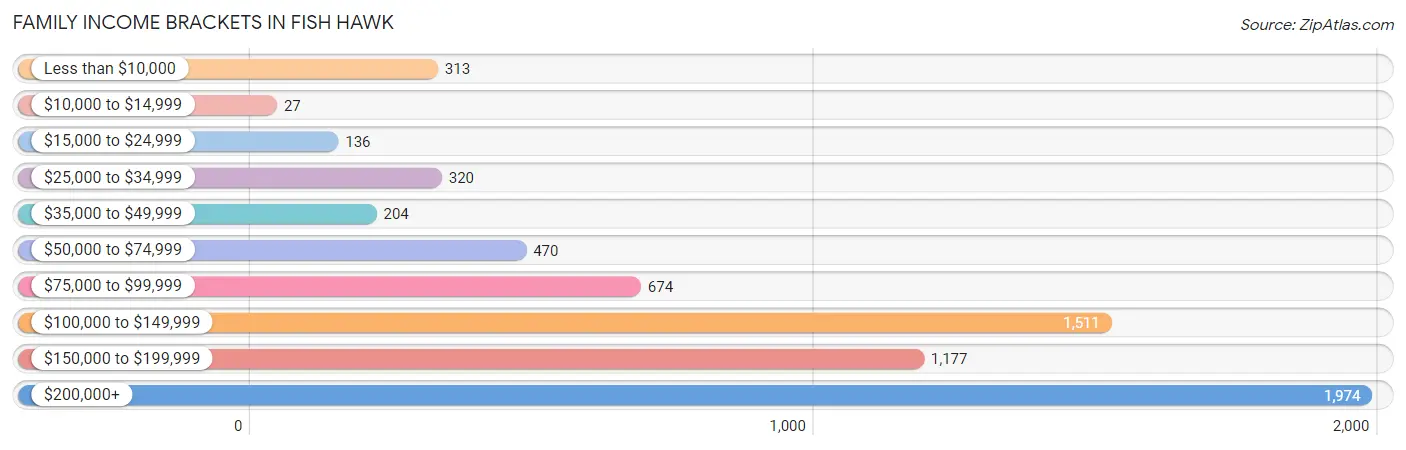
| Income Bracket | # Families | % Families |
| Less than $10,000 | 313 | 4.6% |
| $10,000 to $14,999 | 27 | 0.4% |
| $15,000 to $24,999 | 136 | 2.0% |
| $25,000 to $34,999 | 320 | 4.7% |
| $35,000 to $49,999 | 204 | 3.0% |
| $50,000 to $74,999 | 470 | 6.9% |
| $75,000 to $99,999 | 674 | 9.9% |
| $100,000 to $149,999 | 1,511 | 22.2% |
| $150,000 to $199,999 | 1,177 | 17.3% |
| $200,000+ | 1,974 | 29.0% |
Family Income by Famaliy Size in Fish Hawk
7+ person families (75 | 1.1%) account for the highest median family income in Fish Hawk with $219,464 per family, while 3-person families (1,527 | 22.4%) have the highest median income of $56,250 per family member.
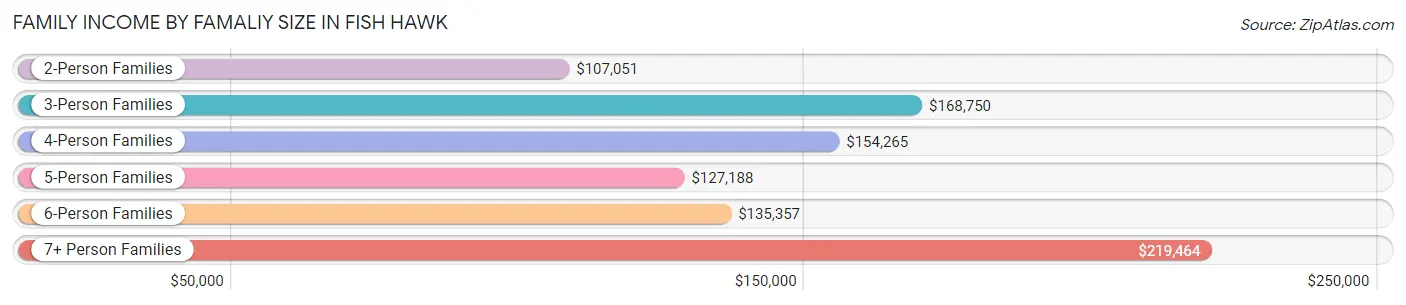
| Income Bracket | # Families | Median Income |
| 2-Person Families | 2,090 (30.7%) | $107,051 |
| 3-Person Families | 1,527 (22.4%) | $168,750 |
| 4-Person Families | 2,026 (29.8%) | $154,265 |
| 5-Person Families | 890 (13.1%) | $127,188 |
| 6-Person Families | 198 (2.9%) | $135,357 |
| 7+ Person Families | 75 (1.1%) | $219,464 |
| Total | 6,806 (100.0%) | $138,333 |
Family Income by Number of Earners in Fish Hawk
The median family income in Fish Hawk is $138,333, with families comprising 2 earners (3,542) having the highest median family income of $163,983, while families with no earners (627) have the lowest median family income of $73,036, accounting for 52.0% and 9.2% of families, respectively.
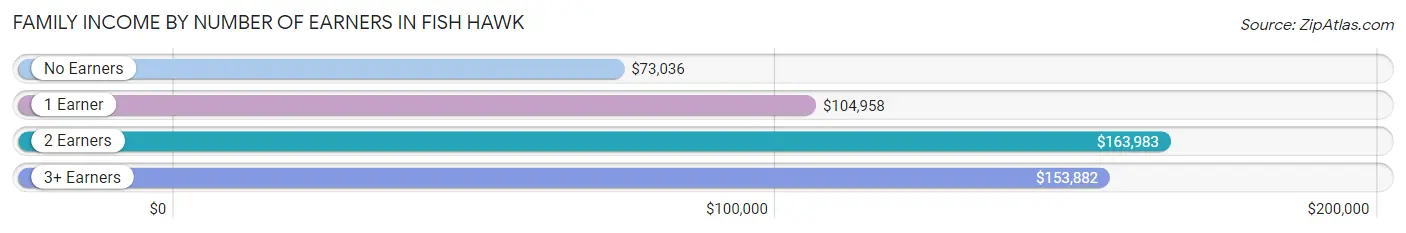
| Number of Earners | # Families | Median Income |
| No Earners | 627 (9.2%) | $73,036 |
| 1 Earner | 2,041 (30.0%) | $104,958 |
| 2 Earners | 3,542 (52.0%) | $163,983 |
| 3+ Earners | 596 (8.8%) | $153,882 |
| Total | 6,806 (100.0%) | $138,333 |
Household Income in Fish Hawk
Household Income Brackets in Fish Hawk
With 2,017 households falling in the category, the $200,000+ income range is the most frequent in Fish Hawk, accounting for 26.2% of all households. In contrast, only 38 households (0.5%) fall into the $10,000 to $14,999 income bracket, making it the least populous group.
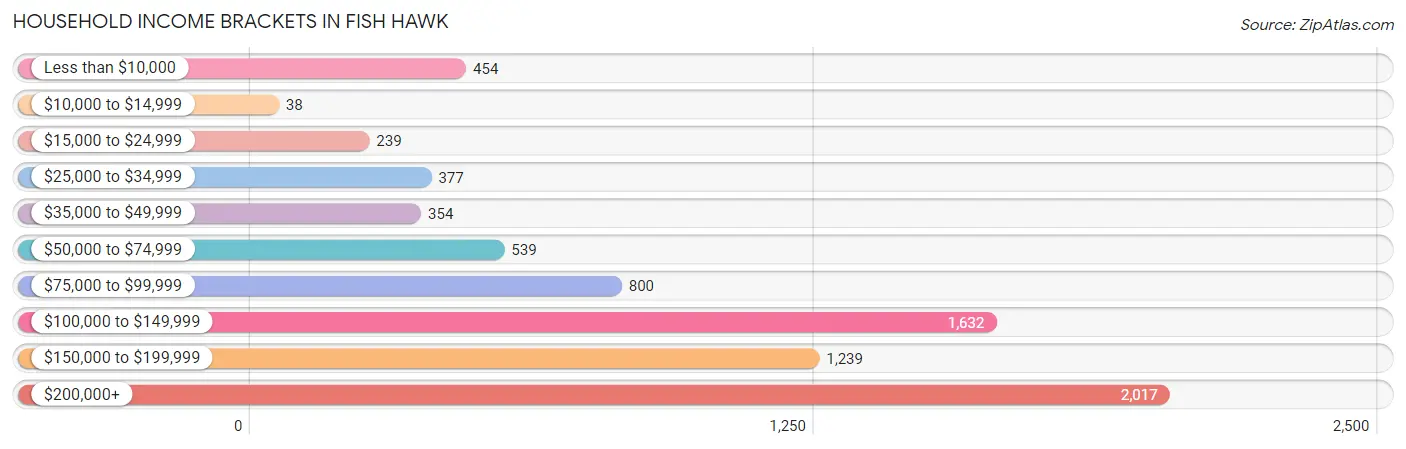
| Income Bracket | # Households | % Households |
| Less than $10,000 | 454 | 5.9% |
| $10,000 to $14,999 | 38 | 0.5% |
| $15,000 to $24,999 | 239 | 3.1% |
| $25,000 to $34,999 | 377 | 4.9% |
| $35,000 to $49,999 | 354 | 4.6% |
| $50,000 to $74,999 | 539 | 7.0% |
| $75,000 to $99,999 | 800 | 10.4% |
| $100,000 to $149,999 | 1,632 | 21.2% |
| $150,000 to $199,999 | 1,239 | 16.1% |
| $200,000+ | 2,017 | 26.2% |
Household Income by Householder Age in Fish Hawk
The median household income in Fish Hawk is $129,580, with the highest median household income of $153,306 found in the 45 to 64 years age bracket for the primary householder. A total of 3,544 households (46.0%) fall into this category.
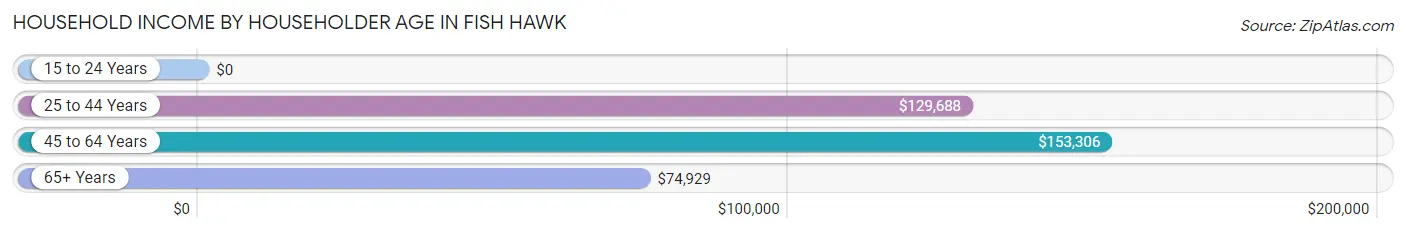
| Income Bracket | # Households | Median Income |
| 15 to 24 Years | 0 (0.0%) | $0 |
| 25 to 44 Years | 3,143 (40.8%) | $129,688 |
| 45 to 64 Years | 3,544 (46.0%) | $153,306 |
| 65+ Years | 1,010 (13.1%) | $74,929 |
| Total | 7,697 (100.0%) | $129,580 |
Poverty in Fish Hawk
Income Below Poverty by Sex and Age in Fish Hawk
With 5.3% poverty level for males and 9.8% for females among the residents of Fish Hawk, 25 to 34 year old males and 25 to 34 year old females are the most vulnerable to poverty, with 106 males (13.0%) and 379 females (23.3%) in their respective age groups living below the poverty level.
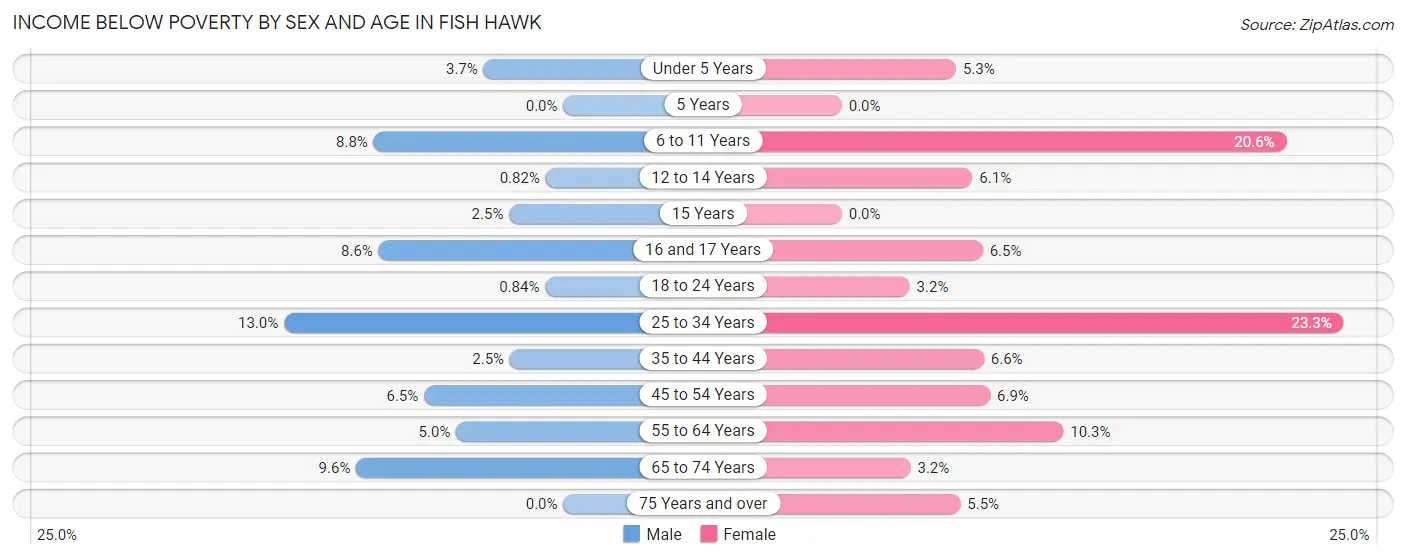
| Age Bracket | Male | Female |
| Under 5 Years | 33 (3.7%) | 44 (5.3%) |
| 5 Years | 0 (0.0%) | 0 (0.0%) |
| 6 to 11 Years | 141 (8.8%) | 295 (20.6%) |
| 12 to 14 Years | 8 (0.8%) | 71 (6.1%) |
| 15 Years | 7 (2.5%) | 0 (0.0%) |
| 16 and 17 Years | 36 (8.6%) | 31 (6.5%) |
| 18 to 24 Years | 7 (0.8%) | 21 (3.2%) |
| 25 to 34 Years | 106 (13.0%) | 379 (23.3%) |
| 35 to 44 Years | 52 (2.5%) | 146 (6.6%) |
| 45 to 54 Years | 133 (6.5%) | 149 (6.9%) |
| 55 to 64 Years | 52 (5.0%) | 94 (10.3%) |
| 65 to 74 Years | 57 (9.6%) | 26 (3.2%) |
| 75 Years and over | 0 (0.0%) | 29 (5.5%) |
| Total | 632 (5.3%) | 1,285 (9.8%) |
Income Above Poverty by Sex and Age in Fish Hawk
According to the poverty statistics in Fish Hawk, males aged 5 years and females aged 5 years are the age groups that are most secure financially, with 100.0% of males and 100.0% of females in these age groups living above the poverty line.
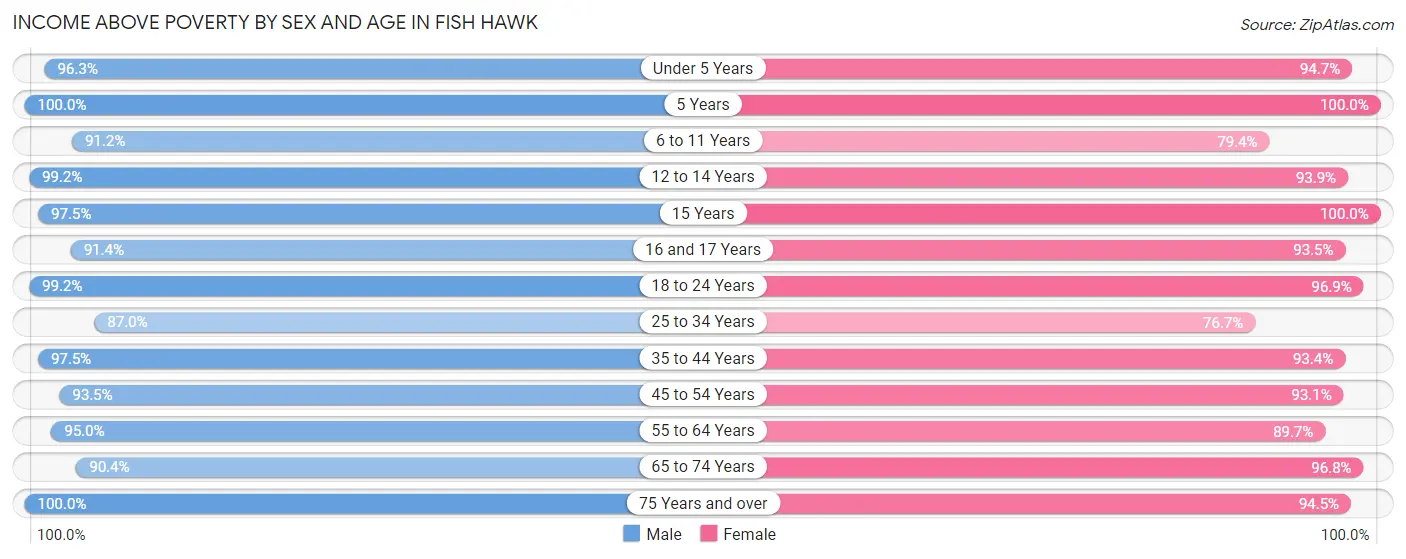
| Age Bracket | Male | Female |
| Under 5 Years | 858 (96.3%) | 786 (94.7%) |
| 5 Years | 76 (100.0%) | 58 (100.0%) |
| 6 to 11 Years | 1,461 (91.2%) | 1,135 (79.4%) |
| 12 to 14 Years | 964 (99.2%) | 1,101 (93.9%) |
| 15 Years | 272 (97.5%) | 279 (100.0%) |
| 16 and 17 Years | 384 (91.4%) | 443 (93.5%) |
| 18 to 24 Years | 827 (99.2%) | 646 (96.9%) |
| 25 to 34 Years | 712 (87.0%) | 1,249 (76.7%) |
| 35 to 44 Years | 2,041 (97.5%) | 2,071 (93.4%) |
| 45 to 54 Years | 1,927 (93.5%) | 2,016 (93.1%) |
| 55 to 64 Years | 995 (95.0%) | 820 (89.7%) |
| 65 to 74 Years | 536 (90.4%) | 789 (96.8%) |
| 75 Years and over | 215 (100.0%) | 498 (94.5%) |
| Total | 11,268 (94.7%) | 11,891 (90.2%) |
Income Below Poverty Among Married-Couple Families in Fish Hawk
The poverty statistics for married-couple families in Fish Hawk show that 3.8% or 221 of the total 5,795 families live below the poverty line. Families with 1 or 2 children have the highest poverty rate of 5.8%, comprising of 177 families. On the other hand, families with 3 or 4 children have the lowest poverty rate of 0.0%, which includes 0 families.
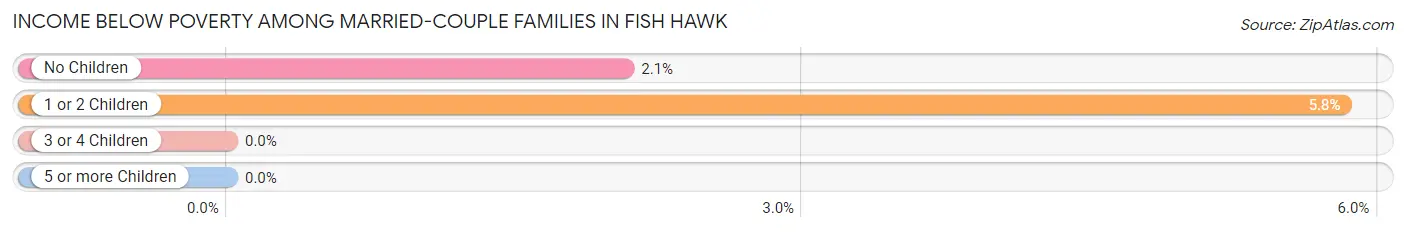
| Children | Above Poverty | Below Poverty |
| No Children | 2,079 (97.9%) | 44 (2.1%) |
| 1 or 2 Children | 2,863 (94.2%) | 177 (5.8%) |
| 3 or 4 Children | 599 (100.0%) | 0 (0.0%) |
| 5 or more Children | 33 (100.0%) | 0 (0.0%) |
| Total | 5,574 (96.2%) | 221 (3.8%) |
Income Below Poverty Among Single-Parent Households in Fish Hawk
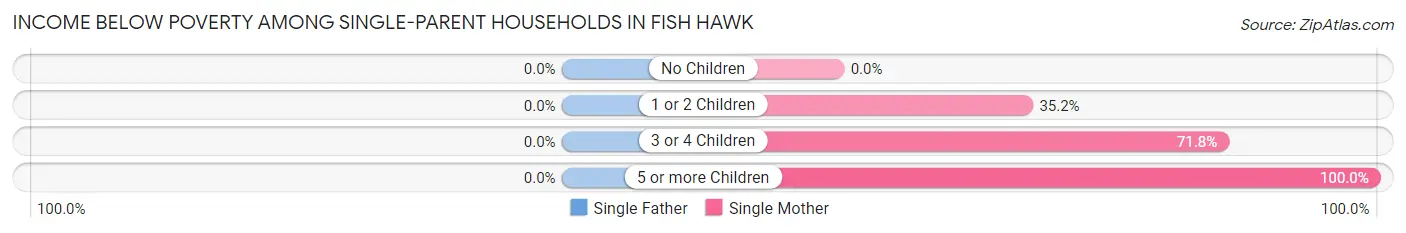
| Children | Single Father | Single Mother |
| No Children | 0 (0.0%) | 0 (0.0%) |
| 1 or 2 Children | 0 (0.0%) | 218 (35.2%) |
| 3 or 4 Children | 0 (0.0%) | 56 (71.8%) |
| 5 or more Children | 0 (0.0%) | 5 (100.0%) |
| Total | 0 (0.0%) | 279 (31.4%) |
Income Below Poverty Among Married-Couple vs Single-Parent Households in Fish Hawk
The poverty data for Fish Hawk shows that 221 of the married-couple family households (3.8%) and 279 of the single-parent households (27.6%) are living below the poverty level. Within the married-couple family households, those with 1 or 2 children have the highest poverty rate, with 177 households (5.8%) falling below the poverty line. Among the single-parent households, those with 5 or more children have the highest poverty rate, with 5 household (100.0%) living below poverty.
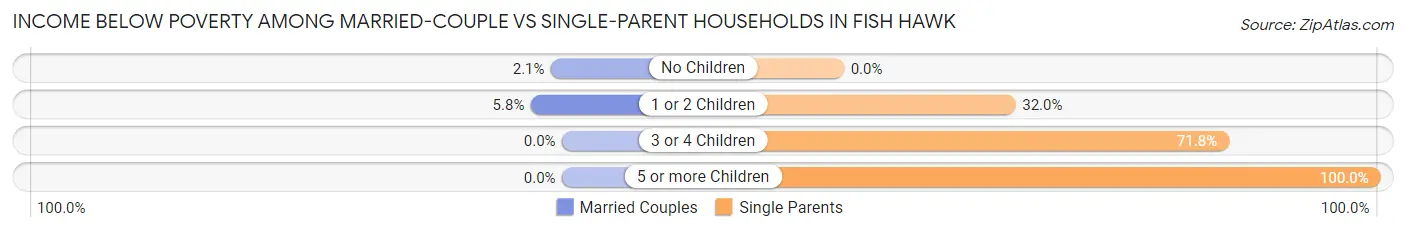
| Children | Married-Couple Families | Single-Parent Households |
| No Children | 44 (2.1%) | 0 (0.0%) |
| 1 or 2 Children | 177 (5.8%) | 218 (32.0%) |
| 3 or 4 Children | 0 (0.0%) | 56 (71.8%) |
| 5 or more Children | 0 (0.0%) | 5 (100.0%) |
| Total | 221 (3.8%) | 279 (27.6%) |
Race in Fish Hawk
The most populous races in Fish Hawk are White / Caucasian (19,314 | 76.7%), Hispanic or Latino (3,797 | 15.1%), and Two or more Races (1,943 | 7.7%).
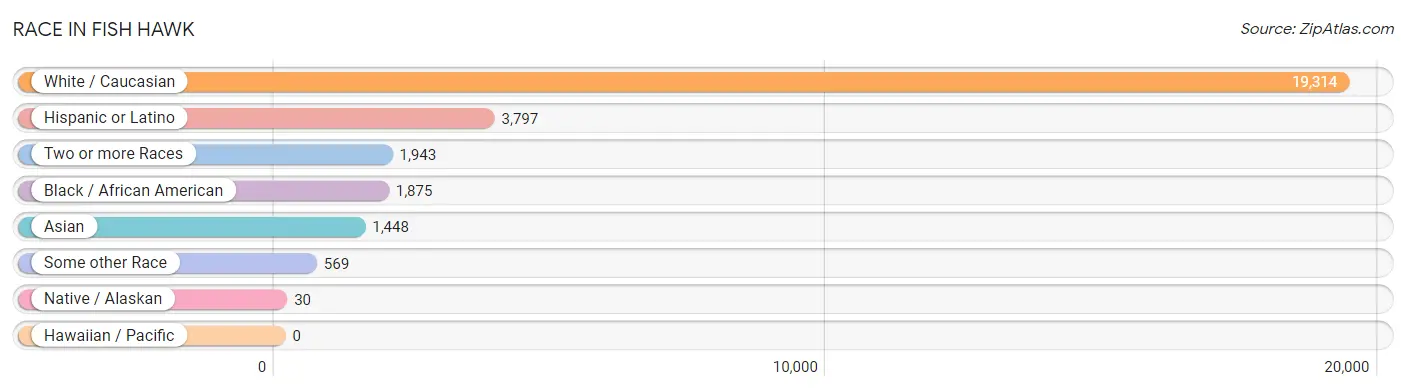
| Race | # Population | % Population |
| Asian | 1,448 | 5.8% |
| Black / African American | 1,875 | 7.4% |
| Hawaiian / Pacific | 0 | 0.0% |
| Hispanic or Latino | 3,797 | 15.1% |
| Native / Alaskan | 30 | 0.1% |
| White / Caucasian | 19,314 | 76.7% |
| Two or more Races | 1,943 | 7.7% |
| Some other Race | 569 | 2.3% |
| Total | 25,179 | 100.0% |
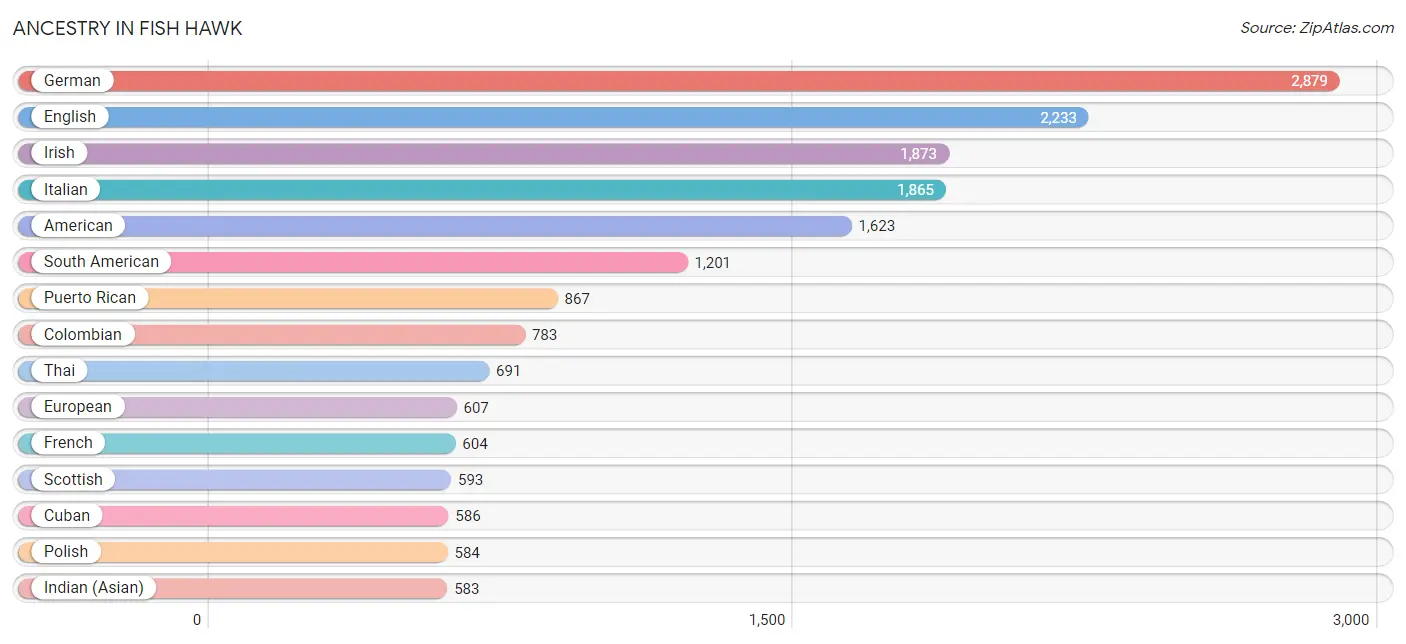
Ancestry in Fish Hawk
The most populous ancestries reported in Fish Hawk are German (2,879 | 11.4%), English (2,233 | 8.9%), Irish (1,873 | 7.4%), Italian (1,865 | 7.4%), and American (1,623 | 6.5%), together accounting for 41.6% of all Fish Hawk residents.
| Ancestry | # Population | % Population |
| African | 7 | 0.0% |
| American | 1,623 | 6.5% |
| Arab | 52 | 0.2% |
| Argentinean | 90 | 0.4% |
| Armenian | 254 | 1.0% |
| Austrian | 114 | 0.4% |
| Bahamian | 86 | 0.3% |
| Barbadian | 11 | 0.0% |
| Bhutanese | 20 | 0.1% |
| Blackfeet | 5 | 0.0% |
| Bolivian | 35 | 0.1% |
| British | 294 | 1.2% |
| Burmese | 24 | 0.1% |
| Canadian | 45 | 0.2% |
| Central American | 237 | 0.9% |
| Cherokee | 35 | 0.1% |
| Colombian | 783 | 3.1% |
| Cree | 7 | 0.0% |
| Croatian | 14 | 0.1% |
| Cuban | 586 | 2.3% |
| Czech | 48 | 0.2% |
| Danish | 14 | 0.1% |
| Dominican | 71 | 0.3% |
| Dutch | 255 | 1.0% |
| Eastern European | 31 | 0.1% |
| Ecuadorian | 101 | 0.4% |
| English | 2,233 | 8.9% |
| Estonian | 11 | 0.0% |
| European | 607 | 2.4% |
| Filipino | 70 | 0.3% |
| French | 604 | 2.4% |
| French Canadian | 224 | 0.9% |
| German | 2,879 | 11.4% |
| Greek | 68 | 0.3% |
| Guatemalan | 184 | 0.7% |
| Guyanese | 102 | 0.4% |
| Haitian | 7 | 0.0% |
| Hungarian | 163 | 0.6% |
| Indian (Asian) | 583 | 2.3% |
| Irish | 1,873 | 7.4% |
| Italian | 1,865 | 7.4% |
| Jamaican | 146 | 0.6% |
| Korean | 173 | 0.7% |
| Lebanese | 29 | 0.1% |
| Lithuanian | 60 | 0.2% |
| Mexican | 547 | 2.2% |
| Moroccan | 7 | 0.0% |
| Native Hawaiian | 24 | 0.1% |
| Nicaraguan | 33 | 0.1% |
| Northern European | 80 | 0.3% |
| Norwegian | 503 | 2.0% |
| Pakistani | 25 | 0.1% |
| Panamanian | 20 | 0.1% |
| Peruvian | 179 | 0.7% |
| Polish | 584 | 2.3% |
| Portuguese | 198 | 0.8% |
| Puerto Rican | 867 | 3.4% |
| Romanian | 45 | 0.2% |
| Russian | 405 | 1.6% |
| Scandinavian | 36 | 0.1% |
| Scotch-Irish | 386 | 1.5% |
| Scottish | 593 | 2.4% |
| Serbian | 9 | 0.0% |
| Slovak | 10 | 0.0% |
| South American | 1,201 | 4.8% |
| Spaniard | 232 | 0.9% |
| Spanish | 27 | 0.1% |
| Sri Lankan | 184 | 0.7% |
| Subsaharan African | 7 | 0.0% |
| Swedish | 399 | 1.6% |
| Swiss | 58 | 0.2% |
| Thai | 691 | 2.7% |
| Turkish | 36 | 0.1% |
| Ukrainian | 76 | 0.3% |
| Venezuelan | 13 | 0.1% |
| Welsh | 36 | 0.1% |
| West Indian | 107 | 0.4% | View All 77 Rows |
Immigrants in Fish Hawk
The most numerous immigrant groups reported in Fish Hawk came from Latin America (1,460 | 5.8%), Asia (955 | 3.8%), South America (847 | 3.4%), Europe (801 | 3.2%), and Eastern Europe (512 | 2.0%), together accounting for 18.2% of all Fish Hawk residents.
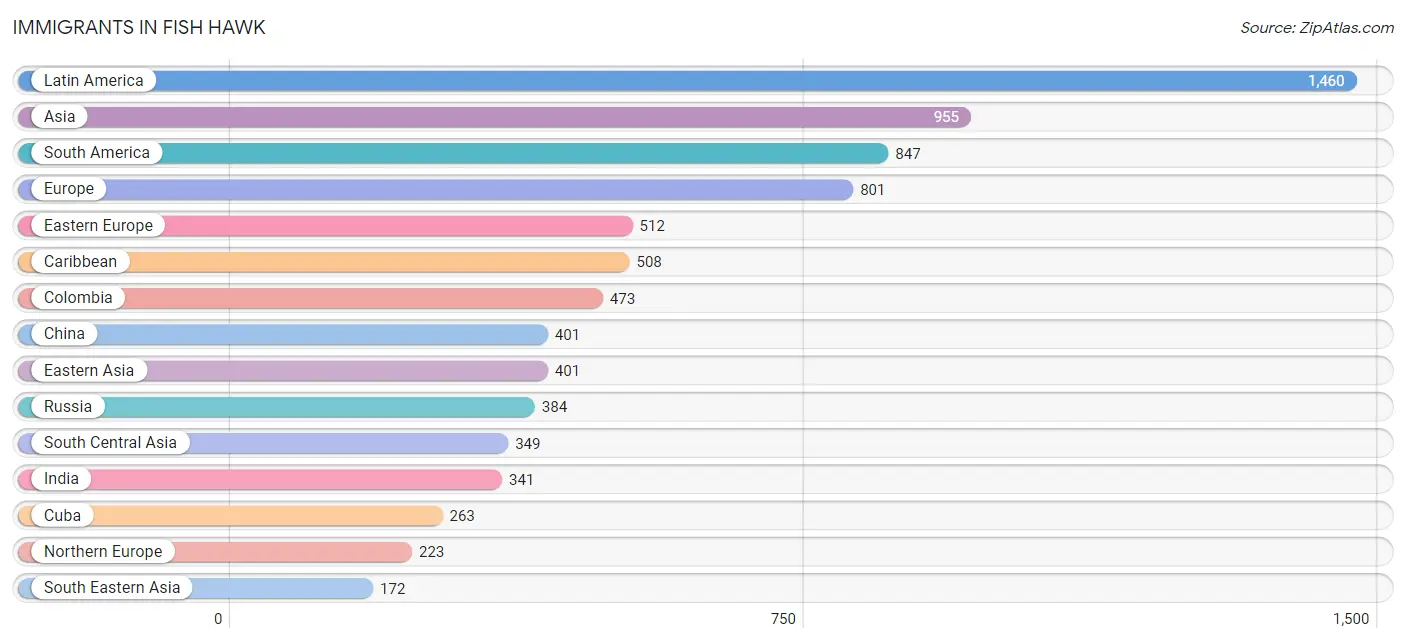
| Immigration Origin | # Population | % Population |
| Africa | 10 | 0.0% |
| Argentina | 43 | 0.2% |
| Asia | 955 | 3.8% |
| Bahamas | 86 | 0.3% |
| Bolivia | 35 | 0.1% |
| Brazil | 155 | 0.6% |
| Canada | 114 | 0.4% |
| Caribbean | 508 | 2.0% |
| Central America | 105 | 0.4% |
| China | 401 | 1.6% |
| Colombia | 473 | 1.9% |
| Cuba | 263 | 1.0% |
| Dominican Republic | 34 | 0.1% |
| Eastern Asia | 401 | 1.6% |
| Eastern Europe | 512 | 2.0% |
| England | 67 | 0.3% |
| Europe | 801 | 3.2% |
| Germany | 56 | 0.2% |
| Guatemala | 66 | 0.3% |
| Guyana | 64 | 0.3% |
| Haiti | 7 | 0.0% |
| Hong Kong | 63 | 0.3% |
| Hungary | 91 | 0.4% |
| India | 341 | 1.3% |
| Jamaica | 95 | 0.4% |
| Latin America | 1,460 | 5.8% |
| Lebanon | 7 | 0.0% |
| Mexico | 9 | 0.0% |
| Nepal | 8 | 0.0% |
| Nicaragua | 11 | 0.0% |
| Northern Europe | 223 | 0.9% |
| Panama | 19 | 0.1% |
| Peru | 64 | 0.3% |
| Philippines | 75 | 0.3% |
| Poland | 27 | 0.1% |
| Portugal | 10 | 0.0% |
| Romania | 10 | 0.0% |
| Russia | 384 | 1.5% |
| Scotland | 9 | 0.0% |
| Singapore | 37 | 0.2% |
| South Africa | 10 | 0.0% |
| South America | 847 | 3.4% |
| South Central Asia | 349 | 1.4% |
| South Eastern Asia | 172 | 0.7% |
| Southern Europe | 10 | 0.0% |
| Taiwan | 70 | 0.3% |
| Trinidad and Tobago | 23 | 0.1% |
| Turkey | 11 | 0.0% |
| Venezuela | 13 | 0.1% |
| Vietnam | 60 | 0.2% |
| Western Asia | 33 | 0.1% |
| Western Europe | 56 | 0.2% | View All 52 Rows |
Sex and Age in Fish Hawk
Sex and Age in Fish Hawk
The most populous age groups in Fish Hawk are 10 to 14 Years (1,496 | 12.6%) for men and 10 to 14 Years (1,713 | 12.9%) for women.
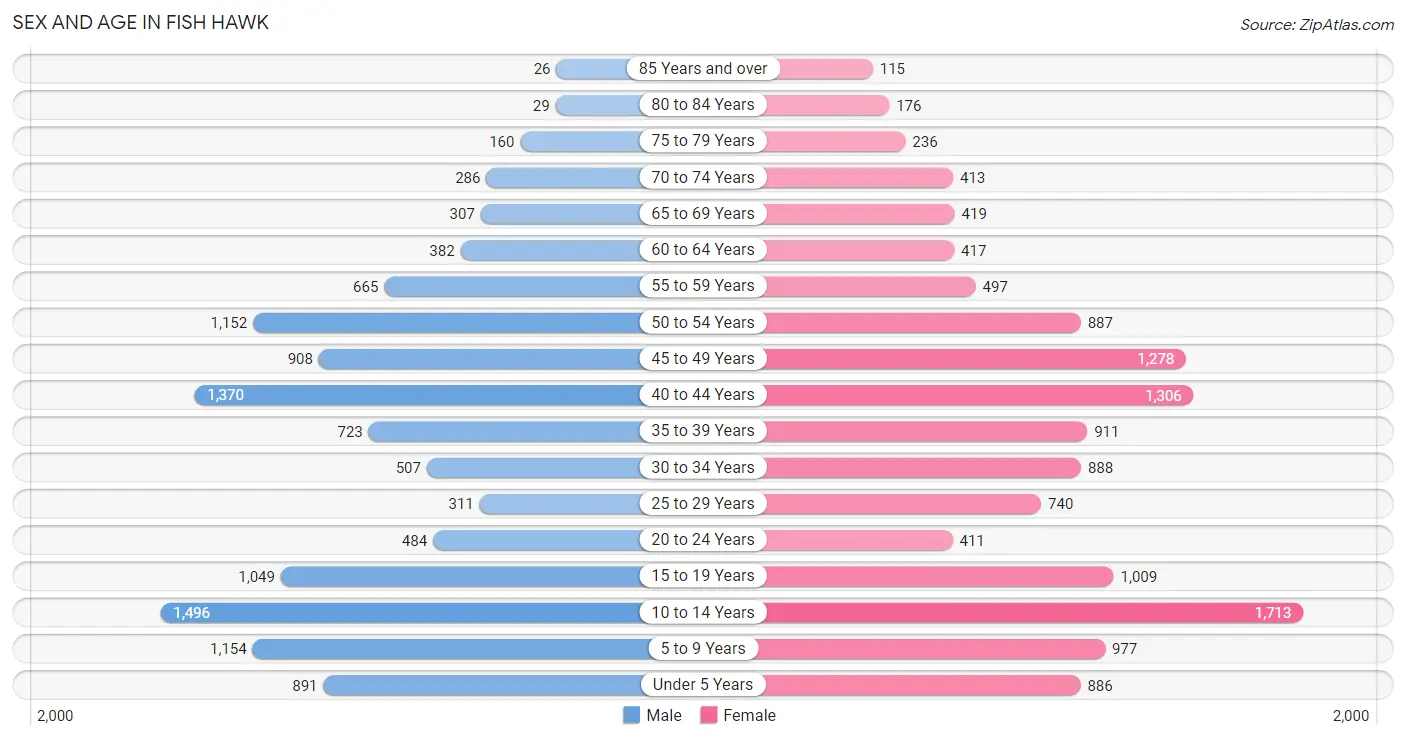
| Age Bracket | Male | Female |
| Under 5 Years | 891 (7.5%) | 886 (6.7%) |
| 5 to 9 Years | 1,154 (9.7%) | 977 (7.4%) |
| 10 to 14 Years | 1,496 (12.6%) | 1,713 (12.9%) |
| 15 to 19 Years | 1,049 (8.8%) | 1,009 (7.6%) |
| 20 to 24 Years | 484 (4.1%) | 411 (3.1%) |
| 25 to 29 Years | 311 (2.6%) | 740 (5.6%) |
| 30 to 34 Years | 507 (4.3%) | 888 (6.7%) |
| 35 to 39 Years | 723 (6.1%) | 911 (6.9%) |
| 40 to 44 Years | 1,370 (11.5%) | 1,306 (9.8%) |
| 45 to 49 Years | 908 (7.6%) | 1,278 (9.6%) |
| 50 to 54 Years | 1,152 (9.7%) | 887 (6.7%) |
| 55 to 59 Years | 665 (5.6%) | 497 (3.7%) |
| 60 to 64 Years | 382 (3.2%) | 417 (3.1%) |
| 65 to 69 Years | 307 (2.6%) | 419 (3.2%) |
| 70 to 74 Years | 286 (2.4%) | 413 (3.1%) |
| 75 to 79 Years | 160 (1.3%) | 236 (1.8%) |
| 80 to 84 Years | 29 (0.2%) | 176 (1.3%) |
| 85 Years and over | 26 (0.2%) | 115 (0.9%) |
| Total | 11,900 (100.0%) | 13,279 (100.0%) |
Families and Households in Fish Hawk
Median Family Size in Fish Hawk
The median family size in Fish Hawk is 3.51 persons per family, with married-couple families (5,795 | 85.2%) accounting for the largest median family size of 3.55 persons per family. On the other hand, single male/father families (122 | 1.8%) represent the smallest median family size with 2.52 persons per family.
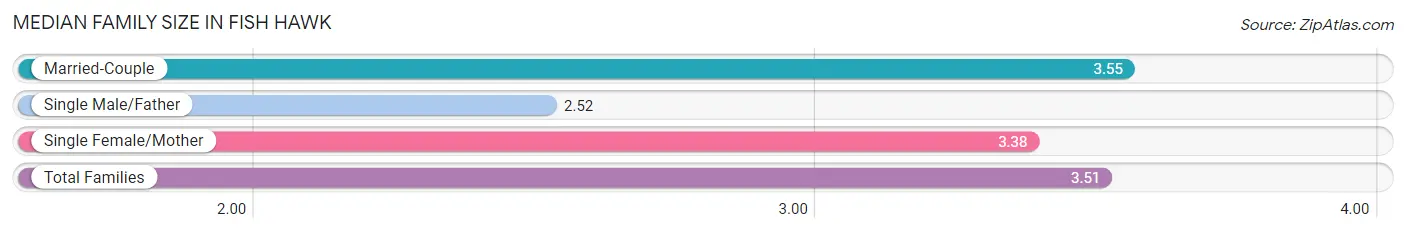
| Family Type | # Families | Family Size |
| Married-Couple | 5,795 (85.2%) | 3.55 |
| Single Male/Father | 122 (1.8%) | 2.52 |
| Single Female/Mother | 889 (13.1%) | 3.38 |
| Total Families | 6,806 (100.0%) | 3.51 |
Median Household Size in Fish Hawk
The median household size in Fish Hawk is 3.27 persons per household, with married-couple households (5,795 | 75.3%) accounting for the largest median household size of 3.55 persons per household. non-family households (891 | 11.6%) represent the smallest median household size with 1.24 persons per household.
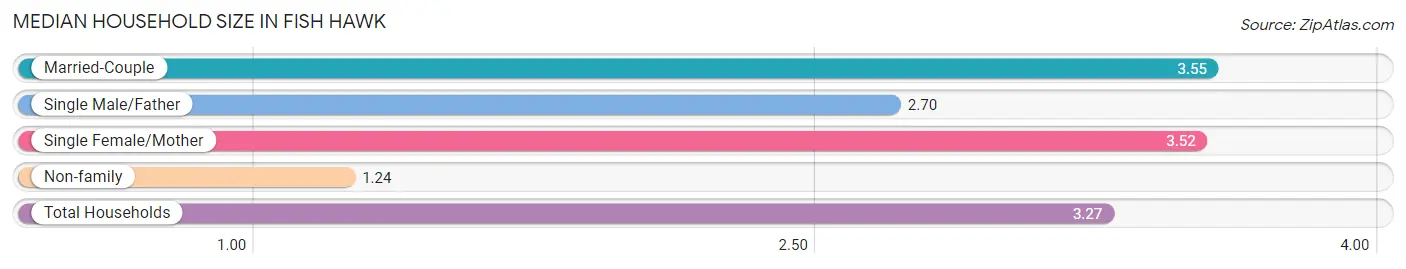
| Household Type | # Households | Household Size |
| Married-Couple | 5,795 (75.3%) | 3.55 |
| Single Male/Father | 122 (1.6%) | 2.70 |
| Single Female/Mother | 889 (11.6%) | 3.52 |
| Non-family | 891 (11.6%) | 1.24 |
| Total Households | 7,697 (100.0%) | 3.27 |
Household Size by Marriage Status in Fish Hawk
Out of a total of 7,697 households in Fish Hawk, 6,806 (88.4%) are family households, while 891 (11.6%) are nonfamily households. The most numerous type of family households are 4-person households, comprising 2,046, and the most common type of nonfamily households are 1-person households, comprising 755.
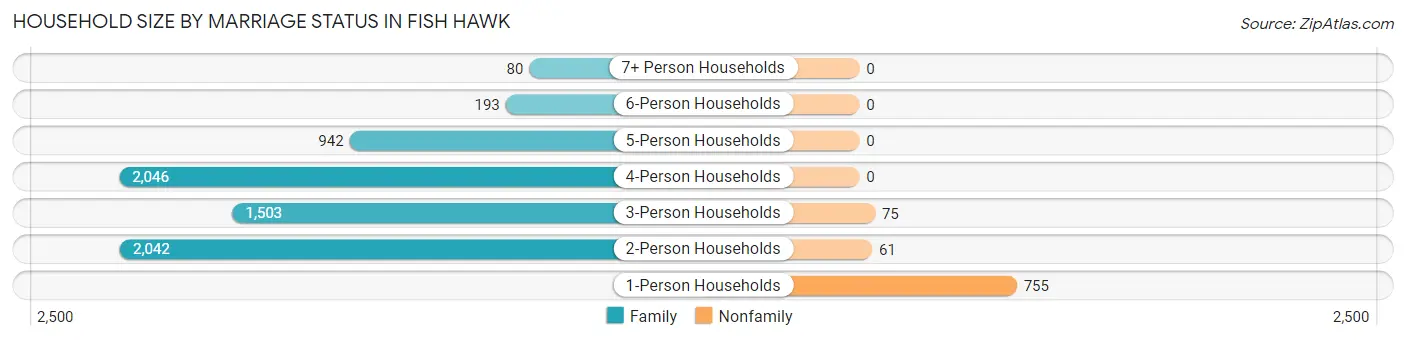
| Household Size | Family Households | Nonfamily Households |
| 1-Person Households | - | 755 (9.8%) |
| 2-Person Households | 2,042 (26.5%) | 61 (0.8%) |
| 3-Person Households | 1,503 (19.5%) | 75 (1.0%) |
| 4-Person Households | 2,046 (26.6%) | 0 (0.0%) |
| 5-Person Households | 942 (12.2%) | 0 (0.0%) |
| 6-Person Households | 193 (2.5%) | 0 (0.0%) |
| 7+ Person Households | 80 (1.0%) | 0 (0.0%) |
| Total | 6,806 (88.4%) | 891 (11.6%) |
Female Fertility in Fish Hawk
Fertility by Age in Fish Hawk
Average fertility rate in Fish Hawk is 68.0 births per 1,000 women. Women in the age bracket of 20 to 34 years have the highest fertility rate with 157.0 births per 1,000 women. Women in the age bracket of 20 to 34 years acount for 69.8% of all women with births.
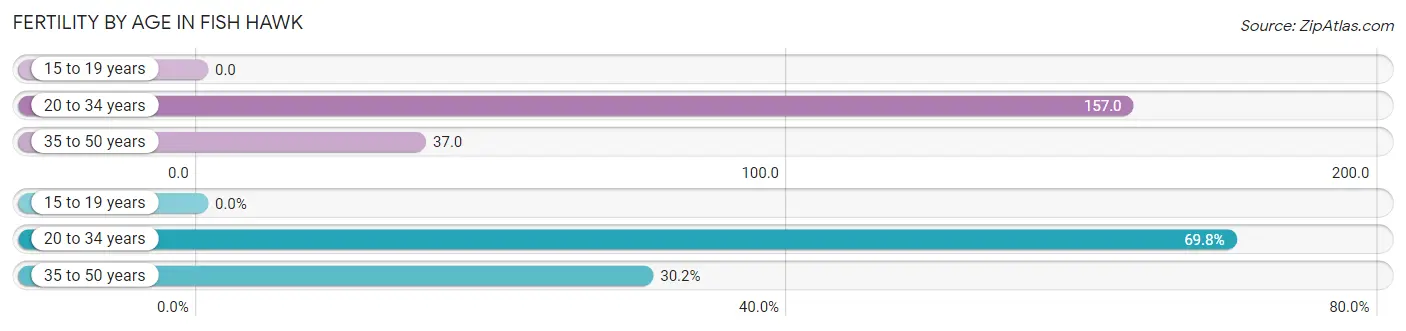
| Age Bracket | Women with Births | Births / 1,000 Women |
| 15 to 19 years | 0 (0.0%) | 0.0 |
| 20 to 34 years | 321 (69.8%) | 157.0 |
| 35 to 50 years | 139 (30.2%) | 37.0 |
| Total | 460 (100.0%) | 68.0 |
Fertility by Age by Marriage Status in Fish Hawk
95.2% of women with births (460) in Fish Hawk are married. The highest percentage of unmarried women with births falls into 35 to 50 years age bracket with 15.8% of them unmarried at the time of birth, while the lowest percentage of unmarried women with births belong to 20 to 34 years age bracket with 0.0% of them unmarried.
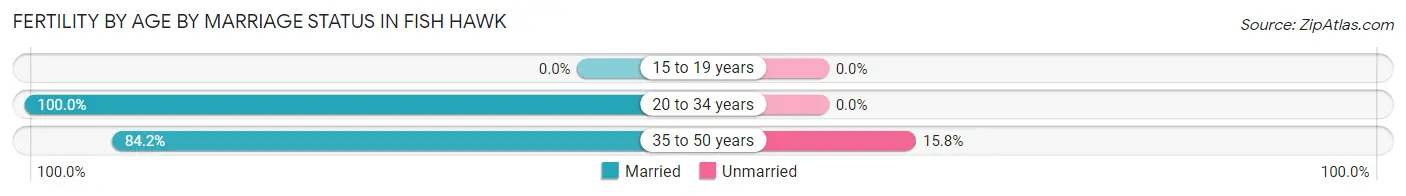
| Age Bracket | Married | Unmarried |
| 15 to 19 years | 0 (0.0%) | 0 (0.0%) |
| 20 to 34 years | 321 (100.0%) | 0 (0.0%) |
| 35 to 50 years | 117 (84.2%) | 22 (15.8%) |
| Total | 438 (95.2%) | 22 (4.8%) |
Fertility by Education in Fish Hawk
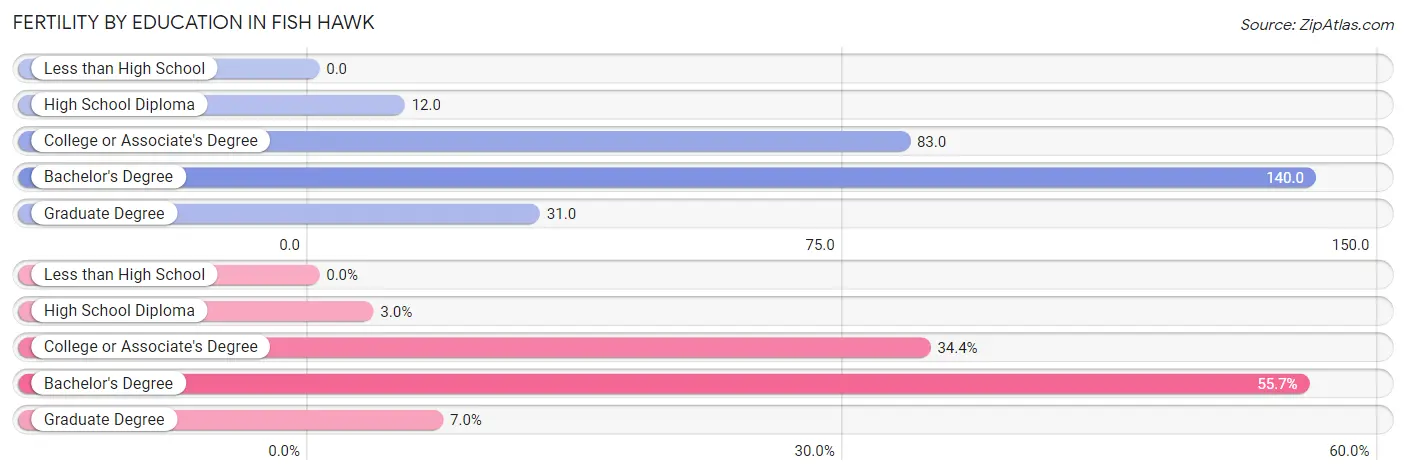
| Educational Attainment | Women with Births | Births / 1,000 Women |
| Less than High School | 0 (0.0%) | 0.0 |
| High School Diploma | 14 (3.0%) | 12.0 |
| College or Associate's Degree | 158 (34.4%) | 83.0 |
| Bachelor's Degree | 256 (55.6%) | 140.0 |
| Graduate Degree | 32 (7.0%) | 31.0 |
| Total | 460 (100.0%) | 68.0 |
Fertility by Education by Marriage Status in Fish Hawk
4.8% of women with births in Fish Hawk are unmarried. Women with the educational attainment of high school diploma are most likely to be married with 100.0% of them married at childbirth, while women with the educational attainment of graduate degree are least likely to be married with 68.8% of them unmarried at childbirth.
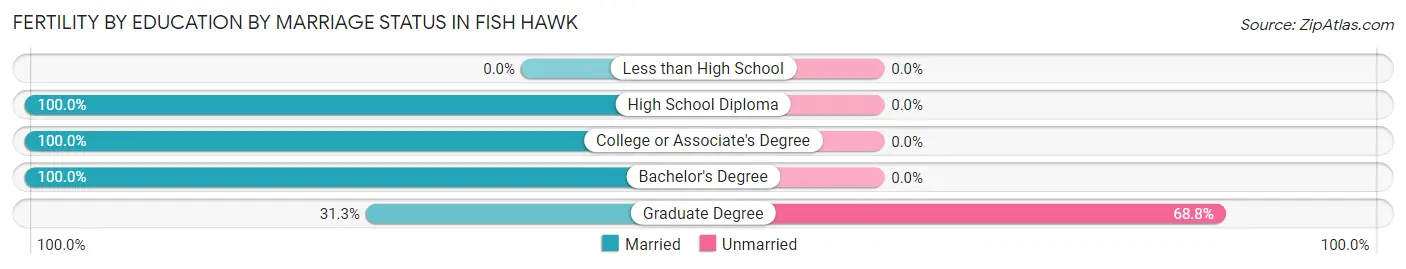
| Educational Attainment | Married | Unmarried |
| Less than High School | 0 (0.0%) | 0 (0.0%) |
| High School Diploma | 14 (100.0%) | 0 (0.0%) |
| College or Associate's Degree | 158 (100.0%) | 0 (0.0%) |
| Bachelor's Degree | 256 (100.0%) | 0 (0.0%) |
| Graduate Degree | 10 (31.2%) | 22 (68.8%) |
| Total | 438 (95.2%) | 22 (4.8%) |
Employment Characteristics in Fish Hawk
Employment by Class of Employer in Fish Hawk
Among the 10,918 employed individuals in Fish Hawk, private company employees (7,719 | 70.7%), not-for-profit organizations (789 | 7.2%), and federal government employees (645 | 5.9%) make up the most common classes of employment.
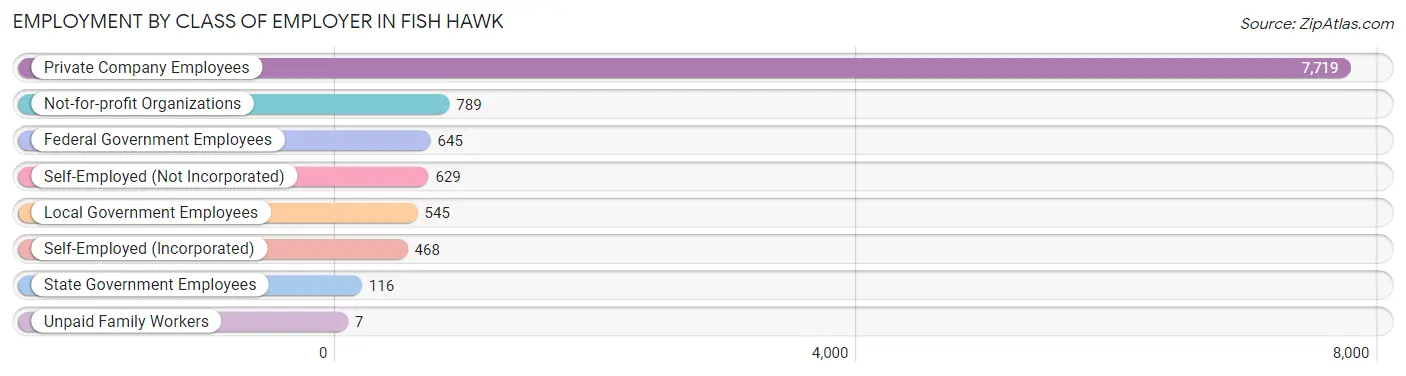
| Employer Class | # Employees | % Employees |
| Private Company Employees | 7,719 | 70.7% |
| Self-Employed (Incorporated) | 468 | 4.3% |
| Self-Employed (Not Incorporated) | 629 | 5.8% |
| Not-for-profit Organizations | 789 | 7.2% |
| Local Government Employees | 545 | 5.0% |
| State Government Employees | 116 | 1.1% |
| Federal Government Employees | 645 | 5.9% |
| Unpaid Family Workers | 7 | 0.1% |
| Total | 10,918 | 100.0% |
Employment Status by Age in Fish Hawk
According to the labor force statistics for Fish Hawk, out of the total population over 16 years of age (17,504), 68.2% or 11,938 individuals are in the labor force, with 5.6% or 669 of them unemployed. The age group with the highest labor force participation rate is 30 to 34 years, with 92.6% or 1,292 individuals in the labor force. Within the labor force, the 16 to 19 years age range has the highest percentage of unemployed individuals, with 32.5% or 189 of them being unemployed.
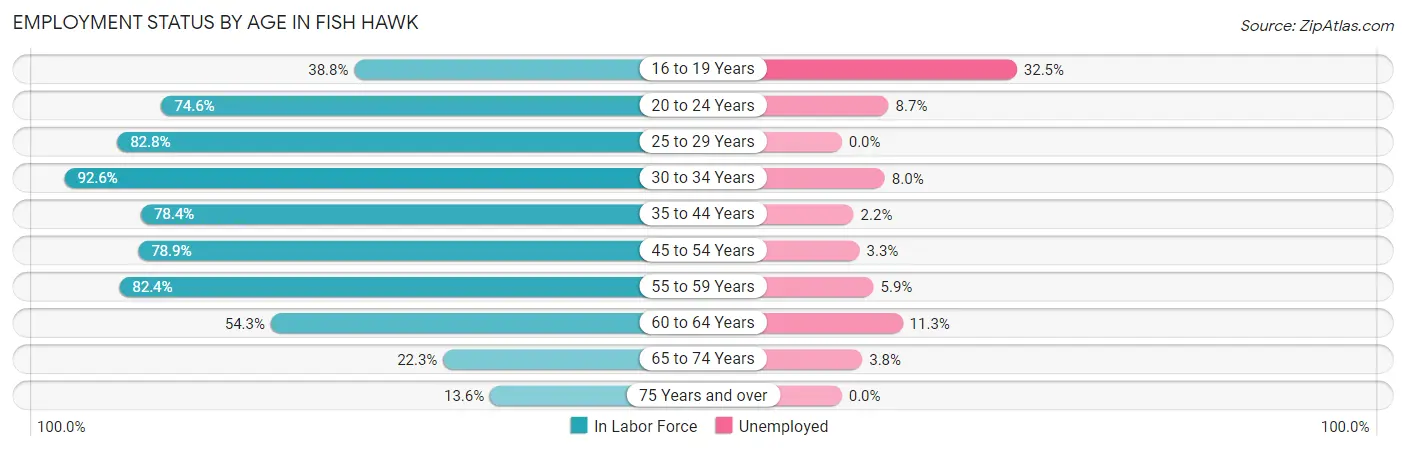
| Age Bracket | In Labor Force | Unemployed |
| 16 to 19 Years | 582 (38.8%) | 189 (32.5%) |
| 20 to 24 Years | 668 (74.6%) | 58 (8.7%) |
| 25 to 29 Years | 870 (82.8%) | 0 (0.0%) |
| 30 to 34 Years | 1,292 (92.6%) | 103 (8.0%) |
| 35 to 44 Years | 3,379 (78.4%) | 74 (2.2%) |
| 45 to 54 Years | 3,334 (78.9%) | 110 (3.3%) |
| 55 to 59 Years | 957 (82.4%) | 56 (5.9%) |
| 60 to 64 Years | 434 (54.3%) | 49 (11.3%) |
| 65 to 74 Years | 318 (22.3%) | 12 (3.8%) |
| 75 Years and over | 101 (13.6%) | 0 (0.0%) |
| Total | 11,938 (68.2%) | 669 (5.6%) |
Employment Status by Educational Attainment in Fish Hawk
According to labor force statistics for Fish Hawk, 79.3% of individuals (10,263) out of the total population between 25 and 64 years of age (12,942) are in the labor force, with 3.9% or 400 of them being unemployed. The group with the highest labor force participation rate are those with the educational attainment of bachelor's degree or higher, with 84.4% or 5,762 individuals in the labor force. Within the labor force, individuals with college / associate degree education have the highest percentage of unemployment, with 6.0% or 165 of them being unemployed.
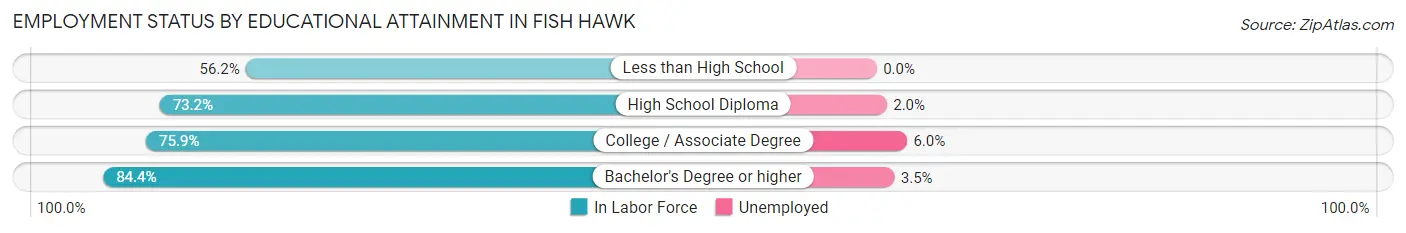
| Educational Attainment | In Labor Force | Unemployed |
| Less than High School | 228 (56.2%) | 0 (0.0%) |
| High School Diploma | 1,521 (73.2%) | 42 (2.0%) |
| College / Associate Degree | 2,756 (75.9%) | 218 (6.0%) |
| Bachelor's Degree or higher | 5,762 (84.4%) | 239 (3.5%) |
| Total | 10,263 (79.3%) | 505 (3.9%) |
Employment Occupations by Sex in Fish Hawk
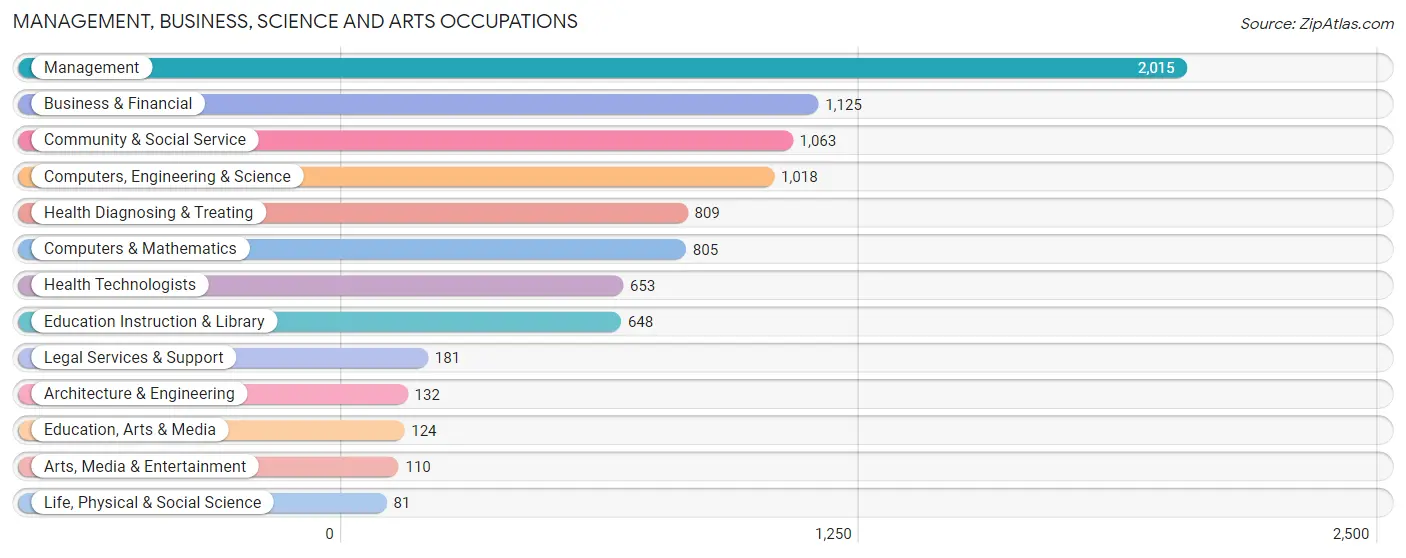
Management, Business, Science and Arts Occupations
The most common Management, Business, Science and Arts occupations in Fish Hawk are Management (2,015 | 18.4%), Business & Financial (1,125 | 10.3%), Community & Social Service (1,063 | 9.7%), Computers, Engineering & Science (1,018 | 9.3%), and Health Diagnosing & Treating (809 | 7.4%).
Management, Business, Science and Arts Occupations by Sex
Within the Management, Business, Science and Arts occupations in Fish Hawk, the most male-oriented occupations are Architecture & Engineering (77.3%), Computers & Mathematics (71.2%), and Computers, Engineering & Science (70.3%), while the most female-oriented occupations are Education, Arts & Media (89.5%), Health Technologists (78.1%), and Education Instruction & Library (78.1%).
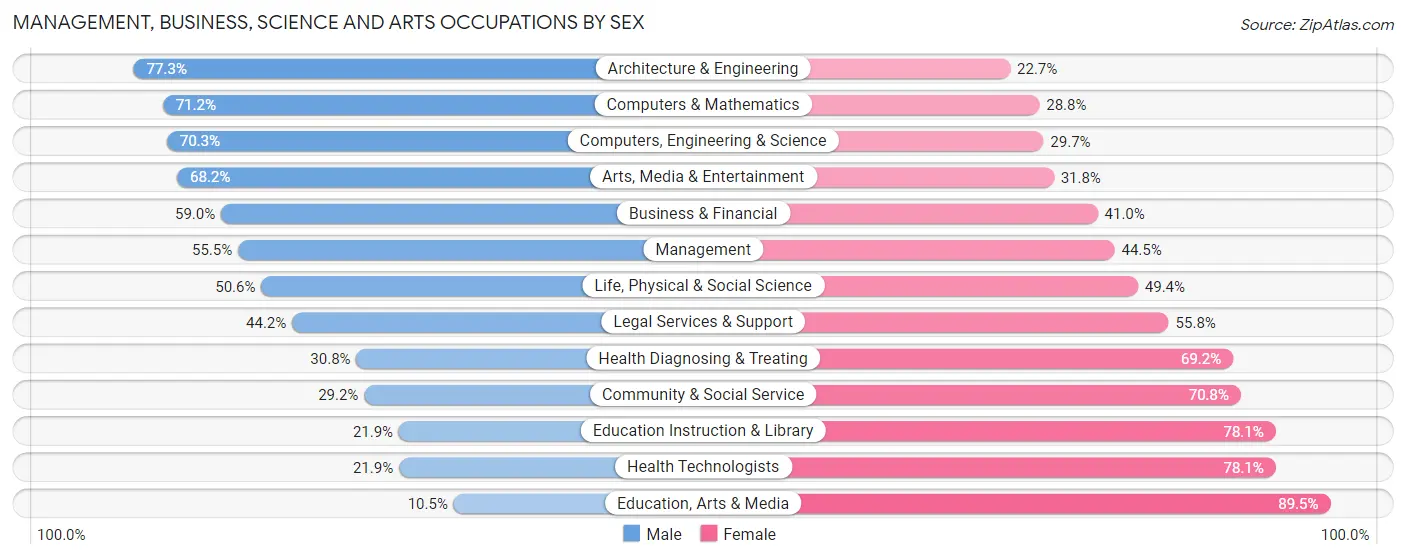
| Occupation | Male | Female |
| Management | 1,118 (55.5%) | 897 (44.5%) |
| Business & Financial | 664 (59.0%) | 461 (41.0%) |
| Computers, Engineering & Science | 716 (70.3%) | 302 (29.7%) |
| Computers & Mathematics | 573 (71.2%) | 232 (28.8%) |
| Architecture & Engineering | 102 (77.3%) | 30 (22.7%) |
| Life, Physical & Social Science | 41 (50.6%) | 40 (49.4%) |
| Community & Social Service | 310 (29.2%) | 753 (70.8%) |
| Education, Arts & Media | 13 (10.5%) | 111 (89.5%) |
| Legal Services & Support | 80 (44.2%) | 101 (55.8%) |
| Education Instruction & Library | 142 (21.9%) | 506 (78.1%) |
| Arts, Media & Entertainment | 75 (68.2%) | 35 (31.8%) |
| Health Diagnosing & Treating | 249 (30.8%) | 560 (69.2%) |
| Health Technologists | 143 (21.9%) | 510 (78.1%) |
| Total (Category) | 3,057 (50.7%) | 2,973 (49.3%) |
| Total (Overall) | 5,292 (48.3%) | 5,670 (51.7%) |
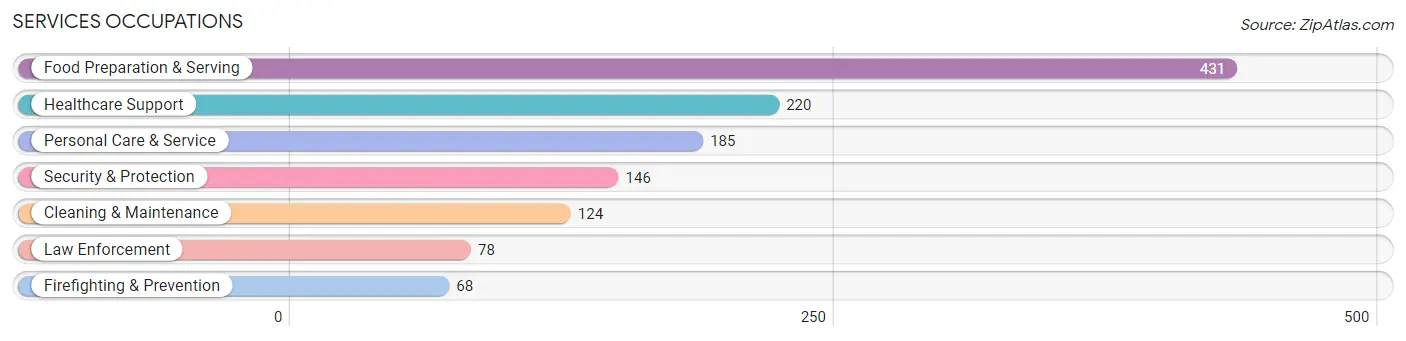
Services Occupations
The most common Services occupations in Fish Hawk are Food Preparation & Serving (431 | 3.9%), Healthcare Support (220 | 2.0%), Personal Care & Service (185 | 1.7%), Security & Protection (146 | 1.3%), and Cleaning & Maintenance (124 | 1.1%).
Services Occupations by Sex
Within the Services occupations in Fish Hawk, the most male-oriented occupations are Law Enforcement (87.2%), Security & Protection (74.0%), and Cleaning & Maintenance (69.4%), while the most female-oriented occupations are Healthcare Support (95.0%), Personal Care & Service (81.1%), and Food Preparation & Serving (68.9%).
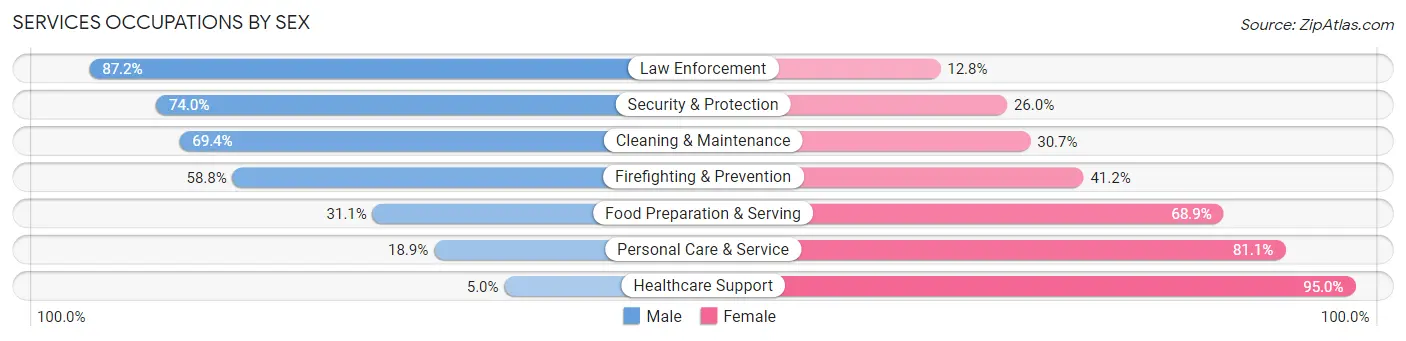
| Occupation | Male | Female |
| Healthcare Support | 11 (5.0%) | 209 (95.0%) |
| Security & Protection | 108 (74.0%) | 38 (26.0%) |
| Firefighting & Prevention | 40 (58.8%) | 28 (41.2%) |
| Law Enforcement | 68 (87.2%) | 10 (12.8%) |
| Food Preparation & Serving | 134 (31.1%) | 297 (68.9%) |
| Cleaning & Maintenance | 86 (69.4%) | 38 (30.6%) |
| Personal Care & Service | 35 (18.9%) | 150 (81.1%) |
| Total (Category) | 374 (33.8%) | 732 (66.2%) |
| Total (Overall) | 5,292 (48.3%) | 5,670 (51.7%) |
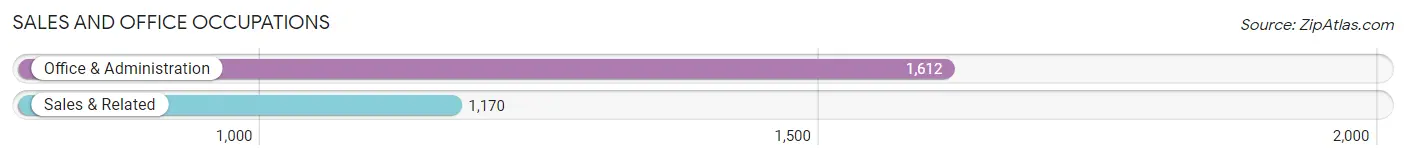
Sales and Office Occupations
The most common Sales and Office occupations in Fish Hawk are Office & Administration (1,612 | 14.7%), and Sales & Related (1,170 | 10.7%).
Sales and Office Occupations by Sex
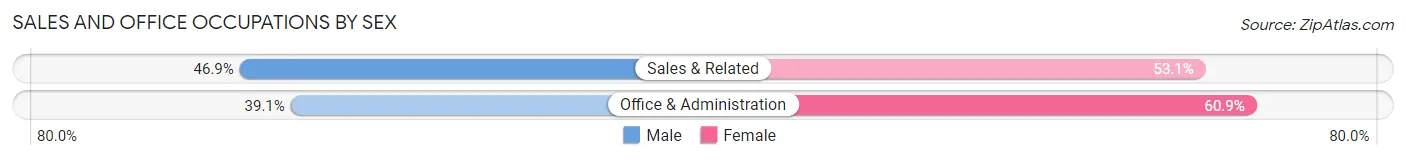
| Occupation | Male | Female |
| Sales & Related | 549 (46.9%) | 621 (53.1%) |
| Office & Administration | 630 (39.1%) | 982 (60.9%) |
| Total (Category) | 1,179 (42.4%) | 1,603 (57.6%) |
| Total (Overall) | 5,292 (48.3%) | 5,670 (51.7%) |
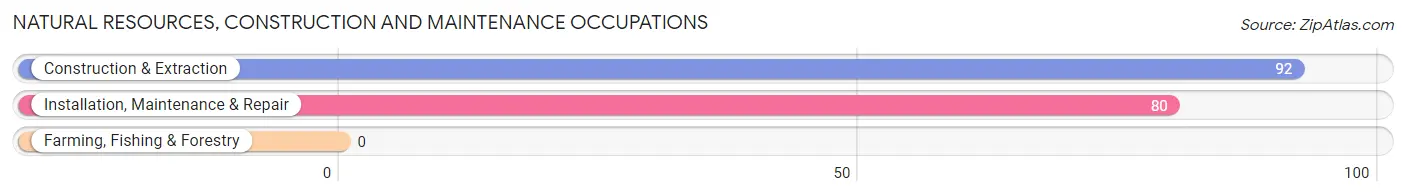
Natural Resources, Construction and Maintenance Occupations
The most common Natural Resources, Construction and Maintenance occupations in Fish Hawk are Construction & Extraction (92 | 0.8%), and Installation, Maintenance & Repair (80 | 0.7%).
Natural Resources, Construction and Maintenance Occupations by Sex
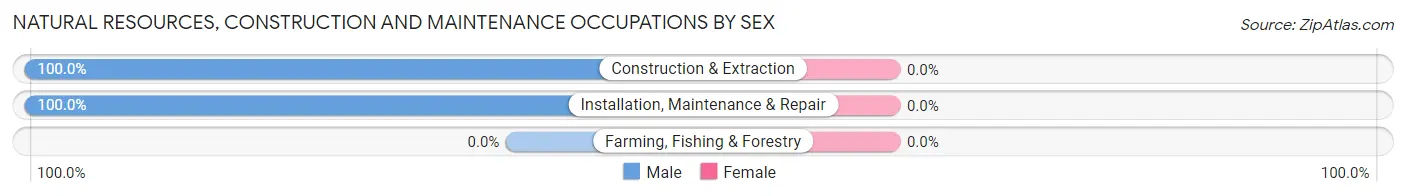
| Occupation | Male | Female |
| Farming, Fishing & Forestry | 0 (0.0%) | 0 (0.0%) |
| Construction & Extraction | 92 (100.0%) | 0 (0.0%) |
| Installation, Maintenance & Repair | 80 (100.0%) | 0 (0.0%) |
| Total (Category) | 172 (100.0%) | 0 (0.0%) |
| Total (Overall) | 5,292 (48.3%) | 5,670 (51.7%) |
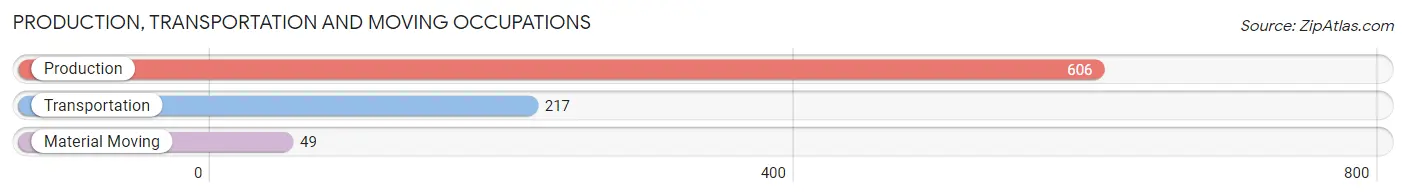
Production, Transportation and Moving Occupations
The most common Production, Transportation and Moving occupations in Fish Hawk are Production (606 | 5.5%), Transportation (217 | 2.0%), and Material Moving (49 | 0.4%).
Production, Transportation and Moving Occupations by Sex
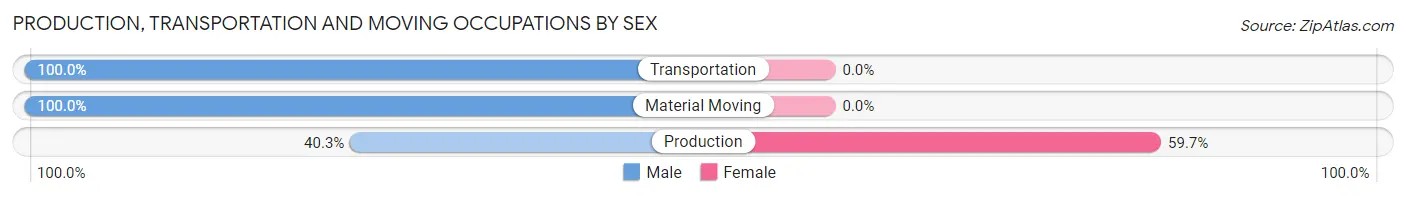
| Occupation | Male | Female |
| Production | 244 (40.3%) | 362 (59.7%) |
| Transportation | 217 (100.0%) | 0 (0.0%) |
| Material Moving | 49 (100.0%) | 0 (0.0%) |
| Total (Category) | 510 (58.5%) | 362 (41.5%) |
| Total (Overall) | 5,292 (48.3%) | 5,670 (51.7%) |
Employment Industries by Sex in Fish Hawk
Employment Industries in Fish Hawk
The major employment industries in Fish Hawk include Professional & Scientific (1,671 | 15.2%), Retail Trade (1,646 | 15.0%), Health Care & Social Assistance (1,545 | 14.1%), Finance & Insurance (1,446 | 13.2%), and Educational Services (748 | 6.8%).
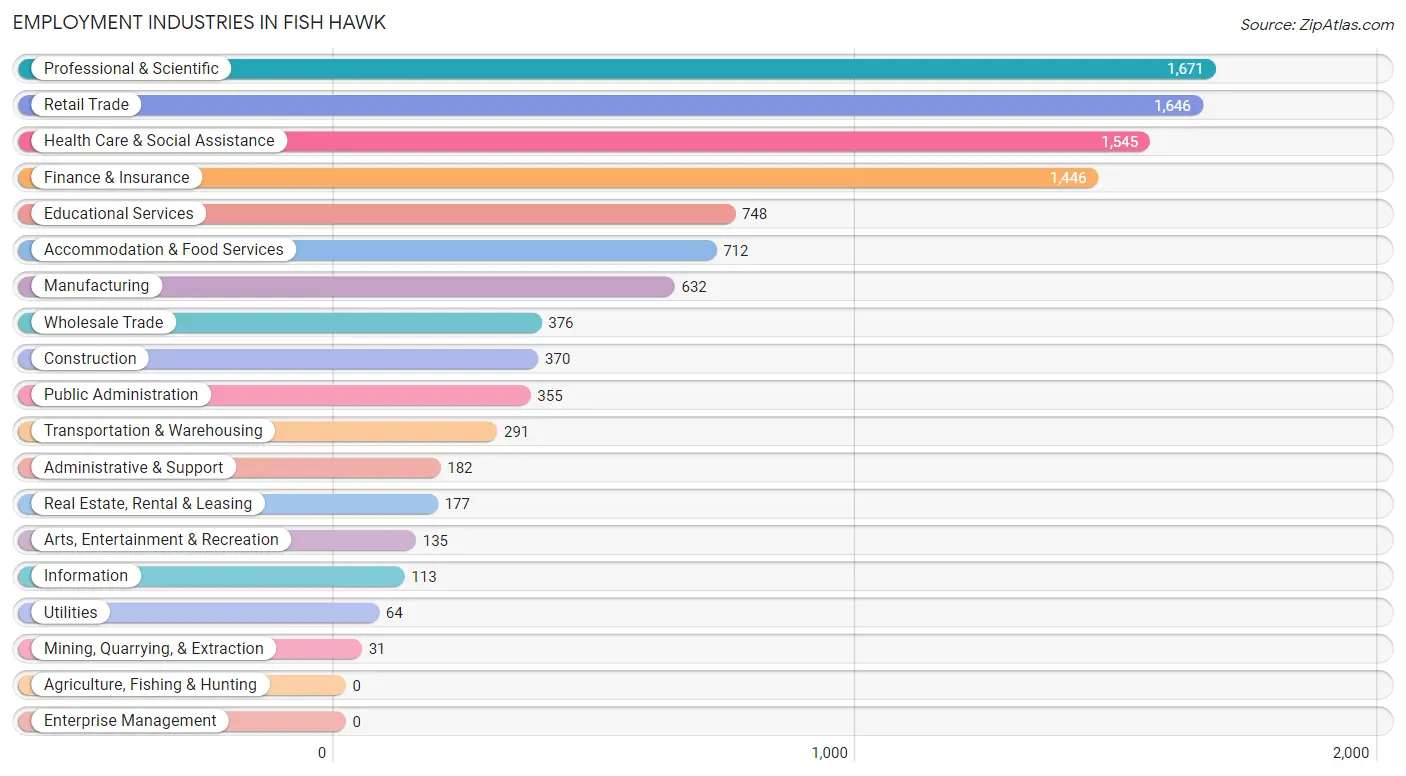
Employment Industries by Sex in Fish Hawk
The Fish Hawk industries that see more men than women are Utilities (100.0%), Construction (87.0%), and Transportation & Warehousing (86.3%), whereas the industries that tend to have a higher number of women are Health Care & Social Assistance (77.4%), Educational Services (74.2%), and Accommodation & Food Services (71.5%).
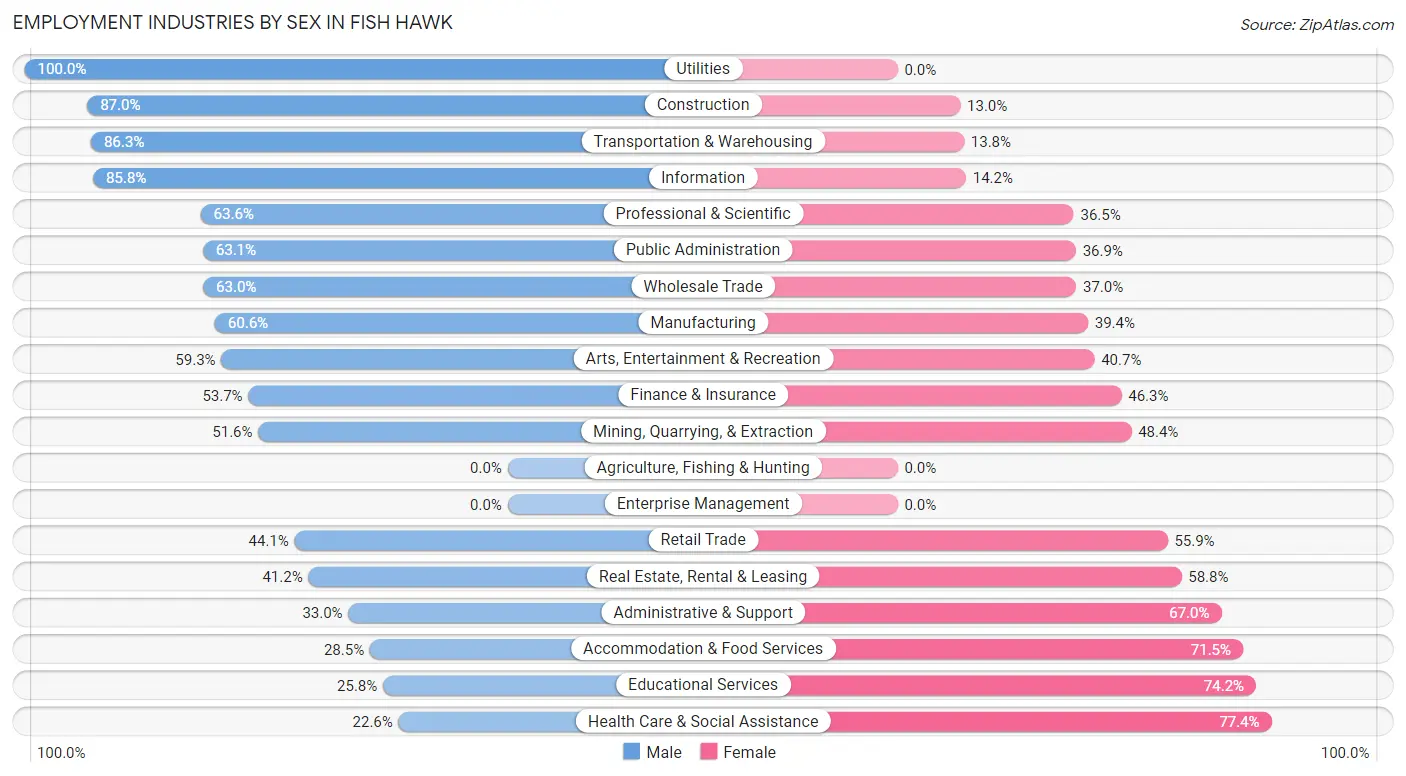
| Industry | Male | Female |
| Agriculture, Fishing & Hunting | 0 (0.0%) | 0 (0.0%) |
| Mining, Quarrying, & Extraction | 16 (51.6%) | 15 (48.4%) |
| Construction | 322 (87.0%) | 48 (13.0%) |
| Manufacturing | 383 (60.6%) | 249 (39.4%) |
| Wholesale Trade | 237 (63.0%) | 139 (37.0%) |
| Retail Trade | 726 (44.1%) | 920 (55.9%) |
| Transportation & Warehousing | 251 (86.3%) | 40 (13.8%) |
| Utilities | 64 (100.0%) | 0 (0.0%) |
| Information | 97 (85.8%) | 16 (14.2%) |
| Finance & Insurance | 776 (53.7%) | 670 (46.3%) |
| Real Estate, Rental & Leasing | 73 (41.2%) | 104 (58.8%) |
| Professional & Scientific | 1,062 (63.5%) | 609 (36.4%) |
| Enterprise Management | 0 (0.0%) | 0 (0.0%) |
| Administrative & Support | 60 (33.0%) | 122 (67.0%) |
| Educational Services | 193 (25.8%) | 555 (74.2%) |
| Health Care & Social Assistance | 349 (22.6%) | 1,196 (77.4%) |
| Arts, Entertainment & Recreation | 80 (59.3%) | 55 (40.7%) |
| Accommodation & Food Services | 203 (28.5%) | 509 (71.5%) |
| Public Administration | 224 (63.1%) | 131 (36.9%) |
| Total | 5,292 (48.3%) | 5,670 (51.7%) |
Education in Fish Hawk
School Enrollment in Fish Hawk
The most common levels of schooling among the 8,656 students in Fish Hawk are middle school (2,545 | 29.4%), high school (1,962 | 22.7%), and elementary school (1,728 | 20.0%).
| School Level | # Students | % Students |
| Nursery / Preschool | 329 | 3.8% |
| Kindergarten | 462 | 5.3% |
| Elementary School | 1,728 | 20.0% |
| Middle School | 2,545 | 29.4% |
| High School | 1,962 | 22.7% |
| College / Undergraduate | 1,263 | 14.6% |
| Graduate / Professional | 367 | 4.2% |
| Total | 8,656 | 100.0% |
School Enrollment by Age by Funding Source in Fish Hawk
Out of a total of 8,656 students who are enrolled in schools in Fish Hawk, 814 (9.4%) attend a private institution, while the remaining 7,842 (90.6%) are enrolled in public schools. The age group of 3 to 4 year olds has the highest likelihood of being enrolled in private schools, with 77 (32.5% in the age bracket) enrolled. Conversely, the age group of 15 to 17 year olds has the lowest likelihood of being enrolled in a private school, with 1,424 (98.1% in the age bracket) attending a public institution.
| Age Bracket | Public School | Private School |
| 3 to 4 Year Olds | 160 (67.5%) | 77 (32.5%) |
| 5 to 9 Year Old | 1,777 (90.1%) | 196 (9.9%) |
| 10 to 14 Year Olds | 2,986 (93.0%) | 223 (7.0%) |
| 15 to 17 Year Olds | 1,424 (98.1%) | 28 (1.9%) |
| 18 to 19 Year Olds | 315 (77.8%) | 90 (22.2%) |
| 20 to 24 Year Olds | 458 (87.7%) | 64 (12.3%) |
| 25 to 34 Year Olds | 444 (94.1%) | 28 (5.9%) |
| 35 Years and over | 277 (71.8%) | 109 (28.2%) |
| Total | 7,842 (90.6%) | 814 (9.4%) |
Educational Attainment by Field of Study in Fish Hawk
Business (1,817 | 22.2%), science & technology (978 | 11.9%), education (909 | 11.1%), computers & mathematics (709 | 8.6%), and social sciences (695 | 8.5%) are the most common fields of study among 8,194 individuals in Fish Hawk who have obtained a bachelor's degree or higher.
| Field of Study | # Graduates | % Graduates |
| Computers & Mathematics | 709 | 8.6% |
| Bio, Nature & Agricultural | 328 | 4.0% |
| Physical & Health Sciences | 355 | 4.3% |
| Psychology | 423 | 5.2% |
| Social Sciences | 695 | 8.5% |
| Engineering | 435 | 5.3% |
| Multidisciplinary Studies | 33 | 0.4% |
| Science & Technology | 978 | 11.9% |
| Business | 1,817 | 22.2% |
| Education | 909 | 11.1% |
| Literature & Languages | 367 | 4.5% |
| Liberal Arts & History | 260 | 3.2% |
| Visual & Performing Arts | 261 | 3.2% |
| Communications | 219 | 2.7% |
| Arts & Humanities | 405 | 4.9% |
| Total | 8,194 | 100.0% |
Transportation & Commute in Fish Hawk
Vehicle Availability by Sex in Fish Hawk
The most prevalent vehicle ownership categories in Fish Hawk are males with 2 vehicles (2,995, accounting for 55.1%) and females with 2 vehicles (2,680, making up 54.6%).
| Vehicles Available | Male | Female |
| No Vehicle | 117 (2.1%) | 143 (2.6%) |
| 1 Vehicle | 314 (5.8%) | 668 (12.2%) |
| 2 Vehicles | 2,995 (55.1%) | 2,680 (48.9%) |
| 3 Vehicles | 1,638 (30.1%) | 1,638 (29.9%) |
| 4 Vehicles | 242 (4.4%) | 299 (5.4%) |
| 5 or more Vehicles | 128 (2.4%) | 56 (1.0%) |
| Total | 5,434 (100.0%) | 5,484 (100.0%) |
Commute Time in Fish Hawk
The most frequently occuring commute durations in Fish Hawk are 45 to 59 minutes (1,712 commuters, 20.1%), 60 to 89 minutes (1,506 commuters, 17.7%), and 30 to 34 minutes (1,230 commuters, 14.4%).
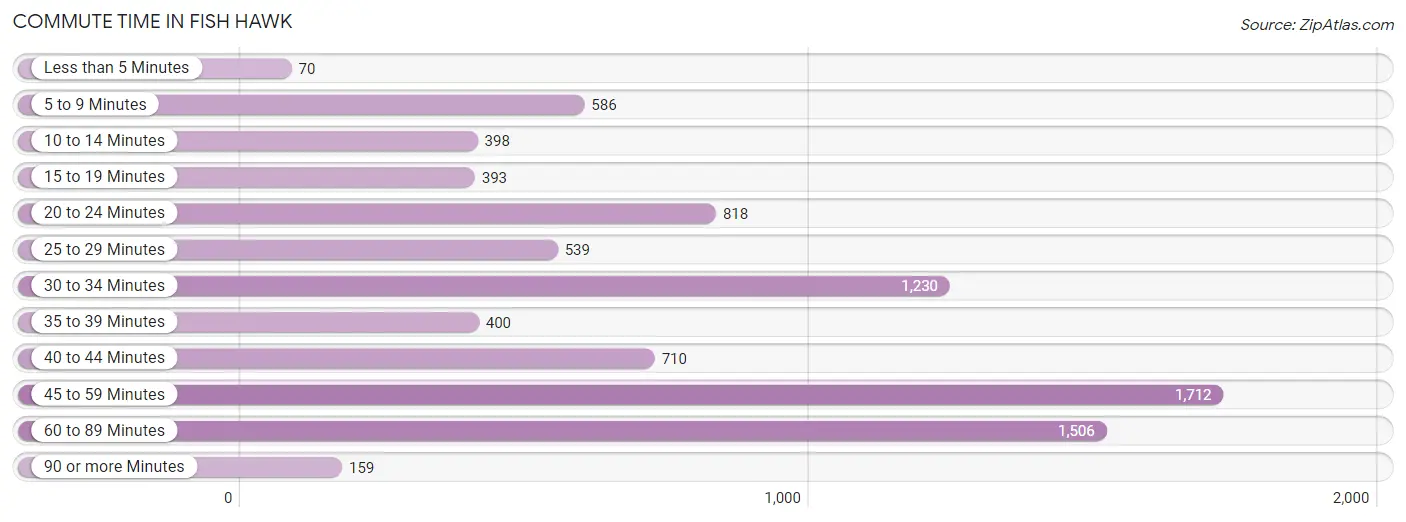
| Commute Time | # Commuters | % Commuters |
| Less than 5 Minutes | 70 | 0.8% |
| 5 to 9 Minutes | 586 | 6.9% |
| 10 to 14 Minutes | 398 | 4.7% |
| 15 to 19 Minutes | 393 | 4.6% |
| 20 to 24 Minutes | 818 | 9.6% |
| 25 to 29 Minutes | 539 | 6.3% |
| 30 to 34 Minutes | 1,230 | 14.4% |
| 35 to 39 Minutes | 400 | 4.7% |
| 40 to 44 Minutes | 710 | 8.3% |
| 45 to 59 Minutes | 1,712 | 20.1% |
| 60 to 89 Minutes | 1,506 | 17.7% |
| 90 or more Minutes | 159 | 1.9% |
Commute Time by Sex in Fish Hawk
The most common commute times in Fish Hawk are 60 to 89 minutes (975 commuters, 23.4%) for males and 45 to 59 minutes (772 commuters, 17.7%) for females.
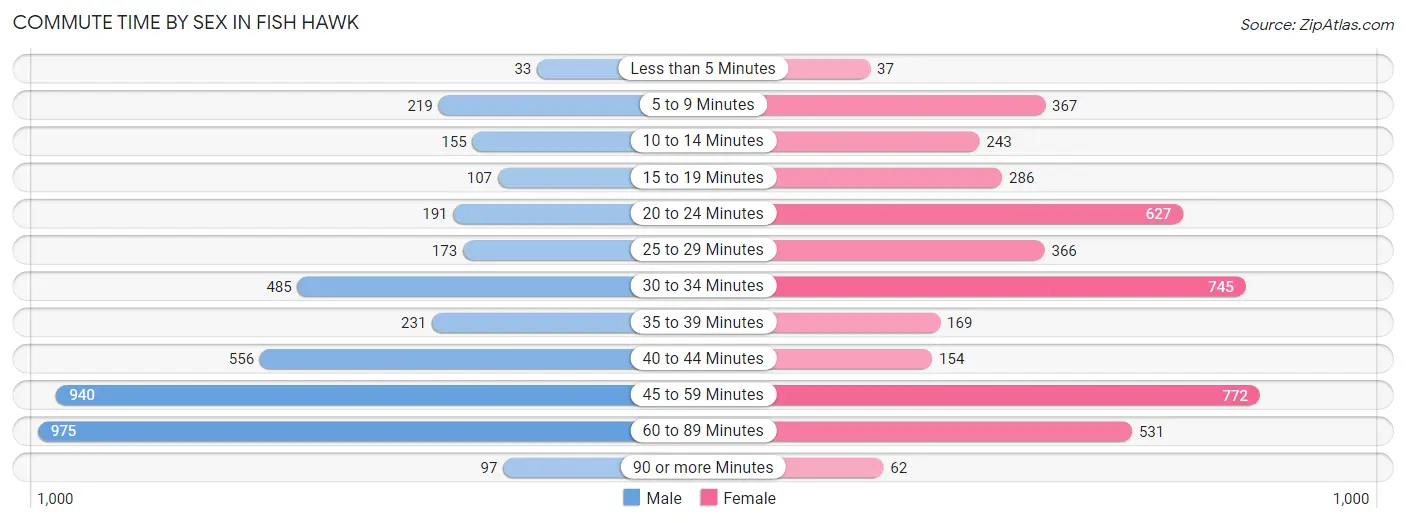
| Commute Time | Male | Female |
| Less than 5 Minutes | 33 (0.8%) | 37 (0.9%) |
| 5 to 9 Minutes | 219 (5.3%) | 367 (8.4%) |
| 10 to 14 Minutes | 155 (3.7%) | 243 (5.6%) |
| 15 to 19 Minutes | 107 (2.6%) | 286 (6.6%) |
| 20 to 24 Minutes | 191 (4.6%) | 627 (14.4%) |
| 25 to 29 Minutes | 173 (4.2%) | 366 (8.4%) |
| 30 to 34 Minutes | 485 (11.7%) | 745 (17.1%) |
| 35 to 39 Minutes | 231 (5.6%) | 169 (3.9%) |
| 40 to 44 Minutes | 556 (13.4%) | 154 (3.5%) |
| 45 to 59 Minutes | 940 (22.6%) | 772 (17.7%) |
| 60 to 89 Minutes | 975 (23.4%) | 531 (12.2%) |
| 90 or more Minutes | 97 (2.3%) | 62 (1.4%) |
Time of Departure to Work by Sex in Fish Hawk
The most frequent times of departure to work in Fish Hawk are 6:30 AM to 6:59 AM (692, 16.6%) for males and 7:00 AM to 7:29 AM (1,052, 24.1%) for females.
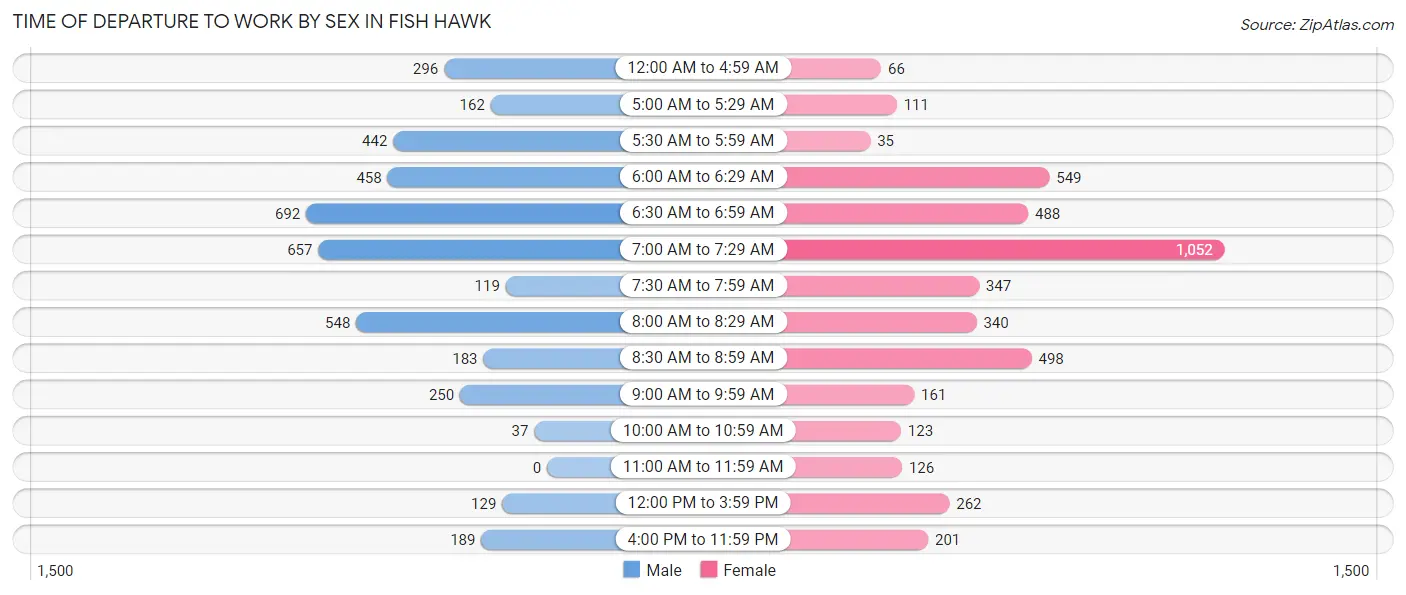
| Time of Departure | Male | Female |
| 12:00 AM to 4:59 AM | 296 (7.1%) | 66 (1.5%) |
| 5:00 AM to 5:29 AM | 162 (3.9%) | 111 (2.5%) |
| 5:30 AM to 5:59 AM | 442 (10.6%) | 35 (0.8%) |
| 6:00 AM to 6:29 AM | 458 (11.0%) | 549 (12.6%) |
| 6:30 AM to 6:59 AM | 692 (16.6%) | 488 (11.2%) |
| 7:00 AM to 7:29 AM | 657 (15.8%) | 1,052 (24.1%) |
| 7:30 AM to 7:59 AM | 119 (2.9%) | 347 (8.0%) |
| 8:00 AM to 8:29 AM | 548 (13.2%) | 340 (7.8%) |
| 8:30 AM to 8:59 AM | 183 (4.4%) | 498 (11.4%) |
| 9:00 AM to 9:59 AM | 250 (6.0%) | 161 (3.7%) |
| 10:00 AM to 10:59 AM | 37 (0.9%) | 123 (2.8%) |
| 11:00 AM to 11:59 AM | 0 (0.0%) | 126 (2.9%) |
| 12:00 PM to 3:59 PM | 129 (3.1%) | 262 (6.0%) |
| 4:00 PM to 11:59 PM | 189 (4.5%) | 201 (4.6%) |
| Total | 4,162 (100.0%) | 4,359 (100.0%) |
Housing Occupancy in Fish Hawk
Occupancy by Ownership in Fish Hawk
Of the total 7,697 dwellings in Fish Hawk, owner-occupied units account for 6,093 (79.2%), while renter-occupied units make up 1,604 (20.8%).
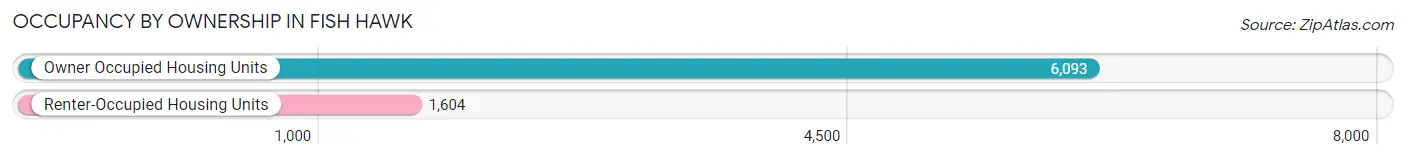
| Occupancy | # Housing Units | % Housing Units |
| Owner Occupied Housing Units | 6,093 | 79.2% |
| Renter-Occupied Housing Units | 1,604 | 20.8% |
| Total Occupied Housing Units | 7,697 | 100.0% |
Occupancy by Household Size in Fish Hawk
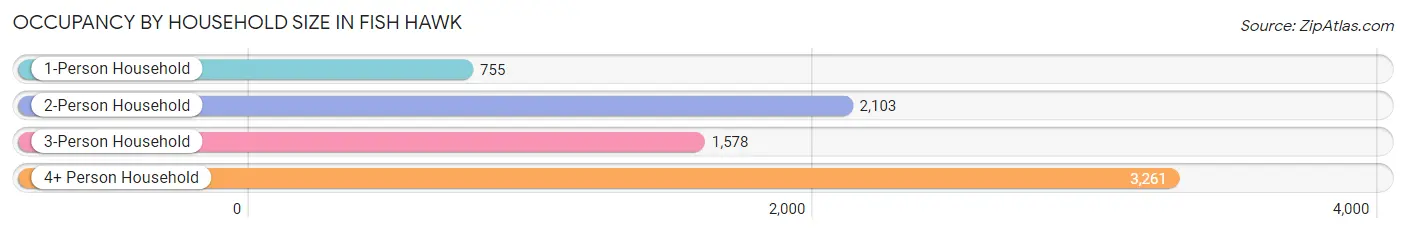
| Household Size | # Housing Units | % Housing Units |
| 1-Person Household | 755 | 9.8% |
| 2-Person Household | 2,103 | 27.3% |
| 3-Person Household | 1,578 | 20.5% |
| 4+ Person Household | 3,261 | 42.4% |
| Total Housing Units | 7,697 | 100.0% |
Occupancy by Ownership by Household Size in Fish Hawk
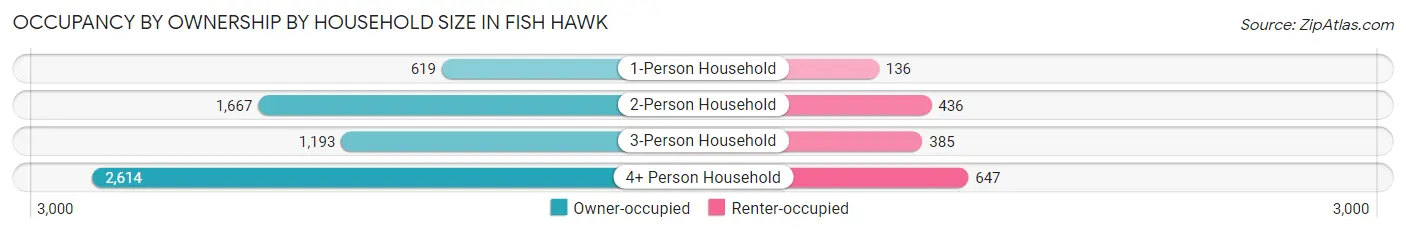
| Household Size | Owner-occupied | Renter-occupied |
| 1-Person Household | 619 (82.0%) | 136 (18.0%) |
| 2-Person Household | 1,667 (79.3%) | 436 (20.7%) |
| 3-Person Household | 1,193 (75.6%) | 385 (24.4%) |
| 4+ Person Household | 2,614 (80.2%) | 647 (19.8%) |
| Total Housing Units | 6,093 (79.2%) | 1,604 (20.8%) |
Occupancy by Educational Attainment in Fish Hawk
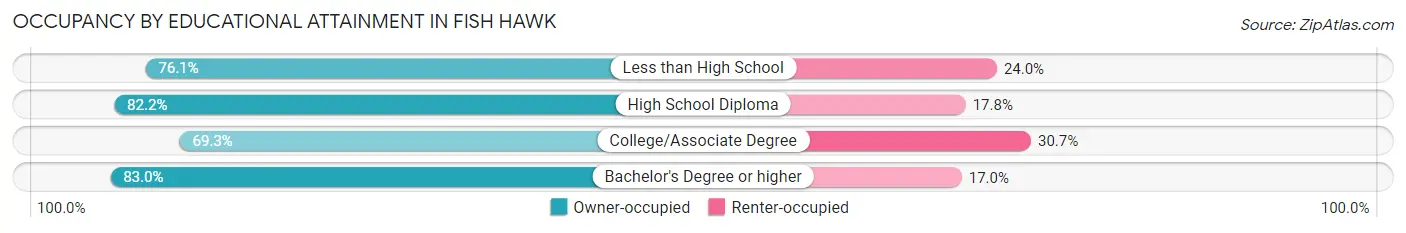
| Household Size | Owner-occupied | Renter-occupied |
| Less than High School | 235 (76.0%) | 74 (23.9%) |
| High School Diploma | 741 (82.2%) | 160 (17.8%) |
| College/Associate Degree | 1,356 (69.3%) | 601 (30.7%) |
| Bachelor's Degree or higher | 3,761 (83.0%) | 769 (17.0%) |
Occupancy by Age of Householder in Fish Hawk
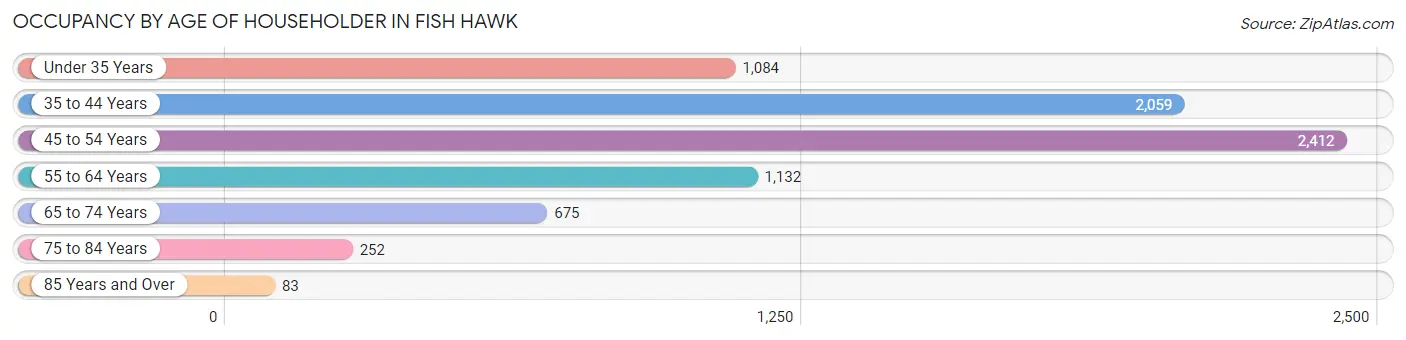
| Age Bracket | # Households | % Households |
| Under 35 Years | 1,084 | 14.1% |
| 35 to 44 Years | 2,059 | 26.8% |
| 45 to 54 Years | 2,412 | 31.3% |
| 55 to 64 Years | 1,132 | 14.7% |
| 65 to 74 Years | 675 | 8.8% |
| 75 to 84 Years | 252 | 3.3% |
| 85 Years and Over | 83 | 1.1% |
| Total | 7,697 | 100.0% |
Housing Finances in Fish Hawk
Median Income by Occupancy in Fish Hawk
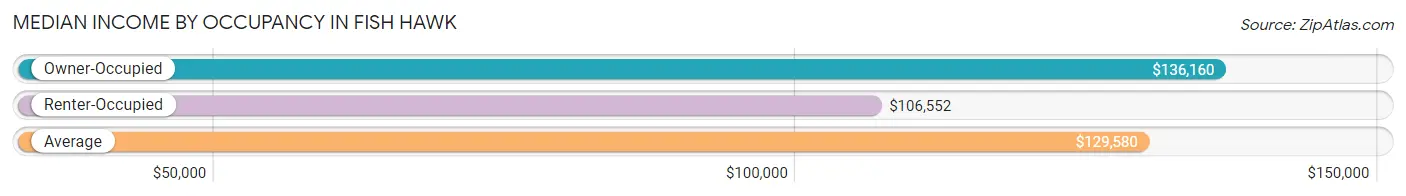
| Occupancy Type | # Households | Median Income |
| Owner-Occupied | 6,093 (79.2%) | $136,160 |
| Renter-Occupied | 1,604 (20.8%) | $106,552 |
| Average | 7,697 (100.0%) | $129,580 |
Occupancy by Householder Income Bracket in Fish Hawk
| Income Bracket | Owner-occupied | Renter-occupied |
| Less than $5,000 | 142 (2.3%) | 27 (1.7%) |
| $5,000 to $9,999 | 79 (1.3%) | 207 (12.9%) |
| $10,000 to $14,999 | 37 (0.6%) | 0 (0.0%) |
| $15,000 to $19,999 | 122 (2.0%) | 0 (0.0%) |
| $20,000 to $24,999 | 70 (1.1%) | 47 (2.9%) |
| $25,000 to $34,999 | 348 (5.7%) | 32 (2.0%) |
| $35,000 to $49,999 | 212 (3.5%) | 143 (8.9%) |
| $50,000 to $74,999 | 414 (6.8%) | 127 (7.9%) |
| $75,000 to $99,999 | 609 (10.0%) | 191 (11.9%) |
| $100,000 to $149,999 | 1,210 (19.9%) | 423 (26.4%) |
| $150,000 or more | 2,850 (46.8%) | 407 (25.4%) |
| Total | 6,093 (100.0%) | 1,604 (100.0%) |
Monthly Housing Cost Tiers in Fish Hawk
| Monthly Cost | Owner-occupied | Renter-occupied |
| Less than $300 | 76 (1.3%) | 0 (0.0%) |
| $300 to $499 | 256 (4.2%) | 0 (0.0%) |
| $500 to $799 | 366 (6.0%) | 0 (0.0%) |
| $800 to $999 | 353 (5.8%) | 23 (1.4%) |
| $1,000 to $1,499 | 537 (8.8%) | 130 (8.1%) |
| $1,500 to $1,999 | 579 (9.5%) | 420 (26.2%) |
| $2,000 to $2,499 | 990 (16.3%) | 425 (26.5%) |
| $2,500 to $2,999 | 1,069 (17.5%) | 369 (23.0%) |
| $3,000 or more | 1,867 (30.6%) | 213 (13.3%) |
| Total | 6,093 (100.0%) | 1,604 (100.0%) |
Physical Housing Characteristics in Fish Hawk
Housing Structures in Fish Hawk
| Structure Type | # Housing Units | % Housing Units |
| Single Unit, Detached | 6,369 | 82.8% |
| Single Unit, Attached | 930 | 12.1% |
| 2 Unit Apartments | 58 | 0.7% |
| 3 or 4 Unit Apartments | 73 | 0.9% |
| 5 to 9 Unit Apartments | 42 | 0.5% |
| 10 or more Apartments | 89 | 1.2% |
| Mobile Home / Other | 136 | 1.8% |
| Total | 7,697 | 100.0% |
Housing Structures by Occupancy in Fish Hawk
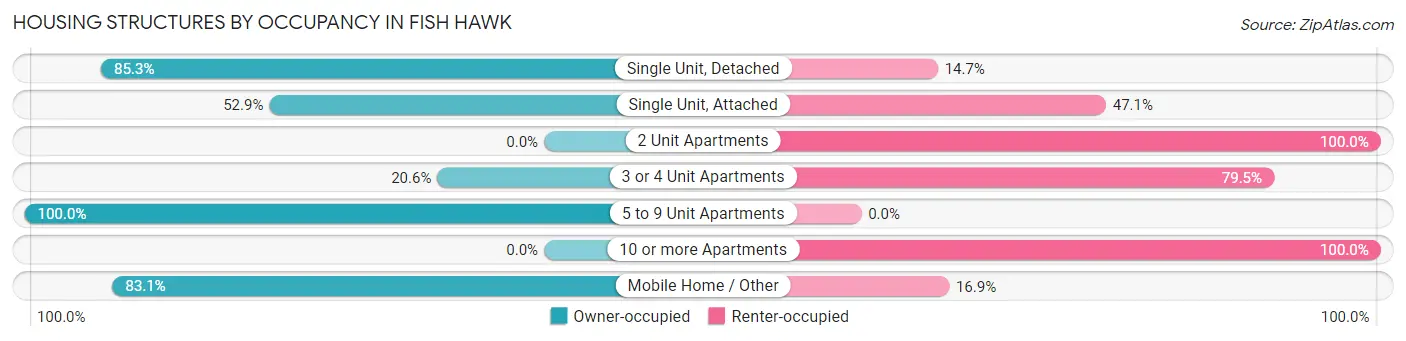
| Structure Type | Owner-occupied | Renter-occupied |
| Single Unit, Detached | 5,431 (85.3%) | 938 (14.7%) |
| Single Unit, Attached | 492 (52.9%) | 438 (47.1%) |
| 2 Unit Apartments | 0 (0.0%) | 58 (100.0%) |
| 3 or 4 Unit Apartments | 15 (20.5%) | 58 (79.4%) |
| 5 to 9 Unit Apartments | 42 (100.0%) | 0 (0.0%) |
| 10 or more Apartments | 0 (0.0%) | 89 (100.0%) |
| Mobile Home / Other | 113 (83.1%) | 23 (16.9%) |
| Total | 6,093 (79.2%) | 1,604 (20.8%) |
Housing Structures by Number of Rooms in Fish Hawk
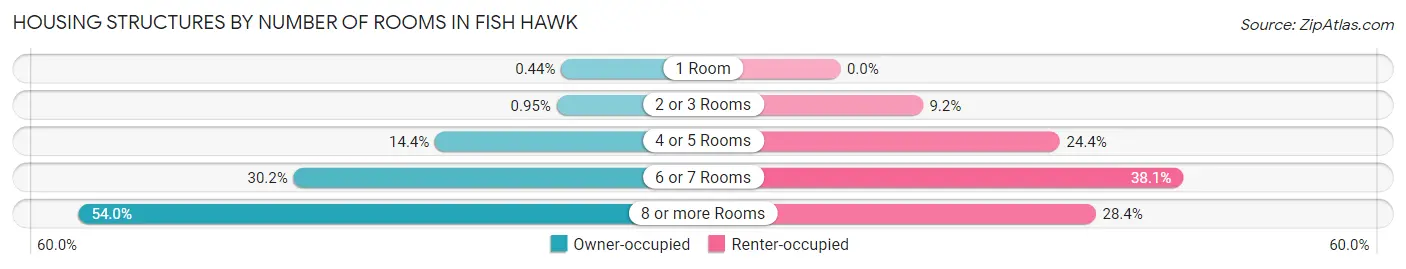
| Number of Rooms | Owner-occupied | Renter-occupied |
| 1 Room | 27 (0.4%) | 0 (0.0%) |
| 2 or 3 Rooms | 58 (0.9%) | 147 (9.2%) |
| 4 or 5 Rooms | 880 (14.4%) | 391 (24.4%) |
| 6 or 7 Rooms | 1,837 (30.1%) | 611 (38.1%) |
| 8 or more Rooms | 3,291 (54.0%) | 455 (28.4%) |
| Total | 6,093 (100.0%) | 1,604 (100.0%) |
Housing Structure by Heating Type in Fish Hawk
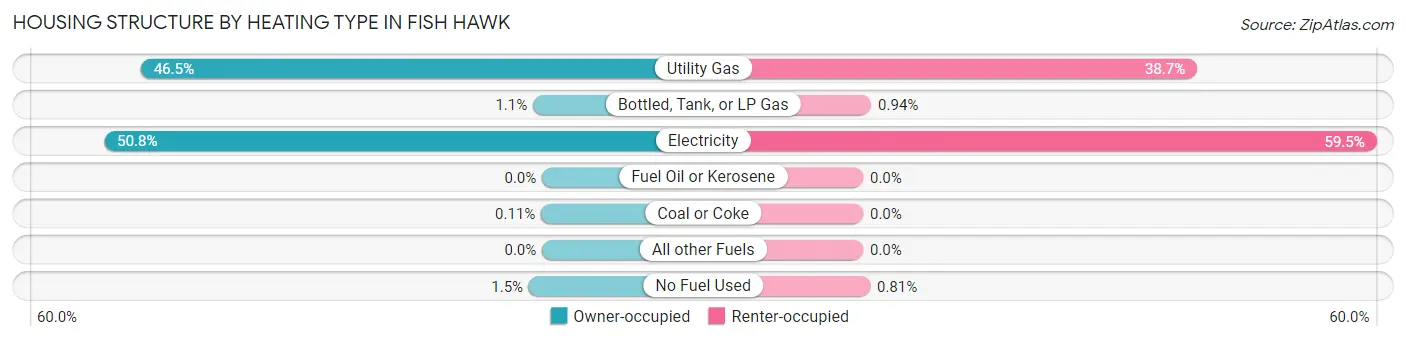
| Heating Type | Owner-occupied | Renter-occupied |
| Utility Gas | 2,835 (46.5%) | 621 (38.7%) |
| Bottled, Tank, or LP Gas | 64 (1.1%) | 15 (0.9%) |
| Electricity | 3,094 (50.8%) | 955 (59.5%) |
| Fuel Oil or Kerosene | 0 (0.0%) | 0 (0.0%) |
| Coal or Coke | 7 (0.1%) | 0 (0.0%) |
| All other Fuels | 0 (0.0%) | 0 (0.0%) |
| No Fuel Used | 93 (1.5%) | 13 (0.8%) |
| Total | 6,093 (100.0%) | 1,604 (100.0%) |
Household Vehicle Usage in Fish Hawk
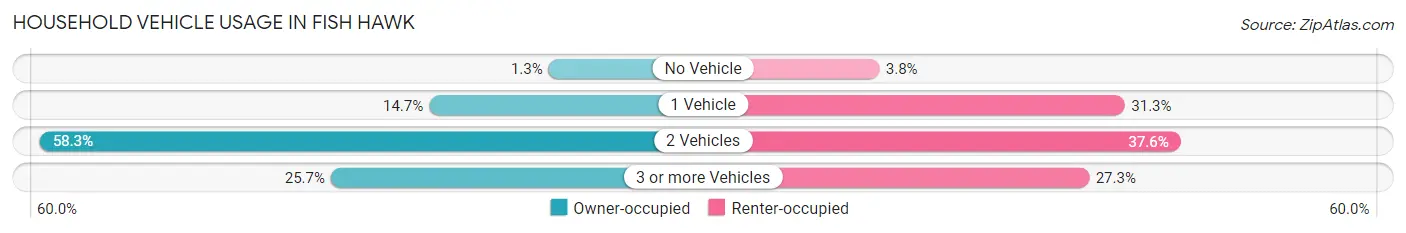
| Vehicles per Household | Owner-occupied | Renter-occupied |
| No Vehicle | 80 (1.3%) | 61 (3.8%) |
| 1 Vehicle | 895 (14.7%) | 502 (31.3%) |
| 2 Vehicles | 3,552 (58.3%) | 603 (37.6%) |
| 3 or more Vehicles | 1,566 (25.7%) | 438 (27.3%) |
| Total | 6,093 (100.0%) | 1,604 (100.0%) |
Real Estate & Mortgages in Fish Hawk
Real Estate and Mortgage Overview in Fish Hawk
| Characteristic | Without Mortgage | With Mortgage |
| Housing Units | 1,349 | 4,744 |
| Median Property Value | $399,400 | $481,500 |
| Median Household Income | $93,482 | $2,455 |
| Monthly Housing Costs | $813 | $1,861 |
| Real Estate Taxes | $5,102 | $11 |
Property Value by Mortgage Status in Fish Hawk
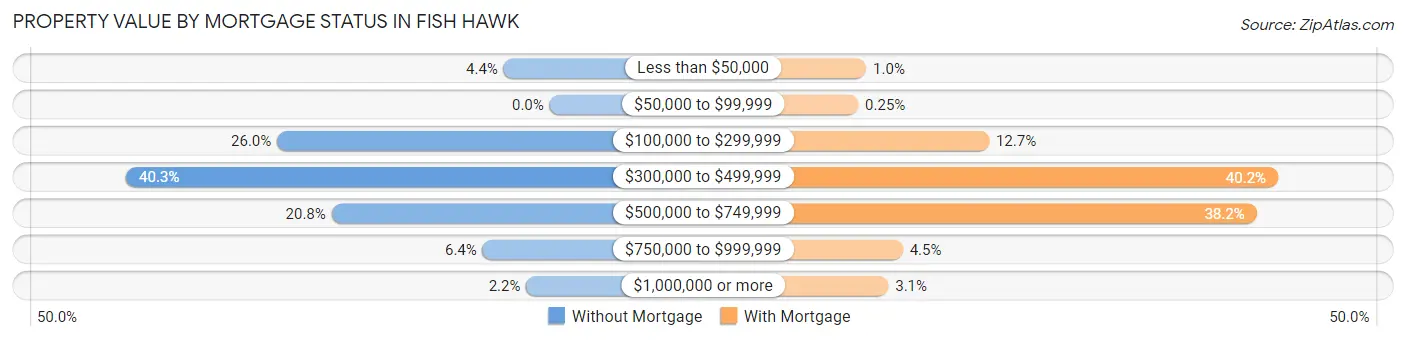
| Property Value | Without Mortgage | With Mortgage |
| Less than $50,000 | 59 (4.4%) | 48 (1.0%) |
| $50,000 to $99,999 | 0 (0.0%) | 12 (0.3%) |
| $100,000 to $299,999 | 350 (26.0%) | 603 (12.7%) |
| $300,000 to $499,999 | 544 (40.3%) | 1,908 (40.2%) |
| $500,000 to $749,999 | 280 (20.8%) | 1,812 (38.2%) |
| $750,000 to $999,999 | 86 (6.4%) | 213 (4.5%) |
| $1,000,000 or more | 30 (2.2%) | 148 (3.1%) |
| Total | 1,349 (100.0%) | 4,744 (100.0%) |
Household Income by Mortgage Status in Fish Hawk
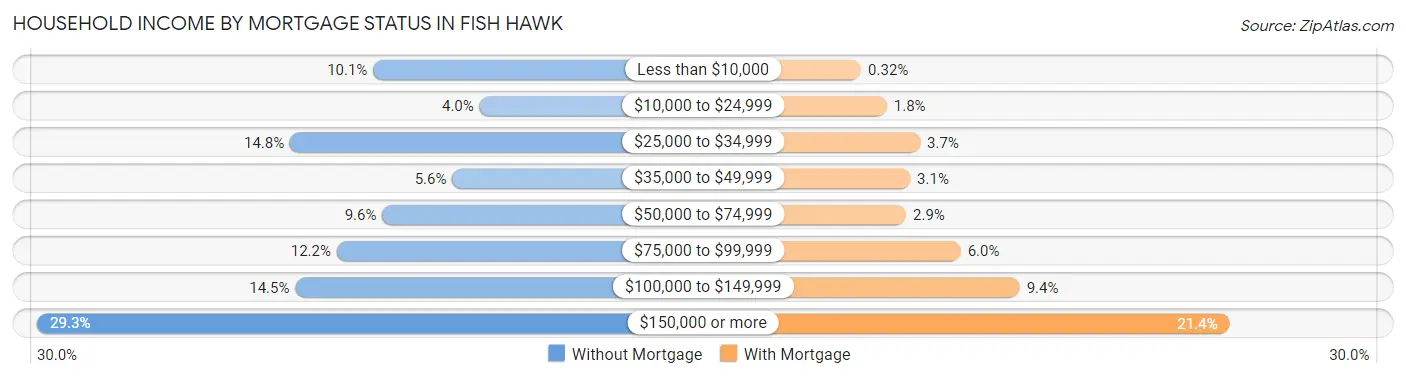
| Household Income | Without Mortgage | With Mortgage |
| Less than $10,000 | 136 (10.1%) | 15 (0.3%) |
| $10,000 to $24,999 | 54 (4.0%) | 85 (1.8%) |
| $25,000 to $34,999 | 200 (14.8%) | 175 (3.7%) |
| $35,000 to $49,999 | 75 (5.6%) | 148 (3.1%) |
| $50,000 to $74,999 | 129 (9.6%) | 137 (2.9%) |
| $75,000 to $99,999 | 164 (12.2%) | 285 (6.0%) |
| $100,000 to $149,999 | 196 (14.5%) | 445 (9.4%) |
| $150,000 or more | 395 (29.3%) | 1,014 (21.4%) |
| Total | 1,349 (100.0%) | 4,744 (100.0%) |
Property Value to Household Income Ratio in Fish Hawk
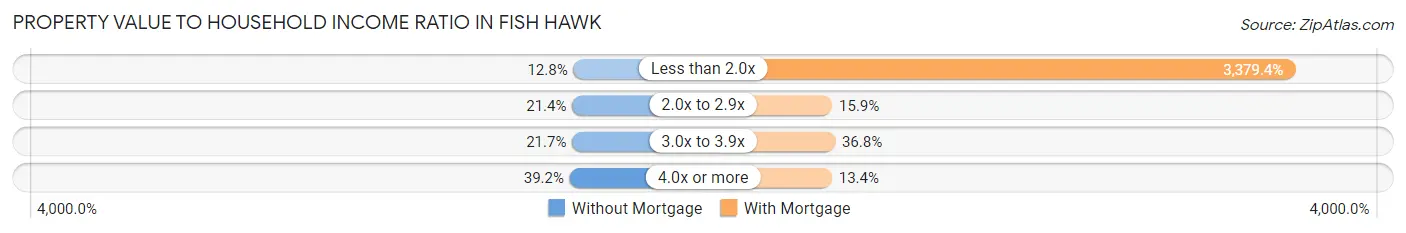
| Value-to-Income Ratio | Without Mortgage | With Mortgage |
| Less than 2.0x | 172 (12.8%) | 160,318 (3,379.4%) |
| 2.0x to 2.9x | 288 (21.3%) | 756 (15.9%) |
| 3.0x to 3.9x | 292 (21.6%) | 1,745 (36.8%) |
| 4.0x or more | 529 (39.2%) | 635 (13.4%) |
| Total | 1,349 (100.0%) | 4,744 (100.0%) |
Real Estate Taxes by Mortgage Status in Fish Hawk
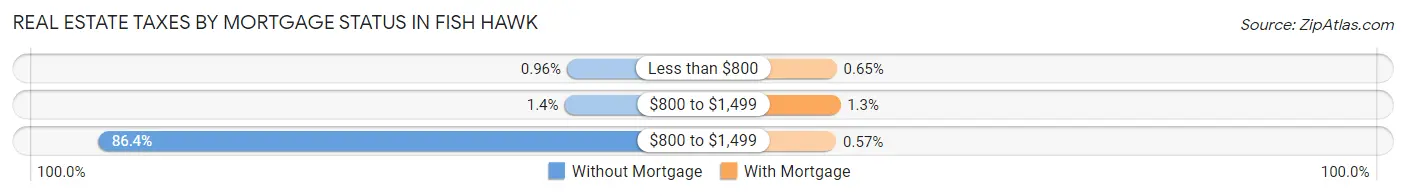
| Property Taxes | Without Mortgage | With Mortgage |
| Less than $800 | 13 (1.0%) | 31 (0.6%) |
| $800 to $1,499 | 19 (1.4%) | 62 (1.3%) |
| $800 to $1,499 | 1,166 (86.4%) | 27 (0.6%) |
| Total | 1,349 (100.0%) | 4,744 (100.0%) |
Health & Disability in Fish Hawk
Health Insurance Coverage by Age in Fish Hawk
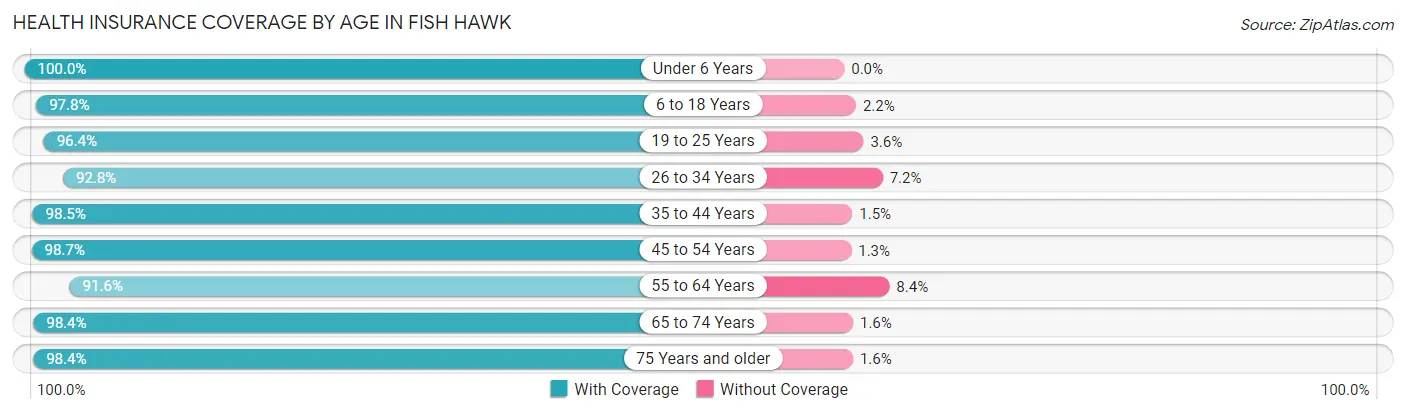
| Age Bracket | With Coverage | Without Coverage |
| Under 6 Years | 1,911 (100.0%) | 0 (0.0%) |
| 6 to 18 Years | 6,858 (97.8%) | 153 (2.2%) |
| 19 to 25 Years | 1,378 (96.4%) | 51 (3.6%) |
| 26 to 34 Years | 2,010 (92.8%) | 155 (7.2%) |
| 35 to 44 Years | 3,996 (98.5%) | 61 (1.5%) |
| 45 to 54 Years | 4,097 (98.7%) | 54 (1.3%) |
| 55 to 64 Years | 1,796 (91.6%) | 165 (8.4%) |
| 65 to 74 Years | 1,385 (98.4%) | 23 (1.6%) |
| 75 Years and older | 730 (98.4%) | 12 (1.6%) |
| Total | 24,161 (97.3%) | 674 (2.7%) |
Health Insurance Coverage by Citizenship Status in Fish Hawk
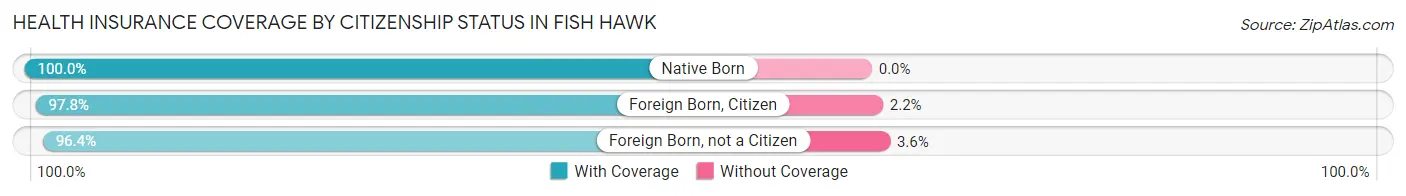
| Citizenship Status | With Coverage | Without Coverage |
| Native Born | 1,911 (100.0%) | 0 (0.0%) |
| Foreign Born, Citizen | 6,858 (97.8%) | 153 (2.2%) |
| Foreign Born, not a Citizen | 1,378 (96.4%) | 51 (3.6%) |
Health Insurance Coverage by Household Income in Fish Hawk
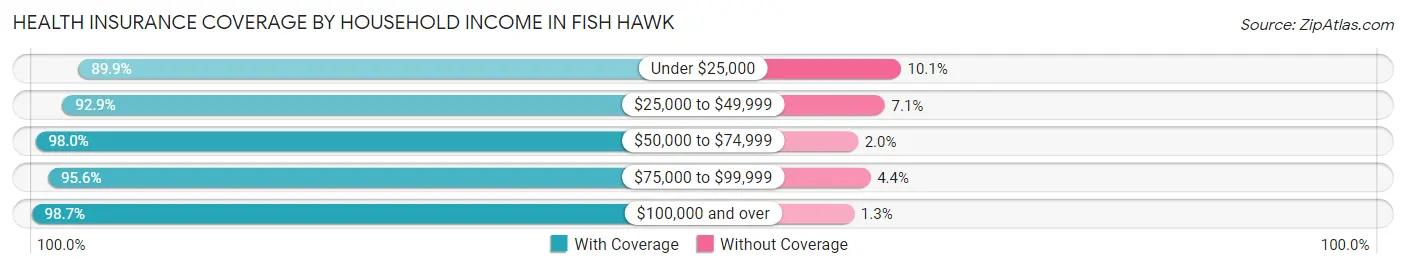
| Household Income | With Coverage | Without Coverage |
| Under $25,000 | 1,554 (89.9%) | 174 (10.1%) |
| $25,000 to $49,999 | 1,838 (92.9%) | 140 (7.1%) |
| $50,000 to $74,999 | 1,633 (98.0%) | 34 (2.0%) |
| $75,000 to $99,999 | 2,089 (95.6%) | 96 (4.4%) |
| $100,000 and over | 17,047 (98.7%) | 230 (1.3%) |
Public vs Private Health Insurance Coverage by Age in Fish Hawk
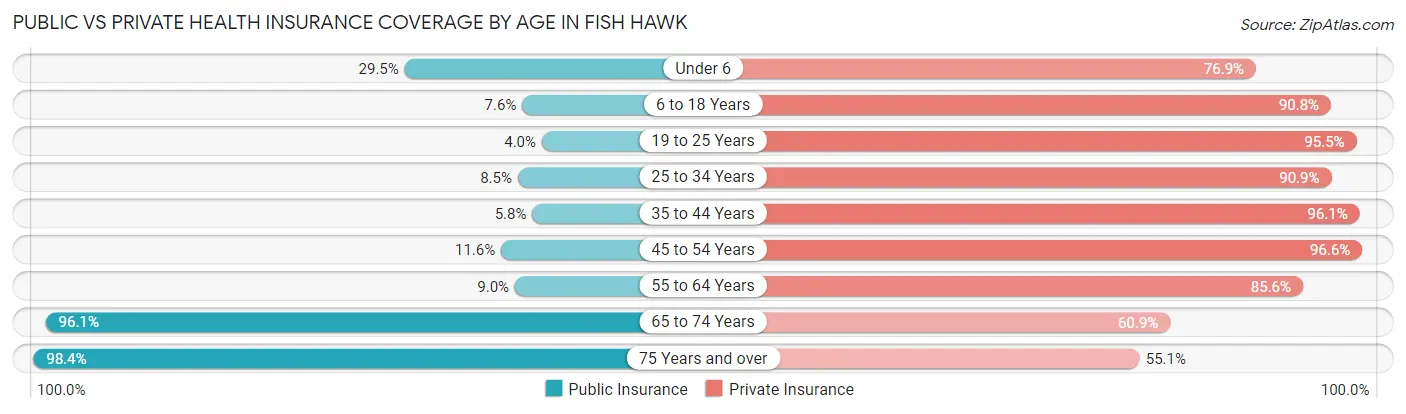
| Age Bracket | Public Insurance | Private Insurance |
| Under 6 | 563 (29.5%) | 1,469 (76.9%) |
| 6 to 18 Years | 535 (7.6%) | 6,365 (90.8%) |
| 19 to 25 Years | 57 (4.0%) | 1,365 (95.5%) |
| 25 to 34 Years | 183 (8.5%) | 1,967 (90.8%) |
| 35 to 44 Years | 234 (5.8%) | 3,899 (96.1%) |
| 45 to 54 Years | 480 (11.6%) | 4,009 (96.6%) |
| 55 to 64 Years | 176 (9.0%) | 1,678 (85.6%) |
| 65 to 74 Years | 1,353 (96.1%) | 858 (60.9%) |
| 75 Years and over | 730 (98.4%) | 409 (55.1%) |
| Total | 4,311 (17.4%) | 22,019 (88.7%) |
Disability Status by Sex by Age in Fish Hawk
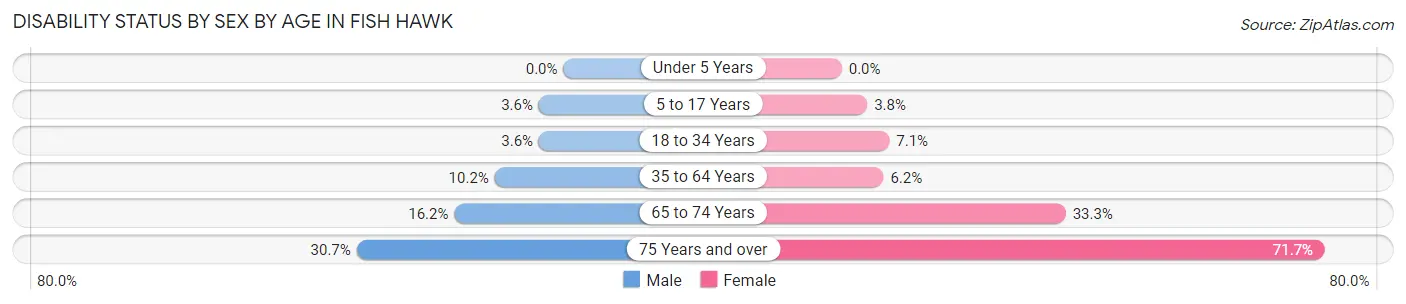
| Age Bracket | Male | Female |
| Under 5 Years | 0 (0.0%) | 0 (0.0%) |
| 5 to 17 Years | 122 (3.6%) | 130 (3.8%) |
| 18 to 34 Years | 60 (3.6%) | 162 (7.1%) |
| 35 to 64 Years | 497 (10.2%) | 328 (6.2%) |
| 65 to 74 Years | 96 (16.2%) | 271 (33.3%) |
| 75 Years and over | 66 (30.7%) | 378 (71.7%) |
Disability Class by Sex by Age in Fish Hawk
Disability Class: Hearing Difficulty
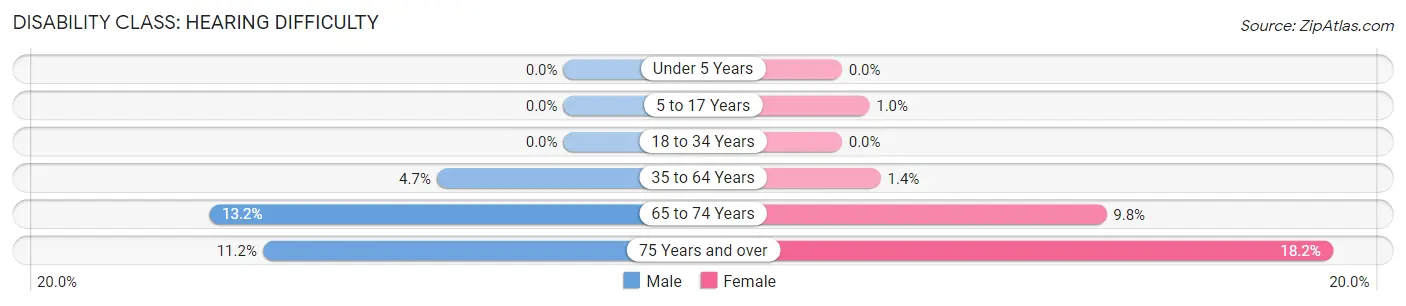
| Age Bracket | Male | Female |
| Under 5 Years | 0 (0.0%) | 0 (0.0%) |
| 5 to 17 Years | 0 (0.0%) | 35 (1.0%) |
| 18 to 34 Years | 0 (0.0%) | 0 (0.0%) |
| 35 to 64 Years | 229 (4.7%) | 76 (1.4%) |
| 65 to 74 Years | 78 (13.2%) | 80 (9.8%) |
| 75 Years and over | 24 (11.2%) | 96 (18.2%) |
Disability Class: Vision Difficulty
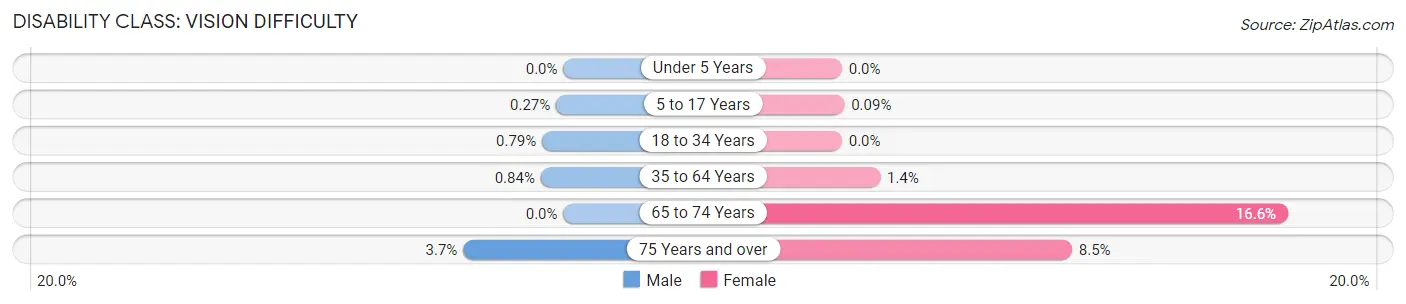
| Age Bracket | Male | Female |
| Under 5 Years | 0 (0.0%) | 0 (0.0%) |
| 5 to 17 Years | 9 (0.3%) | 3 (0.1%) |
| 18 to 34 Years | 13 (0.8%) | 0 (0.0%) |
| 35 to 64 Years | 41 (0.8%) | 75 (1.4%) |
| 65 to 74 Years | 0 (0.0%) | 135 (16.6%) |
| 75 Years and over | 8 (3.7%) | 45 (8.5%) |
Disability Class: Cognitive Difficulty
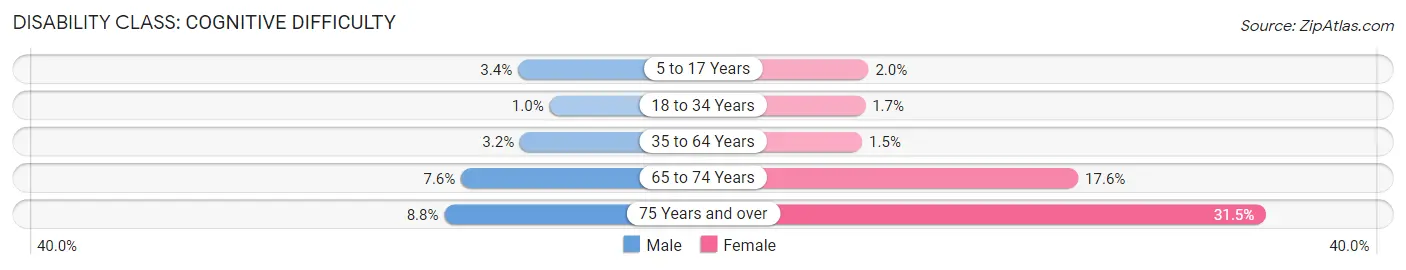
| Age Bracket | Male | Female |
| 5 to 17 Years | 113 (3.4%) | 68 (2.0%) |
| 18 to 34 Years | 17 (1.0%) | 40 (1.7%) |
| 35 to 64 Years | 157 (3.2%) | 80 (1.5%) |
| 65 to 74 Years | 45 (7.6%) | 143 (17.5%) |
| 75 Years and over | 19 (8.8%) | 166 (31.5%) |
Disability Class: Ambulatory Difficulty
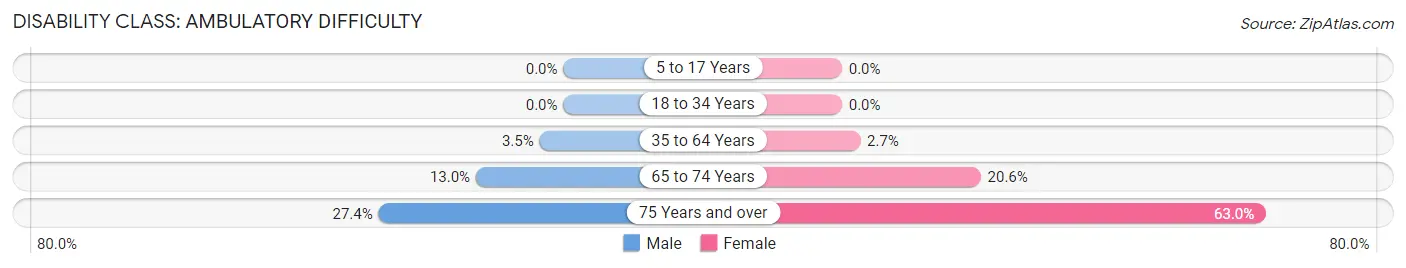
| Age Bracket | Male | Female |
| 5 to 17 Years | 0 (0.0%) | 0 (0.0%) |
| 18 to 34 Years | 0 (0.0%) | 0 (0.0%) |
| 35 to 64 Years | 172 (3.5%) | 144 (2.7%) |
| 65 to 74 Years | 77 (13.0%) | 168 (20.6%) |
| 75 Years and over | 59 (27.4%) | 332 (63.0%) |
Disability Class: Self-Care Difficulty
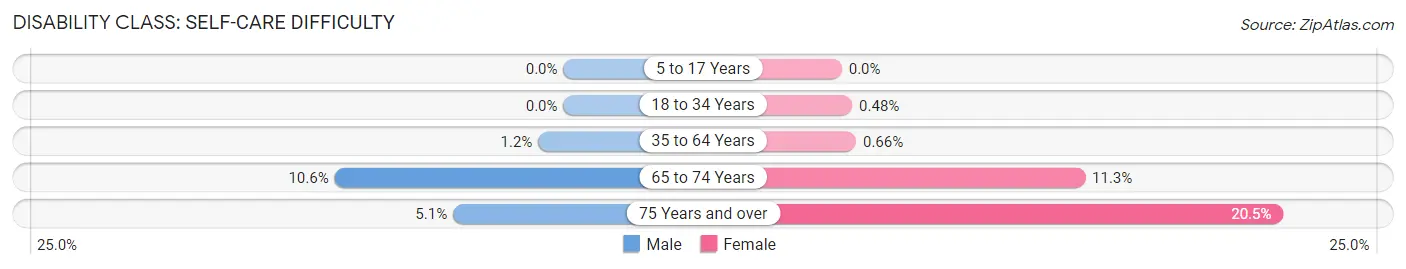
| Age Bracket | Male | Female |
| 5 to 17 Years | 0 (0.0%) | 0 (0.0%) |
| 18 to 34 Years | 0 (0.0%) | 11 (0.5%) |
| 35 to 64 Years | 57 (1.2%) | 35 (0.7%) |
| 65 to 74 Years | 63 (10.6%) | 92 (11.3%) |
| 75 Years and over | 11 (5.1%) | 108 (20.5%) |
Technology Access in Fish Hawk
Computing Device Access in Fish Hawk
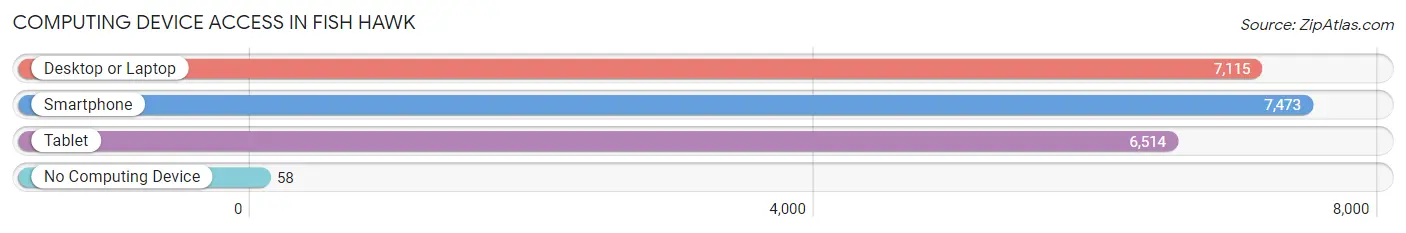
| Device Type | # Households | % Households |
| Desktop or Laptop | 7,115 | 92.4% |
| Smartphone | 7,473 | 97.1% |
| Tablet | 6,514 | 84.6% |
| No Computing Device | 58 | 0.7% |
| Total | 7,697 | 100.0% |
Internet Access in Fish Hawk
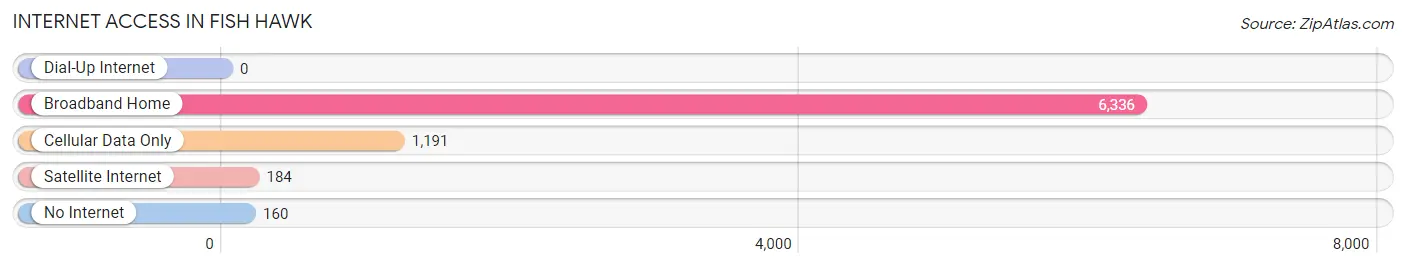
| Internet Type | # Households | % Households |
| Dial-Up Internet | 0 | 0.0% |
| Broadband Home | 6,336 | 82.3% |
| Cellular Data Only | 1,191 | 15.5% |
| Satellite Internet | 184 | 2.4% |
| No Internet | 160 | 2.1% |
| Total | 7,697 | 100.0% |
Fish Hawk Summary
History
Fish Hawk, Florida is a small unincorporated community located in Hillsborough County, Florida. It is located approximately 20 miles southeast of Tampa and is part of the Tampa-St. Petersburg-Clearwater Metropolitan Statistical Area. The area was first settled in the late 19th century by a group of settlers from the nearby town of Lithia. The settlers were attracted to the area due to its abundance of fish and wildlife, and the area was soon known as Fish Hawk.
The area was sparsely populated until the early 20th century, when the railroad came through the area. This allowed for the development of the area, and soon the town of Fish Hawk was established. The town was incorporated in 1925 and was home to a variety of businesses, including a general store, a post office, a school, and a few churches.
The town of Fish Hawk experienced a period of growth in the 1950s and 1960s, as the population increased and new businesses opened. However, the town began to decline in the 1970s and 1980s, as the population began to move away and businesses began to close. By the 1990s, the town had become a small, rural community with a population of just over 1,000.
Geography
Fish Hawk is located in Hillsborough County, Florida, approximately 20 miles southeast of Tampa. The town is situated on the banks of the Alafia River, which flows through the area. The town is surrounded by a variety of natural features, including wetlands, forests, and lakes. The area is also home to a variety of wildlife, including deer, wild turkeys, and a variety of birds.
The town of Fish Hawk is located in a humid subtropical climate zone, with hot, humid summers and mild winters. The average temperature in the summer is around 90 degrees Fahrenheit, while the average temperature in the winter is around 60 degrees Fahrenheit. The area receives an average of 50 inches of rain per year.
Economy
The economy of Fish Hawk is largely based on agriculture and tourism. The area is home to a variety of farms, which produce a variety of crops, including citrus fruits, vegetables, and hay. The area is also home to a variety of tourist attractions, including fishing, boating, and camping.
The town of Fish Hawk is also home to a variety of small businesses, including restaurants, stores, and other services. The town is also home to a few manufacturing companies, which produce a variety of products, including furniture and clothing.
Demographics
As of the 2010 census, the population of Fish Hawk was 1,093. The population is largely white (90.2%), with a small percentage of African Americans (4.2%) and Hispanics (3.2%). The median household income in the town is $45,000, and the median age is 44.
Conclusion
Fish Hawk, Florida is a small unincorporated community located in Hillsborough County, Florida. It is located approximately 20 miles southeast of Tampa and is part of the Tampa-St. Petersburg-Clearwater Metropolitan Statistical Area. The area was first settled in the late 19th century by a group of settlers from the nearby town of Lithia. The town of Fish Hawk experienced a period of growth in the 1950s and 1960s, but has since become a small, rural community with a population of just over 1,000. The economy of Fish Hawk is largely based on agriculture and tourism, and the population is largely white.
Common Questions
What is Per Capita Income in Fish Hawk?
Per Capita income in Fish Hawk is $47,021.
What is the Median Family Income in Fish Hawk?
Median Family Income in Fish Hawk is $138,333.
What is the Median Household income in Fish Hawk?
Median Household Income in Fish Hawk is $129,580.
What is Income or Wage Gap in Fish Hawk?
Income or Wage Gap in Fish Hawk is 51.9%.
Women in Fish Hawk earn 48.1 cents for every dollar earned by a man.
What is Family Income Deficit in Fish Hawk?
Family Income Deficit in Fish Hawk is $14,706.
Families that are below poverty line in Fish Hawk earn $14,706 less on average than the poverty threshold level.
What is Inequality or Gini Index in Fish Hawk?
Inequality or Gini Index in Fish Hawk is 0.40.
What is the Total Population of Fish Hawk?
Total Population of Fish Hawk is 25,179.
What is the Total Male Population of Fish Hawk?
Total Male Population of Fish Hawk is 11,900.
What is the Total Female Population of Fish Hawk?
Total Female Population of Fish Hawk is 13,279.
What is the Ratio of Males per 100 Females in Fish Hawk?
There are 89.62 Males per 100 Females in Fish Hawk.
What is the Ratio of Females per 100 Males in Fish Hawk?
There are 111.59 Females per 100 Males in Fish Hawk.
What is the Median Population Age in Fish Hawk?
Median Population Age in Fish Hawk is 35.3 Years.
What is the Average Family Size in Fish Hawk
Average Family Size in Fish Hawk is 3.5 People.
What is the Average Household Size in Fish Hawk
Average Household Size in Fish Hawk is 3.3 People.
How Large is the Labor Force in Fish Hawk?
There are 11,938 People in the Labor Forcein in Fish Hawk.
What is the Percentage of People in the Labor Force in Fish Hawk?
68.2% of People are in the Labor Force in Fish Hawk.
What is the Unemployment Rate in Fish Hawk?
Unemployment Rate in Fish Hawk is 5.6%.