Yalaha, FL Map & Demographics
Yalaha Map
Yalaha Overview
$58,085
PER CAPITA INCOME
$122,996
AVG FAMILY INCOME
$122,644
AVG HOUSEHOLD INCOME
53.7%
WAGE / INCOME GAP [ % ]
46.3¢/ $1
WAGE / INCOME GAP [ $ ]
0.36
INEQUALITY / GINI INDEX
1,404
TOTAL POPULATION
693
MALE POPULATION
711
FEMALE POPULATION
97.47
MALES / 100 FEMALES
102.60
FEMALES / 100 MALES
67.5
MEDIAN AGE
2.2
AVG FAMILY SIZE
2.1
AVG HOUSEHOLD SIZE
434
LABOR FORCE [ PEOPLE ]
35.0%
PERCENT IN LABOR FORCE
Yalaha Zip Codes
Yalaha Area Codes
Income in Yalaha
Income Overview in Yalaha
Per Capita Income in Yalaha is $58,085, while median incomes of families and households are $122,996 and $122,644 respectively.
| Characteristic | Number | Measure |
| Per Capita Income | 1,404 | $58,085 |
| Median Family Income | 551 | $122,996 |
| Mean Family Income | 551 | $136,919 |
| Median Household Income | 668 | $122,644 |
| Mean Household Income | 668 | $123,357 |
| Income Deficit | 551 | $0 |
| Wage / Income Gap (%) | 1,404 | 53.68% |
| Wage / Income Gap ($) | 1,404 | 46.32¢ per $1 |
| Gini / Inequality Index | 1,404 | 0.36 |
Earnings by Sex in Yalaha
Average Earnings in Yalaha are $64,470, $125,203 for men and $58,000 for women, a difference of 53.7%.
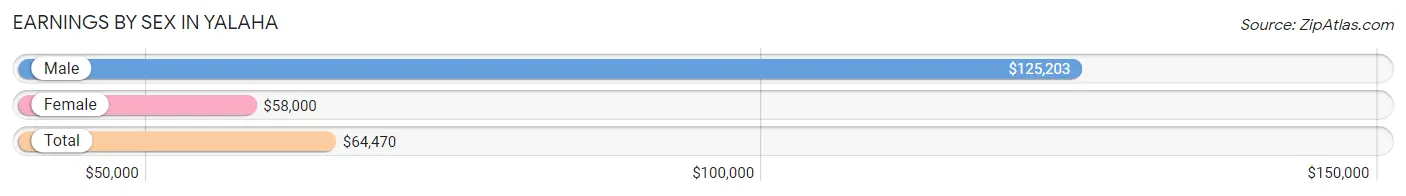
| Sex | Number | Average Earnings |
| Male | 212 (48.8%) | $125,203 |
| Female | 222 (51.1%) | $58,000 |
| Total | 434 (100.0%) | $64,470 |
Earnings by Sex by Income Bracket in Yalaha
The most common earnings brackets in Yalaha are $100,000+ for men (137 | 64.6%) and $55,000 to $64,999 for women (88 | 39.6%).
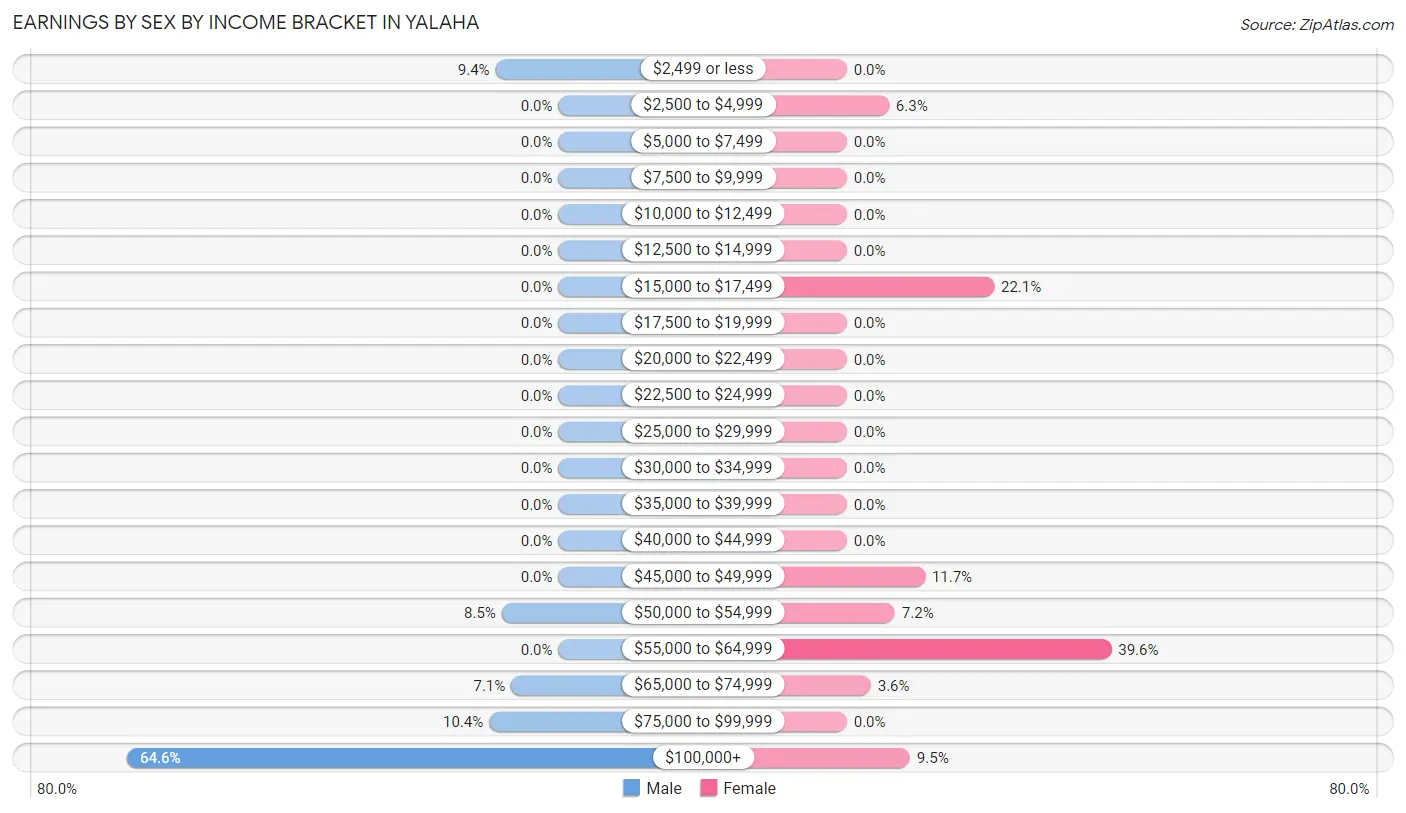
| Income | Male | Female |
| $2,499 or less | 20 (9.4%) | 0 (0.0%) |
| $2,500 to $4,999 | 0 (0.0%) | 14 (6.3%) |
| $5,000 to $7,499 | 0 (0.0%) | 0 (0.0%) |
| $7,500 to $9,999 | 0 (0.0%) | 0 (0.0%) |
| $10,000 to $12,499 | 0 (0.0%) | 0 (0.0%) |
| $12,500 to $14,999 | 0 (0.0%) | 0 (0.0%) |
| $15,000 to $17,499 | 0 (0.0%) | 49 (22.1%) |
| $17,500 to $19,999 | 0 (0.0%) | 0 (0.0%) |
| $20,000 to $22,499 | 0 (0.0%) | 0 (0.0%) |
| $22,500 to $24,999 | 0 (0.0%) | 0 (0.0%) |
| $25,000 to $29,999 | 0 (0.0%) | 0 (0.0%) |
| $30,000 to $34,999 | 0 (0.0%) | 0 (0.0%) |
| $35,000 to $39,999 | 0 (0.0%) | 0 (0.0%) |
| $40,000 to $44,999 | 0 (0.0%) | 0 (0.0%) |
| $45,000 to $49,999 | 0 (0.0%) | 26 (11.7%) |
| $50,000 to $54,999 | 18 (8.5%) | 16 (7.2%) |
| $55,000 to $64,999 | 0 (0.0%) | 88 (39.6%) |
| $65,000 to $74,999 | 15 (7.1%) | 8 (3.6%) |
| $75,000 to $99,999 | 22 (10.4%) | 0 (0.0%) |
| $100,000+ | 137 (64.6%) | 21 (9.5%) |
| Total | 212 (100.0%) | 222 (100.0%) |
Earnings by Sex by Educational Attainment in Yalaha
Average earnings in Yalaha are $125,203 for men and $58,000 for women, a difference of 53.7%. Men with an educational attainment of college or associate's degree enjoy the highest average annual earnings of $125,735, while those with college or associate's degree education earn the least with $125,735. Women with an educational attainment of bachelor's degree earn the most with the average annual earnings of $61,250, while those with high school diploma education have the smallest earnings of $15,924.
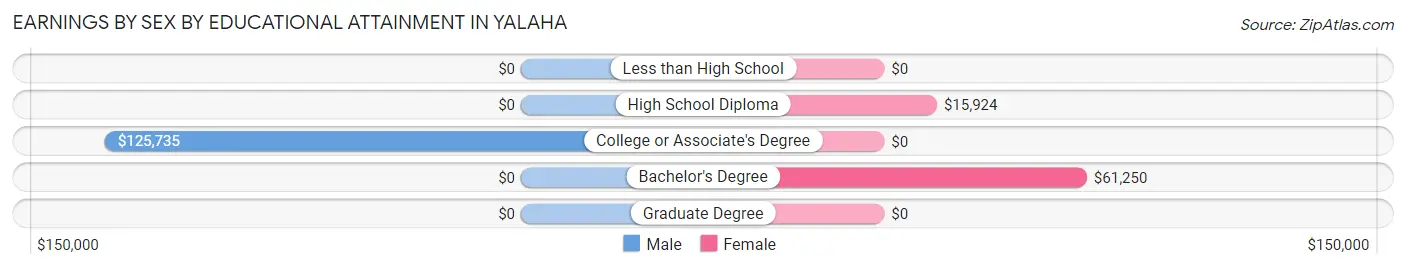
| Educational Attainment | Male Income | Female Income |
| Less than High School | - | - |
| High School Diploma | - | - |
| College or Associate's Degree | $125,735 | $0 |
| Bachelor's Degree | - | - |
| Graduate Degree | - | - |
| Total | $125,203 | $58,000 |
Family Income in Yalaha
Family Income Brackets in Yalaha
According to the Yalaha family income data, there are 286 families falling into the $100,000 to $149,999 income range, which is the most common income bracket and makes up 51.9% of all families.
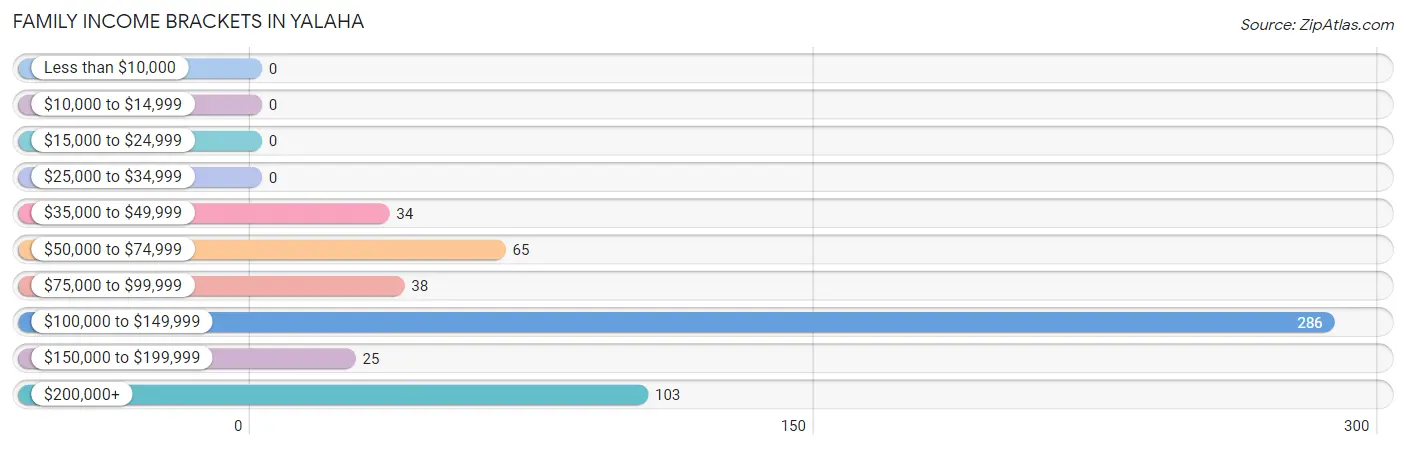
| Income Bracket | # Families | % Families |
| Less than $10,000 | 0 | 0.0% |
| $10,000 to $14,999 | 0 | 0.0% |
| $15,000 to $24,999 | 0 | 0.0% |
| $25,000 to $34,999 | 0 | 0.0% |
| $35,000 to $49,999 | 34 | 6.2% |
| $50,000 to $74,999 | 65 | 11.8% |
| $75,000 to $99,999 | 38 | 6.9% |
| $100,000 to $149,999 | 286 | 51.9% |
| $150,000 to $199,999 | 25 | 4.5% |
| $200,000+ | 103 | 18.7% |
Family Income by Famaliy Size in Yalaha
4-person families (115 | 20.9%) account for the highest median family income in Yalaha with $240,899 per family, while 2-person families (426 | 77.3%) have the highest median income of $60,924 per family member.
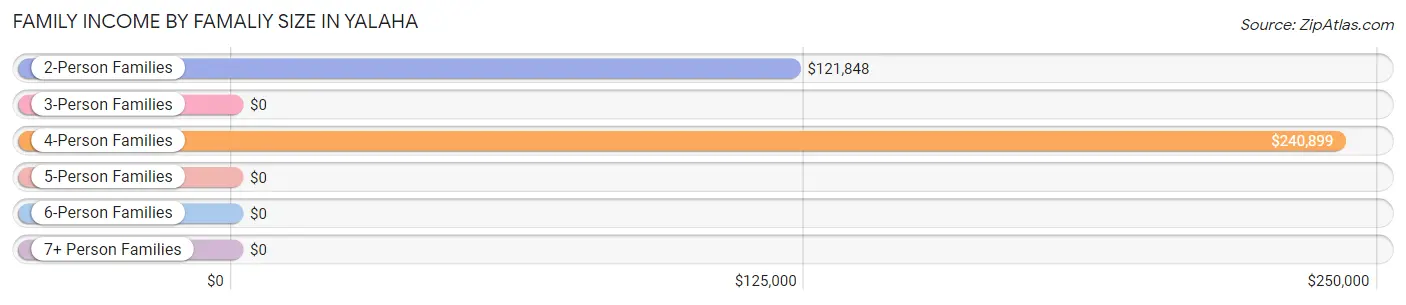
| Income Bracket | # Families | Median Income |
| 2-Person Families | 426 (77.3%) | $121,848 |
| 3-Person Families | 10 (1.8%) | $0 |
| 4-Person Families | 115 (20.9%) | $240,899 |
| 5-Person Families | 0 (0.0%) | $0 |
| 6-Person Families | 0 (0.0%) | $0 |
| 7+ Person Families | 0 (0.0%) | $0 |
| Total | 551 (100.0%) | $122,996 |
Family Income by Number of Earners in Yalaha
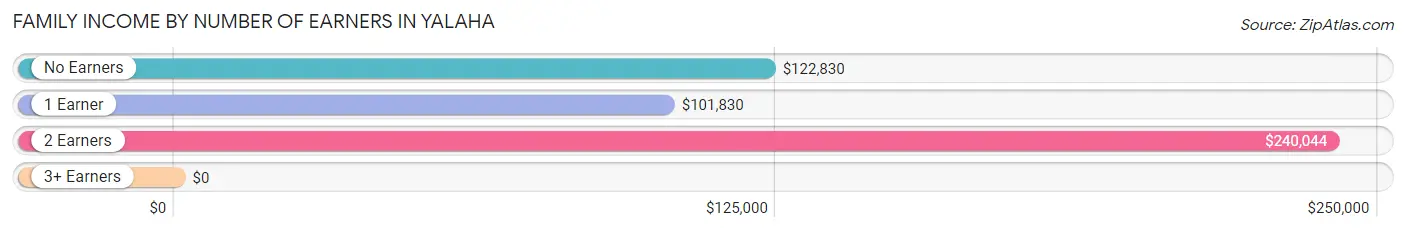
| Number of Earners | # Families | Median Income |
| No Earners | 352 (63.9%) | $122,830 |
| 1 Earner | 45 (8.2%) | $101,830 |
| 2 Earners | 154 (28.0%) | $240,044 |
| 3+ Earners | 0 (0.0%) | $0 |
| Total | 551 (100.0%) | $122,996 |
Household Income in Yalaha
Household Income Brackets in Yalaha
With 286 households falling in the category, the $100,000 to $149,999 income range is the most frequent in Yalaha, accounting for 42.8% of all households.
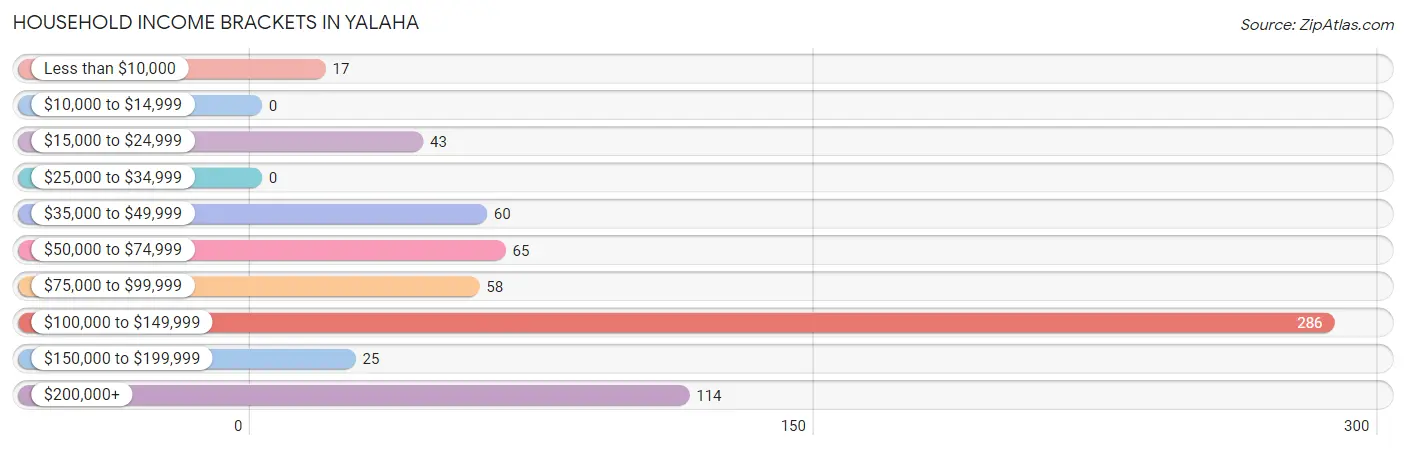
| Income Bracket | # Households | % Households |
| Less than $10,000 | 17 | 2.5% |
| $10,000 to $14,999 | 0 | 0.0% |
| $15,000 to $24,999 | 43 | 6.4% |
| $25,000 to $34,999 | 0 | 0.0% |
| $35,000 to $49,999 | 60 | 9.0% |
| $50,000 to $74,999 | 65 | 9.7% |
| $75,000 to $99,999 | 58 | 8.7% |
| $100,000 to $149,999 | 286 | 42.8% |
| $150,000 to $199,999 | 25 | 3.7% |
| $200,000+ | 114 | 17.1% |
Household Income by Householder Age in Yalaha
The median household income in Yalaha is $122,644, with the highest median household income of $240,526 found in the 25 to 44 years age bracket for the primary householder. A total of 132 households (19.8%) fall into this category.
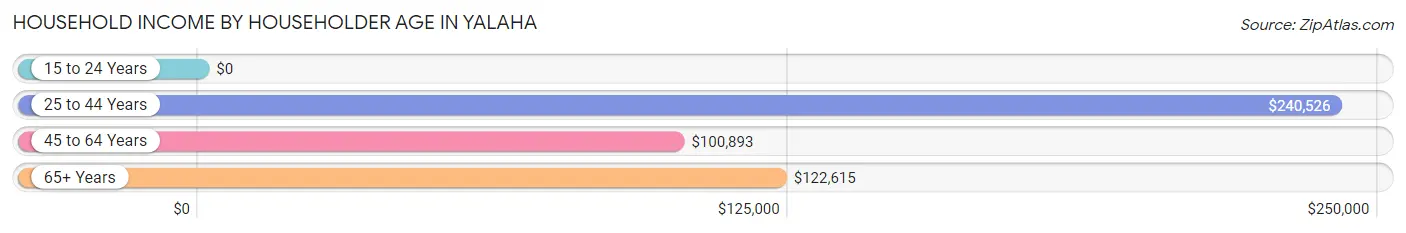
| Income Bracket | # Households | Median Income |
| 15 to 24 Years | 0 (0.0%) | $0 |
| 25 to 44 Years | 132 (19.8%) | $240,526 |
| 45 to 64 Years | 132 (19.8%) | $100,893 |
| 65+ Years | 404 (60.5%) | $122,615 |
| Total | 668 (100.0%) | $122,644 |
Poverty in Yalaha
Income Below Poverty by Sex and Age in Yalaha
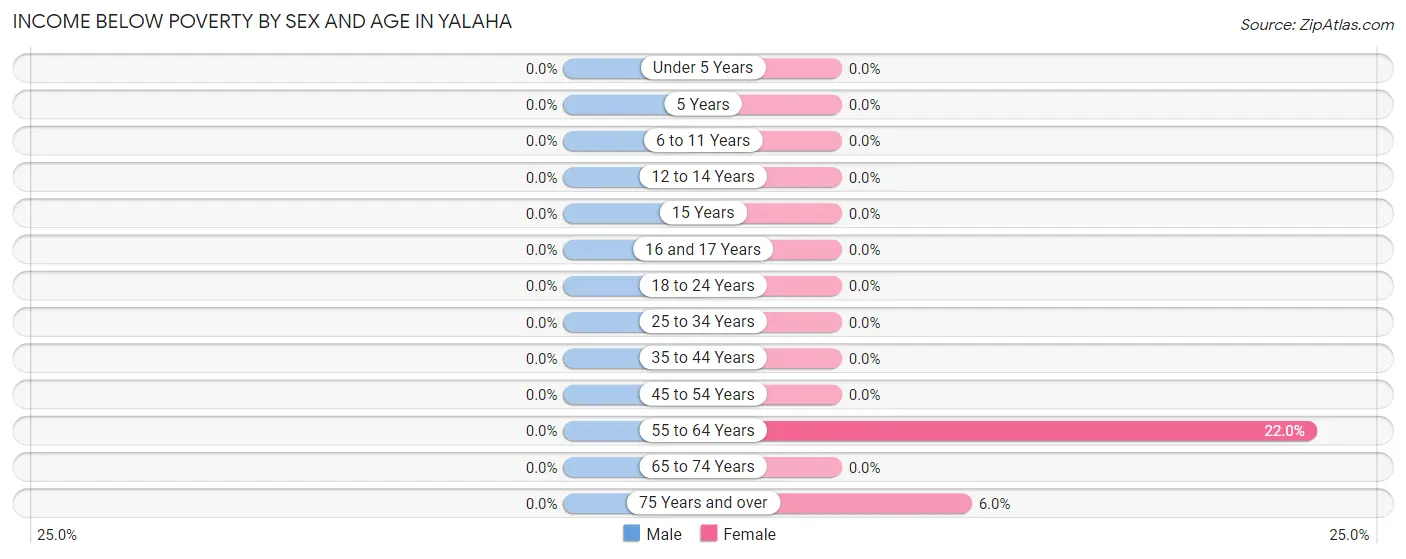
| Age Bracket | Male | Female |
| Under 5 Years | 0 (0.0%) | 0 (0.0%) |
| 5 Years | 0 (0.0%) | 0 (0.0%) |
| 6 to 11 Years | 0 (0.0%) | 0 (0.0%) |
| 12 to 14 Years | 0 (0.0%) | 0 (0.0%) |
| 15 Years | 0 (0.0%) | 0 (0.0%) |
| 16 and 17 Years | 0 (0.0%) | 0 (0.0%) |
| 18 to 24 Years | 0 (0.0%) | 0 (0.0%) |
| 25 to 34 Years | 0 (0.0%) | 0 (0.0%) |
| 35 to 44 Years | 0 (0.0%) | 0 (0.0%) |
| 45 to 54 Years | 0 (0.0%) | 0 (0.0%) |
| 55 to 64 Years | 0 (0.0%) | 26 (22.0%) |
| 65 to 74 Years | 0 (0.0%) | 0 (0.0%) |
| 75 Years and over | 0 (0.0%) | 17 (6.0%) |
| Total | 0 (0.0%) | 43 (6.0%) |
Income Above Poverty by Sex and Age in Yalaha
According to the poverty statistics in Yalaha, males aged 5 years and females aged 6 to 11 years are the age groups that are most secure financially, with 100.0% of males and 100.0% of females in these age groups living above the poverty line.
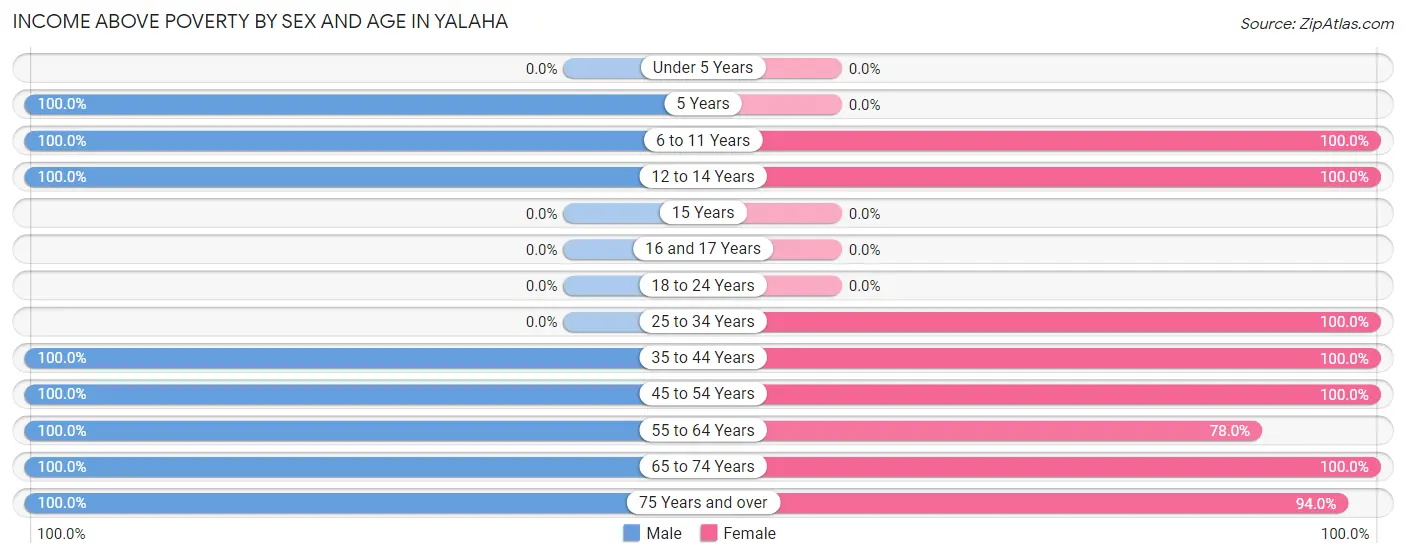
| Age Bracket | Male | Female |
| Under 5 Years | 0 (0.0%) | 0 (0.0%) |
| 5 Years | 22 (100.0%) | 0 (0.0%) |
| 6 to 11 Years | 85 (100.0%) | 16 (100.0%) |
| 12 to 14 Years | 6 (100.0%) | 36 (100.0%) |
| 15 Years | 0 (0.0%) | 0 (0.0%) |
| 16 and 17 Years | 0 (0.0%) | 0 (0.0%) |
| 18 to 24 Years | 0 (0.0%) | 0 (0.0%) |
| 25 to 34 Years | 0 (0.0%) | 29 (100.0%) |
| 35 to 44 Years | 95 (100.0%) | 111 (100.0%) |
| 45 to 54 Years | 60 (100.0%) | 39 (100.0%) |
| 55 to 64 Years | 58 (100.0%) | 92 (78.0%) |
| 65 to 74 Years | 130 (100.0%) | 80 (100.0%) |
| 75 Years and over | 237 (100.0%) | 265 (94.0%) |
| Total | 693 (100.0%) | 668 (94.0%) |
Income Below Poverty Among Married-Couple Families in Yalaha
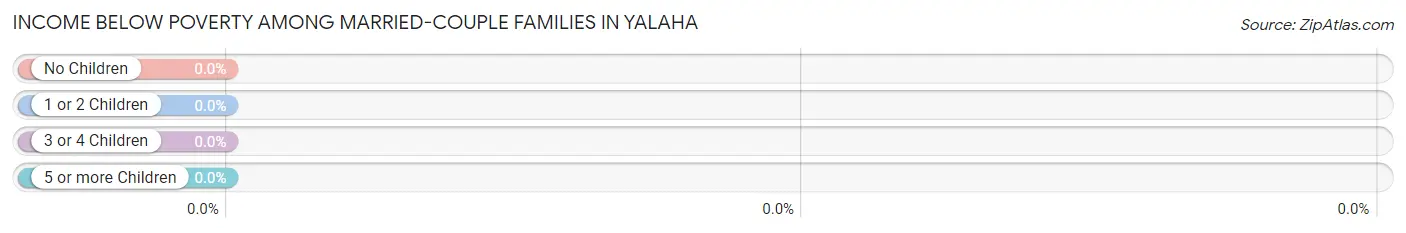
| Children | Above Poverty | Below Poverty |
| No Children | 411 (100.0%) | 0 (0.0%) |
| 1 or 2 Children | 123 (100.0%) | 0 (0.0%) |
| 3 or 4 Children | 0 (0.0%) | 0 (0.0%) |
| 5 or more Children | 0 (0.0%) | 0 (0.0%) |
| Total | 534 (100.0%) | 0 (0.0%) |
Income Below Poverty Among Single-Parent Households in Yalaha
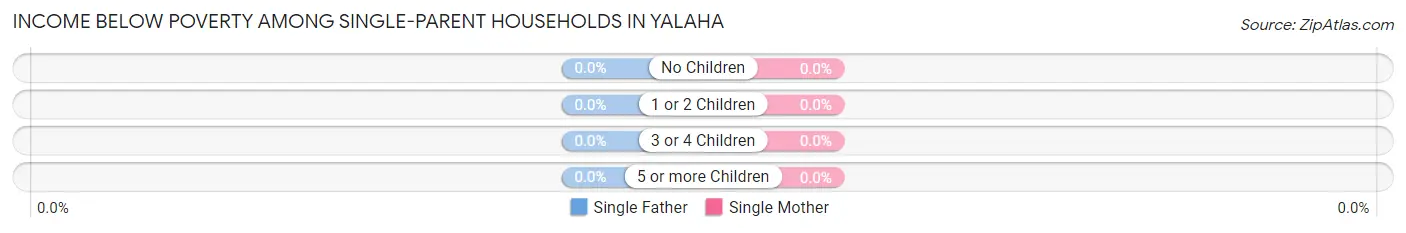
| Children | Single Father | Single Mother |
| No Children | 0 (0.0%) | 0 (0.0%) |
| 1 or 2 Children | 0 (0.0%) | 0 (0.0%) |
| 3 or 4 Children | 0 (0.0%) | 0 (0.0%) |
| 5 or more Children | 0 (0.0%) | 0 (0.0%) |
| Total | 0 (0.0%) | 0 (0.0%) |
Income Below Poverty Among Married-Couple vs Single-Parent Households in Yalaha
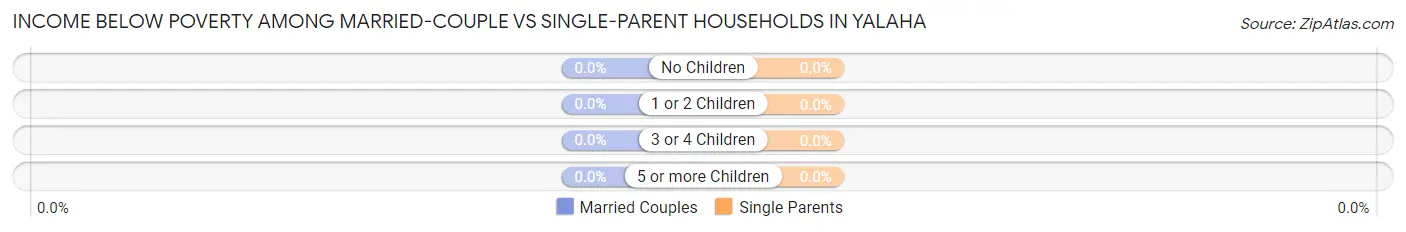
| Children | Married-Couple Families | Single-Parent Households |
| No Children | 0 (0.0%) | 0 (0.0%) |
| 1 or 2 Children | 0 (0.0%) | 0 (0.0%) |
| 3 or 4 Children | 0 (0.0%) | 0 (0.0%) |
| 5 or more Children | 0 (0.0%) | 0 (0.0%) |
| Total | 0 (0.0%) | 0 (0.0%) |
Race in Yalaha
The most populous races in Yalaha are White / Caucasian (1,205 | 85.8%), Native / Alaskan (164 | 11.7%), and Two or more Races (20 | 1.4%).
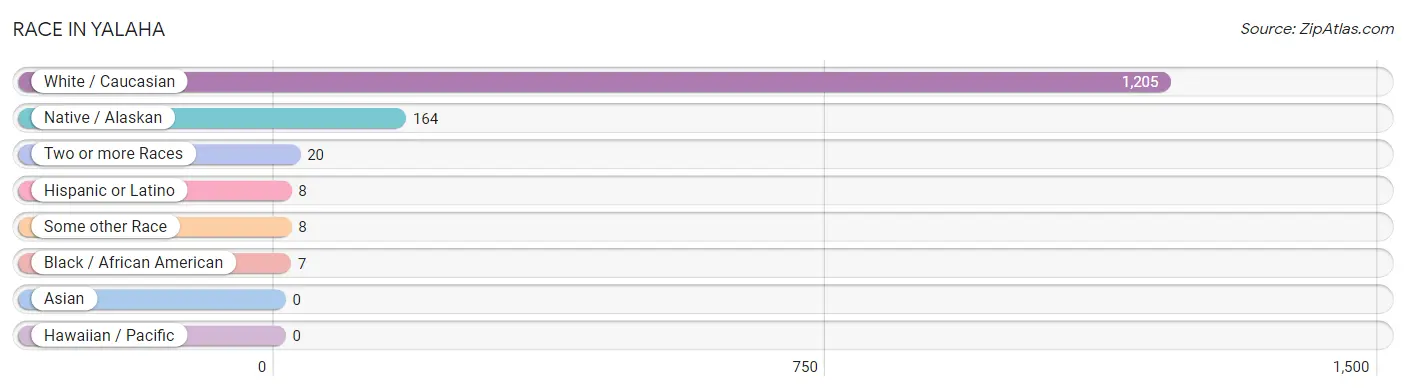
| Race | # Population | % Population |
| Asian | 0 | 0.0% |
| Black / African American | 7 | 0.5% |
| Hawaiian / Pacific | 0 | 0.0% |
| Hispanic or Latino | 8 | 0.6% |
| Native / Alaskan | 164 | 11.7% |
| White / Caucasian | 1,205 | 85.8% |
| Two or more Races | 20 | 1.4% |
| Some other Race | 8 | 0.6% |
| Total | 1,404 | 100.0% |
Ancestry in Yalaha
The most populous ancestries reported in Yalaha are German (477 | 34.0%), Irish (317 | 22.6%), American (314 | 22.4%), English (96 | 6.8%), and Italian (96 | 6.8%), together accounting for 92.6% of all Yalaha residents.
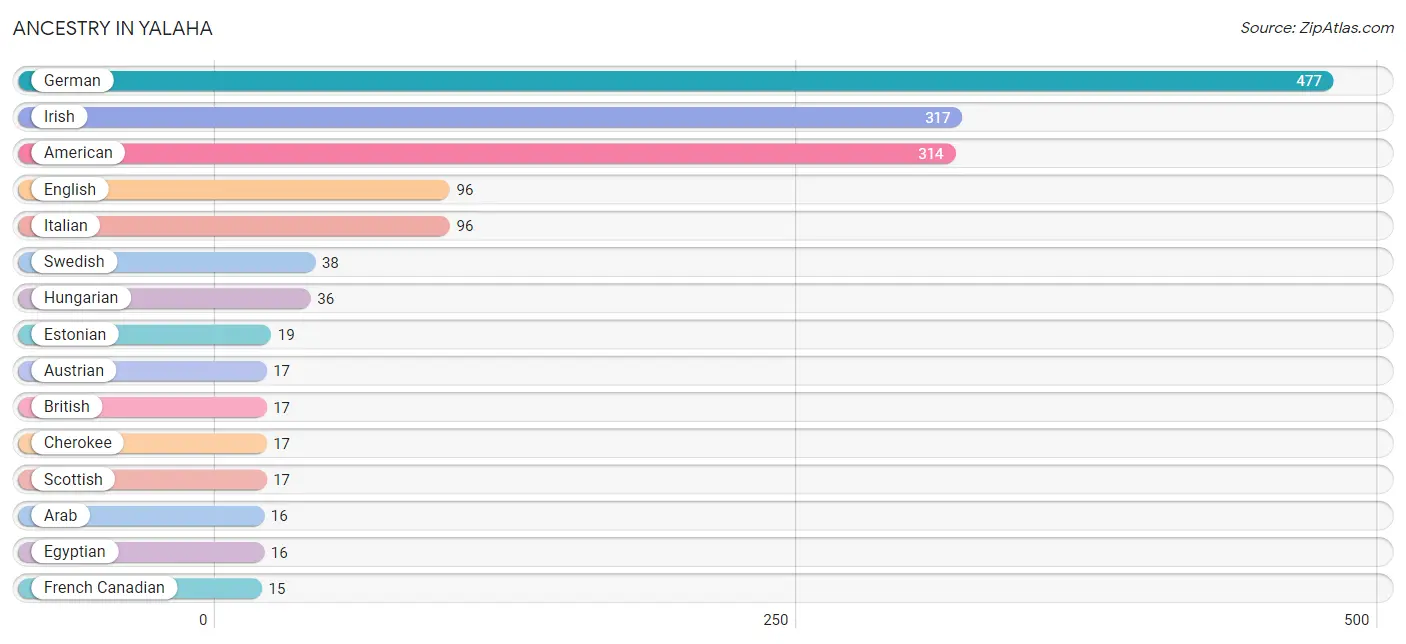
| Ancestry | # Population | % Population |
| American | 314 | 22.4% |
| Arab | 16 | 1.1% |
| Austrian | 17 | 1.2% |
| British | 17 | 1.2% |
| Cherokee | 17 | 1.2% |
| Egyptian | 16 | 1.1% |
| English | 96 | 6.8% |
| Estonian | 19 | 1.3% |
| European | 7 | 0.5% |
| French Canadian | 15 | 1.1% |
| German | 477 | 34.0% |
| Hungarian | 36 | 2.6% |
| Irish | 317 | 22.6% |
| Italian | 96 | 6.8% |
| Puerto Rican | 8 | 0.6% |
| Scotch-Irish | 8 | 0.6% |
| Scottish | 17 | 1.2% |
| Swedish | 38 | 2.7% | View All 18 Rows |
Immigrants in Yalaha

| Immigration Origin | # Population | % Population | View All 0 Rows |
Sex and Age in Yalaha
Sex and Age in Yalaha
The most populous age groups in Yalaha are 85 Years and over (191 | 27.6%) for men and 85 Years and over (238 | 33.5%) for women.
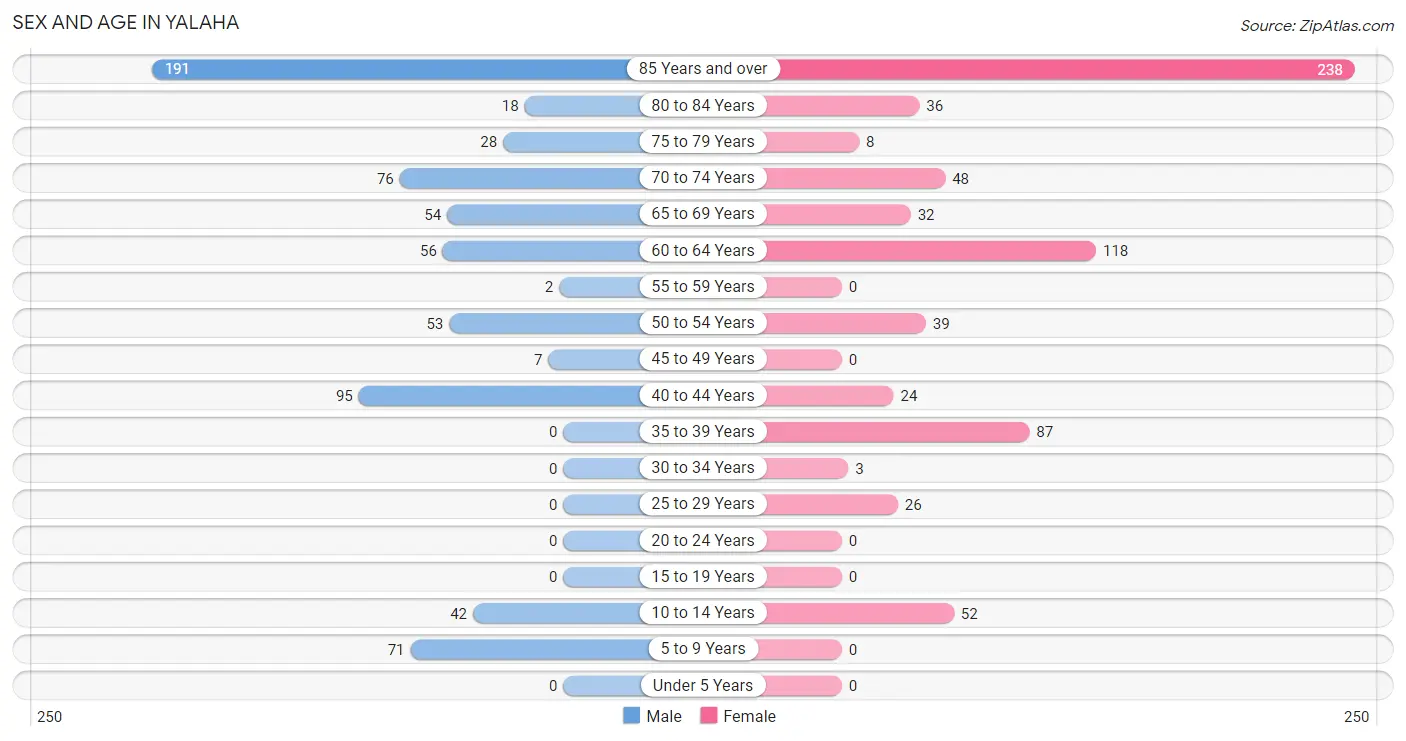
| Age Bracket | Male | Female |
| Under 5 Years | 0 (0.0%) | 0 (0.0%) |
| 5 to 9 Years | 71 (10.2%) | 0 (0.0%) |
| 10 to 14 Years | 42 (6.1%) | 52 (7.3%) |
| 15 to 19 Years | 0 (0.0%) | 0 (0.0%) |
| 20 to 24 Years | 0 (0.0%) | 0 (0.0%) |
| 25 to 29 Years | 0 (0.0%) | 26 (3.7%) |
| 30 to 34 Years | 0 (0.0%) | 3 (0.4%) |
| 35 to 39 Years | 0 (0.0%) | 87 (12.2%) |
| 40 to 44 Years | 95 (13.7%) | 24 (3.4%) |
| 45 to 49 Years | 7 (1.0%) | 0 (0.0%) |
| 50 to 54 Years | 53 (7.6%) | 39 (5.5%) |
| 55 to 59 Years | 2 (0.3%) | 0 (0.0%) |
| 60 to 64 Years | 56 (8.1%) | 118 (16.6%) |
| 65 to 69 Years | 54 (7.8%) | 32 (4.5%) |
| 70 to 74 Years | 76 (11.0%) | 48 (6.8%) |
| 75 to 79 Years | 28 (4.0%) | 8 (1.1%) |
| 80 to 84 Years | 18 (2.6%) | 36 (5.1%) |
| 85 Years and over | 191 (27.6%) | 238 (33.5%) |
| Total | 693 (100.0%) | 711 (100.0%) |
Families and Households in Yalaha
Median Family Size in Yalaha
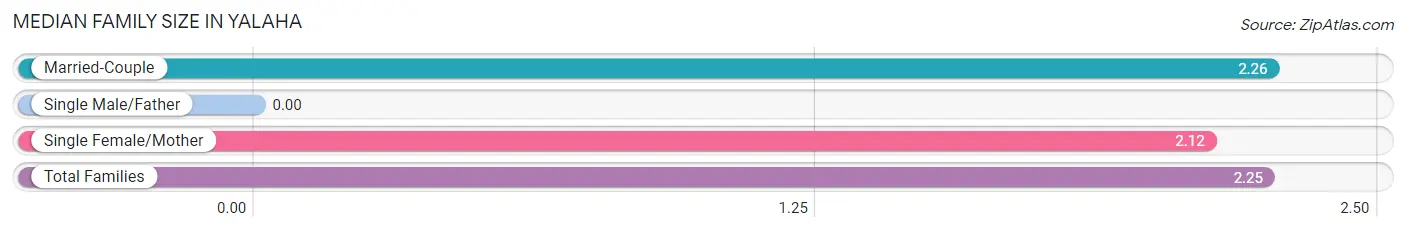
| Family Type | # Families | Family Size |
| Married-Couple | 534 (96.9%) | 2.26 |
| Single Male/Father | 0 (0.0%) | - |
| Single Female/Mother | 17 (3.1%) | 2.12 |
| Total Families | 551 (100.0%) | 2.25 |
Median Household Size in Yalaha
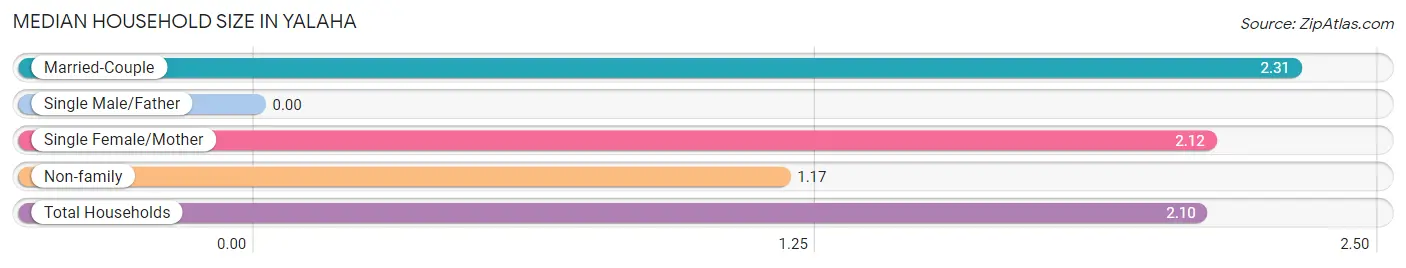
| Household Type | # Households | Household Size |
| Married-Couple | 534 (79.9%) | 2.31 |
| Single Male/Father | 0 (0.0%) | - |
| Single Female/Mother | 17 (2.5%) | 2.12 |
| Non-family | 117 (17.5%) | 1.17 |
| Total Households | 668 (100.0%) | 2.10 |
Household Size by Marriage Status in Yalaha
Out of a total of 668 households in Yalaha, 551 (82.5%) are family households, while 117 (17.5%) are nonfamily households. The most numerous type of family households are 2-person households, comprising 403, and the most common type of nonfamily households are 1-person households, comprising 97.
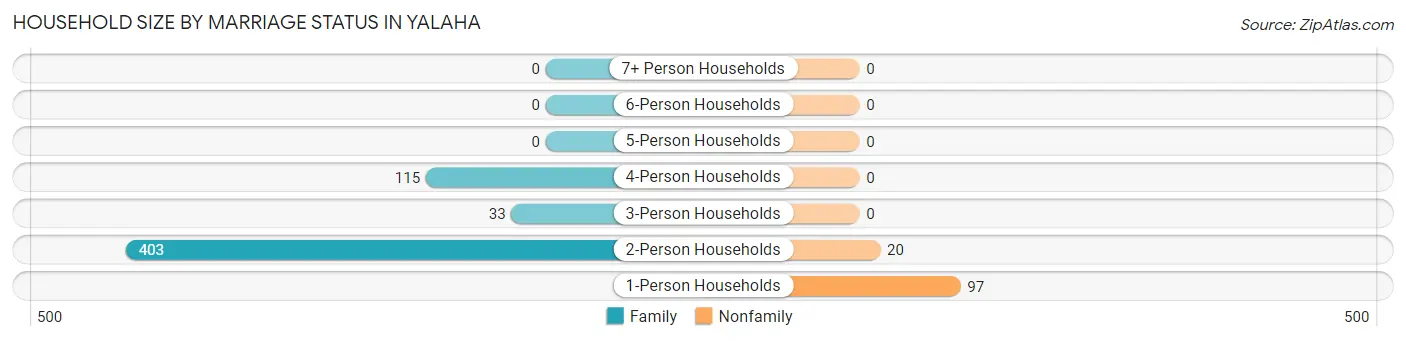
| Household Size | Family Households | Nonfamily Households |
| 1-Person Households | - | 97 (14.5%) |
| 2-Person Households | 403 (60.3%) | 20 (3.0%) |
| 3-Person Households | 33 (4.9%) | 0 (0.0%) |
| 4-Person Households | 115 (17.2%) | 0 (0.0%) |
| 5-Person Households | 0 (0.0%) | 0 (0.0%) |
| 6-Person Households | 0 (0.0%) | 0 (0.0%) |
| 7+ Person Households | 0 (0.0%) | 0 (0.0%) |
| Total | 551 (82.5%) | 117 (17.5%) |
Female Fertility in Yalaha
Fertility by Age in Yalaha
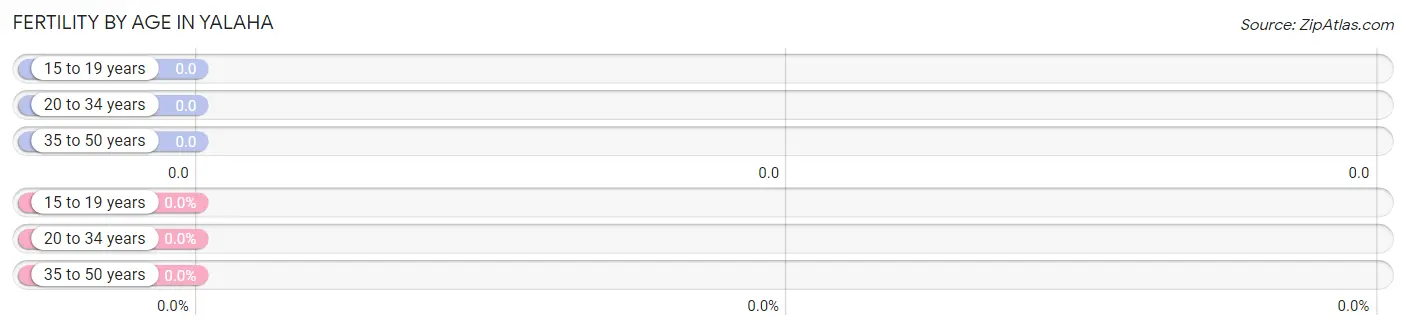
| Age Bracket | Women with Births | Births / 1,000 Women |
| 15 to 19 years | 0 (0.0%) | 0.0 |
| 20 to 34 years | 0 (0.0%) | 0.0 |
| 35 to 50 years | 0 (0.0%) | 0.0 |
| Total | 0 (0.0%) | 0.0 |
Fertility by Age by Marriage Status in Yalaha
| Age Bracket | Married | Unmarried |
| 15 to 19 years | 0 (0.0%) | 0 (0.0%) |
| 20 to 34 years | 0 (0.0%) | 0 (0.0%) |
| 35 to 50 years | 0 (0.0%) | 0 (0.0%) |
| Total | 0 (0.0%) | 0 (0.0%) |
Fertility by Education in Yalaha
| Educational Attainment | Women with Births | Births / 1,000 Women |
| Less than High School | 0 (0.0%) | 0.0 |
| High School Diploma | 0 (0.0%) | 0.0 |
| College or Associate's Degree | 0 (0.0%) | 0.0 |
| Bachelor's Degree | 0 (0.0%) | 0.0 |
| Graduate Degree | 0 (0.0%) | 0.0 |
| Total | 0 (0.0%) | 0.0 |
Fertility by Education by Marriage Status in Yalaha
| Educational Attainment | Married | Unmarried |
| Less than High School | 0 (0.0%) | 0 (0.0%) |
| High School Diploma | 0 (0.0%) | 0 (0.0%) |
| College or Associate's Degree | 0 (0.0%) | 0 (0.0%) |
| Bachelor's Degree | 0 (0.0%) | 0 (0.0%) |
| Graduate Degree | 0 (0.0%) | 0 (0.0%) |
| Total | 0 (0.0%) | 0 (0.0%) |
Employment Characteristics in Yalaha
Employment by Class of Employer in Yalaha
Among the 434 employed individuals in Yalaha, private company employees (335 | 77.2%), state government employees (49 | 11.3%), and local government employees (20 | 4.6%) make up the most common classes of employment.
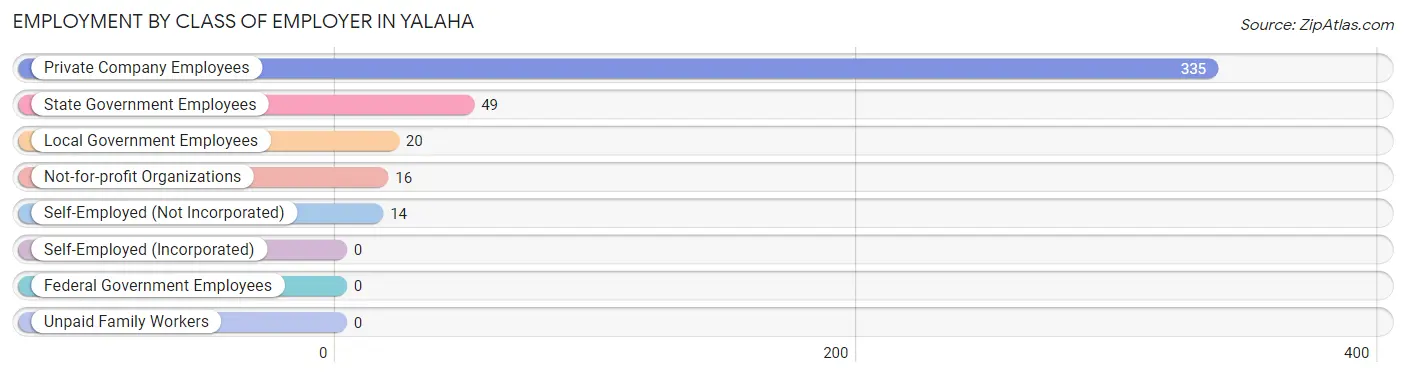
| Employer Class | # Employees | % Employees |
| Private Company Employees | 335 | 77.2% |
| Self-Employed (Incorporated) | 0 | 0.0% |
| Self-Employed (Not Incorporated) | 14 | 3.2% |
| Not-for-profit Organizations | 16 | 3.7% |
| Local Government Employees | 20 | 4.6% |
| State Government Employees | 49 | 11.3% |
| Federal Government Employees | 0 | 0.0% |
| Unpaid Family Workers | 0 | 0.0% |
| Total | 434 | 100.0% |
Employment Status by Age in Yalaha
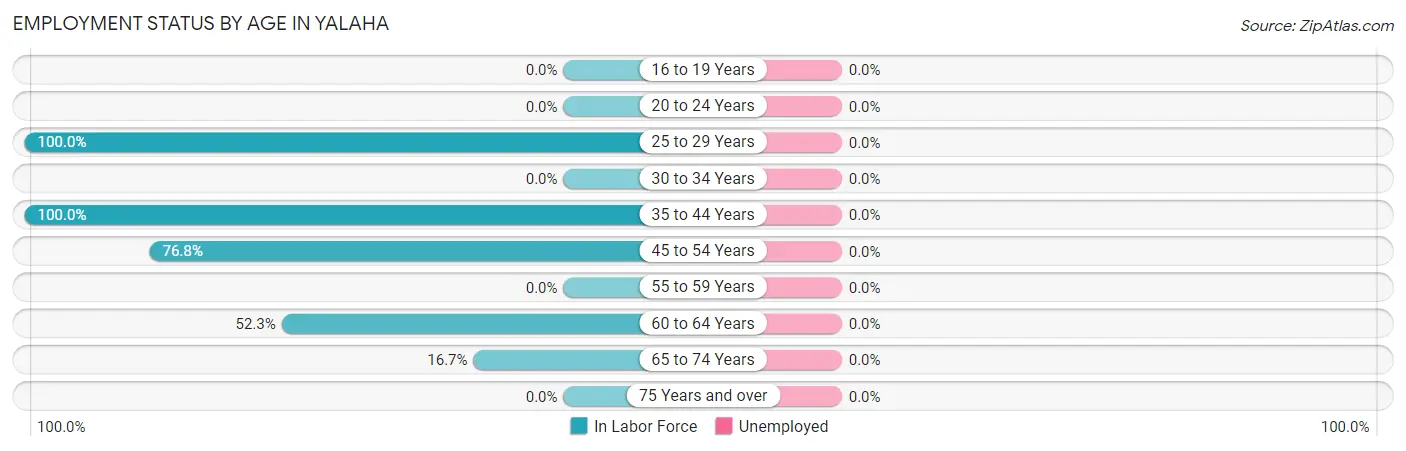
| Age Bracket | In Labor Force | Unemployed |
| 16 to 19 Years | 0 (0.0%) | 0 (0.0%) |
| 20 to 24 Years | 0 (0.0%) | 0 (0.0%) |
| 25 to 29 Years | 26 (100.0%) | 0 (0.0%) |
| 30 to 34 Years | 0 (0.0%) | 0 (0.0%) |
| 35 to 44 Years | 206 (100.0%) | 0 (0.0%) |
| 45 to 54 Years | 76 (76.8%) | 0 (0.0%) |
| 55 to 59 Years | 0 (0.0%) | 0 (0.0%) |
| 60 to 64 Years | 91 (52.3%) | 0 (0.0%) |
| 65 to 74 Years | 35 (16.7%) | 0 (0.0%) |
| 75 Years and over | 0 (0.0%) | 0 (0.0%) |
| Total | 434 (35.0%) | 0 (0.0%) |
Employment Status by Educational Attainment in Yalaha
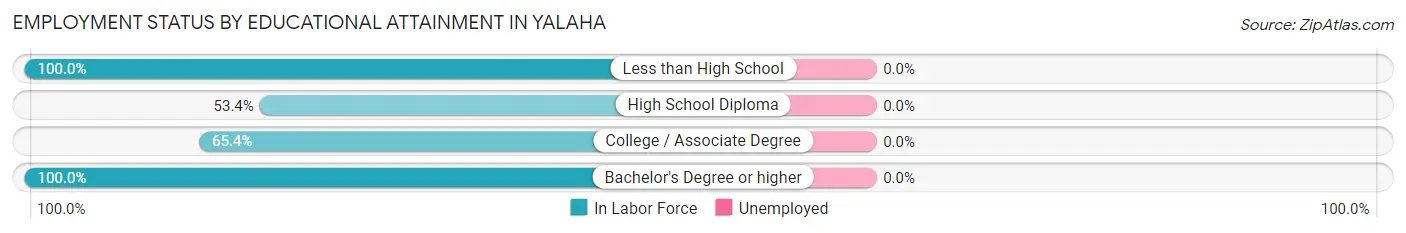
| Educational Attainment | In Labor Force | Unemployed |
| Less than High School | 18 (100.0%) | 0 (0.0%) |
| High School Diploma | 95 (53.4%) | 0 (0.0%) |
| College / Associate Degree | 53 (65.4%) | 0 (0.0%) |
| Bachelor's Degree or higher | 233 (100.0%) | 0 (0.0%) |
| Total | 399 (78.2%) | 0 (0.0%) |
Employment Occupations by Sex in Yalaha
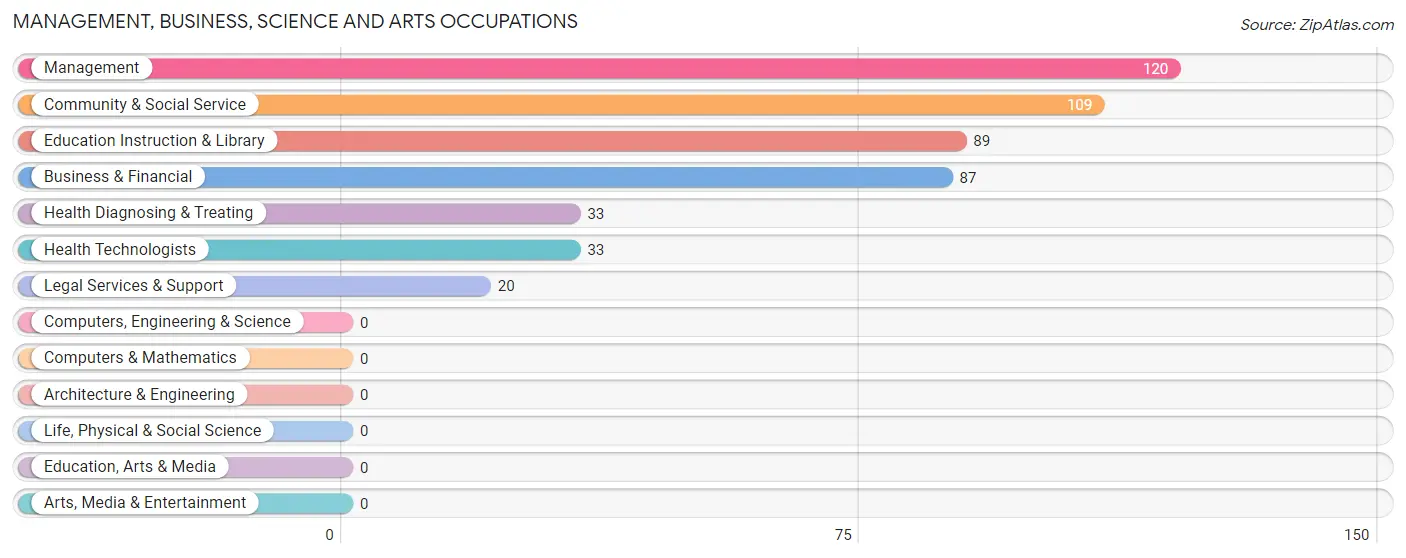
Management, Business, Science and Arts Occupations
The most common Management, Business, Science and Arts occupations in Yalaha are Management (120 | 27.7%), Community & Social Service (109 | 25.1%), Education Instruction & Library (89 | 20.5%), Business & Financial (87 | 20.1%), and Health Diagnosing & Treating (33 | 7.6%).
Management, Business, Science and Arts Occupations by Sex
Within the Management, Business, Science and Arts occupations in Yalaha, the most male-oriented occupations are Legal Services & Support (100.0%), Management (86.7%), and Business & Financial (23.0%), while the most female-oriented occupations are Education Instruction & Library (100.0%), Community & Social Service (81.7%), and Health Diagnosing & Treating (78.8%).
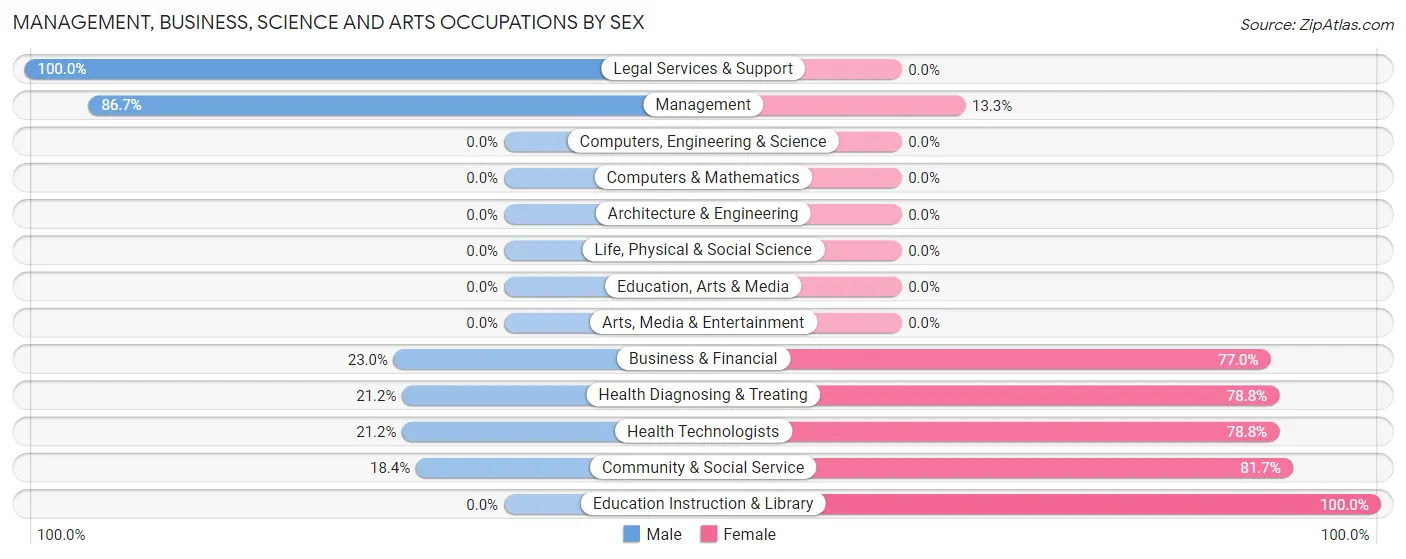
| Occupation | Male | Female |
| Management | 104 (86.7%) | 16 (13.3%) |
| Business & Financial | 20 (23.0%) | 67 (77.0%) |
| Computers, Engineering & Science | 0 (0.0%) | 0 (0.0%) |
| Computers & Mathematics | 0 (0.0%) | 0 (0.0%) |
| Architecture & Engineering | 0 (0.0%) | 0 (0.0%) |
| Life, Physical & Social Science | 0 (0.0%) | 0 (0.0%) |
| Community & Social Service | 20 (18.3%) | 89 (81.7%) |
| Education, Arts & Media | 0 (0.0%) | 0 (0.0%) |
| Legal Services & Support | 20 (100.0%) | 0 (0.0%) |
| Education Instruction & Library | 0 (0.0%) | 89 (100.0%) |
| Arts, Media & Entertainment | 0 (0.0%) | 0 (0.0%) |
| Health Diagnosing & Treating | 7 (21.2%) | 26 (78.8%) |
| Health Technologists | 7 (21.2%) | 26 (78.8%) |
| Total (Category) | 151 (43.3%) | 198 (56.7%) |
| Total (Overall) | 212 (48.8%) | 222 (51.1%) |
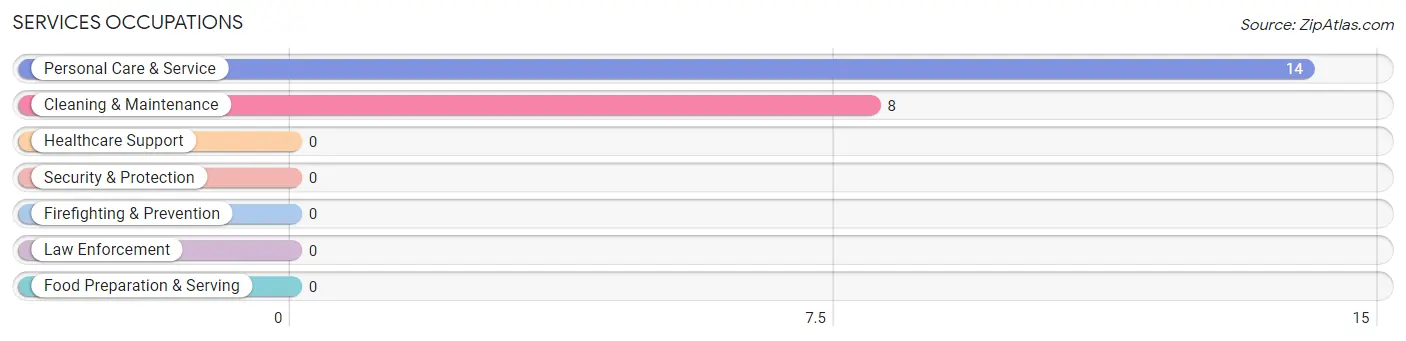
Services Occupations
The most common Services occupations in Yalaha are Personal Care & Service (14 | 3.2%), and Cleaning & Maintenance (8 | 1.8%).
Services Occupations by Sex
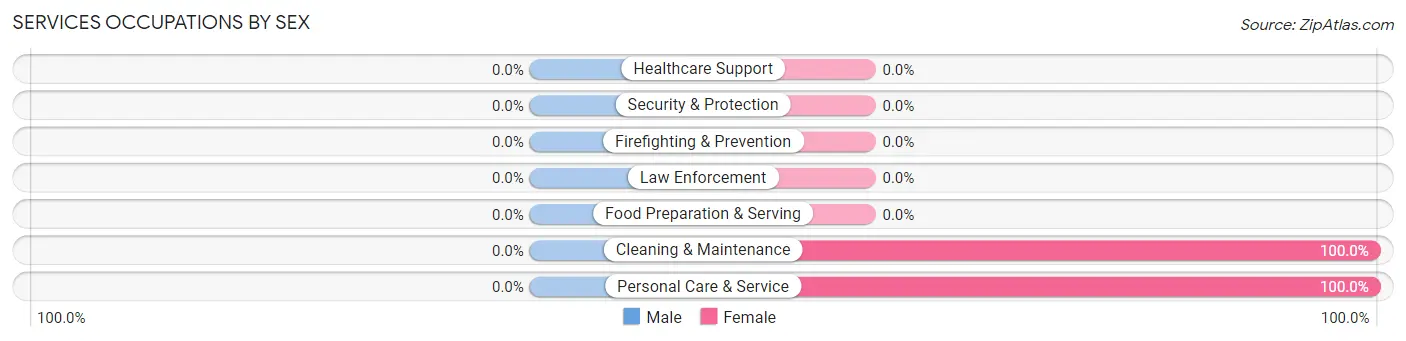
| Occupation | Male | Female |
| Healthcare Support | 0 (0.0%) | 0 (0.0%) |
| Security & Protection | 0 (0.0%) | 0 (0.0%) |
| Firefighting & Prevention | 0 (0.0%) | 0 (0.0%) |
| Law Enforcement | 0 (0.0%) | 0 (0.0%) |
| Food Preparation & Serving | 0 (0.0%) | 0 (0.0%) |
| Cleaning & Maintenance | 0 (0.0%) | 8 (100.0%) |
| Personal Care & Service | 0 (0.0%) | 14 (100.0%) |
| Total (Category) | 0 (0.0%) | 22 (100.0%) |
| Total (Overall) | 212 (48.8%) | 222 (51.1%) |
Sales and Office Occupations
The most common Sales and Office occupations in Yalaha are , and Sales & Related (2 | 0.5%).
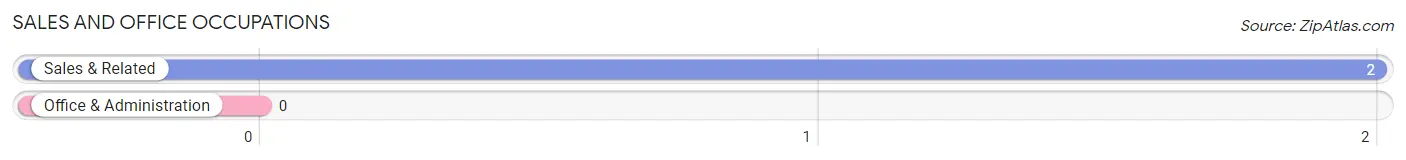
Sales and Office Occupations by Sex
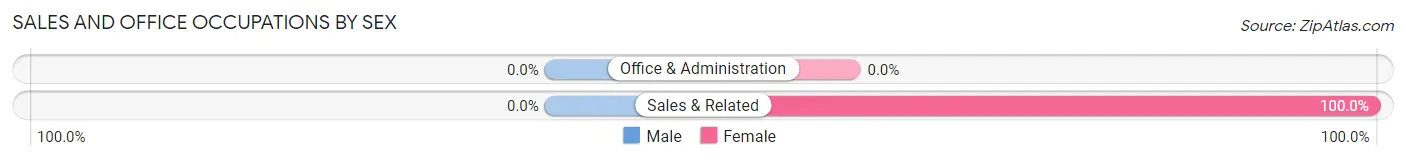
| Occupation | Male | Female |
| Sales & Related | 0 (0.0%) | 2 (100.0%) |
| Office & Administration | 0 (0.0%) | 0 (0.0%) |
| Total (Category) | 0 (0.0%) | 2 (100.0%) |
| Total (Overall) | 212 (48.8%) | 222 (51.1%) |
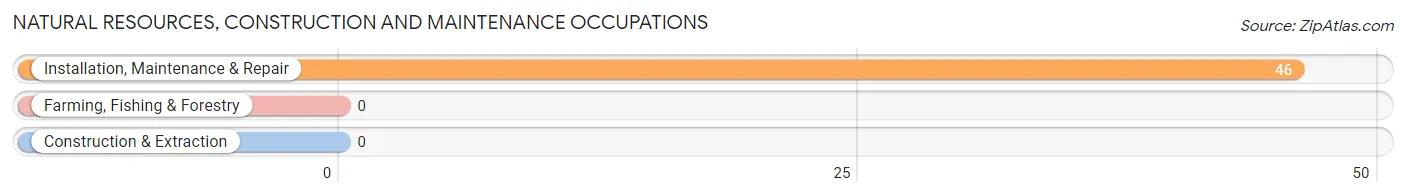
Natural Resources, Construction and Maintenance Occupations
The most common Natural Resources, Construction and Maintenance occupations in Yalaha are , and Installation, Maintenance & Repair (46 | 10.6%).
Natural Resources, Construction and Maintenance Occupations by Sex
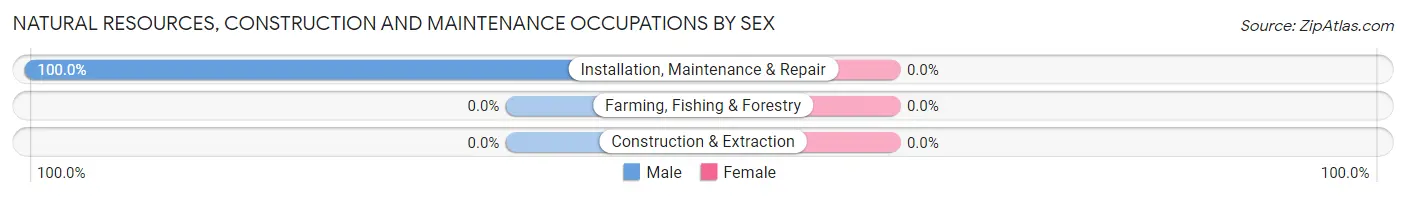
| Occupation | Male | Female |
| Farming, Fishing & Forestry | 0 (0.0%) | 0 (0.0%) |
| Construction & Extraction | 0 (0.0%) | 0 (0.0%) |
| Installation, Maintenance & Repair | 46 (100.0%) | 0 (0.0%) |
| Total (Category) | 46 (100.0%) | 0 (0.0%) |
| Total (Overall) | 212 (48.8%) | 222 (51.1%) |
Production, Transportation and Moving Occupations
The most common Production, Transportation and Moving occupations in Yalaha are , and Production (15 | 3.5%).
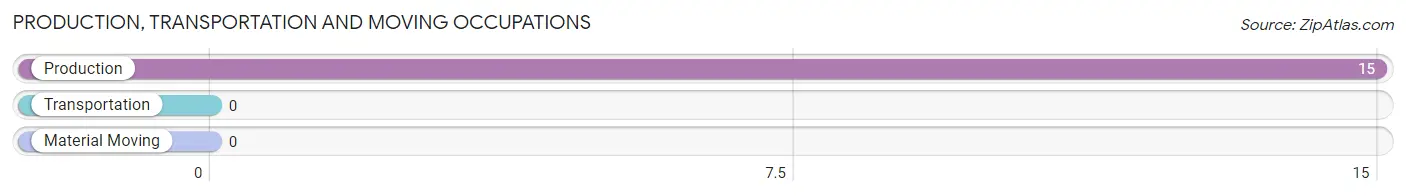
Production, Transportation and Moving Occupations by Sex
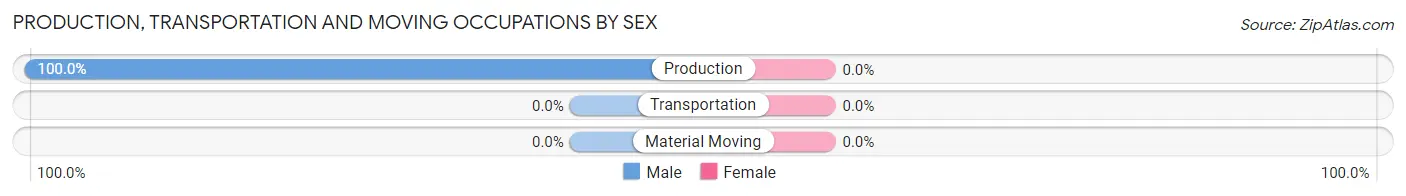
| Occupation | Male | Female |
| Production | 15 (100.0%) | 0 (0.0%) |
| Transportation | 0 (0.0%) | 0 (0.0%) |
| Material Moving | 0 (0.0%) | 0 (0.0%) |
| Total (Category) | 15 (100.0%) | 0 (0.0%) |
| Total (Overall) | 212 (48.8%) | 222 (51.1%) |
Employment Industries by Sex in Yalaha
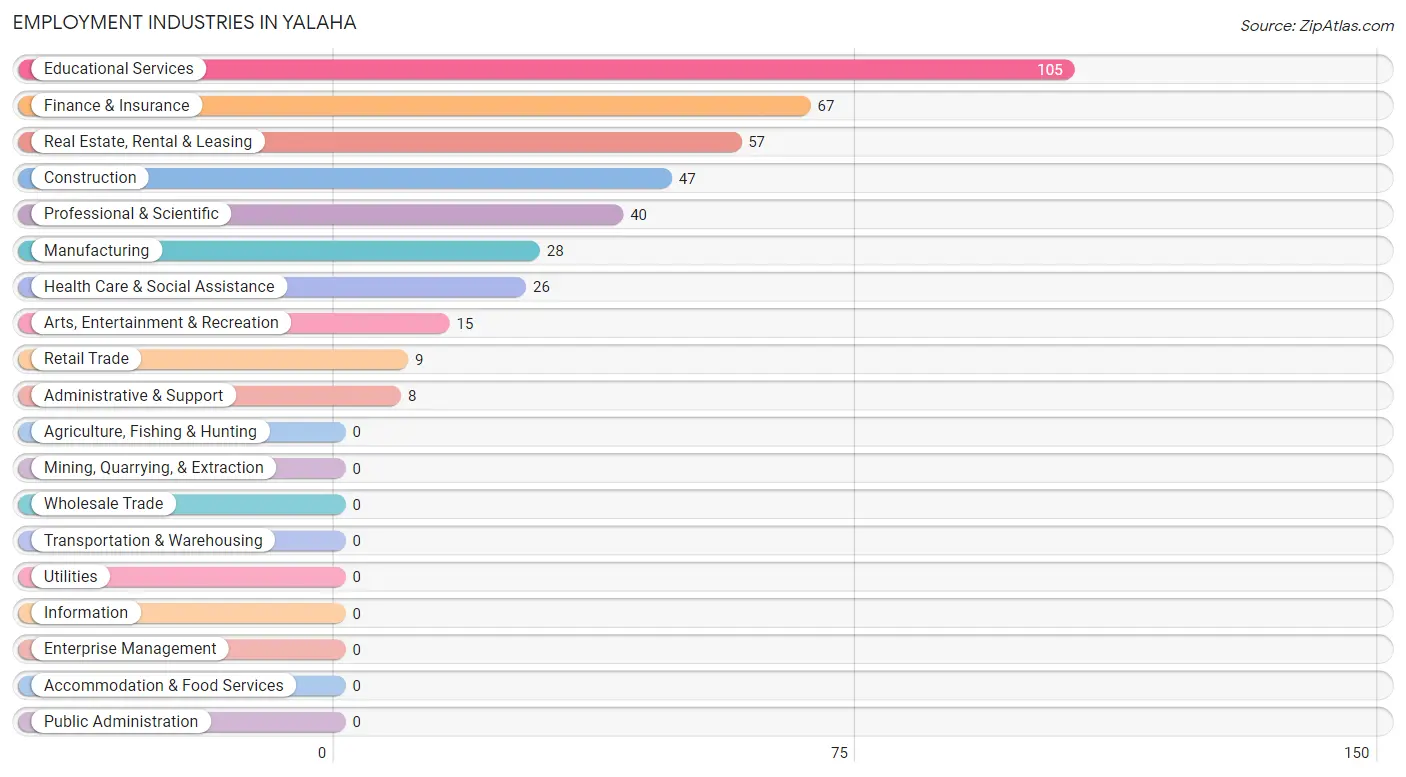
Employment Industries in Yalaha
The major employment industries in Yalaha include Educational Services (105 | 24.2%), Finance & Insurance (67 | 15.4%), Real Estate, Rental & Leasing (57 | 13.1%), Construction (47 | 10.8%), and Professional & Scientific (40 | 9.2%).
Employment Industries by Sex in Yalaha
The Yalaha industries that see more men than women are Construction (100.0%), Manufacturing (100.0%), and Real Estate, Rental & Leasing (100.0%), whereas the industries that tend to have a higher number of women are Finance & Insurance (100.0%), Administrative & Support (100.0%), and Educational Services (100.0%).
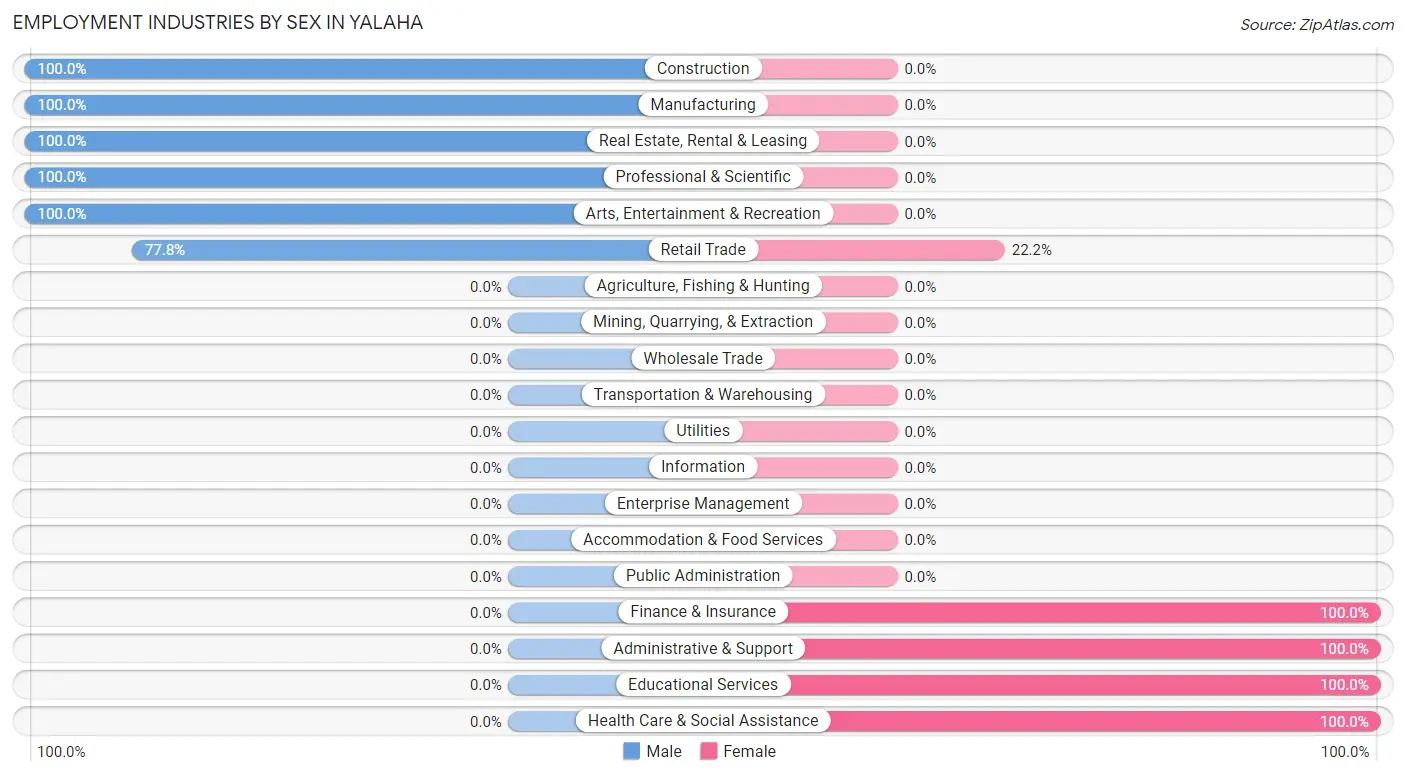
| Industry | Male | Female |
| Agriculture, Fishing & Hunting | 0 (0.0%) | 0 (0.0%) |
| Mining, Quarrying, & Extraction | 0 (0.0%) | 0 (0.0%) |
| Construction | 47 (100.0%) | 0 (0.0%) |
| Manufacturing | 28 (100.0%) | 0 (0.0%) |
| Wholesale Trade | 0 (0.0%) | 0 (0.0%) |
| Retail Trade | 7 (77.8%) | 2 (22.2%) |
| Transportation & Warehousing | 0 (0.0%) | 0 (0.0%) |
| Utilities | 0 (0.0%) | 0 (0.0%) |
| Information | 0 (0.0%) | 0 (0.0%) |
| Finance & Insurance | 0 (0.0%) | 67 (100.0%) |
| Real Estate, Rental & Leasing | 57 (100.0%) | 0 (0.0%) |
| Professional & Scientific | 40 (100.0%) | 0 (0.0%) |
| Enterprise Management | 0 (0.0%) | 0 (0.0%) |
| Administrative & Support | 0 (0.0%) | 8 (100.0%) |
| Educational Services | 0 (0.0%) | 105 (100.0%) |
| Health Care & Social Assistance | 0 (0.0%) | 26 (100.0%) |
| Arts, Entertainment & Recreation | 15 (100.0%) | 0 (0.0%) |
| Accommodation & Food Services | 0 (0.0%) | 0 (0.0%) |
| Public Administration | 0 (0.0%) | 0 (0.0%) |
| Total | 212 (48.8%) | 222 (51.1%) |
Education in Yalaha
School Enrollment in Yalaha
The most common levels of schooling among the 165 students in Yalaha are middle school (94 | 57.0%), elementary school (49 | 29.7%), and nursery / preschool (22 | 13.3%).
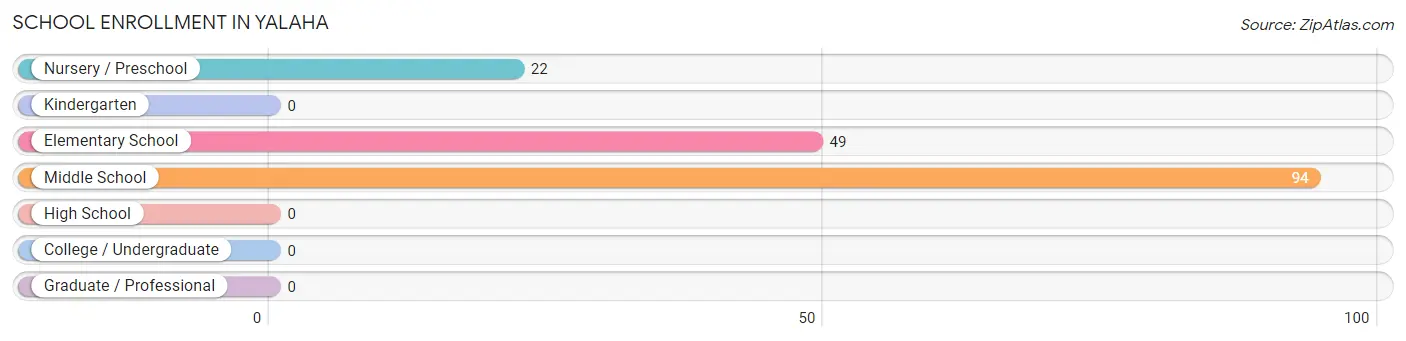
| School Level | # Students | % Students |
| Nursery / Preschool | 22 | 13.3% |
| Kindergarten | 0 | 0.0% |
| Elementary School | 49 | 29.7% |
| Middle School | 94 | 57.0% |
| High School | 0 | 0.0% |
| College / Undergraduate | 0 | 0.0% |
| Graduate / Professional | 0 | 0.0% |
| Total | 165 | 100.0% |
School Enrollment by Age by Funding Source in Yalaha
Out of a total of 165 students who are enrolled in schools in Yalaha, 65 (39.4%) attend a private institution, while the remaining 100 (60.6%) are enrolled in public schools. The age group of 10 to 14 year olds has the highest likelihood of being enrolled in private schools, with 65 (69.2% in the age bracket) enrolled. Conversely, the age group of 5 to 9 year old has the lowest likelihood of being enrolled in a private school, with 71 (100.0% in the age bracket) attending a public institution.
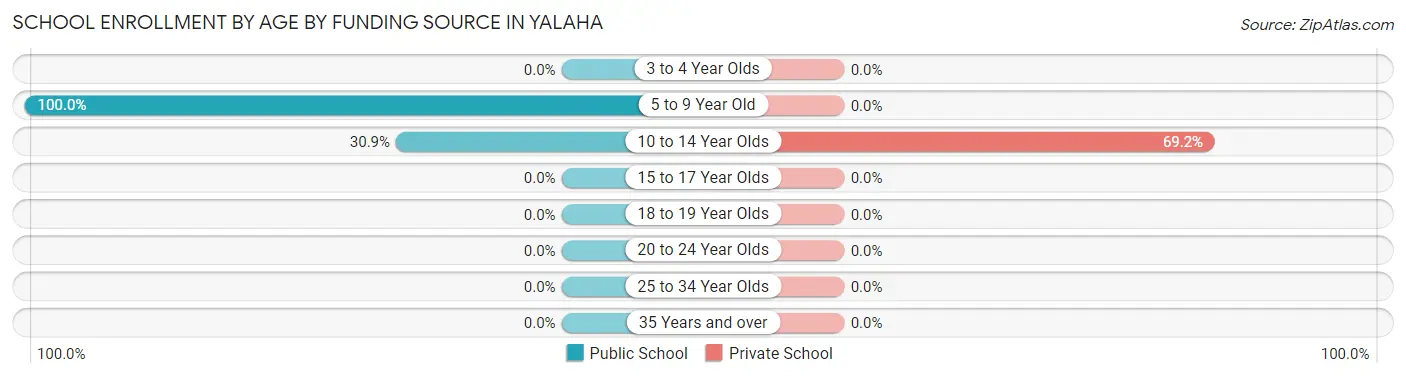
| Age Bracket | Public School | Private School |
| 3 to 4 Year Olds | 0 (0.0%) | 0 (0.0%) |
| 5 to 9 Year Old | 71 (100.0%) | 0 (0.0%) |
| 10 to 14 Year Olds | 29 (30.8%) | 65 (69.2%) |
| 15 to 17 Year Olds | 0 (0.0%) | 0 (0.0%) |
| 18 to 19 Year Olds | 0 (0.0%) | 0 (0.0%) |
| 20 to 24 Year Olds | 0 (0.0%) | 0 (0.0%) |
| 25 to 34 Year Olds | 0 (0.0%) | 0 (0.0%) |
| 35 Years and over | 0 (0.0%) | 0 (0.0%) |
| Total | 100 (60.6%) | 65 (39.4%) |
Educational Attainment by Field of Study in Yalaha
Engineering (174 | 30.7%), education (103 | 18.2%), science & technology (83 | 14.6%), business (72 | 12.7%), and psychology (56 | 9.9%) are the most common fields of study among 567 individuals in Yalaha who have obtained a bachelor's degree or higher.
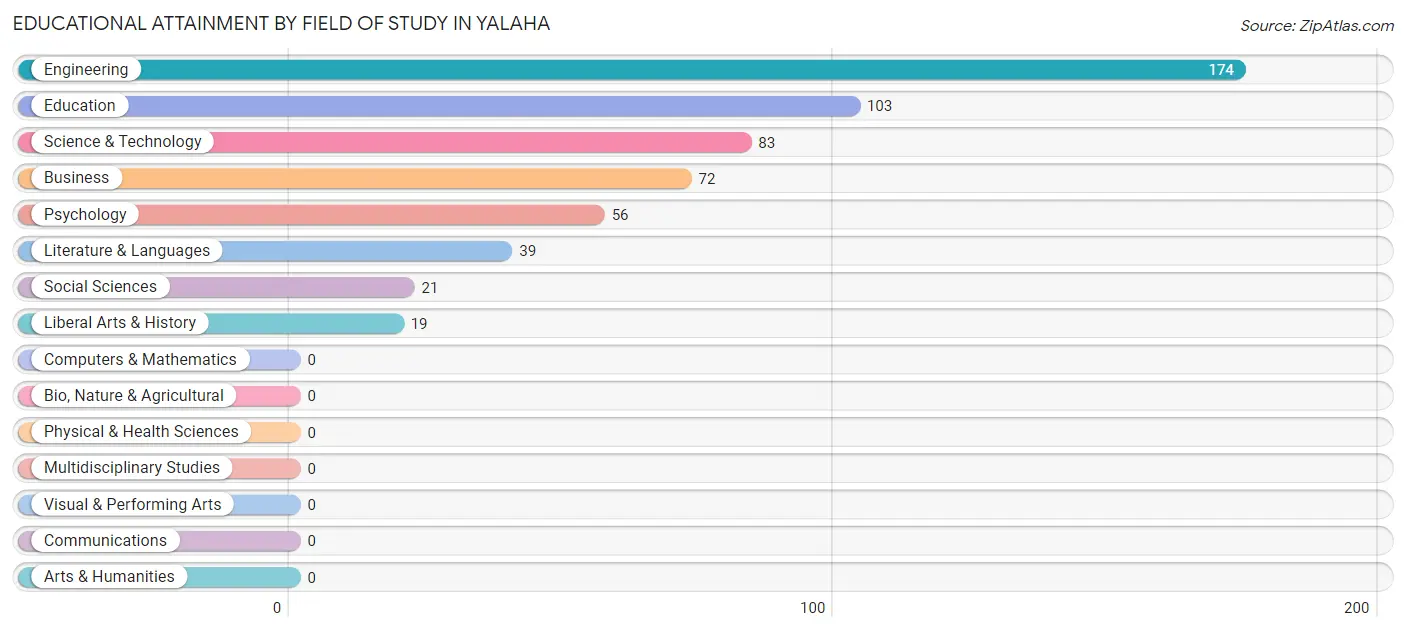
| Field of Study | # Graduates | % Graduates |
| Computers & Mathematics | 0 | 0.0% |
| Bio, Nature & Agricultural | 0 | 0.0% |
| Physical & Health Sciences | 0 | 0.0% |
| Psychology | 56 | 9.9% |
| Social Sciences | 21 | 3.7% |
| Engineering | 174 | 30.7% |
| Multidisciplinary Studies | 0 | 0.0% |
| Science & Technology | 83 | 14.6% |
| Business | 72 | 12.7% |
| Education | 103 | 18.2% |
| Literature & Languages | 39 | 6.9% |
| Liberal Arts & History | 19 | 3.4% |
| Visual & Performing Arts | 0 | 0.0% |
| Communications | 0 | 0.0% |
| Arts & Humanities | 0 | 0.0% |
| Total | 567 | 100.0% |
Transportation & Commute in Yalaha
Vehicle Availability by Sex in Yalaha
The most prevalent vehicle ownership categories in Yalaha are males with 2 vehicles (145, accounting for 68.4%) and females with 2 vehicles (95, making up 65.3%).
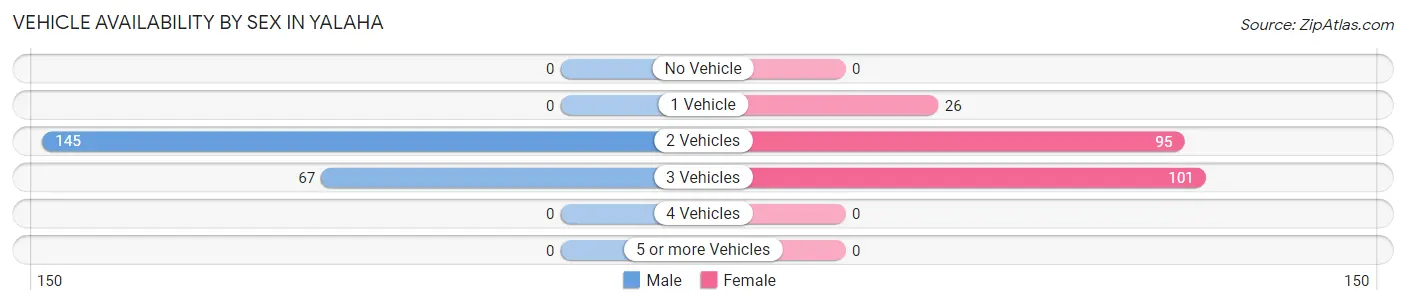
| Vehicles Available | Male | Female |
| No Vehicle | 0 (0.0%) | 0 (0.0%) |
| 1 Vehicle | 0 (0.0%) | 26 (11.7%) |
| 2 Vehicles | 145 (68.4%) | 95 (42.8%) |
| 3 Vehicles | 67 (31.6%) | 101 (45.5%) |
| 4 Vehicles | 0 (0.0%) | 0 (0.0%) |
| 5 or more Vehicles | 0 (0.0%) | 0 (0.0%) |
| Total | 212 (100.0%) | 222 (100.0%) |
Commute Time in Yalaha
The most frequently occuring commute durations in Yalaha are 60 to 89 minutes (86 commuters, 23.1%), 15 to 19 minutes (74 commuters, 19.8%), and 30 to 34 minutes (73 commuters, 19.6%).
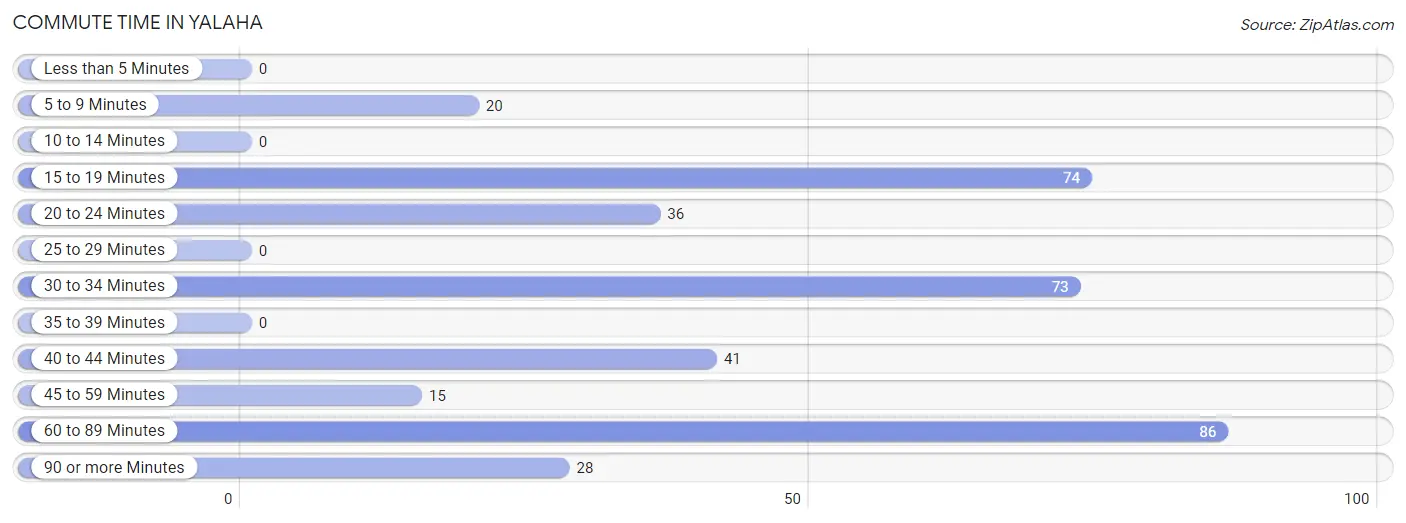
| Commute Time | # Commuters | % Commuters |
| Less than 5 Minutes | 0 | 0.0% |
| 5 to 9 Minutes | 20 | 5.4% |
| 10 to 14 Minutes | 0 | 0.0% |
| 15 to 19 Minutes | 74 | 19.8% |
| 20 to 24 Minutes | 36 | 9.7% |
| 25 to 29 Minutes | 0 | 0.0% |
| 30 to 34 Minutes | 73 | 19.6% |
| 35 to 39 Minutes | 0 | 0.0% |
| 40 to 44 Minutes | 41 | 11.0% |
| 45 to 59 Minutes | 15 | 4.0% |
| 60 to 89 Minutes | 86 | 23.1% |
| 90 or more Minutes | 28 | 7.5% |
Commute Time by Sex in Yalaha
The most common commute times in Yalaha are 30 to 34 minutes (57 commuters, 27.8%) for males and 15 to 19 minutes (49 commuters, 29.2%) for females.
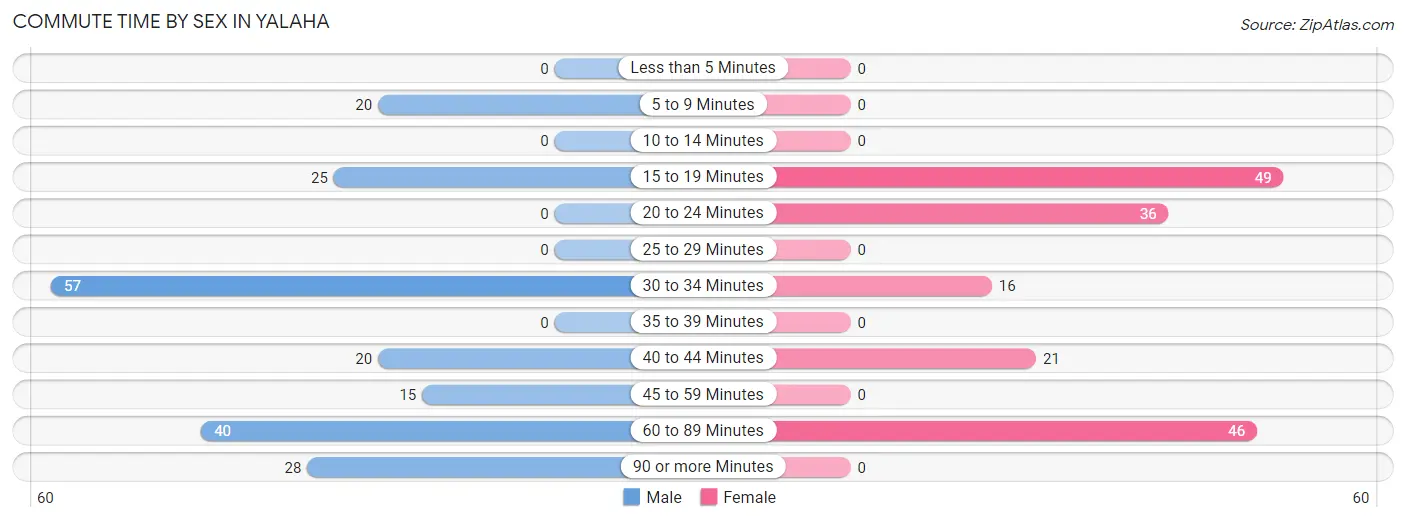
| Commute Time | Male | Female |
| Less than 5 Minutes | 0 (0.0%) | 0 (0.0%) |
| 5 to 9 Minutes | 20 (9.8%) | 0 (0.0%) |
| 10 to 14 Minutes | 0 (0.0%) | 0 (0.0%) |
| 15 to 19 Minutes | 25 (12.2%) | 49 (29.2%) |
| 20 to 24 Minutes | 0 (0.0%) | 36 (21.4%) |
| 25 to 29 Minutes | 0 (0.0%) | 0 (0.0%) |
| 30 to 34 Minutes | 57 (27.8%) | 16 (9.5%) |
| 35 to 39 Minutes | 0 (0.0%) | 0 (0.0%) |
| 40 to 44 Minutes | 20 (9.8%) | 21 (12.5%) |
| 45 to 59 Minutes | 15 (7.3%) | 0 (0.0%) |
| 60 to 89 Minutes | 40 (19.5%) | 46 (27.4%) |
| 90 or more Minutes | 28 (13.7%) | 0 (0.0%) |
Time of Departure to Work by Sex in Yalaha
The most frequent times of departure to work in Yalaha are 7:00 AM to 7:29 AM (57, 27.8%) for males and 7:30 AM to 7:59 AM (69, 41.1%) for females.
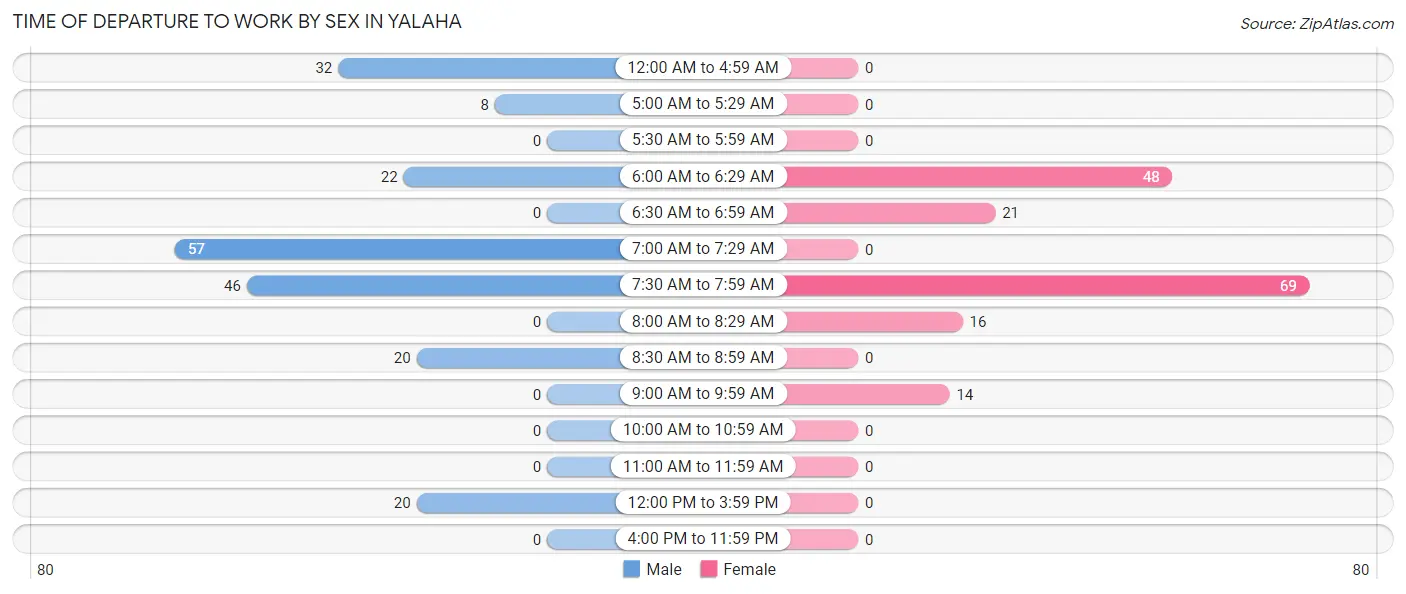
| Time of Departure | Male | Female |
| 12:00 AM to 4:59 AM | 32 (15.6%) | 0 (0.0%) |
| 5:00 AM to 5:29 AM | 8 (3.9%) | 0 (0.0%) |
| 5:30 AM to 5:59 AM | 0 (0.0%) | 0 (0.0%) |
| 6:00 AM to 6:29 AM | 22 (10.7%) | 48 (28.6%) |
| 6:30 AM to 6:59 AM | 0 (0.0%) | 21 (12.5%) |
| 7:00 AM to 7:29 AM | 57 (27.8%) | 0 (0.0%) |
| 7:30 AM to 7:59 AM | 46 (22.4%) | 69 (41.1%) |
| 8:00 AM to 8:29 AM | 0 (0.0%) | 16 (9.5%) |
| 8:30 AM to 8:59 AM | 20 (9.8%) | 0 (0.0%) |
| 9:00 AM to 9:59 AM | 0 (0.0%) | 14 (8.3%) |
| 10:00 AM to 10:59 AM | 0 (0.0%) | 0 (0.0%) |
| 11:00 AM to 11:59 AM | 0 (0.0%) | 0 (0.0%) |
| 12:00 PM to 3:59 PM | 20 (9.8%) | 0 (0.0%) |
| 4:00 PM to 11:59 PM | 0 (0.0%) | 0 (0.0%) |
| Total | 205 (100.0%) | 168 (100.0%) |
Housing Occupancy in Yalaha
Occupancy by Ownership in Yalaha
Of the total 668 dwellings in Yalaha, owner-occupied units account for 668 (100.0%), while renter-occupied units make up 0 (0.0%).
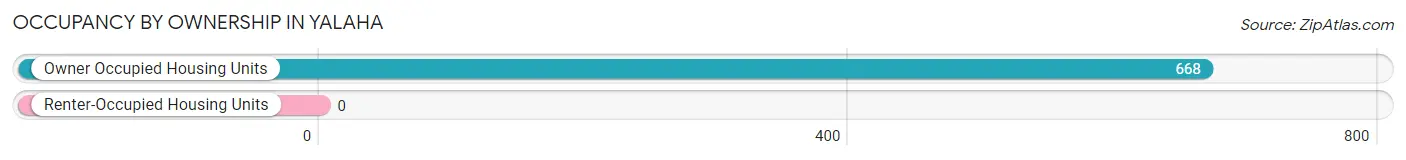
| Occupancy | # Housing Units | % Housing Units |
| Owner Occupied Housing Units | 668 | 100.0% |
| Renter-Occupied Housing Units | 0 | 0.0% |
| Total Occupied Housing Units | 668 | 100.0% |
Occupancy by Household Size in Yalaha
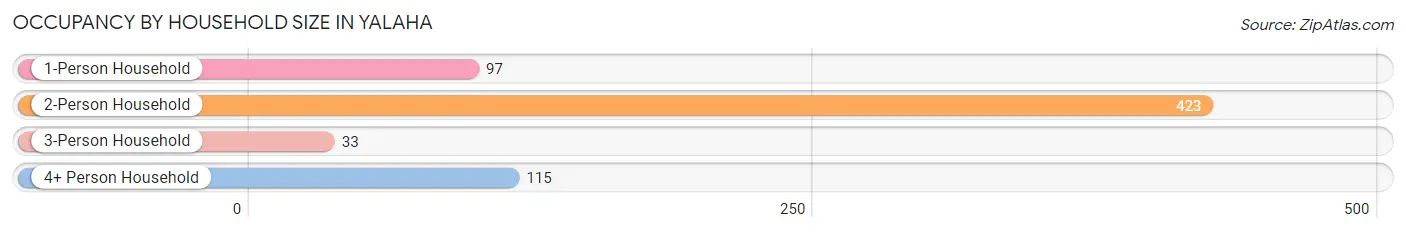
| Household Size | # Housing Units | % Housing Units |
| 1-Person Household | 97 | 14.5% |
| 2-Person Household | 423 | 63.3% |
| 3-Person Household | 33 | 4.9% |
| 4+ Person Household | 115 | 17.2% |
| Total Housing Units | 668 | 100.0% |
Occupancy by Ownership by Household Size in Yalaha
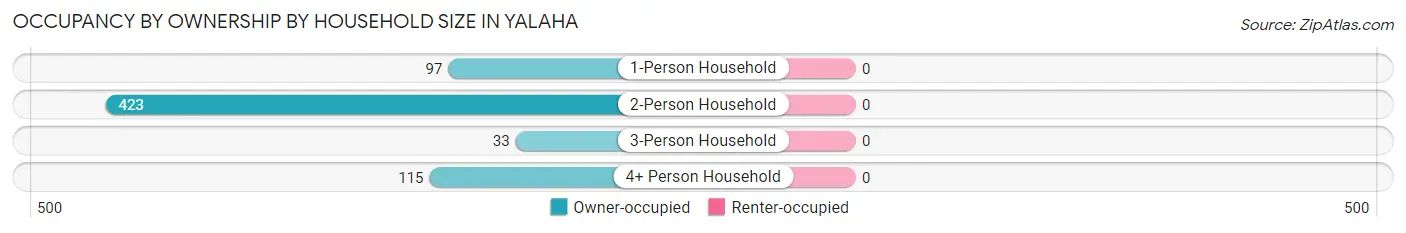
| Household Size | Owner-occupied | Renter-occupied |
| 1-Person Household | 97 (100.0%) | 0 (0.0%) |
| 2-Person Household | 423 (100.0%) | 0 (0.0%) |
| 3-Person Household | 33 (100.0%) | 0 (0.0%) |
| 4+ Person Household | 115 (100.0%) | 0 (0.0%) |
| Total Housing Units | 668 (100.0%) | 0 (0.0%) |
Occupancy by Educational Attainment in Yalaha
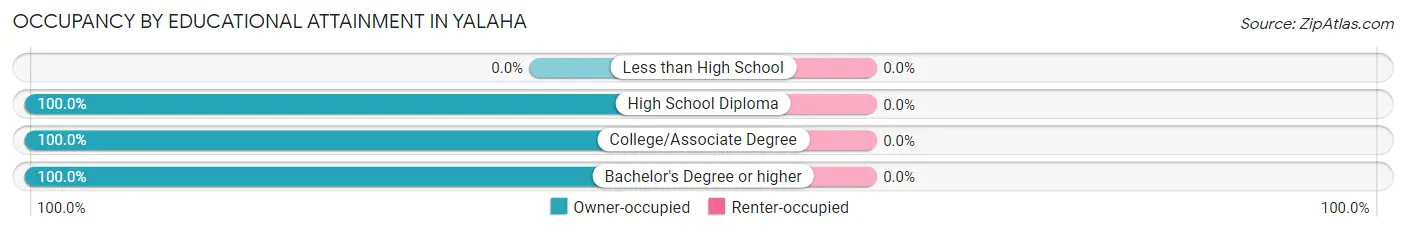
| Household Size | Owner-occupied | Renter-occupied |
| Less than High School | 0 (0.0%) | 0 (0.0%) |
| High School Diploma | 93 (100.0%) | 0 (0.0%) |
| College/Associate Degree | 203 (100.0%) | 0 (0.0%) |
| Bachelor's Degree or higher | 372 (100.0%) | 0 (0.0%) |
Occupancy by Age of Householder in Yalaha
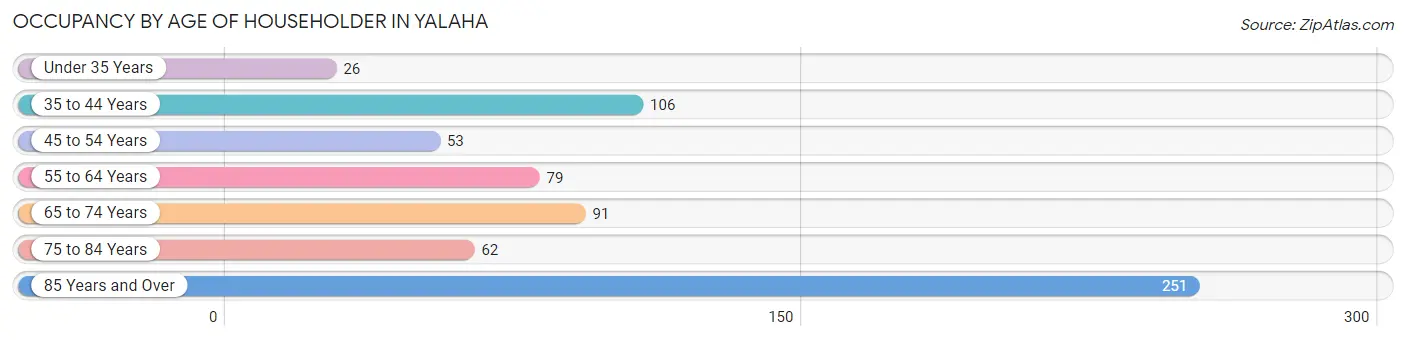
| Age Bracket | # Households | % Households |
| Under 35 Years | 26 | 3.9% |
| 35 to 44 Years | 106 | 15.9% |
| 45 to 54 Years | 53 | 7.9% |
| 55 to 64 Years | 79 | 11.8% |
| 65 to 74 Years | 91 | 13.6% |
| 75 to 84 Years | 62 | 9.3% |
| 85 Years and Over | 251 | 37.6% |
| Total | 668 | 100.0% |
Housing Finances in Yalaha
Median Income by Occupancy in Yalaha
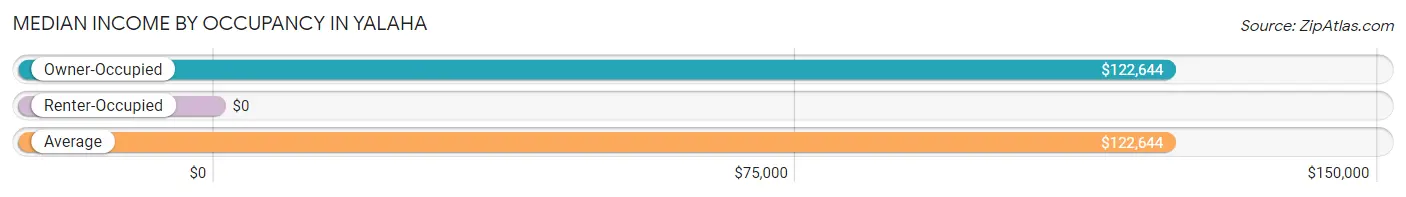
| Occupancy Type | # Households | Median Income |
| Owner-Occupied | 668 (100.0%) | $122,644 |
| Renter-Occupied | 0 (0.0%) | $0 |
| Average | 668 (100.0%) | $122,644 |
Occupancy by Householder Income Bracket in Yalaha
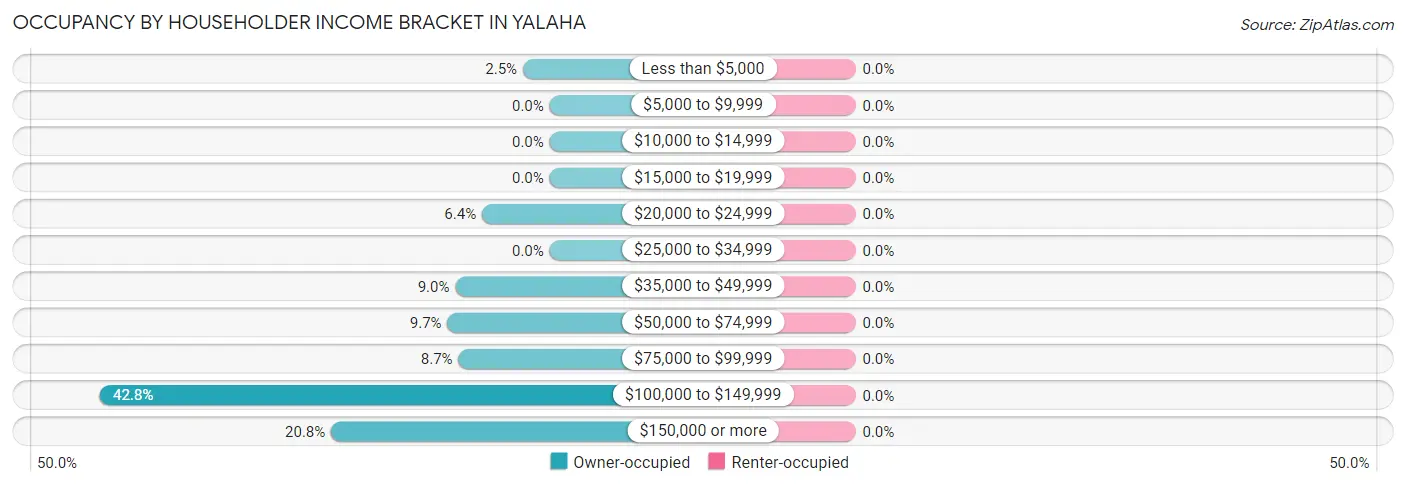
| Income Bracket | Owner-occupied | Renter-occupied |
| Less than $5,000 | 17 (2.5%) | 0 (0.0%) |
| $5,000 to $9,999 | 0 (0.0%) | 0 (0.0%) |
| $10,000 to $14,999 | 0 (0.0%) | 0 (0.0%) |
| $15,000 to $19,999 | 0 (0.0%) | 0 (0.0%) |
| $20,000 to $24,999 | 43 (6.4%) | 0 (0.0%) |
| $25,000 to $34,999 | 0 (0.0%) | 0 (0.0%) |
| $35,000 to $49,999 | 60 (9.0%) | 0 (0.0%) |
| $50,000 to $74,999 | 65 (9.7%) | 0 (0.0%) |
| $75,000 to $99,999 | 58 (8.7%) | 0 (0.0%) |
| $100,000 to $149,999 | 286 (42.8%) | 0 (0.0%) |
| $150,000 or more | 139 (20.8%) | 0 (0.0%) |
| Total | 668 (100.0%) | 0 (0.0%) |
Monthly Housing Cost Tiers in Yalaha
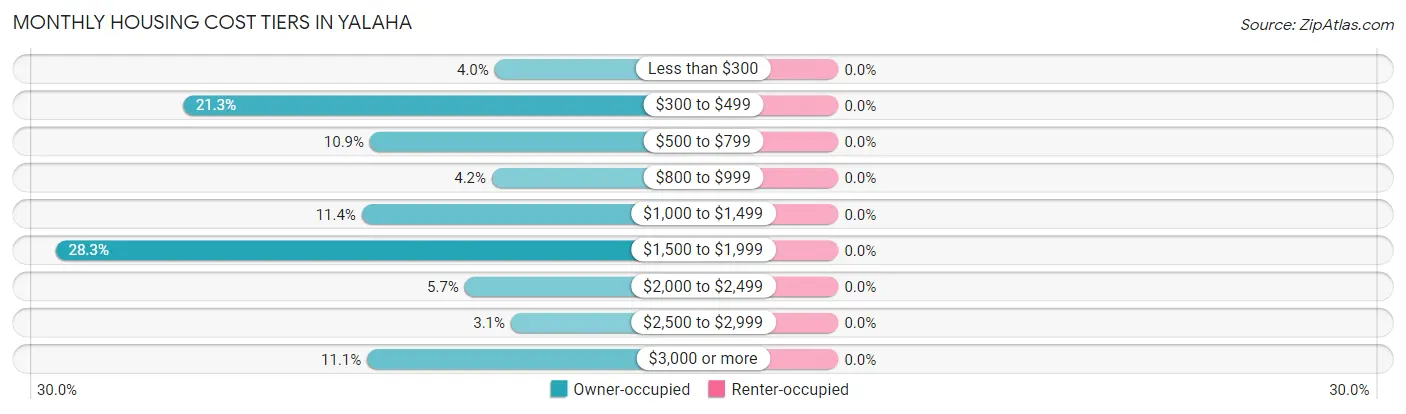
| Monthly Cost | Owner-occupied | Renter-occupied |
| Less than $300 | 27 (4.0%) | 0 (0.0%) |
| $300 to $499 | 142 (21.3%) | 0 (0.0%) |
| $500 to $799 | 73 (10.9%) | 0 (0.0%) |
| $800 to $999 | 28 (4.2%) | 0 (0.0%) |
| $1,000 to $1,499 | 76 (11.4%) | 0 (0.0%) |
| $1,500 to $1,999 | 189 (28.3%) | 0 (0.0%) |
| $2,000 to $2,499 | 38 (5.7%) | 0 (0.0%) |
| $2,500 to $2,999 | 21 (3.1%) | 0 (0.0%) |
| $3,000 or more | 74 (11.1%) | 0 (0.0%) |
| Total | 668 (100.0%) | 0 (0.0%) |
Physical Housing Characteristics in Yalaha
Housing Structures in Yalaha
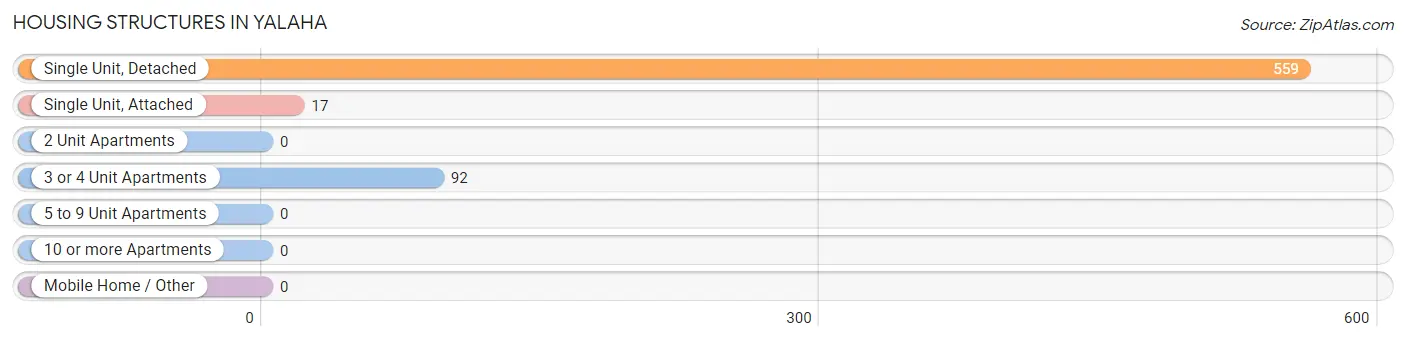
| Structure Type | # Housing Units | % Housing Units |
| Single Unit, Detached | 559 | 83.7% |
| Single Unit, Attached | 17 | 2.5% |
| 2 Unit Apartments | 0 | 0.0% |
| 3 or 4 Unit Apartments | 92 | 13.8% |
| 5 to 9 Unit Apartments | 0 | 0.0% |
| 10 or more Apartments | 0 | 0.0% |
| Mobile Home / Other | 0 | 0.0% |
| Total | 668 | 100.0% |
Housing Structures by Occupancy in Yalaha
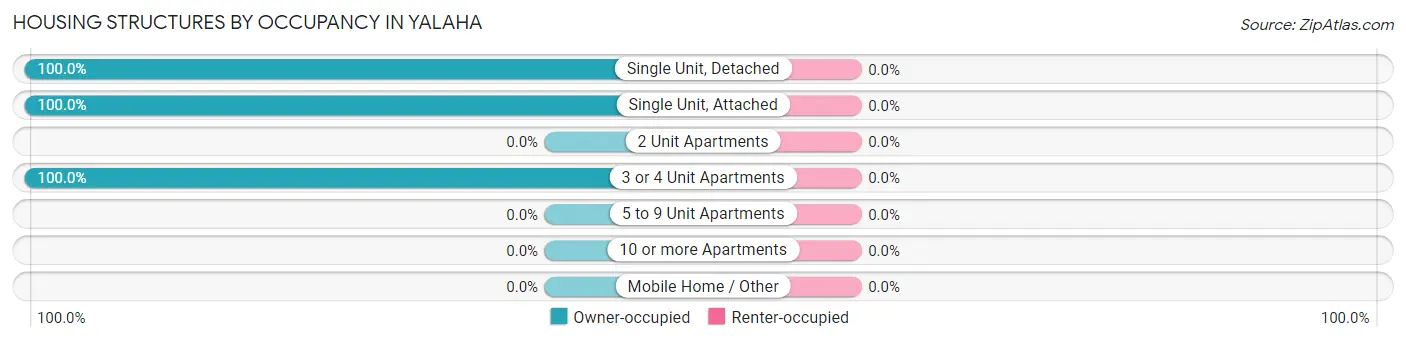
| Structure Type | Owner-occupied | Renter-occupied |
| Single Unit, Detached | 559 (100.0%) | 0 (0.0%) |
| Single Unit, Attached | 17 (100.0%) | 0 (0.0%) |
| 2 Unit Apartments | 0 (0.0%) | 0 (0.0%) |
| 3 or 4 Unit Apartments | 92 (100.0%) | 0 (0.0%) |
| 5 to 9 Unit Apartments | 0 (0.0%) | 0 (0.0%) |
| 10 or more Apartments | 0 (0.0%) | 0 (0.0%) |
| Mobile Home / Other | 0 (0.0%) | 0 (0.0%) |
| Total | 668 (100.0%) | 0 (0.0%) |
Housing Structures by Number of Rooms in Yalaha
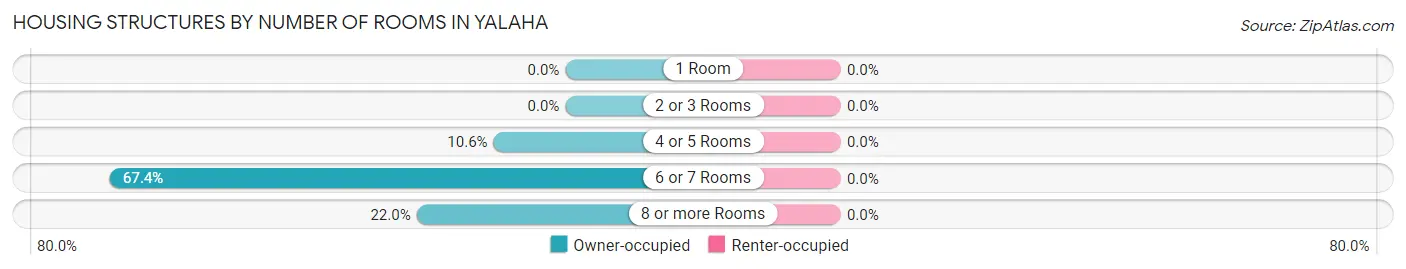
| Number of Rooms | Owner-occupied | Renter-occupied |
| 1 Room | 0 (0.0%) | 0 (0.0%) |
| 2 or 3 Rooms | 0 (0.0%) | 0 (0.0%) |
| 4 or 5 Rooms | 71 (10.6%) | 0 (0.0%) |
| 6 or 7 Rooms | 450 (67.4%) | 0 (0.0%) |
| 8 or more Rooms | 147 (22.0%) | 0 (0.0%) |
| Total | 668 (100.0%) | 0 (0.0%) |
Housing Structure by Heating Type in Yalaha
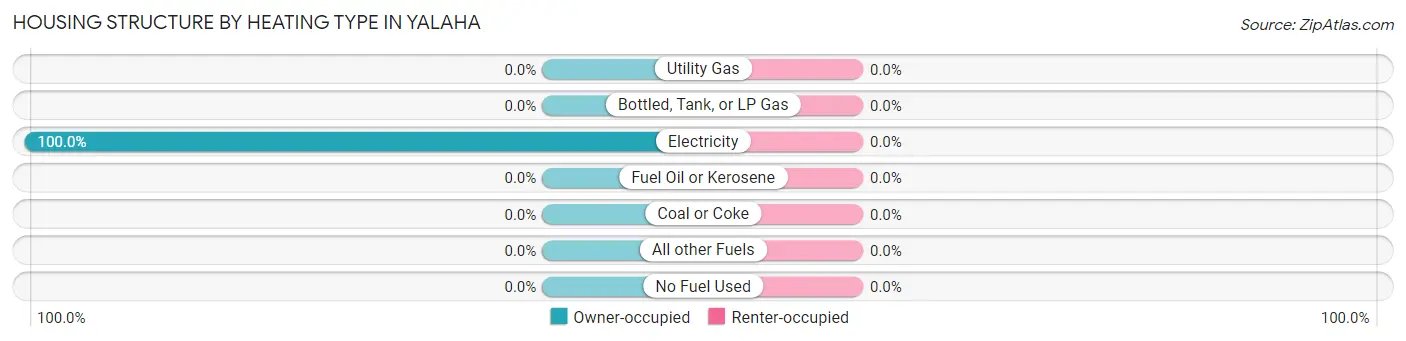
| Heating Type | Owner-occupied | Renter-occupied |
| Utility Gas | 0 (0.0%) | 0 (0.0%) |
| Bottled, Tank, or LP Gas | 0 (0.0%) | 0 (0.0%) |
| Electricity | 668 (100.0%) | 0 (0.0%) |
| Fuel Oil or Kerosene | 0 (0.0%) | 0 (0.0%) |
| Coal or Coke | 0 (0.0%) | 0 (0.0%) |
| All other Fuels | 0 (0.0%) | 0 (0.0%) |
| No Fuel Used | 0 (0.0%) | 0 (0.0%) |
| Total | 668 (100.0%) | 0 (0.0%) |
Household Vehicle Usage in Yalaha
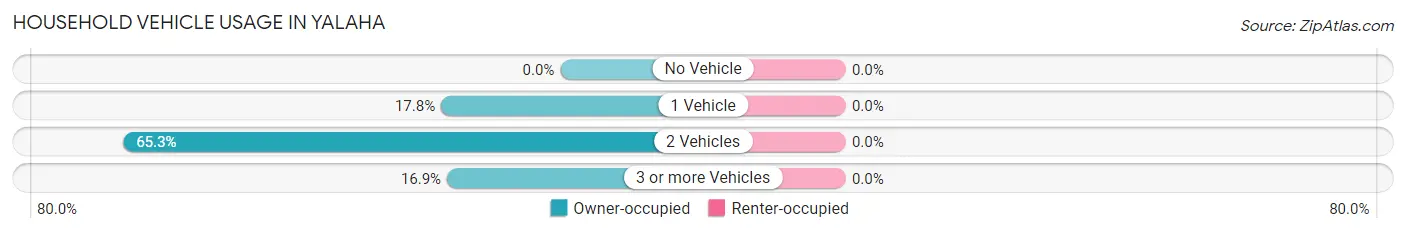
| Vehicles per Household | Owner-occupied | Renter-occupied |
| No Vehicle | 0 (0.0%) | 0 (0.0%) |
| 1 Vehicle | 119 (17.8%) | 0 (0.0%) |
| 2 Vehicles | 436 (65.3%) | 0 (0.0%) |
| 3 or more Vehicles | 113 (16.9%) | 0 (0.0%) |
| Total | 668 (100.0%) | 0 (0.0%) |
Real Estate & Mortgages in Yalaha
Real Estate and Mortgage Overview in Yalaha
| Characteristic | Without Mortgage | With Mortgage |
| Housing Units | 242 | 426 |
| Median Property Value | $278,800 | $564,500 |
| Median Household Income | $51,038 | $106 |
| Monthly Housing Costs | $462 | $74 |
| Real Estate Taxes | $1,473 | $0 |
Property Value by Mortgage Status in Yalaha
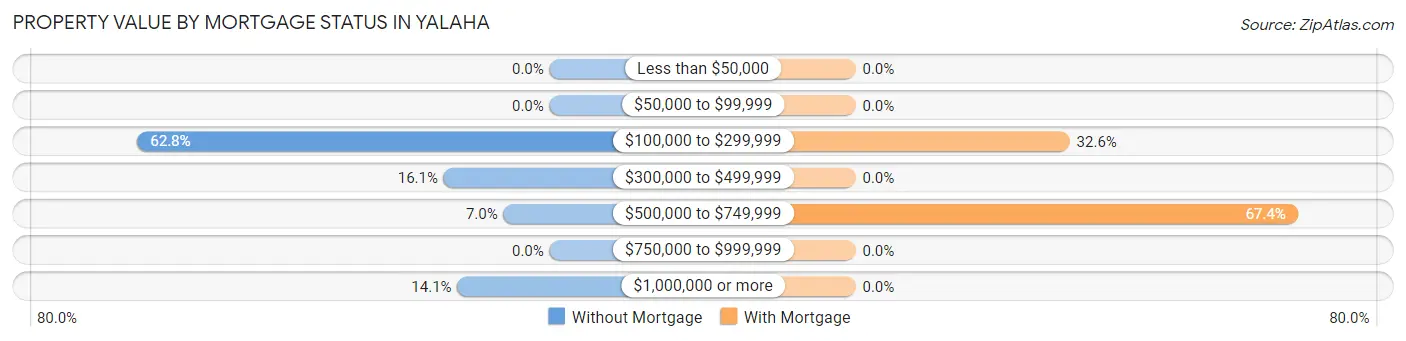
| Property Value | Without Mortgage | With Mortgage |
| Less than $50,000 | 0 (0.0%) | 0 (0.0%) |
| $50,000 to $99,999 | 0 (0.0%) | 0 (0.0%) |
| $100,000 to $299,999 | 152 (62.8%) | 139 (32.6%) |
| $300,000 to $499,999 | 39 (16.1%) | 0 (0.0%) |
| $500,000 to $749,999 | 17 (7.0%) | 287 (67.4%) |
| $750,000 to $999,999 | 0 (0.0%) | 0 (0.0%) |
| $1,000,000 or more | 34 (14.1%) | 0 (0.0%) |
| Total | 242 (100.0%) | 426 (100.0%) |
Household Income by Mortgage Status in Yalaha
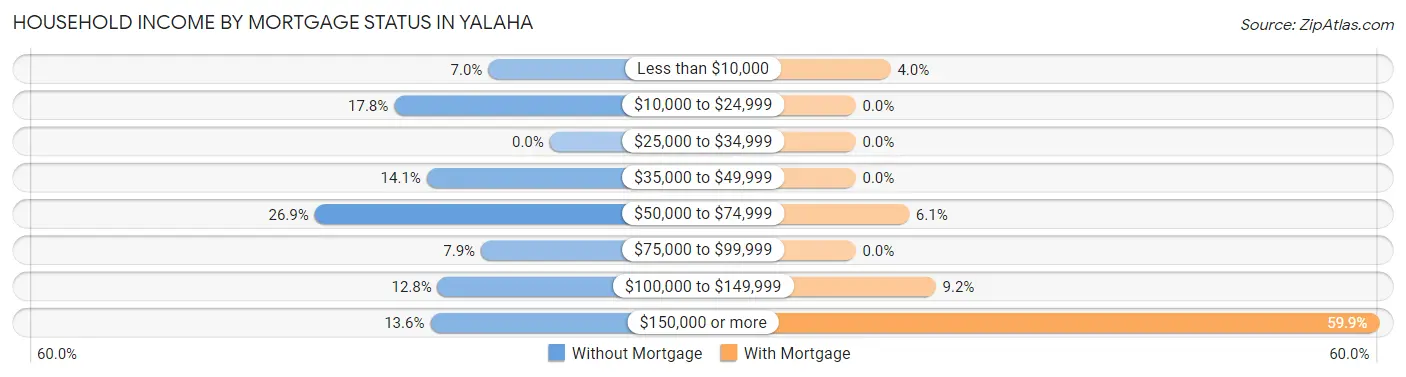
| Household Income | Without Mortgage | With Mortgage |
| Less than $10,000 | 17 (7.0%) | 17 (4.0%) |
| $10,000 to $24,999 | 43 (17.8%) | 0 (0.0%) |
| $25,000 to $34,999 | 0 (0.0%) | 0 (0.0%) |
| $35,000 to $49,999 | 34 (14.1%) | 0 (0.0%) |
| $50,000 to $74,999 | 65 (26.9%) | 26 (6.1%) |
| $75,000 to $99,999 | 19 (7.9%) | 0 (0.0%) |
| $100,000 to $149,999 | 31 (12.8%) | 39 (9.1%) |
| $150,000 or more | 33 (13.6%) | 255 (59.9%) |
| Total | 242 (100.0%) | 426 (100.0%) |
Property Value to Household Income Ratio in Yalaha
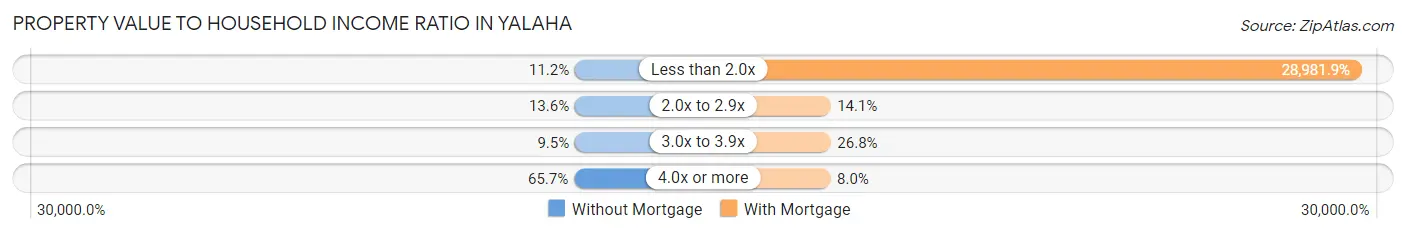
| Value-to-Income Ratio | Without Mortgage | With Mortgage |
| Less than 2.0x | 27 (11.2%) | 123,463 (28,981.9%) |
| 2.0x to 2.9x | 33 (13.6%) | 60 (14.1%) |
| 3.0x to 3.9x | 23 (9.5%) | 114 (26.8%) |
| 4.0x or more | 159 (65.7%) | 34 (8.0%) |
| Total | 242 (100.0%) | 426 (100.0%) |
Real Estate Taxes by Mortgage Status in Yalaha
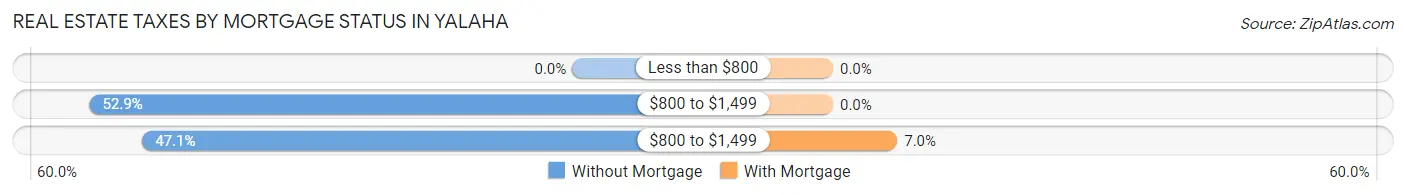
| Property Taxes | Without Mortgage | With Mortgage |
| Less than $800 | 0 (0.0%) | 0 (0.0%) |
| $800 to $1,499 | 128 (52.9%) | 0 (0.0%) |
| $800 to $1,499 | 114 (47.1%) | 30 (7.0%) |
| Total | 242 (100.0%) | 426 (100.0%) |
Health & Disability in Yalaha
Health Insurance Coverage by Age in Yalaha

| Age Bracket | With Coverage | Without Coverage |
| Under 6 Years | 22 (100.0%) | 0 (0.0%) |
| 6 to 18 Years | 143 (100.0%) | 0 (0.0%) |
| 19 to 25 Years | 0 (0.0%) | 0 (0.0%) |
| 26 to 34 Years | 29 (100.0%) | 0 (0.0%) |
| 35 to 44 Years | 198 (96.1%) | 8 (3.9%) |
| 45 to 54 Years | 41 (41.4%) | 58 (58.6%) |
| 55 to 64 Years | 176 (100.0%) | 0 (0.0%) |
| 65 to 74 Years | 210 (100.0%) | 0 (0.0%) |
| 75 Years and older | 519 (100.0%) | 0 (0.0%) |
| Total | 1,338 (95.3%) | 66 (4.7%) |
Health Insurance Coverage by Citizenship Status in Yalaha
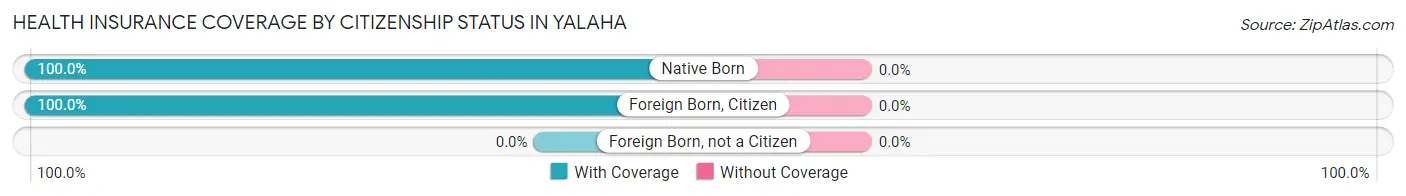
| Citizenship Status | With Coverage | Without Coverage |
| Native Born | 22 (100.0%) | 0 (0.0%) |
| Foreign Born, Citizen | 143 (100.0%) | 0 (0.0%) |
| Foreign Born, not a Citizen | 0 (0.0%) | 0 (0.0%) |
Health Insurance Coverage by Household Income in Yalaha
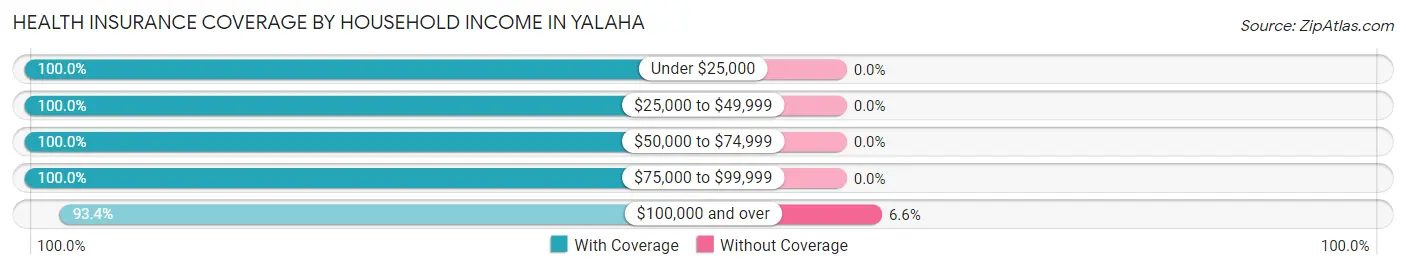
| Household Income | With Coverage | Without Coverage |
| Under $25,000 | 60 (100.0%) | 0 (0.0%) |
| $25,000 to $49,999 | 94 (100.0%) | 0 (0.0%) |
| $50,000 to $74,999 | 129 (100.0%) | 0 (0.0%) |
| $75,000 to $99,999 | 119 (100.0%) | 0 (0.0%) |
| $100,000 and over | 936 (93.4%) | 66 (6.6%) |
Public vs Private Health Insurance Coverage by Age in Yalaha
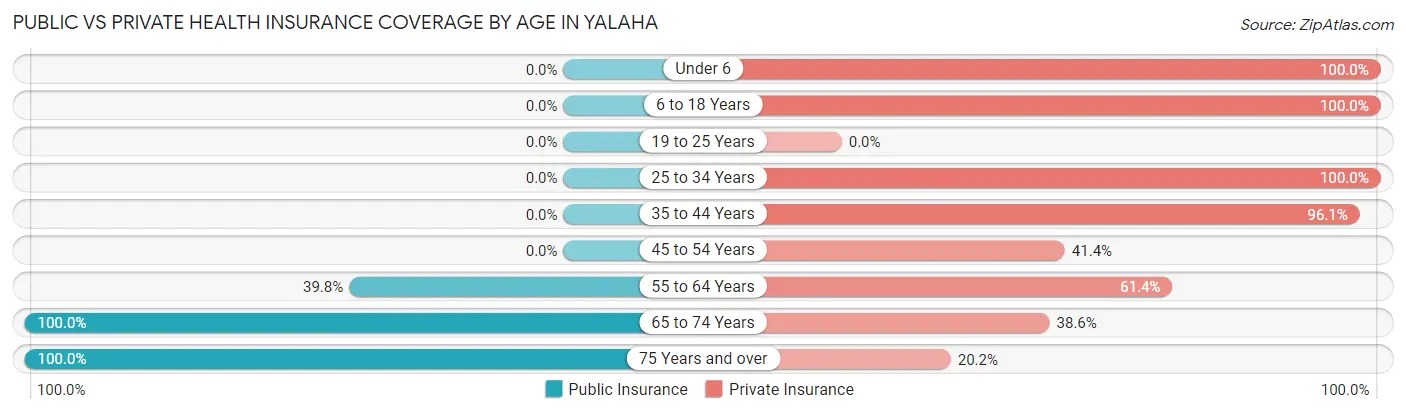
| Age Bracket | Public Insurance | Private Insurance |
| Under 6 | 0 (0.0%) | 22 (100.0%) |
| 6 to 18 Years | 0 (0.0%) | 143 (100.0%) |
| 19 to 25 Years | 0 (0.0%) | 0 (0.0%) |
| 25 to 34 Years | 0 (0.0%) | 29 (100.0%) |
| 35 to 44 Years | 0 (0.0%) | 198 (96.1%) |
| 45 to 54 Years | 0 (0.0%) | 41 (41.4%) |
| 55 to 64 Years | 70 (39.8%) | 108 (61.4%) |
| 65 to 74 Years | 210 (100.0%) | 81 (38.6%) |
| 75 Years and over | 519 (100.0%) | 105 (20.2%) |
| Total | 799 (56.9%) | 727 (51.8%) |
Disability Status by Sex by Age in Yalaha
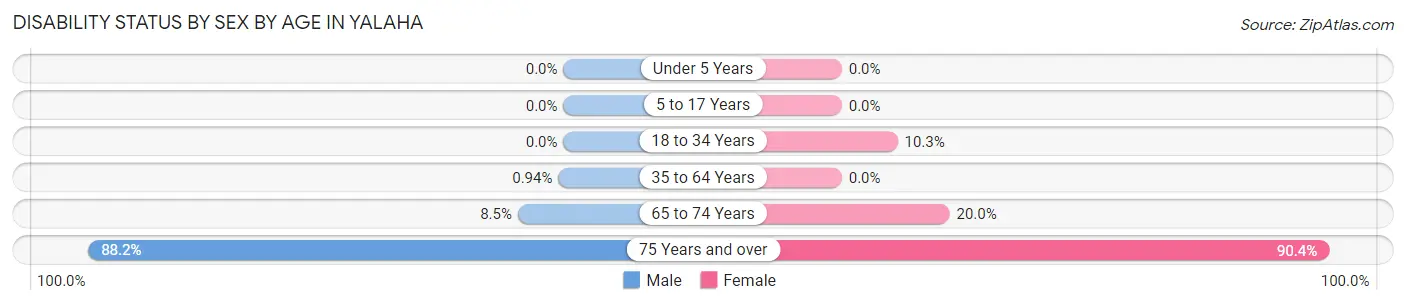
| Age Bracket | Male | Female |
| Under 5 Years | 0 (0.0%) | 0 (0.0%) |
| 5 to 17 Years | 0 (0.0%) | 0 (0.0%) |
| 18 to 34 Years | 0 (0.0%) | 3 (10.3%) |
| 35 to 64 Years | 2 (0.9%) | 0 (0.0%) |
| 65 to 74 Years | 11 (8.5%) | 16 (20.0%) |
| 75 Years and over | 209 (88.2%) | 255 (90.4%) |
Disability Class by Sex by Age in Yalaha
Disability Class: Hearing Difficulty
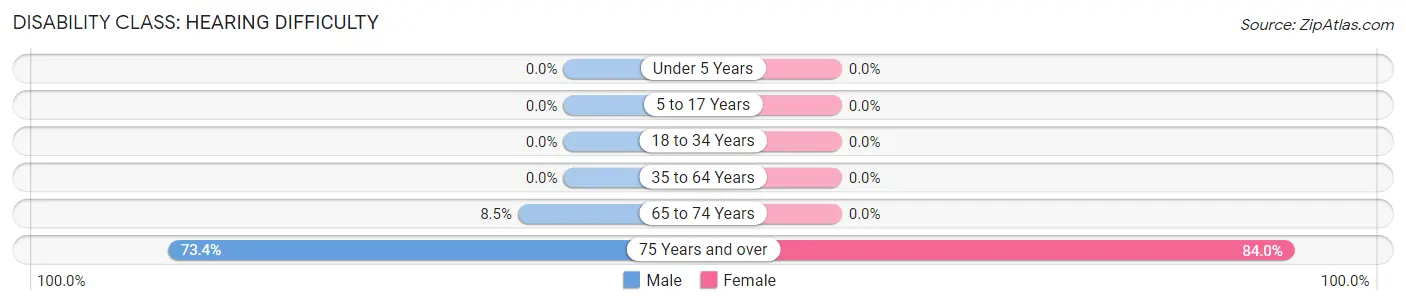
| Age Bracket | Male | Female |
| Under 5 Years | 0 (0.0%) | 0 (0.0%) |
| 5 to 17 Years | 0 (0.0%) | 0 (0.0%) |
| 18 to 34 Years | 0 (0.0%) | 0 (0.0%) |
| 35 to 64 Years | 0 (0.0%) | 0 (0.0%) |
| 65 to 74 Years | 11 (8.5%) | 0 (0.0%) |
| 75 Years and over | 174 (73.4%) | 237 (84.0%) |
Disability Class: Vision Difficulty
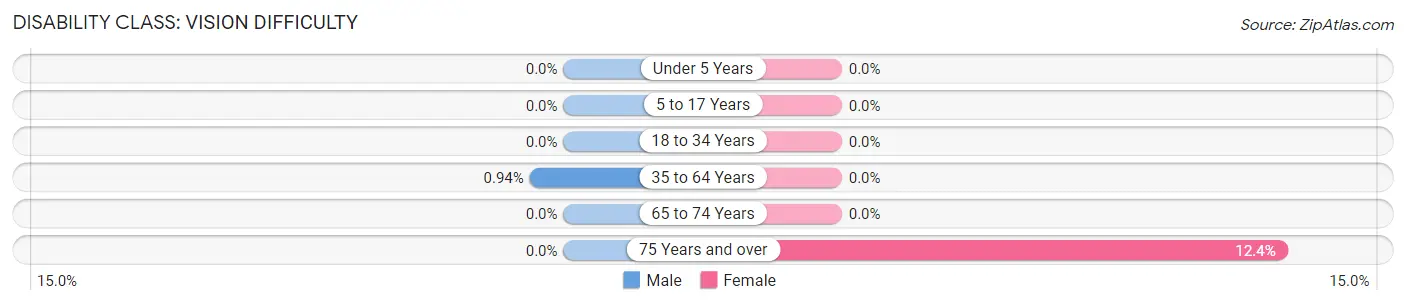
| Age Bracket | Male | Female |
| Under 5 Years | 0 (0.0%) | 0 (0.0%) |
| 5 to 17 Years | 0 (0.0%) | 0 (0.0%) |
| 18 to 34 Years | 0 (0.0%) | 0 (0.0%) |
| 35 to 64 Years | 2 (0.9%) | 0 (0.0%) |
| 65 to 74 Years | 0 (0.0%) | 0 (0.0%) |
| 75 Years and over | 0 (0.0%) | 35 (12.4%) |
Disability Class: Cognitive Difficulty
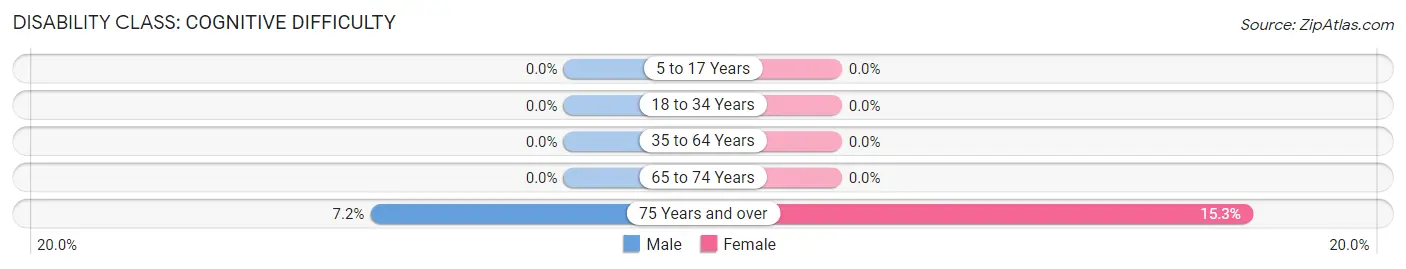
| Age Bracket | Male | Female |
| 5 to 17 Years | 0 (0.0%) | 0 (0.0%) |
| 18 to 34 Years | 0 (0.0%) | 0 (0.0%) |
| 35 to 64 Years | 0 (0.0%) | 0 (0.0%) |
| 65 to 74 Years | 0 (0.0%) | 0 (0.0%) |
| 75 Years and over | 17 (7.2%) | 43 (15.2%) |
Disability Class: Ambulatory Difficulty
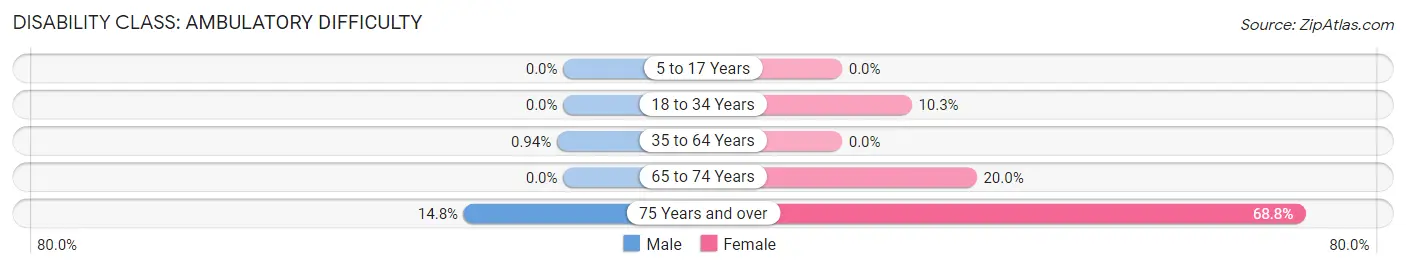
| Age Bracket | Male | Female |
| 5 to 17 Years | 0 (0.0%) | 0 (0.0%) |
| 18 to 34 Years | 0 (0.0%) | 3 (10.3%) |
| 35 to 64 Years | 2 (0.9%) | 0 (0.0%) |
| 65 to 74 Years | 0 (0.0%) | 16 (20.0%) |
| 75 Years and over | 35 (14.8%) | 194 (68.8%) |
Disability Class: Self-Care Difficulty
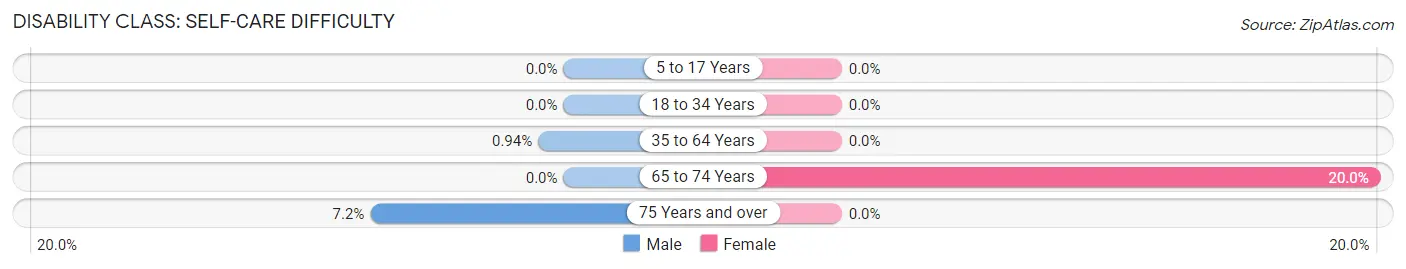
| Age Bracket | Male | Female |
| 5 to 17 Years | 0 (0.0%) | 0 (0.0%) |
| 18 to 34 Years | 0 (0.0%) | 0 (0.0%) |
| 35 to 64 Years | 2 (0.9%) | 0 (0.0%) |
| 65 to 74 Years | 0 (0.0%) | 16 (20.0%) |
| 75 Years and over | 17 (7.2%) | 0 (0.0%) |
Technology Access in Yalaha
Computing Device Access in Yalaha
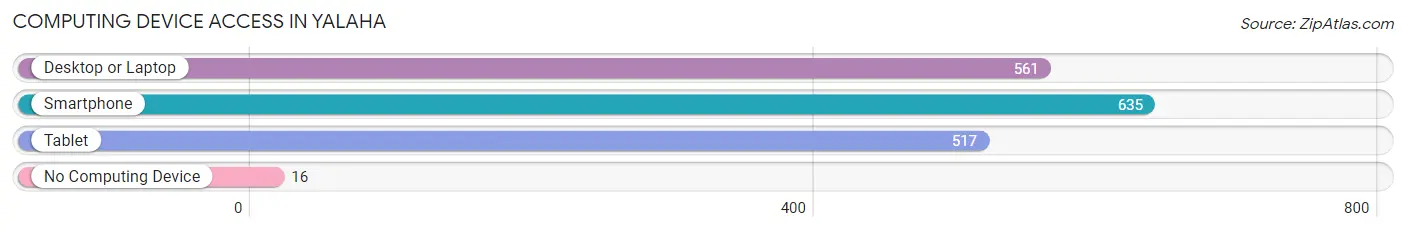
| Device Type | # Households | % Households |
| Desktop or Laptop | 561 | 84.0% |
| Smartphone | 635 | 95.1% |
| Tablet | 517 | 77.4% |
| No Computing Device | 16 | 2.4% |
| Total | 668 | 100.0% |
Internet Access in Yalaha
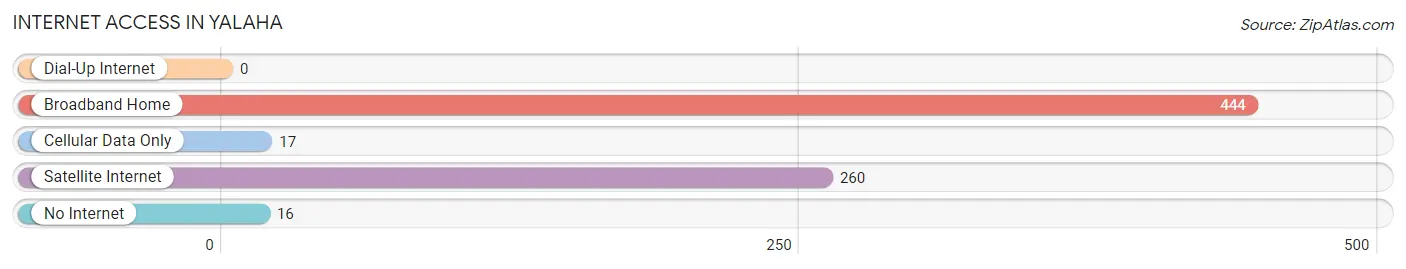
| Internet Type | # Households | % Households |
| Dial-Up Internet | 0 | 0.0% |
| Broadband Home | 444 | 66.5% |
| Cellular Data Only | 17 | 2.5% |
| Satellite Internet | 260 | 38.9% |
| No Internet | 16 | 2.4% |
| Total | 668 | 100.0% |
Yalaha Summary
Yalaha is a small unincorporated community located in Lake County, Florida, United States. It is situated on the western shore of Lake Harris, a large lake in the Harris Chain of Lakes. The community is located approximately 25 miles northwest of Orlando and is part of the Orlando–Kissimmee–Sanford Metropolitan Statistical Area.
History
The area that is now Yalaha was originally inhabited by the Seminole Indians. The first European settlers arrived in the area in the late 19th century. The community was named after the Seminole word for “home”.
In the early 20th century, Yalaha was a small farming community. The area was known for its citrus groves and vegetable farms. The community was also home to a number of small businesses, including a general store, a post office, and a blacksmith shop.
In the 1950s, the area began to experience rapid growth as more people moved to the area. The population of Yalaha increased from just over 200 in 1950 to nearly 1,000 by the end of the decade.
Geography
Yalaha is located in Lake County, Florida, approximately 25 miles northwest of Orlando. The community is situated on the western shore of Lake Harris, a large lake in the Harris Chain of Lakes. The area is characterized by rolling hills and lush vegetation.
The climate in Yalaha is subtropical, with hot, humid summers and mild winters. The average annual temperature is 73°F (23°C). The average annual precipitation is 50 inches (127 cm).
Economy
The economy of Yalaha is largely based on agriculture and tourism. The area is known for its citrus groves and vegetable farms. The community is also home to a number of small businesses, including restaurants, shops, and a marina.
Tourism is an important part of the local economy. The area is home to several popular attractions, including the Yalaha Country Bakery, the Yalaha Bootlegging Company, and the Yalaha Boat Tours.
Demographics
As of the 2010 census, the population of Yalaha was 1,845. The racial makeup of the community was 94.3% White, 1.2% African American, 0.3% Native American, 0.7% Asian, 0.1% Pacific Islander, 1.7% from other races, and 1.9% from two or more races. Hispanic or Latino of any race were 4.2% of the population.
The median household income in Yalaha was $45,938, and the median family income was $50,938. The per capita income was $20,938. About 8.3% of families and 10.2% of the population were below the poverty line, including 14.3% of those under age 18 and 5.2% of those age 65 or over.
Common Questions
What is Per Capita Income in Yalaha?
Per Capita income in Yalaha is $58,085.
What is the Median Family Income in Yalaha?
Median Family Income in Yalaha is $122,996.
What is the Median Household income in Yalaha?
Median Household Income in Yalaha is $122,644.
What is Income or Wage Gap in Yalaha?
Income or Wage Gap in Yalaha is 53.7%.
Women in Yalaha earn 46.3 cents for every dollar earned by a man.
What is Inequality or Gini Index in Yalaha?
Inequality or Gini Index in Yalaha is 0.36.
What is the Total Population of Yalaha?
Total Population of Yalaha is 1,404.
What is the Total Male Population of Yalaha?
Total Male Population of Yalaha is 693.
What is the Total Female Population of Yalaha?
Total Female Population of Yalaha is 711.
What is the Ratio of Males per 100 Females in Yalaha?
There are 97.47 Males per 100 Females in Yalaha.
What is the Ratio of Females per 100 Males in Yalaha?
There are 102.60 Females per 100 Males in Yalaha.
What is the Median Population Age in Yalaha?
Median Population Age in Yalaha is 67.5 Years.
What is the Average Family Size in Yalaha
Average Family Size in Yalaha is 2.2 People.
What is the Average Household Size in Yalaha
Average Household Size in Yalaha is 2.1 People.
How Large is the Labor Force in Yalaha?
There are 434 People in the Labor Forcein in Yalaha.
What is the Percentage of People in the Labor Force in Yalaha?
35.0% of People are in the Labor Force in Yalaha.