Silver Lake, FL Map & Demographics
Silver Lake Map
Silver Lake Overview
$35,407
PER CAPITA INCOME
$83,896
AVG FAMILY INCOME
$73,700
AVG HOUSEHOLD INCOME
41.0%
WAGE / INCOME GAP [ % ]
59.0¢/ $1
WAGE / INCOME GAP [ $ ]
0.42
INEQUALITY / GINI INDEX
2,524
TOTAL POPULATION
958
MALE POPULATION
1,566
FEMALE POPULATION
61.17
MALES / 100 FEMALES
163.47
FEMALES / 100 MALES
41.8
MEDIAN AGE
3.2
AVG FAMILY SIZE
2.7
AVG HOUSEHOLD SIZE
1,147
LABOR FORCE [ PEOPLE ]
56.3%
PERCENT IN LABOR FORCE
6.8%
UNEMPLOYMENT RATE
Income in Silver Lake
Income Overview in Silver Lake
Per Capita Income in Silver Lake is $35,407, while median incomes of families and households are $83,896 and $73,700 respectively.
| Characteristic | Number | Measure |
| Per Capita Income | 2,524 | $35,407 |
| Median Family Income | 686 | $83,896 |
| Mean Family Income | 686 | $104,645 |
| Median Household Income | 924 | $73,700 |
| Mean Household Income | 924 | $96,009 |
| Income Deficit | 686 | $0 |
| Wage / Income Gap (%) | 2,524 | 41.02% |
| Wage / Income Gap ($) | 2,524 | 58.98¢ per $1 |
| Gini / Inequality Index | 2,524 | 0.42 |
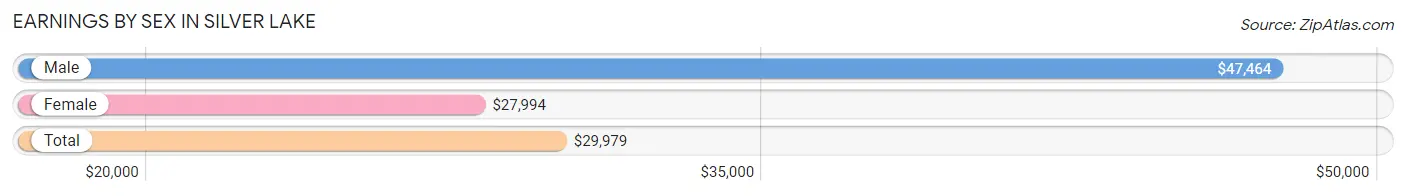
Earnings by Sex in Silver Lake
Average Earnings in Silver Lake are $29,979, $47,464 for men and $27,994 for women, a difference of 41.0%.
| Sex | Number | Average Earnings |
| Male | 491 (40.6%) | $47,464 |
| Female | 719 (59.4%) | $27,994 |
| Total | 1,210 (100.0%) | $29,979 |
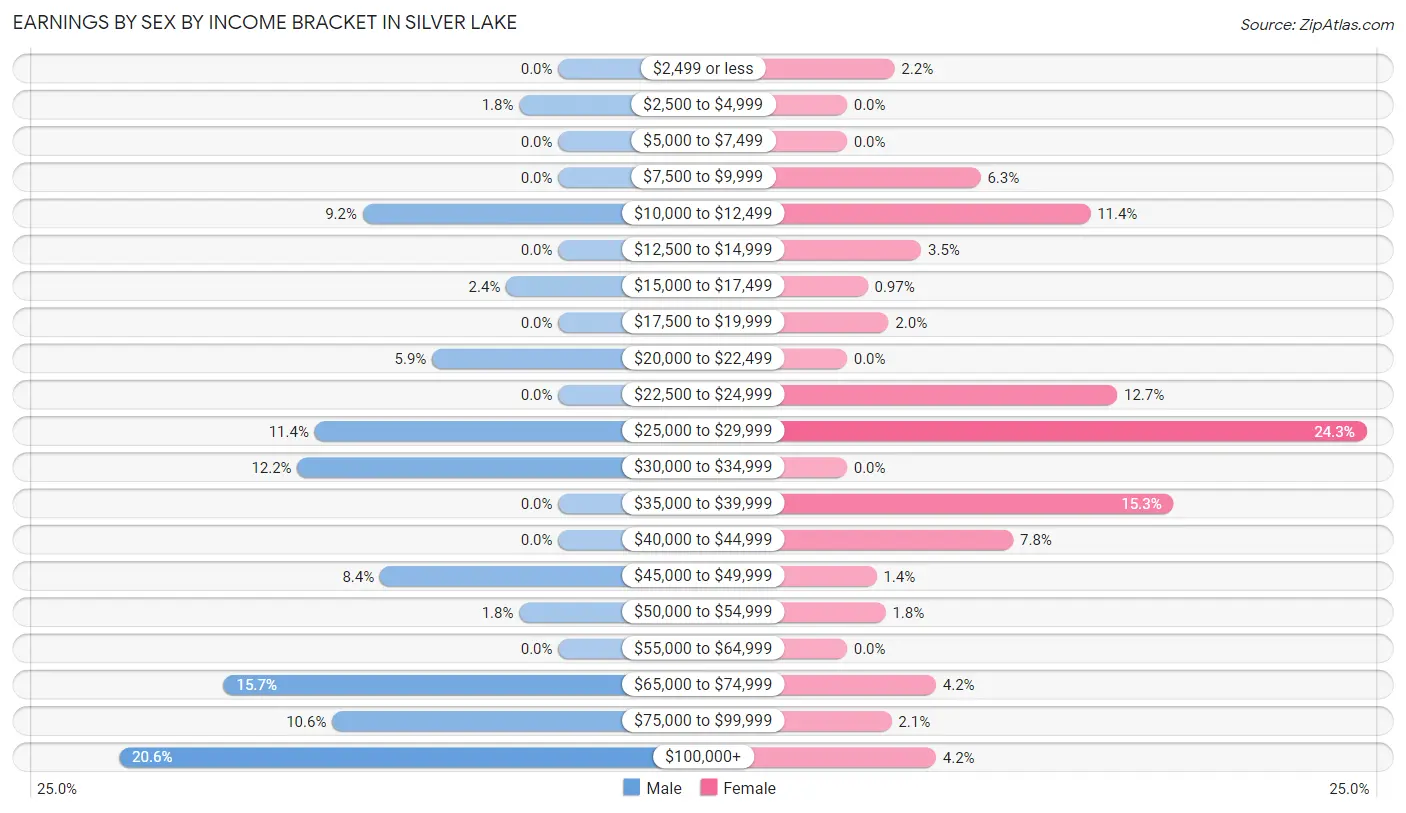
Earnings by Sex by Income Bracket in Silver Lake
The most common earnings brackets in Silver Lake are $100,000+ for men (101 | 20.6%) and $25,000 to $29,999 for women (175 | 24.3%).
| Income | Male | Female |
| $2,499 or less | 0 (0.0%) | 16 (2.2%) |
| $2,500 to $4,999 | 9 (1.8%) | 0 (0.0%) |
| $5,000 to $7,499 | 0 (0.0%) | 0 (0.0%) |
| $7,500 to $9,999 | 0 (0.0%) | 45 (6.3%) |
| $10,000 to $12,499 | 45 (9.2%) | 82 (11.4%) |
| $12,500 to $14,999 | 0 (0.0%) | 25 (3.5%) |
| $15,000 to $17,499 | 12 (2.4%) | 7 (1.0%) |
| $17,500 to $19,999 | 0 (0.0%) | 14 (1.9%) |
| $20,000 to $22,499 | 29 (5.9%) | 0 (0.0%) |
| $22,500 to $24,999 | 0 (0.0%) | 91 (12.7%) |
| $25,000 to $29,999 | 56 (11.4%) | 175 (24.3%) |
| $30,000 to $34,999 | 60 (12.2%) | 0 (0.0%) |
| $35,000 to $39,999 | 0 (0.0%) | 110 (15.3%) |
| $40,000 to $44,999 | 0 (0.0%) | 56 (7.8%) |
| $45,000 to $49,999 | 41 (8.4%) | 10 (1.4%) |
| $50,000 to $54,999 | 9 (1.8%) | 13 (1.8%) |
| $55,000 to $64,999 | 0 (0.0%) | 0 (0.0%) |
| $65,000 to $74,999 | 77 (15.7%) | 30 (4.2%) |
| $75,000 to $99,999 | 52 (10.6%) | 15 (2.1%) |
| $100,000+ | 101 (20.6%) | 30 (4.2%) |
| Total | 491 (100.0%) | 719 (100.0%) |
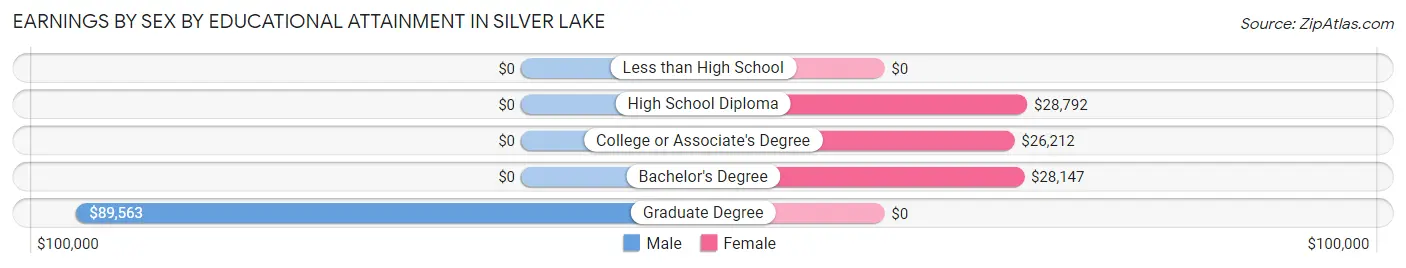
Earnings by Sex by Educational Attainment in Silver Lake
Average earnings in Silver Lake are $47,464 for men and $28,761 for women, a difference of 39.4%. Men with an educational attainment of graduate degree enjoy the highest average annual earnings of $89,563, while those with graduate degree education earn the least with $89,563. Women with an educational attainment of high school diploma earn the most with the average annual earnings of $28,792, while those with college or associate's degree education have the smallest earnings of $26,212.
| Educational Attainment | Male Income | Female Income |
| Less than High School | - | - |
| High School Diploma | - | - |
| College or Associate's Degree | - | - |
| Bachelor's Degree | - | - |
| Graduate Degree | $89,563 | $0 |
| Total | $47,464 | $28,761 |
Family Income in Silver Lake
Family Income Brackets in Silver Lake
According to the Silver Lake family income data, there are 180 families falling into the $100,000 to $149,999 income range, which is the most common income bracket and makes up 26.2% of all families.
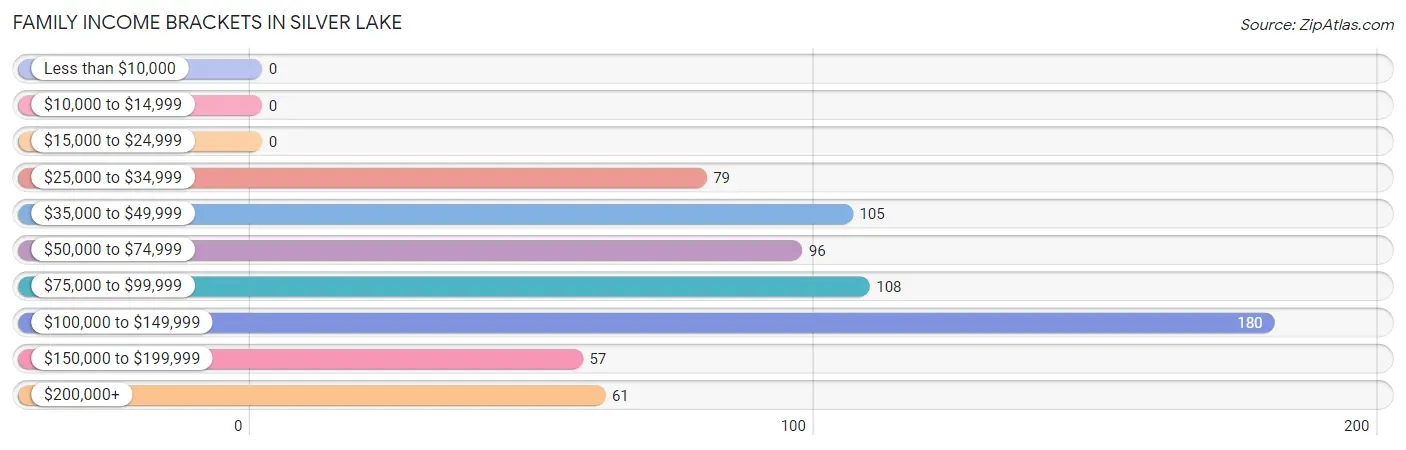
| Income Bracket | # Families | % Families |
| Less than $10,000 | 0 | 0.0% |
| $10,000 to $14,999 | 0 | 0.0% |
| $15,000 to $24,999 | 0 | 0.0% |
| $25,000 to $34,999 | 79 | 11.5% |
| $35,000 to $49,999 | 105 | 15.3% |
| $50,000 to $74,999 | 96 | 14.0% |
| $75,000 to $99,999 | 108 | 15.7% |
| $100,000 to $149,999 | 180 | 26.2% |
| $150,000 to $199,999 | 57 | 8.3% |
| $200,000+ | 61 | 8.9% |
Family Income by Famaliy Size in Silver Lake
2-person families (408 | 59.5%) account for the highest median family income in Silver Lake with $100,278 per family, while 2-person families (408 | 59.5%) have the highest median income of $50,139 per family member.
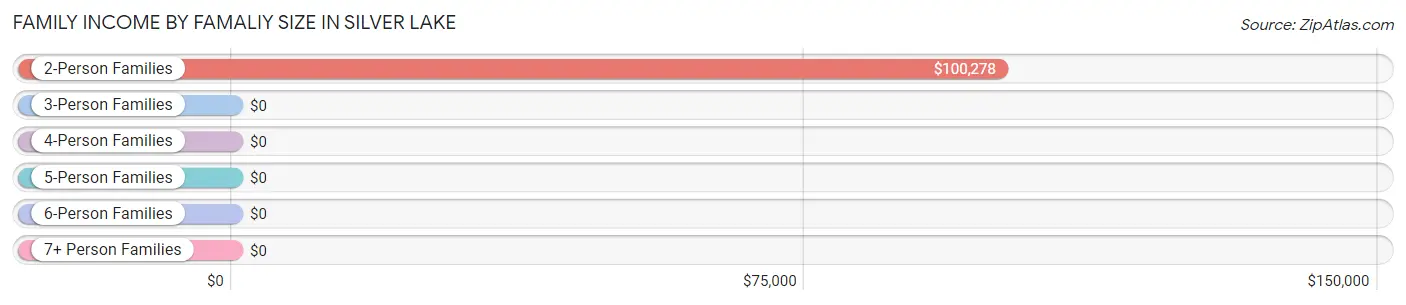
| Income Bracket | # Families | Median Income |
| 2-Person Families | 408 (59.5%) | $100,278 |
| 3-Person Families | 97 (14.1%) | $0 |
| 4-Person Families | 25 (3.6%) | $0 |
| 5-Person Families | 41 (6.0%) | $0 |
| 6-Person Families | 60 (8.7%) | $0 |
| 7+ Person Families | 55 (8.0%) | $0 |
| Total | 686 (100.0%) | $83,896 |
Family Income by Number of Earners in Silver Lake
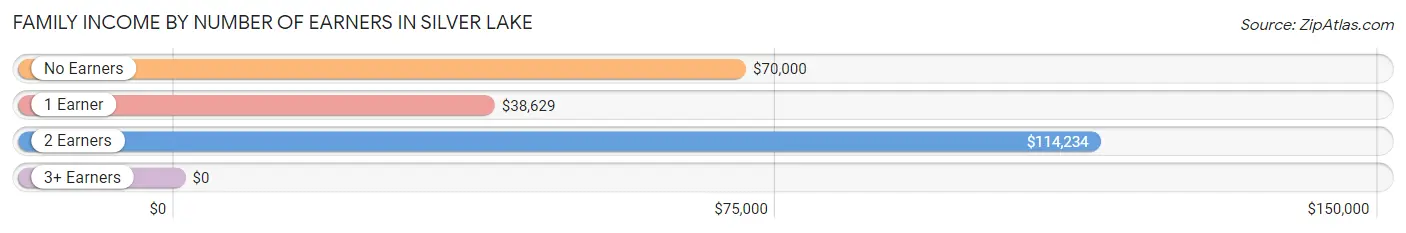
| Number of Earners | # Families | Median Income |
| No Earners | 116 (16.9%) | $70,000 |
| 1 Earner | 266 (38.8%) | $38,629 |
| 2 Earners | 257 (37.5%) | $114,234 |
| 3+ Earners | 47 (6.9%) | $0 |
| Total | 686 (100.0%) | $83,896 |
Household Income in Silver Lake
Household Income Brackets in Silver Lake
With 192 households falling in the category, the $50,000 to $74,999 income range is the most frequent in Silver Lake, accounting for 20.8% of all households.
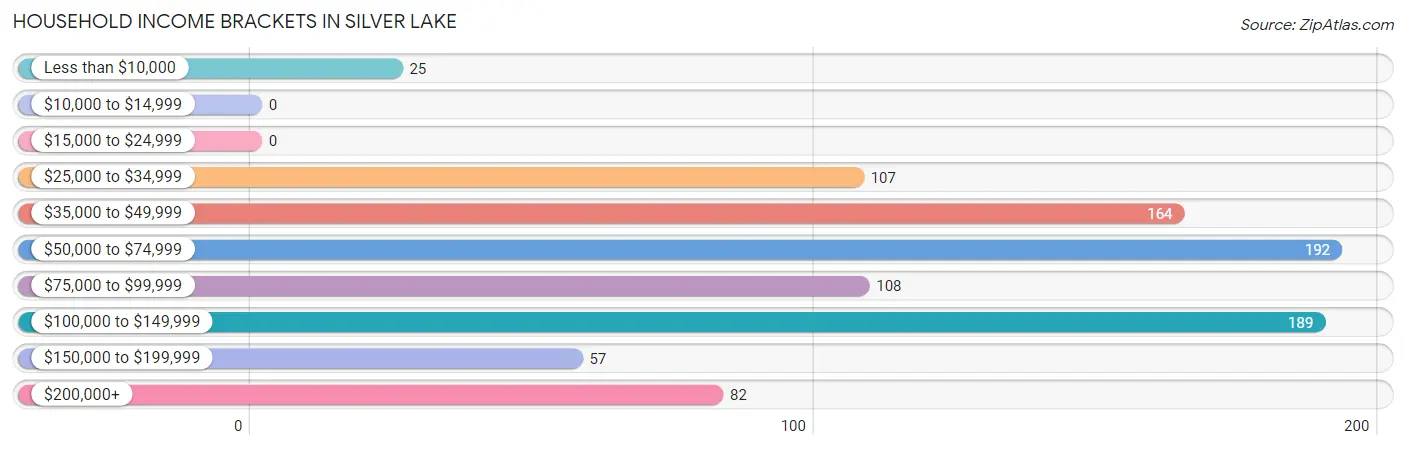
| Income Bracket | # Households | % Households |
| Less than $10,000 | 25 | 2.7% |
| $10,000 to $14,999 | 0 | 0.0% |
| $15,000 to $24,999 | 0 | 0.0% |
| $25,000 to $34,999 | 107 | 11.6% |
| $35,000 to $49,999 | 164 | 17.7% |
| $50,000 to $74,999 | 192 | 20.8% |
| $75,000 to $99,999 | 108 | 11.7% |
| $100,000 to $149,999 | 189 | 20.5% |
| $150,000 to $199,999 | 57 | 6.2% |
| $200,000+ | 82 | 8.9% |
Household Income by Householder Age in Silver Lake
The median household income in Silver Lake is $73,700, with the highest median household income of $105,912 found in the 45 to 64 years age bracket for the primary householder. A total of 271 households (29.3%) fall into this category. Meanwhile, the 15 to 24 years age bracket for the primary householder has the lowest median household income of $0, with 17 households (1.8%) in this group.
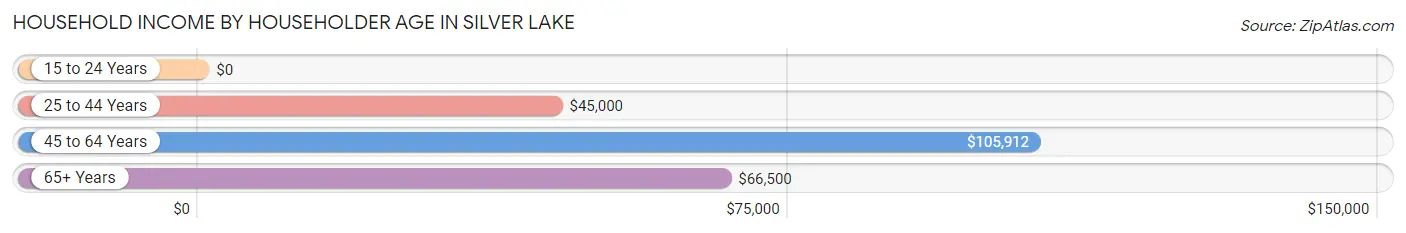
| Income Bracket | # Households | Median Income |
| 15 to 24 Years | 17 (1.8%) | $0 |
| 25 to 44 Years | 356 (38.5%) | $45,000 |
| 45 to 64 Years | 271 (29.3%) | $105,912 |
| 65+ Years | 280 (30.3%) | $66,500 |
| Total | 924 (100.0%) | $73,700 |
Poverty in Silver Lake
Income Below Poverty by Sex and Age in Silver Lake
With 9.5% poverty level for males and 16.4% for females among the residents of Silver Lake, 6 to 11 year old males and 5 year old females are the most vulnerable to poverty, with 36 males (100.0%) and 35 females (100.0%) in their respective age groups living below the poverty level.
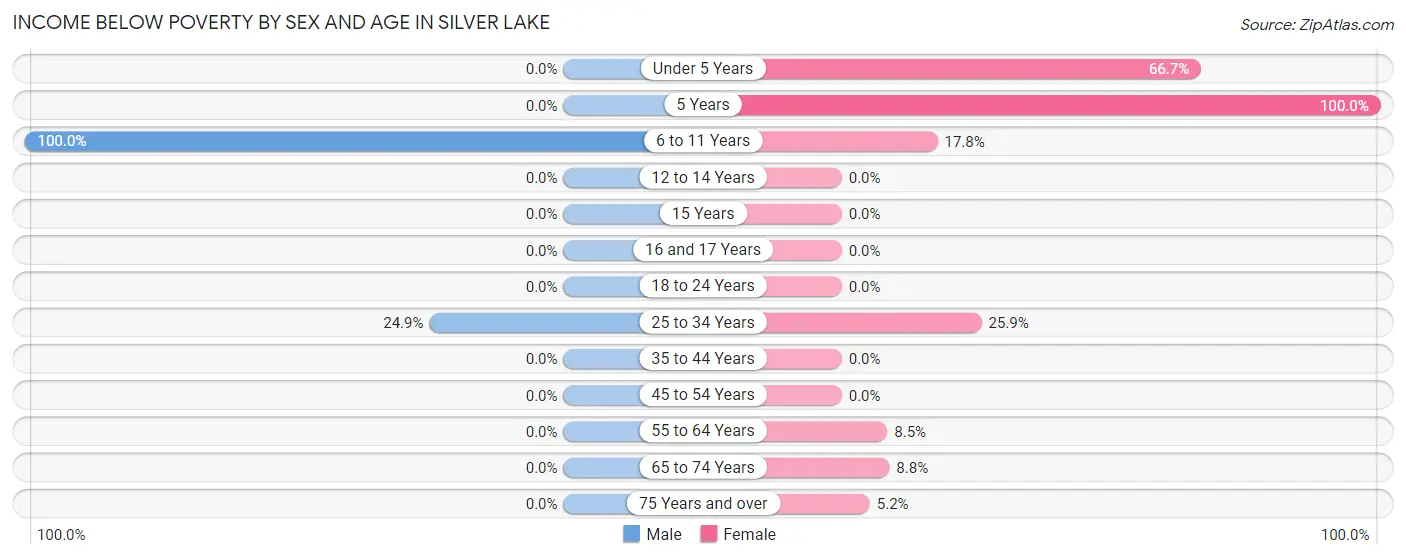
| Age Bracket | Male | Female |
| Under 5 Years | 0 (0.0%) | 74 (66.7%) |
| 5 Years | 0 (0.0%) | 35 (100.0%) |
| 6 to 11 Years | 36 (100.0%) | 35 (17.8%) |
| 12 to 14 Years | 0 (0.0%) | 0 (0.0%) |
| 15 Years | 0 (0.0%) | 0 (0.0%) |
| 16 and 17 Years | 0 (0.0%) | 0 (0.0%) |
| 18 to 24 Years | 0 (0.0%) | 0 (0.0%) |
| 25 to 34 Years | 55 (24.9%) | 69 (25.9%) |
| 35 to 44 Years | 0 (0.0%) | 0 (0.0%) |
| 45 to 54 Years | 0 (0.0%) | 0 (0.0%) |
| 55 to 64 Years | 0 (0.0%) | 18 (8.5%) |
| 65 to 74 Years | 0 (0.0%) | 16 (8.8%) |
| 75 Years and over | 0 (0.0%) | 9 (5.2%) |
| Total | 91 (9.5%) | 256 (16.4%) |
Income Above Poverty by Sex and Age in Silver Lake
According to the poverty statistics in Silver Lake, males aged under 5 years and females aged 12 to 14 years are the age groups that are most secure financially, with 100.0% of males and 100.0% of females in these age groups living above the poverty line.
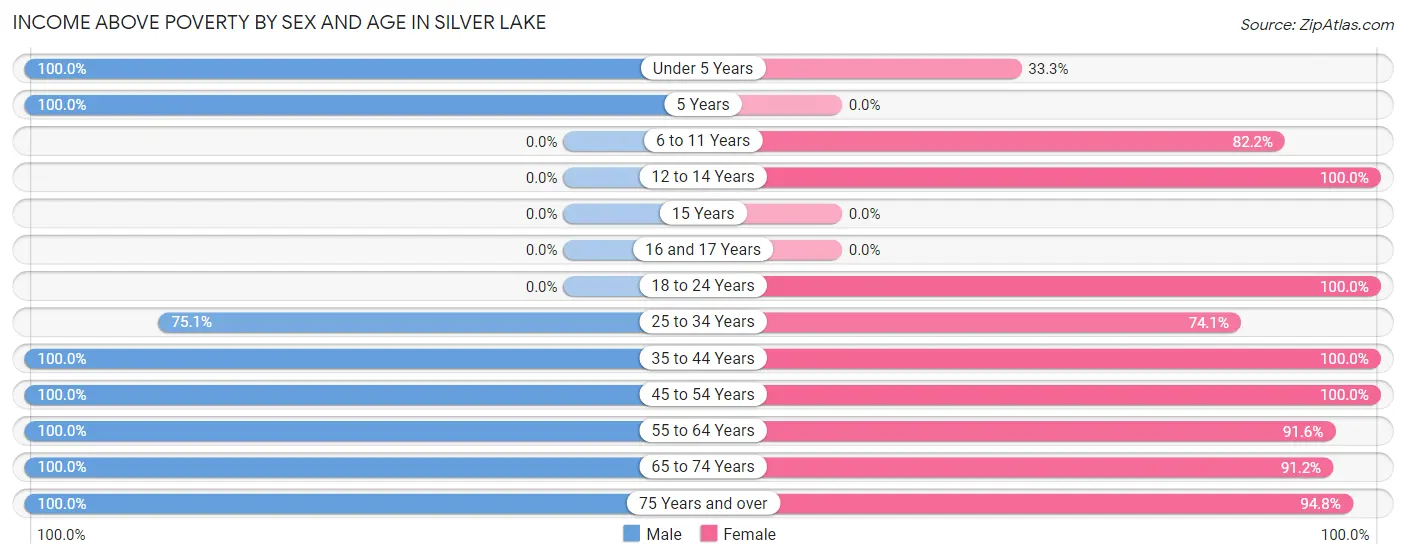
| Age Bracket | Male | Female |
| Under 5 Years | 27 (100.0%) | 37 (33.3%) |
| 5 Years | 18 (100.0%) | 0 (0.0%) |
| 6 to 11 Years | 0 (0.0%) | 162 (82.2%) |
| 12 to 14 Years | 0 (0.0%) | 63 (100.0%) |
| 15 Years | 0 (0.0%) | 0 (0.0%) |
| 16 and 17 Years | 0 (0.0%) | 0 (0.0%) |
| 18 to 24 Years | 0 (0.0%) | 107 (100.0%) |
| 25 to 34 Years | 166 (75.1%) | 197 (74.1%) |
| 35 to 44 Years | 170 (100.0%) | 138 (100.0%) |
| 45 to 54 Years | 45 (100.0%) | 82 (100.0%) |
| 55 to 64 Years | 168 (100.0%) | 195 (91.5%) |
| 65 to 74 Years | 186 (100.0%) | 165 (91.2%) |
| 75 Years and over | 87 (100.0%) | 164 (94.8%) |
| Total | 867 (90.5%) | 1,310 (83.7%) |
Income Below Poverty Among Married-Couple Families in Silver Lake
The poverty statistics for married-couple families in Silver Lake show that 10.9% or 55 of the total 503 families live below the poverty line. Families with 5 or more children have the highest poverty rate of 100.0%, comprising of 55 families. On the other hand, families with no children have the lowest poverty rate of 0.0%, which includes 0 families.
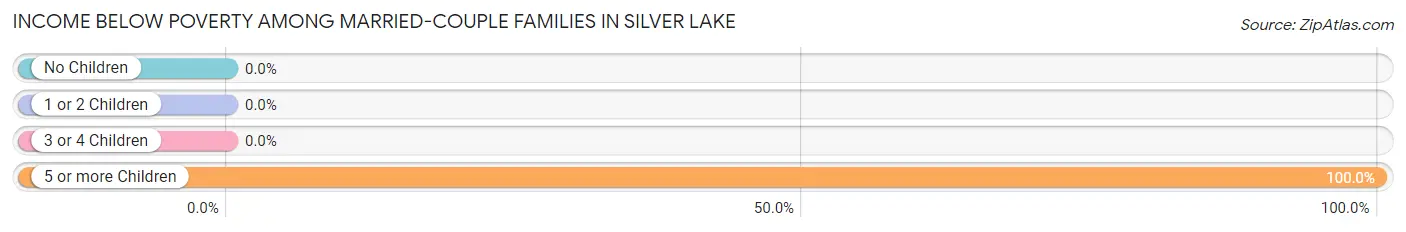
| Children | Above Poverty | Below Poverty |
| No Children | 384 (100.0%) | 0 (0.0%) |
| 1 or 2 Children | 41 (100.0%) | 0 (0.0%) |
| 3 or 4 Children | 23 (100.0%) | 0 (0.0%) |
| 5 or more Children | 0 (0.0%) | 55 (100.0%) |
| Total | 448 (89.1%) | 55 (10.9%) |
Income Below Poverty Among Single-Parent Households in Silver Lake
| Children | Single Father | Single Mother |
| No Children | 0 (0.0%) | 0 (0.0%) |
| 1 or 2 Children | 0 (0.0%) | 0 (0.0%) |
| 3 or 4 Children | 0 (0.0%) | 0 (0.0%) |
| 5 or more Children | 0 (0.0%) | 0 (0.0%) |
| Total | 0 (0.0%) | 0 (0.0%) |
Income Below Poverty Among Married-Couple vs Single-Parent Households in Silver Lake
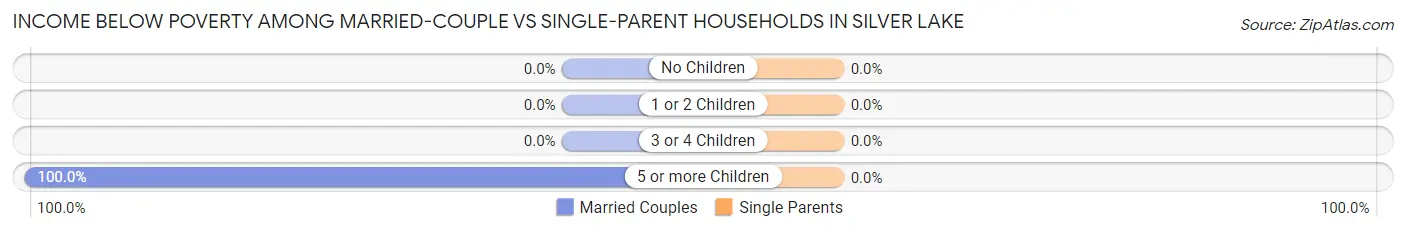
| Children | Married-Couple Families | Single-Parent Households |
| No Children | 0 (0.0%) | 0 (0.0%) |
| 1 or 2 Children | 0 (0.0%) | 0 (0.0%) |
| 3 or 4 Children | 0 (0.0%) | 0 (0.0%) |
| 5 or more Children | 55 (100.0%) | 0 (0.0%) |
| Total | 55 (10.9%) | 0 (0.0%) |
Race in Silver Lake
The most populous races in Silver Lake are White / Caucasian (1,838 | 72.8%), Hispanic or Latino (489 | 19.4%), and Two or more Races (376 | 14.9%).
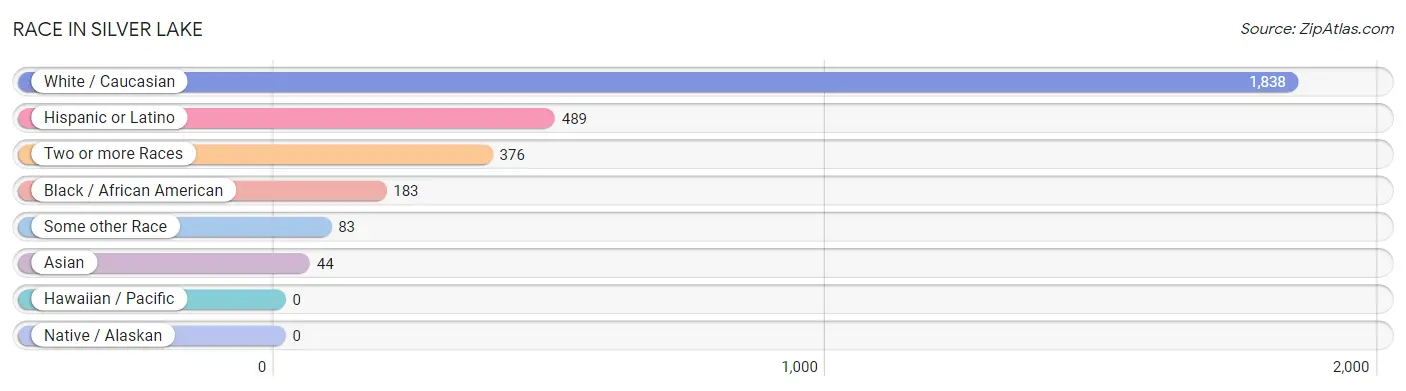
| Race | # Population | % Population |
| Asian | 44 | 1.7% |
| Black / African American | 183 | 7.2% |
| Hawaiian / Pacific | 0 | 0.0% |
| Hispanic or Latino | 489 | 19.4% |
| Native / Alaskan | 0 | 0.0% |
| White / Caucasian | 1,838 | 72.8% |
| Two or more Races | 376 | 14.9% |
| Some other Race | 83 | 3.3% |
| Total | 2,524 | 100.0% |
Ancestry in Silver Lake
The most populous ancestries reported in Silver Lake are English (369 | 14.6%), Italian (347 | 13.8%), Mexican (329 | 13.0%), Irish (282 | 11.2%), and Polish (255 | 10.1%), together accounting for 62.7% of all Silver Lake residents.
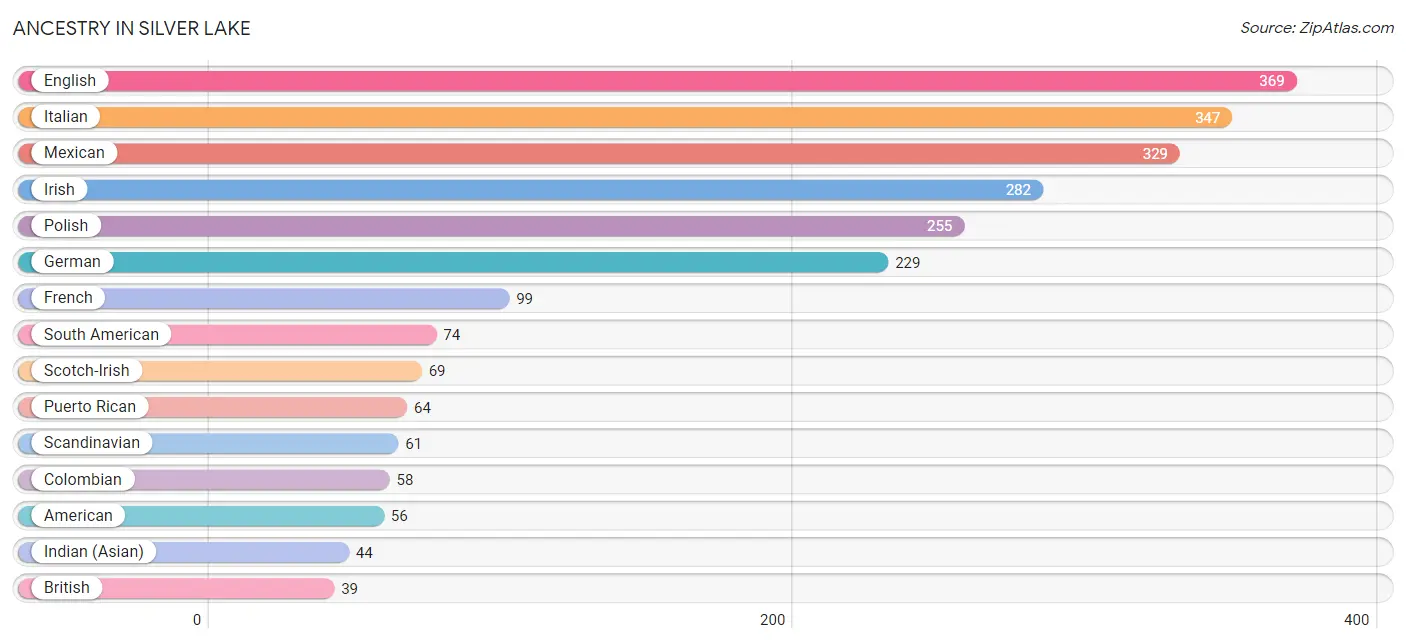
| Ancestry | # Population | % Population |
| American | 56 | 2.2% |
| Arab | 5 | 0.2% |
| Belgian | 17 | 0.7% |
| British | 39 | 1.5% |
| Central American | 11 | 0.4% |
| Cherokee | 18 | 0.7% |
| Colombian | 58 | 2.3% |
| Costa Rican | 11 | 0.4% |
| Cuban | 11 | 0.4% |
| Ecuadorian | 16 | 0.6% |
| Egyptian | 5 | 0.2% |
| English | 369 | 14.6% |
| European | 27 | 1.1% |
| French | 99 | 3.9% |
| French Canadian | 10 | 0.4% |
| German | 229 | 9.1% |
| Indian (Asian) | 44 | 1.7% |
| Irish | 282 | 11.2% |
| Israeli | 29 | 1.1% |
| Italian | 347 | 13.8% |
| Mexican | 329 | 13.0% |
| Polish | 255 | 10.1% |
| Puerto Rican | 64 | 2.5% |
| Russian | 36 | 1.4% |
| Scandinavian | 61 | 2.4% |
| Scotch-Irish | 69 | 2.7% |
| Scottish | 31 | 1.2% |
| South American | 74 | 2.9% |
| Swiss | 10 | 0.4% |
| Welsh | 23 | 0.9% | View All 30 Rows |
Immigrants in Silver Lake
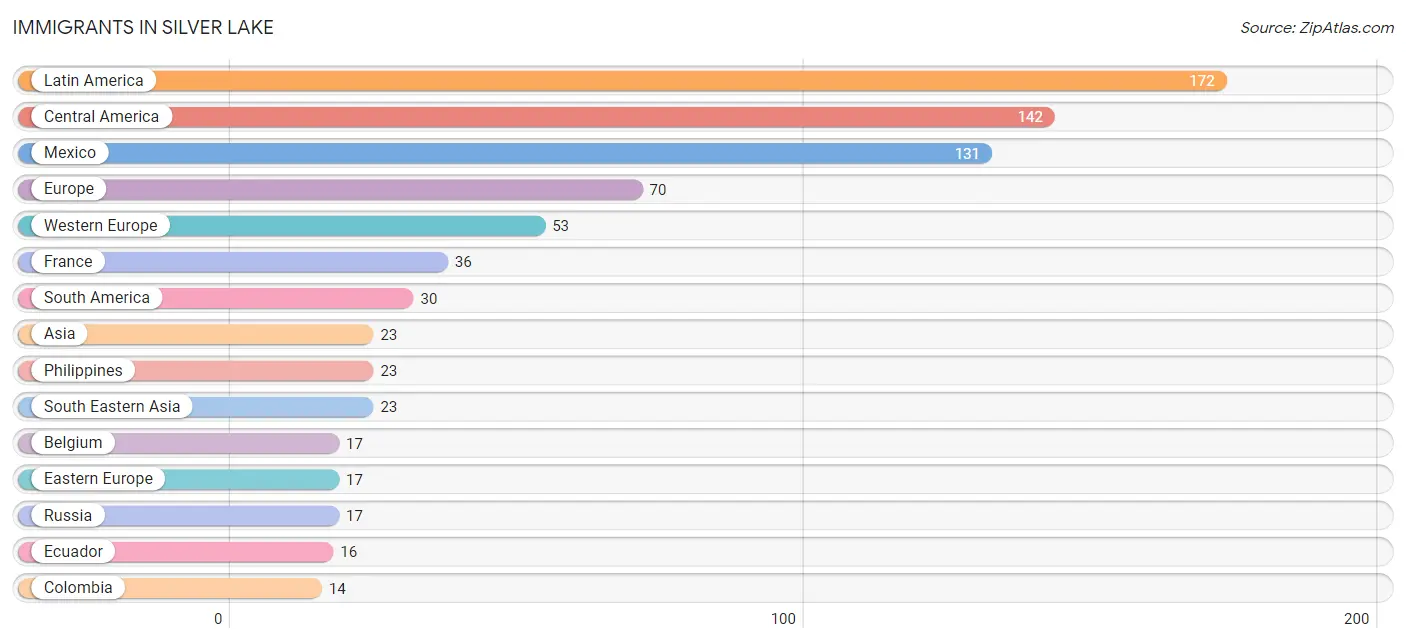
The most numerous immigrant groups reported in Silver Lake came from Latin America (172 | 6.8%), Central America (142 | 5.6%), Mexico (131 | 5.2%), Europe (70 | 2.8%), and Western Europe (53 | 2.1%), together accounting for 22.5% of all Silver Lake residents.
| Immigration Origin | # Population | % Population |
| Africa | 5 | 0.2% |
| Asia | 23 | 0.9% |
| Belgium | 17 | 0.7% |
| Central America | 142 | 5.6% |
| Colombia | 14 | 0.5% |
| Costa Rica | 11 | 0.4% |
| Eastern Europe | 17 | 0.7% |
| Ecuador | 16 | 0.6% |
| Egypt | 5 | 0.2% |
| Europe | 70 | 2.8% |
| France | 36 | 1.4% |
| Latin America | 172 | 6.8% |
| Mexico | 131 | 5.2% |
| Northern Africa | 5 | 0.2% |
| Philippines | 23 | 0.9% |
| Russia | 17 | 0.7% |
| South America | 30 | 1.2% |
| South Eastern Asia | 23 | 0.9% |
| Western Europe | 53 | 2.1% | View All 19 Rows |
Sex and Age in Silver Lake
Sex and Age in Silver Lake
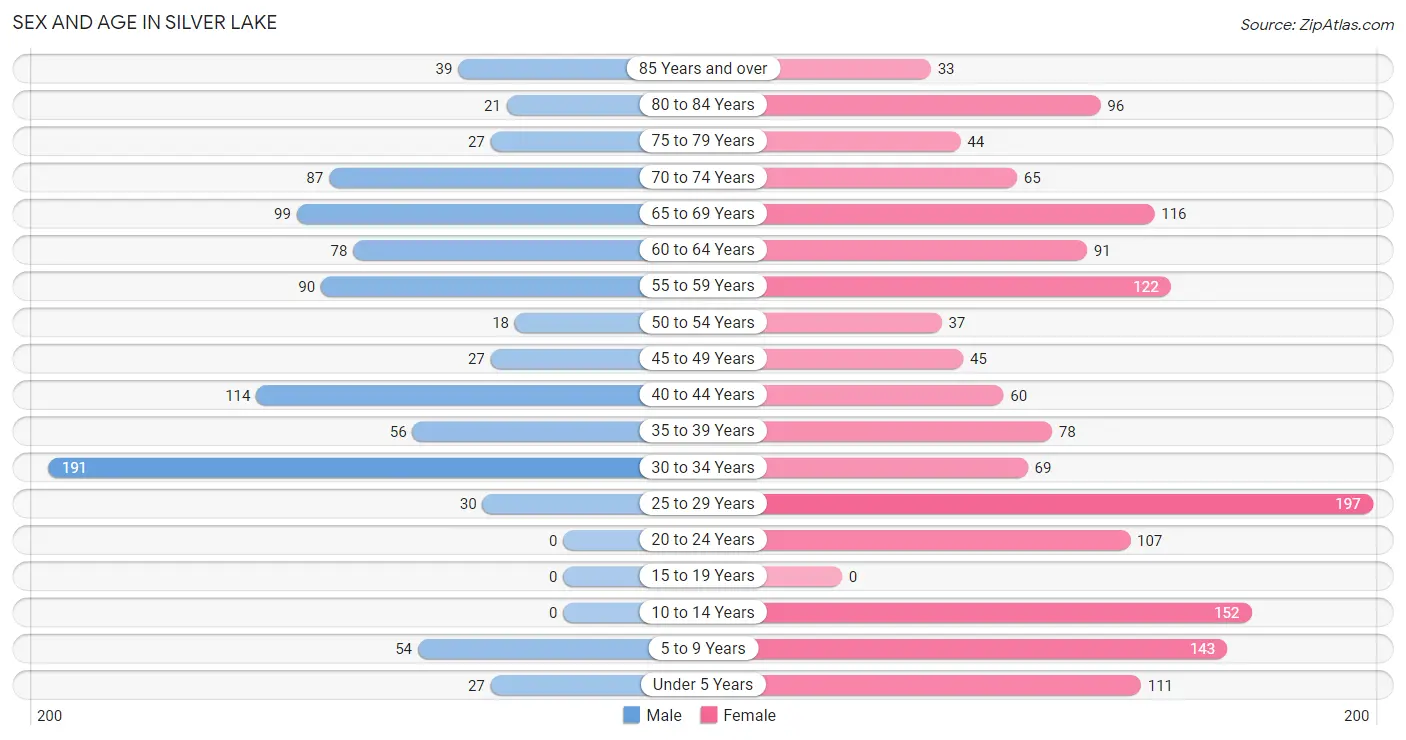
The most populous age groups in Silver Lake are 30 to 34 Years (191 | 19.9%) for men and 25 to 29 Years (197 | 12.6%) for women.
| Age Bracket | Male | Female |
| Under 5 Years | 27 (2.8%) | 111 (7.1%) |
| 5 to 9 Years | 54 (5.6%) | 143 (9.1%) |
| 10 to 14 Years | 0 (0.0%) | 152 (9.7%) |
| 15 to 19 Years | 0 (0.0%) | 0 (0.0%) |
| 20 to 24 Years | 0 (0.0%) | 107 (6.8%) |
| 25 to 29 Years | 30 (3.1%) | 197 (12.6%) |
| 30 to 34 Years | 191 (19.9%) | 69 (4.4%) |
| 35 to 39 Years | 56 (5.9%) | 78 (5.0%) |
| 40 to 44 Years | 114 (11.9%) | 60 (3.8%) |
| 45 to 49 Years | 27 (2.8%) | 45 (2.9%) |
| 50 to 54 Years | 18 (1.9%) | 37 (2.4%) |
| 55 to 59 Years | 90 (9.4%) | 122 (7.8%) |
| 60 to 64 Years | 78 (8.1%) | 91 (5.8%) |
| 65 to 69 Years | 99 (10.3%) | 116 (7.4%) |
| 70 to 74 Years | 87 (9.1%) | 65 (4.2%) |
| 75 to 79 Years | 27 (2.8%) | 44 (2.8%) |
| 80 to 84 Years | 21 (2.2%) | 96 (6.1%) |
| 85 Years and over | 39 (4.1%) | 33 (2.1%) |
| Total | 958 (100.0%) | 1,566 (100.0%) |
Families and Households in Silver Lake
Median Family Size in Silver Lake
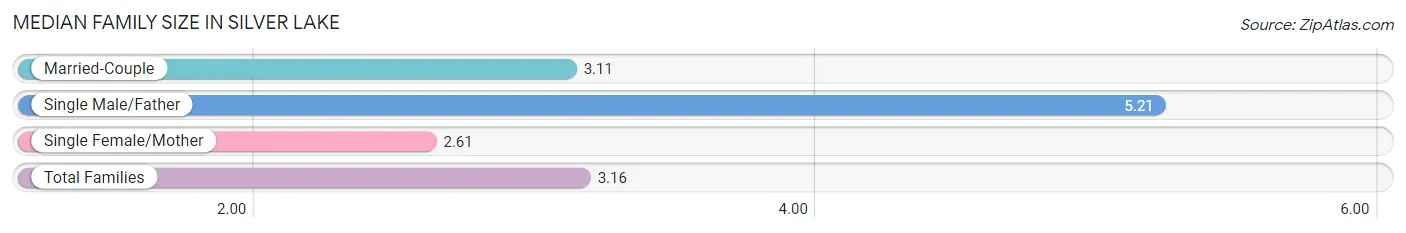
The median family size in Silver Lake is 3.16 persons per family, with single male/father families (47 | 6.9%) accounting for the largest median family size of 5.21 persons per family. On the other hand, single female/mother families (136 | 19.8%) represent the smallest median family size with 2.61 persons per family.
| Family Type | # Families | Family Size |
| Married-Couple | 503 (73.3%) | 3.11 |
| Single Male/Father | 47 (6.9%) | 5.21 |
| Single Female/Mother | 136 (19.8%) | 2.61 |
| Total Families | 686 (100.0%) | 3.16 |
Median Household Size in Silver Lake
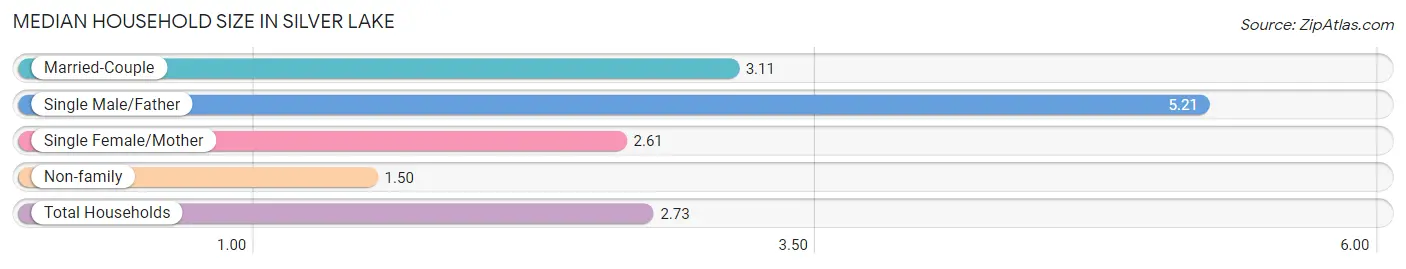
The median household size in Silver Lake is 2.73 persons per household, with single male/father households (47 | 5.1%) accounting for the largest median household size of 5.21 persons per household. non-family households (238 | 25.8%) represent the smallest median household size with 1.50 persons per household.
| Household Type | # Households | Household Size |
| Married-Couple | 503 (54.4%) | 3.11 |
| Single Male/Father | 47 (5.1%) | 5.21 |
| Single Female/Mother | 136 (14.7%) | 2.61 |
| Non-family | 238 (25.8%) | 1.50 |
| Total Households | 924 (100.0%) | 2.73 |
Household Size by Marriage Status in Silver Lake
Out of a total of 924 households in Silver Lake, 686 (74.2%) are family households, while 238 (25.8%) are nonfamily households. The most numerous type of family households are 2-person households, comprising 408, and the most common type of nonfamily households are 1-person households, comprising 181.
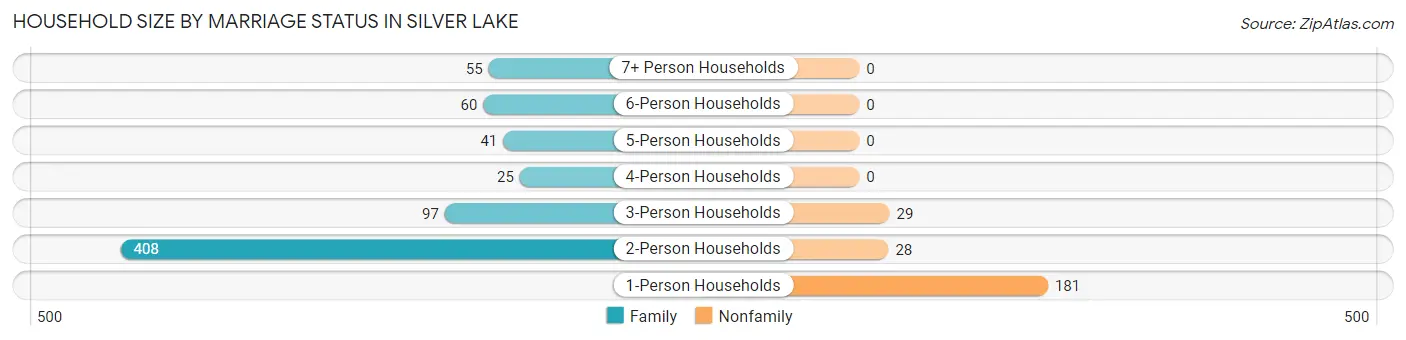
| Household Size | Family Households | Nonfamily Households |
| 1-Person Households | - | 181 (19.6%) |
| 2-Person Households | 408 (44.2%) | 28 (3.0%) |
| 3-Person Households | 97 (10.5%) | 29 (3.1%) |
| 4-Person Households | 25 (2.7%) | 0 (0.0%) |
| 5-Person Households | 41 (4.4%) | 0 (0.0%) |
| 6-Person Households | 60 (6.5%) | 0 (0.0%) |
| 7+ Person Households | 55 (5.9%) | 0 (0.0%) |
| Total | 686 (74.2%) | 238 (25.8%) |
Female Fertility in Silver Lake
Fertility by Age in Silver Lake
| Age Bracket | Women with Births | Births / 1,000 Women |
| 15 to 19 years | 0 (0.0%) | 0.0 |
| 20 to 34 years | 0 (0.0%) | 0.0 |
| 35 to 50 years | 0 (0.0%) | 0.0 |
| Total | 0 (0.0%) | 0.0 |
Fertility by Age by Marriage Status in Silver Lake
| Age Bracket | Married | Unmarried |
| 15 to 19 years | 0 (0.0%) | 0 (0.0%) |
| 20 to 34 years | 0 (0.0%) | 0 (0.0%) |
| 35 to 50 years | 0 (0.0%) | 0 (0.0%) |
| Total | 0 (0.0%) | 0 (0.0%) |
Fertility by Education in Silver Lake
| Educational Attainment | Women with Births | Births / 1,000 Women |
| Less than High School | 0 (0.0%) | 0.0 |
| High School Diploma | 0 (0.0%) | 0.0 |
| College or Associate's Degree | 0 (0.0%) | 0.0 |
| Bachelor's Degree | 0 (0.0%) | 0.0 |
| Graduate Degree | 0 (0.0%) | 0.0 |
| Total | 0 (0.0%) | 0.0 |
Fertility by Education by Marriage Status in Silver Lake
| Educational Attainment | Married | Unmarried |
| Less than High School | 0 (0.0%) | 0 (0.0%) |
| High School Diploma | 0 (0.0%) | 0 (0.0%) |
| College or Associate's Degree | 0 (0.0%) | 0 (0.0%) |
| Bachelor's Degree | 0 (0.0%) | 0 (0.0%) |
| Graduate Degree | 0 (0.0%) | 0 (0.0%) |
| Total | 0 (0.0%) | 0 (0.0%) |
Employment Characteristics in Silver Lake
Employment by Class of Employer in Silver Lake
Among the 1,069 employed individuals in Silver Lake, private company employees (563 | 52.7%), self-employed (not incorporated) (165 | 15.4%), and self-employed (incorporated) (160 | 15.0%) make up the most common classes of employment.
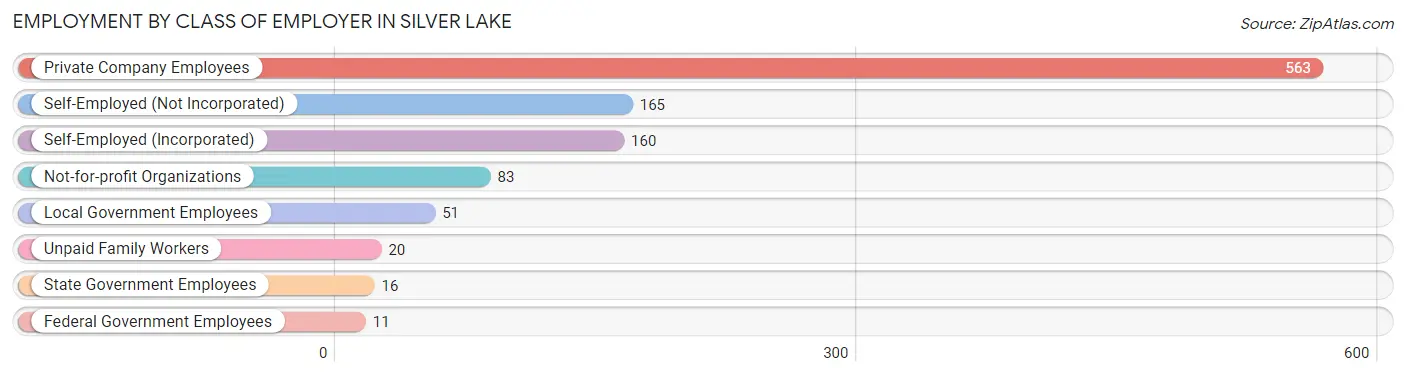
| Employer Class | # Employees | % Employees |
| Private Company Employees | 563 | 52.7% |
| Self-Employed (Incorporated) | 160 | 15.0% |
| Self-Employed (Not Incorporated) | 165 | 15.4% |
| Not-for-profit Organizations | 83 | 7.8% |
| Local Government Employees | 51 | 4.8% |
| State Government Employees | 16 | 1.5% |
| Federal Government Employees | 11 | 1.0% |
| Unpaid Family Workers | 20 | 1.9% |
| Total | 1,069 | 100.0% |
Employment Status by Age in Silver Lake
According to the labor force statistics for Silver Lake, out of the total population over 16 years of age (2,037), 56.3% or 1,147 individuals are in the labor force, with 6.8% or 78 of them unemployed. The age group with the highest labor force participation rate is 20 to 24 years, with 100.0% or 107 individuals in the labor force. Within the labor force, the 35 to 44 years age range has the highest percentage of unemployed individuals, with 25.9% or 67 of them being unemployed.
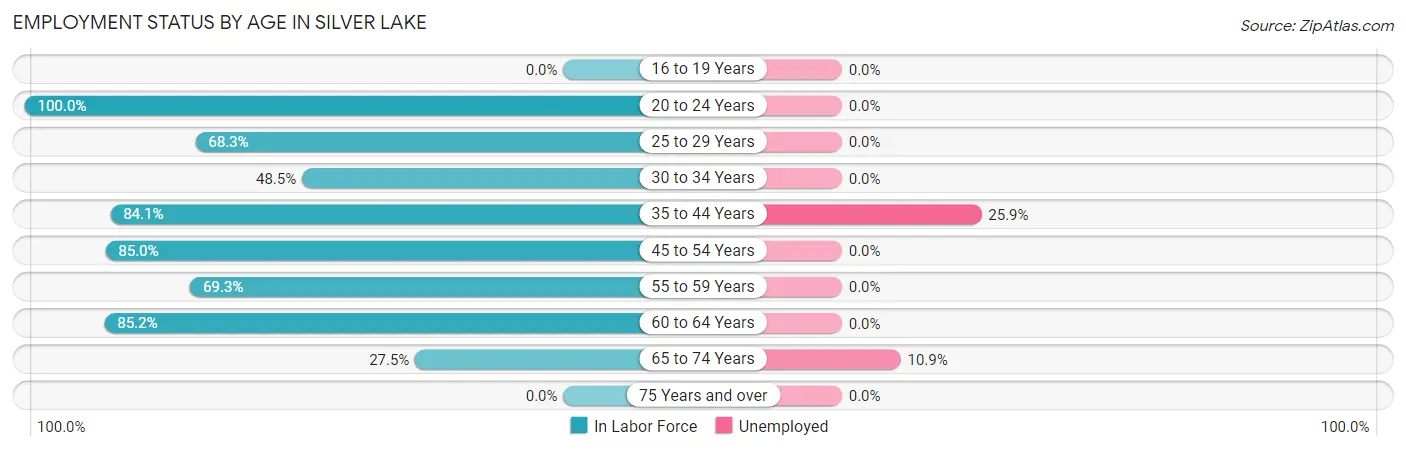
| Age Bracket | In Labor Force | Unemployed |
| 16 to 19 Years | 0 (0.0%) | 0 (0.0%) |
| 20 to 24 Years | 107 (100.0%) | 0 (0.0%) |
| 25 to 29 Years | 155 (68.3%) | 0 (0.0%) |
| 30 to 34 Years | 126 (48.5%) | 0 (0.0%) |
| 35 to 44 Years | 259 (84.1%) | 67 (25.9%) |
| 45 to 54 Years | 108 (85.0%) | 0 (0.0%) |
| 55 to 59 Years | 147 (69.3%) | 0 (0.0%) |
| 60 to 64 Years | 144 (85.2%) | 0 (0.0%) |
| 65 to 74 Years | 101 (27.5%) | 11 (10.9%) |
| 75 Years and over | 0 (0.0%) | 0 (0.0%) |
| Total | 1,147 (56.3%) | 78 (6.8%) |
Employment Status by Educational Attainment in Silver Lake
According to labor force statistics for Silver Lake, 72.1% of individuals (939) out of the total population between 25 and 64 years of age (1,303) are in the labor force, with 7.1% or 67 of them being unemployed. The group with the highest labor force participation rate are those with the educational attainment of high school diploma, with 94.0% or 299 individuals in the labor force. Within the labor force, individuals with less than high school education have the highest percentage of unemployment, with 100.0% or 11 of them being unemployed.
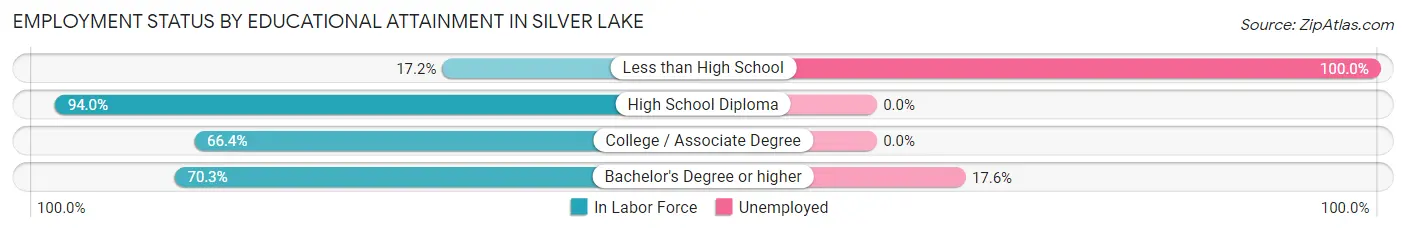
| Educational Attainment | In Labor Force | Unemployed |
| Less than High School | 11 (17.2%) | 64 (100.0%) |
| High School Diploma | 299 (94.0%) | 0 (0.0%) |
| College / Associate Degree | 310 (66.4%) | 0 (0.0%) |
| Bachelor's Degree or higher | 319 (70.3%) | 80 (17.6%) |
| Total | 939 (72.1%) | 93 (7.1%) |
Employment Occupations by Sex in Silver Lake
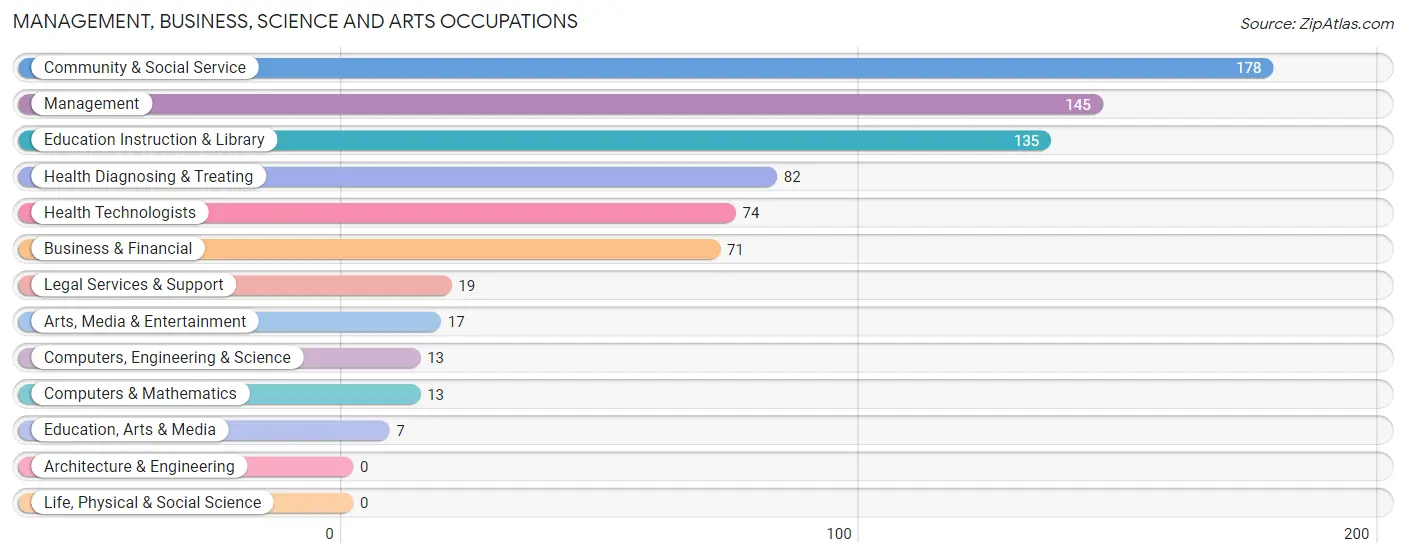
Management, Business, Science and Arts Occupations
The most common Management, Business, Science and Arts occupations in Silver Lake are Community & Social Service (178 | 16.7%), Management (145 | 13.6%), Education Instruction & Library (135 | 12.6%), Health Diagnosing & Treating (82 | 7.7%), and Health Technologists (74 | 6.9%).
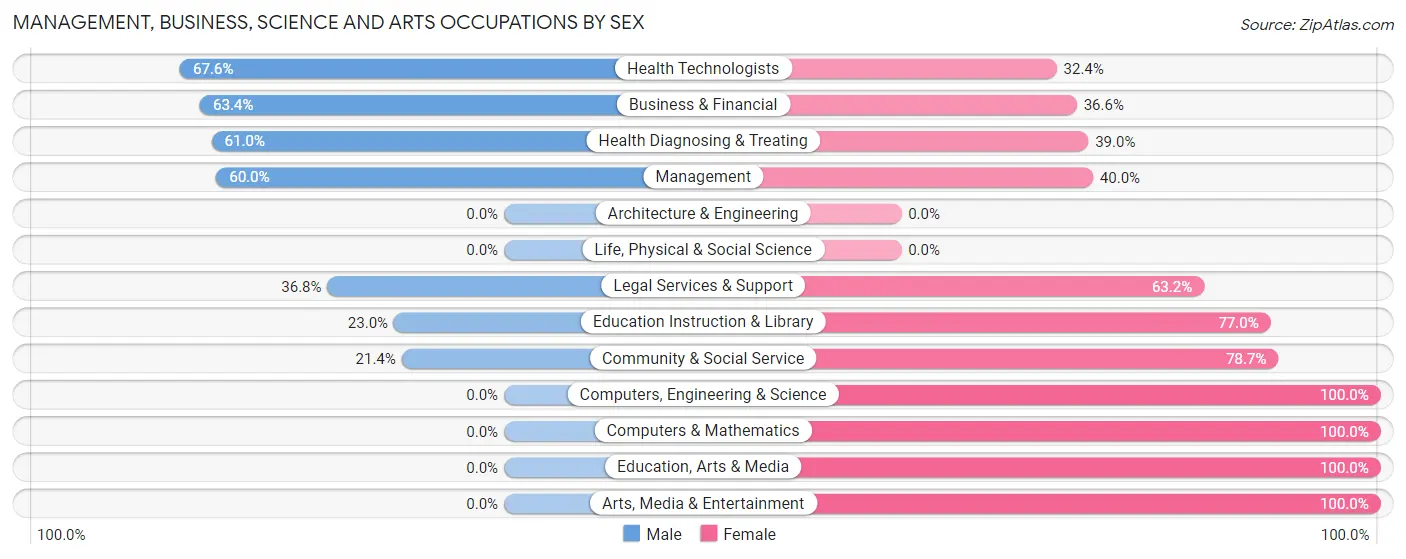
Management, Business, Science and Arts Occupations by Sex
Within the Management, Business, Science and Arts occupations in Silver Lake, the most male-oriented occupations are Health Technologists (67.6%), Business & Financial (63.4%), and Health Diagnosing & Treating (61.0%), while the most female-oriented occupations are Computers, Engineering & Science (100.0%), Computers & Mathematics (100.0%), and Education, Arts & Media (100.0%).
| Occupation | Male | Female |
| Management | 87 (60.0%) | 58 (40.0%) |
| Business & Financial | 45 (63.4%) | 26 (36.6%) |
| Computers, Engineering & Science | 0 (0.0%) | 13 (100.0%) |
| Computers & Mathematics | 0 (0.0%) | 13 (100.0%) |
| Architecture & Engineering | 0 (0.0%) | 0 (0.0%) |
| Life, Physical & Social Science | 0 (0.0%) | 0 (0.0%) |
| Community & Social Service | 38 (21.3%) | 140 (78.6%) |
| Education, Arts & Media | 0 (0.0%) | 7 (100.0%) |
| Legal Services & Support | 7 (36.8%) | 12 (63.2%) |
| Education Instruction & Library | 31 (23.0%) | 104 (77.0%) |
| Arts, Media & Entertainment | 0 (0.0%) | 17 (100.0%) |
| Health Diagnosing & Treating | 50 (61.0%) | 32 (39.0%) |
| Health Technologists | 50 (67.6%) | 24 (32.4%) |
| Total (Category) | 220 (45.0%) | 269 (55.0%) |
| Total (Overall) | 377 (35.3%) | 692 (64.7%) |
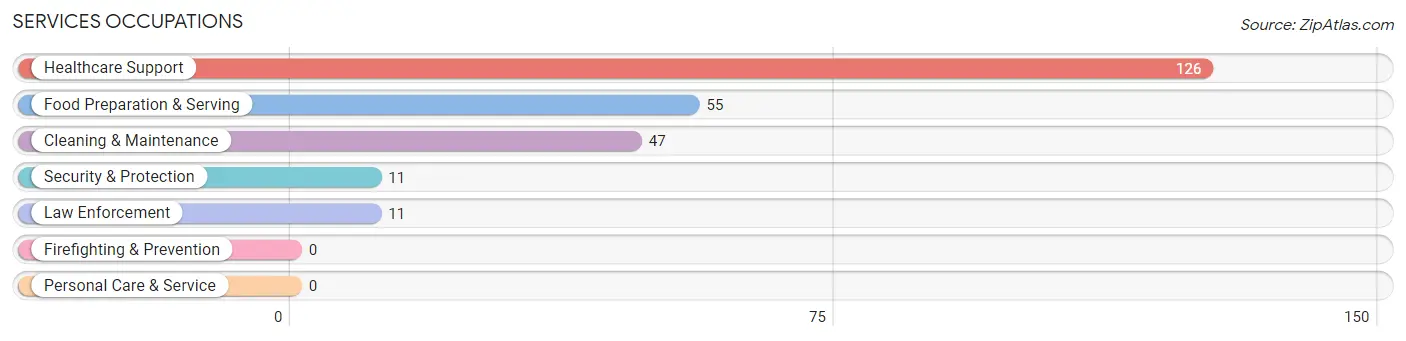
Services Occupations
The most common Services occupations in Silver Lake are Healthcare Support (126 | 11.8%), Food Preparation & Serving (55 | 5.1%), Cleaning & Maintenance (47 | 4.4%), Security & Protection (11 | 1.0%), and Law Enforcement (11 | 1.0%).
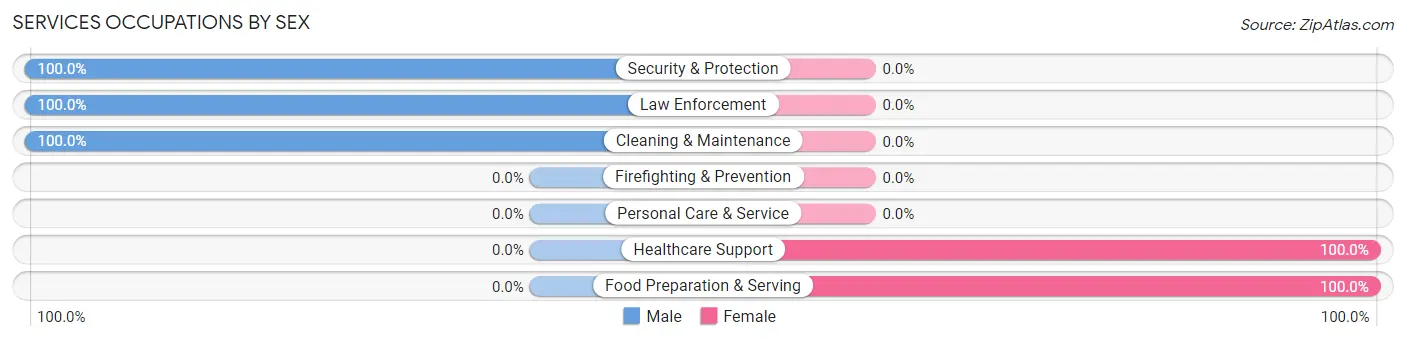
Services Occupations by Sex
Within the Services occupations in Silver Lake, the most male-oriented occupations are Security & Protection (100.0%), Law Enforcement (100.0%), and Cleaning & Maintenance (100.0%), while the most female-oriented occupations are Healthcare Support (100.0%), and Food Preparation & Serving (100.0%).
| Occupation | Male | Female |
| Healthcare Support | 0 (0.0%) | 126 (100.0%) |
| Security & Protection | 11 (100.0%) | 0 (0.0%) |
| Firefighting & Prevention | 0 (0.0%) | 0 (0.0%) |
| Law Enforcement | 11 (100.0%) | 0 (0.0%) |
| Food Preparation & Serving | 0 (0.0%) | 55 (100.0%) |
| Cleaning & Maintenance | 47 (100.0%) | 0 (0.0%) |
| Personal Care & Service | 0 (0.0%) | 0 (0.0%) |
| Total (Category) | 58 (24.3%) | 181 (75.7%) |
| Total (Overall) | 377 (35.3%) | 692 (64.7%) |
Sales and Office Occupations
The most common Sales and Office occupations in Silver Lake are Sales & Related (135 | 12.6%), and Office & Administration (111 | 10.4%).
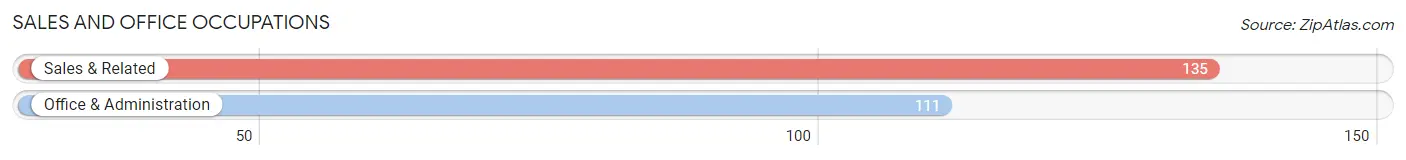
Sales and Office Occupations by Sex
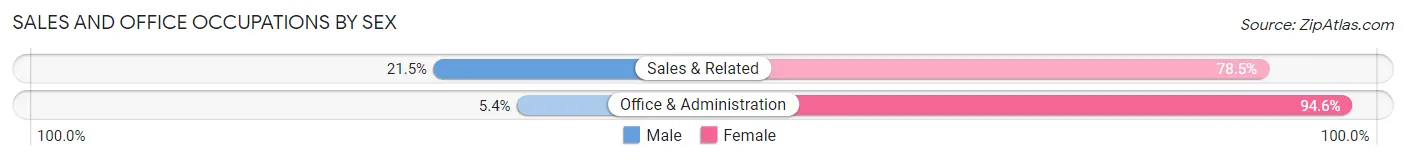
| Occupation | Male | Female |
| Sales & Related | 29 (21.5%) | 106 (78.5%) |
| Office & Administration | 6 (5.4%) | 105 (94.6%) |
| Total (Category) | 35 (14.2%) | 211 (85.8%) |
| Total (Overall) | 377 (35.3%) | 692 (64.7%) |
Natural Resources, Construction and Maintenance Occupations
The most common Natural Resources, Construction and Maintenance occupations in Silver Lake are , and Installation, Maintenance & Repair (41 | 3.8%).
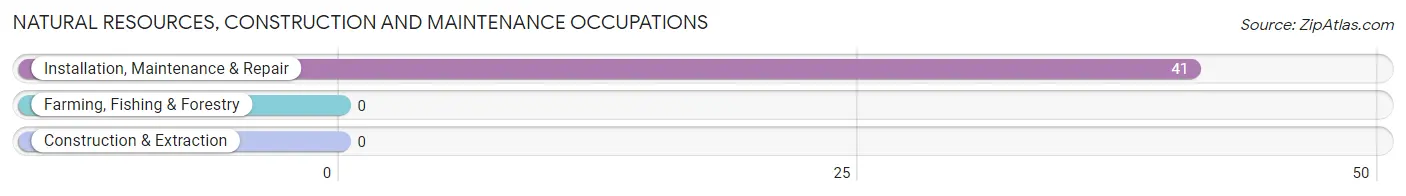
Natural Resources, Construction and Maintenance Occupations by Sex
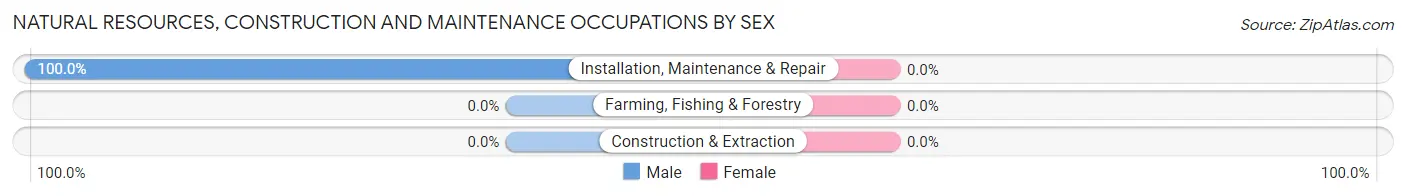
| Occupation | Male | Female |
| Farming, Fishing & Forestry | 0 (0.0%) | 0 (0.0%) |
| Construction & Extraction | 0 (0.0%) | 0 (0.0%) |
| Installation, Maintenance & Repair | 41 (100.0%) | 0 (0.0%) |
| Total (Category) | 41 (100.0%) | 0 (0.0%) |
| Total (Overall) | 377 (35.3%) | 692 (64.7%) |
Production, Transportation and Moving Occupations
The most common Production, Transportation and Moving occupations in Silver Lake are Material Moving (31 | 2.9%), and Production (23 | 2.1%).
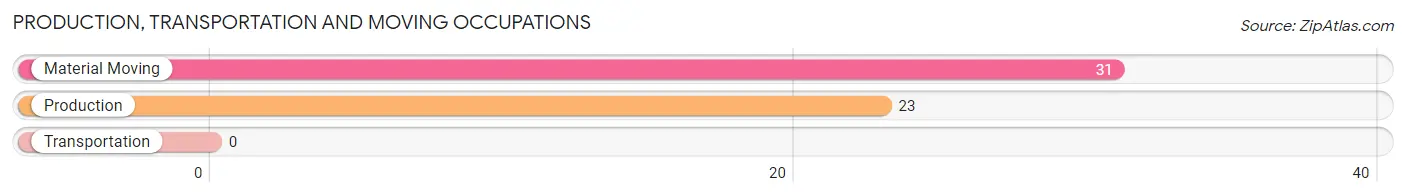
Production, Transportation and Moving Occupations by Sex
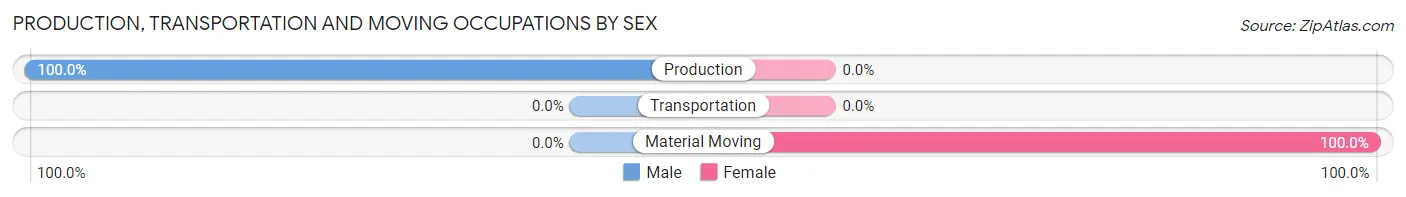
| Occupation | Male | Female |
| Production | 23 (100.0%) | 0 (0.0%) |
| Transportation | 0 (0.0%) | 0 (0.0%) |
| Material Moving | 0 (0.0%) | 31 (100.0%) |
| Total (Category) | 23 (42.6%) | 31 (57.4%) |
| Total (Overall) | 377 (35.3%) | 692 (64.7%) |
Employment Industries by Sex in Silver Lake
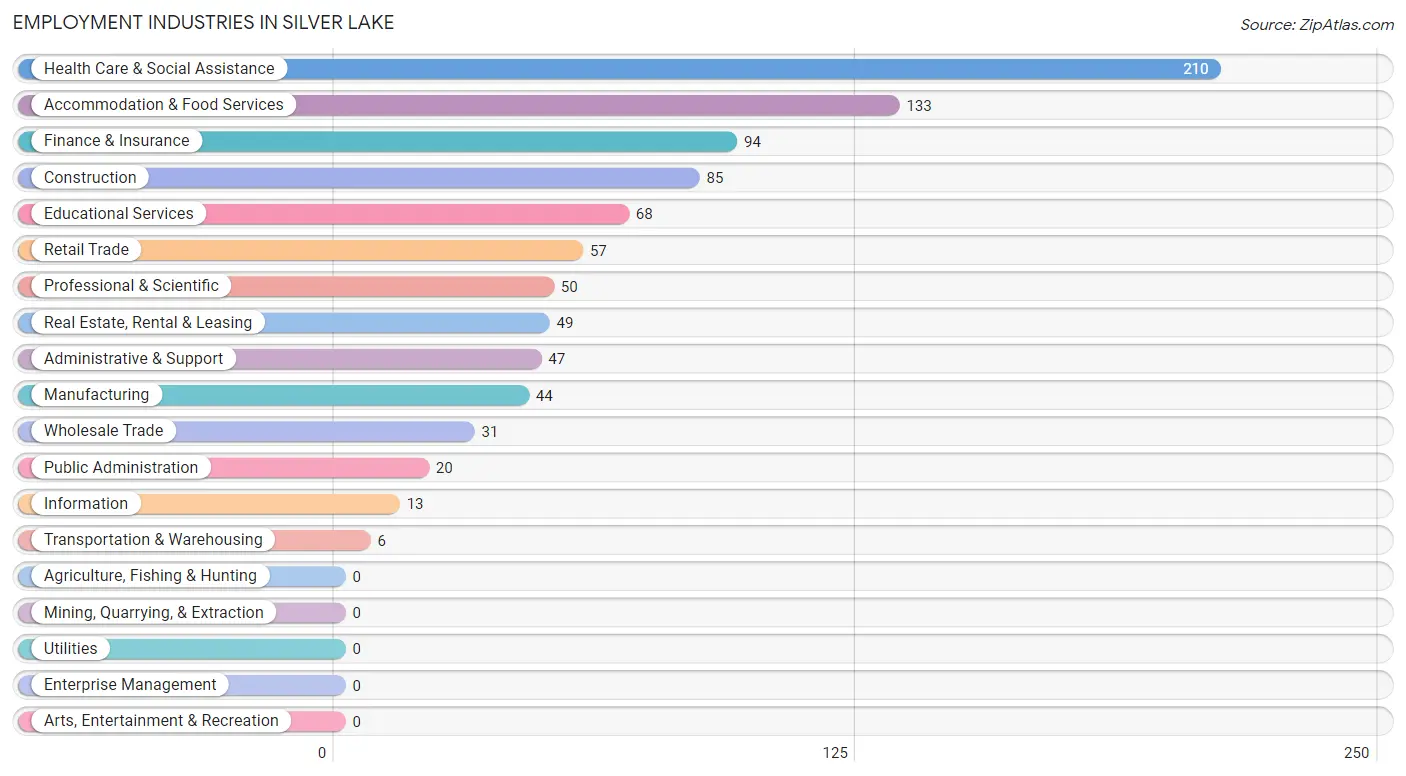
Employment Industries in Silver Lake
The major employment industries in Silver Lake include Health Care & Social Assistance (210 | 19.6%), Accommodation & Food Services (133 | 12.4%), Finance & Insurance (94 | 8.8%), Construction (85 | 8.0%), and Educational Services (68 | 6.4%).
Employment Industries by Sex in Silver Lake
The Silver Lake industries that see more men than women are Manufacturing (100.0%), Transportation & Warehousing (100.0%), and Information (100.0%), whereas the industries that tend to have a higher number of women are Wholesale Trade (100.0%), Real Estate, Rental & Leasing (100.0%), and Finance & Insurance (80.8%).
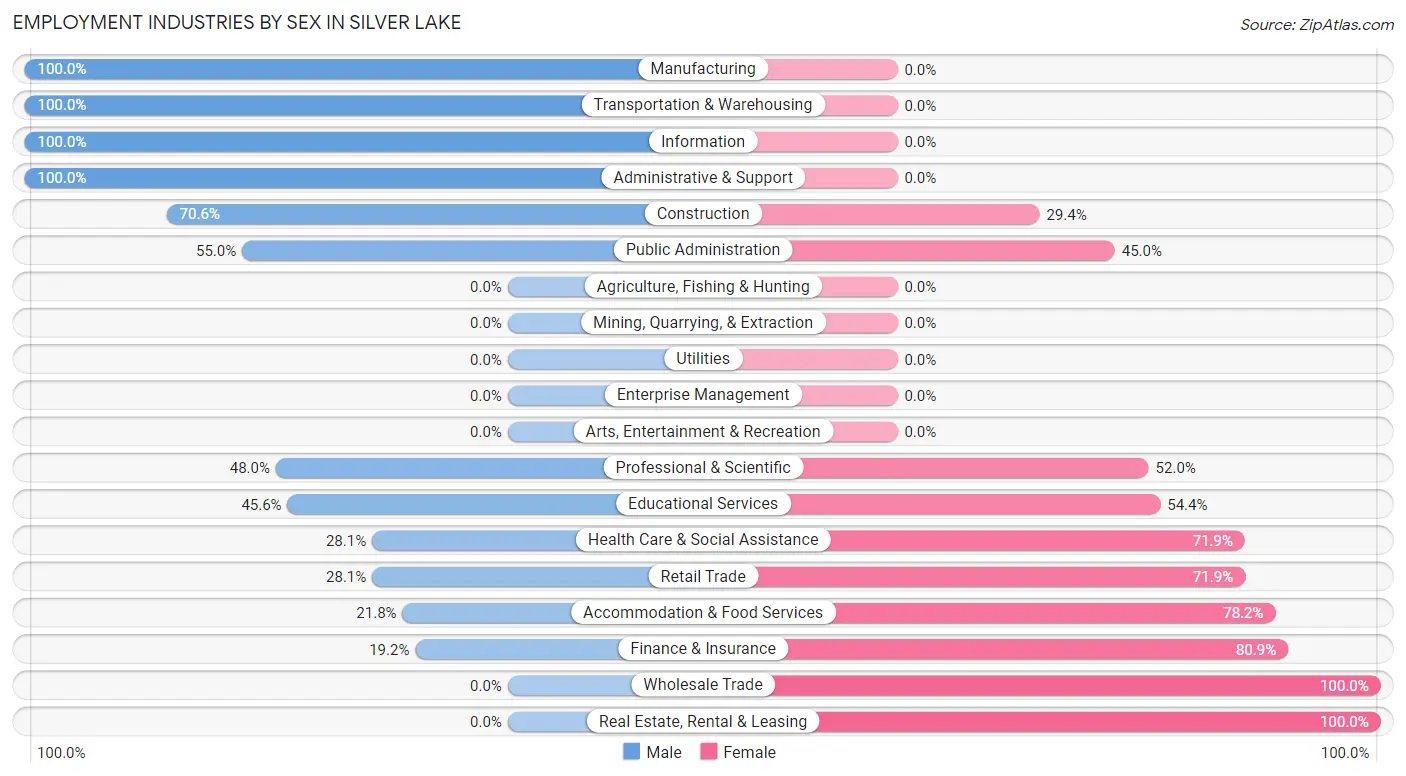
| Industry | Male | Female |
| Agriculture, Fishing & Hunting | 0 (0.0%) | 0 (0.0%) |
| Mining, Quarrying, & Extraction | 0 (0.0%) | 0 (0.0%) |
| Construction | 60 (70.6%) | 25 (29.4%) |
| Manufacturing | 44 (100.0%) | 0 (0.0%) |
| Wholesale Trade | 0 (0.0%) | 31 (100.0%) |
| Retail Trade | 16 (28.1%) | 41 (71.9%) |
| Transportation & Warehousing | 6 (100.0%) | 0 (0.0%) |
| Utilities | 0 (0.0%) | 0 (0.0%) |
| Information | 13 (100.0%) | 0 (0.0%) |
| Finance & Insurance | 18 (19.2%) | 76 (80.8%) |
| Real Estate, Rental & Leasing | 0 (0.0%) | 49 (100.0%) |
| Professional & Scientific | 24 (48.0%) | 26 (52.0%) |
| Enterprise Management | 0 (0.0%) | 0 (0.0%) |
| Administrative & Support | 47 (100.0%) | 0 (0.0%) |
| Educational Services | 31 (45.6%) | 37 (54.4%) |
| Health Care & Social Assistance | 59 (28.1%) | 151 (71.9%) |
| Arts, Entertainment & Recreation | 0 (0.0%) | 0 (0.0%) |
| Accommodation & Food Services | 29 (21.8%) | 104 (78.2%) |
| Public Administration | 11 (55.0%) | 9 (45.0%) |
| Total | 377 (35.3%) | 692 (64.7%) |
Education in Silver Lake
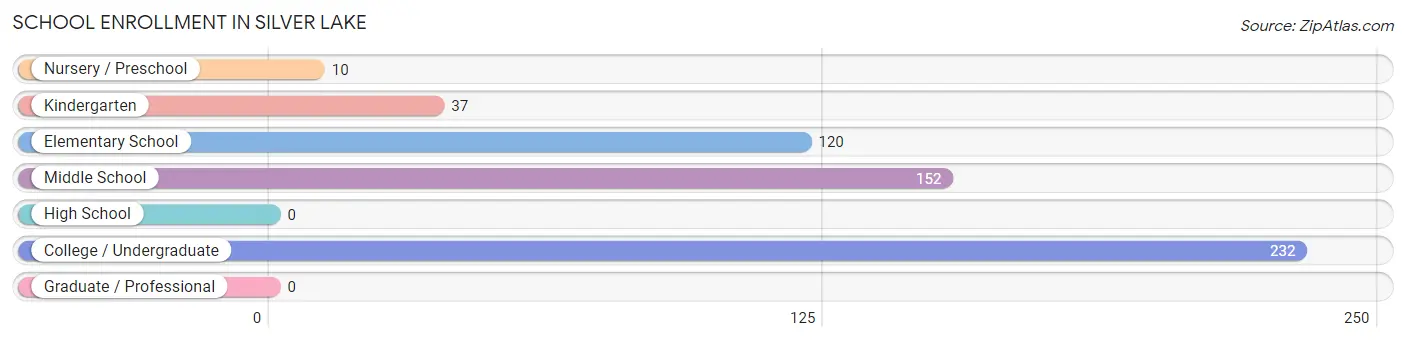
School Enrollment in Silver Lake
The most common levels of schooling among the 551 students in Silver Lake are college / undergraduate (232 | 42.1%), middle school (152 | 27.6%), and elementary school (120 | 21.8%).
| School Level | # Students | % Students |
| Nursery / Preschool | 10 | 1.8% |
| Kindergarten | 37 | 6.7% |
| Elementary School | 120 | 21.8% |
| Middle School | 152 | 27.6% |
| High School | 0 | 0.0% |
| College / Undergraduate | 232 | 42.1% |
| Graduate / Professional | 0 | 0.0% |
| Total | 551 | 100.0% |
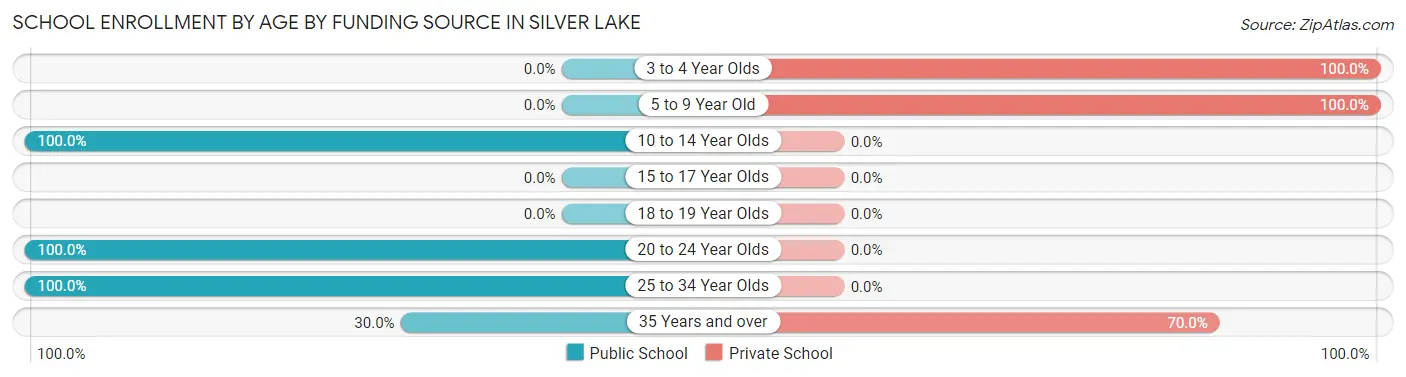
School Enrollment by Age by Funding Source in Silver Lake
Out of a total of 551 students who are enrolled in schools in Silver Lake, 216 (39.2%) attend a private institution, while the remaining 335 (60.8%) are enrolled in public schools. The age group of 3 to 4 year olds has the highest likelihood of being enrolled in private schools, with 47 (100.0% in the age bracket) enrolled. Conversely, the age group of 10 to 14 year olds has the lowest likelihood of being enrolled in a private school, with 152 (100.0% in the age bracket) attending a public institution.
| Age Bracket | Public School | Private School |
| 3 to 4 Year Olds | 0 (0.0%) | 47 (100.0%) |
| 5 to 9 Year Old | 0 (0.0%) | 120 (100.0%) |
| 10 to 14 Year Olds | 152 (100.0%) | 0 (0.0%) |
| 15 to 17 Year Olds | 0 (0.0%) | 0 (0.0%) |
| 18 to 19 Year Olds | 0 (0.0%) | 0 (0.0%) |
| 20 to 24 Year Olds | 107 (100.0%) | 0 (0.0%) |
| 25 to 34 Year Olds | 55 (100.0%) | 0 (0.0%) |
| 35 Years and over | 21 (30.0%) | 49 (70.0%) |
| Total | 335 (60.8%) | 216 (39.2%) |
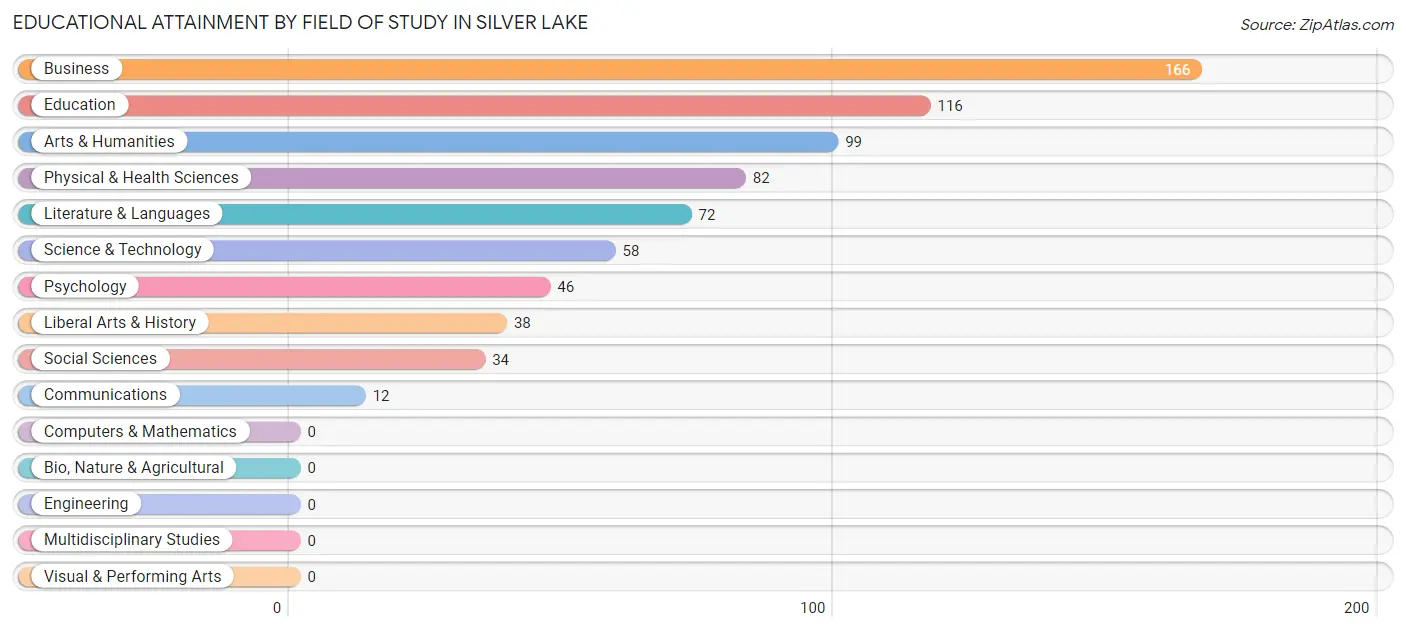
Educational Attainment by Field of Study in Silver Lake
Business (166 | 23.0%), education (116 | 16.0%), arts & humanities (99 | 13.7%), physical & health sciences (82 | 11.3%), and literature & languages (72 | 10.0%) are the most common fields of study among 723 individuals in Silver Lake who have obtained a bachelor's degree or higher.
| Field of Study | # Graduates | % Graduates |
| Computers & Mathematics | 0 | 0.0% |
| Bio, Nature & Agricultural | 0 | 0.0% |
| Physical & Health Sciences | 82 | 11.3% |
| Psychology | 46 | 6.4% |
| Social Sciences | 34 | 4.7% |
| Engineering | 0 | 0.0% |
| Multidisciplinary Studies | 0 | 0.0% |
| Science & Technology | 58 | 8.0% |
| Business | 166 | 23.0% |
| Education | 116 | 16.0% |
| Literature & Languages | 72 | 10.0% |
| Liberal Arts & History | 38 | 5.3% |
| Visual & Performing Arts | 0 | 0.0% |
| Communications | 12 | 1.7% |
| Arts & Humanities | 99 | 13.7% |
| Total | 723 | 100.0% |
Transportation & Commute in Silver Lake
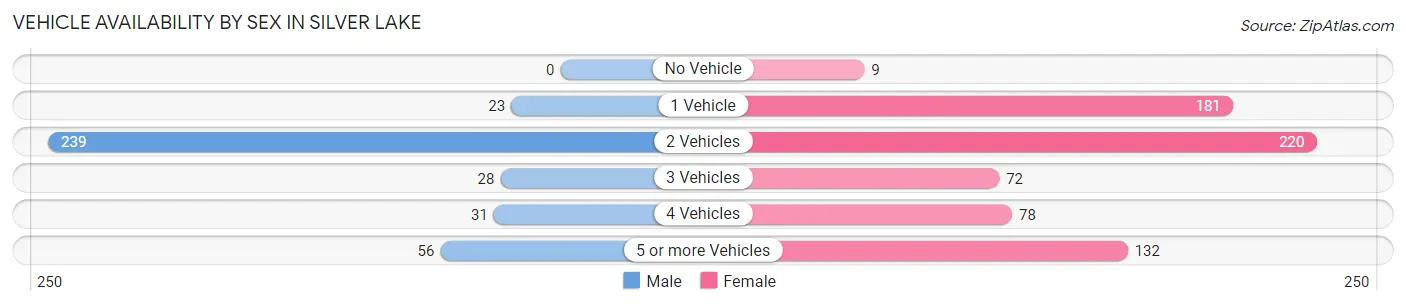
Vehicle Availability by Sex in Silver Lake
The most prevalent vehicle ownership categories in Silver Lake are males with 2 vehicles (239, accounting for 63.4%) and females with 2 vehicles (220, making up 34.5%).
| Vehicles Available | Male | Female |
| No Vehicle | 0 (0.0%) | 9 (1.3%) |
| 1 Vehicle | 23 (6.1%) | 181 (26.2%) |
| 2 Vehicles | 239 (63.4%) | 220 (31.8%) |
| 3 Vehicles | 28 (7.4%) | 72 (10.4%) |
| 4 Vehicles | 31 (8.2%) | 78 (11.3%) |
| 5 or more Vehicles | 56 (14.8%) | 132 (19.1%) |
| Total | 377 (100.0%) | 692 (100.0%) |
Commute Time in Silver Lake
The most frequently occuring commute durations in Silver Lake are 10 to 14 minutes (188 commuters, 20.0%), 20 to 24 minutes (177 commuters, 18.9%), and 5 to 9 minutes (133 commuters, 14.2%).
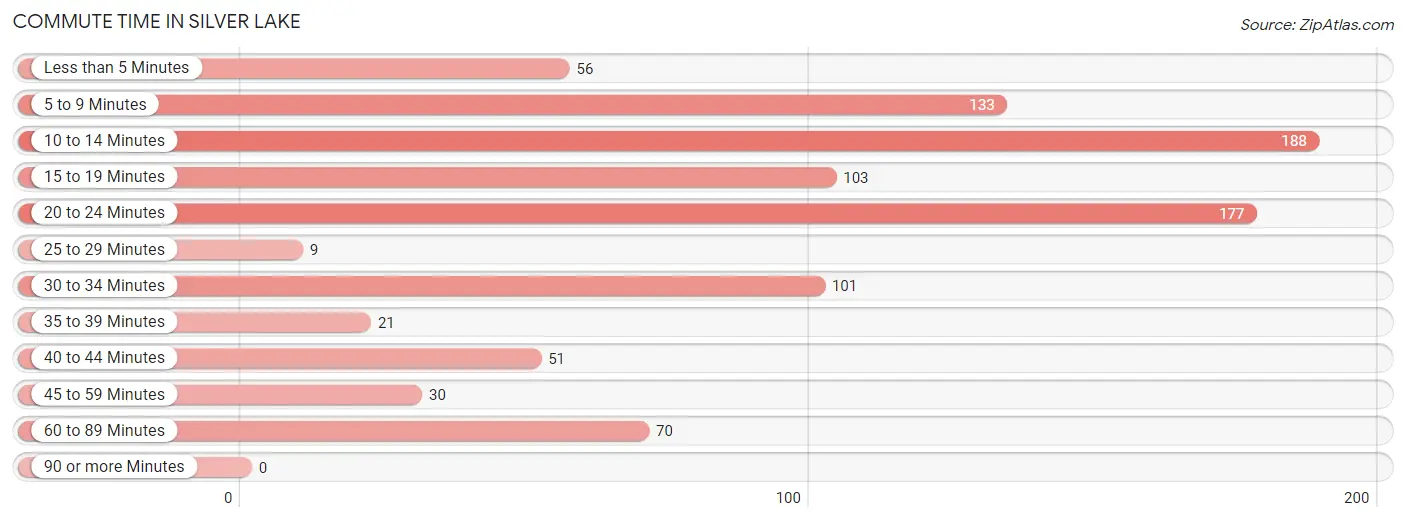
| Commute Time | # Commuters | % Commuters |
| Less than 5 Minutes | 56 | 6.0% |
| 5 to 9 Minutes | 133 | 14.2% |
| 10 to 14 Minutes | 188 | 20.0% |
| 15 to 19 Minutes | 103 | 11.0% |
| 20 to 24 Minutes | 177 | 18.9% |
| 25 to 29 Minutes | 9 | 1.0% |
| 30 to 34 Minutes | 101 | 10.8% |
| 35 to 39 Minutes | 21 | 2.2% |
| 40 to 44 Minutes | 51 | 5.4% |
| 45 to 59 Minutes | 30 | 3.2% |
| 60 to 89 Minutes | 70 | 7.4% |
| 90 or more Minutes | 0 | 0.0% |
Commute Time by Sex in Silver Lake
The most common commute times in Silver Lake are 10 to 14 minutes (85 commuters, 27.2%) for males and 20 to 24 minutes (164 commuters, 26.2%) for females.
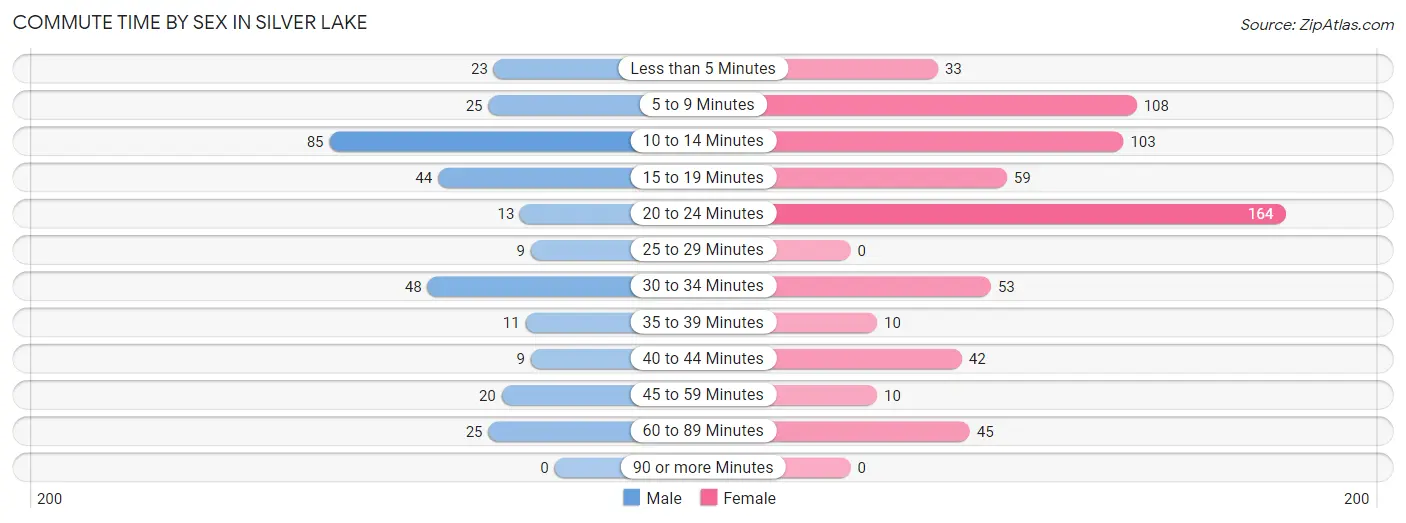
| Commute Time | Male | Female |
| Less than 5 Minutes | 23 (7.4%) | 33 (5.3%) |
| 5 to 9 Minutes | 25 (8.0%) | 108 (17.2%) |
| 10 to 14 Minutes | 85 (27.2%) | 103 (16.4%) |
| 15 to 19 Minutes | 44 (14.1%) | 59 (9.4%) |
| 20 to 24 Minutes | 13 (4.2%) | 164 (26.2%) |
| 25 to 29 Minutes | 9 (2.9%) | 0 (0.0%) |
| 30 to 34 Minutes | 48 (15.4%) | 53 (8.5%) |
| 35 to 39 Minutes | 11 (3.5%) | 10 (1.6%) |
| 40 to 44 Minutes | 9 (2.9%) | 42 (6.7%) |
| 45 to 59 Minutes | 20 (6.4%) | 10 (1.6%) |
| 60 to 89 Minutes | 25 (8.0%) | 45 (7.2%) |
| 90 or more Minutes | 0 (0.0%) | 0 (0.0%) |
Time of Departure to Work by Sex in Silver Lake
The most frequent times of departure to work in Silver Lake are 7:00 AM to 7:29 AM (89, 28.5%) for males and 9:00 AM to 9:59 AM (133, 21.2%) for females.
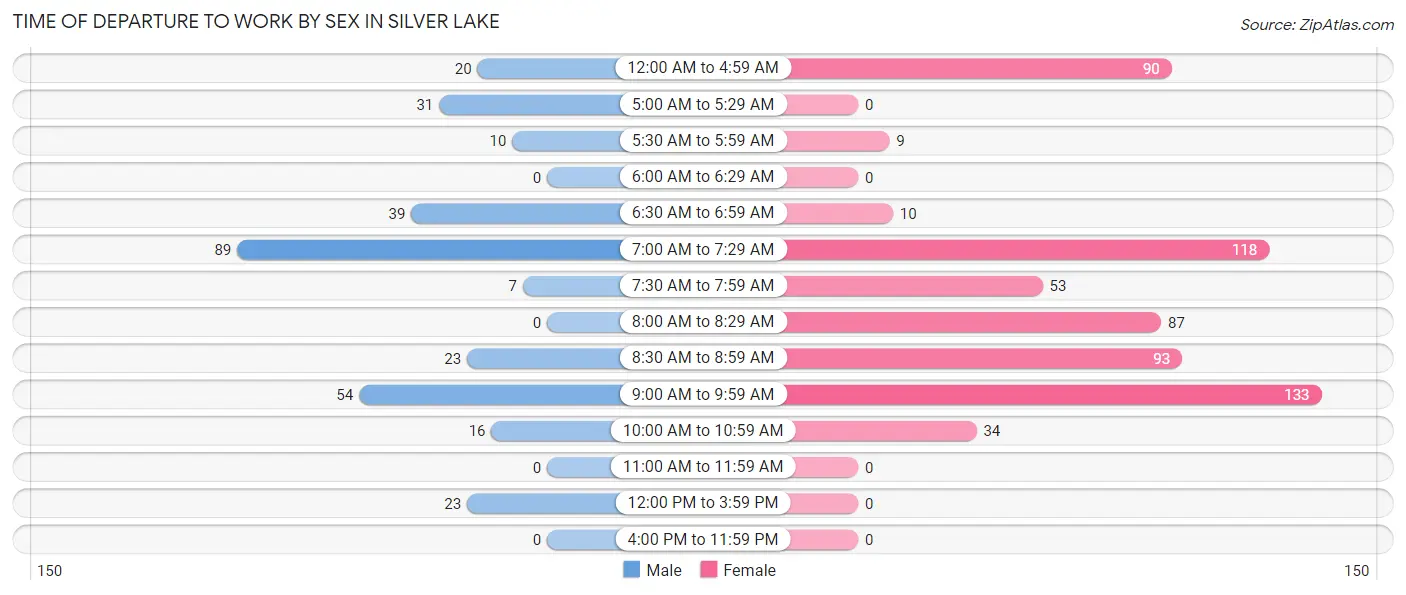
| Time of Departure | Male | Female |
| 12:00 AM to 4:59 AM | 20 (6.4%) | 90 (14.3%) |
| 5:00 AM to 5:29 AM | 31 (9.9%) | 0 (0.0%) |
| 5:30 AM to 5:59 AM | 10 (3.2%) | 9 (1.4%) |
| 6:00 AM to 6:29 AM | 0 (0.0%) | 0 (0.0%) |
| 6:30 AM to 6:59 AM | 39 (12.5%) | 10 (1.6%) |
| 7:00 AM to 7:29 AM | 89 (28.5%) | 118 (18.8%) |
| 7:30 AM to 7:59 AM | 7 (2.2%) | 53 (8.5%) |
| 8:00 AM to 8:29 AM | 0 (0.0%) | 87 (13.9%) |
| 8:30 AM to 8:59 AM | 23 (7.4%) | 93 (14.8%) |
| 9:00 AM to 9:59 AM | 54 (17.3%) | 133 (21.2%) |
| 10:00 AM to 10:59 AM | 16 (5.1%) | 34 (5.4%) |
| 11:00 AM to 11:59 AM | 0 (0.0%) | 0 (0.0%) |
| 12:00 PM to 3:59 PM | 23 (7.4%) | 0 (0.0%) |
| 4:00 PM to 11:59 PM | 0 (0.0%) | 0 (0.0%) |
| Total | 312 (100.0%) | 627 (100.0%) |
Housing Occupancy in Silver Lake
Occupancy by Ownership in Silver Lake
Of the total 924 dwellings in Silver Lake, owner-occupied units account for 841 (91.0%), while renter-occupied units make up 83 (9.0%).
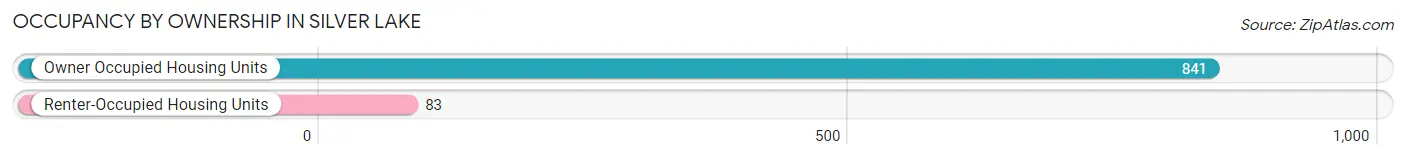
| Occupancy | # Housing Units | % Housing Units |
| Owner Occupied Housing Units | 841 | 91.0% |
| Renter-Occupied Housing Units | 83 | 9.0% |
| Total Occupied Housing Units | 924 | 100.0% |
Occupancy by Household Size in Silver Lake
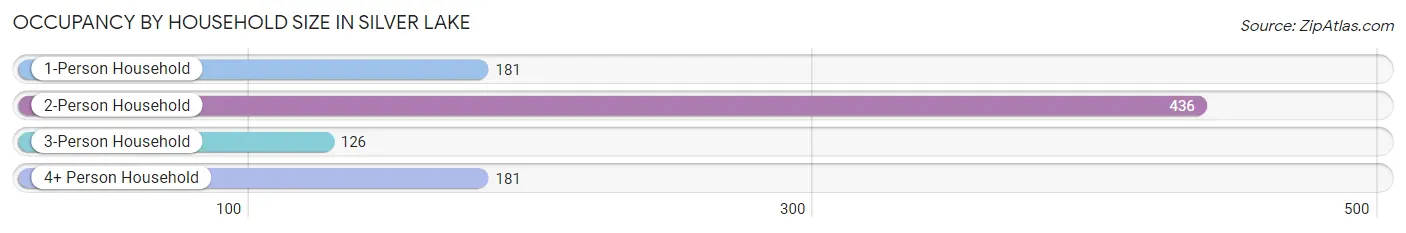
| Household Size | # Housing Units | % Housing Units |
| 1-Person Household | 181 | 19.6% |
| 2-Person Household | 436 | 47.2% |
| 3-Person Household | 126 | 13.6% |
| 4+ Person Household | 181 | 19.6% |
| Total Housing Units | 924 | 100.0% |
Occupancy by Ownership by Household Size in Silver Lake
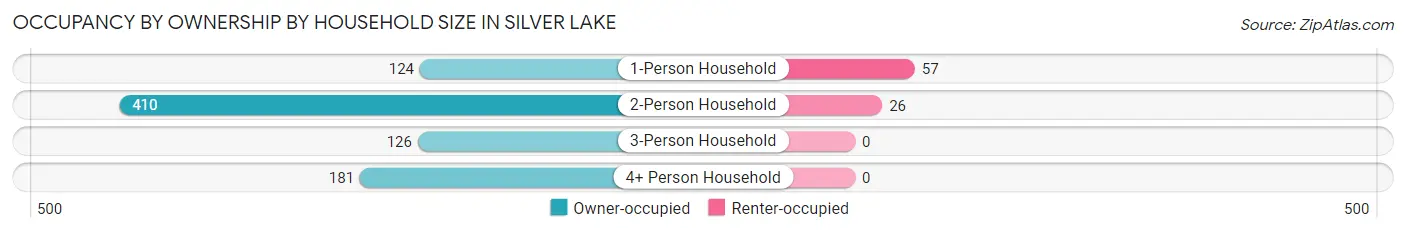
| Household Size | Owner-occupied | Renter-occupied |
| 1-Person Household | 124 (68.5%) | 57 (31.5%) |
| 2-Person Household | 410 (94.0%) | 26 (6.0%) |
| 3-Person Household | 126 (100.0%) | 0 (0.0%) |
| 4+ Person Household | 181 (100.0%) | 0 (0.0%) |
| Total Housing Units | 841 (91.0%) | 83 (9.0%) |
Occupancy by Educational Attainment in Silver Lake
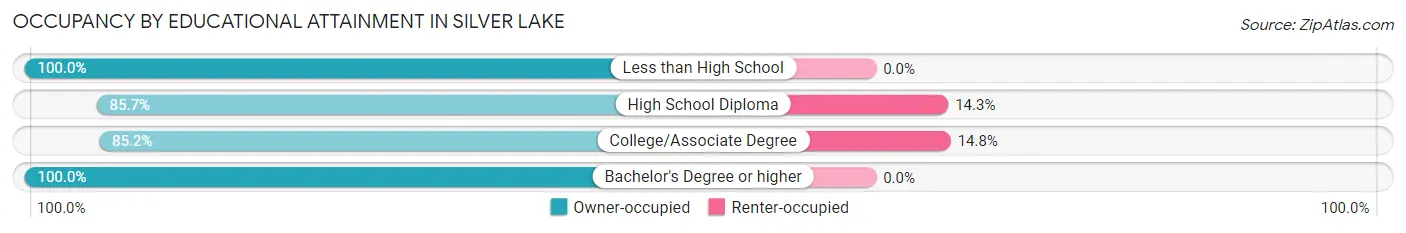
| Household Size | Owner-occupied | Renter-occupied |
| Less than High School | 35 (100.0%) | 0 (0.0%) |
| High School Diploma | 168 (85.7%) | 28 (14.3%) |
| College/Associate Degree | 317 (85.2%) | 55 (14.8%) |
| Bachelor's Degree or higher | 321 (100.0%) | 0 (0.0%) |
Occupancy by Age of Householder in Silver Lake
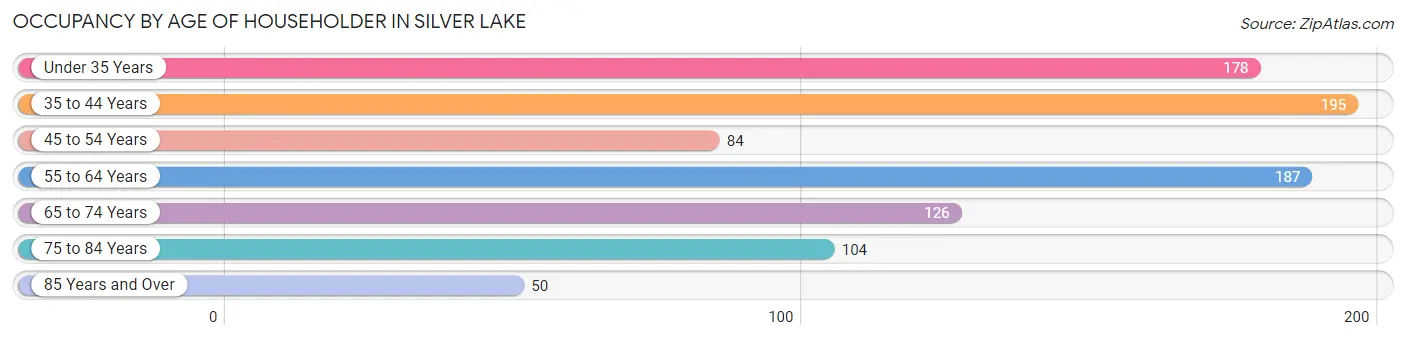
| Age Bracket | # Households | % Households |
| Under 35 Years | 178 | 19.3% |
| 35 to 44 Years | 195 | 21.1% |
| 45 to 54 Years | 84 | 9.1% |
| 55 to 64 Years | 187 | 20.2% |
| 65 to 74 Years | 126 | 13.6% |
| 75 to 84 Years | 104 | 11.3% |
| 85 Years and Over | 50 | 5.4% |
| Total | 924 | 100.0% |
Housing Finances in Silver Lake
Median Income by Occupancy in Silver Lake
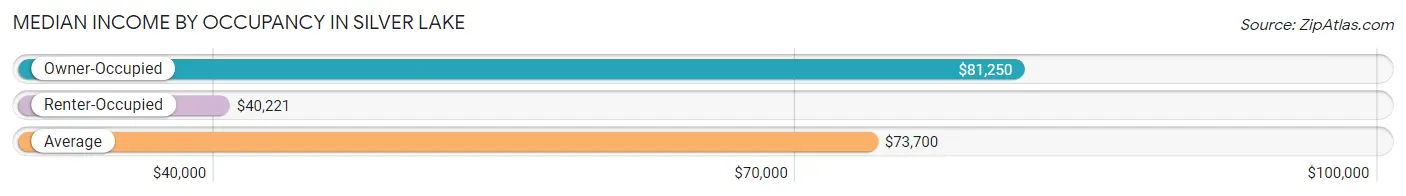
| Occupancy Type | # Households | Median Income |
| Owner-Occupied | 841 (91.0%) | $81,250 |
| Renter-Occupied | 83 (9.0%) | $40,221 |
| Average | 924 (100.0%) | $73,700 |
Occupancy by Householder Income Bracket in Silver Lake
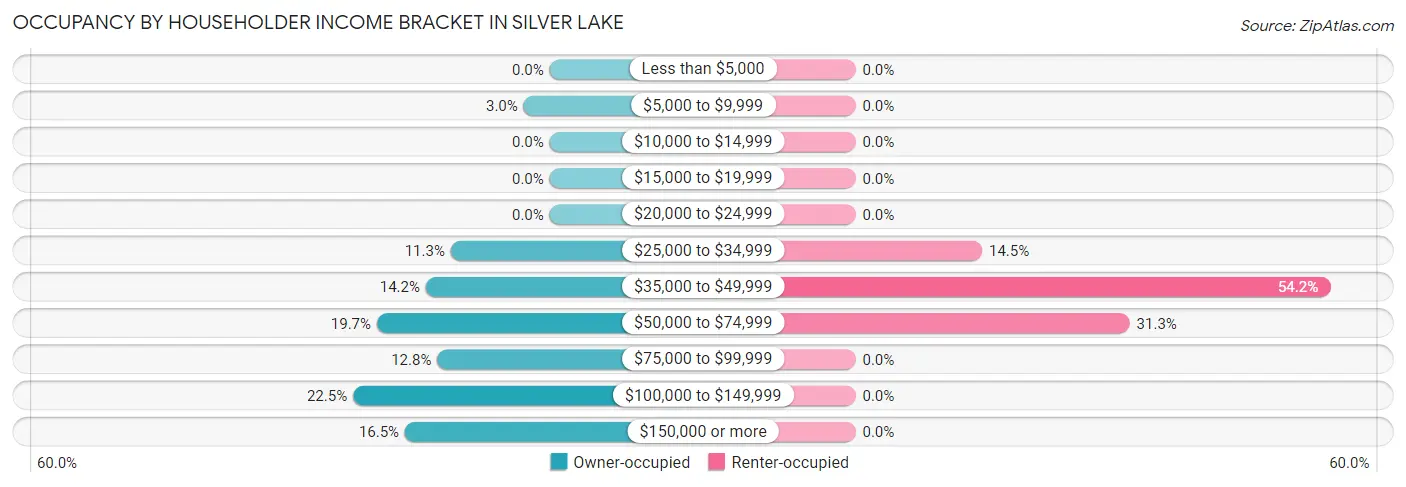
| Income Bracket | Owner-occupied | Renter-occupied |
| Less than $5,000 | 0 (0.0%) | 0 (0.0%) |
| $5,000 to $9,999 | 25 (3.0%) | 0 (0.0%) |
| $10,000 to $14,999 | 0 (0.0%) | 0 (0.0%) |
| $15,000 to $19,999 | 0 (0.0%) | 0 (0.0%) |
| $20,000 to $24,999 | 0 (0.0%) | 0 (0.0%) |
| $25,000 to $34,999 | 95 (11.3%) | 12 (14.5%) |
| $35,000 to $49,999 | 119 (14.1%) | 45 (54.2%) |
| $50,000 to $74,999 | 166 (19.7%) | 26 (31.3%) |
| $75,000 to $99,999 | 108 (12.8%) | 0 (0.0%) |
| $100,000 to $149,999 | 189 (22.5%) | 0 (0.0%) |
| $150,000 or more | 139 (16.5%) | 0 (0.0%) |
| Total | 841 (100.0%) | 83 (100.0%) |
Monthly Housing Cost Tiers in Silver Lake
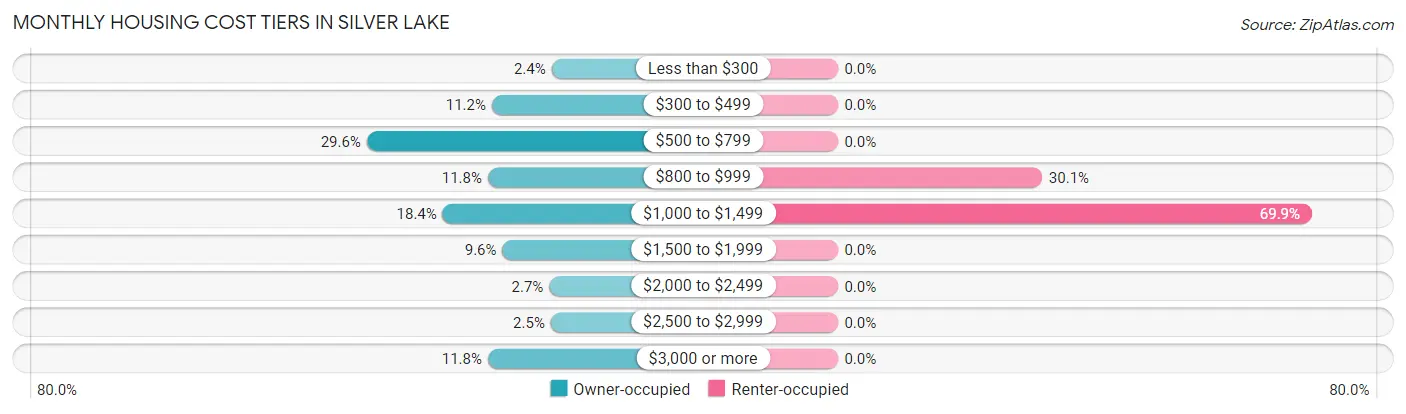
| Monthly Cost | Owner-occupied | Renter-occupied |
| Less than $300 | 20 (2.4%) | 0 (0.0%) |
| $300 to $499 | 94 (11.2%) | 0 (0.0%) |
| $500 to $799 | 249 (29.6%) | 0 (0.0%) |
| $800 to $999 | 99 (11.8%) | 25 (30.1%) |
| $1,000 to $1,499 | 155 (18.4%) | 58 (69.9%) |
| $1,500 to $1,999 | 81 (9.6%) | 0 (0.0%) |
| $2,000 to $2,499 | 23 (2.7%) | 0 (0.0%) |
| $2,500 to $2,999 | 21 (2.5%) | 0 (0.0%) |
| $3,000 or more | 99 (11.8%) | 0 (0.0%) |
| Total | 841 (100.0%) | 83 (100.0%) |
Physical Housing Characteristics in Silver Lake
Housing Structures in Silver Lake
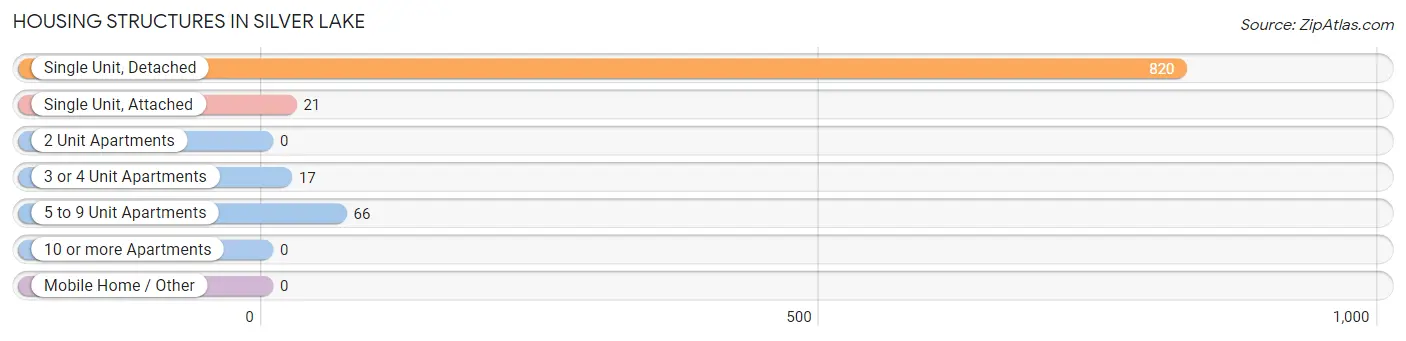
| Structure Type | # Housing Units | % Housing Units |
| Single Unit, Detached | 820 | 88.7% |
| Single Unit, Attached | 21 | 2.3% |
| 2 Unit Apartments | 0 | 0.0% |
| 3 or 4 Unit Apartments | 17 | 1.8% |
| 5 to 9 Unit Apartments | 66 | 7.1% |
| 10 or more Apartments | 0 | 0.0% |
| Mobile Home / Other | 0 | 0.0% |
| Total | 924 | 100.0% |
Housing Structures by Occupancy in Silver Lake
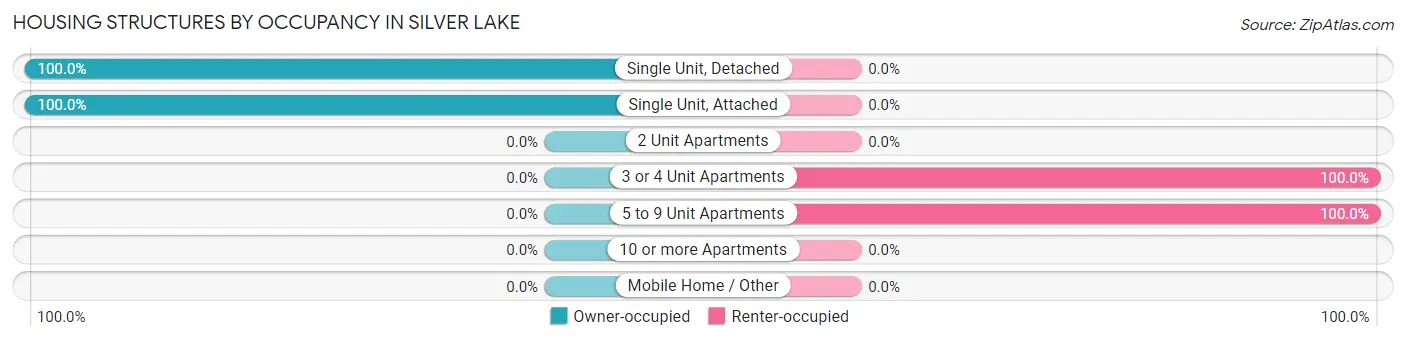
| Structure Type | Owner-occupied | Renter-occupied |
| Single Unit, Detached | 820 (100.0%) | 0 (0.0%) |
| Single Unit, Attached | 21 (100.0%) | 0 (0.0%) |
| 2 Unit Apartments | 0 (0.0%) | 0 (0.0%) |
| 3 or 4 Unit Apartments | 0 (0.0%) | 17 (100.0%) |
| 5 to 9 Unit Apartments | 0 (0.0%) | 66 (100.0%) |
| 10 or more Apartments | 0 (0.0%) | 0 (0.0%) |
| Mobile Home / Other | 0 (0.0%) | 0 (0.0%) |
| Total | 841 (91.0%) | 83 (9.0%) |
Housing Structures by Number of Rooms in Silver Lake
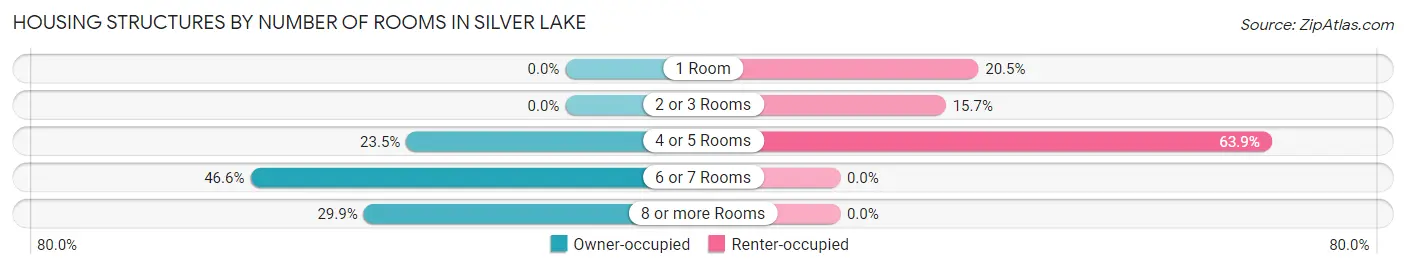
| Number of Rooms | Owner-occupied | Renter-occupied |
| 1 Room | 0 (0.0%) | 17 (20.5%) |
| 2 or 3 Rooms | 0 (0.0%) | 13 (15.7%) |
| 4 or 5 Rooms | 198 (23.5%) | 53 (63.9%) |
| 6 or 7 Rooms | 392 (46.6%) | 0 (0.0%) |
| 8 or more Rooms | 251 (29.8%) | 0 (0.0%) |
| Total | 841 (100.0%) | 83 (100.0%) |
Housing Structure by Heating Type in Silver Lake
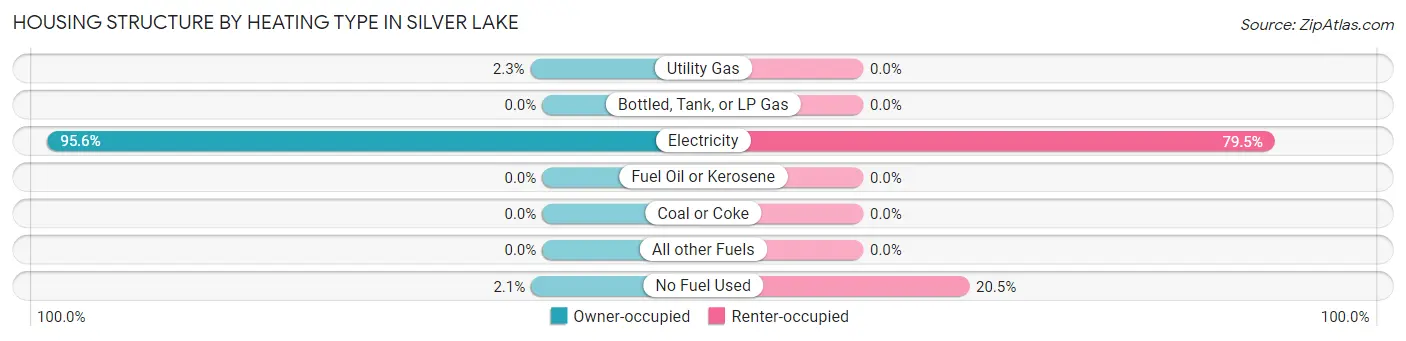
| Heating Type | Owner-occupied | Renter-occupied |
| Utility Gas | 19 (2.3%) | 0 (0.0%) |
| Bottled, Tank, or LP Gas | 0 (0.0%) | 0 (0.0%) |
| Electricity | 804 (95.6%) | 66 (79.5%) |
| Fuel Oil or Kerosene | 0 (0.0%) | 0 (0.0%) |
| Coal or Coke | 0 (0.0%) | 0 (0.0%) |
| All other Fuels | 0 (0.0%) | 0 (0.0%) |
| No Fuel Used | 18 (2.1%) | 17 (20.5%) |
| Total | 841 (100.0%) | 83 (100.0%) |
Household Vehicle Usage in Silver Lake
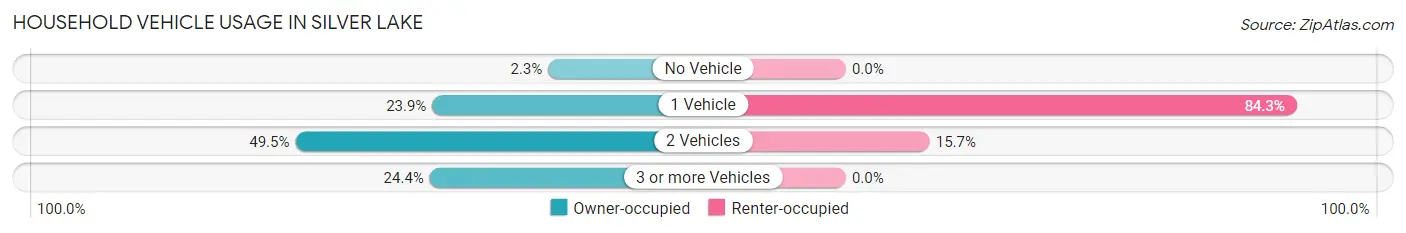
| Vehicles per Household | Owner-occupied | Renter-occupied |
| No Vehicle | 19 (2.3%) | 0 (0.0%) |
| 1 Vehicle | 201 (23.9%) | 70 (84.3%) |
| 2 Vehicles | 416 (49.5%) | 13 (15.7%) |
| 3 or more Vehicles | 205 (24.4%) | 0 (0.0%) |
| Total | 841 (100.0%) | 83 (100.0%) |
Real Estate & Mortgages in Silver Lake
Real Estate and Mortgage Overview in Silver Lake
| Characteristic | Without Mortgage | With Mortgage |
| Housing Units | 415 | 426 |
| Median Property Value | $273,000 | $295,900 |
| Median Household Income | $84,654 | $64 |
| Monthly Housing Costs | $602 | $99 |
| Real Estate Taxes | $2,379 | $0 |
Property Value by Mortgage Status in Silver Lake
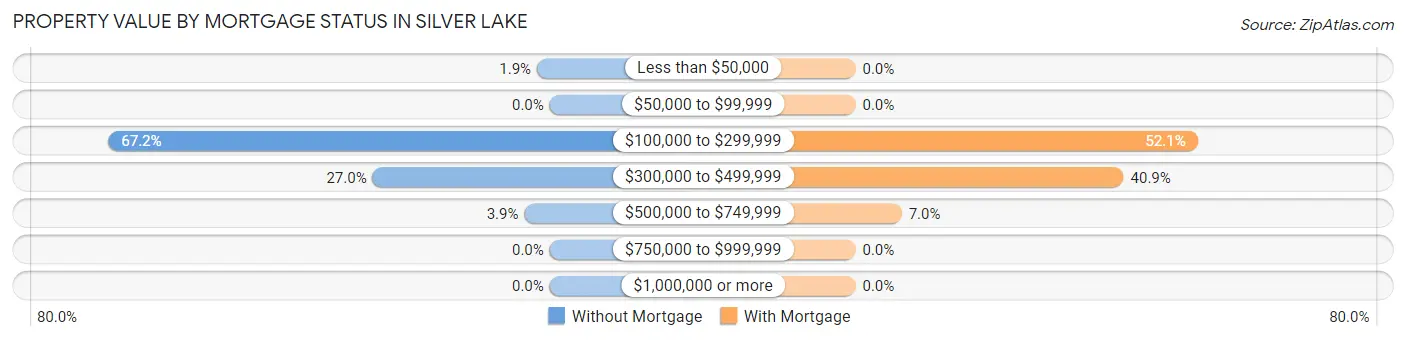
| Property Value | Without Mortgage | With Mortgage |
| Less than $50,000 | 8 (1.9%) | 0 (0.0%) |
| $50,000 to $99,999 | 0 (0.0%) | 0 (0.0%) |
| $100,000 to $299,999 | 279 (67.2%) | 222 (52.1%) |
| $300,000 to $499,999 | 112 (27.0%) | 174 (40.8%) |
| $500,000 to $749,999 | 16 (3.9%) | 30 (7.0%) |
| $750,000 to $999,999 | 0 (0.0%) | 0 (0.0%) |
| $1,000,000 or more | 0 (0.0%) | 0 (0.0%) |
| Total | 415 (100.0%) | 426 (100.0%) |
Household Income by Mortgage Status in Silver Lake
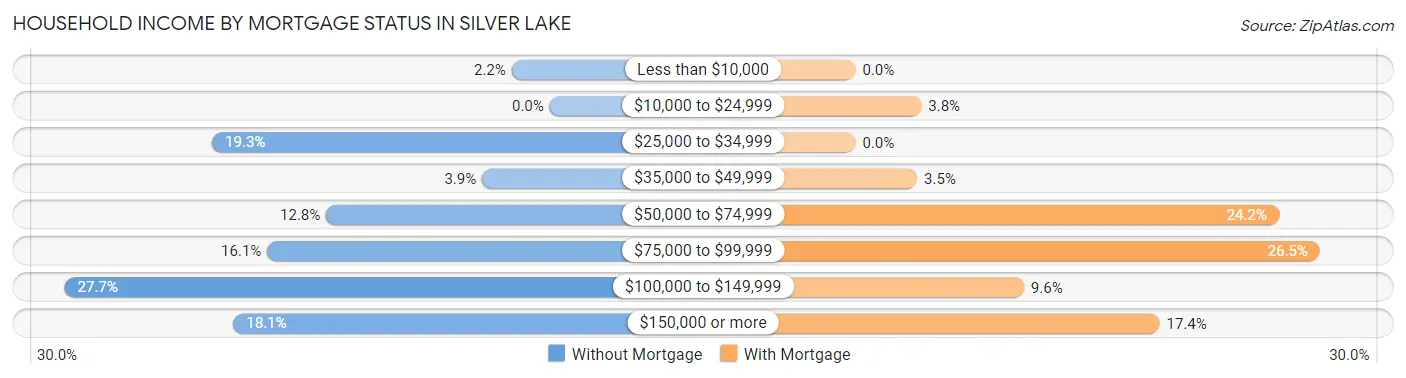
| Household Income | Without Mortgage | With Mortgage |
| Less than $10,000 | 9 (2.2%) | 0 (0.0%) |
| $10,000 to $24,999 | 0 (0.0%) | 16 (3.8%) |
| $25,000 to $34,999 | 80 (19.3%) | 0 (0.0%) |
| $35,000 to $49,999 | 16 (3.9%) | 15 (3.5%) |
| $50,000 to $74,999 | 53 (12.8%) | 103 (24.2%) |
| $75,000 to $99,999 | 67 (16.1%) | 113 (26.5%) |
| $100,000 to $149,999 | 115 (27.7%) | 41 (9.6%) |
| $150,000 or more | 75 (18.1%) | 74 (17.4%) |
| Total | 415 (100.0%) | 426 (100.0%) |
Property Value to Household Income Ratio in Silver Lake
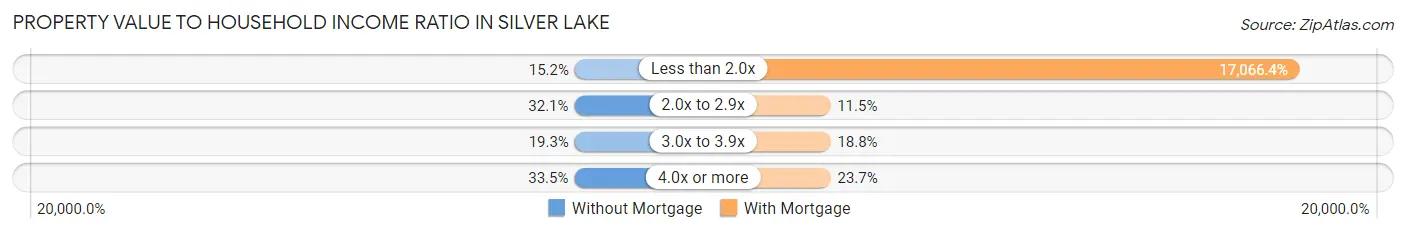
| Value-to-Income Ratio | Without Mortgage | With Mortgage |
| Less than 2.0x | 63 (15.2%) | 72,703 (17,066.4%) |
| 2.0x to 2.9x | 133 (32.1%) | 49 (11.5%) |
| 3.0x to 3.9x | 80 (19.3%) | 80 (18.8%) |
| 4.0x or more | 139 (33.5%) | 101 (23.7%) |
| Total | 415 (100.0%) | 426 (100.0%) |
Real Estate Taxes by Mortgage Status in Silver Lake
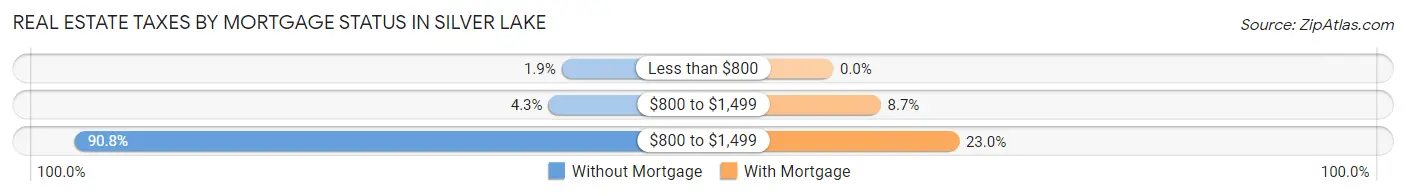
| Property Taxes | Without Mortgage | With Mortgage |
| Less than $800 | 8 (1.9%) | 0 (0.0%) |
| $800 to $1,499 | 18 (4.3%) | 37 (8.7%) |
| $800 to $1,499 | 377 (90.8%) | 98 (23.0%) |
| Total | 415 (100.0%) | 426 (100.0%) |
Health & Disability in Silver Lake
Health Insurance Coverage by Age in Silver Lake
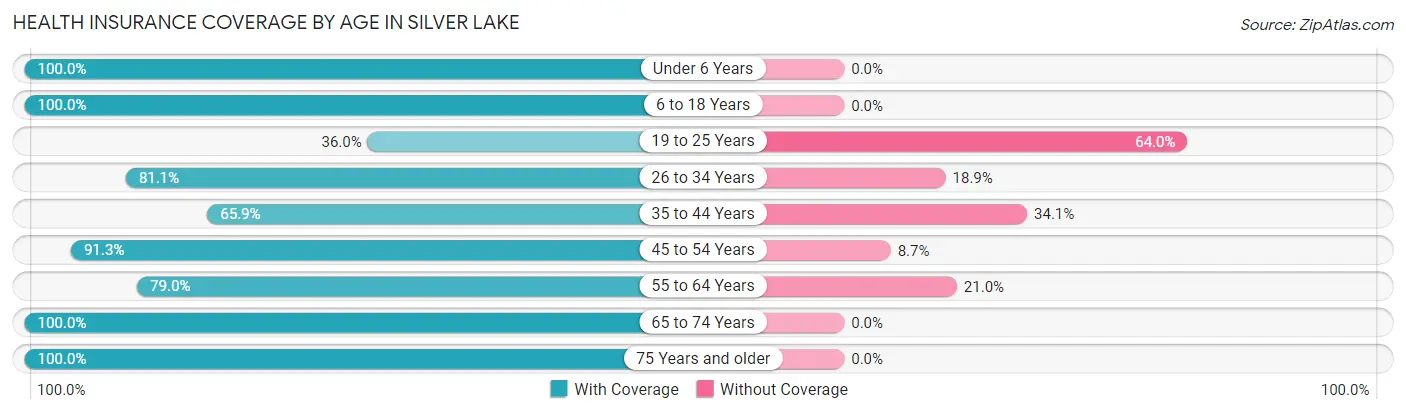
| Age Bracket | With Coverage | Without Coverage |
| Under 6 Years | 191 (100.0%) | 0 (0.0%) |
| 6 to 18 Years | 296 (100.0%) | 0 (0.0%) |
| 19 to 25 Years | 71 (36.0%) | 126 (64.0%) |
| 26 to 34 Years | 322 (81.1%) | 75 (18.9%) |
| 35 to 44 Years | 203 (65.9%) | 105 (34.1%) |
| 45 to 54 Years | 116 (91.3%) | 11 (8.7%) |
| 55 to 64 Years | 301 (79.0%) | 80 (21.0%) |
| 65 to 74 Years | 367 (100.0%) | 0 (0.0%) |
| 75 Years and older | 260 (100.0%) | 0 (0.0%) |
| Total | 2,127 (84.3%) | 397 (15.7%) |
Health Insurance Coverage by Citizenship Status in Silver Lake
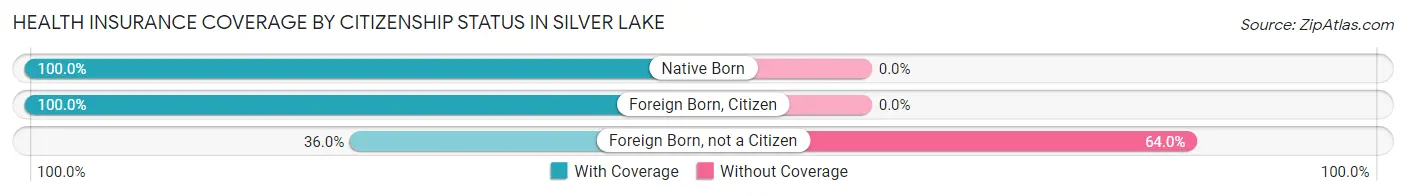
| Citizenship Status | With Coverage | Without Coverage |
| Native Born | 191 (100.0%) | 0 (0.0%) |
| Foreign Born, Citizen | 296 (100.0%) | 0 (0.0%) |
| Foreign Born, not a Citizen | 71 (36.0%) | 126 (64.0%) |
Health Insurance Coverage by Household Income in Silver Lake
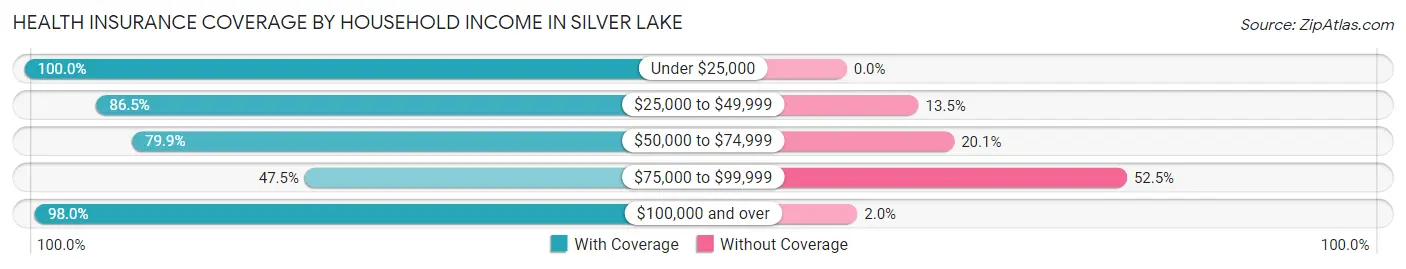
| Household Income | With Coverage | Without Coverage |
| Under $25,000 | 25 (100.0%) | 0 (0.0%) |
| $25,000 to $49,999 | 617 (86.5%) | 96 (13.5%) |
| $50,000 to $74,999 | 365 (79.9%) | 92 (20.1%) |
| $75,000 to $99,999 | 172 (47.5%) | 190 (52.5%) |
| $100,000 and over | 946 (98.0%) | 19 (2.0%) |
Public vs Private Health Insurance Coverage by Age in Silver Lake
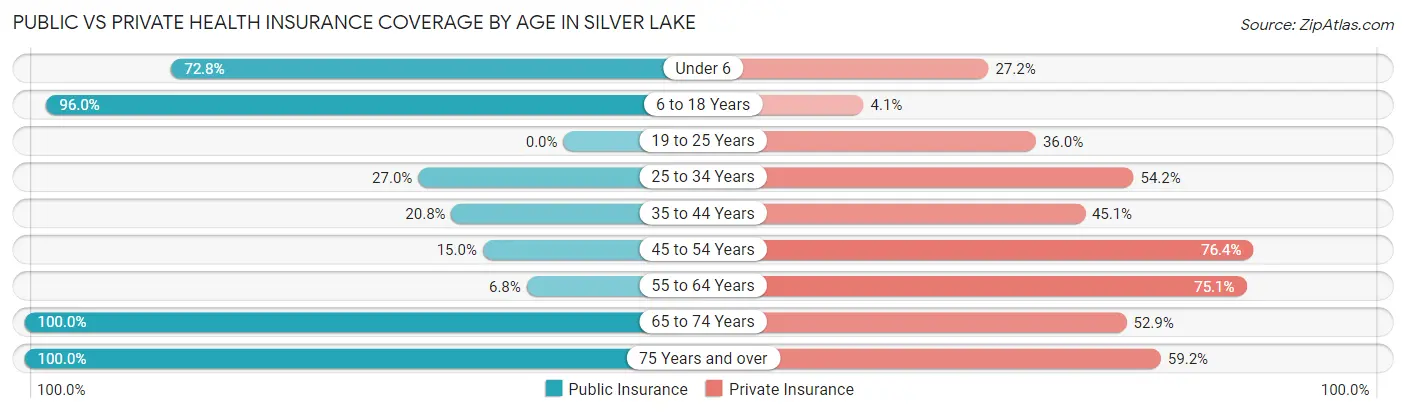
| Age Bracket | Public Insurance | Private Insurance |
| Under 6 | 139 (72.8%) | 52 (27.2%) |
| 6 to 18 Years | 284 (96.0%) | 12 (4.1%) |
| 19 to 25 Years | 0 (0.0%) | 71 (36.0%) |
| 25 to 34 Years | 107 (27.0%) | 215 (54.2%) |
| 35 to 44 Years | 64 (20.8%) | 139 (45.1%) |
| 45 to 54 Years | 19 (15.0%) | 97 (76.4%) |
| 55 to 64 Years | 26 (6.8%) | 286 (75.1%) |
| 65 to 74 Years | 367 (100.0%) | 194 (52.9%) |
| 75 Years and over | 260 (100.0%) | 154 (59.2%) |
| Total | 1,266 (50.2%) | 1,220 (48.3%) |
Disability Status by Sex by Age in Silver Lake
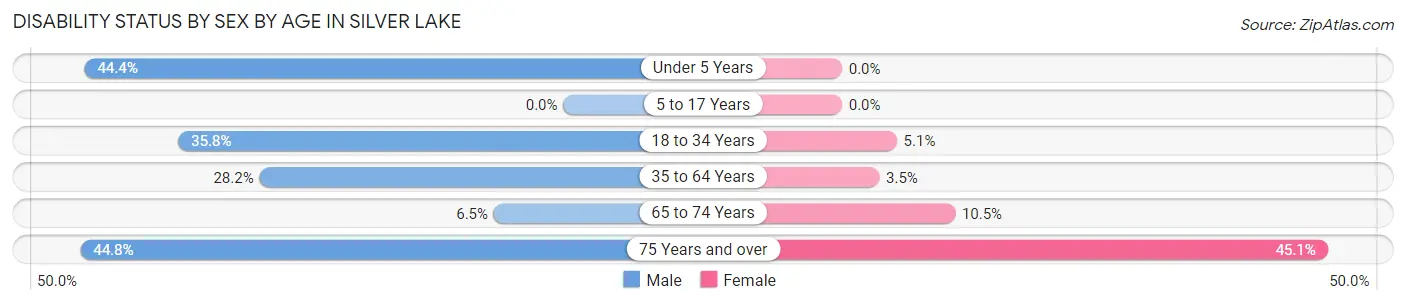
| Age Bracket | Male | Female |
| Under 5 Years | 12 (44.4%) | 0 (0.0%) |
| 5 to 17 Years | 0 (0.0%) | 0 (0.0%) |
| 18 to 34 Years | 79 (35.7%) | 19 (5.1%) |
| 35 to 64 Years | 108 (28.2%) | 15 (3.5%) |
| 65 to 74 Years | 12 (6.5%) | 19 (10.5%) |
| 75 Years and over | 39 (44.8%) | 78 (45.1%) |
Disability Class by Sex by Age in Silver Lake
Disability Class: Hearing Difficulty
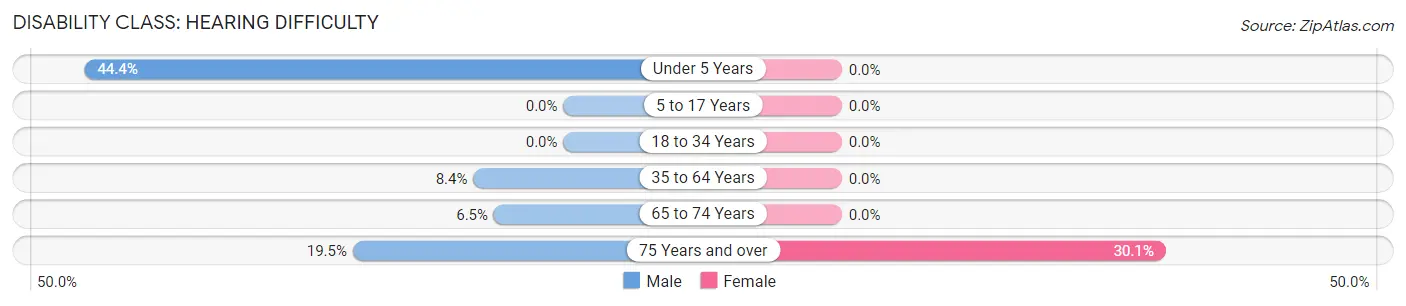
| Age Bracket | Male | Female |
| Under 5 Years | 12 (44.4%) | 0 (0.0%) |
| 5 to 17 Years | 0 (0.0%) | 0 (0.0%) |
| 18 to 34 Years | 0 (0.0%) | 0 (0.0%) |
| 35 to 64 Years | 32 (8.4%) | 0 (0.0%) |
| 65 to 74 Years | 12 (6.5%) | 0 (0.0%) |
| 75 Years and over | 17 (19.5%) | 52 (30.1%) |
Disability Class: Vision Difficulty
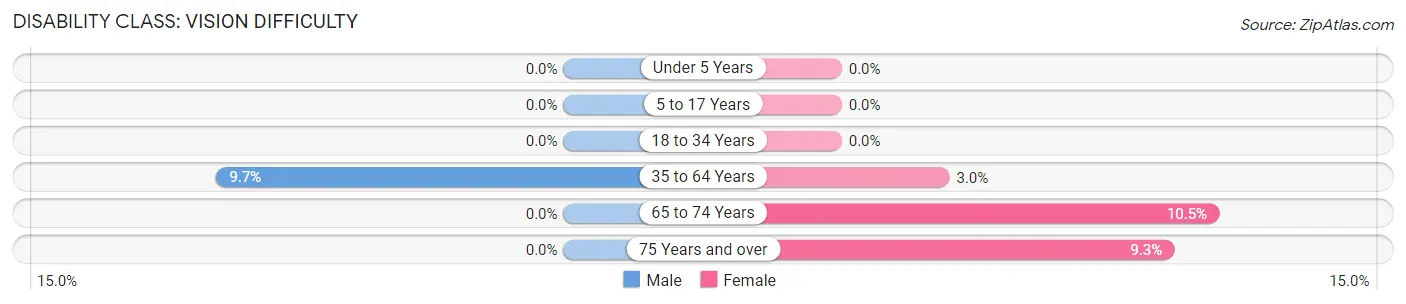
| Age Bracket | Male | Female |
| Under 5 Years | 0 (0.0%) | 0 (0.0%) |
| 5 to 17 Years | 0 (0.0%) | 0 (0.0%) |
| 18 to 34 Years | 0 (0.0%) | 0 (0.0%) |
| 35 to 64 Years | 37 (9.7%) | 13 (3.0%) |
| 65 to 74 Years | 0 (0.0%) | 19 (10.5%) |
| 75 Years and over | 0 (0.0%) | 16 (9.2%) |
Disability Class: Cognitive Difficulty
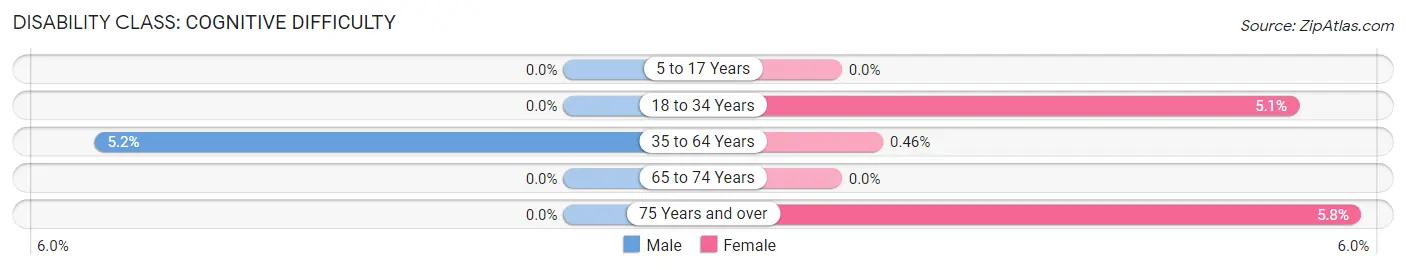
| Age Bracket | Male | Female |
| 5 to 17 Years | 0 (0.0%) | 0 (0.0%) |
| 18 to 34 Years | 0 (0.0%) | 19 (5.1%) |
| 35 to 64 Years | 20 (5.2%) | 2 (0.5%) |
| 65 to 74 Years | 0 (0.0%) | 0 (0.0%) |
| 75 Years and over | 0 (0.0%) | 10 (5.8%) |
Disability Class: Ambulatory Difficulty
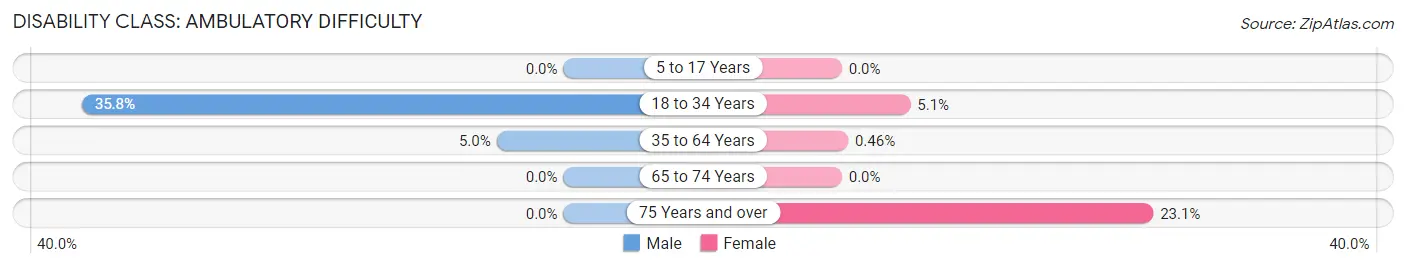
| Age Bracket | Male | Female |
| 5 to 17 Years | 0 (0.0%) | 0 (0.0%) |
| 18 to 34 Years | 79 (35.7%) | 19 (5.1%) |
| 35 to 64 Years | 19 (5.0%) | 2 (0.5%) |
| 65 to 74 Years | 0 (0.0%) | 0 (0.0%) |
| 75 Years and over | 0 (0.0%) | 40 (23.1%) |
Disability Class: Self-Care Difficulty
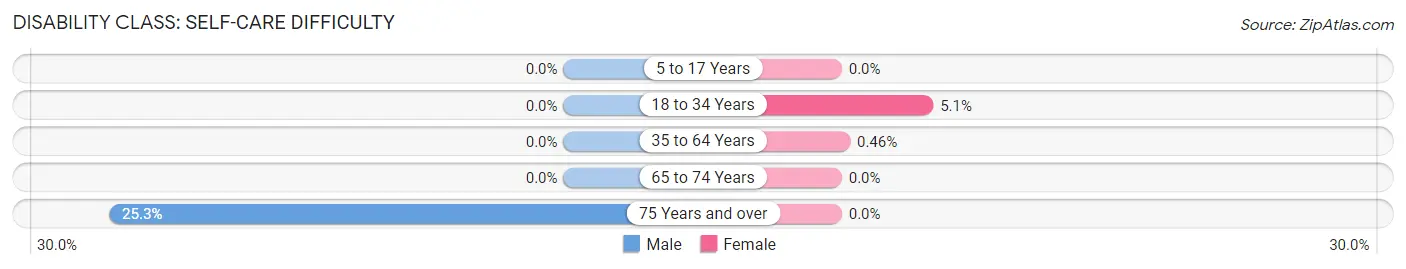
| Age Bracket | Male | Female |
| 5 to 17 Years | 0 (0.0%) | 0 (0.0%) |
| 18 to 34 Years | 0 (0.0%) | 19 (5.1%) |
| 35 to 64 Years | 0 (0.0%) | 2 (0.5%) |
| 65 to 74 Years | 0 (0.0%) | 0 (0.0%) |
| 75 Years and over | 22 (25.3%) | 0 (0.0%) |
Technology Access in Silver Lake
Computing Device Access in Silver Lake
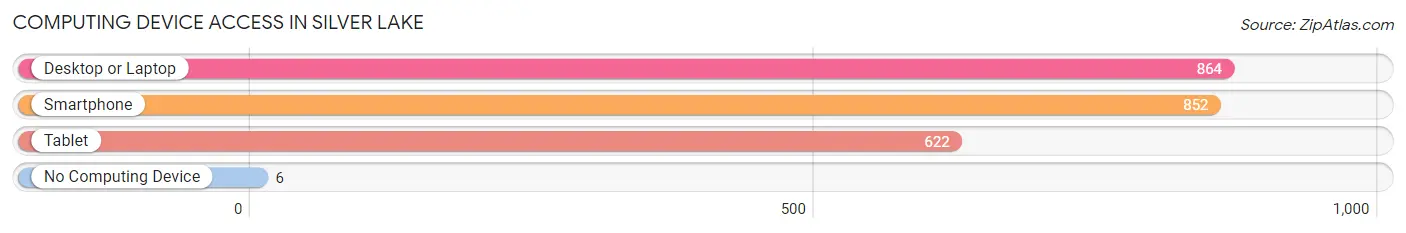
| Device Type | # Households | % Households |
| Desktop or Laptop | 864 | 93.5% |
| Smartphone | 852 | 92.2% |
| Tablet | 622 | 67.3% |
| No Computing Device | 6 | 0.6% |
| Total | 924 | 100.0% |
Internet Access in Silver Lake
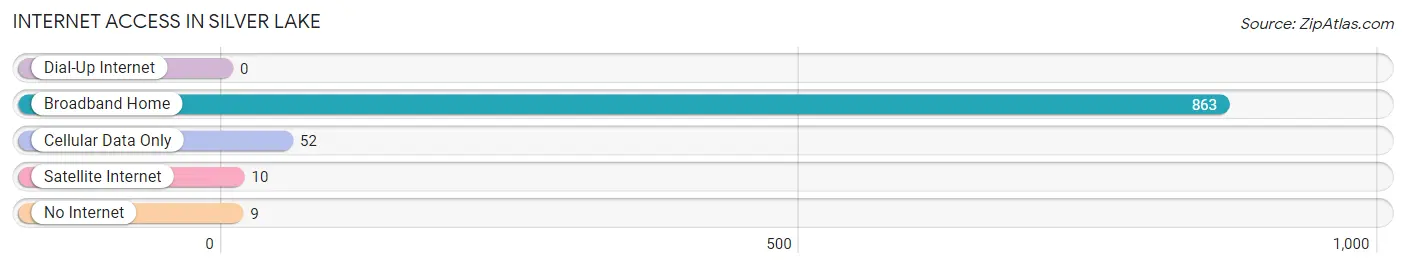
| Internet Type | # Households | % Households |
| Dial-Up Internet | 0 | 0.0% |
| Broadband Home | 863 | 93.4% |
| Cellular Data Only | 52 | 5.6% |
| Satellite Internet | 10 | 1.1% |
| No Internet | 9 | 1.0% |
| Total | 924 | 100.0% |
Silver Lake Summary
Introduction
Silver Lake is a small town located in the state of Florida, United States. It is situated in the northern part of the state, in the county of Polk. The town is located on the shores of Silver Lake, a natural lake that is part of the Kissimmee River system. The town has a population of approximately 1,000 people and is a popular tourist destination due to its proximity to the nearby cities of Orlando and Tampa.
History
Silver Lake was first settled in the late 19th century by settlers from the nearby town of Fort Meade. The town was originally known as Silver Lake Station, and was a stop on the South Florida Railroad. The town was officially incorporated in 1925, and the name was changed to Silver Lake.
The town was a popular tourist destination in the early 20th century, and was known for its fishing and hunting opportunities. The town was also home to a number of resorts, including the Silver Lake Hotel, which was built in the 1920s.
Geography
Silver Lake is located in the northern part of the state of Florida, in the county of Polk. The town is situated on the shores of Silver Lake, a natural lake that is part of the Kissimmee River system. The lake is approximately 4,000 acres in size and is a popular destination for fishing and boating.
The town is located approximately 30 miles from the cities of Orlando and Tampa. The town is also located near the Lake Wales Ridge, a ridge of sand hills that runs through the center of the state.
Economy
The economy of Silver Lake is largely based on tourism. The town is a popular destination for fishing and boating, and is home to a number of resorts and hotels. The town is also home to a number of restaurants and shops, as well as a number of small businesses.
The town is also home to a number of agricultural operations, including citrus groves and cattle ranches. The town is also home to a number of manufacturing operations, including a paper mill and a furniture factory.
Demographics
As of the 2010 census, the population of Silver Lake was 1,000 people. The town is predominantly white, with approximately 90% of the population being white. The town is also home to a small Hispanic population, with approximately 5% of the population being Hispanic.
The median household income in Silver Lake is approximately $35,000, and the median home value is approximately $100,000. The town has a low unemployment rate, with approximately 4% of the population being unemployed.
Conclusion
Silver Lake is a small town located in the northern part of the state of Florida. The town is situated on the shores of Silver Lake, a natural lake that is part of the Kissimmee River system. The town has a population of approximately 1,000 people and is a popular tourist destination due to its proximity to the nearby cities of Orlando and Tampa. The economy of Silver Lake is largely based on tourism, and the town is home to a number of resorts and restaurants. The town is predominantly white, with approximately 90% of the population being white. The median household income in Silver Lake is approximately $35,000, and the median home value is approximately $100,000.
Common Questions
What is Per Capita Income in Silver Lake?
Per Capita income in Silver Lake is $35,407.
What is the Median Family Income in Silver Lake?
Median Family Income in Silver Lake is $83,896.
What is the Median Household income in Silver Lake?
Median Household Income in Silver Lake is $73,700.
What is Income or Wage Gap in Silver Lake?
Income or Wage Gap in Silver Lake is 41.0%.
Women in Silver Lake earn 59.0 cents for every dollar earned by a man.
What is Inequality or Gini Index in Silver Lake?
Inequality or Gini Index in Silver Lake is 0.42.
What is the Total Population of Silver Lake?
Total Population of Silver Lake is 2,524.
What is the Total Male Population of Silver Lake?
Total Male Population of Silver Lake is 958.
What is the Total Female Population of Silver Lake?
Total Female Population of Silver Lake is 1,566.
What is the Ratio of Males per 100 Females in Silver Lake?
There are 61.17 Males per 100 Females in Silver Lake.
What is the Ratio of Females per 100 Males in Silver Lake?
There are 163.47 Females per 100 Males in Silver Lake.
What is the Median Population Age in Silver Lake?
Median Population Age in Silver Lake is 41.8 Years.
What is the Average Family Size in Silver Lake
Average Family Size in Silver Lake is 3.2 People.
What is the Average Household Size in Silver Lake
Average Household Size in Silver Lake is 2.7 People.
How Large is the Labor Force in Silver Lake?
There are 1,147 People in the Labor Forcein in Silver Lake.
What is the Percentage of People in the Labor Force in Silver Lake?
56.3% of People are in the Labor Force in Silver Lake.
What is the Unemployment Rate in Silver Lake?
Unemployment Rate in Silver Lake is 6.8%.