Belleview, FL Map & Demographics
Belleview Map
Belleview Overview
$26,405
PER CAPITA INCOME
$66,021
AVG FAMILY INCOME
$49,007
AVG HOUSEHOLD INCOME
19.9%
WAGE / INCOME GAP [ % ]
80.1¢/ $1
WAGE / INCOME GAP [ $ ]
0.45
INEQUALITY / GINI INDEX
5,438
TOTAL POPULATION
2,664
MALE POPULATION
2,774
FEMALE POPULATION
96.03
MALES / 100 FEMALES
104.13
FEMALES / 100 MALES
37.2
MEDIAN AGE
3.3
AVG FAMILY SIZE
2.6
AVG HOUSEHOLD SIZE
2,456
LABOR FORCE [ PEOPLE ]
57.3%
PERCENT IN LABOR FORCE
1.3%
UNEMPLOYMENT RATE
Belleview Zip Codes
Belleview Area Codes
Income in Belleview
Income Overview in Belleview
Per Capita Income in Belleview is $26,405, while median incomes of families and households are $66,021 and $49,007 respectively.
| Characteristic | Number | Measure |
| Per Capita Income | 5,438 | $26,405 |
| Median Family Income | 1,282 | $66,021 |
| Mean Family Income | 1,282 | $83,362 |
| Median Household Income | 2,105 | $49,007 |
| Mean Household Income | 2,105 | $67,590 |
| Income Deficit | 1,282 | $0 |
| Wage / Income Gap (%) | 5,438 | 19.91% |
| Wage / Income Gap ($) | 5,438 | 80.09¢ per $1 |
| Gini / Inequality Index | 5,438 | 0.45 |
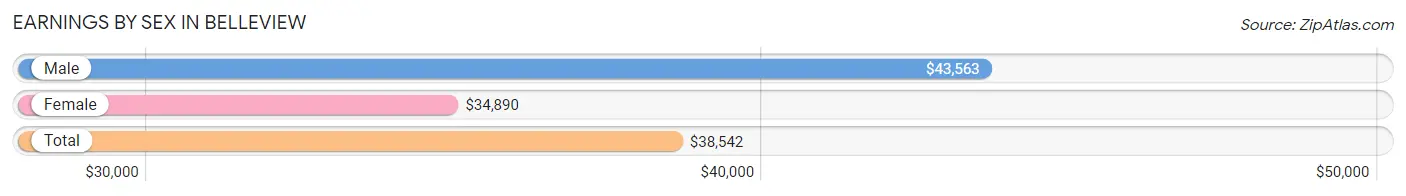
Earnings by Sex in Belleview
Average Earnings in Belleview are $38,542, $43,563 for men and $34,890 for women, a difference of 19.9%.
| Sex | Number | Average Earnings |
| Male | 1,377 (53.1%) | $43,563 |
| Female | 1,215 (46.9%) | $34,890 |
| Total | 2,592 (100.0%) | $38,542 |
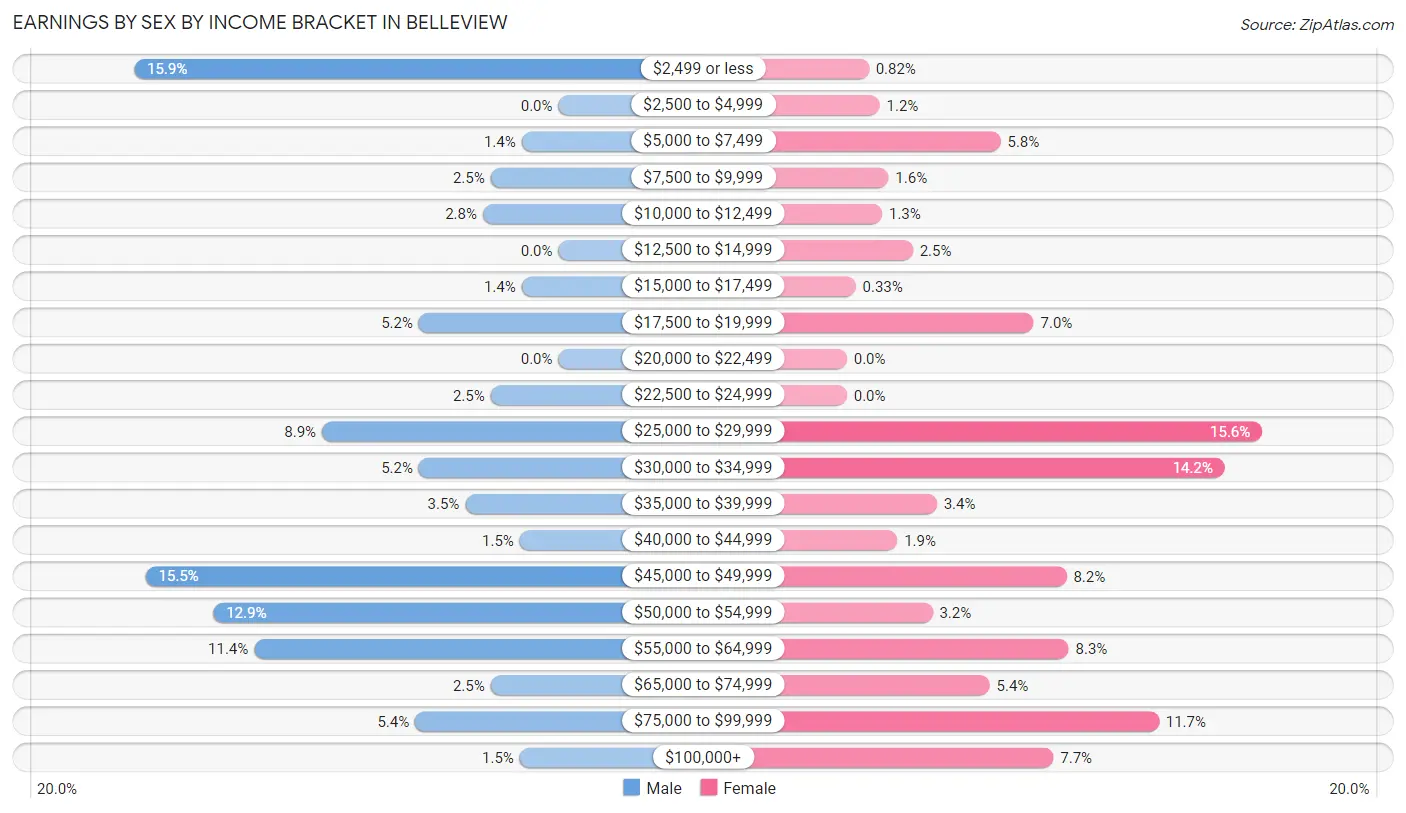
Earnings by Sex by Income Bracket in Belleview
The most common earnings brackets in Belleview are $2,499 or less for men (219 | 15.9%) and $25,000 to $29,999 for women (189 | 15.6%).
| Income | Male | Female |
| $2,499 or less | 219 (15.9%) | 10 (0.8%) |
| $2,500 to $4,999 | 0 (0.0%) | 15 (1.2%) |
| $5,000 to $7,499 | 19 (1.4%) | 70 (5.8%) |
| $7,500 to $9,999 | 35 (2.5%) | 19 (1.6%) |
| $10,000 to $12,499 | 39 (2.8%) | 16 (1.3%) |
| $12,500 to $14,999 | 0 (0.0%) | 30 (2.5%) |
| $15,000 to $17,499 | 19 (1.4%) | 4 (0.3%) |
| $17,500 to $19,999 | 72 (5.2%) | 85 (7.0%) |
| $20,000 to $22,499 | 0 (0.0%) | 0 (0.0%) |
| $22,500 to $24,999 | 35 (2.5%) | 0 (0.0%) |
| $25,000 to $29,999 | 122 (8.9%) | 189 (15.6%) |
| $30,000 to $34,999 | 72 (5.2%) | 172 (14.2%) |
| $35,000 to $39,999 | 48 (3.5%) | 41 (3.4%) |
| $40,000 to $44,999 | 20 (1.5%) | 23 (1.9%) |
| $45,000 to $49,999 | 213 (15.5%) | 100 (8.2%) |
| $50,000 to $54,999 | 178 (12.9%) | 39 (3.2%) |
| $55,000 to $64,999 | 157 (11.4%) | 101 (8.3%) |
| $65,000 to $74,999 | 35 (2.5%) | 65 (5.3%) |
| $75,000 to $99,999 | 74 (5.4%) | 142 (11.7%) |
| $100,000+ | 20 (1.5%) | 94 (7.7%) |
| Total | 1,377 (100.0%) | 1,215 (100.0%) |
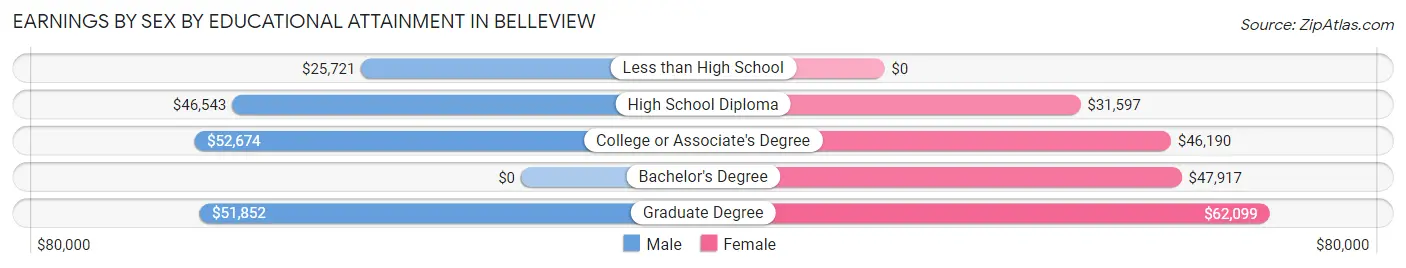
Earnings by Sex by Educational Attainment in Belleview
Average earnings in Belleview are $47,074 for men and $46,101 for women, a difference of 2.1%. Men with an educational attainment of college or associate's degree enjoy the highest average annual earnings of $52,674, while those with less than high school education earn the least with $25,721. Women with an educational attainment of graduate degree earn the most with the average annual earnings of $62,099, while those with high school diploma education have the smallest earnings of $31,597.
| Educational Attainment | Male Income | Female Income |
| Less than High School | $25,721 | $0 |
| High School Diploma | $46,543 | $31,597 |
| College or Associate's Degree | $52,674 | $46,190 |
| Bachelor's Degree | - | - |
| Graduate Degree | $51,852 | $62,099 |
| Total | $47,074 | $46,101 |
Family Income in Belleview
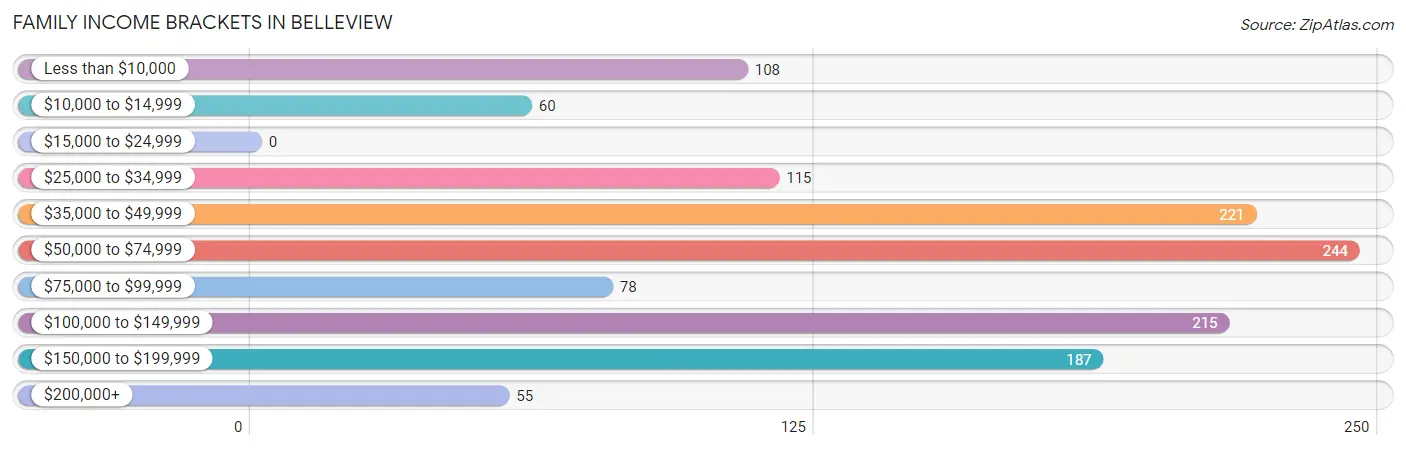
Family Income Brackets in Belleview
According to the Belleview family income data, there are 244 families falling into the $50,000 to $74,999 income range, which is the most common income bracket and makes up 19.0% of all families.
| Income Bracket | # Families | % Families |
| Less than $10,000 | 108 | 8.4% |
| $10,000 to $14,999 | 60 | 4.7% |
| $15,000 to $24,999 | 0 | 0.0% |
| $25,000 to $34,999 | 115 | 9.0% |
| $35,000 to $49,999 | 221 | 17.2% |
| $50,000 to $74,999 | 244 | 19.0% |
| $75,000 to $99,999 | 78 | 6.1% |
| $100,000 to $149,999 | 215 | 16.8% |
| $150,000 to $199,999 | 187 | 14.6% |
| $200,000+ | 55 | 4.3% |
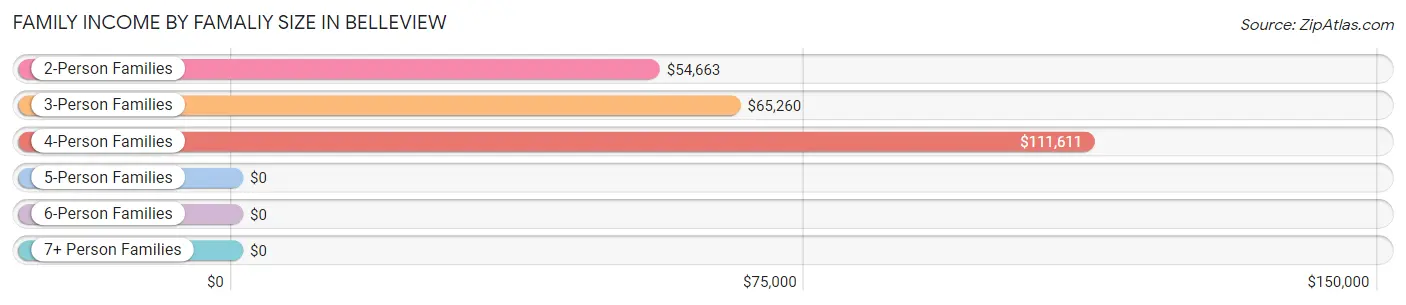
Family Income by Famaliy Size in Belleview
4-person families (275 | 21.4%) account for the highest median family income in Belleview with $111,611 per family, while 4-person families (275 | 21.4%) have the highest median income of $27,903 per family member.
| Income Bracket | # Families | Median Income |
| 2-Person Families | 655 (51.1%) | $54,663 |
| 3-Person Families | 147 (11.5%) | $65,260 |
| 4-Person Families | 275 (21.4%) | $111,611 |
| 5-Person Families | 118 (9.2%) | $0 |
| 6-Person Families | 22 (1.7%) | $0 |
| 7+ Person Families | 65 (5.1%) | $0 |
| Total | 1,282 (100.0%) | $66,021 |
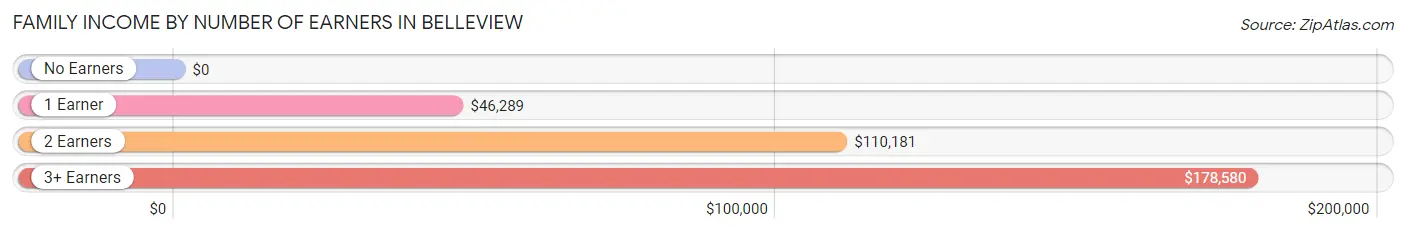
Family Income by Number of Earners in Belleview
| Number of Earners | # Families | Median Income |
| No Earners | 230 (17.9%) | $0 |
| 1 Earner | 365 (28.5%) | $46,289 |
| 2 Earners | 542 (42.3%) | $110,181 |
| 3+ Earners | 145 (11.3%) | $178,580 |
| Total | 1,282 (100.0%) | $66,021 |
Household Income in Belleview
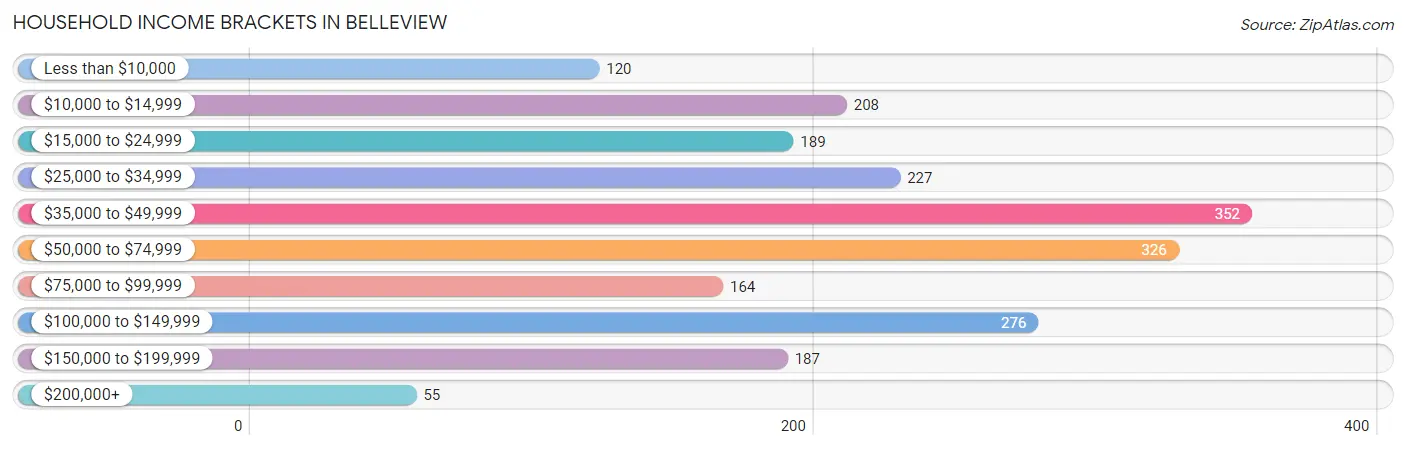
Household Income Brackets in Belleview
With 352 households falling in the category, the $35,000 to $49,999 income range is the most frequent in Belleview, accounting for 16.7% of all households. In contrast, only 55 households (2.6%) fall into the $200,000+ income bracket, making it the least populous group.
| Income Bracket | # Households | % Households |
| Less than $10,000 | 120 | 5.7% |
| $10,000 to $14,999 | 208 | 9.9% |
| $15,000 to $24,999 | 189 | 9.0% |
| $25,000 to $34,999 | 227 | 10.8% |
| $35,000 to $49,999 | 352 | 16.7% |
| $50,000 to $74,999 | 326 | 15.5% |
| $75,000 to $99,999 | 164 | 7.8% |
| $100,000 to $149,999 | 276 | 13.1% |
| $150,000 to $199,999 | 187 | 8.9% |
| $200,000+ | 55 | 2.6% |
Household Income by Householder Age in Belleview
The median household income in Belleview is $49,007, with the highest median household income of $76,250 found in the 25 to 44 years age bracket for the primary householder. A total of 678 households (32.2%) fall into this category. Meanwhile, the 15 to 24 years age bracket for the primary householder has the lowest median household income of $0, with 16 households (0.8%) in this group.
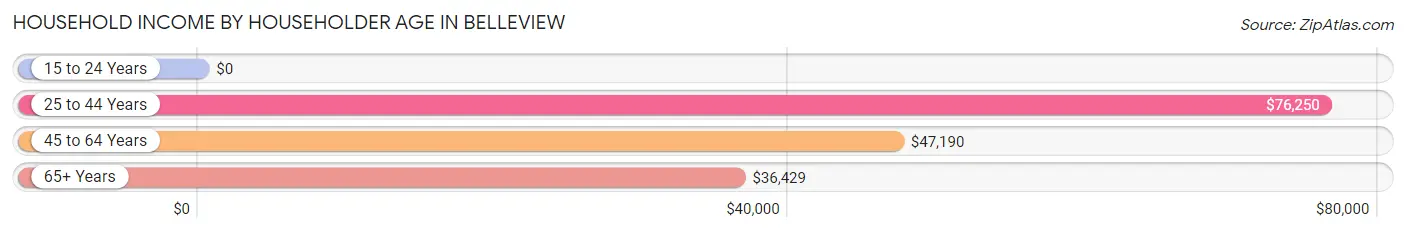
| Income Bracket | # Households | Median Income |
| 15 to 24 Years | 16 (0.8%) | $0 |
| 25 to 44 Years | 678 (32.2%) | $76,250 |
| 45 to 64 Years | 829 (39.4%) | $47,190 |
| 65+ Years | 582 (27.7%) | $36,429 |
| Total | 2,105 (100.0%) | $49,007 |
Poverty in Belleview
Income Below Poverty by Sex and Age in Belleview
With 15.6% poverty level for males and 19.2% for females among the residents of Belleview, 6 to 11 year old males and 12 to 14 year old females are the most vulnerable to poverty, with 205 males (89.5%) and 61 females (76.2%) in their respective age groups living below the poverty level.
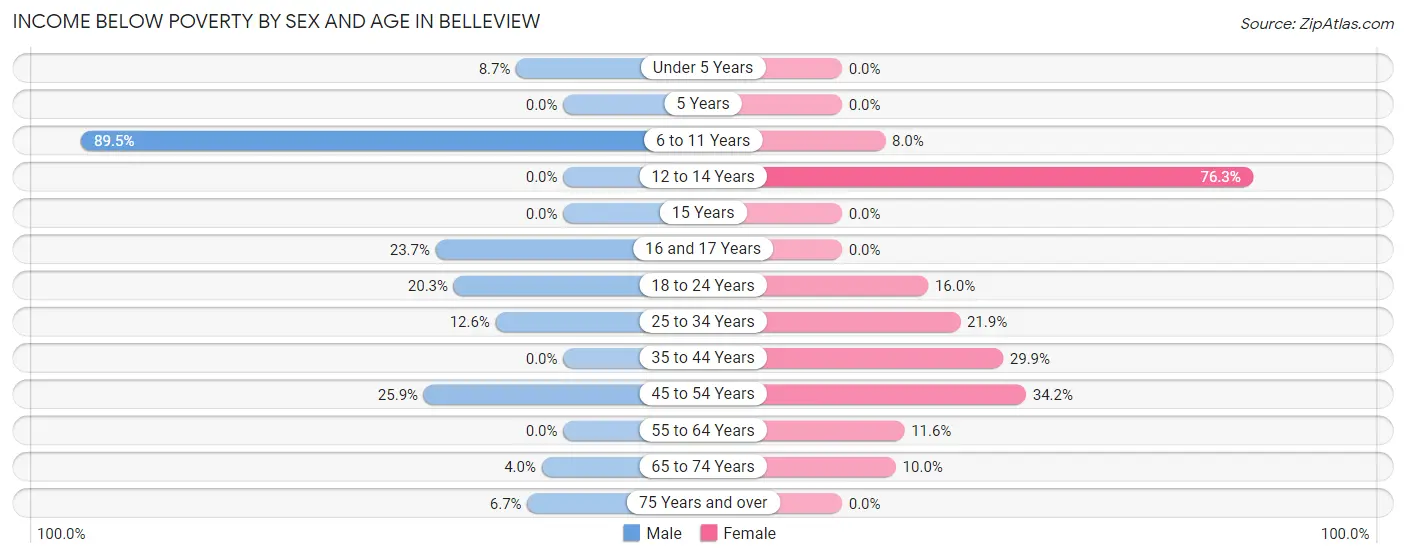
| Age Bracket | Male | Female |
| Under 5 Years | 27 (8.7%) | 0 (0.0%) |
| 5 Years | 0 (0.0%) | 0 (0.0%) |
| 6 to 11 Years | 205 (89.5%) | 24 (8.0%) |
| 12 to 14 Years | 0 (0.0%) | 61 (76.2%) |
| 15 Years | 0 (0.0%) | 0 (0.0%) |
| 16 and 17 Years | 27 (23.7%) | 0 (0.0%) |
| 18 to 24 Years | 63 (20.3%) | 44 (16.0%) |
| 25 to 34 Years | 28 (12.6%) | 68 (21.9%) |
| 35 to 44 Years | 0 (0.0%) | 93 (29.9%) |
| 45 to 54 Years | 44 (25.9%) | 168 (34.2%) |
| 55 to 64 Years | 0 (0.0%) | 44 (11.6%) |
| 65 to 74 Years | 12 (4.0%) | 27 (10.0%) |
| 75 Years and over | 8 (6.7%) | 0 (0.0%) |
| Total | 414 (15.6%) | 529 (19.2%) |
Income Above Poverty by Sex and Age in Belleview
According to the poverty statistics in Belleview, males aged 12 to 14 years and females aged under 5 years are the age groups that are most secure financially, with 100.0% of males and 100.0% of females in these age groups living above the poverty line.
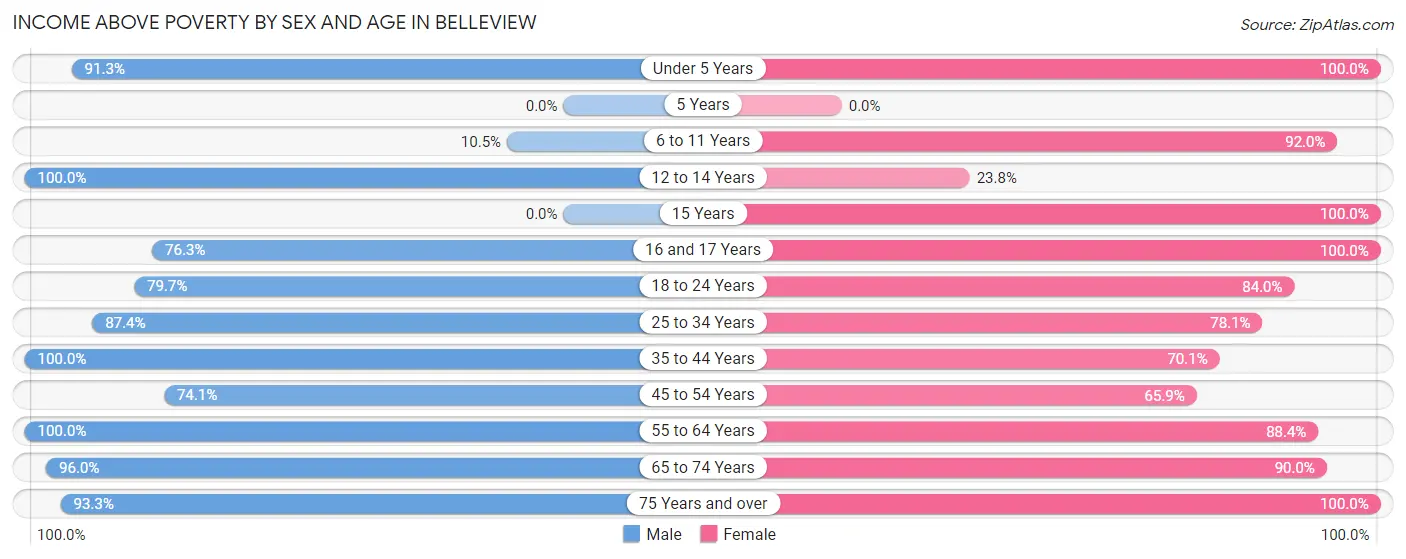
| Age Bracket | Male | Female |
| Under 5 Years | 282 (91.3%) | 52 (100.0%) |
| 5 Years | 0 (0.0%) | 0 (0.0%) |
| 6 to 11 Years | 24 (10.5%) | 275 (92.0%) |
| 12 to 14 Years | 106 (100.0%) | 19 (23.7%) |
| 15 Years | 0 (0.0%) | 73 (100.0%) |
| 16 and 17 Years | 87 (76.3%) | 27 (100.0%) |
| 18 to 24 Years | 247 (79.7%) | 231 (84.0%) |
| 25 to 34 Years | 195 (87.4%) | 242 (78.1%) |
| 35 to 44 Years | 479 (100.0%) | 218 (70.1%) |
| 45 to 54 Years | 126 (74.1%) | 324 (65.8%) |
| 55 to 64 Years | 294 (100.0%) | 336 (88.4%) |
| 65 to 74 Years | 288 (96.0%) | 243 (90.0%) |
| 75 Years and over | 112 (93.3%) | 188 (100.0%) |
| Total | 2,240 (84.4%) | 2,228 (80.8%) |
Income Below Poverty Among Married-Couple Families in Belleview
The poverty statistics for married-couple families in Belleview show that 2.6% or 22 of the total 850 families live below the poverty line. Families with 1 or 2 children have the highest poverty rate of 8.9%, comprising of 22 families. On the other hand, families with no children have the lowest poverty rate of 0.0%, which includes 0 families.
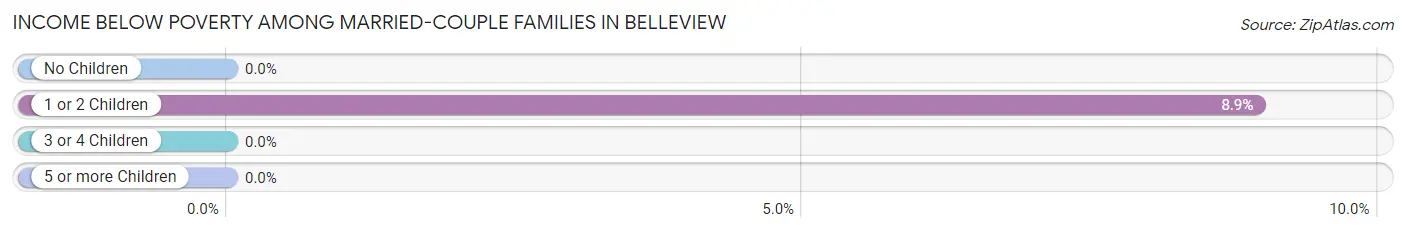
| Children | Above Poverty | Below Poverty |
| No Children | 539 (100.0%) | 0 (0.0%) |
| 1 or 2 Children | 224 (91.1%) | 22 (8.9%) |
| 3 or 4 Children | 0 (0.0%) | 0 (0.0%) |
| 5 or more Children | 65 (100.0%) | 0 (0.0%) |
| Total | 828 (97.4%) | 22 (2.6%) |
Income Below Poverty Among Single-Parent Households in Belleview
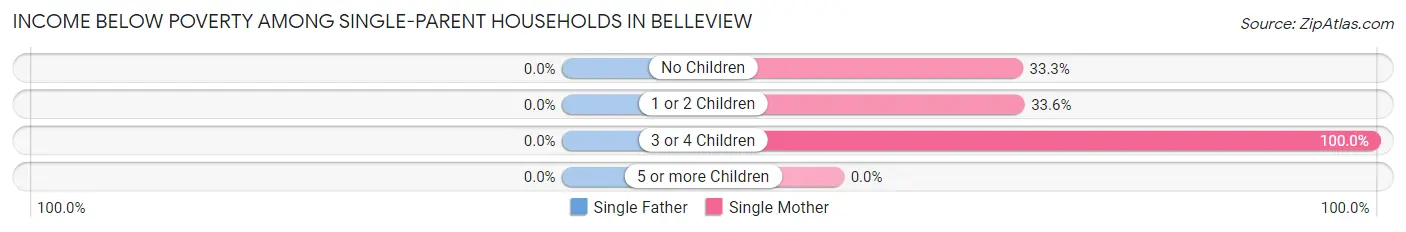
| Children | Single Father | Single Mother |
| No Children | 0 (0.0%) | 52 (33.3%) |
| 1 or 2 Children | 0 (0.0%) | 38 (33.6%) |
| 3 or 4 Children | 0 (0.0%) | 56 (100.0%) |
| 5 or more Children | 0 (0.0%) | 0 (0.0%) |
| Total | 0 (0.0%) | 146 (44.9%) |
Income Below Poverty Among Married-Couple vs Single-Parent Households in Belleview
The poverty data for Belleview shows that 22 of the married-couple family households (2.6%) and 146 of the single-parent households (33.8%) are living below the poverty level. Within the married-couple family households, those with 1 or 2 children have the highest poverty rate, with 22 households (8.9%) falling below the poverty line. Among the single-parent households, those with 3 or 4 children have the highest poverty rate, with 56 household (100.0%) living below poverty.
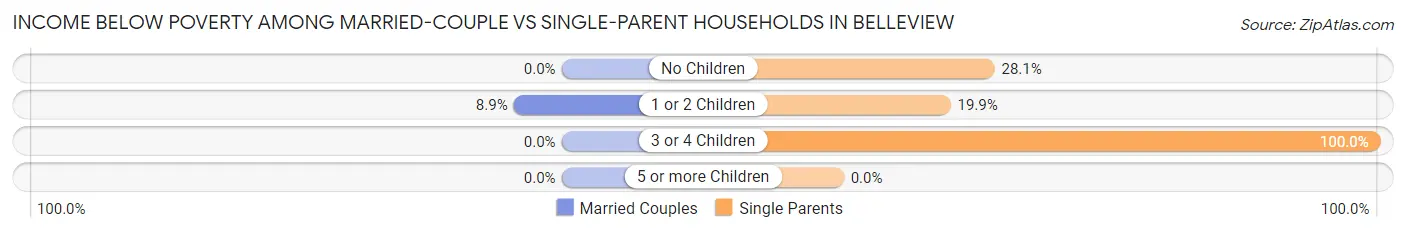
| Children | Married-Couple Families | Single-Parent Households |
| No Children | 0 (0.0%) | 52 (28.1%) |
| 1 or 2 Children | 22 (8.9%) | 38 (19.9%) |
| 3 or 4 Children | 0 (0.0%) | 56 (100.0%) |
| 5 or more Children | 0 (0.0%) | 0 (0.0%) |
| Total | 22 (2.6%) | 146 (33.8%) |
Race in Belleview
The most populous races in Belleview are White / Caucasian (4,833 | 88.9%), Hispanic or Latino (606 | 11.1%), and Two or more Races (424 | 7.8%).
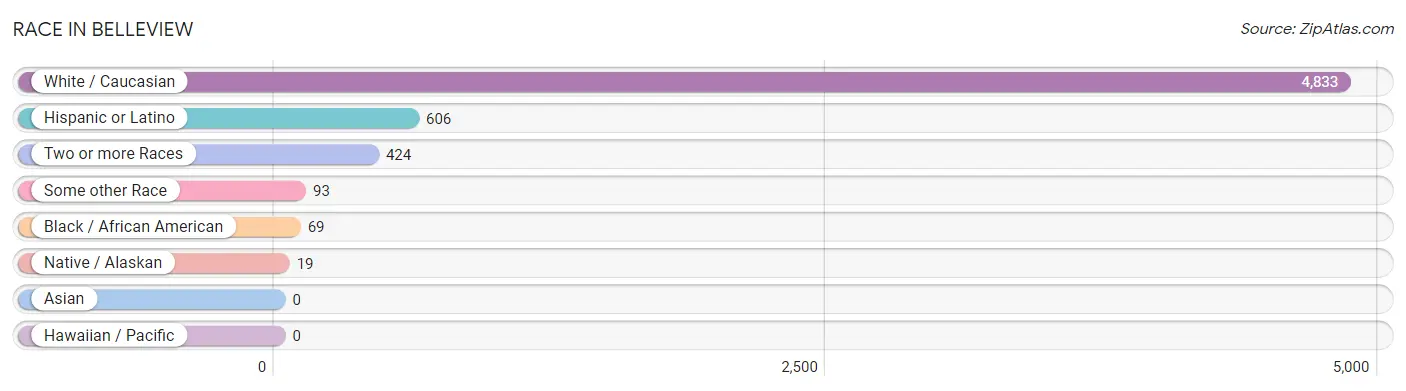
| Race | # Population | % Population |
| Asian | 0 | 0.0% |
| Black / African American | 69 | 1.3% |
| Hawaiian / Pacific | 0 | 0.0% |
| Hispanic or Latino | 606 | 11.1% |
| Native / Alaskan | 19 | 0.4% |
| White / Caucasian | 4,833 | 88.9% |
| Two or more Races | 424 | 7.8% |
| Some other Race | 93 | 1.7% |
| Total | 5,438 | 100.0% |
Ancestry in Belleview
The most populous ancestries reported in Belleview are Irish (757 | 13.9%), German (744 | 13.7%), Italian (484 | 8.9%), English (483 | 8.9%), and French (341 | 6.3%), together accounting for 51.6% of all Belleview residents.
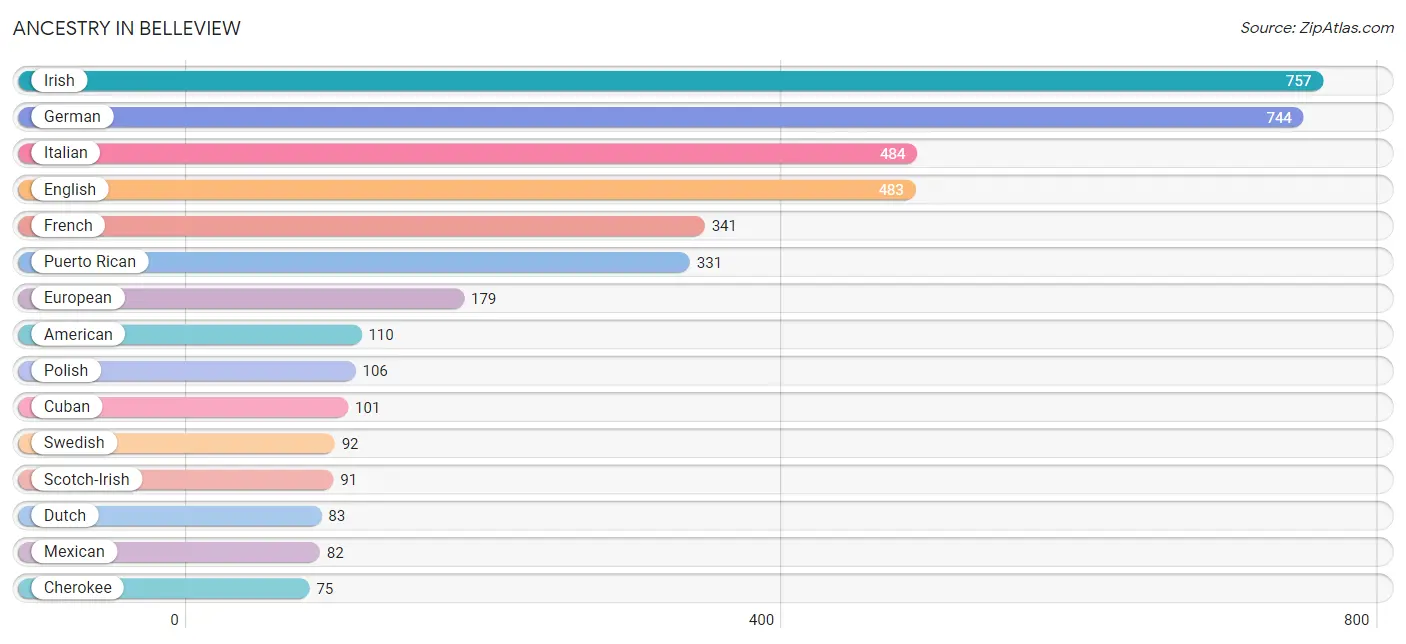
| Ancestry | # Population | % Population |
| African | 4 | 0.1% |
| American | 110 | 2.0% |
| Central American | 29 | 0.5% |
| Cherokee | 75 | 1.4% |
| Colombian | 15 | 0.3% |
| Cuban | 101 | 1.9% |
| Czech | 35 | 0.6% |
| Dutch | 83 | 1.5% |
| English | 483 | 8.9% |
| European | 179 | 3.3% |
| French | 341 | 6.3% |
| German | 744 | 13.7% |
| Irish | 757 | 13.9% |
| Italian | 484 | 8.9% |
| Lithuanian | 19 | 0.4% |
| Mexican | 82 | 1.5% |
| Nicaraguan | 29 | 0.5% |
| Norwegian | 47 | 0.9% |
| Polish | 106 | 1.9% |
| Puerto Rican | 331 | 6.1% |
| Scandinavian | 15 | 0.3% |
| Scotch-Irish | 91 | 1.7% |
| Scottish | 32 | 0.6% |
| South American | 15 | 0.3% |
| Spaniard | 13 | 0.2% |
| Subsaharan African | 4 | 0.1% |
| Swedish | 92 | 1.7% | View All 27 Rows |
Immigrants in Belleview
The most numerous immigrant groups reported in Belleview came from Latin America (191 | 3.5%), Central America (88 | 1.6%), Mexico (69 | 1.3%), Caribbean (62 | 1.1%), and Cuba (62 | 1.1%), together accounting for 8.7% of all Belleview residents.
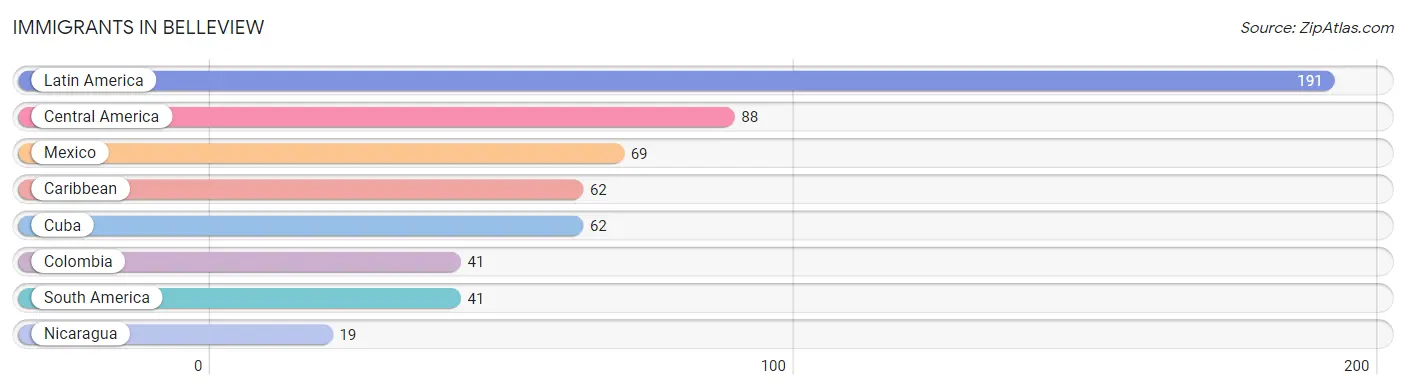
| Immigration Origin | # Population | % Population |
| Caribbean | 62 | 1.1% |
| Central America | 88 | 1.6% |
| Colombia | 41 | 0.7% |
| Cuba | 62 | 1.1% |
| Latin America | 191 | 3.5% |
| Mexico | 69 | 1.3% |
| Nicaragua | 19 | 0.4% |
| South America | 41 | 0.7% | View All 8 Rows |
Sex and Age in Belleview
Sex and Age in Belleview
The most populous age groups in Belleview are Under 5 Years (309 | 11.6%) for men and 5 to 9 Years (291 | 10.5%) for women.
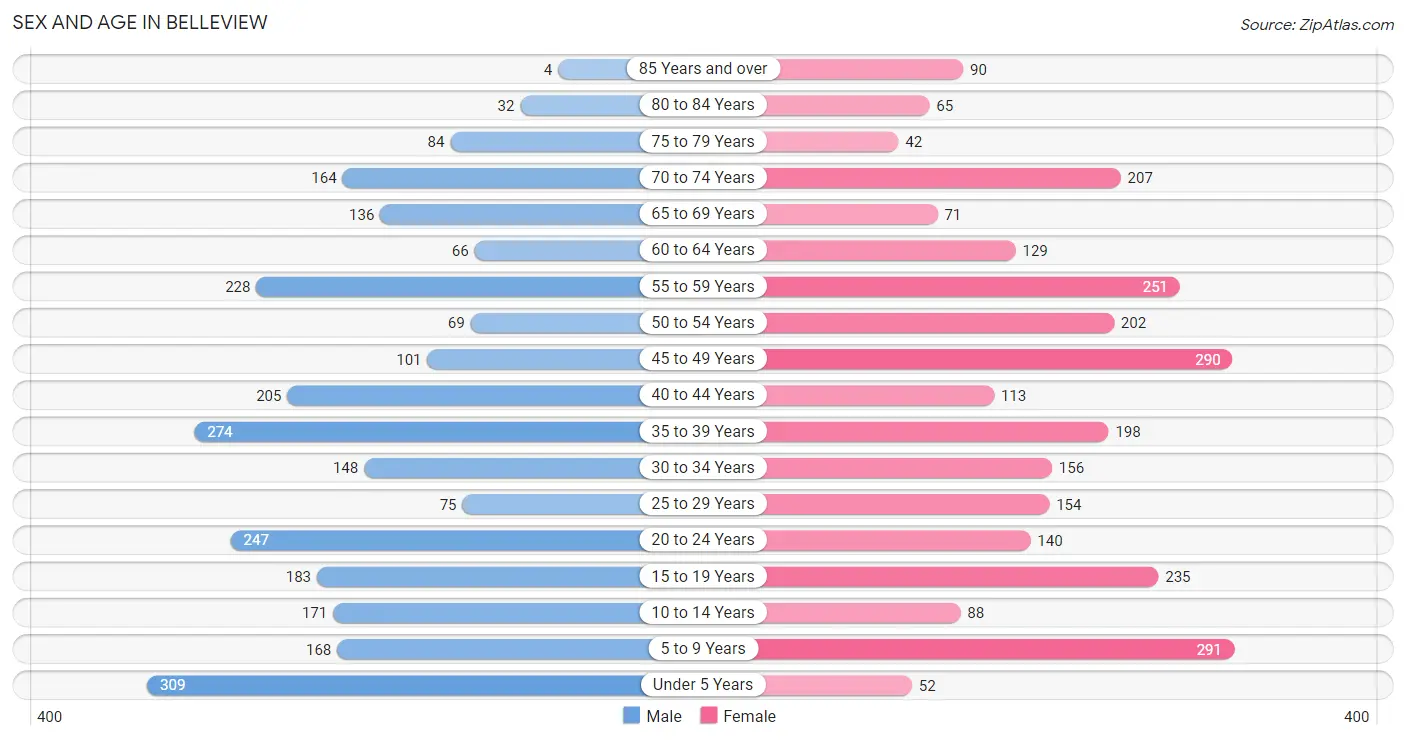
| Age Bracket | Male | Female |
| Under 5 Years | 309 (11.6%) | 52 (1.9%) |
| 5 to 9 Years | 168 (6.3%) | 291 (10.5%) |
| 10 to 14 Years | 171 (6.4%) | 88 (3.2%) |
| 15 to 19 Years | 183 (6.9%) | 235 (8.5%) |
| 20 to 24 Years | 247 (9.3%) | 140 (5.1%) |
| 25 to 29 Years | 75 (2.8%) | 154 (5.6%) |
| 30 to 34 Years | 148 (5.6%) | 156 (5.6%) |
| 35 to 39 Years | 274 (10.3%) | 198 (7.1%) |
| 40 to 44 Years | 205 (7.7%) | 113 (4.1%) |
| 45 to 49 Years | 101 (3.8%) | 290 (10.4%) |
| 50 to 54 Years | 69 (2.6%) | 202 (7.3%) |
| 55 to 59 Years | 228 (8.6%) | 251 (9.0%) |
| 60 to 64 Years | 66 (2.5%) | 129 (4.6%) |
| 65 to 69 Years | 136 (5.1%) | 71 (2.6%) |
| 70 to 74 Years | 164 (6.2%) | 207 (7.5%) |
| 75 to 79 Years | 84 (3.2%) | 42 (1.5%) |
| 80 to 84 Years | 32 (1.2%) | 65 (2.3%) |
| 85 Years and over | 4 (0.2%) | 90 (3.2%) |
| Total | 2,664 (100.0%) | 2,774 (100.0%) |
Families and Households in Belleview
Median Family Size in Belleview
The median family size in Belleview is 3.30 persons per family, with single male/father families (107 | 8.4%) accounting for the largest median family size of 3.54 persons per family. On the other hand, single female/mother families (325 | 25.4%) represent the smallest median family size with 3.10 persons per family.
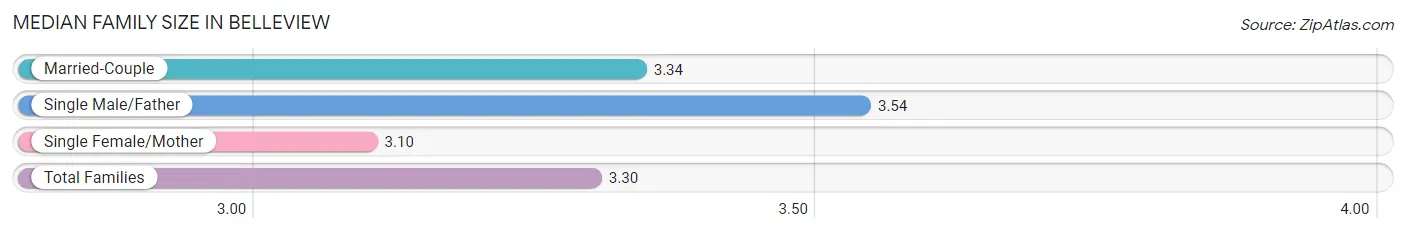
| Family Type | # Families | Family Size |
| Married-Couple | 850 (66.3%) | 3.34 |
| Single Male/Father | 107 (8.4%) | 3.54 |
| Single Female/Mother | 325 (25.4%) | 3.10 |
| Total Families | 1,282 (100.0%) | 3.30 |
Median Household Size in Belleview
The median household size in Belleview is 2.56 persons per household, with single male/father households (107 | 5.1%) accounting for the largest median household size of 4.52 persons per household. non-family households (823 | 39.1%) represent the smallest median household size with 1.19 persons per household.
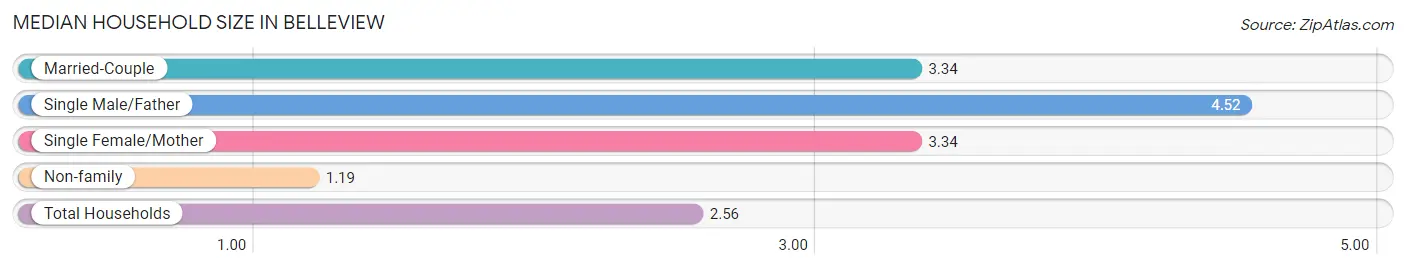
| Household Type | # Households | Household Size |
| Married-Couple | 850 (40.4%) | 3.34 |
| Single Male/Father | 107 (5.1%) | 4.52 |
| Single Female/Mother | 325 (15.4%) | 3.34 |
| Non-family | 823 (39.1%) | 1.19 |
| Total Households | 2,105 (100.0%) | 2.56 |
Household Size by Marriage Status in Belleview
Out of a total of 2,105 households in Belleview, 1,282 (60.9%) are family households, while 823 (39.1%) are nonfamily households. The most numerous type of family households are 2-person households, comprising 601, and the most common type of nonfamily households are 1-person households, comprising 702.
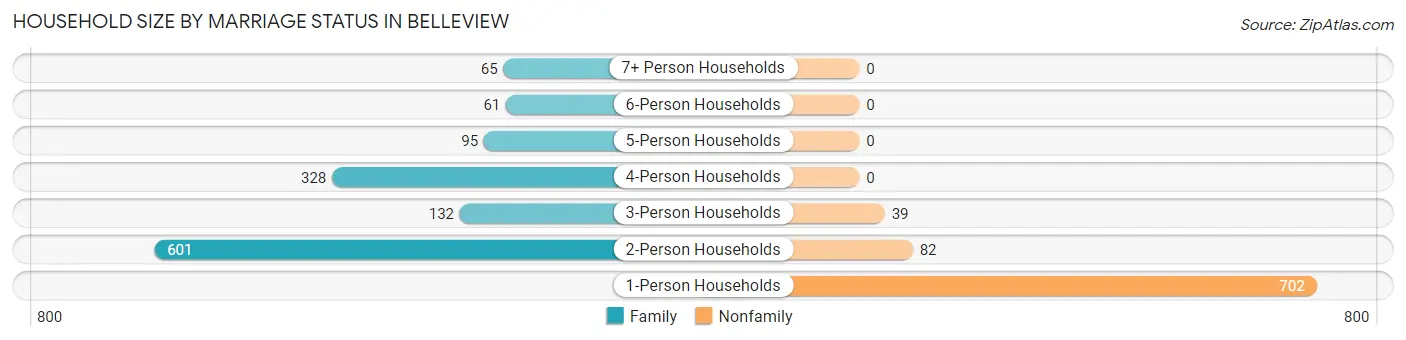
| Household Size | Family Households | Nonfamily Households |
| 1-Person Households | - | 702 (33.4%) |
| 2-Person Households | 601 (28.5%) | 82 (3.9%) |
| 3-Person Households | 132 (6.3%) | 39 (1.8%) |
| 4-Person Households | 328 (15.6%) | 0 (0.0%) |
| 5-Person Households | 95 (4.5%) | 0 (0.0%) |
| 6-Person Households | 61 (2.9%) | 0 (0.0%) |
| 7+ Person Households | 65 (3.1%) | 0 (0.0%) |
| Total | 1,282 (60.9%) | 823 (39.1%) |
Female Fertility in Belleview
Fertility by Age in Belleview
Average fertility rate in Belleview is 55.0 births per 1,000 women. Women in the age bracket of 35 to 50 years have the highest fertility rate with 108.0 births per 1,000 women. Women in the age bracket of 35 to 50 years acount for 100.0% of all women with births.
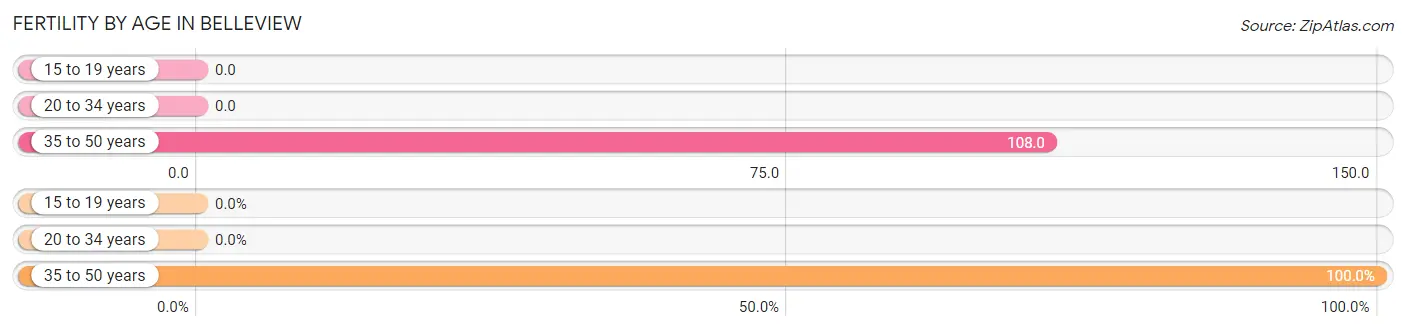
| Age Bracket | Women with Births | Births / 1,000 Women |
| 15 to 19 years | 0 (0.0%) | 0.0 |
| 20 to 34 years | 0 (0.0%) | 0.0 |
| 35 to 50 years | 76 (100.0%) | 108.0 |
| Total | 76 (100.0%) | 55.0 |
Fertility by Age by Marriage Status in Belleview
94.7% of women with births (76) in Belleview are married. The highest percentage of unmarried women with births falls into 35 to 50 years age bracket with 5.3% of them unmarried at the time of birth, while the lowest percentage of unmarried women with births belong to 35 to 50 years age bracket with 5.3% of them unmarried.
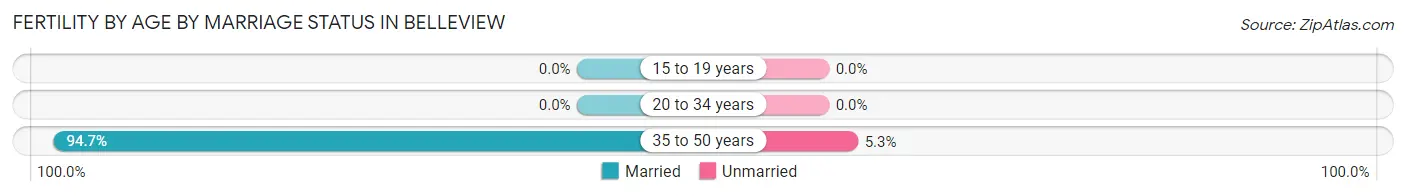
| Age Bracket | Married | Unmarried |
| 15 to 19 years | 0 (0.0%) | 0 (0.0%) |
| 20 to 34 years | 0 (0.0%) | 0 (0.0%) |
| 35 to 50 years | 72 (94.7%) | 4 (5.3%) |
| Total | 72 (94.7%) | 4 (5.3%) |
Fertility by Education in Belleview
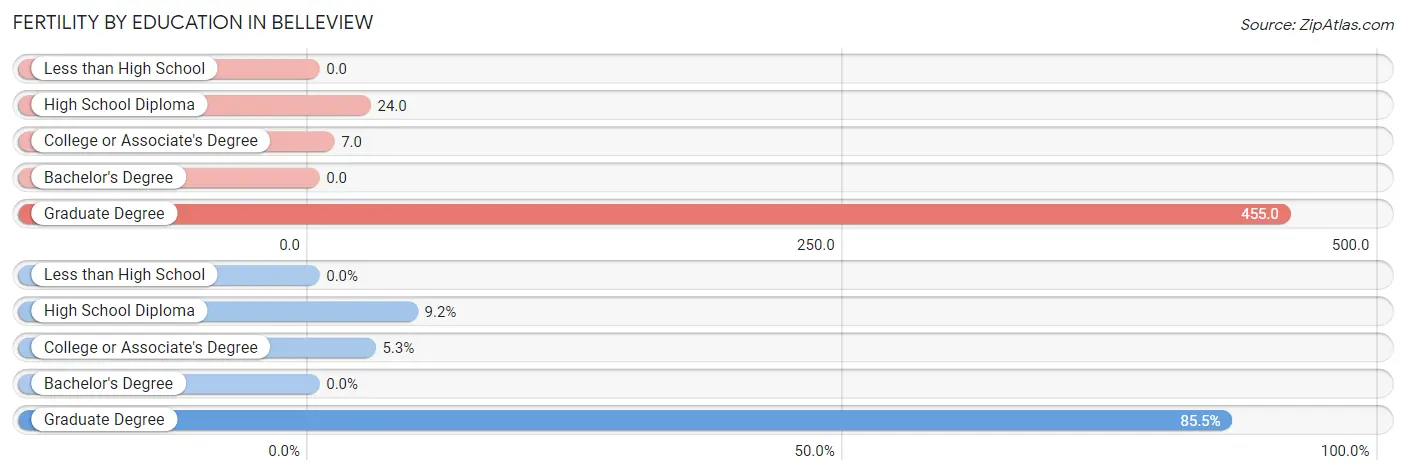
| Educational Attainment | Women with Births | Births / 1,000 Women |
| Less than High School | 0 (0.0%) | 0.0 |
| High School Diploma | 7 (9.2%) | 24.0 |
| College or Associate's Degree | 4 (5.3%) | 7.0 |
| Bachelor's Degree | 0 (0.0%) | 0.0 |
| Graduate Degree | 65 (85.5%) | 455.0 |
| Total | 76 (100.0%) | 55.0 |
Fertility by Education by Marriage Status in Belleview
5.3% of women with births in Belleview are unmarried. Women with the educational attainment of high school diploma are most likely to be married with 100.0% of them married at childbirth, while women with the educational attainment of college or associate's degree are least likely to be married with 100.0% of them unmarried at childbirth.
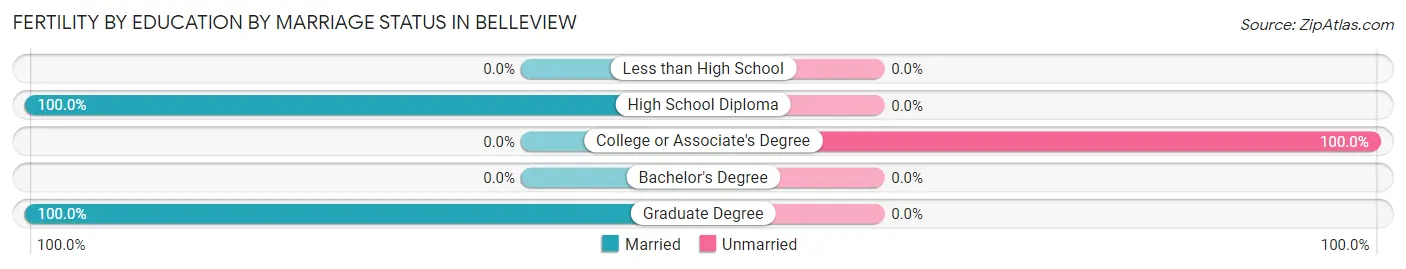
| Educational Attainment | Married | Unmarried |
| Less than High School | 0 (0.0%) | 0 (0.0%) |
| High School Diploma | 7 (100.0%) | 0 (0.0%) |
| College or Associate's Degree | 0 (0.0%) | 4 (100.0%) |
| Bachelor's Degree | 0 (0.0%) | 0 (0.0%) |
| Graduate Degree | 65 (100.0%) | 0 (0.0%) |
| Total | 72 (94.7%) | 4 (5.3%) |
Employment Characteristics in Belleview
Employment by Class of Employer in Belleview
Among the 2,422 employed individuals in Belleview, private company employees (1,762 | 72.8%), local government employees (313 | 12.9%), and not-for-profit organizations (148 | 6.1%) make up the most common classes of employment.
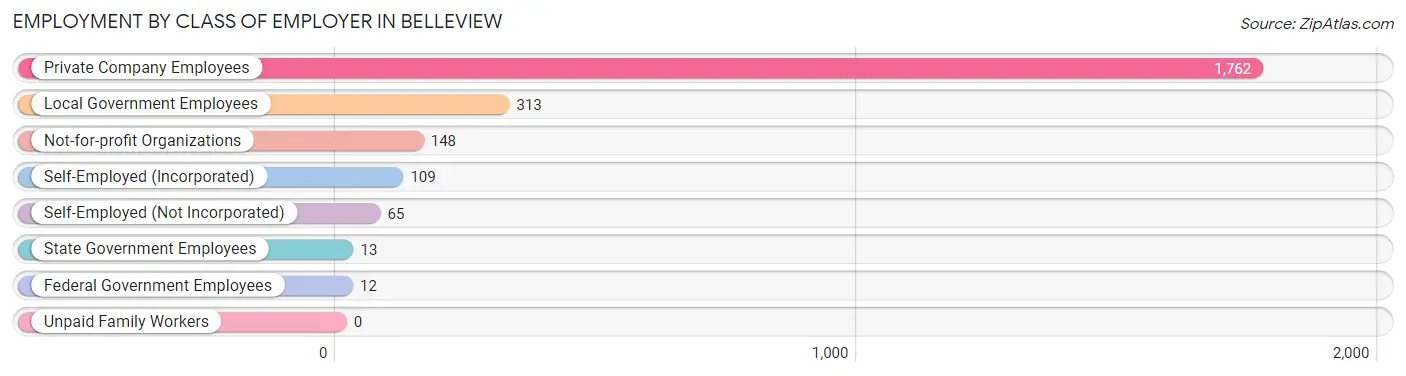
| Employer Class | # Employees | % Employees |
| Private Company Employees | 1,762 | 72.8% |
| Self-Employed (Incorporated) | 109 | 4.5% |
| Self-Employed (Not Incorporated) | 65 | 2.7% |
| Not-for-profit Organizations | 148 | 6.1% |
| Local Government Employees | 313 | 12.9% |
| State Government Employees | 13 | 0.5% |
| Federal Government Employees | 12 | 0.5% |
| Unpaid Family Workers | 0 | 0.0% |
| Total | 2,422 | 100.0% |
Employment Status by Age in Belleview
According to the labor force statistics for Belleview, out of the total population over 16 years of age (4,286), 57.3% or 2,456 individuals are in the labor force, with 1.3% or 32 of them unemployed. The age group with the highest labor force participation rate is 30 to 34 years, with 78.0% or 237 individuals in the labor force. Within the labor force, the 60 to 64 years age range has the highest percentage of unemployed individuals, with 14.9% or 11 of them being unemployed.
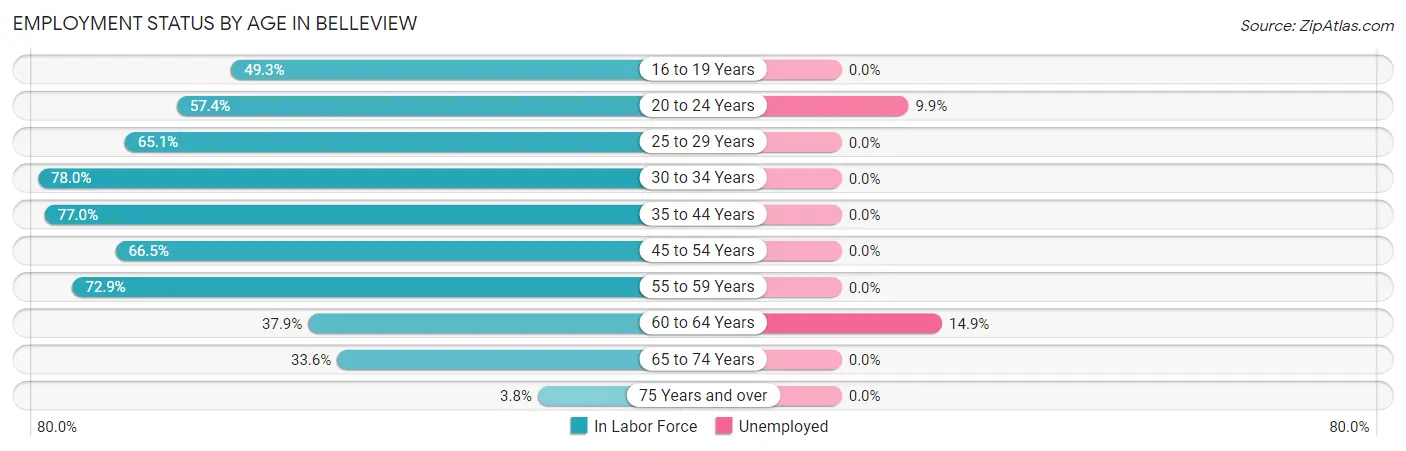
| Age Bracket | In Labor Force | Unemployed |
| 16 to 19 Years | 170 (49.3%) | 0 (0.0%) |
| 20 to 24 Years | 222 (57.4%) | 22 (9.9%) |
| 25 to 29 Years | 149 (65.1%) | 0 (0.0%) |
| 30 to 34 Years | 237 (78.0%) | 0 (0.0%) |
| 35 to 44 Years | 608 (77.0%) | 0 (0.0%) |
| 45 to 54 Years | 440 (66.5%) | 0 (0.0%) |
| 55 to 59 Years | 349 (72.9%) | 0 (0.0%) |
| 60 to 64 Years | 74 (37.9%) | 11 (14.9%) |
| 65 to 74 Years | 194 (33.6%) | 0 (0.0%) |
| 75 Years and over | 12 (3.8%) | 0 (0.0%) |
| Total | 2,456 (57.3%) | 32 (1.3%) |
Employment Status by Educational Attainment in Belleview
According to labor force statistics for Belleview, 69.8% of individuals (1,856) out of the total population between 25 and 64 years of age (2,659) are in the labor force, with 0.6% or 11 of them being unemployed. The group with the highest labor force participation rate are those with the educational attainment of bachelor's degree or higher, with 80.8% or 611 individuals in the labor force. Within the labor force, individuals with less than high school education have the highest percentage of unemployment, with 10.6% or 11 of them being unemployed.
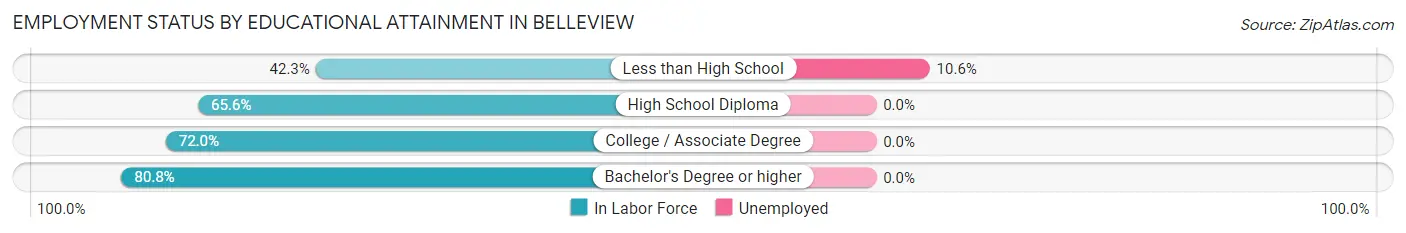
| Educational Attainment | In Labor Force | Unemployed |
| Less than High School | 104 (42.3%) | 26 (10.6%) |
| High School Diploma | 520 (65.6%) | 0 (0.0%) |
| College / Associate Degree | 622 (72.0%) | 0 (0.0%) |
| Bachelor's Degree or higher | 611 (80.8%) | 0 (0.0%) |
| Total | 1,856 (69.8%) | 16 (0.6%) |
Employment Occupations by Sex in Belleview
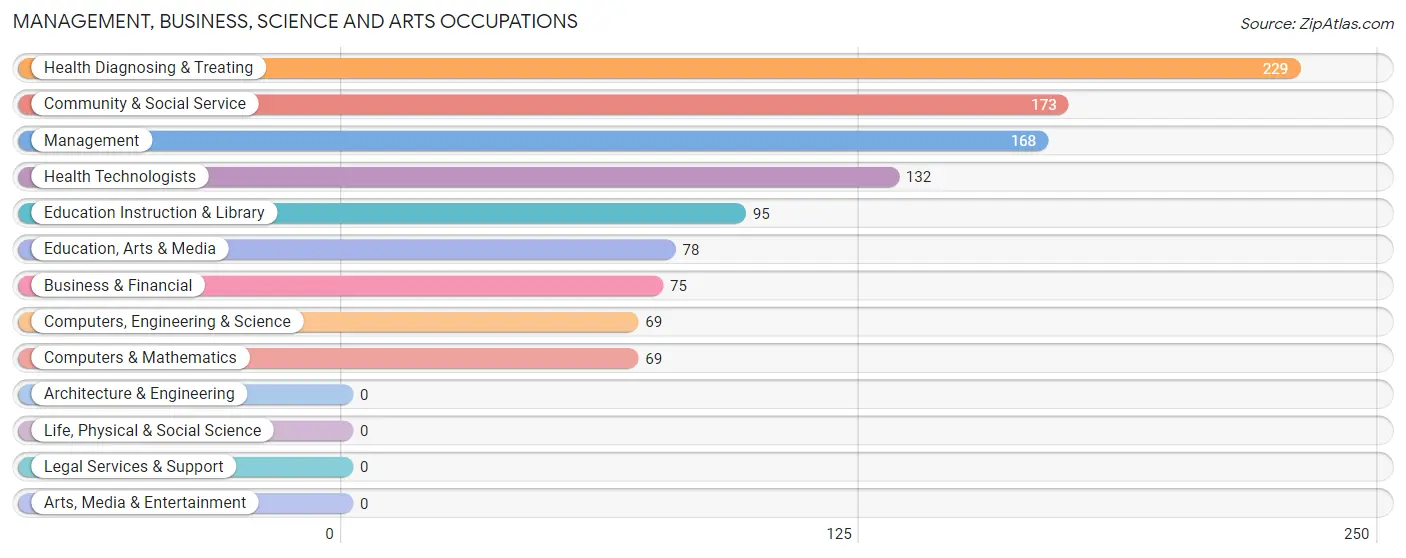
Management, Business, Science and Arts Occupations
The most common Management, Business, Science and Arts occupations in Belleview are Health Diagnosing & Treating (229 | 9.5%), Community & Social Service (173 | 7.1%), Management (168 | 6.9%), Health Technologists (132 | 5.4%), and Education Instruction & Library (95 | 3.9%).
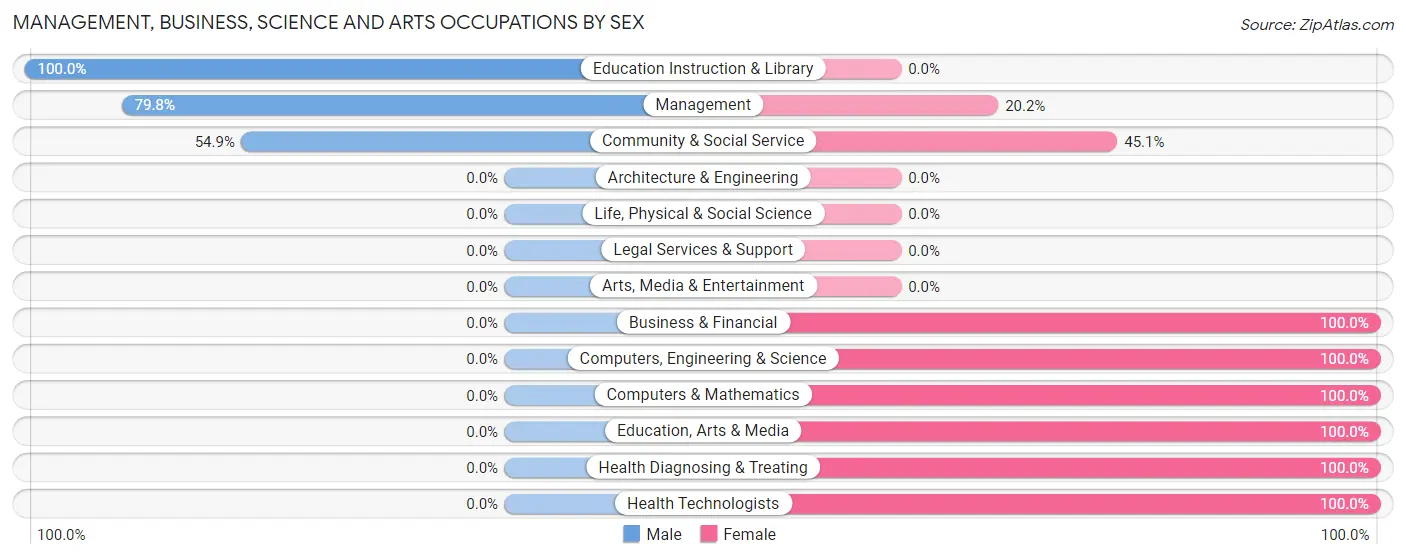
Management, Business, Science and Arts Occupations by Sex
Within the Management, Business, Science and Arts occupations in Belleview, the most male-oriented occupations are Education Instruction & Library (100.0%), Management (79.8%), and Community & Social Service (54.9%), while the most female-oriented occupations are Business & Financial (100.0%), Computers, Engineering & Science (100.0%), and Computers & Mathematics (100.0%).
| Occupation | Male | Female |
| Management | 134 (79.8%) | 34 (20.2%) |
| Business & Financial | 0 (0.0%) | 75 (100.0%) |
| Computers, Engineering & Science | 0 (0.0%) | 69 (100.0%) |
| Computers & Mathematics | 0 (0.0%) | 69 (100.0%) |
| Architecture & Engineering | 0 (0.0%) | 0 (0.0%) |
| Life, Physical & Social Science | 0 (0.0%) | 0 (0.0%) |
| Community & Social Service | 95 (54.9%) | 78 (45.1%) |
| Education, Arts & Media | 0 (0.0%) | 78 (100.0%) |
| Legal Services & Support | 0 (0.0%) | 0 (0.0%) |
| Education Instruction & Library | 95 (100.0%) | 0 (0.0%) |
| Arts, Media & Entertainment | 0 (0.0%) | 0 (0.0%) |
| Health Diagnosing & Treating | 0 (0.0%) | 229 (100.0%) |
| Health Technologists | 0 (0.0%) | 132 (100.0%) |
| Total (Category) | 229 (32.1%) | 485 (67.9%) |
| Total (Overall) | 1,294 (53.4%) | 1,128 (46.6%) |
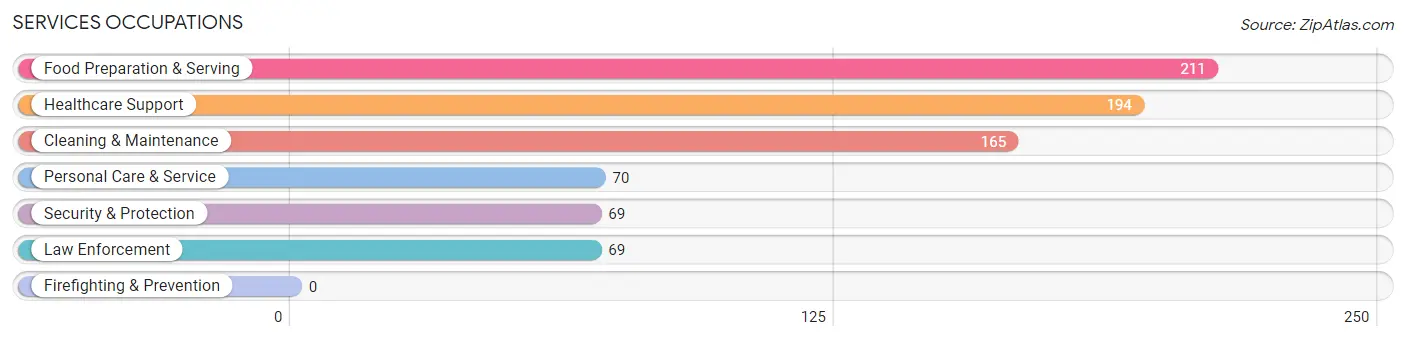
Services Occupations
The most common Services occupations in Belleview are Food Preparation & Serving (211 | 8.7%), Healthcare Support (194 | 8.0%), Cleaning & Maintenance (165 | 6.8%), Personal Care & Service (70 | 2.9%), and Security & Protection (69 | 2.9%).
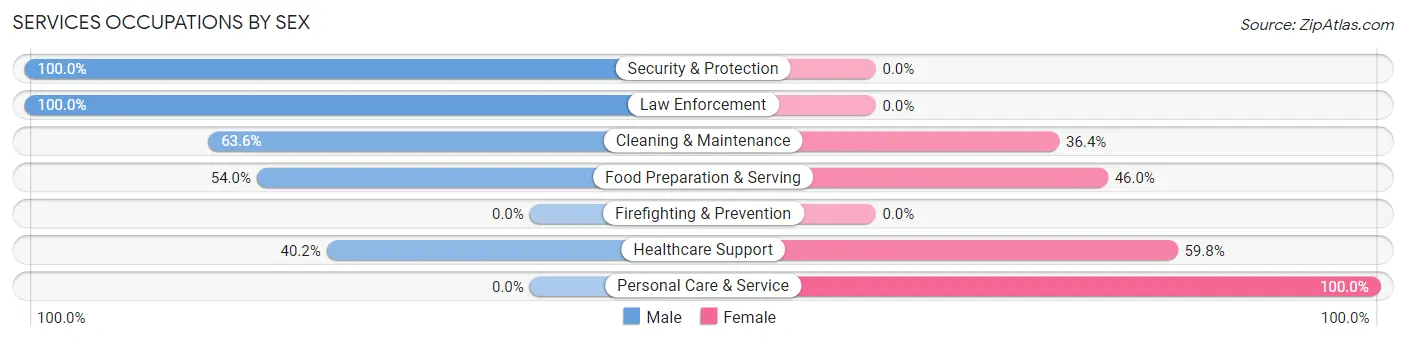
Services Occupations by Sex
Within the Services occupations in Belleview, the most male-oriented occupations are Security & Protection (100.0%), Law Enforcement (100.0%), and Cleaning & Maintenance (63.6%), while the most female-oriented occupations are Personal Care & Service (100.0%), Healthcare Support (59.8%), and Food Preparation & Serving (46.0%).
| Occupation | Male | Female |
| Healthcare Support | 78 (40.2%) | 116 (59.8%) |
| Security & Protection | 69 (100.0%) | 0 (0.0%) |
| Firefighting & Prevention | 0 (0.0%) | 0 (0.0%) |
| Law Enforcement | 69 (100.0%) | 0 (0.0%) |
| Food Preparation & Serving | 114 (54.0%) | 97 (46.0%) |
| Cleaning & Maintenance | 105 (63.6%) | 60 (36.4%) |
| Personal Care & Service | 0 (0.0%) | 70 (100.0%) |
| Total (Category) | 366 (51.6%) | 343 (48.4%) |
| Total (Overall) | 1,294 (53.4%) | 1,128 (46.6%) |
Sales and Office Occupations
The most common Sales and Office occupations in Belleview are Sales & Related (284 | 11.7%), and Office & Administration (279 | 11.5%).

Sales and Office Occupations by Sex
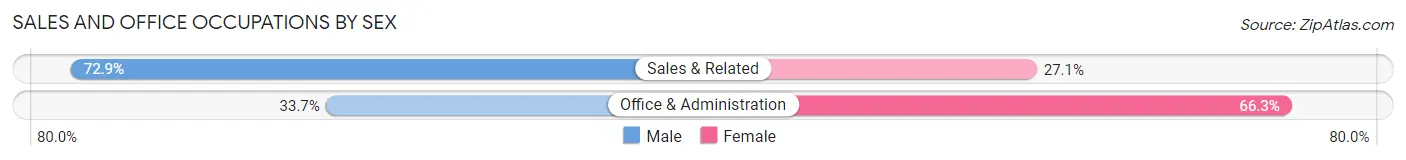
| Occupation | Male | Female |
| Sales & Related | 207 (72.9%) | 77 (27.1%) |
| Office & Administration | 94 (33.7%) | 185 (66.3%) |
| Total (Category) | 301 (53.5%) | 262 (46.5%) |
| Total (Overall) | 1,294 (53.4%) | 1,128 (46.6%) |
Natural Resources, Construction and Maintenance Occupations
The most common Natural Resources, Construction and Maintenance occupations in Belleview are Installation, Maintenance & Repair (120 | 5.0%), and Construction & Extraction (75 | 3.1%).

Natural Resources, Construction and Maintenance Occupations by Sex

| Occupation | Male | Female |
| Farming, Fishing & Forestry | 0 (0.0%) | 0 (0.0%) |
| Construction & Extraction | 75 (100.0%) | 0 (0.0%) |
| Installation, Maintenance & Repair | 120 (100.0%) | 0 (0.0%) |
| Total (Category) | 195 (100.0%) | 0 (0.0%) |
| Total (Overall) | 1,294 (53.4%) | 1,128 (46.6%) |
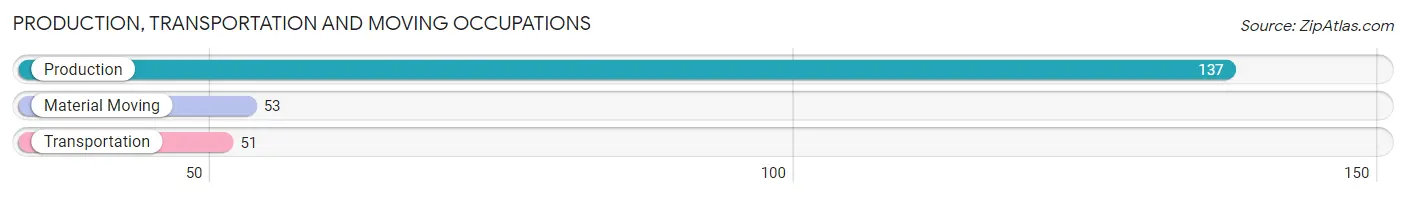
Production, Transportation and Moving Occupations
The most common Production, Transportation and Moving occupations in Belleview are Production (137 | 5.7%), Material Moving (53 | 2.2%), and Transportation (51 | 2.1%).
Production, Transportation and Moving Occupations by Sex
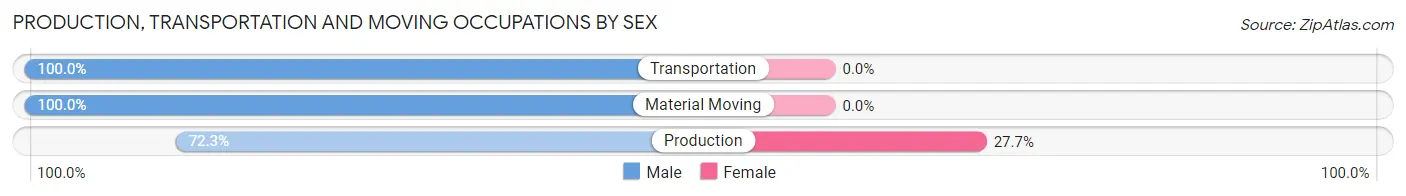
| Occupation | Male | Female |
| Production | 99 (72.3%) | 38 (27.7%) |
| Transportation | 51 (100.0%) | 0 (0.0%) |
| Material Moving | 53 (100.0%) | 0 (0.0%) |
| Total (Category) | 203 (84.2%) | 38 (15.8%) |
| Total (Overall) | 1,294 (53.4%) | 1,128 (46.6%) |
Employment Industries by Sex in Belleview
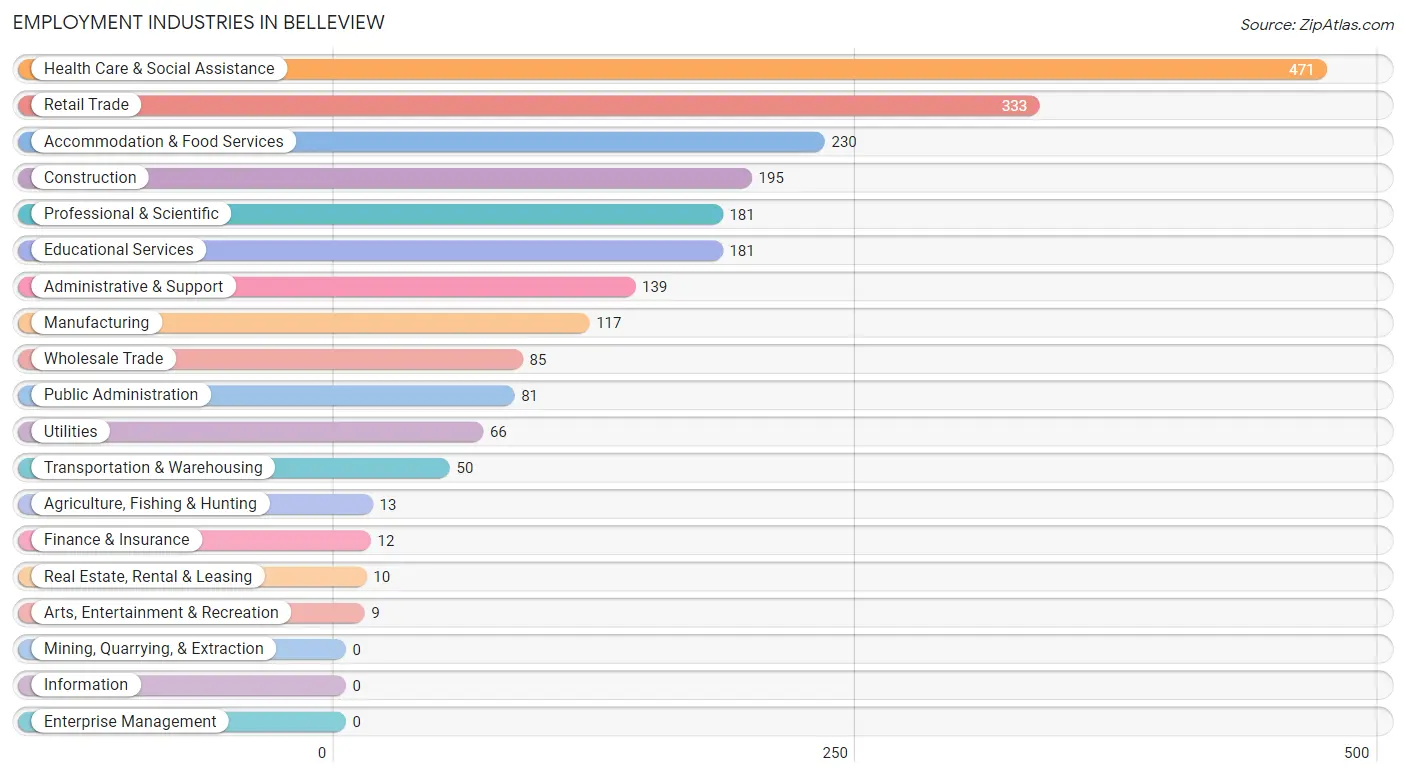
Employment Industries in Belleview
The major employment industries in Belleview include Health Care & Social Assistance (471 | 19.5%), Retail Trade (333 | 13.8%), Accommodation & Food Services (230 | 9.5%), Construction (195 | 8.1%), and Professional & Scientific (181 | 7.5%).
Employment Industries by Sex in Belleview
The Belleview industries that see more men than women are Agriculture, Fishing & Hunting (100.0%), Construction (100.0%), and Wholesale Trade (100.0%), whereas the industries that tend to have a higher number of women are Finance & Insurance (100.0%), Real Estate, Rental & Leasing (100.0%), and Professional & Scientific (100.0%).
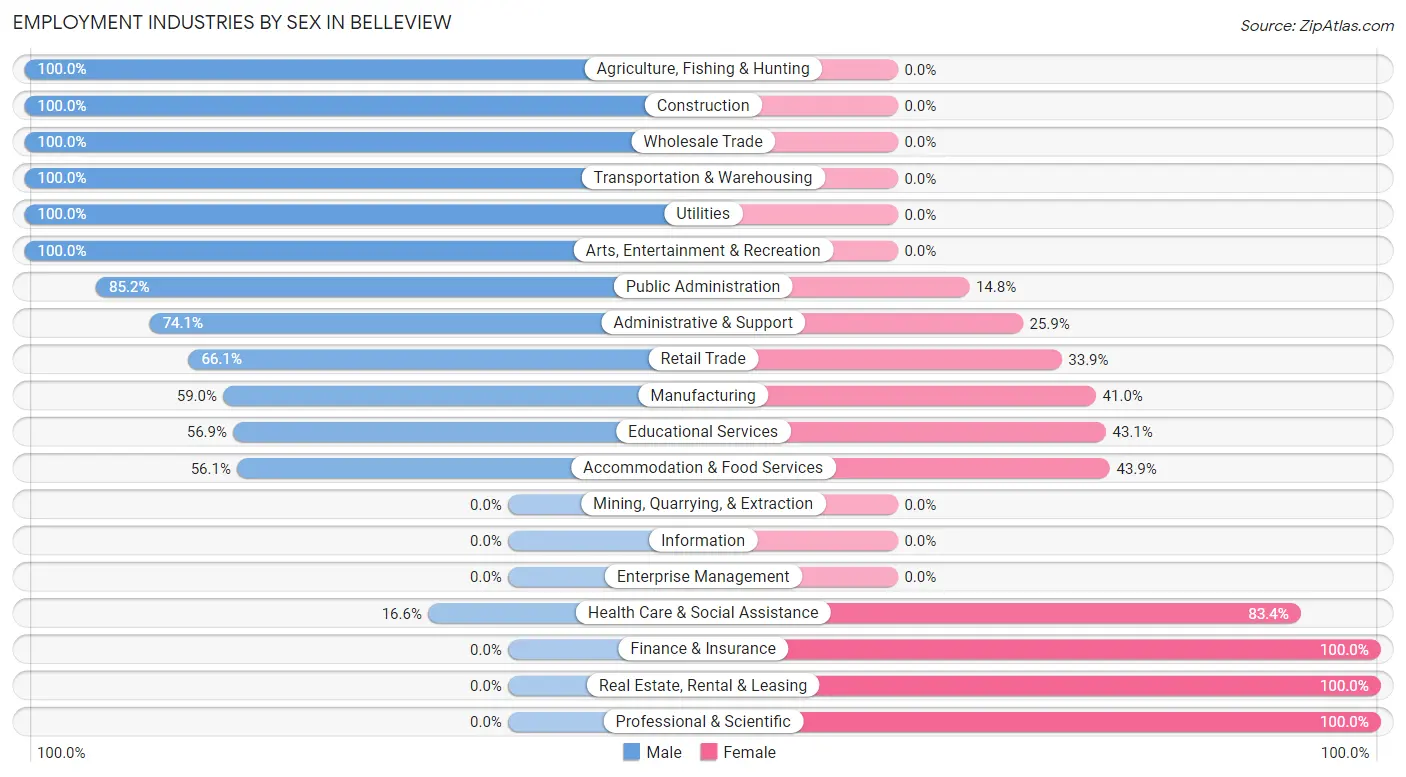
| Industry | Male | Female |
| Agriculture, Fishing & Hunting | 13 (100.0%) | 0 (0.0%) |
| Mining, Quarrying, & Extraction | 0 (0.0%) | 0 (0.0%) |
| Construction | 195 (100.0%) | 0 (0.0%) |
| Manufacturing | 69 (59.0%) | 48 (41.0%) |
| Wholesale Trade | 85 (100.0%) | 0 (0.0%) |
| Retail Trade | 220 (66.1%) | 113 (33.9%) |
| Transportation & Warehousing | 50 (100.0%) | 0 (0.0%) |
| Utilities | 66 (100.0%) | 0 (0.0%) |
| Information | 0 (0.0%) | 0 (0.0%) |
| Finance & Insurance | 0 (0.0%) | 12 (100.0%) |
| Real Estate, Rental & Leasing | 0 (0.0%) | 10 (100.0%) |
| Professional & Scientific | 0 (0.0%) | 181 (100.0%) |
| Enterprise Management | 0 (0.0%) | 0 (0.0%) |
| Administrative & Support | 103 (74.1%) | 36 (25.9%) |
| Educational Services | 103 (56.9%) | 78 (43.1%) |
| Health Care & Social Assistance | 78 (16.6%) | 393 (83.4%) |
| Arts, Entertainment & Recreation | 9 (100.0%) | 0 (0.0%) |
| Accommodation & Food Services | 129 (56.1%) | 101 (43.9%) |
| Public Administration | 69 (85.2%) | 12 (14.8%) |
| Total | 1,294 (53.4%) | 1,128 (46.6%) |
Education in Belleview
School Enrollment in Belleview
The most common levels of schooling among the 1,273 students in Belleview are elementary school (448 | 35.2%), college / undergraduate (240 | 18.9%), and middle school (226 | 17.7%).
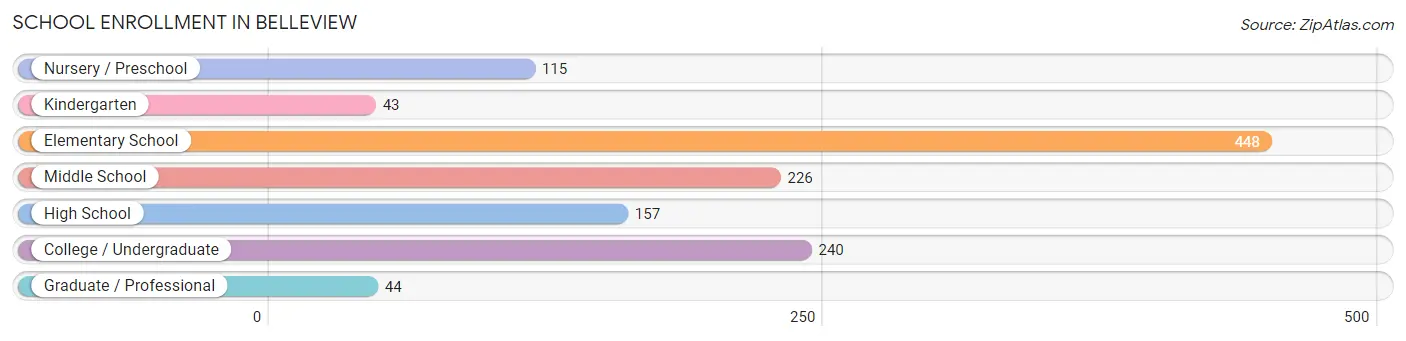
| School Level | # Students | % Students |
| Nursery / Preschool | 115 | 9.0% |
| Kindergarten | 43 | 3.4% |
| Elementary School | 448 | 35.2% |
| Middle School | 226 | 17.7% |
| High School | 157 | 12.3% |
| College / Undergraduate | 240 | 18.9% |
| Graduate / Professional | 44 | 3.5% |
| Total | 1,273 | 100.0% |
School Enrollment by Age by Funding Source in Belleview
Out of a total of 1,273 students who are enrolled in schools in Belleview, 227 (17.8%) attend a private institution, while the remaining 1,046 (82.2%) are enrolled in public schools. The age group of 3 to 4 year olds has the highest likelihood of being enrolled in private schools, with 115 (100.0% in the age bracket) enrolled. Conversely, the age group of 5 to 9 year old has the lowest likelihood of being enrolled in a private school, with 422 (100.0% in the age bracket) attending a public institution.
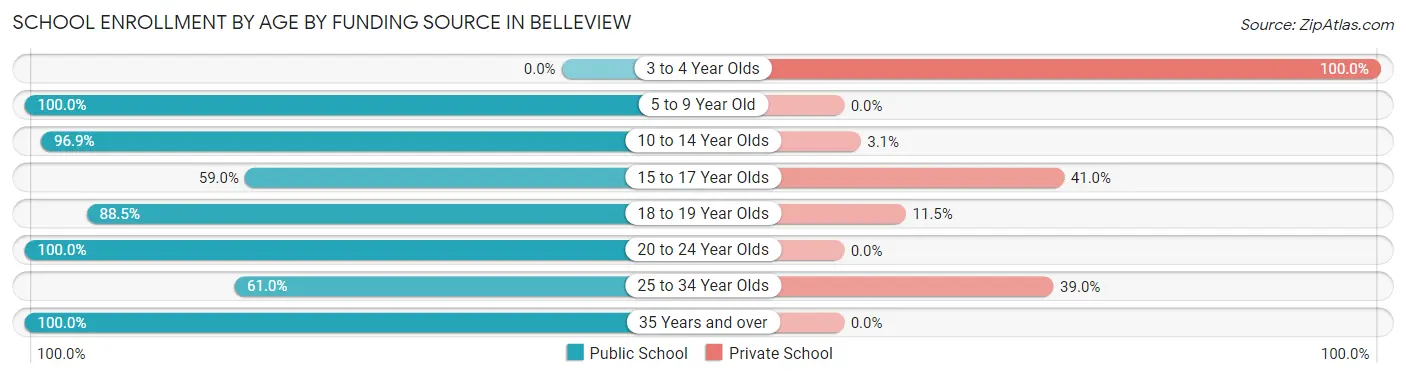
| Age Bracket | Public School | Private School |
| 3 to 4 Year Olds | 0 (0.0%) | 115 (100.0%) |
| 5 to 9 Year Old | 422 (100.0%) | 0 (0.0%) |
| 10 to 14 Year Olds | 251 (96.9%) | 8 (3.1%) |
| 15 to 17 Year Olds | 105 (59.0%) | 73 (41.0%) |
| 18 to 19 Year Olds | 115 (88.5%) | 15 (11.5%) |
| 20 to 24 Year Olds | 100 (100.0%) | 0 (0.0%) |
| 25 to 34 Year Olds | 25 (61.0%) | 16 (39.0%) |
| 35 Years and over | 28 (100.0%) | 0 (0.0%) |
| Total | 1,046 (82.2%) | 227 (17.8%) |
Educational Attainment by Field of Study in Belleview
Business (211 | 22.8%), liberal arts & history (176 | 19.1%), education (133 | 14.4%), communications (78 | 8.4%), and science & technology (73 | 7.9%) are the most common fields of study among 924 individuals in Belleview who have obtained a bachelor's degree or higher.
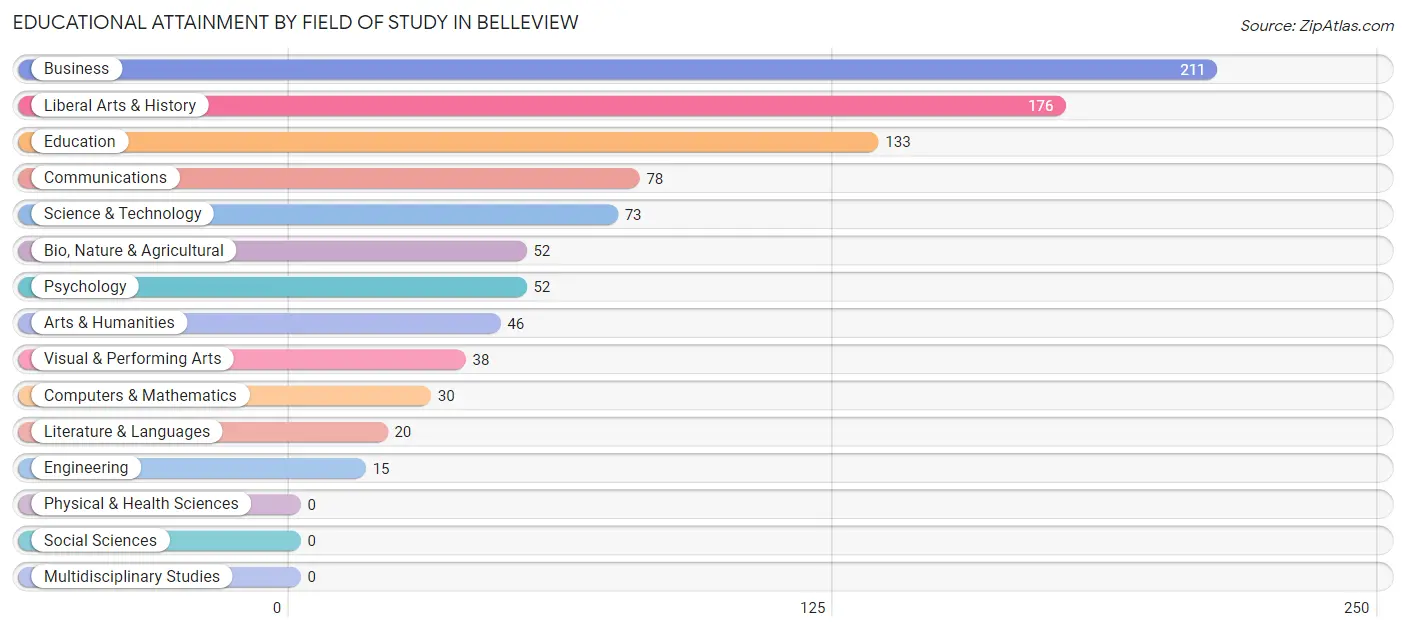
| Field of Study | # Graduates | % Graduates |
| Computers & Mathematics | 30 | 3.3% |
| Bio, Nature & Agricultural | 52 | 5.6% |
| Physical & Health Sciences | 0 | 0.0% |
| Psychology | 52 | 5.6% |
| Social Sciences | 0 | 0.0% |
| Engineering | 15 | 1.6% |
| Multidisciplinary Studies | 0 | 0.0% |
| Science & Technology | 73 | 7.9% |
| Business | 211 | 22.8% |
| Education | 133 | 14.4% |
| Literature & Languages | 20 | 2.2% |
| Liberal Arts & History | 176 | 19.1% |
| Visual & Performing Arts | 38 | 4.1% |
| Communications | 78 | 8.4% |
| Arts & Humanities | 46 | 5.0% |
| Total | 924 | 100.0% |
Transportation & Commute in Belleview
Vehicle Availability by Sex in Belleview
The most prevalent vehicle ownership categories in Belleview are males with 2 vehicles (419, accounting for 32.5%) and females with 2 vehicles (430, making up 37.3%).
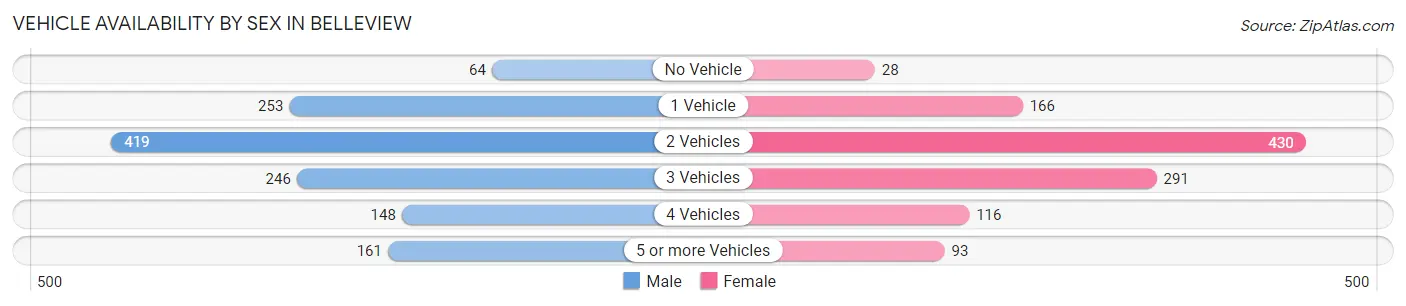
| Vehicles Available | Male | Female |
| No Vehicle | 64 (5.0%) | 28 (2.5%) |
| 1 Vehicle | 253 (19.6%) | 166 (14.8%) |
| 2 Vehicles | 419 (32.5%) | 430 (38.3%) |
| 3 Vehicles | 246 (19.1%) | 291 (25.9%) |
| 4 Vehicles | 148 (11.5%) | 116 (10.3%) |
| 5 or more Vehicles | 161 (12.5%) | 93 (8.3%) |
| Total | 1,291 (100.0%) | 1,124 (100.0%) |
Commute Time in Belleview
The most frequently occuring commute durations in Belleview are 30 to 34 minutes (424 commuters, 19.1%), 20 to 24 minutes (395 commuters, 17.8%), and 5 to 9 minutes (254 commuters, 11.5%).
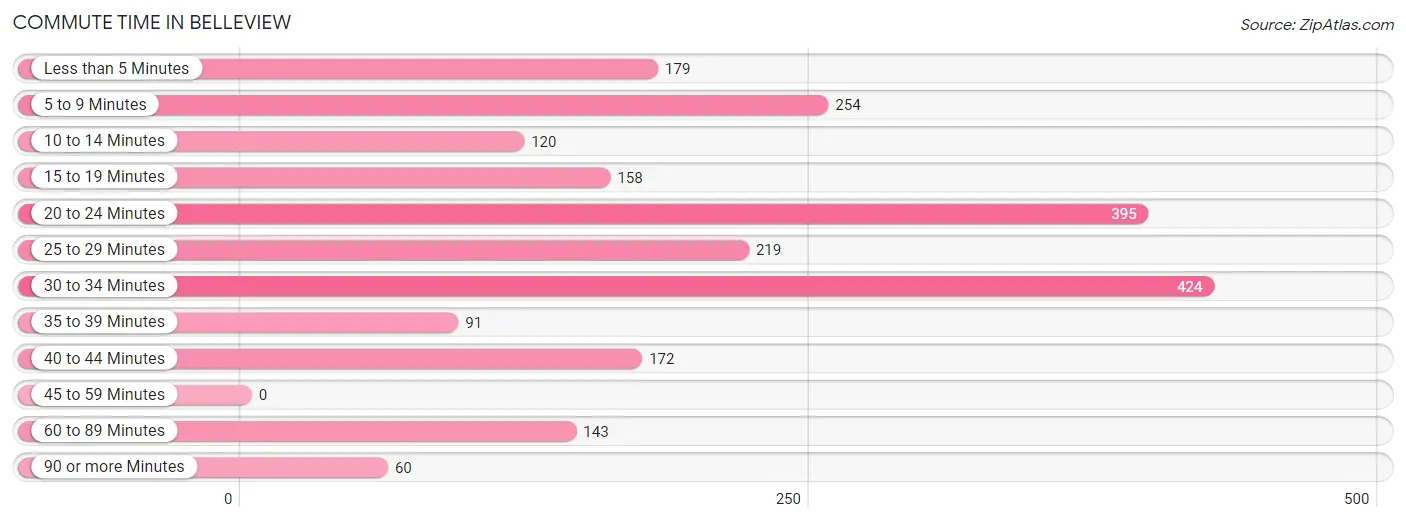
| Commute Time | # Commuters | % Commuters |
| Less than 5 Minutes | 179 | 8.1% |
| 5 to 9 Minutes | 254 | 11.5% |
| 10 to 14 Minutes | 120 | 5.4% |
| 15 to 19 Minutes | 158 | 7.1% |
| 20 to 24 Minutes | 395 | 17.8% |
| 25 to 29 Minutes | 219 | 9.9% |
| 30 to 34 Minutes | 424 | 19.1% |
| 35 to 39 Minutes | 91 | 4.1% |
| 40 to 44 Minutes | 172 | 7.8% |
| 45 to 59 Minutes | 0 | 0.0% |
| 60 to 89 Minutes | 143 | 6.5% |
| 90 or more Minutes | 60 | 2.7% |
Commute Time by Sex in Belleview
The most common commute times in Belleview are 30 to 34 minutes (281 commuters, 24.1%) for males and 20 to 24 minutes (305 commuters, 29.0%) for females.
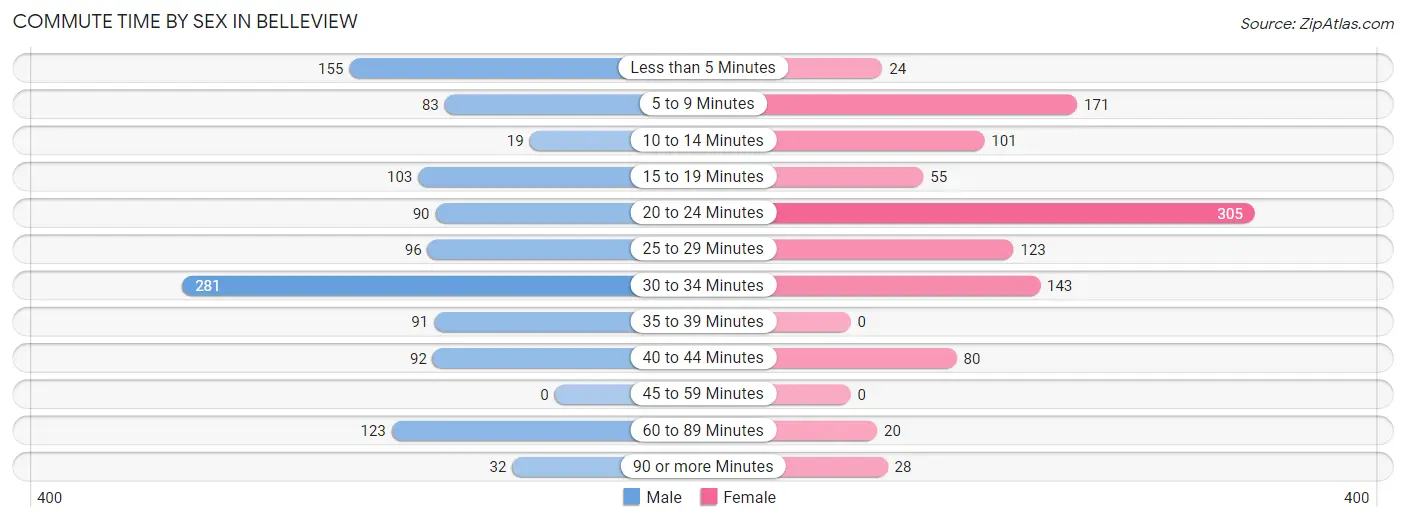
| Commute Time | Male | Female |
| Less than 5 Minutes | 155 (13.3%) | 24 (2.3%) |
| 5 to 9 Minutes | 83 (7.1%) | 171 (16.3%) |
| 10 to 14 Minutes | 19 (1.6%) | 101 (9.6%) |
| 15 to 19 Minutes | 103 (8.8%) | 55 (5.2%) |
| 20 to 24 Minutes | 90 (7.7%) | 305 (29.0%) |
| 25 to 29 Minutes | 96 (8.2%) | 123 (11.7%) |
| 30 to 34 Minutes | 281 (24.1%) | 143 (13.6%) |
| 35 to 39 Minutes | 91 (7.8%) | 0 (0.0%) |
| 40 to 44 Minutes | 92 (7.9%) | 80 (7.6%) |
| 45 to 59 Minutes | 0 (0.0%) | 0 (0.0%) |
| 60 to 89 Minutes | 123 (10.6%) | 20 (1.9%) |
| 90 or more Minutes | 32 (2.8%) | 28 (2.7%) |
Time of Departure to Work by Sex in Belleview
The most frequent times of departure to work in Belleview are 7:00 AM to 7:29 AM (298, 25.6%) for males and 7:00 AM to 7:29 AM (406, 38.7%) for females.
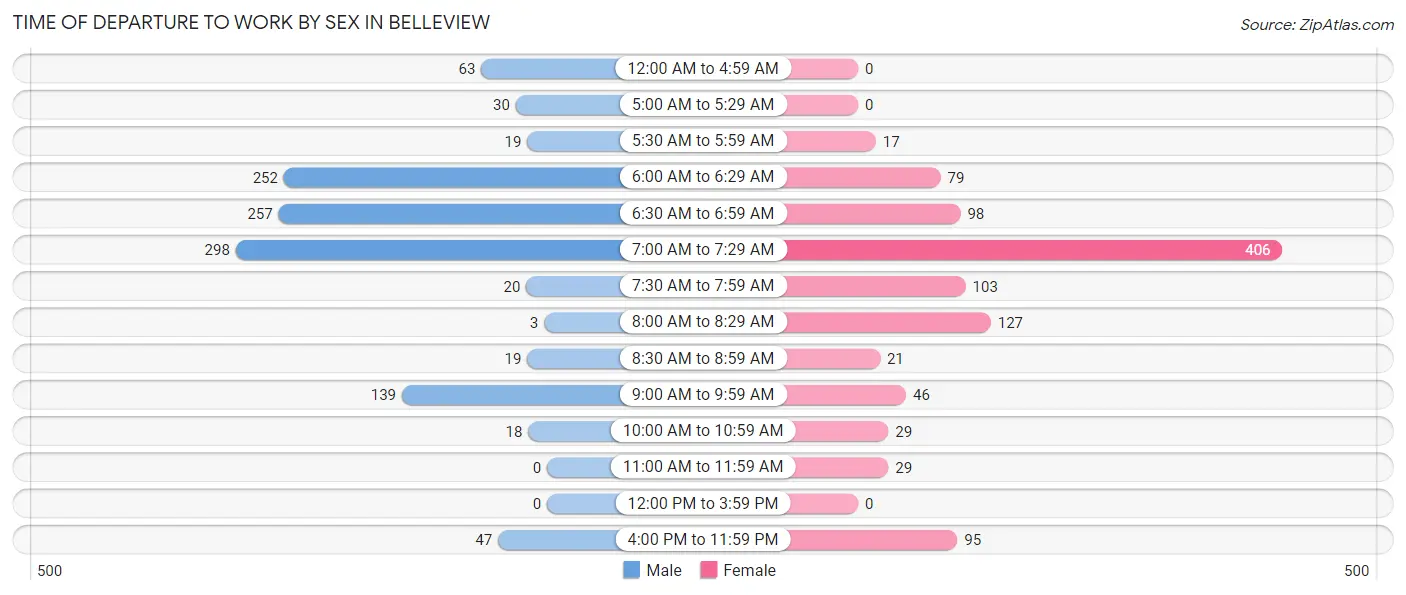
| Time of Departure | Male | Female |
| 12:00 AM to 4:59 AM | 63 (5.4%) | 0 (0.0%) |
| 5:00 AM to 5:29 AM | 30 (2.6%) | 0 (0.0%) |
| 5:30 AM to 5:59 AM | 19 (1.6%) | 17 (1.6%) |
| 6:00 AM to 6:29 AM | 252 (21.6%) | 79 (7.5%) |
| 6:30 AM to 6:59 AM | 257 (22.1%) | 98 (9.3%) |
| 7:00 AM to 7:29 AM | 298 (25.6%) | 406 (38.7%) |
| 7:30 AM to 7:59 AM | 20 (1.7%) | 103 (9.8%) |
| 8:00 AM to 8:29 AM | 3 (0.3%) | 127 (12.1%) |
| 8:30 AM to 8:59 AM | 19 (1.6%) | 21 (2.0%) |
| 9:00 AM to 9:59 AM | 139 (11.9%) | 46 (4.4%) |
| 10:00 AM to 10:59 AM | 18 (1.5%) | 29 (2.8%) |
| 11:00 AM to 11:59 AM | 0 (0.0%) | 29 (2.8%) |
| 12:00 PM to 3:59 PM | 0 (0.0%) | 0 (0.0%) |
| 4:00 PM to 11:59 PM | 47 (4.0%) | 95 (9.0%) |
| Total | 1,165 (100.0%) | 1,050 (100.0%) |
Housing Occupancy in Belleview
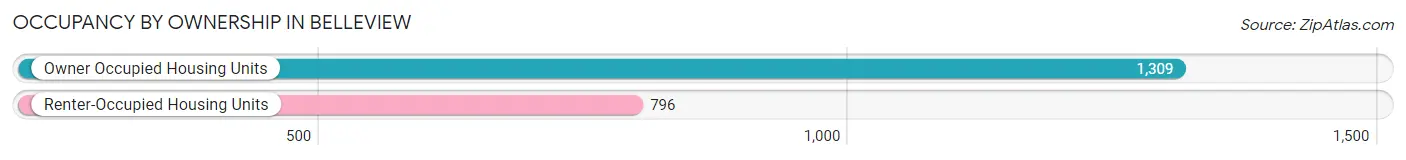
Occupancy by Ownership in Belleview
Of the total 2,105 dwellings in Belleview, owner-occupied units account for 1,309 (62.2%), while renter-occupied units make up 796 (37.8%).
| Occupancy | # Housing Units | % Housing Units |
| Owner Occupied Housing Units | 1,309 | 62.2% |
| Renter-Occupied Housing Units | 796 | 37.8% |
| Total Occupied Housing Units | 2,105 | 100.0% |
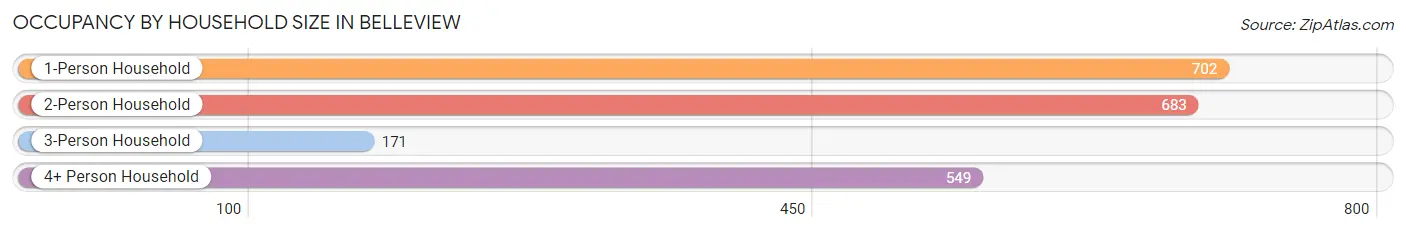
Occupancy by Household Size in Belleview
| Household Size | # Housing Units | % Housing Units |
| 1-Person Household | 702 | 33.4% |
| 2-Person Household | 683 | 32.5% |
| 3-Person Household | 171 | 8.1% |
| 4+ Person Household | 549 | 26.1% |
| Total Housing Units | 2,105 | 100.0% |
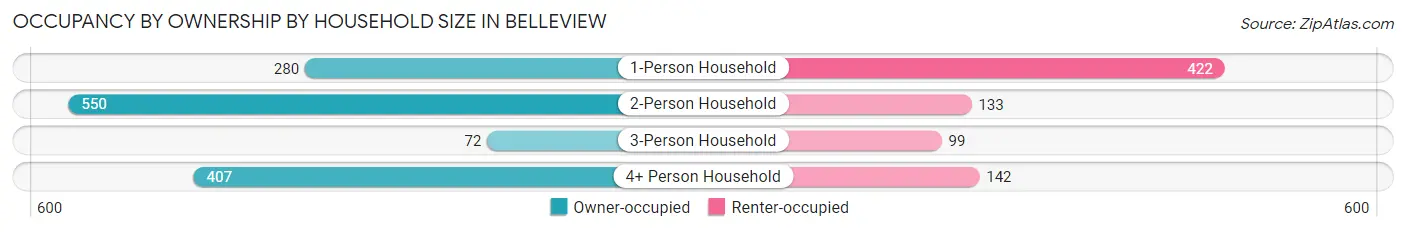
Occupancy by Ownership by Household Size in Belleview
| Household Size | Owner-occupied | Renter-occupied |
| 1-Person Household | 280 (39.9%) | 422 (60.1%) |
| 2-Person Household | 550 (80.5%) | 133 (19.5%) |
| 3-Person Household | 72 (42.1%) | 99 (57.9%) |
| 4+ Person Household | 407 (74.1%) | 142 (25.9%) |
| Total Housing Units | 1,309 (62.2%) | 796 (37.8%) |
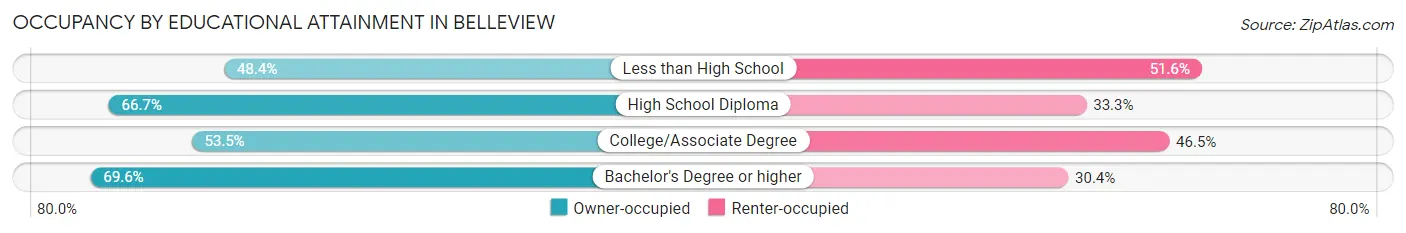
Occupancy by Educational Attainment in Belleview
| Household Size | Owner-occupied | Renter-occupied |
| Less than High School | 74 (48.4%) | 79 (51.6%) |
| High School Diploma | 524 (66.7%) | 262 (33.3%) |
| College/Associate Degree | 334 (53.5%) | 290 (46.5%) |
| Bachelor's Degree or higher | 377 (69.6%) | 165 (30.4%) |
Occupancy by Age of Householder in Belleview
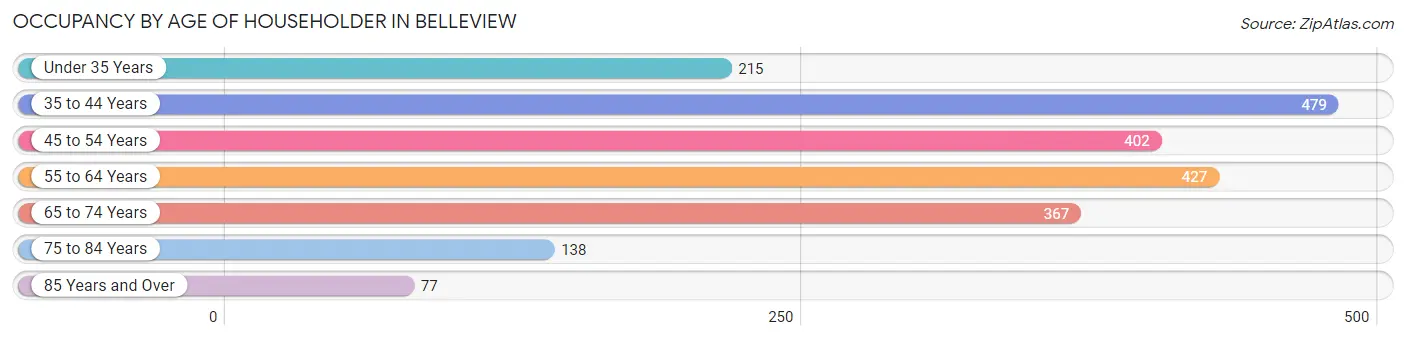
| Age Bracket | # Households | % Households |
| Under 35 Years | 215 | 10.2% |
| 35 to 44 Years | 479 | 22.8% |
| 45 to 54 Years | 402 | 19.1% |
| 55 to 64 Years | 427 | 20.3% |
| 65 to 74 Years | 367 | 17.4% |
| 75 to 84 Years | 138 | 6.6% |
| 85 Years and Over | 77 | 3.7% |
| Total | 2,105 | 100.0% |
Housing Finances in Belleview
Median Income by Occupancy in Belleview
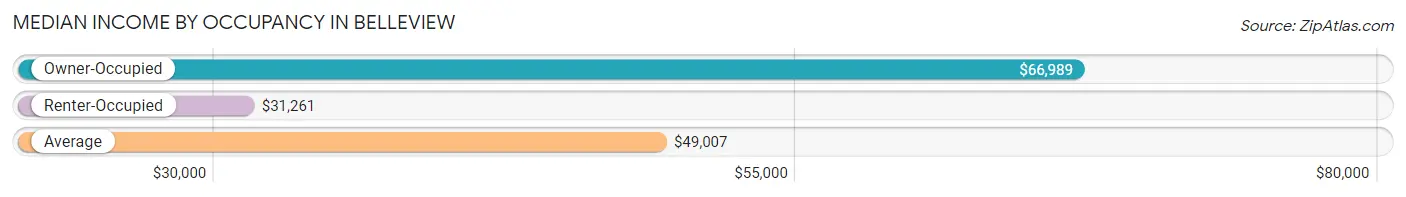
| Occupancy Type | # Households | Median Income |
| Owner-Occupied | 1,309 (62.2%) | $66,989 |
| Renter-Occupied | 796 (37.8%) | $31,261 |
| Average | 2,105 (100.0%) | $49,007 |
Occupancy by Householder Income Bracket in Belleview
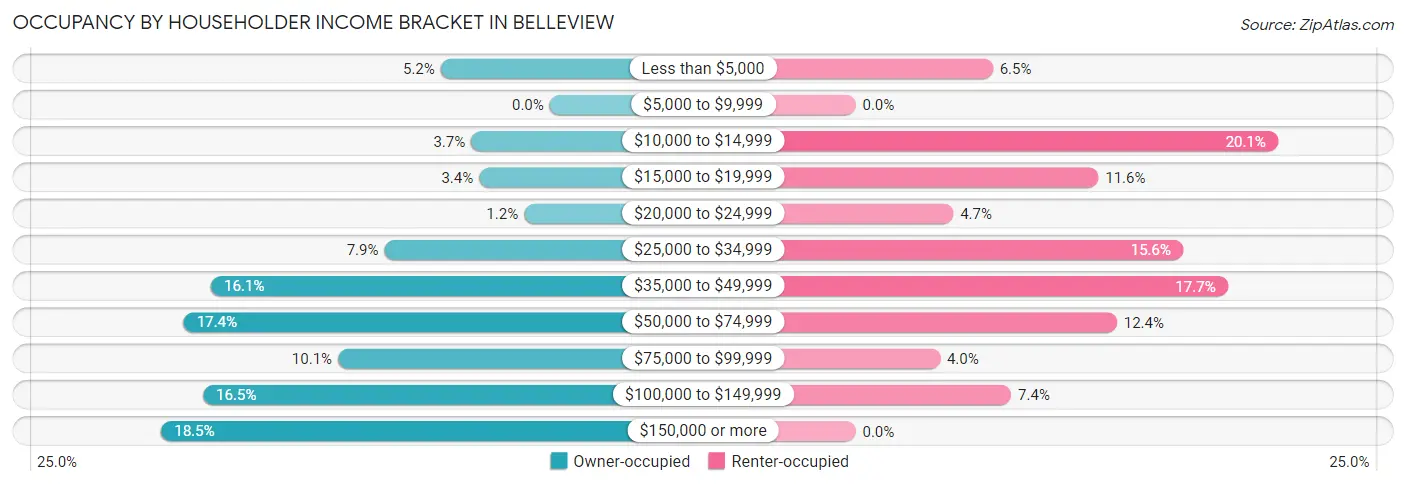
| Income Bracket | Owner-occupied | Renter-occupied |
| Less than $5,000 | 68 (5.2%) | 52 (6.5%) |
| $5,000 to $9,999 | 0 (0.0%) | 0 (0.0%) |
| $10,000 to $14,999 | 49 (3.7%) | 160 (20.1%) |
| $15,000 to $19,999 | 44 (3.4%) | 92 (11.6%) |
| $20,000 to $24,999 | 16 (1.2%) | 37 (4.6%) |
| $25,000 to $34,999 | 103 (7.9%) | 124 (15.6%) |
| $35,000 to $49,999 | 211 (16.1%) | 141 (17.7%) |
| $50,000 to $74,999 | 228 (17.4%) | 99 (12.4%) |
| $75,000 to $99,999 | 132 (10.1%) | 32 (4.0%) |
| $100,000 to $149,999 | 216 (16.5%) | 59 (7.4%) |
| $150,000 or more | 242 (18.5%) | 0 (0.0%) |
| Total | 1,309 (100.0%) | 796 (100.0%) |
Monthly Housing Cost Tiers in Belleview
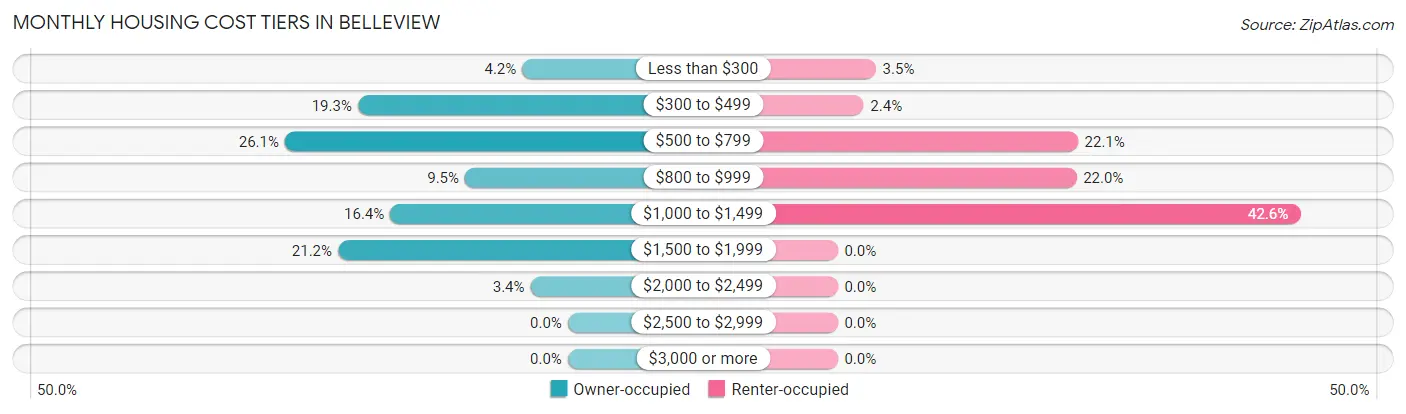
| Monthly Cost | Owner-occupied | Renter-occupied |
| Less than $300 | 55 (4.2%) | 28 (3.5%) |
| $300 to $499 | 253 (19.3%) | 19 (2.4%) |
| $500 to $799 | 341 (26.1%) | 176 (22.1%) |
| $800 to $999 | 124 (9.5%) | 175 (22.0%) |
| $1,000 to $1,499 | 214 (16.4%) | 339 (42.6%) |
| $1,500 to $1,999 | 277 (21.2%) | 0 (0.0%) |
| $2,000 to $2,499 | 45 (3.4%) | 0 (0.0%) |
| $2,500 to $2,999 | 0 (0.0%) | 0 (0.0%) |
| $3,000 or more | 0 (0.0%) | 0 (0.0%) |
| Total | 1,309 (100.0%) | 796 (100.0%) |
Physical Housing Characteristics in Belleview
Housing Structures in Belleview
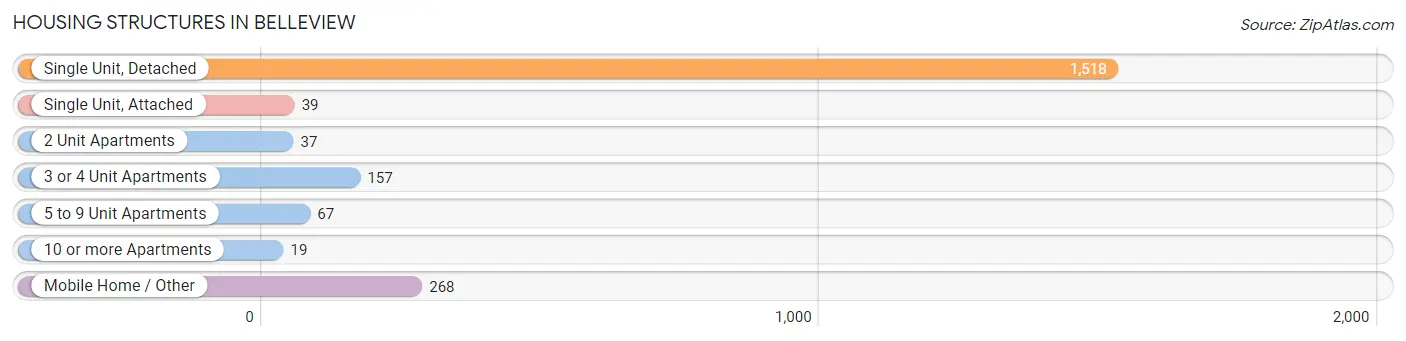
| Structure Type | # Housing Units | % Housing Units |
| Single Unit, Detached | 1,518 | 72.1% |
| Single Unit, Attached | 39 | 1.8% |
| 2 Unit Apartments | 37 | 1.8% |
| 3 or 4 Unit Apartments | 157 | 7.5% |
| 5 to 9 Unit Apartments | 67 | 3.2% |
| 10 or more Apartments | 19 | 0.9% |
| Mobile Home / Other | 268 | 12.7% |
| Total | 2,105 | 100.0% |
Housing Structures by Occupancy in Belleview
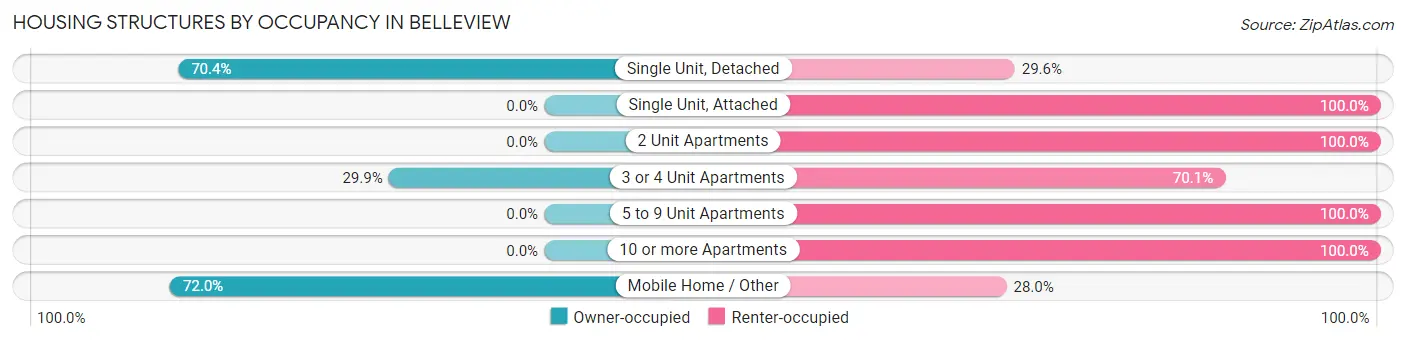
| Structure Type | Owner-occupied | Renter-occupied |
| Single Unit, Detached | 1,069 (70.4%) | 449 (29.6%) |
| Single Unit, Attached | 0 (0.0%) | 39 (100.0%) |
| 2 Unit Apartments | 0 (0.0%) | 37 (100.0%) |
| 3 or 4 Unit Apartments | 47 (29.9%) | 110 (70.1%) |
| 5 to 9 Unit Apartments | 0 (0.0%) | 67 (100.0%) |
| 10 or more Apartments | 0 (0.0%) | 19 (100.0%) |
| Mobile Home / Other | 193 (72.0%) | 75 (28.0%) |
| Total | 1,309 (62.2%) | 796 (37.8%) |
Housing Structures by Number of Rooms in Belleview
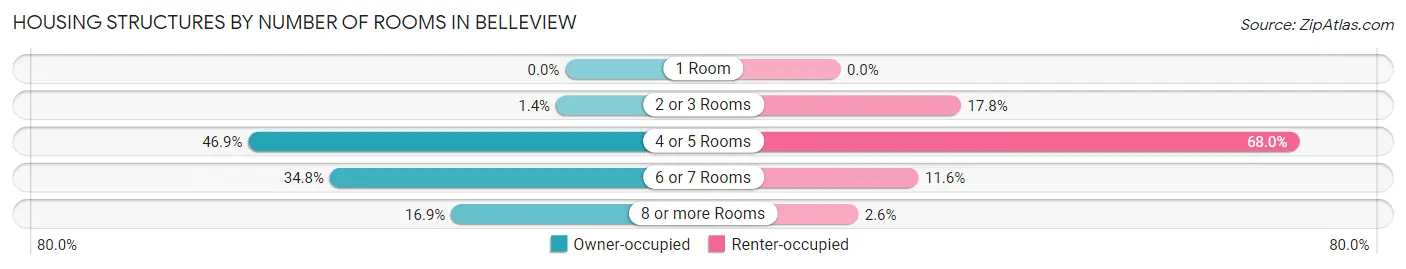
| Number of Rooms | Owner-occupied | Renter-occupied |
| 1 Room | 0 (0.0%) | 0 (0.0%) |
| 2 or 3 Rooms | 18 (1.4%) | 142 (17.8%) |
| 4 or 5 Rooms | 614 (46.9%) | 541 (68.0%) |
| 6 or 7 Rooms | 456 (34.8%) | 92 (11.6%) |
| 8 or more Rooms | 221 (16.9%) | 21 (2.6%) |
| Total | 1,309 (100.0%) | 796 (100.0%) |
Housing Structure by Heating Type in Belleview
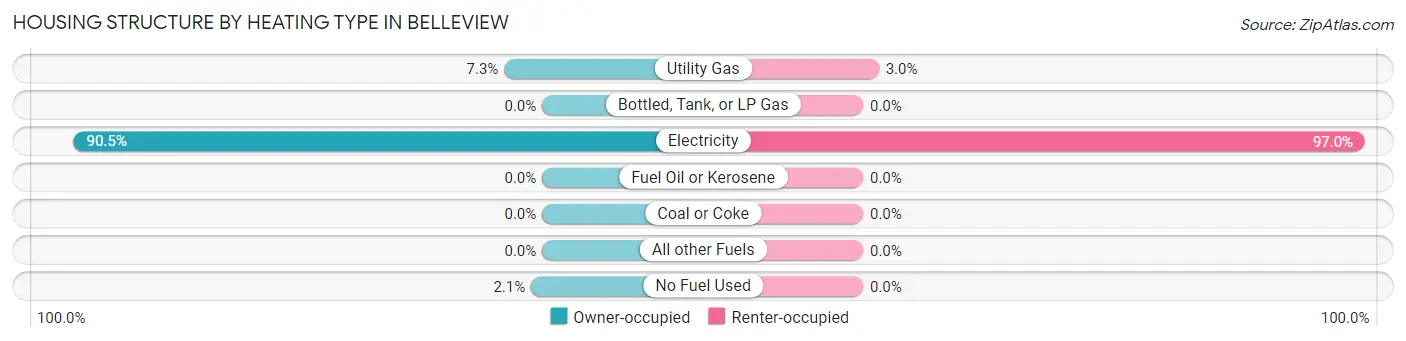
| Heating Type | Owner-occupied | Renter-occupied |
| Utility Gas | 96 (7.3%) | 24 (3.0%) |
| Bottled, Tank, or LP Gas | 0 (0.0%) | 0 (0.0%) |
| Electricity | 1,185 (90.5%) | 772 (97.0%) |
| Fuel Oil or Kerosene | 0 (0.0%) | 0 (0.0%) |
| Coal or Coke | 0 (0.0%) | 0 (0.0%) |
| All other Fuels | 0 (0.0%) | 0 (0.0%) |
| No Fuel Used | 28 (2.1%) | 0 (0.0%) |
| Total | 1,309 (100.0%) | 796 (100.0%) |
Household Vehicle Usage in Belleview
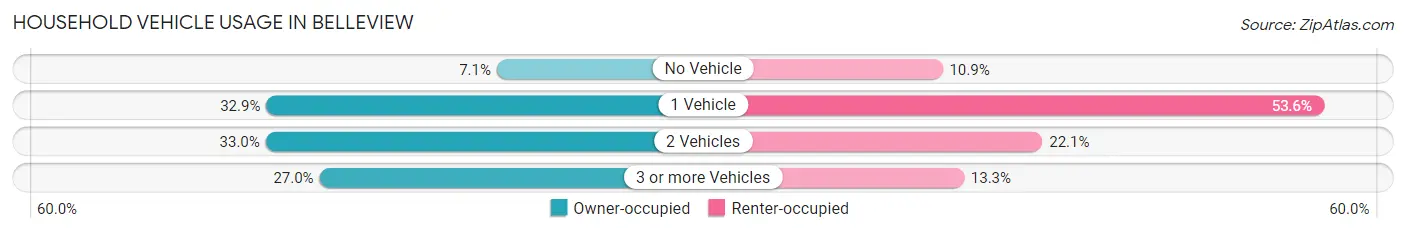
| Vehicles per Household | Owner-occupied | Renter-occupied |
| No Vehicle | 93 (7.1%) | 87 (10.9%) |
| 1 Vehicle | 431 (32.9%) | 427 (53.6%) |
| 2 Vehicles | 432 (33.0%) | 176 (22.1%) |
| 3 or more Vehicles | 353 (27.0%) | 106 (13.3%) |
| Total | 1,309 (100.0%) | 796 (100.0%) |
Real Estate & Mortgages in Belleview
Real Estate and Mortgage Overview in Belleview
| Characteristic | Without Mortgage | With Mortgage |
| Housing Units | 583 | 726 |
| Median Property Value | $99,900 | $201,700 |
| Median Household Income | $46,319 | $95 |
| Monthly Housing Costs | $493 | $0 |
| Real Estate Taxes | $1,116 | $12 |
Property Value by Mortgage Status in Belleview
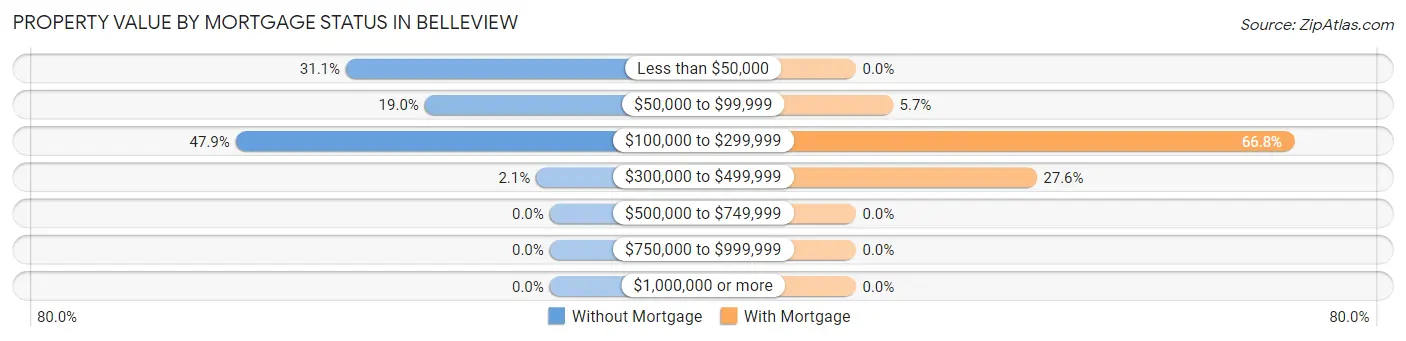
| Property Value | Without Mortgage | With Mortgage |
| Less than $50,000 | 181 (31.0%) | 0 (0.0%) |
| $50,000 to $99,999 | 111 (19.0%) | 41 (5.7%) |
| $100,000 to $299,999 | 279 (47.9%) | 485 (66.8%) |
| $300,000 to $499,999 | 12 (2.1%) | 200 (27.6%) |
| $500,000 to $749,999 | 0 (0.0%) | 0 (0.0%) |
| $750,000 to $999,999 | 0 (0.0%) | 0 (0.0%) |
| $1,000,000 or more | 0 (0.0%) | 0 (0.0%) |
| Total | 583 (100.0%) | 726 (100.0%) |
Household Income by Mortgage Status in Belleview
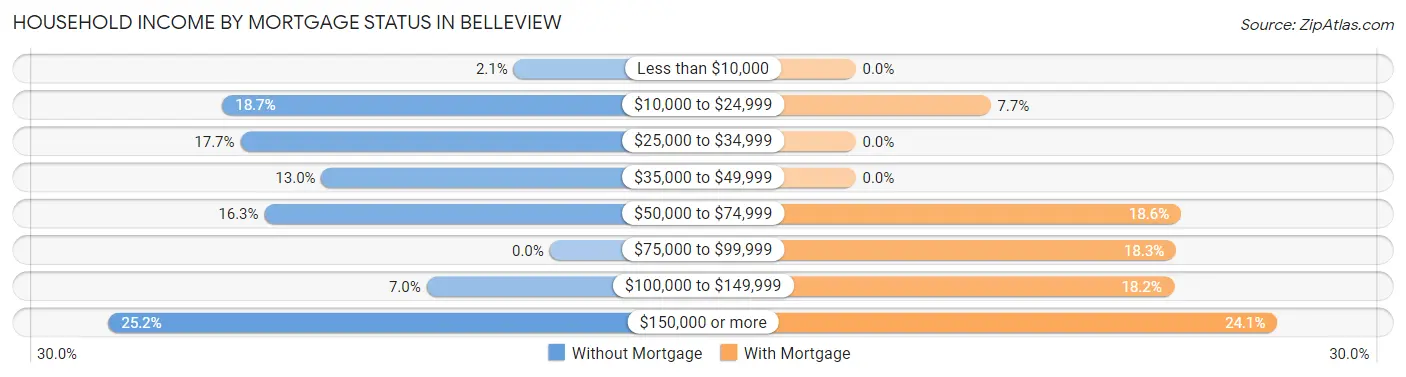
| Household Income | Without Mortgage | With Mortgage |
| Less than $10,000 | 12 (2.1%) | 0 (0.0%) |
| $10,000 to $24,999 | 109 (18.7%) | 56 (7.7%) |
| $25,000 to $34,999 | 103 (17.7%) | 0 (0.0%) |
| $35,000 to $49,999 | 76 (13.0%) | 0 (0.0%) |
| $50,000 to $74,999 | 95 (16.3%) | 135 (18.6%) |
| $75,000 to $99,999 | 0 (0.0%) | 133 (18.3%) |
| $100,000 to $149,999 | 41 (7.0%) | 132 (18.2%) |
| $150,000 or more | 147 (25.2%) | 175 (24.1%) |
| Total | 583 (100.0%) | 726 (100.0%) |
Property Value to Household Income Ratio in Belleview
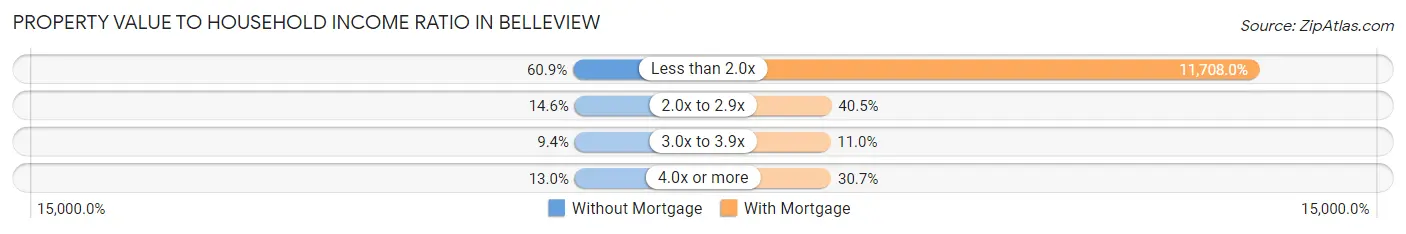
| Value-to-Income Ratio | Without Mortgage | With Mortgage |
| Less than 2.0x | 355 (60.9%) | 85,000 (11,708.0%) |
| 2.0x to 2.9x | 85 (14.6%) | 294 (40.5%) |
| 3.0x to 3.9x | 55 (9.4%) | 80 (11.0%) |
| 4.0x or more | 76 (13.0%) | 223 (30.7%) |
| Total | 583 (100.0%) | 726 (100.0%) |
Real Estate Taxes by Mortgage Status in Belleview
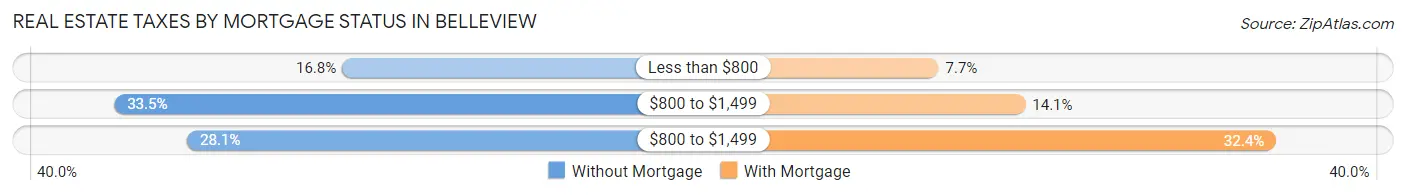
| Property Taxes | Without Mortgage | With Mortgage |
| Less than $800 | 98 (16.8%) | 56 (7.7%) |
| $800 to $1,499 | 195 (33.5%) | 102 (14.1%) |
| $800 to $1,499 | 164 (28.1%) | 235 (32.4%) |
| Total | 583 (100.0%) | 726 (100.0%) |
Health & Disability in Belleview
Health Insurance Coverage by Age in Belleview
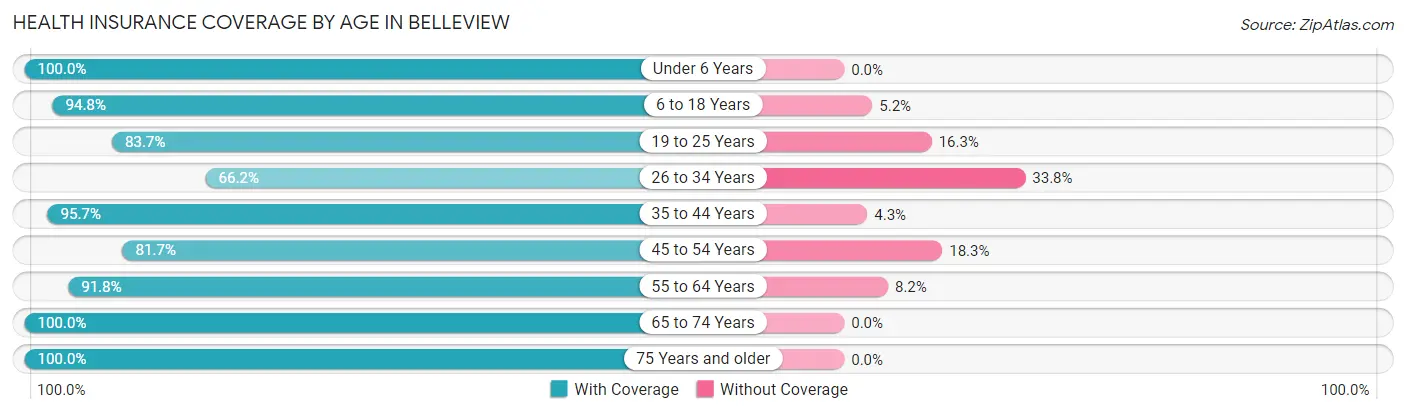
| Age Bracket | With Coverage | Without Coverage |
| Under 6 Years | 361 (100.0%) | 0 (0.0%) |
| 6 to 18 Years | 943 (94.8%) | 52 (5.2%) |
| 19 to 25 Years | 488 (83.7%) | 95 (16.3%) |
| 26 to 34 Years | 310 (66.2%) | 158 (33.8%) |
| 35 to 44 Years | 756 (95.7%) | 34 (4.3%) |
| 45 to 54 Years | 541 (81.7%) | 121 (18.3%) |
| 55 to 64 Years | 619 (91.8%) | 55 (8.2%) |
| 65 to 74 Years | 570 (100.0%) | 0 (0.0%) |
| 75 Years and older | 308 (100.0%) | 0 (0.0%) |
| Total | 4,896 (90.5%) | 515 (9.5%) |
Health Insurance Coverage by Citizenship Status in Belleview
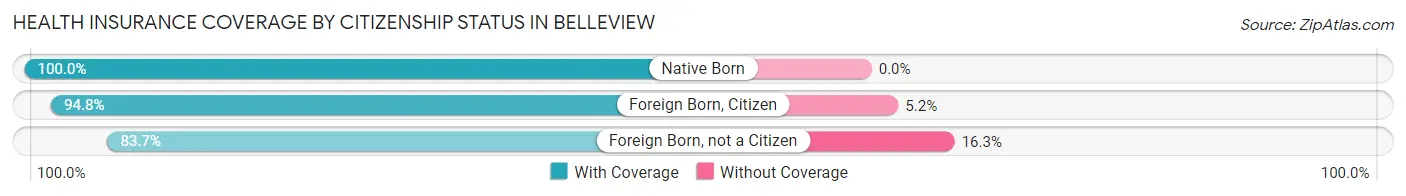
| Citizenship Status | With Coverage | Without Coverage |
| Native Born | 361 (100.0%) | 0 (0.0%) |
| Foreign Born, Citizen | 943 (94.8%) | 52 (5.2%) |
| Foreign Born, not a Citizen | 488 (83.7%) | 95 (16.3%) |
Health Insurance Coverage by Household Income in Belleview
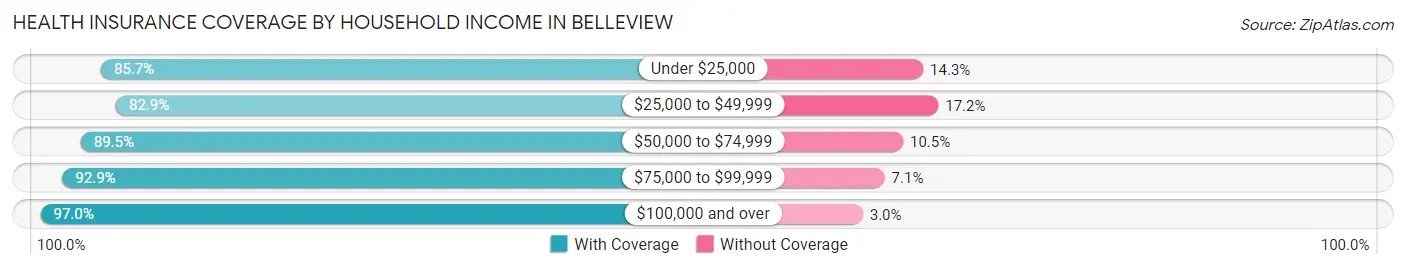
| Household Income | With Coverage | Without Coverage |
| Under $25,000 | 916 (85.7%) | 153 (14.3%) |
| $25,000 to $49,999 | 850 (82.9%) | 176 (17.2%) |
| $50,000 to $74,999 | 747 (89.5%) | 88 (10.5%) |
| $75,000 to $99,999 | 485 (92.9%) | 37 (7.1%) |
| $100,000 and over | 1,881 (97.0%) | 58 (3.0%) |
Public vs Private Health Insurance Coverage by Age in Belleview
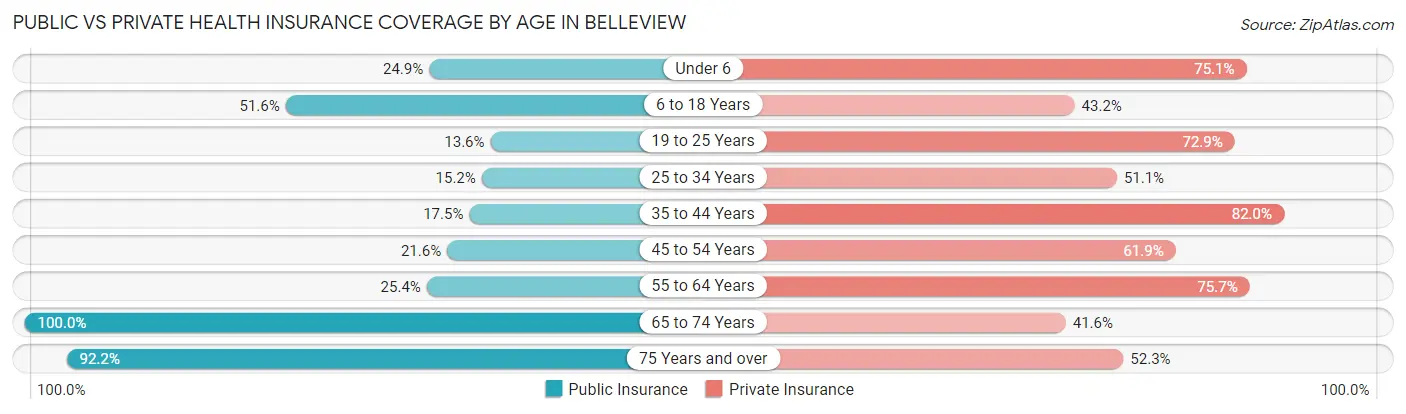
| Age Bracket | Public Insurance | Private Insurance |
| Under 6 | 90 (24.9%) | 271 (75.1%) |
| 6 to 18 Years | 513 (51.6%) | 430 (43.2%) |
| 19 to 25 Years | 79 (13.6%) | 425 (72.9%) |
| 25 to 34 Years | 71 (15.2%) | 239 (51.1%) |
| 35 to 44 Years | 138 (17.5%) | 648 (82.0%) |
| 45 to 54 Years | 143 (21.6%) | 410 (61.9%) |
| 55 to 64 Years | 171 (25.4%) | 510 (75.7%) |
| 65 to 74 Years | 570 (100.0%) | 237 (41.6%) |
| 75 Years and over | 284 (92.2%) | 161 (52.3%) |
| Total | 2,059 (38.1%) | 3,331 (61.6%) |
Disability Status by Sex by Age in Belleview
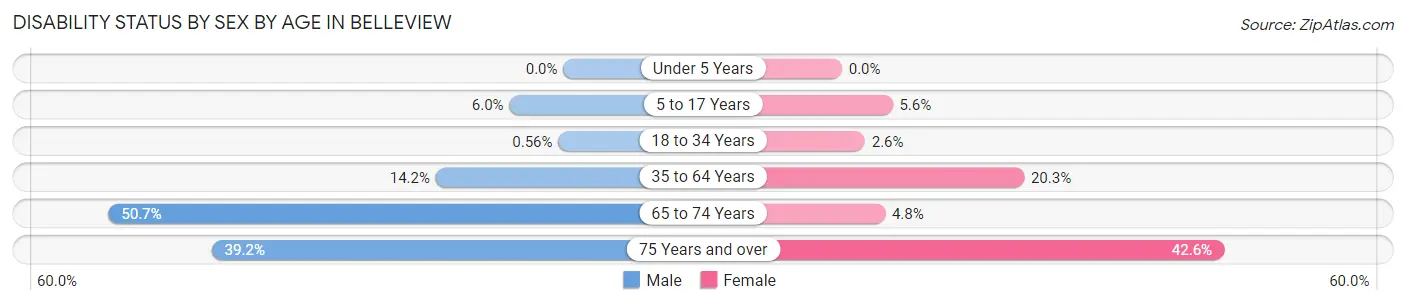
| Age Bracket | Male | Female |
| Under 5 Years | 0 (0.0%) | 0 (0.0%) |
| 5 to 17 Years | 27 (6.0%) | 27 (5.6%) |
| 18 to 34 Years | 3 (0.6%) | 15 (2.6%) |
| 35 to 64 Years | 134 (14.2%) | 240 (20.3%) |
| 65 to 74 Years | 152 (50.7%) | 13 (4.8%) |
| 75 Years and over | 47 (39.2%) | 80 (42.5%) |
Disability Class by Sex by Age in Belleview
Disability Class: Hearing Difficulty
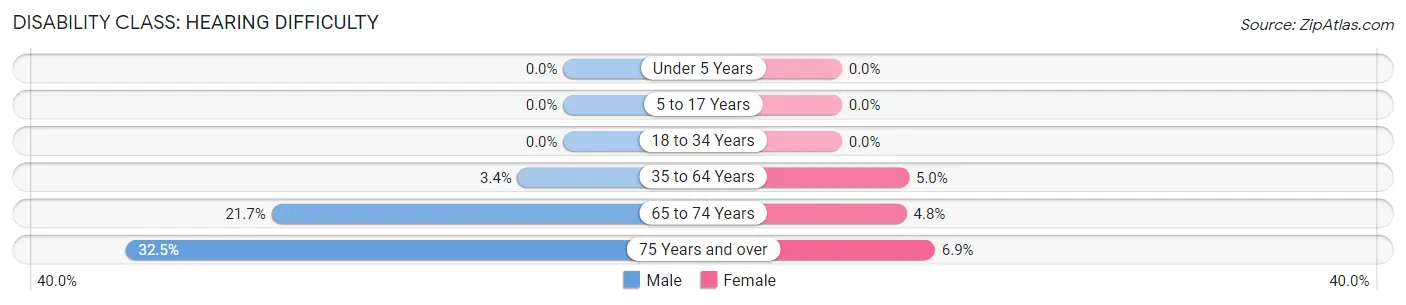
| Age Bracket | Male | Female |
| Under 5 Years | 0 (0.0%) | 0 (0.0%) |
| 5 to 17 Years | 0 (0.0%) | 0 (0.0%) |
| 18 to 34 Years | 0 (0.0%) | 0 (0.0%) |
| 35 to 64 Years | 32 (3.4%) | 59 (5.0%) |
| 65 to 74 Years | 65 (21.7%) | 13 (4.8%) |
| 75 Years and over | 39 (32.5%) | 13 (6.9%) |
Disability Class: Vision Difficulty
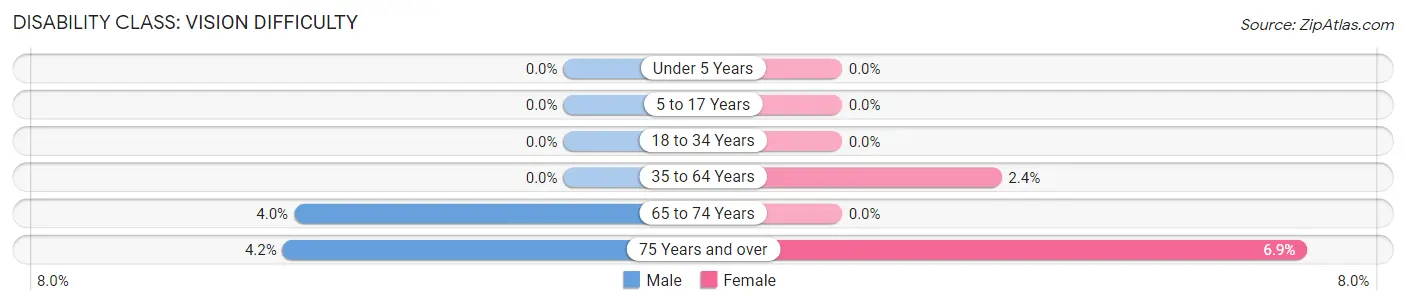
| Age Bracket | Male | Female |
| Under 5 Years | 0 (0.0%) | 0 (0.0%) |
| 5 to 17 Years | 0 (0.0%) | 0 (0.0%) |
| 18 to 34 Years | 0 (0.0%) | 0 (0.0%) |
| 35 to 64 Years | 0 (0.0%) | 28 (2.4%) |
| 65 to 74 Years | 12 (4.0%) | 0 (0.0%) |
| 75 Years and over | 5 (4.2%) | 13 (6.9%) |
Disability Class: Cognitive Difficulty
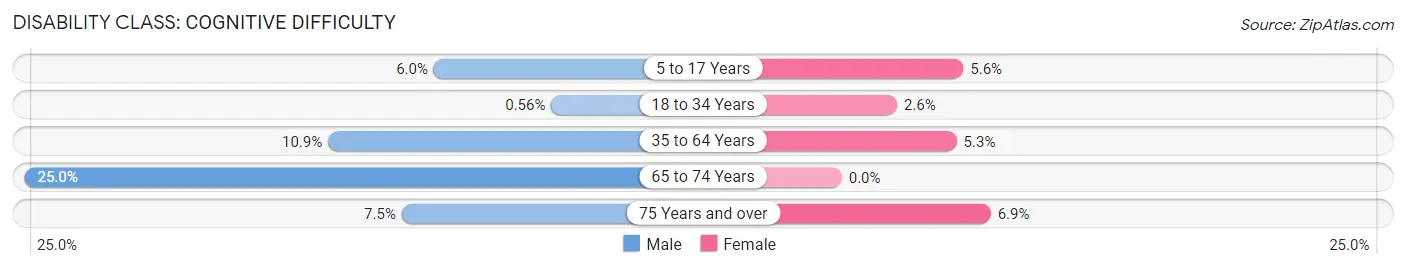
| Age Bracket | Male | Female |
| 5 to 17 Years | 27 (6.0%) | 27 (5.6%) |
| 18 to 34 Years | 3 (0.6%) | 15 (2.6%) |
| 35 to 64 Years | 103 (10.9%) | 63 (5.3%) |
| 65 to 74 Years | 75 (25.0%) | 0 (0.0%) |
| 75 Years and over | 9 (7.5%) | 13 (6.9%) |
Disability Class: Ambulatory Difficulty
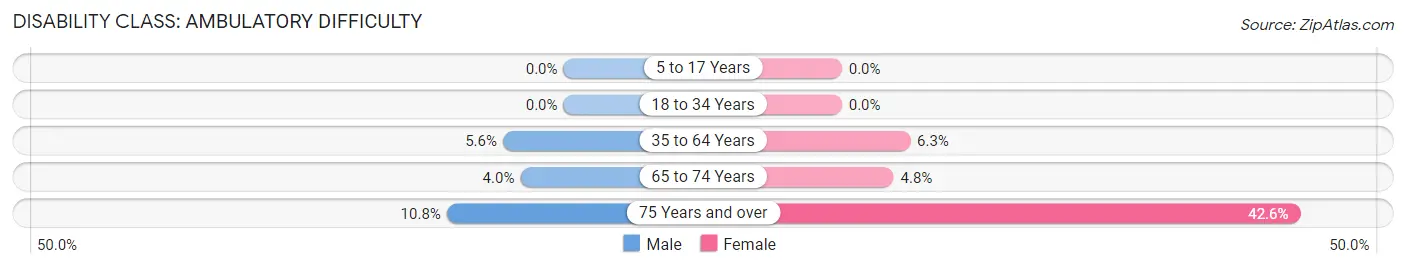
| Age Bracket | Male | Female |
| 5 to 17 Years | 0 (0.0%) | 0 (0.0%) |
| 18 to 34 Years | 0 (0.0%) | 0 (0.0%) |
| 35 to 64 Years | 53 (5.6%) | 75 (6.3%) |
| 65 to 74 Years | 12 (4.0%) | 13 (4.8%) |
| 75 Years and over | 13 (10.8%) | 80 (42.5%) |
Disability Class: Self-Care Difficulty
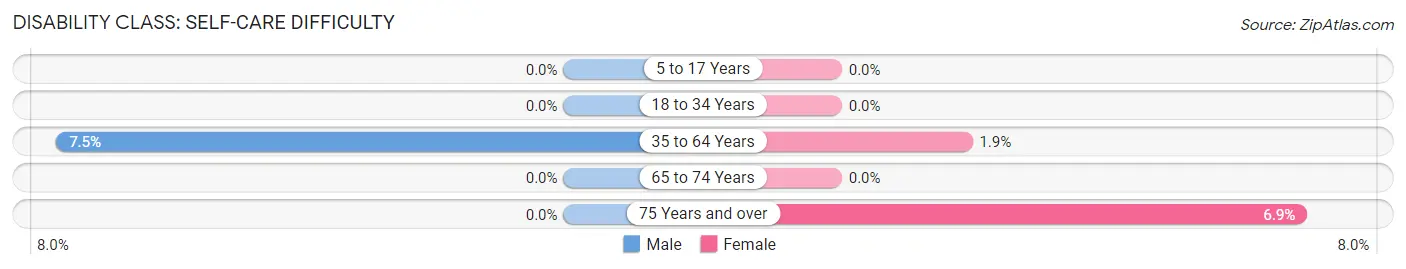
| Age Bracket | Male | Female |
| 5 to 17 Years | 0 (0.0%) | 0 (0.0%) |
| 18 to 34 Years | 0 (0.0%) | 0 (0.0%) |
| 35 to 64 Years | 71 (7.5%) | 23 (1.9%) |
| 65 to 74 Years | 0 (0.0%) | 0 (0.0%) |
| 75 Years and over | 0 (0.0%) | 13 (6.9%) |
Technology Access in Belleview
Computing Device Access in Belleview
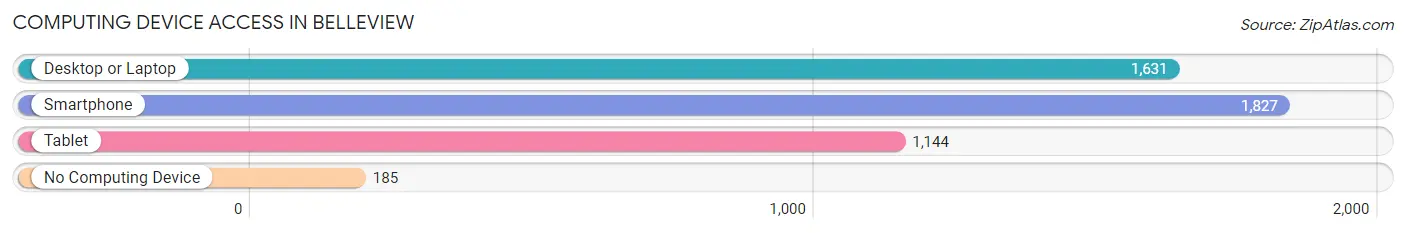
| Device Type | # Households | % Households |
| Desktop or Laptop | 1,631 | 77.5% |
| Smartphone | 1,827 | 86.8% |
| Tablet | 1,144 | 54.3% |
| No Computing Device | 185 | 8.8% |
| Total | 2,105 | 100.0% |
Internet Access in Belleview
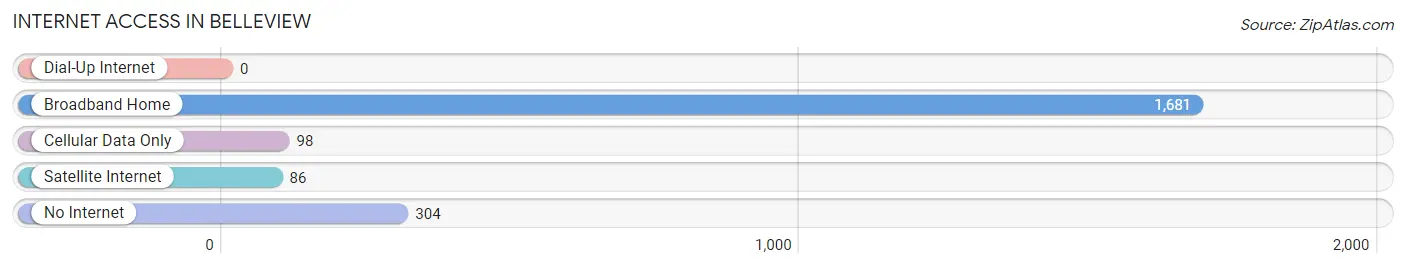
| Internet Type | # Households | % Households |
| Dial-Up Internet | 0 | 0.0% |
| Broadband Home | 1,681 | 79.9% |
| Cellular Data Only | 98 | 4.7% |
| Satellite Internet | 86 | 4.1% |
| No Internet | 304 | 14.4% |
| Total | 2,105 | 100.0% |
Belleview Summary
Belleview, Florida is a small town located in Marion County, Florida. It is situated in the heart of Central Florida, approximately 20 miles south of Ocala and 40 miles northwest of Orlando. The town was founded in 1884 by a group of settlers from Belleview, Kentucky, and was incorporated in 1925. As of the 2010 census, the population of Belleview was 3,478.
History
Belleview was founded in 1884 by a group of settlers from Belleview, Kentucky. The town was named after the Kentucky town, which was named after the beautiful view of the Ohio River from the town. The settlers were attracted to the area due to its fertile soil and abundant wildlife. The first settlers built a sawmill and a gristmill, and the town quickly grew.
In 1925, Belleview was officially incorporated as a town. The town was known for its citrus industry, and it was home to several packing houses. The town also had a thriving lumber industry, and it was home to several sawmills.
In the 1950s, Belleview began to experience a population boom due to the growth of the nearby cities of Ocala and Gainesville. The town was also home to a number of tourist attractions, including a drive-in movie theater, a miniature golf course, and a go-kart track.
Geography
Belleview is located in Marion County, Florida. It is situated in the heart of Central Florida, approximately 20 miles south of Ocala and 40 miles northwest of Orlando. The town is located on the eastern edge of the Ocala National Forest, and it is surrounded by rolling hills and lush forests.
The town is located at an elevation of approximately 100 feet above sea level. The average temperature in Belleview is around 70 degrees Fahrenheit, and the average annual rainfall is around 50 inches.
Economy
Belleview’s economy is largely based on agriculture and tourism. The town is home to several packing houses, and it is also home to a number of tourist attractions, including a drive-in movie theater, a miniature golf course, and a go-kart track.
The town is also home to a number of small businesses, including restaurants, retail stores, and service providers. The town is also home to a number of manufacturing companies, including a furniture manufacturer and a plastics manufacturer.
Demographics
As of the 2010 census, the population of Belleview was 3,478. The population is predominantly white (90.2%), with a small percentage of African Americans (4.2%) and Hispanics (3.2%). The median household income in Belleview is $37,945, and the median home value is $117,400.
Belleview is a small town with a close-knit community. The town is home to a number of churches, and it is also home to a number of civic organizations, including the Belleview Lions Club and the Belleview Historical Society. The town is also home to a number of parks and recreational facilities, including a public pool, a skate park, and a disc golf course.
Common Questions
What is Per Capita Income in Belleview?
Per Capita income in Belleview is $26,405.
What is the Median Family Income in Belleview?
Median Family Income in Belleview is $66,021.
What is the Median Household income in Belleview?
Median Household Income in Belleview is $49,007.
What is Income or Wage Gap in Belleview?
Income or Wage Gap in Belleview is 19.9%.
Women in Belleview earn 80.1 cents for every dollar earned by a man.
What is Inequality or Gini Index in Belleview?
Inequality or Gini Index in Belleview is 0.45.
What is the Total Population of Belleview?
Total Population of Belleview is 5,438.
What is the Total Male Population of Belleview?
Total Male Population of Belleview is 2,664.
What is the Total Female Population of Belleview?
Total Female Population of Belleview is 2,774.
What is the Ratio of Males per 100 Females in Belleview?
There are 96.03 Males per 100 Females in Belleview.
What is the Ratio of Females per 100 Males in Belleview?
There are 104.13 Females per 100 Males in Belleview.
What is the Median Population Age in Belleview?
Median Population Age in Belleview is 37.2 Years.
What is the Average Family Size in Belleview
Average Family Size in Belleview is 3.3 People.
What is the Average Household Size in Belleview
Average Household Size in Belleview is 2.6 People.
How Large is the Labor Force in Belleview?
There are 2,456 People in the Labor Forcein in Belleview.
What is the Percentage of People in the Labor Force in Belleview?
57.3% of People are in the Labor Force in Belleview.
What is the Unemployment Rate in Belleview?
Unemployment Rate in Belleview is 1.3%.