Tavares, FL Map & Demographics
Tavares Map

Tavares Overview
$35,284
PER CAPITA INCOME
$73,207
AVG FAMILY INCOME
$54,271
AVG HOUSEHOLD INCOME
39.7%
WAGE / INCOME GAP [ % ]
60.3¢/ $1
WAGE / INCOME GAP [ $ ]
0.48
INEQUALITY / GINI INDEX
19,088
TOTAL POPULATION
8,780
MALE POPULATION
10,308
FEMALE POPULATION
85.18
MALES / 100 FEMALES
117.40
FEMALES / 100 MALES
54.6
MEDIAN AGE
2.7
AVG FAMILY SIZE
2.1
AVG HOUSEHOLD SIZE
6,844
LABOR FORCE [ PEOPLE ]
41.7%
PERCENT IN LABOR FORCE
4.9%
UNEMPLOYMENT RATE
Tavares Zip Codes
Tavares Area Codes
Income in Tavares
Income Overview in Tavares
Per Capita Income in Tavares is $35,284, while median incomes of families and households are $73,207 and $54,271 respectively.
| Characteristic | Number | Measure |
| Per Capita Income | 19,088 | $35,284 |
| Median Family Income | 5,132 | $73,207 |
| Mean Family Income | 5,132 | $98,641 |
| Median Household Income | 8,515 | $54,271 |
| Mean Household Income | 8,515 | $77,884 |
| Income Deficit | 5,132 | $0 |
| Wage / Income Gap (%) | 19,088 | 39.70% |
| Wage / Income Gap ($) | 19,088 | 60.30¢ per $1 |
| Gini / Inequality Index | 19,088 | 0.48 |
Earnings by Sex in Tavares
Average Earnings in Tavares are $36,623, $46,209 for men and $27,866 for women, a difference of 39.7%.

| Sex | Number | Average Earnings |
| Male | 3,549 (48.4%) | $46,209 |
| Female | 3,777 (51.6%) | $27,866 |
| Total | 7,326 (100.0%) | $36,623 |
Earnings by Sex by Income Bracket in Tavares
The most common earnings brackets in Tavares are $100,000+ for men (581 | 16.4%) and $75,000 to $99,999 for women (386 | 10.2%).

| Income | Male | Female |
| $2,499 or less | 158 (4.4%) | 245 (6.5%) |
| $2,500 to $4,999 | 13 (0.4%) | 239 (6.3%) |
| $5,000 to $7,499 | 113 (3.2%) | 74 (2.0%) |
| $7,500 to $9,999 | 88 (2.5%) | 107 (2.8%) |
| $10,000 to $12,499 | 64 (1.8%) | 103 (2.7%) |
| $12,500 to $14,999 | 42 (1.2%) | 192 (5.1%) |
| $15,000 to $17,499 | 19 (0.5%) | 167 (4.4%) |
| $17,500 to $19,999 | 64 (1.8%) | 199 (5.3%) |
| $20,000 to $22,499 | 110 (3.1%) | 291 (7.7%) |
| $22,500 to $24,999 | 114 (3.2%) | 85 (2.2%) |
| $25,000 to $29,999 | 91 (2.6%) | 347 (9.2%) |
| $30,000 to $34,999 | 462 (13.0%) | 189 (5.0%) |
| $35,000 to $39,999 | 155 (4.4%) | 162 (4.3%) |
| $40,000 to $44,999 | 193 (5.4%) | 140 (3.7%) |
| $45,000 to $49,999 | 274 (7.7%) | 92 (2.4%) |
| $50,000 to $54,999 | 187 (5.3%) | 87 (2.3%) |
| $55,000 to $64,999 | 253 (7.1%) | 357 (9.5%) |
| $65,000 to $74,999 | 213 (6.0%) | 206 (5.4%) |
| $75,000 to $99,999 | 355 (10.0%) | 386 (10.2%) |
| $100,000+ | 581 (16.4%) | 109 (2.9%) |
| Total | 3,549 (100.0%) | 3,777 (100.0%) |
Earnings by Sex by Educational Attainment in Tavares
Average earnings in Tavares are $48,929 for men and $29,111 for women, a difference of 40.5%. Men with an educational attainment of bachelor's degree enjoy the highest average annual earnings of $76,607, while those with less than high school education earn the least with $38,953. Women with an educational attainment of graduate degree earn the most with the average annual earnings of $52,226, while those with less than high school education have the smallest earnings of $14,754.

| Educational Attainment | Male Income | Female Income |
| Less than High School | $38,953 | $14,754 |
| High School Diploma | $45,115 | $27,319 |
| College or Associate's Degree | $45,417 | $36,196 |
| Bachelor's Degree | $76,607 | $0 |
| Graduate Degree | $48,393 | $52,226 |
| Total | $48,929 | $29,111 |
Family Income in Tavares
Family Income Brackets in Tavares
According to the Tavares family income data, there are 944 families falling into the $75,000 to $99,999 income range, which is the most common income bracket and makes up 18.4% of all families. Conversely, the $10,000 to $14,999 income bracket is the least frequent group with only 144 families (2.8%) belonging to this category.

| Income Bracket | # Families | % Families |
| Less than $10,000 | 154 | 3.0% |
| $10,000 to $14,999 | 144 | 2.8% |
| $15,000 to $24,999 | 221 | 4.3% |
| $25,000 to $34,999 | 565 | 11.0% |
| $35,000 to $49,999 | 713 | 13.9% |
| $50,000 to $74,999 | 867 | 16.9% |
| $75,000 to $99,999 | 944 | 18.4% |
| $100,000 to $149,999 | 770 | 15.0% |
| $150,000 to $199,999 | 318 | 6.2% |
| $200,000+ | 436 | 8.5% |
Family Income by Famaliy Size in Tavares
5-person families (258 | 5.0%) account for the highest median family income in Tavares with $90,893 per family, while 2-person families (3,422 | 66.7%) have the highest median income of $32,486 per family member.

| Income Bracket | # Families | Median Income |
| 2-Person Families | 3,422 (66.7%) | $64,973 |
| 3-Person Families | 733 (14.3%) | $85,820 |
| 4-Person Families | 617 (12.0%) | $74,925 |
| 5-Person Families | 258 (5.0%) | $90,893 |
| 6-Person Families | 94 (1.8%) | $84,643 |
| 7+ Person Families | 8 (0.2%) | $0 |
| Total | 5,132 (100.0%) | $73,207 |
Family Income by Number of Earners in Tavares
The median family income in Tavares is $73,207, with families comprising 2 earners (1,498) having the highest median family income of $96,389, while families with 1 earner (1,340) have the lowest median family income of $47,500, accounting for 29.2% and 26.1% of families, respectively.

| Number of Earners | # Families | Median Income |
| No Earners | 2,107 (41.1%) | $57,464 |
| 1 Earner | 1,340 (26.1%) | $47,500 |
| 2 Earners | 1,498 (29.2%) | $96,389 |
| 3+ Earners | 187 (3.6%) | $84,179 |
| Total | 5,132 (100.0%) | $73,207 |
Household Income in Tavares
Household Income Brackets in Tavares
With 1,592 households falling in the category, the $50,000 to $74,999 income range is the most frequent in Tavares, accounting for 18.7% of all households. In contrast, only 204 households (2.4%) fall into the less than $10,000 income bracket, making it the least populous group.

| Income Bracket | # Households | % Households |
| Less than $10,000 | 204 | 2.4% |
| $10,000 to $14,999 | 358 | 4.2% |
| $15,000 to $24,999 | 1,107 | 13.0% |
| $25,000 to $34,999 | 945 | 11.1% |
| $35,000 to $49,999 | 1,379 | 16.2% |
| $50,000 to $74,999 | 1,592 | 18.7% |
| $75,000 to $99,999 | 1,158 | 13.6% |
| $100,000 to $149,999 | 971 | 11.4% |
| $150,000 to $199,999 | 341 | 4.0% |
| $200,000+ | 451 | 5.3% |
Household Income by Householder Age in Tavares
The median household income in Tavares is $54,271, with the highest median household income of $70,682 found in the 25 to 44 years age bracket for the primary householder. A total of 1,562 households (18.3%) fall into this category. Meanwhile, the 65+ years age bracket for the primary householder has the lowest median household income of $40,569, with 4,444 households (52.2%) in this group.

| Income Bracket | # Households | Median Income |
| 15 to 24 Years | 141 (1.7%) | $57,621 |
| 25 to 44 Years | 1,562 (18.3%) | $70,682 |
| 45 to 64 Years | 2,368 (27.8%) | $64,145 |
| 65+ Years | 4,444 (52.2%) | $40,569 |
| Total | 8,515 (100.0%) | $54,271 |
Poverty in Tavares
Income Below Poverty by Sex and Age in Tavares
With 9.8% poverty level for males and 10.9% for females among the residents of Tavares, under 5 year old males and 15 year old females are the most vulnerable to poverty, with 107 males (32.8%) and 40 females (26.3%) in their respective age groups living below the poverty level.

| Age Bracket | Male | Female |
| Under 5 Years | 107 (32.8%) | 107 (20.8%) |
| 5 Years | 0 (0.0%) | 35 (25.9%) |
| 6 to 11 Years | 40 (12.6%) | 40 (6.7%) |
| 12 to 14 Years | 0 (0.0%) | 17 (11.1%) |
| 15 Years | 14 (18.7%) | 40 (26.3%) |
| 16 and 17 Years | 30 (19.1%) | 20 (9.8%) |
| 18 to 24 Years | 101 (24.9%) | 133 (26.2%) |
| 25 to 34 Years | 39 (4.5%) | 139 (16.6%) |
| 35 to 44 Years | 32 (4.4%) | 90 (11.4%) |
| 45 to 54 Years | 74 (9.6%) | 94 (9.5%) |
| 55 to 64 Years | 111 (14.4%) | 174 (13.4%) |
| 65 to 74 Years | 136 (8.5%) | 156 (9.1%) |
| 75 Years and over | 91 (6.0%) | 59 (2.6%) |
| Total | 775 (9.8%) | 1,104 (10.9%) |
Income Above Poverty by Sex and Age in Tavares
According to the poverty statistics in Tavares, males aged 5 years and females aged 75 years and over are the age groups that are most secure financially, with 100.0% of males and 97.4% of females in these age groups living above the poverty line.

| Age Bracket | Male | Female |
| Under 5 Years | 219 (67.2%) | 408 (79.2%) |
| 5 Years | 173 (100.0%) | 100 (74.1%) |
| 6 to 11 Years | 277 (87.4%) | 555 (93.3%) |
| 12 to 14 Years | 235 (100.0%) | 136 (88.9%) |
| 15 Years | 61 (81.3%) | 112 (73.7%) |
| 16 and 17 Years | 127 (80.9%) | 185 (90.2%) |
| 18 to 24 Years | 305 (75.1%) | 374 (73.8%) |
| 25 to 34 Years | 821 (95.5%) | 697 (83.4%) |
| 35 to 44 Years | 701 (95.6%) | 697 (88.6%) |
| 45 to 54 Years | 696 (90.4%) | 891 (90.5%) |
| 55 to 64 Years | 661 (85.6%) | 1,127 (86.6%) |
| 65 to 74 Years | 1,469 (91.5%) | 1,563 (90.9%) |
| 75 Years and over | 1,428 (94.0%) | 2,196 (97.4%) |
| Total | 7,173 (90.2%) | 9,041 (89.1%) |
Income Below Poverty Among Married-Couple Families in Tavares
The poverty statistics for married-couple families in Tavares show that 4.6% or 191 of the total 4,122 families live below the poverty line. Families with 3 or 4 children have the highest poverty rate of 12.7%, comprising of 25 families. On the other hand, families with 5 or more children have the lowest poverty rate of 0.0%, which includes 0 families.

| Children | Above Poverty | Below Poverty |
| No Children | 3,086 (95.5%) | 145 (4.5%) |
| 1 or 2 Children | 665 (96.9%) | 21 (3.1%) |
| 3 or 4 Children | 172 (87.3%) | 25 (12.7%) |
| 5 or more Children | 8 (100.0%) | 0 (0.0%) |
| Total | 3,931 (95.4%) | 191 (4.6%) |
Income Below Poverty Among Single-Parent Households in Tavares
According to the poverty data in Tavares, 10.0% or 28 single-father households and 32.2% or 235 single-mother households are living below the poverty line. Among single-father households, those with no children have the highest poverty rate, with 28 households (26.9%) experiencing poverty. Likewise, among single-mother households, those with 3 or 4 children have the highest poverty rate, with 21 households (55.3%) falling below the poverty line.

| Children | Single Father | Single Mother |
| No Children | 28 (26.9%) | 20 (8.2%) |
| 1 or 2 Children | 0 (0.0%) | 194 (43.1%) |
| 3 or 4 Children | 0 (0.0%) | 21 (55.3%) |
| 5 or more Children | 0 (0.0%) | 0 (0.0%) |
| Total | 28 (10.0%) | 235 (32.2%) |
Income Below Poverty Among Married-Couple vs Single-Parent Households in Tavares
The poverty data for Tavares shows that 191 of the married-couple family households (4.6%) and 263 of the single-parent households (26.0%) are living below the poverty level. Within the married-couple family households, those with 3 or 4 children have the highest poverty rate, with 25 households (12.7%) falling below the poverty line. Among the single-parent households, those with 1 or 2 children have the highest poverty rate, with 194 household (32.9%) living below poverty.

| Children | Married-Couple Families | Single-Parent Households |
| No Children | 145 (4.5%) | 48 (13.8%) |
| 1 or 2 Children | 21 (3.1%) | 194 (32.9%) |
| 3 or 4 Children | 25 (12.7%) | 21 (28.8%) |
| 5 or more Children | 0 (0.0%) | 0 (0.0%) |
| Total | 191 (4.6%) | 263 (26.0%) |
Race in Tavares
The most populous races in Tavares are White / Caucasian (14,493 | 75.9%), Hispanic or Latino (2,340 | 12.3%), and Black / African American (2,137 | 11.2%).

| Race | # Population | % Population |
| Asian | 451 | 2.4% |
| Black / African American | 2,137 | 11.2% |
| Hawaiian / Pacific | 0 | 0.0% |
| Hispanic or Latino | 2,340 | 12.3% |
| Native / Alaskan | 57 | 0.3% |
| White / Caucasian | 14,493 | 75.9% |
| Two or more Races | 1,231 | 6.5% |
| Some other Race | 719 | 3.8% |
| Total | 19,088 | 100.0% |
Ancestry in Tavares
The most populous ancestries reported in Tavares are German (2,773 | 14.5%), English (2,413 | 12.6%), Irish (2,098 | 11.0%), American (1,363 | 7.1%), and Puerto Rican (1,248 | 6.5%), together accounting for 51.8% of all Tavares residents.

| Ancestry | # Population | % Population |
| African | 158 | 0.8% |
| American | 1,363 | 7.1% |
| Arab | 36 | 0.2% |
| Argentinean | 108 | 0.6% |
| Armenian | 23 | 0.1% |
| Austrian | 28 | 0.2% |
| Bahamian | 10 | 0.1% |
| Barbadian | 8 | 0.0% |
| Belgian | 35 | 0.2% |
| Bermudan | 11 | 0.1% |
| British | 207 | 1.1% |
| British West Indian | 31 | 0.2% |
| Bulgarian | 78 | 0.4% |
| Cajun | 8 | 0.0% |
| Canadian | 25 | 0.1% |
| Central American | 16 | 0.1% |
| Central American Indian | 33 | 0.2% |
| Cherokee | 33 | 0.2% |
| Chickasaw | 32 | 0.2% |
| Colombian | 47 | 0.3% |
| Cuban | 373 | 1.9% |
| Czech | 15 | 0.1% |
| Danish | 10 | 0.1% |
| Dominican | 95 | 0.5% |
| Dutch | 187 | 1.0% |
| Eastern European | 141 | 0.7% |
| Ecuadorian | 14 | 0.1% |
| English | 2,413 | 12.6% |
| European | 550 | 2.9% |
| Finnish | 7 | 0.0% |
| French | 362 | 1.9% |
| French American Indian | 11 | 0.1% |
| French Canadian | 98 | 0.5% |
| German | 2,773 | 14.5% |
| Greek | 23 | 0.1% |
| Guyanese | 23 | 0.1% |
| Haitian | 146 | 0.8% |
| Hungarian | 78 | 0.4% |
| Indian (Asian) | 128 | 0.7% |
| Irish | 2,098 | 11.0% |
| Italian | 753 | 3.9% |
| Jamaican | 263 | 1.4% |
| Korean | 66 | 0.4% |
| Lithuanian | 57 | 0.3% |
| Mexican | 240 | 1.3% |
| Moroccan | 36 | 0.2% |
| Native Hawaiian | 21 | 0.1% |
| Navajo | 6 | 0.0% |
| Northern European | 44 | 0.2% |
| Norwegian | 216 | 1.1% |
| Panamanian | 16 | 0.1% |
| Pennsylvania German | 14 | 0.1% |
| Peruvian | 43 | 0.2% |
| Polish | 449 | 2.4% |
| Portuguese | 108 | 0.6% |
| Puerto Rican | 1,248 | 6.5% |
| Romanian | 5 | 0.0% |
| Russian | 41 | 0.2% |
| Scandinavian | 13 | 0.1% |
| Scotch-Irish | 168 | 0.9% |
| Scottish | 390 | 2.0% |
| Slovak | 28 | 0.2% |
| South American | 245 | 1.3% |
| Spaniard | 32 | 0.2% |
| Spanish | 8 | 0.0% |
| Subsaharan African | 158 | 0.8% |
| Swedish | 85 | 0.4% |
| Swiss | 147 | 0.8% |
| Thai | 363 | 1.9% |
| U.S. Virgin Islander | 245 | 1.3% |
| Ukrainian | 13 | 0.1% |
| Uruguayan | 11 | 0.1% |
| Venezuelan | 22 | 0.1% |
| Welsh | 37 | 0.2% |
| West Indian | 5 | 0.0% |
| Yugoslavian | 11 | 0.1% | View All 76 Rows |
Immigrants in Tavares
The most numerous immigrant groups reported in Tavares came from Latin America (826 | 4.3%), Asia (449 | 2.4%), India (388 | 2.0%), South Central Asia (388 | 2.0%), and Caribbean (384 | 2.0%), together accounting for 12.8% of all Tavares residents.

| Immigration Origin | # Population | % Population |
| Argentina | 108 | 0.6% |
| Asia | 449 | 2.4% |
| Bulgaria | 78 | 0.4% |
| Canada | 51 | 0.3% |
| Caribbean | 384 | 2.0% |
| Central America | 156 | 0.8% |
| China | 49 | 0.3% |
| Colombia | 52 | 0.3% |
| Cuba | 168 | 0.9% |
| Eastern Asia | 61 | 0.3% |
| Eastern Europe | 96 | 0.5% |
| England | 38 | 0.2% |
| Europe | 225 | 1.2% |
| Germany | 40 | 0.2% |
| Guyana | 81 | 0.4% |
| Haiti | 13 | 0.1% |
| India | 388 | 2.0% |
| Ireland | 32 | 0.2% |
| Jamaica | 168 | 0.9% |
| Japan | 12 | 0.1% |
| Latin America | 826 | 4.3% |
| Mexico | 156 | 0.8% |
| Northern Europe | 89 | 0.5% |
| Peru | 12 | 0.1% |
| Romania | 5 | 0.0% |
| Scotland | 13 | 0.1% |
| Serbia | 13 | 0.1% |
| South America | 286 | 1.5% |
| South Central Asia | 388 | 2.0% |
| Uruguay | 11 | 0.1% |
| Venezuela | 22 | 0.1% |
| Western Europe | 40 | 0.2% | View All 32 Rows |
Sex and Age in Tavares
Sex and Age in Tavares
The most populous age groups in Tavares are 70 to 74 Years (993 | 11.3%) for men and 70 to 74 Years (972 | 9.4%) for women.

| Age Bracket | Male | Female |
| Under 5 Years | 326 (3.7%) | 515 (5.0%) |
| 5 to 9 Years | 390 (4.4%) | 562 (5.4%) |
| 10 to 14 Years | 335 (3.8%) | 321 (3.1%) |
| 15 to 19 Years | 338 (3.8%) | 485 (4.7%) |
| 20 to 24 Years | 424 (4.8%) | 401 (3.9%) |
| 25 to 29 Years | 628 (7.1%) | 517 (5.0%) |
| 30 to 34 Years | 427 (4.9%) | 347 (3.4%) |
| 35 to 39 Years | 632 (7.2%) | 417 (4.1%) |
| 40 to 44 Years | 381 (4.3%) | 422 (4.1%) |
| 45 to 49 Years | 421 (4.8%) | 516 (5.0%) |
| 50 to 54 Years | 417 (4.8%) | 475 (4.6%) |
| 55 to 59 Years | 416 (4.7%) | 429 (4.2%) |
| 60 to 64 Years | 474 (5.4%) | 880 (8.5%) |
| 65 to 69 Years | 612 (7.0%) | 752 (7.3%) |
| 70 to 74 Years | 993 (11.3%) | 972 (9.4%) |
| 75 to 79 Years | 679 (7.7%) | 874 (8.5%) |
| 80 to 84 Years | 451 (5.1%) | 707 (6.9%) |
| 85 Years and over | 436 (5.0%) | 716 (7.0%) |
| Total | 8,780 (100.0%) | 10,308 (100.0%) |
Families and Households in Tavares
Median Family Size in Tavares
The median family size in Tavares is 2.70 persons per family, with single male/father families (279 | 5.4%) accounting for the largest median family size of 3.29 persons per family. On the other hand, married-couple families (4,122 | 80.3%) represent the smallest median family size with 2.61 persons per family.

| Family Type | # Families | Family Size |
| Married-Couple | 4,122 (80.3%) | 2.61 |
| Single Male/Father | 279 (5.4%) | 3.29 |
| Single Female/Mother | 731 (14.2%) | 2.95 |
| Total Families | 5,132 (100.0%) | 2.70 |
Median Household Size in Tavares
The median household size in Tavares is 2.12 persons per household, with single male/father households (279 | 3.3%) accounting for the largest median household size of 4.02 persons per household. non-family households (3,383 | 39.7%) represent the smallest median household size with 1.14 persons per household.
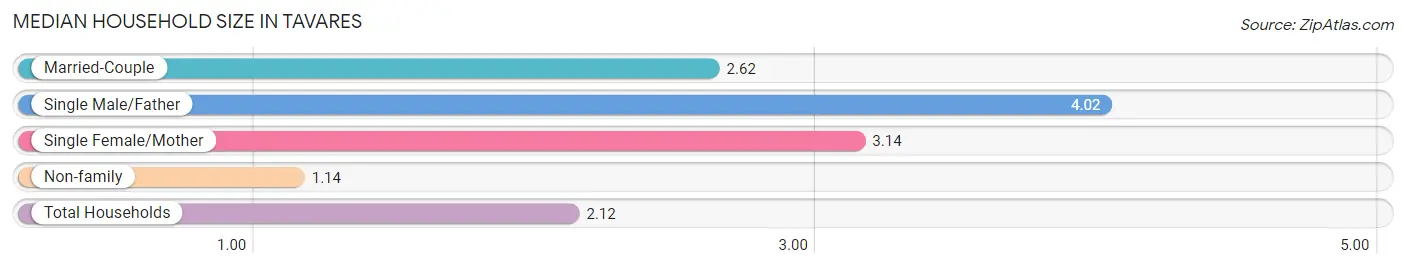
| Household Type | # Households | Household Size |
| Married-Couple | 4,122 (48.4%) | 2.62 |
| Single Male/Father | 279 (3.3%) | 4.02 |
| Single Female/Mother | 731 (8.6%) | 3.14 |
| Non-family | 3,383 (39.7%) | 1.14 |
| Total Households | 8,515 (100.0%) | 2.12 |
Household Size by Marriage Status in Tavares
Out of a total of 8,515 households in Tavares, 5,132 (60.3%) are family households, while 3,383 (39.7%) are nonfamily households. The most numerous type of family households are 2-person households, comprising 3,296, and the most common type of nonfamily households are 1-person households, comprising 2,960.

| Household Size | Family Households | Nonfamily Households |
| 1-Person Households | - | 2,960 (34.8%) |
| 2-Person Households | 3,296 (38.7%) | 401 (4.7%) |
| 3-Person Households | 743 (8.7%) | 22 (0.3%) |
| 4-Person Households | 692 (8.1%) | 0 (0.0%) |
| 5-Person Households | 264 (3.1%) | 0 (0.0%) |
| 6-Person Households | 129 (1.5%) | 0 (0.0%) |
| 7+ Person Households | 8 (0.1%) | 0 (0.0%) |
| Total | 5,132 (60.3%) | 3,383 (39.7%) |
Female Fertility in Tavares
Fertility by Age in Tavares
Average fertility rate in Tavares is 41.0 births per 1,000 women. Women in the age bracket of 20 to 34 years have the highest fertility rate with 102.0 births per 1,000 women. Women in the age bracket of 20 to 34 years acount for 100.0% of all women with births.

| Age Bracket | Women with Births | Births / 1,000 Women |
| 15 to 19 years | 0 (0.0%) | 0.0 |
| 20 to 34 years | 129 (100.0%) | 102.0 |
| 35 to 50 years | 0 (0.0%) | 0.0 |
| Total | 129 (100.0%) | 41.0 |
Fertility by Age by Marriage Status in Tavares
46.5% of women with births (129) in Tavares are married. The highest percentage of unmarried women with births falls into 20 to 34 years age bracket with 53.5% of them unmarried at the time of birth, while the lowest percentage of unmarried women with births belong to 20 to 34 years age bracket with 53.5% of them unmarried.

| Age Bracket | Married | Unmarried |
| 15 to 19 years | 0 (0.0%) | 0 (0.0%) |
| 20 to 34 years | 60 (46.5%) | 69 (53.5%) |
| 35 to 50 years | 0 (0.0%) | 0 (0.0%) |
| Total | 60 (46.5%) | 69 (53.5%) |
Fertility by Education in Tavares

| Educational Attainment | Women with Births | Births / 1,000 Women |
| Less than High School | 0 (0.0%) | 0.0 |
| High School Diploma | 70 (54.3%) | 91.0 |
| College or Associate's Degree | 59 (45.7%) | 50.0 |
| Bachelor's Degree | 0 (0.0%) | 0.0 |
| Graduate Degree | 0 (0.0%) | 0.0 |
| Total | 129 (100.0%) | 41.0 |
Fertility by Education by Marriage Status in Tavares
53.5% of women with births in Tavares are unmarried. Women with the educational attainment of high school diploma are most likely to be married with 51.4% of them married at childbirth, while women with the educational attainment of college or associate's degree are least likely to be married with 59.3% of them unmarried at childbirth.

| Educational Attainment | Married | Unmarried |
| Less than High School | 0 (0.0%) | 0 (0.0%) |
| High School Diploma | 36 (51.4%) | 34 (48.6%) |
| College or Associate's Degree | 24 (40.7%) | 35 (59.3%) |
| Bachelor's Degree | 0 (0.0%) | 0 (0.0%) |
| Graduate Degree | 0 (0.0%) | 0 (0.0%) |
| Total | 60 (46.5%) | 69 (53.5%) |
Employment Characteristics in Tavares
Employment by Class of Employer in Tavares
Among the 6,380 employed individuals in Tavares, private company employees (3,906 | 61.2%), not-for-profit organizations (561 | 8.8%), and self-employed (incorporated) (516 | 8.1%) make up the most common classes of employment.

| Employer Class | # Employees | % Employees |
| Private Company Employees | 3,906 | 61.2% |
| Self-Employed (Incorporated) | 516 | 8.1% |
| Self-Employed (Not Incorporated) | 499 | 7.8% |
| Not-for-profit Organizations | 561 | 8.8% |
| Local Government Employees | 450 | 7.0% |
| State Government Employees | 248 | 3.9% |
| Federal Government Employees | 174 | 2.7% |
| Unpaid Family Workers | 26 | 0.4% |
| Total | 6,380 | 100.0% |
Employment Status by Age in Tavares
According to the labor force statistics for Tavares, out of the total population over 16 years of age (16,412), 41.7% or 6,844 individuals are in the labor force, with 4.9% or 335 of them unemployed. The age group with the highest labor force participation rate is 45 to 54 years, with 82.2% or 1,503 individuals in the labor force. Within the labor force, the 16 to 19 years age range has the highest percentage of unemployed individuals, with 47.4% or 55 of them being unemployed.

| Age Bracket | In Labor Force | Unemployed |
| 16 to 19 Years | 116 (19.5%) | 55 (47.4%) |
| 20 to 24 Years | 434 (52.6%) | 9 (2.1%) |
| 25 to 29 Years | 851 (74.3%) | 0 (0.0%) |
| 30 to 34 Years | 578 (74.7%) | 12 (2.1%) |
| 35 to 44 Years | 1,333 (72.0%) | 97 (7.3%) |
| 45 to 54 Years | 1,503 (82.2%) | 86 (5.7%) |
| 55 to 59 Years | 553 (65.4%) | 13 (2.4%) |
| 60 to 64 Years | 737 (54.4%) | 33 (4.5%) |
| 65 to 74 Years | 646 (19.4%) | 30 (4.7%) |
| 75 Years and over | 89 (2.3%) | 0 (0.0%) |
| Total | 6,844 (41.7%) | 335 (4.9%) |
Employment Status by Educational Attainment in Tavares
According to labor force statistics for Tavares, 71.2% of individuals (5,553) out of the total population between 25 and 64 years of age (7,799) are in the labor force, with 4.3% or 239 of them being unemployed. The group with the highest labor force participation rate are those with the educational attainment of bachelor's degree or higher, with 85.4% or 1,031 individuals in the labor force. Within the labor force, individuals with college / associate degree education have the highest percentage of unemployment, with 5.6% or 139 of them being unemployed.

| Educational Attainment | In Labor Force | Unemployed |
| Less than High School | 758 (57.3%) | 61 (4.6%) |
| High School Diploma | 1,287 (61.0%) | 44 (2.1%) |
| College / Associate Degree | 2,477 (78.4%) | 177 (5.6%) |
| Bachelor's Degree or higher | 1,031 (85.4%) | 46 (3.8%) |
| Total | 5,553 (71.2%) | 335 (4.3%) |
Employment Occupations by Sex in Tavares
Management, Business, Science and Arts Occupations
The most common Management, Business, Science and Arts occupations in Tavares are Health Diagnosing & Treating (810 | 12.5%), Business & Financial (517 | 8.0%), Health Technologists (443 | 6.8%), Community & Social Service (441 | 6.8%), and Management (435 | 6.7%).

Management, Business, Science and Arts Occupations by Sex
Within the Management, Business, Science and Arts occupations in Tavares, the most male-oriented occupations are Computers & Mathematics (81.5%), Computers, Engineering & Science (71.9%), and Life, Physical & Social Science (67.0%), while the most female-oriented occupations are Health Technologists (82.8%), Education Instruction & Library (79.0%), and Health Diagnosing & Treating (71.9%).

| Occupation | Male | Female |
| Management | 205 (47.1%) | 230 (52.9%) |
| Business & Financial | 291 (56.3%) | 226 (43.7%) |
| Computers, Engineering & Science | 184 (71.9%) | 72 (28.1%) |
| Computers & Mathematics | 88 (81.5%) | 20 (18.5%) |
| Architecture & Engineering | 31 (60.8%) | 20 (39.2%) |
| Life, Physical & Social Science | 65 (67.0%) | 32 (33.0%) |
| Community & Social Service | 138 (31.3%) | 303 (68.7%) |
| Education, Arts & Media | 43 (53.7%) | 37 (46.3%) |
| Legal Services & Support | 0 (0.0%) | 0 (0.0%) |
| Education Instruction & Library | 43 (21.0%) | 162 (79.0%) |
| Arts, Media & Entertainment | 52 (33.3%) | 104 (66.7%) |
| Health Diagnosing & Treating | 228 (28.1%) | 582 (71.9%) |
| Health Technologists | 76 (17.2%) | 367 (82.8%) |
| Total (Category) | 1,046 (42.5%) | 1,413 (57.5%) |
| Total (Overall) | 3,190 (49.2%) | 3,287 (50.7%) |
Services Occupations
The most common Services occupations in Tavares are Food Preparation & Serving (435 | 6.7%), Cleaning & Maintenance (282 | 4.3%), Security & Protection (273 | 4.2%), Healthcare Support (188 | 2.9%), and Law Enforcement (146 | 2.2%).

Services Occupations by Sex
Within the Services occupations in Tavares, the most male-oriented occupations are Law Enforcement (87.0%), Cleaning & Maintenance (85.1%), and Security & Protection (70.3%), while the most female-oriented occupations are Healthcare Support (100.0%), Food Preparation & Serving (78.6%), and Personal Care & Service (77.7%).

| Occupation | Male | Female |
| Healthcare Support | 0 (0.0%) | 188 (100.0%) |
| Security & Protection | 192 (70.3%) | 81 (29.7%) |
| Firefighting & Prevention | 65 (51.2%) | 62 (48.8%) |
| Law Enforcement | 127 (87.0%) | 19 (13.0%) |
| Food Preparation & Serving | 93 (21.4%) | 342 (78.6%) |
| Cleaning & Maintenance | 240 (85.1%) | 42 (14.9%) |
| Personal Care & Service | 31 (22.3%) | 108 (77.7%) |
| Total (Category) | 556 (42.2%) | 761 (57.8%) |
| Total (Overall) | 3,190 (49.2%) | 3,287 (50.7%) |
Sales and Office Occupations
The most common Sales and Office occupations in Tavares are Office & Administration (819 | 12.6%), and Sales & Related (544 | 8.4%).

Sales and Office Occupations by Sex

| Occupation | Male | Female |
| Sales & Related | 226 (41.5%) | 318 (58.5%) |
| Office & Administration | 182 (22.2%) | 637 (77.8%) |
| Total (Category) | 408 (29.9%) | 955 (70.1%) |
| Total (Overall) | 3,190 (49.2%) | 3,287 (50.7%) |
Natural Resources, Construction and Maintenance Occupations
The most common Natural Resources, Construction and Maintenance occupations in Tavares are Construction & Extraction (448 | 6.9%), Installation, Maintenance & Repair (190 | 2.9%), and Farming, Fishing & Forestry (22 | 0.3%).

Natural Resources, Construction and Maintenance Occupations by Sex

| Occupation | Male | Female |
| Farming, Fishing & Forestry | 0 (0.0%) | 22 (100.0%) |
| Construction & Extraction | 421 (94.0%) | 27 (6.0%) |
| Installation, Maintenance & Repair | 190 (100.0%) | 0 (0.0%) |
| Total (Category) | 611 (92.6%) | 49 (7.4%) |
| Total (Overall) | 3,190 (49.2%) | 3,287 (50.7%) |
Production, Transportation and Moving Occupations
The most common Production, Transportation and Moving occupations in Tavares are Production (358 | 5.5%), Transportation (230 | 3.5%), and Material Moving (90 | 1.4%).

Production, Transportation and Moving Occupations by Sex

| Occupation | Male | Female |
| Production | 292 (81.6%) | 66 (18.4%) |
| Transportation | 214 (93.0%) | 16 (7.0%) |
| Material Moving | 63 (70.0%) | 27 (30.0%) |
| Total (Category) | 569 (83.9%) | 109 (16.1%) |
| Total (Overall) | 3,190 (49.2%) | 3,287 (50.7%) |
Employment Industries by Sex in Tavares
Employment Industries in Tavares
The major employment industries in Tavares include Health Care & Social Assistance (1,420 | 21.9%), Retail Trade (678 | 10.5%), Construction (568 | 8.8%), Professional & Scientific (515 | 8.0%), and Accommodation & Food Services (482 | 7.4%).

Employment Industries by Sex in Tavares
The Tavares industries that see more men than women are Utilities (100.0%), Construction (89.6%), and Transportation & Warehousing (81.2%), whereas the industries that tend to have a higher number of women are Enterprise Management (100.0%), Health Care & Social Assistance (79.5%), and Agriculture, Fishing & Hunting (79.2%).

| Industry | Male | Female |
| Agriculture, Fishing & Hunting | 22 (20.7%) | 84 (79.2%) |
| Mining, Quarrying, & Extraction | 0 (0.0%) | 0 (0.0%) |
| Construction | 509 (89.6%) | 59 (10.4%) |
| Manufacturing | 228 (66.3%) | 116 (33.7%) |
| Wholesale Trade | 112 (70.9%) | 46 (29.1%) |
| Retail Trade | 269 (39.7%) | 409 (60.3%) |
| Transportation & Warehousing | 156 (81.2%) | 36 (18.8%) |
| Utilities | 51 (100.0%) | 0 (0.0%) |
| Information | 74 (79.6%) | 19 (20.4%) |
| Finance & Insurance | 49 (24.9%) | 148 (75.1%) |
| Real Estate, Rental & Leasing | 42 (44.7%) | 52 (55.3%) |
| Professional & Scientific | 405 (78.6%) | 110 (21.4%) |
| Enterprise Management | 0 (0.0%) | 5 (100.0%) |
| Administrative & Support | 256 (64.2%) | 143 (35.8%) |
| Educational Services | 105 (26.8%) | 287 (73.2%) |
| Health Care & Social Assistance | 291 (20.5%) | 1,129 (79.5%) |
| Arts, Entertainment & Recreation | 45 (32.6%) | 93 (67.4%) |
| Accommodation & Food Services | 137 (28.4%) | 345 (71.6%) |
| Public Administration | 235 (73.2%) | 86 (26.8%) |
| Total | 3,190 (49.2%) | 3,287 (50.7%) |
Education in Tavares
School Enrollment in Tavares
The most common levels of schooling among the 3,089 students in Tavares are high school (866 | 28.0%), elementary school (619 | 20.0%), and middle school (497 | 16.1%).

| School Level | # Students | % Students |
| Nursery / Preschool | 190 | 6.1% |
| Kindergarten | 347 | 11.2% |
| Elementary School | 619 | 20.0% |
| Middle School | 497 | 16.1% |
| High School | 866 | 28.0% |
| College / Undergraduate | 457 | 14.8% |
| Graduate / Professional | 113 | 3.7% |
| Total | 3,089 | 100.0% |
School Enrollment by Age by Funding Source in Tavares
Out of a total of 3,089 students who are enrolled in schools in Tavares, 763 (24.7%) attend a private institution, while the remaining 2,326 (75.3%) are enrolled in public schools. The age group of 3 to 4 year olds has the highest likelihood of being enrolled in private schools, with 91 (57.2% in the age bracket) enrolled. Conversely, the age group of 20 to 24 year olds has the lowest likelihood of being enrolled in a private school, with 222 (100.0% in the age bracket) attending a public institution.

| Age Bracket | Public School | Private School |
| 3 to 4 Year Olds | 68 (42.8%) | 91 (57.2%) |
| 5 to 9 Year Old | 680 (71.4%) | 272 (28.6%) |
| 10 to 14 Year Olds | 464 (72.6%) | 175 (27.4%) |
| 15 to 17 Year Olds | 441 (78.0%) | 124 (22.0%) |
| 18 to 19 Year Olds | 146 (90.7%) | 15 (9.3%) |
| 20 to 24 Year Olds | 222 (100.0%) | 0 (0.0%) |
| 25 to 34 Year Olds | 80 (62.0%) | 49 (38.0%) |
| 35 Years and over | 226 (86.3%) | 36 (13.7%) |
| Total | 2,326 (75.3%) | 763 (24.7%) |
Educational Attainment by Field of Study in Tavares
Business (948 | 25.5%), education (933 | 25.1%), liberal arts & history (293 | 7.9%), social sciences (276 | 7.4%), and arts & humanities (270 | 7.3%) are the most common fields of study among 3,720 individuals in Tavares who have obtained a bachelor's degree or higher.

| Field of Study | # Graduates | % Graduates |
| Computers & Mathematics | 82 | 2.2% |
| Bio, Nature & Agricultural | 126 | 3.4% |
| Physical & Health Sciences | 39 | 1.1% |
| Psychology | 113 | 3.0% |
| Social Sciences | 276 | 7.4% |
| Engineering | 198 | 5.3% |
| Multidisciplinary Studies | 80 | 2.1% |
| Science & Technology | 230 | 6.2% |
| Business | 948 | 25.5% |
| Education | 933 | 25.1% |
| Literature & Languages | 20 | 0.5% |
| Liberal Arts & History | 293 | 7.9% |
| Visual & Performing Arts | 51 | 1.4% |
| Communications | 61 | 1.6% |
| Arts & Humanities | 270 | 7.3% |
| Total | 3,720 | 100.0% |
Transportation & Commute in Tavares
Vehicle Availability by Sex in Tavares
The most prevalent vehicle ownership categories in Tavares are males with 2 vehicles (1,644, accounting for 51.4%) and females with 2 vehicles (1,508, making up 51.8%).

| Vehicles Available | Male | Female |
| No Vehicle | 30 (0.9%) | 131 (4.1%) |
| 1 Vehicle | 744 (23.2%) | 904 (28.5%) |
| 2 Vehicles | 1,644 (51.4%) | 1,508 (47.5%) |
| 3 Vehicles | 485 (15.1%) | 459 (14.4%) |
| 4 Vehicles | 137 (4.3%) | 74 (2.3%) |
| 5 or more Vehicles | 161 (5.0%) | 100 (3.2%) |
| Total | 3,201 (100.0%) | 3,176 (100.0%) |
Commute Time in Tavares
The most frequently occuring commute durations in Tavares are 5 to 9 minutes (921 commuters, 14.9%), 15 to 19 minutes (854 commuters, 13.9%), and 20 to 24 minutes (630 commuters, 10.2%).

| Commute Time | # Commuters | % Commuters |
| Less than 5 Minutes | 570 | 9.2% |
| 5 to 9 Minutes | 921 | 14.9% |
| 10 to 14 Minutes | 567 | 9.2% |
| 15 to 19 Minutes | 854 | 13.9% |
| 20 to 24 Minutes | 630 | 10.2% |
| 25 to 29 Minutes | 229 | 3.7% |
| 30 to 34 Minutes | 532 | 8.6% |
| 35 to 39 Minutes | 320 | 5.2% |
| 40 to 44 Minutes | 274 | 4.4% |
| 45 to 59 Minutes | 558 | 9.1% |
| 60 to 89 Minutes | 514 | 8.3% |
| 90 or more Minutes | 191 | 3.1% |
Commute Time by Sex in Tavares
The most common commute times in Tavares are 5 to 9 minutes (516 commuters, 16.5%) for males and 15 to 19 minutes (565 commuters, 18.6%) for females.

| Commute Time | Male | Female |
| Less than 5 Minutes | 172 (5.5%) | 398 (13.1%) |
| 5 to 9 Minutes | 516 (16.5%) | 405 (13.4%) |
| 10 to 14 Minutes | 218 (7.0%) | 349 (11.5%) |
| 15 to 19 Minutes | 289 (9.2%) | 565 (18.6%) |
| 20 to 24 Minutes | 235 (7.5%) | 395 (13.0%) |
| 25 to 29 Minutes | 58 (1.9%) | 171 (5.6%) |
| 30 to 34 Minutes | 379 (12.1%) | 153 (5.0%) |
| 35 to 39 Minutes | 304 (9.7%) | 16 (0.5%) |
| 40 to 44 Minutes | 229 (7.3%) | 45 (1.5%) |
| 45 to 59 Minutes | 256 (8.2%) | 302 (10.0%) |
| 60 to 89 Minutes | 323 (10.3%) | 191 (6.3%) |
| 90 or more Minutes | 147 (4.7%) | 44 (1.5%) |
Time of Departure to Work by Sex in Tavares
The most frequent times of departure to work in Tavares are 6:30 AM to 6:59 AM (465, 14.9%) for males and 7:30 AM to 7:59 AM (875, 28.8%) for females.

| Time of Departure | Male | Female |
| 12:00 AM to 4:59 AM | 225 (7.2%) | 178 (5.9%) |
| 5:00 AM to 5:29 AM | 245 (7.8%) | 73 (2.4%) |
| 5:30 AM to 5:59 AM | 253 (8.1%) | 61 (2.0%) |
| 6:00 AM to 6:29 AM | 378 (12.1%) | 88 (2.9%) |
| 6:30 AM to 6:59 AM | 465 (14.9%) | 156 (5.1%) |
| 7:00 AM to 7:29 AM | 248 (7.9%) | 347 (11.4%) |
| 7:30 AM to 7:59 AM | 408 (13.1%) | 875 (28.8%) |
| 8:00 AM to 8:29 AM | 260 (8.3%) | 411 (13.6%) |
| 8:30 AM to 8:59 AM | 112 (3.6%) | 135 (4.4%) |
| 9:00 AM to 9:59 AM | 188 (6.0%) | 147 (4.9%) |
| 10:00 AM to 10:59 AM | 124 (4.0%) | 116 (3.8%) |
| 11:00 AM to 11:59 AM | 0 (0.0%) | 95 (3.1%) |
| 12:00 PM to 3:59 PM | 106 (3.4%) | 235 (7.7%) |
| 4:00 PM to 11:59 PM | 114 (3.6%) | 117 (3.9%) |
| Total | 3,126 (100.0%) | 3,034 (100.0%) |
Housing Occupancy in Tavares
Occupancy by Ownership in Tavares
Of the total 8,515 dwellings in Tavares, owner-occupied units account for 6,261 (73.5%), while renter-occupied units make up 2,254 (26.5%).

| Occupancy | # Housing Units | % Housing Units |
| Owner Occupied Housing Units | 6,261 | 73.5% |
| Renter-Occupied Housing Units | 2,254 | 26.5% |
| Total Occupied Housing Units | 8,515 | 100.0% |
Occupancy by Household Size in Tavares

| Household Size | # Housing Units | % Housing Units |
| 1-Person Household | 2,960 | 34.8% |
| 2-Person Household | 3,697 | 43.4% |
| 3-Person Household | 765 | 9.0% |
| 4+ Person Household | 1,093 | 12.8% |
| Total Housing Units | 8,515 | 100.0% |
Occupancy by Ownership by Household Size in Tavares

| Household Size | Owner-occupied | Renter-occupied |
| 1-Person Household | 2,008 (67.8%) | 952 (32.2%) |
| 2-Person Household | 3,071 (83.1%) | 626 (16.9%) |
| 3-Person Household | 471 (61.6%) | 294 (38.4%) |
| 4+ Person Household | 711 (65.0%) | 382 (34.9%) |
| Total Housing Units | 6,261 (73.5%) | 2,254 (26.5%) |
Occupancy by Educational Attainment in Tavares

| Household Size | Owner-occupied | Renter-occupied |
| Less than High School | 609 (67.4%) | 295 (32.6%) |
| High School Diploma | 1,475 (73.7%) | 526 (26.3%) |
| College/Associate Degree | 2,656 (71.0%) | 1,084 (29.0%) |
| Bachelor's Degree or higher | 1,521 (81.3%) | 349 (18.7%) |
Occupancy by Age of Householder in Tavares

| Age Bracket | # Households | % Households |
| Under 35 Years | 907 | 10.6% |
| 35 to 44 Years | 796 | 9.3% |
| 45 to 54 Years | 1,054 | 12.4% |
| 55 to 64 Years | 1,314 | 15.4% |
| 65 to 74 Years | 1,770 | 20.8% |
| 75 to 84 Years | 1,738 | 20.4% |
| 85 Years and Over | 936 | 11.0% |
| Total | 8,515 | 100.0% |
Housing Finances in Tavares
Median Income by Occupancy in Tavares

| Occupancy Type | # Households | Median Income |
| Owner-Occupied | 6,261 (73.5%) | $54,225 |
| Renter-Occupied | 2,254 (26.5%) | $55,333 |
| Average | 8,515 (100.0%) | $54,271 |
Occupancy by Householder Income Bracket in Tavares

| Income Bracket | Owner-occupied | Renter-occupied |
| Less than $5,000 | 133 (2.1%) | 36 (1.6%) |
| $5,000 to $9,999 | 15 (0.2%) | 21 (0.9%) |
| $10,000 to $14,999 | 195 (3.1%) | 165 (7.3%) |
| $15,000 to $19,999 | 418 (6.7%) | 178 (7.9%) |
| $20,000 to $24,999 | 382 (6.1%) | 131 (5.8%) |
| $25,000 to $34,999 | 738 (11.8%) | 205 (9.1%) |
| $35,000 to $49,999 | 999 (16.0%) | 384 (17.0%) |
| $50,000 to $74,999 | 1,089 (17.4%) | 507 (22.5%) |
| $75,000 to $99,999 | 732 (11.7%) | 424 (18.8%) |
| $100,000 to $149,999 | 858 (13.7%) | 111 (4.9%) |
| $150,000 or more | 702 (11.2%) | 92 (4.1%) |
| Total | 6,261 (100.0%) | 2,254 (100.0%) |
Monthly Housing Cost Tiers in Tavares

| Monthly Cost | Owner-occupied | Renter-occupied |
| Less than $300 | 819 (13.1%) | 37 (1.6%) |
| $300 to $499 | 1,001 (16.0%) | 61 (2.7%) |
| $500 to $799 | 1,527 (24.4%) | 188 (8.3%) |
| $800 to $999 | 403 (6.4%) | 471 (20.9%) |
| $1,000 to $1,499 | 1,138 (18.2%) | 688 (30.5%) |
| $1,500 to $1,999 | 1,047 (16.7%) | 463 (20.5%) |
| $2,000 to $2,499 | 249 (4.0%) | 74 (3.3%) |
| $2,500 to $2,999 | 0 (0.0%) | 18 (0.8%) |
| $3,000 or more | 77 (1.2%) | 170 (7.5%) |
| Total | 6,261 (100.0%) | 2,254 (100.0%) |
Physical Housing Characteristics in Tavares
Housing Structures in Tavares

| Structure Type | # Housing Units | % Housing Units |
| Single Unit, Detached | 4,812 | 56.5% |
| Single Unit, Attached | 329 | 3.9% |
| 2 Unit Apartments | 204 | 2.4% |
| 3 or 4 Unit Apartments | 167 | 2.0% |
| 5 to 9 Unit Apartments | 229 | 2.7% |
| 10 or more Apartments | 655 | 7.7% |
| Mobile Home / Other | 2,119 | 24.9% |
| Total | 8,515 | 100.0% |
Housing Structures by Occupancy in Tavares

| Structure Type | Owner-occupied | Renter-occupied |
| Single Unit, Detached | 4,112 (85.5%) | 700 (14.5%) |
| Single Unit, Attached | 193 (58.7%) | 136 (41.3%) |
| 2 Unit Apartments | 43 (21.1%) | 161 (78.9%) |
| 3 or 4 Unit Apartments | 16 (9.6%) | 151 (90.4%) |
| 5 to 9 Unit Apartments | 37 (16.2%) | 192 (83.8%) |
| 10 or more Apartments | 10 (1.5%) | 645 (98.5%) |
| Mobile Home / Other | 1,850 (87.3%) | 269 (12.7%) |
| Total | 6,261 (73.5%) | 2,254 (26.5%) |
Housing Structures by Number of Rooms in Tavares

| Number of Rooms | Owner-occupied | Renter-occupied |
| 1 Room | 17 (0.3%) | 70 (3.1%) |
| 2 or 3 Rooms | 585 (9.3%) | 724 (32.1%) |
| 4 or 5 Rooms | 2,591 (41.4%) | 1,039 (46.1%) |
| 6 or 7 Rooms | 2,402 (38.4%) | 343 (15.2%) |
| 8 or more Rooms | 666 (10.6%) | 78 (3.5%) |
| Total | 6,261 (100.0%) | 2,254 (100.0%) |
Housing Structure by Heating Type in Tavares

| Heating Type | Owner-occupied | Renter-occupied |
| Utility Gas | 1,005 (16.1%) | 158 (7.0%) |
| Bottled, Tank, or LP Gas | 204 (3.3%) | 43 (1.9%) |
| Electricity | 4,969 (79.4%) | 1,987 (88.1%) |
| Fuel Oil or Kerosene | 0 (0.0%) | 0 (0.0%) |
| Coal or Coke | 0 (0.0%) | 0 (0.0%) |
| All other Fuels | 39 (0.6%) | 0 (0.0%) |
| No Fuel Used | 44 (0.7%) | 66 (2.9%) |
| Total | 6,261 (100.0%) | 2,254 (100.0%) |
Household Vehicle Usage in Tavares

| Vehicles per Household | Owner-occupied | Renter-occupied |
| No Vehicle | 188 (3.0%) | 337 (14.9%) |
| 1 Vehicle | 3,166 (50.6%) | 1,198 (53.1%) |
| 2 Vehicles | 2,183 (34.9%) | 645 (28.6%) |
| 3 or more Vehicles | 724 (11.6%) | 74 (3.3%) |
| Total | 6,261 (100.0%) | 2,254 (100.0%) |
Real Estate & Mortgages in Tavares
Real Estate and Mortgage Overview in Tavares
| Characteristic | Without Mortgage | With Mortgage |
| Housing Units | 3,592 | 2,669 |
| Median Property Value | $150,300 | $241,800 |
| Median Household Income | $37,013 | $461 |
| Monthly Housing Costs | $495 | $67 |
| Real Estate Taxes | $1,281 | $88 |
Property Value by Mortgage Status in Tavares

| Property Value | Without Mortgage | With Mortgage |
| Less than $50,000 | 1,035 (28.8%) | 74 (2.8%) |
| $50,000 to $99,999 | 523 (14.6%) | 99 (3.7%) |
| $100,000 to $299,999 | 1,493 (41.6%) | 2,095 (78.5%) |
| $300,000 to $499,999 | 446 (12.4%) | 371 (13.9%) |
| $500,000 to $749,999 | 51 (1.4%) | 21 (0.8%) |
| $750,000 to $999,999 | 34 (0.9%) | 0 (0.0%) |
| $1,000,000 or more | 10 (0.3%) | 9 (0.3%) |
| Total | 3,592 (100.0%) | 2,669 (100.0%) |
Household Income by Mortgage Status in Tavares

| Household Income | Without Mortgage | With Mortgage |
| Less than $10,000 | 130 (3.6%) | 17 (0.6%) |
| $10,000 to $24,999 | 852 (23.7%) | 18 (0.7%) |
| $25,000 to $34,999 | 628 (17.5%) | 143 (5.4%) |
| $35,000 to $49,999 | 592 (16.5%) | 110 (4.1%) |
| $50,000 to $74,999 | 527 (14.7%) | 407 (15.2%) |
| $75,000 to $99,999 | 344 (9.6%) | 562 (21.1%) |
| $100,000 to $149,999 | 278 (7.7%) | 388 (14.5%) |
| $150,000 or more | 241 (6.7%) | 580 (21.7%) |
| Total | 3,592 (100.0%) | 2,669 (100.0%) |
Property Value to Household Income Ratio in Tavares

| Value-to-Income Ratio | Without Mortgage | With Mortgage |
| Less than 2.0x | 1,337 (37.2%) | 83,557 (3,130.6%) |
| 2.0x to 2.9x | 476 (13.3%) | 831 (31.1%) |
| 3.0x to 3.9x | 354 (9.9%) | 635 (23.8%) |
| 4.0x or more | 1,393 (38.8%) | 475 (17.8%) |
| Total | 3,592 (100.0%) | 2,669 (100.0%) |
Real Estate Taxes by Mortgage Status in Tavares

| Property Taxes | Without Mortgage | With Mortgage |
| Less than $800 | 1,085 (30.2%) | 0 (0.0%) |
| $800 to $1,499 | 408 (11.4%) | 381 (14.3%) |
| $800 to $1,499 | 1,308 (36.4%) | 493 (18.5%) |
| Total | 3,592 (100.0%) | 2,669 (100.0%) |
Health & Disability in Tavares
Health Insurance Coverage by Age in Tavares

| Age Bracket | With Coverage | Without Coverage |
| Under 6 Years | 1,051 (91.5%) | 98 (8.5%) |
| 6 to 18 Years | 1,969 (95.5%) | 93 (4.5%) |
| 19 to 25 Years | 797 (87.3%) | 116 (12.7%) |
| 26 to 34 Years | 1,152 (74.8%) | 388 (25.2%) |
| 35 to 44 Years | 1,389 (91.4%) | 131 (8.6%) |
| 45 to 54 Years | 1,307 (75.1%) | 433 (24.9%) |
| 55 to 64 Years | 1,779 (85.8%) | 294 (14.2%) |
| 65 to 74 Years | 3,324 (100.0%) | 0 (0.0%) |
| 75 Years and older | 3,774 (100.0%) | 0 (0.0%) |
| Total | 16,542 (91.4%) | 1,553 (8.6%) |
Health Insurance Coverage by Citizenship Status in Tavares

| Citizenship Status | With Coverage | Without Coverage |
| Native Born | 1,051 (91.5%) | 98 (8.5%) |
| Foreign Born, Citizen | 1,969 (95.5%) | 93 (4.5%) |
| Foreign Born, not a Citizen | 797 (87.3%) | 116 (12.7%) |
Health Insurance Coverage by Household Income in Tavares

| Household Income | With Coverage | Without Coverage |
| Under $25,000 | 2,181 (87.0%) | 326 (13.0%) |
| $25,000 to $49,999 | 4,006 (95.8%) | 176 (4.2%) |
| $50,000 to $74,999 | 3,147 (95.0%) | 165 (5.0%) |
| $75,000 to $99,999 | 2,682 (82.3%) | 578 (17.7%) |
| $100,000 and over | 4,471 (93.6%) | 308 (6.4%) |
Public vs Private Health Insurance Coverage by Age in Tavares

| Age Bracket | Public Insurance | Private Insurance |
| Under 6 | 822 (71.5%) | 407 (35.4%) |
| 6 to 18 Years | 869 (42.1%) | 1,201 (58.2%) |
| 19 to 25 Years | 289 (31.7%) | 579 (63.4%) |
| 25 to 34 Years | 352 (22.9%) | 846 (54.9%) |
| 35 to 44 Years | 302 (19.9%) | 1,087 (71.5%) |
| 45 to 54 Years | 328 (18.9%) | 1,096 (63.0%) |
| 55 to 64 Years | 417 (20.1%) | 1,456 (70.2%) |
| 65 to 74 Years | 3,253 (97.9%) | 1,731 (52.1%) |
| 75 Years and over | 3,738 (99.1%) | 2,651 (70.2%) |
| Total | 10,370 (57.3%) | 11,054 (61.1%) |
Disability Status by Sex by Age in Tavares

| Age Bracket | Male | Female |
| Under 5 Years | 0 (0.0%) | 0 (0.0%) |
| 5 to 17 Years | 144 (15.0%) | 142 (11.5%) |
| 18 to 34 Years | 75 (5.9%) | 117 (8.6%) |
| 35 to 64 Years | 391 (17.3%) | 366 (11.9%) |
| 65 to 74 Years | 524 (32.7%) | 575 (33.5%) |
| 75 Years and over | 801 (52.7%) | 920 (40.8%) |
Disability Class by Sex by Age in Tavares
Disability Class: Hearing Difficulty

| Age Bracket | Male | Female |
| Under 5 Years | 0 (0.0%) | 0 (0.0%) |
| 5 to 17 Years | 0 (0.0%) | 0 (0.0%) |
| 18 to 34 Years | 0 (0.0%) | 20 (1.5%) |
| 35 to 64 Years | 139 (6.1%) | 48 (1.6%) |
| 65 to 74 Years | 283 (17.6%) | 143 (8.3%) |
| 75 Years and over | 357 (23.5%) | 341 (15.1%) |
Disability Class: Vision Difficulty

| Age Bracket | Male | Female |
| Under 5 Years | 0 (0.0%) | 0 (0.0%) |
| 5 to 17 Years | 21 (2.2%) | 13 (1.1%) |
| 18 to 34 Years | 0 (0.0%) | 35 (2.6%) |
| 35 to 64 Years | 50 (2.2%) | 97 (3.2%) |
| 65 to 74 Years | 53 (3.3%) | 67 (3.9%) |
| 75 Years and over | 85 (5.6%) | 107 (4.8%) |
Disability Class: Cognitive Difficulty

| Age Bracket | Male | Female |
| 5 to 17 Years | 135 (14.1%) | 129 (10.4%) |
| 18 to 34 Years | 75 (5.9%) | 33 (2.4%) |
| 35 to 64 Years | 175 (7.7%) | 213 (6.9%) |
| 65 to 74 Years | 99 (6.2%) | 35 (2.0%) |
| 75 Years and over | 112 (7.4%) | 322 (14.3%) |
Disability Class: Ambulatory Difficulty

| Age Bracket | Male | Female |
| 5 to 17 Years | 12 (1.3%) | 0 (0.0%) |
| 18 to 34 Years | 0 (0.0%) | 46 (3.4%) |
| 35 to 64 Years | 97 (4.3%) | 137 (4.5%) |
| 65 to 74 Years | 382 (23.8%) | 353 (20.5%) |
| 75 Years and over | 467 (30.7%) | 720 (31.9%) |
Disability Class: Self-Care Difficulty

| Age Bracket | Male | Female |
| 5 to 17 Years | 12 (1.3%) | 78 (6.3%) |
| 18 to 34 Years | 0 (0.0%) | 16 (1.2%) |
| 35 to 64 Years | 59 (2.6%) | 26 (0.9%) |
| 65 to 74 Years | 247 (15.4%) | 10 (0.6%) |
| 75 Years and over | 145 (9.6%) | 158 (7.0%) |
Technology Access in Tavares
Computing Device Access in Tavares

| Device Type | # Households | % Households |
| Desktop or Laptop | 6,215 | 73.0% |
| Smartphone | 6,857 | 80.5% |
| Tablet | 5,076 | 59.6% |
| No Computing Device | 742 | 8.7% |
| Total | 8,515 | 100.0% |
Internet Access in Tavares

| Internet Type | # Households | % Households |
| Dial-Up Internet | 0 | 0.0% |
| Broadband Home | 5,932 | 69.7% |
| Cellular Data Only | 875 | 10.3% |
| Satellite Internet | 762 | 8.9% |
| No Internet | 1,409 | 16.6% |
| Total | 8,515 | 100.0% |
Tavares Summary
Tavares, Florida is a small city located in Lake County, Florida. It is situated in the central part of the state, about 30 miles northwest of Orlando. The city is known for its beautiful lakes, parks, and recreational activities.
History
Tavares was founded in 1880 by Alexander St. Clair-Abrams, a former Confederate soldier. He named the city after his friend, Captain Henry Tavares, who had served in the Confederate Army. The city was incorporated in 1887 and was the county seat of Lake County until 2013.
Tavares was a small farming community until the 1950s, when the city began to experience rapid growth due to the development of the nearby Orlando area. The city was also home to a large citrus industry, which provided jobs and income for many of the city’s residents.
Geography
Tavares is located in the central part of Florida, about 30 miles northwest of Orlando. The city is situated on the northern shore of Lake Dora, one of the largest lakes in the state. The city is also home to several other smaller lakes, including Lake Eustis, Lake Harris, and Lake Griffin.
The city has a total area of 8.2 square miles, of which 7.9 square miles is land and 0.3 square miles is water. The city is located at an elevation of 81 feet above sea level.
Economy
Tavares has a diverse economy, with a variety of industries providing employment opportunities for its residents. The city is home to several manufacturing companies, including a paper mill, a plastics factory, and a printing company. The city is also home to a number of retail stores, restaurants, and other businesses.
The city is also home to a large tourism industry, with many visitors coming to the area to enjoy the city’s lakes, parks, and recreational activities. The city is also home to a number of marinas, which provide access to the many lakes in the area.
Demographics
As of the 2010 census, the population of Tavares was 13,951. The city has a population density of 1,717 people per square mile. The median age of the population is 43.7 years, and the median household income is $41,945.
The racial makeup of the city is 79.2% White, 14.2% African American, 0.4% Native American, 1.2% Asian, 0.1% Pacific Islander, 2.3% from other races, and 2.7% from two or more races. The city is also home to a large Hispanic population, with 24.3% of the population being of Hispanic or Latino origin.
Tavares is a small city with a rich history and a diverse economy. The city is home to a variety of industries, businesses, and recreational activities, making it an attractive destination for visitors and residents alike.
Common Questions
What is Per Capita Income in Tavares?
Per Capita income in Tavares is $35,284.
What is the Median Family Income in Tavares?
Median Family Income in Tavares is $73,207.
What is the Median Household income in Tavares?
Median Household Income in Tavares is $54,271.
What is Income or Wage Gap in Tavares?
Income or Wage Gap in Tavares is 39.7%.
Women in Tavares earn 60.3 cents for every dollar earned by a man.
What is Inequality or Gini Index in Tavares?
Inequality or Gini Index in Tavares is 0.48.
What is the Total Population of Tavares?
Total Population of Tavares is 19,088.
What is the Total Male Population of Tavares?
Total Male Population of Tavares is 8,780.
What is the Total Female Population of Tavares?
Total Female Population of Tavares is 10,308.
What is the Ratio of Males per 100 Females in Tavares?
There are 85.18 Males per 100 Females in Tavares.
What is the Ratio of Females per 100 Males in Tavares?
There are 117.40 Females per 100 Males in Tavares.
What is the Median Population Age in Tavares?
Median Population Age in Tavares is 54.6 Years.
What is the Average Family Size in Tavares
Average Family Size in Tavares is 2.7 People.
What is the Average Household Size in Tavares
Average Household Size in Tavares is 2.1 People.
How Large is the Labor Force in Tavares?
There are 6,844 People in the Labor Forcein in Tavares.
What is the Percentage of People in the Labor Force in Tavares?
41.7% of People are in the Labor Force in Tavares.
What is the Unemployment Rate in Tavares?
Unemployment Rate in Tavares is 4.9%.