Umatilla, FL Map & Demographics
Umatilla Map
Umatilla Overview
$37,882
PER CAPITA INCOME
$74,602
AVG FAMILY INCOME
$67,505
AVG HOUSEHOLD INCOME
45.9%
WAGE / INCOME GAP [ % ]
54.1¢/ $1
WAGE / INCOME GAP [ $ ]
0.39
INEQUALITY / GINI INDEX
3,738
TOTAL POPULATION
1,858
MALE POPULATION
1,880
FEMALE POPULATION
98.83
MALES / 100 FEMALES
101.18
FEMALES / 100 MALES
61.7
MEDIAN AGE
2.7
AVG FAMILY SIZE
1.9
AVG HOUSEHOLD SIZE
1,529
LABOR FORCE [ PEOPLE ]
44.0%
PERCENT IN LABOR FORCE
1.0%
UNEMPLOYMENT RATE
Umatilla Zip Codes
Umatilla Area Codes
Income in Umatilla
Income Overview in Umatilla
Per Capita Income in Umatilla is $37,882, while median incomes of families and households are $74,602 and $67,505 respectively.
| Characteristic | Number | Measure |
| Per Capita Income | 3,738 | $37,882 |
| Median Family Income | 987 | $74,602 |
| Mean Family Income | 987 | $99,475 |
| Median Household Income | 1,935 | $67,505 |
| Mean Household Income | 1,935 | $72,652 |
| Income Deficit | 987 | $0 |
| Wage / Income Gap (%) | 3,738 | 45.91% |
| Wage / Income Gap ($) | 3,738 | 54.09¢ per $1 |
| Gini / Inequality Index | 3,738 | 0.39 |
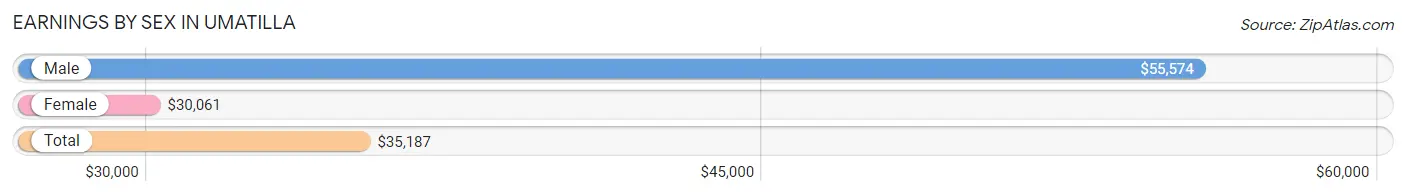
Earnings by Sex in Umatilla
Average Earnings in Umatilla are $35,187, $55,574 for men and $30,061 for women, a difference of 45.9%.
| Sex | Number | Average Earnings |
| Male | 985 (59.8%) | $55,574 |
| Female | 663 (40.2%) | $30,061 |
| Total | 1,648 (100.0%) | $35,187 |
Earnings by Sex by Income Bracket in Umatilla
The most common earnings brackets in Umatilla are $65,000 to $74,999 for men (199 | 20.2%) and $25,000 to $29,999 for women (135 | 20.4%).
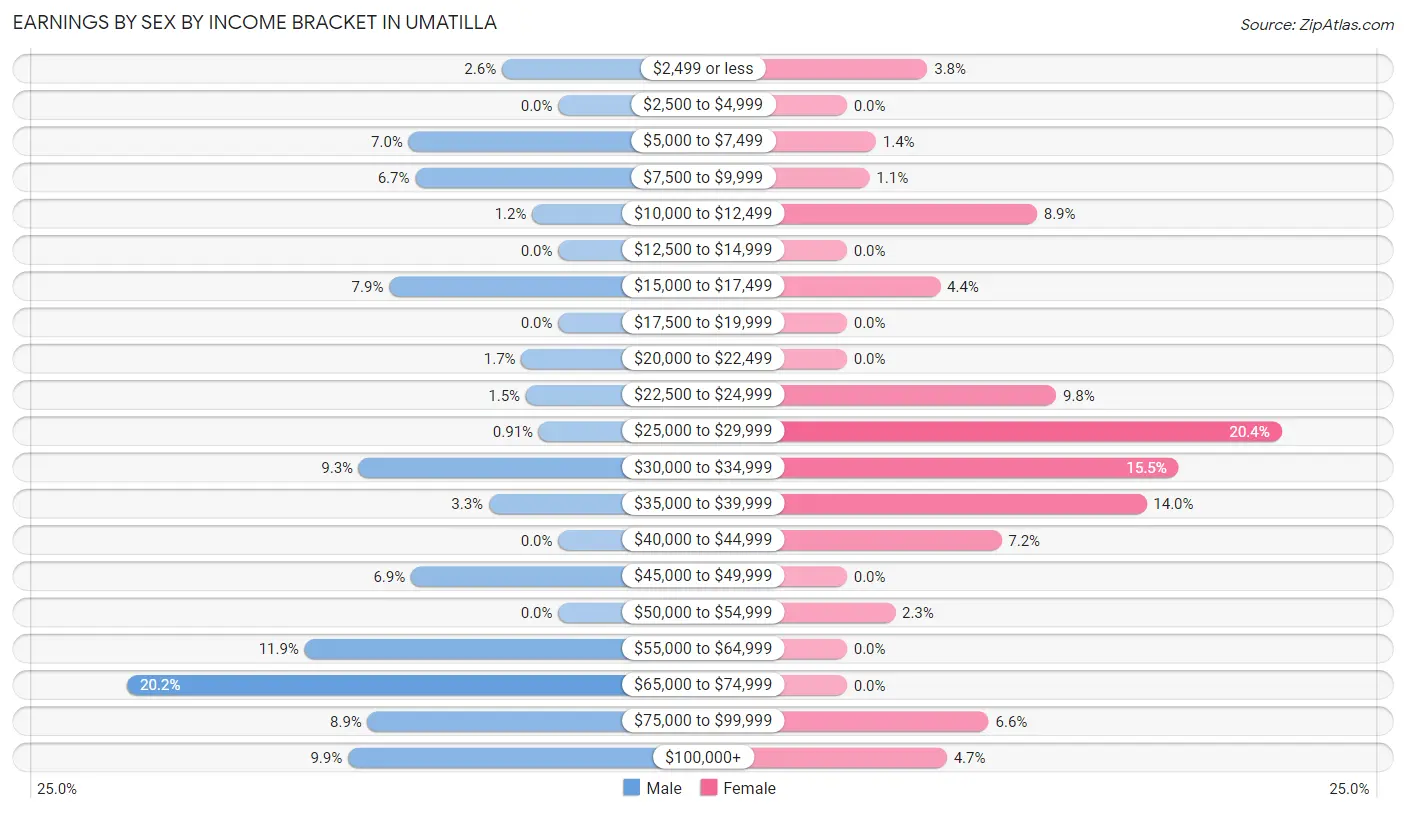
| Income | Male | Female |
| $2,499 or less | 26 (2.6%) | 25 (3.8%) |
| $2,500 to $4,999 | 0 (0.0%) | 0 (0.0%) |
| $5,000 to $7,499 | 69 (7.0%) | 9 (1.4%) |
| $7,500 to $9,999 | 66 (6.7%) | 7 (1.1%) |
| $10,000 to $12,499 | 12 (1.2%) | 59 (8.9%) |
| $12,500 to $14,999 | 0 (0.0%) | 0 (0.0%) |
| $15,000 to $17,499 | 78 (7.9%) | 29 (4.4%) |
| $17,500 to $19,999 | 0 (0.0%) | 0 (0.0%) |
| $20,000 to $22,499 | 17 (1.7%) | 0 (0.0%) |
| $22,500 to $24,999 | 15 (1.5%) | 65 (9.8%) |
| $25,000 to $29,999 | 9 (0.9%) | 135 (20.4%) |
| $30,000 to $34,999 | 92 (9.3%) | 103 (15.5%) |
| $35,000 to $39,999 | 32 (3.3%) | 93 (14.0%) |
| $40,000 to $44,999 | 0 (0.0%) | 48 (7.2%) |
| $45,000 to $49,999 | 68 (6.9%) | 0 (0.0%) |
| $50,000 to $54,999 | 0 (0.0%) | 15 (2.3%) |
| $55,000 to $64,999 | 117 (11.9%) | 0 (0.0%) |
| $65,000 to $74,999 | 199 (20.2%) | 0 (0.0%) |
| $75,000 to $99,999 | 88 (8.9%) | 44 (6.6%) |
| $100,000+ | 97 (9.9%) | 31 (4.7%) |
| Total | 985 (100.0%) | 663 (100.0%) |
Earnings by Sex by Educational Attainment in Umatilla
Average earnings in Umatilla are $56,824 for men and $30,425 for women, a difference of 46.5%. Men with an educational attainment of high school diploma enjoy the highest average annual earnings of $67,840, while those with college or associate's degree education earn the least with $47,537. Women with an educational attainment of bachelor's degree earn the most with the average annual earnings of $31,000, while those with college or associate's degree education have the smallest earnings of $28,105.
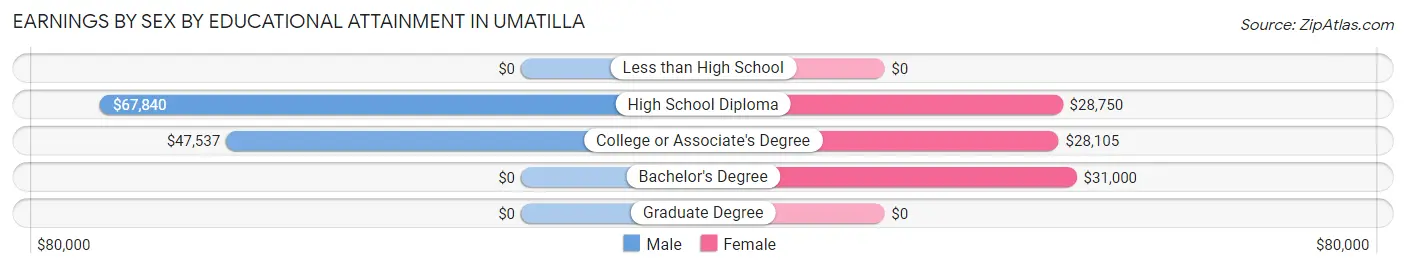
| Educational Attainment | Male Income | Female Income |
| Less than High School | - | - |
| High School Diploma | $67,840 | $28,750 |
| College or Associate's Degree | $47,537 | $28,105 |
| Bachelor's Degree | - | - |
| Graduate Degree | - | - |
| Total | $56,824 | $30,425 |
Family Income in Umatilla
Family Income Brackets in Umatilla
According to the Umatilla family income data, there are 313 families falling into the $50,000 to $74,999 income range, which is the most common income bracket and makes up 31.7% of all families.
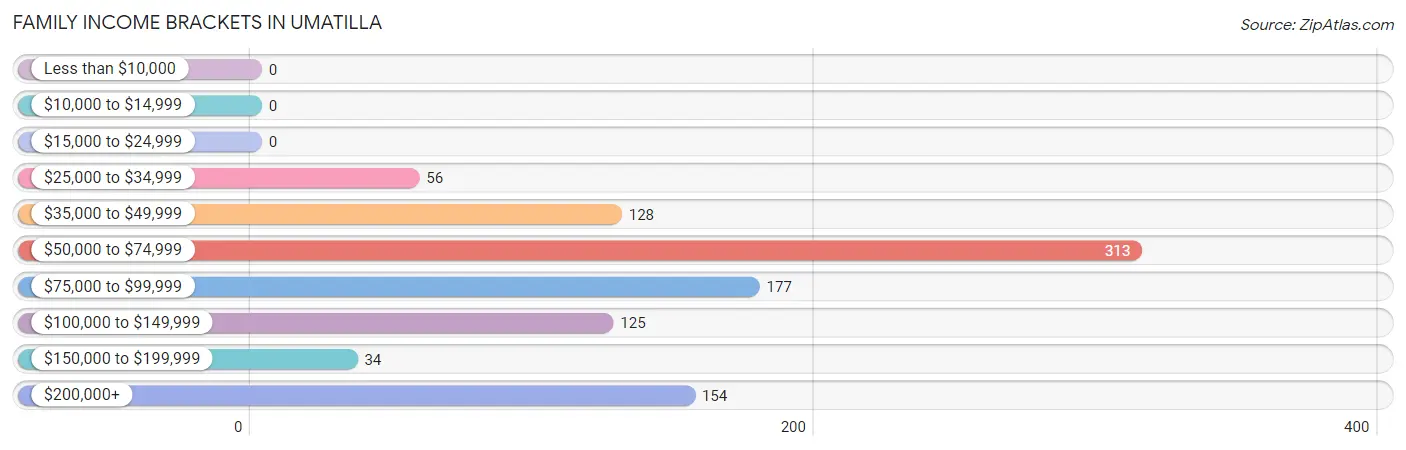
| Income Bracket | # Families | % Families |
| Less than $10,000 | 0 | 0.0% |
| $10,000 to $14,999 | 0 | 0.0% |
| $15,000 to $24,999 | 0 | 0.0% |
| $25,000 to $34,999 | 56 | 5.7% |
| $35,000 to $49,999 | 128 | 13.0% |
| $50,000 to $74,999 | 313 | 31.7% |
| $75,000 to $99,999 | 177 | 17.9% |
| $100,000 to $149,999 | 125 | 12.7% |
| $150,000 to $199,999 | 34 | 3.4% |
| $200,000+ | 154 | 15.6% |
Family Income by Famaliy Size in Umatilla
4-person families (168 | 17.0%) account for the highest median family income in Umatilla with $200,747 per family, while 4-person families (168 | 17.0%) have the highest median income of $50,187 per family member.
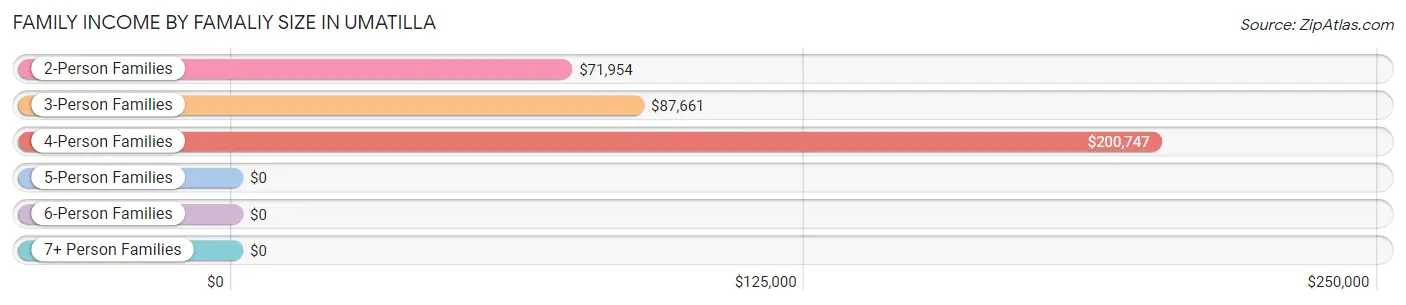
| Income Bracket | # Families | Median Income |
| 2-Person Families | 579 (58.7%) | $71,954 |
| 3-Person Families | 204 (20.7%) | $87,661 |
| 4-Person Families | 168 (17.0%) | $200,747 |
| 5-Person Families | 36 (3.6%) | $0 |
| 6-Person Families | 0 (0.0%) | $0 |
| 7+ Person Families | 0 (0.0%) | $0 |
| Total | 987 (100.0%) | $74,602 |
Family Income by Number of Earners in Umatilla
The median family income in Umatilla is $74,602, with families comprising 3+ earners (52) having the highest median family income of $176,667, while families with 1 earner (207) have the lowest median family income of $44,515, accounting for 5.3% and 21.0% of families, respectively.
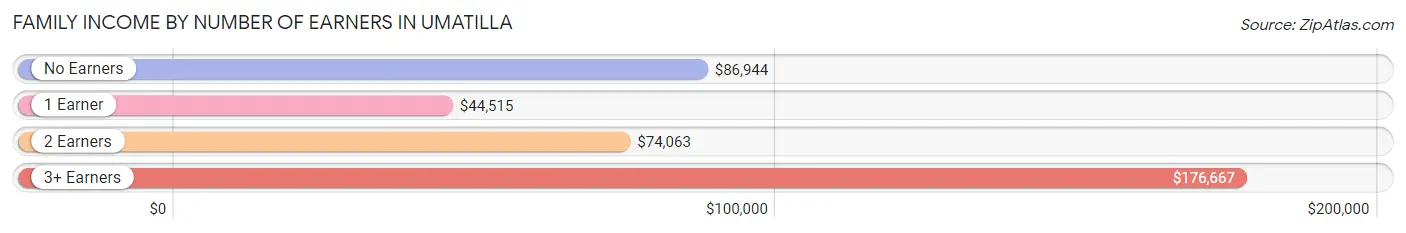
| Number of Earners | # Families | Median Income |
| No Earners | 314 (31.8%) | $86,944 |
| 1 Earner | 207 (21.0%) | $44,515 |
| 2 Earners | 414 (41.9%) | $74,063 |
| 3+ Earners | 52 (5.3%) | $176,667 |
| Total | 987 (100.0%) | $74,602 |
Household Income in Umatilla
Household Income Brackets in Umatilla
With 629 households falling in the category, the $50,000 to $74,999 income range is the most frequent in Umatilla, accounting for 32.5% of all households. In contrast, only 14 households (0.7%) fall into the $10,000 to $14,999 income bracket, making it the least populous group.
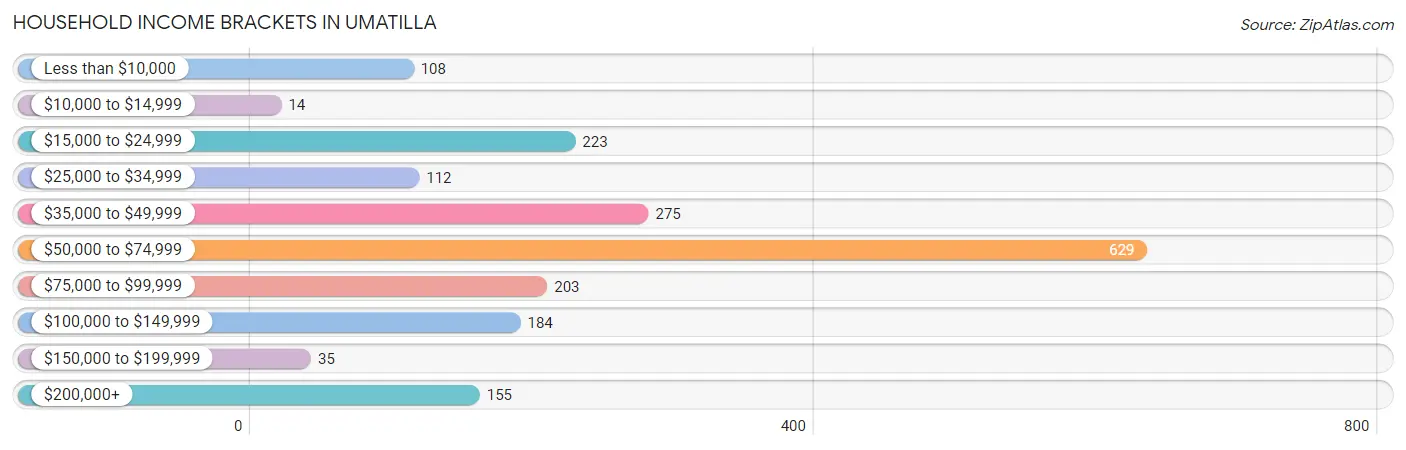
| Income Bracket | # Households | % Households |
| Less than $10,000 | 108 | 5.6% |
| $10,000 to $14,999 | 14 | 0.7% |
| $15,000 to $24,999 | 223 | 11.5% |
| $25,000 to $34,999 | 112 | 5.8% |
| $35,000 to $49,999 | 275 | 14.2% |
| $50,000 to $74,999 | 629 | 32.5% |
| $75,000 to $99,999 | 203 | 10.5% |
| $100,000 to $149,999 | 184 | 9.5% |
| $150,000 to $199,999 | 35 | 1.8% |
| $200,000+ | 155 | 8.0% |
Household Income by Householder Age in Umatilla
The median household income in Umatilla is $67,505, with the highest median household income of $70,013 found in the 25 to 44 years age bracket for the primary householder. A total of 421 households (21.8%) fall into this category.
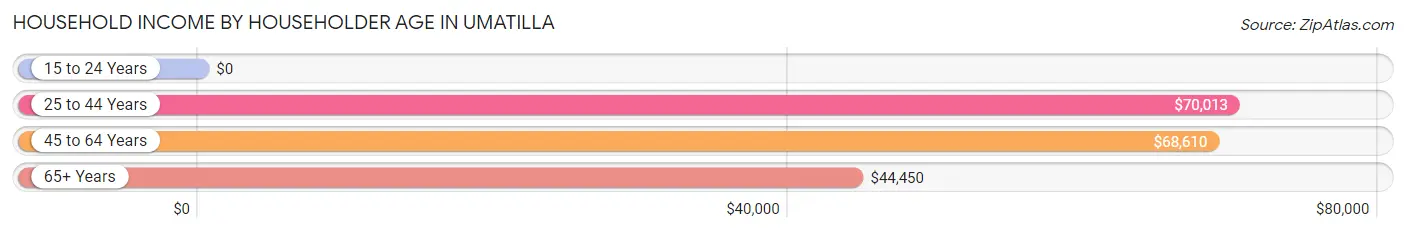
| Income Bracket | # Households | Median Income |
| 15 to 24 Years | 0 (0.0%) | $0 |
| 25 to 44 Years | 421 (21.8%) | $70,013 |
| 45 to 64 Years | 473 (24.4%) | $68,610 |
| 65+ Years | 1,041 (53.8%) | $44,450 |
| Total | 1,935 (100.0%) | $67,505 |
Poverty in Umatilla
Income Below Poverty by Sex and Age in Umatilla
With 7.2% poverty level for males and 2.8% for females among the residents of Umatilla, 65 to 74 year old males and 75 year old and over females are the most vulnerable to poverty, with 64 males (25.4%) and 43 females (7.9%) in their respective age groups living below the poverty level.
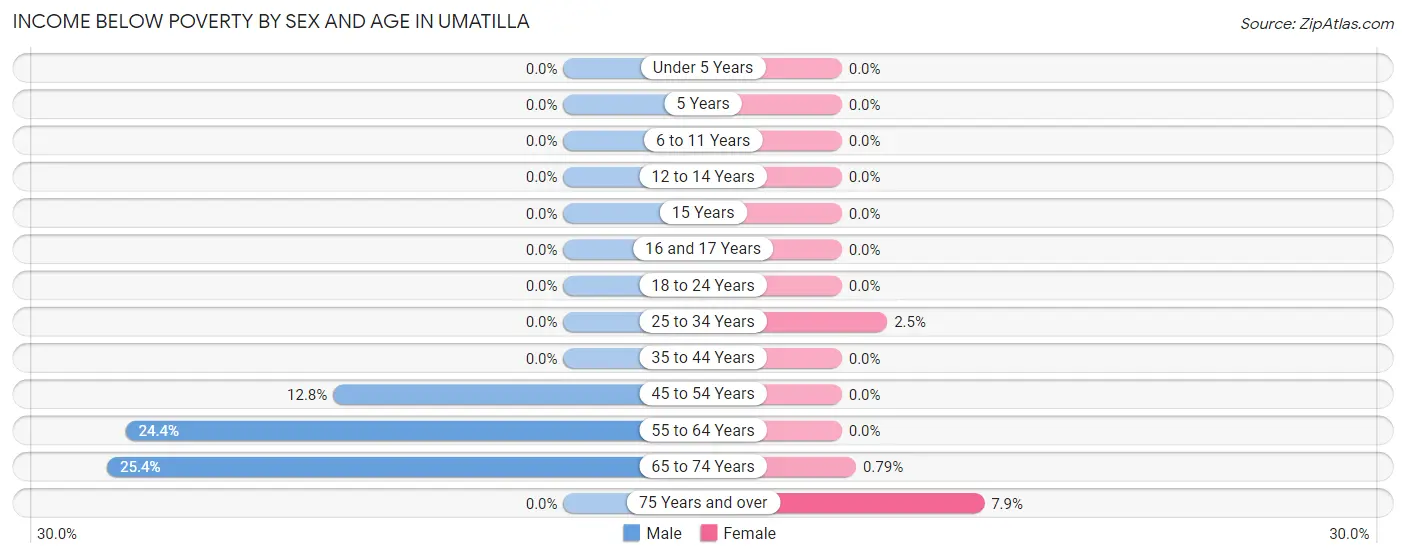
| Age Bracket | Male | Female |
| Under 5 Years | 0 (0.0%) | 0 (0.0%) |
| 5 Years | 0 (0.0%) | 0 (0.0%) |
| 6 to 11 Years | 0 (0.0%) | 0 (0.0%) |
| 12 to 14 Years | 0 (0.0%) | 0 (0.0%) |
| 15 Years | 0 (0.0%) | 0 (0.0%) |
| 16 and 17 Years | 0 (0.0%) | 0 (0.0%) |
| 18 to 24 Years | 0 (0.0%) | 0 (0.0%) |
| 25 to 34 Years | 0 (0.0%) | 5 (2.5%) |
| 35 to 44 Years | 0 (0.0%) | 0 (0.0%) |
| 45 to 54 Years | 40 (12.8%) | 0 (0.0%) |
| 55 to 64 Years | 29 (24.4%) | 0 (0.0%) |
| 65 to 74 Years | 64 (25.4%) | 3 (0.8%) |
| 75 Years and over | 0 (0.0%) | 43 (7.9%) |
| Total | 133 (7.2%) | 51 (2.8%) |
Income Above Poverty by Sex and Age in Umatilla
According to the poverty statistics in Umatilla, males aged under 5 years and females aged 6 to 11 years are the age groups that are most secure financially, with 100.0% of males and 100.0% of females in these age groups living above the poverty line.
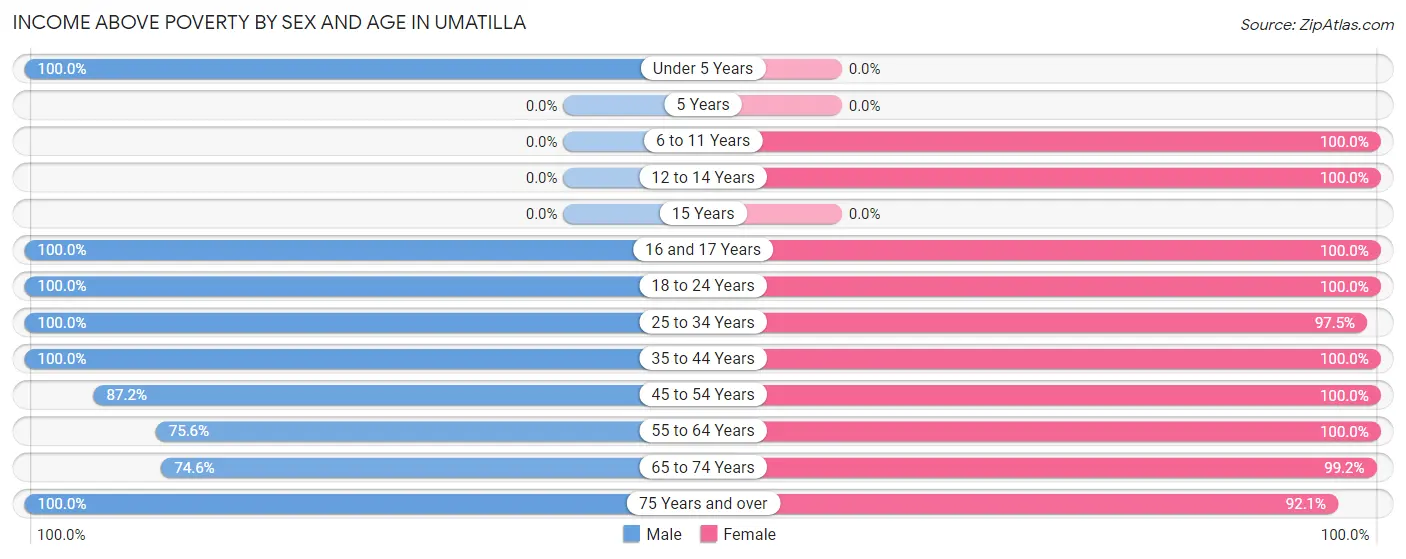
| Age Bracket | Male | Female |
| Under 5 Years | 114 (100.0%) | 0 (0.0%) |
| 5 Years | 0 (0.0%) | 0 (0.0%) |
| 6 to 11 Years | 0 (0.0%) | 59 (100.0%) |
| 12 to 14 Years | 0 (0.0%) | 84 (100.0%) |
| 15 Years | 0 (0.0%) | 0 (0.0%) |
| 16 and 17 Years | 41 (100.0%) | 23 (100.0%) |
| 18 to 24 Years | 121 (100.0%) | 30 (100.0%) |
| 25 to 34 Years | 251 (100.0%) | 193 (97.5%) |
| 35 to 44 Years | 157 (100.0%) | 150 (100.0%) |
| 45 to 54 Years | 272 (87.2%) | 206 (100.0%) |
| 55 to 64 Years | 90 (75.6%) | 159 (100.0%) |
| 65 to 74 Years | 188 (74.6%) | 376 (99.2%) |
| 75 Years and over | 491 (100.0%) | 499 (92.1%) |
| Total | 1,725 (92.8%) | 1,779 (97.2%) |
Income Below Poverty Among Married-Couple Families in Umatilla
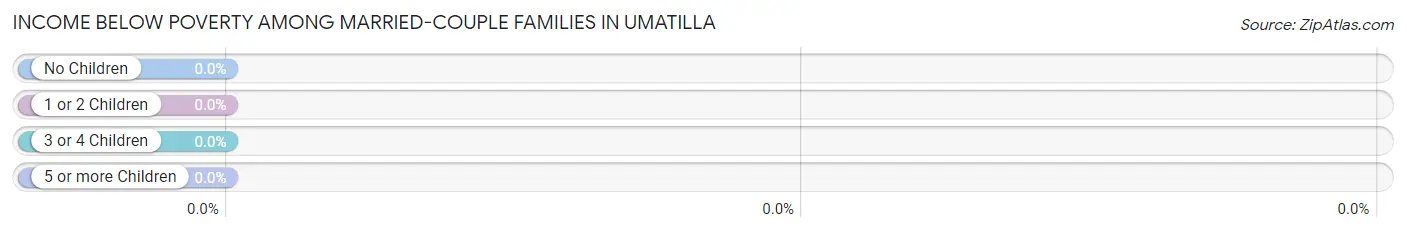
| Children | Above Poverty | Below Poverty |
| No Children | 654 (100.0%) | 0 (0.0%) |
| 1 or 2 Children | 214 (100.0%) | 0 (0.0%) |
| 3 or 4 Children | 0 (0.0%) | 0 (0.0%) |
| 5 or more Children | 0 (0.0%) | 0 (0.0%) |
| Total | 868 (100.0%) | 0 (0.0%) |
Income Below Poverty Among Single-Parent Households in Umatilla
| Children | Single Father | Single Mother |
| No Children | 0 (0.0%) | 0 (0.0%) |
| 1 or 2 Children | 0 (0.0%) | 0 (0.0%) |
| 3 or 4 Children | 0 (0.0%) | 0 (0.0%) |
| 5 or more Children | 0 (0.0%) | 0 (0.0%) |
| Total | 0 (0.0%) | 0 (0.0%) |
Income Below Poverty Among Married-Couple vs Single-Parent Households in Umatilla
| Children | Married-Couple Families | Single-Parent Households |
| No Children | 0 (0.0%) | 0 (0.0%) |
| 1 or 2 Children | 0 (0.0%) | 0 (0.0%) |
| 3 or 4 Children | 0 (0.0%) | 0 (0.0%) |
| 5 or more Children | 0 (0.0%) | 0 (0.0%) |
| Total | 0 (0.0%) | 0 (0.0%) |
Race in Umatilla
The most populous races in Umatilla are White / Caucasian (3,642 | 97.4%), Hispanic or Latino (279 | 7.5%), and Two or more Races (43 | 1.1%).
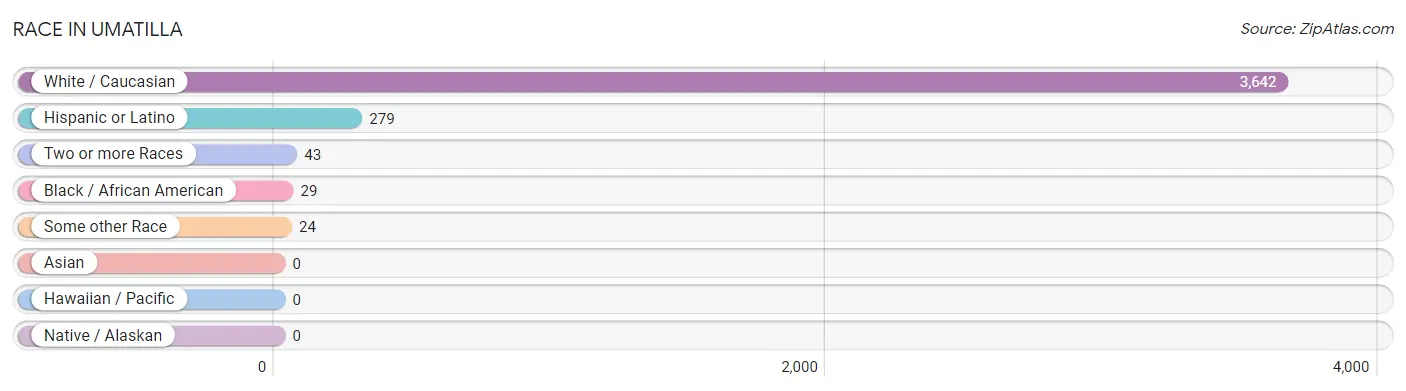
| Race | # Population | % Population |
| Asian | 0 | 0.0% |
| Black / African American | 29 | 0.8% |
| Hawaiian / Pacific | 0 | 0.0% |
| Hispanic or Latino | 279 | 7.5% |
| Native / Alaskan | 0 | 0.0% |
| White / Caucasian | 3,642 | 97.4% |
| Two or more Races | 43 | 1.1% |
| Some other Race | 24 | 0.6% |
| Total | 3,738 | 100.0% |
Ancestry in Umatilla
The most populous ancestries reported in Umatilla are English (762 | 20.4%), German (637 | 17.0%), Irish (491 | 13.1%), American (342 | 9.1%), and Swedish (229 | 6.1%), together accounting for 65.8% of all Umatilla residents.
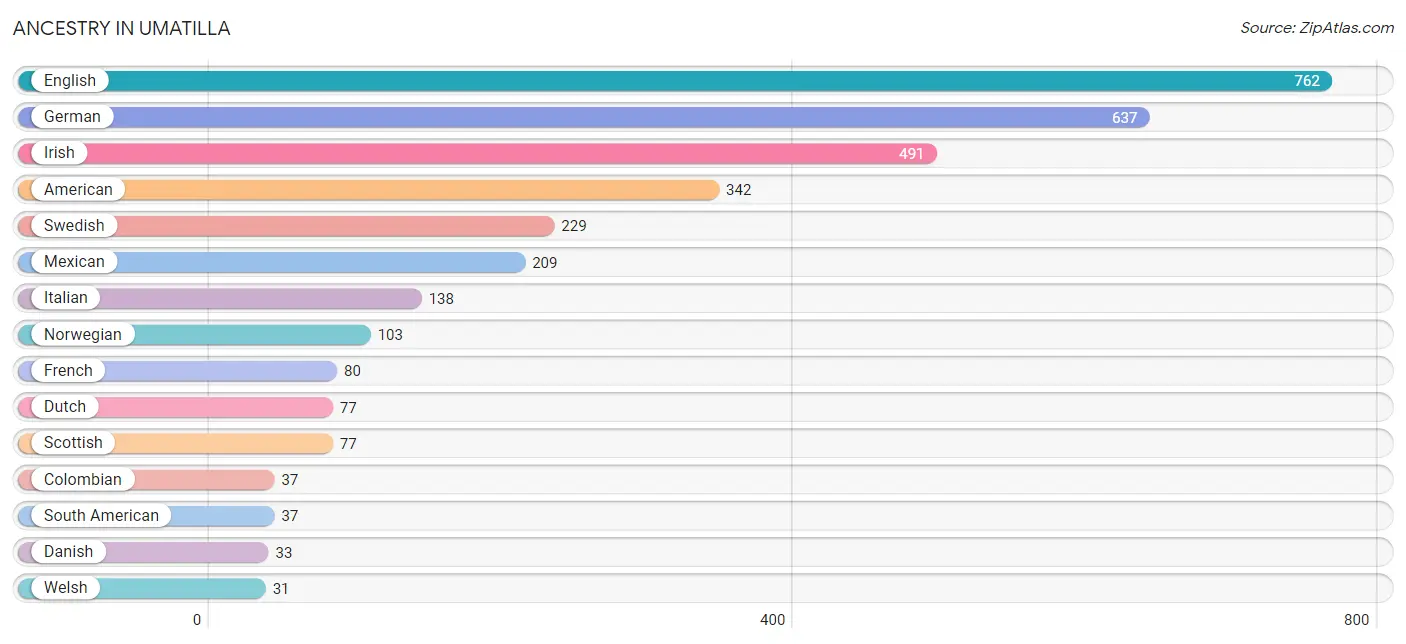
| Ancestry | # Population | % Population |
| American | 342 | 9.1% |
| Austrian | 9 | 0.2% |
| British | 6 | 0.2% |
| Central American | 5 | 0.1% |
| Colombian | 37 | 1.0% |
| Danish | 33 | 0.9% |
| Dutch | 77 | 2.1% |
| Eastern European | 12 | 0.3% |
| English | 762 | 20.4% |
| European | 12 | 0.3% |
| French | 80 | 2.1% |
| French Canadian | 10 | 0.3% |
| German | 637 | 17.0% |
| Haitian | 2 | 0.1% |
| Irish | 491 | 13.1% |
| Italian | 138 | 3.7% |
| Lithuanian | 9 | 0.2% |
| Mexican | 209 | 5.6% |
| Norwegian | 103 | 2.8% |
| Pennsylvania German | 21 | 0.6% |
| Polish | 21 | 0.6% |
| Portuguese | 19 | 0.5% |
| Puerto Rican | 6 | 0.2% |
| Salvadoran | 5 | 0.1% |
| Scotch-Irish | 28 | 0.7% |
| Scottish | 77 | 2.1% |
| Slovene | 20 | 0.5% |
| South American | 37 | 1.0% |
| Swedish | 229 | 6.1% |
| Welsh | 31 | 0.8% | View All 30 Rows |
Immigrants in Umatilla
The most numerous immigrant groups reported in Umatilla came from Latin America (133 | 3.6%), Central America (94 | 2.5%), Mexico (89 | 2.4%), Colombia (37 | 1.0%), and South America (37 | 1.0%), together accounting for 10.4% of all Umatilla residents.
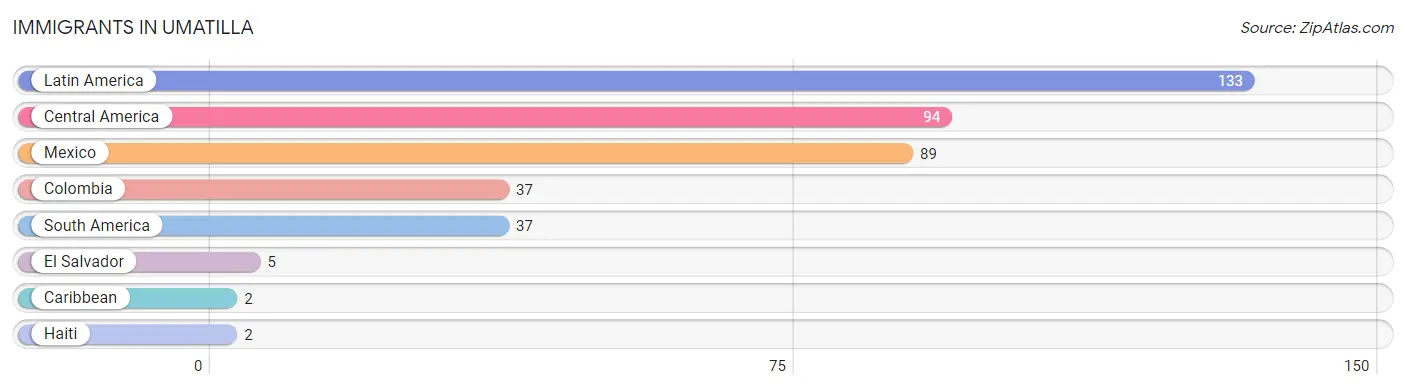
| Immigration Origin | # Population | % Population |
| Caribbean | 2 | 0.1% |
| Central America | 94 | 2.5% |
| Colombia | 37 | 1.0% |
| El Salvador | 5 | 0.1% |
| Haiti | 2 | 0.1% |
| Latin America | 133 | 3.6% |
| Mexico | 89 | 2.4% |
| South America | 37 | 1.0% | View All 8 Rows |
Sex and Age in Umatilla
Sex and Age in Umatilla
The most populous age groups in Umatilla are 50 to 54 Years (274 | 14.7%) for men and 70 to 74 Years (238 | 12.7%) for women.
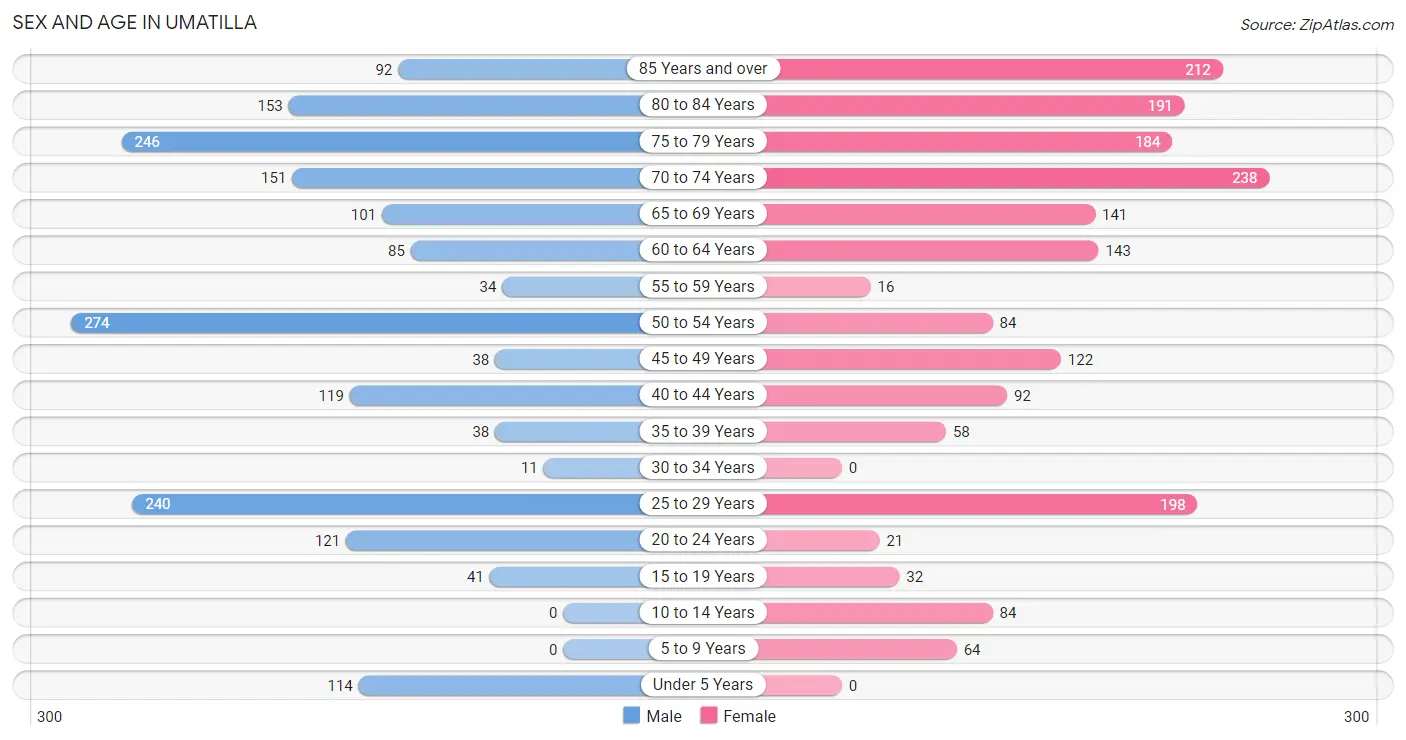
| Age Bracket | Male | Female |
| Under 5 Years | 114 (6.1%) | 0 (0.0%) |
| 5 to 9 Years | 0 (0.0%) | 64 (3.4%) |
| 10 to 14 Years | 0 (0.0%) | 84 (4.5%) |
| 15 to 19 Years | 41 (2.2%) | 32 (1.7%) |
| 20 to 24 Years | 121 (6.5%) | 21 (1.1%) |
| 25 to 29 Years | 240 (12.9%) | 198 (10.5%) |
| 30 to 34 Years | 11 (0.6%) | 0 (0.0%) |
| 35 to 39 Years | 38 (2.1%) | 58 (3.1%) |
| 40 to 44 Years | 119 (6.4%) | 92 (4.9%) |
| 45 to 49 Years | 38 (2.1%) | 122 (6.5%) |
| 50 to 54 Years | 274 (14.7%) | 84 (4.5%) |
| 55 to 59 Years | 34 (1.8%) | 16 (0.9%) |
| 60 to 64 Years | 85 (4.6%) | 143 (7.6%) |
| 65 to 69 Years | 101 (5.4%) | 141 (7.5%) |
| 70 to 74 Years | 151 (8.1%) | 238 (12.7%) |
| 75 to 79 Years | 246 (13.2%) | 184 (9.8%) |
| 80 to 84 Years | 153 (8.2%) | 191 (10.2%) |
| 85 Years and over | 92 (5.0%) | 212 (11.3%) |
| Total | 1,858 (100.0%) | 1,880 (100.0%) |
Families and Households in Umatilla
Median Family Size in Umatilla
The median family size in Umatilla is 2.67 persons per family, with single female/mother families (106 | 10.7%) accounting for the largest median family size of 3 persons per family. On the other hand, single male/father families (13 | 1.3%) represent the smallest median family size with 1.69 persons per family.
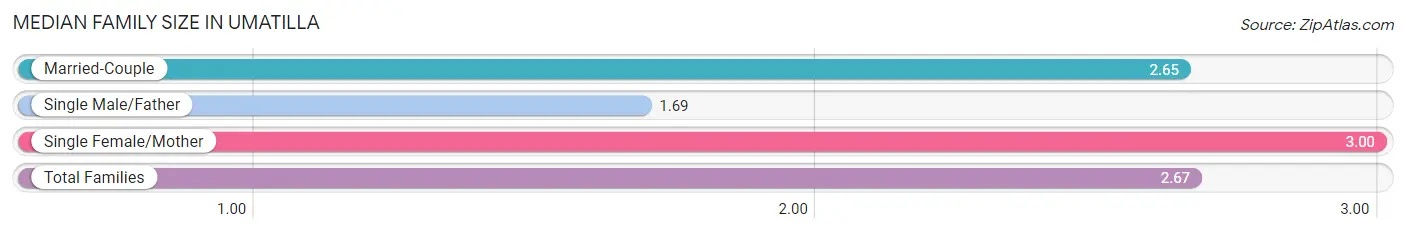
| Family Type | # Families | Family Size |
| Married-Couple | 868 (87.9%) | 2.65 |
| Single Male/Father | 13 (1.3%) | 1.69 |
| Single Female/Mother | 106 (10.7%) | 3.00 |
| Total Families | 987 (100.0%) | 2.67 |
Median Household Size in Umatilla
The median household size in Umatilla is 1.90 persons per household, with single female/mother households (106 | 5.5%) accounting for the largest median household size of 3.28 persons per household. non-family households (948 | 49.0%) represent the smallest median household size with 1.06 persons per household.
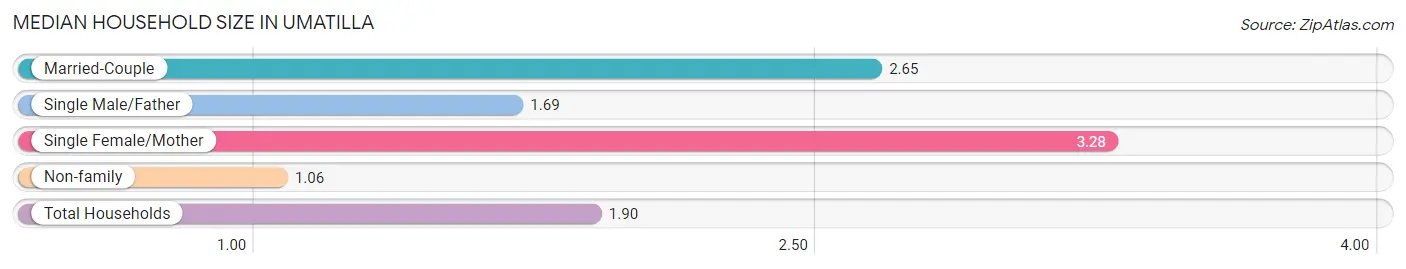
| Household Type | # Households | Household Size |
| Married-Couple | 868 (44.9%) | 2.65 |
| Single Male/Father | 13 (0.7%) | 1.69 |
| Single Female/Mother | 106 (5.5%) | 3.28 |
| Non-family | 948 (49.0%) | 1.06 |
| Total Households | 1,935 (100.0%) | 1.90 |
Household Size by Marriage Status in Umatilla
Out of a total of 1,935 households in Umatilla, 987 (51.0%) are family households, while 948 (49.0%) are nonfamily households. The most numerous type of family households are 2-person households, comprising 544, and the most common type of nonfamily households are 1-person households, comprising 885.
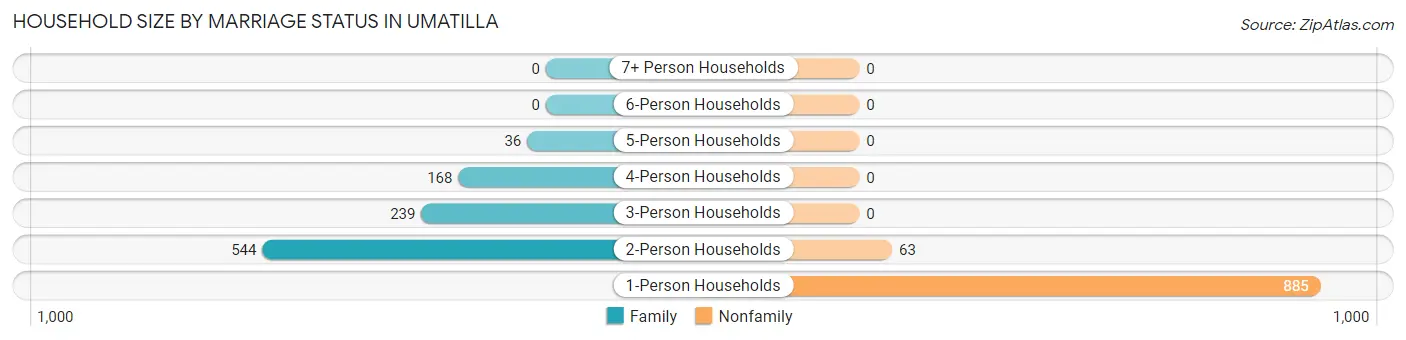
| Household Size | Family Households | Nonfamily Households |
| 1-Person Households | - | 885 (45.7%) |
| 2-Person Households | 544 (28.1%) | 63 (3.3%) |
| 3-Person Households | 239 (12.3%) | 0 (0.0%) |
| 4-Person Households | 168 (8.7%) | 0 (0.0%) |
| 5-Person Households | 36 (1.9%) | 0 (0.0%) |
| 6-Person Households | 0 (0.0%) | 0 (0.0%) |
| 7+ Person Households | 0 (0.0%) | 0 (0.0%) |
| Total | 987 (51.0%) | 948 (49.0%) |
Female Fertility in Umatilla
Fertility by Age in Umatilla
Average fertility rate in Umatilla is 110.0 births per 1,000 women. Women in the age bracket of 20 to 34 years have the highest fertility rate with 283.0 births per 1,000 women. Women in the age bracket of 20 to 34 years acount for 100.0% of all women with births.
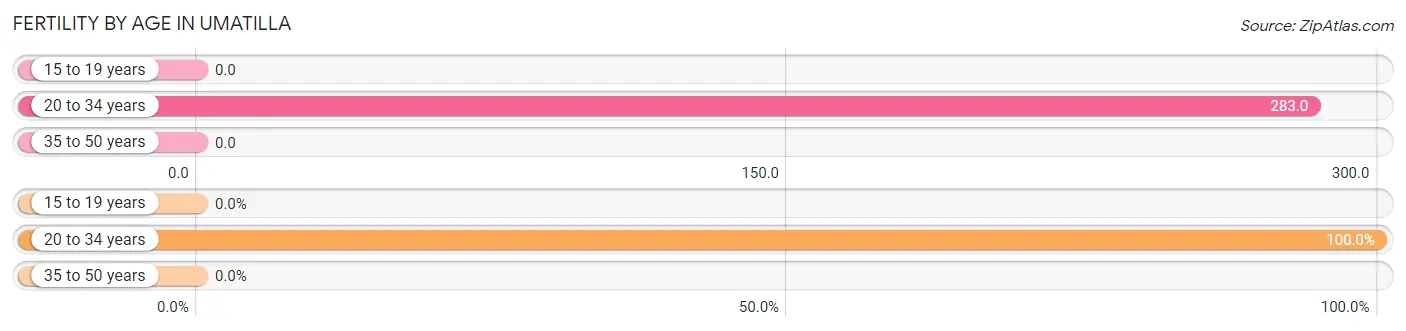
| Age Bracket | Women with Births | Births / 1,000 Women |
| 15 to 19 years | 0 (0.0%) | 0.0 |
| 20 to 34 years | 62 (100.0%) | 283.0 |
| 35 to 50 years | 0 (0.0%) | 0.0 |
| Total | 62 (100.0%) | 110.0 |
Fertility by Age by Marriage Status in Umatilla
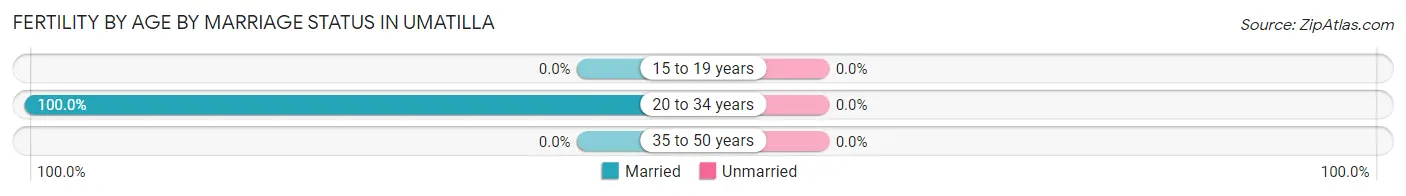
| Age Bracket | Married | Unmarried |
| 15 to 19 years | 0 (0.0%) | 0 (0.0%) |
| 20 to 34 years | 62 (100.0%) | 0 (0.0%) |
| 35 to 50 years | 0 (0.0%) | 0 (0.0%) |
| Total | 62 (100.0%) | 0 (0.0%) |
Fertility by Education in Umatilla
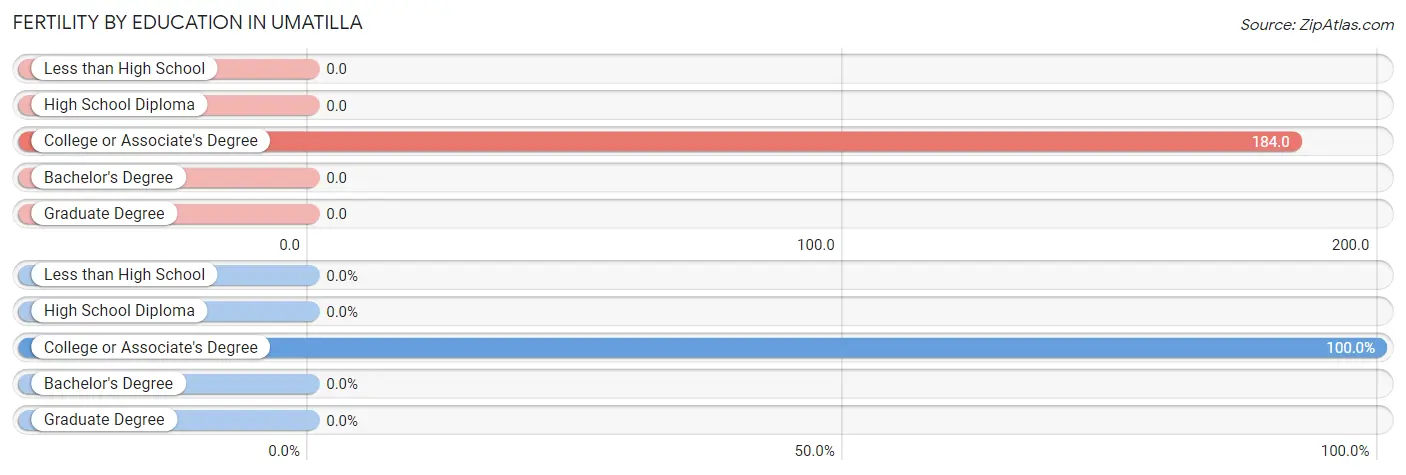
| Educational Attainment | Women with Births | Births / 1,000 Women |
| Less than High School | 0 (0.0%) | 0.0 |
| High School Diploma | 0 (0.0%) | 0.0 |
| College or Associate's Degree | 62 (100.0%) | 184.0 |
| Bachelor's Degree | 0 (0.0%) | 0.0 |
| Graduate Degree | 0 (0.0%) | 0.0 |
| Total | 62 (100.0%) | 110.0 |
Fertility by Education by Marriage Status in Umatilla
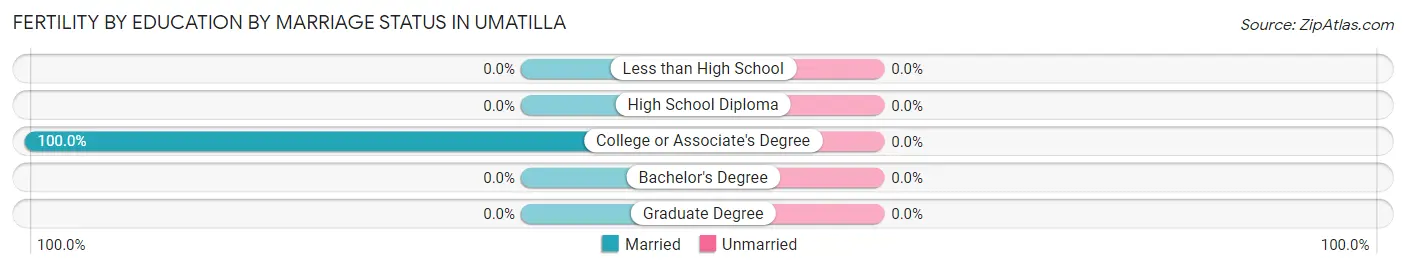
| Educational Attainment | Married | Unmarried |
| Less than High School | 0 (0.0%) | 0 (0.0%) |
| High School Diploma | 0 (0.0%) | 0 (0.0%) |
| College or Associate's Degree | 62 (100.0%) | 0 (0.0%) |
| Bachelor's Degree | 0 (0.0%) | 0 (0.0%) |
| Graduate Degree | 0 (0.0%) | 0 (0.0%) |
| Total | 62 (100.0%) | 0 (0.0%) |
Employment Characteristics in Umatilla
Employment by Class of Employer in Umatilla
Among the 1,512 employed individuals in Umatilla, private company employees (858 | 56.8%), self-employed (incorporated) (236 | 15.6%), and not-for-profit organizations (158 | 10.4%) make up the most common classes of employment.
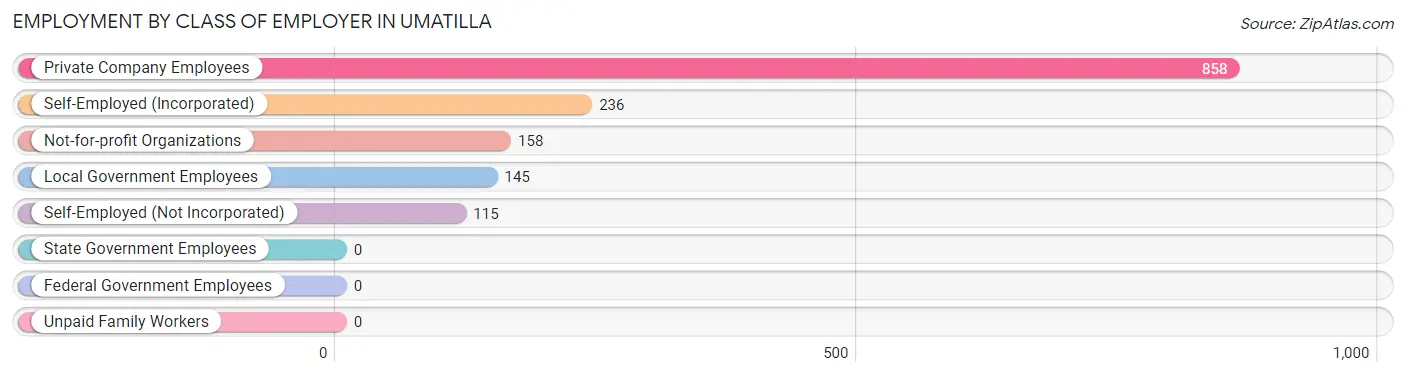
| Employer Class | # Employees | % Employees |
| Private Company Employees | 858 | 56.8% |
| Self-Employed (Incorporated) | 236 | 15.6% |
| Self-Employed (Not Incorporated) | 115 | 7.6% |
| Not-for-profit Organizations | 158 | 10.4% |
| Local Government Employees | 145 | 9.6% |
| State Government Employees | 0 | 0.0% |
| Federal Government Employees | 0 | 0.0% |
| Unpaid Family Workers | 0 | 0.0% |
| Total | 1,512 | 100.0% |
Employment Status by Age in Umatilla
According to the labor force statistics for Umatilla, out of the total population over 16 years of age (3,476), 44.0% or 1,529 individuals are in the labor force, with 1.0% or 15 of them unemployed. The age group with the highest labor force participation rate is 30 to 34 years, with 100.0% or 11 individuals in the labor force. Within the labor force, the 75 years and over age range has the highest percentage of unemployed individuals, with 45.2% or 14 of them being unemployed.
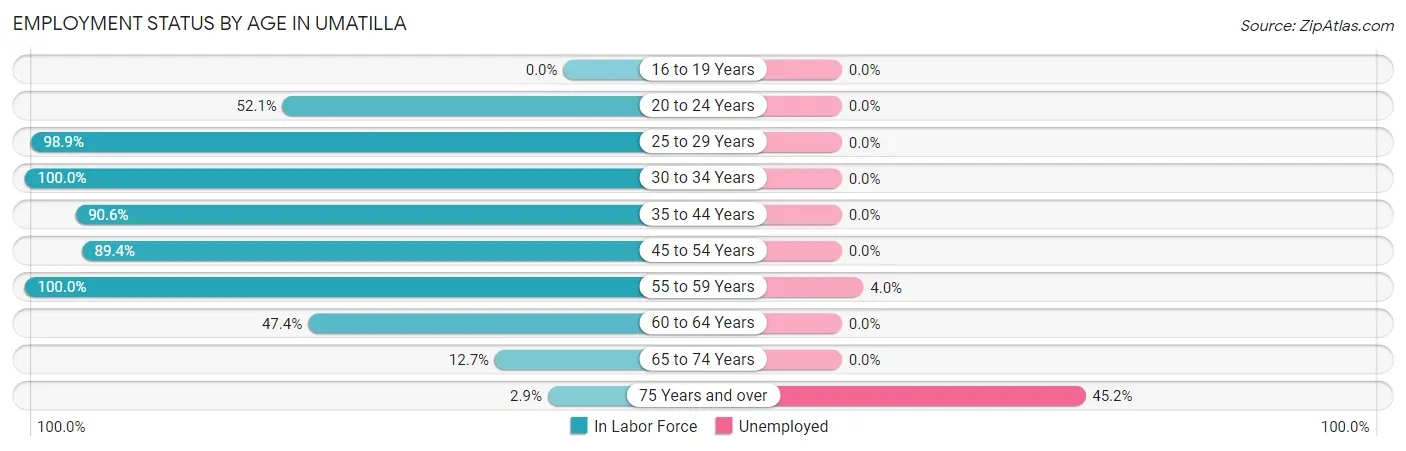
| Age Bracket | In Labor Force | Unemployed |
| 16 to 19 Years | 0 (0.0%) | 0 (0.0%) |
| 20 to 24 Years | 74 (52.1%) | 0 (0.0%) |
| 25 to 29 Years | 433 (98.9%) | 0 (0.0%) |
| 30 to 34 Years | 11 (100.0%) | 0 (0.0%) |
| 35 to 44 Years | 278 (90.6%) | 0 (0.0%) |
| 45 to 54 Years | 463 (89.4%) | 0 (0.0%) |
| 55 to 59 Years | 50 (100.0%) | 2 (4.0%) |
| 60 to 64 Years | 108 (47.4%) | 0 (0.0%) |
| 65 to 74 Years | 80 (12.7%) | 0 (0.0%) |
| 75 Years and over | 31 (2.9%) | 14 (45.2%) |
| Total | 1,529 (44.0%) | 15 (1.0%) |
Employment Status by Educational Attainment in Umatilla
According to labor force statistics for Umatilla, 86.5% of individuals (1,342) out of the total population between 25 and 64 years of age (1,552) are in the labor force, with 0.1% or 1 of them being unemployed. The group with the highest labor force participation rate are those with the educational attainment of college / associate degree, with 96.2% or 632 individuals in the labor force. Within the labor force, individuals with high school diploma education have the highest percentage of unemployment, with 0.4% or 2 of them being unemployed.
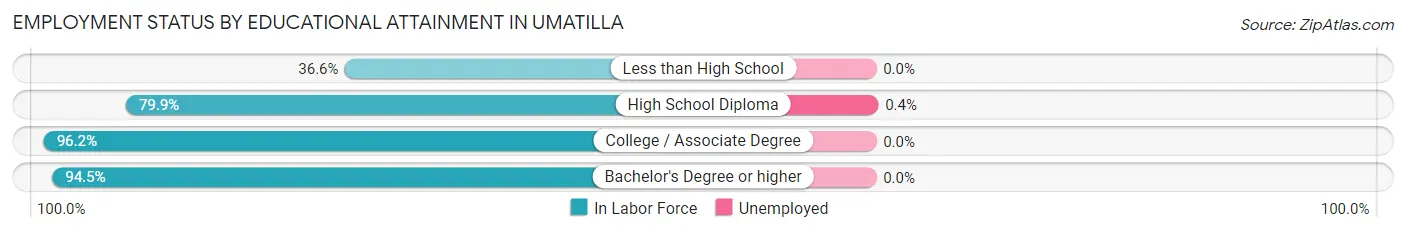
| Educational Attainment | In Labor Force | Unemployed |
| Less than High School | 30 (36.6%) | 0 (0.0%) |
| High School Diploma | 476 (79.9%) | 2 (0.4%) |
| College / Associate Degree | 632 (96.2%) | 0 (0.0%) |
| Bachelor's Degree or higher | 205 (94.5%) | 0 (0.0%) |
| Total | 1,342 (86.5%) | 2 (0.1%) |
Employment Occupations by Sex in Umatilla
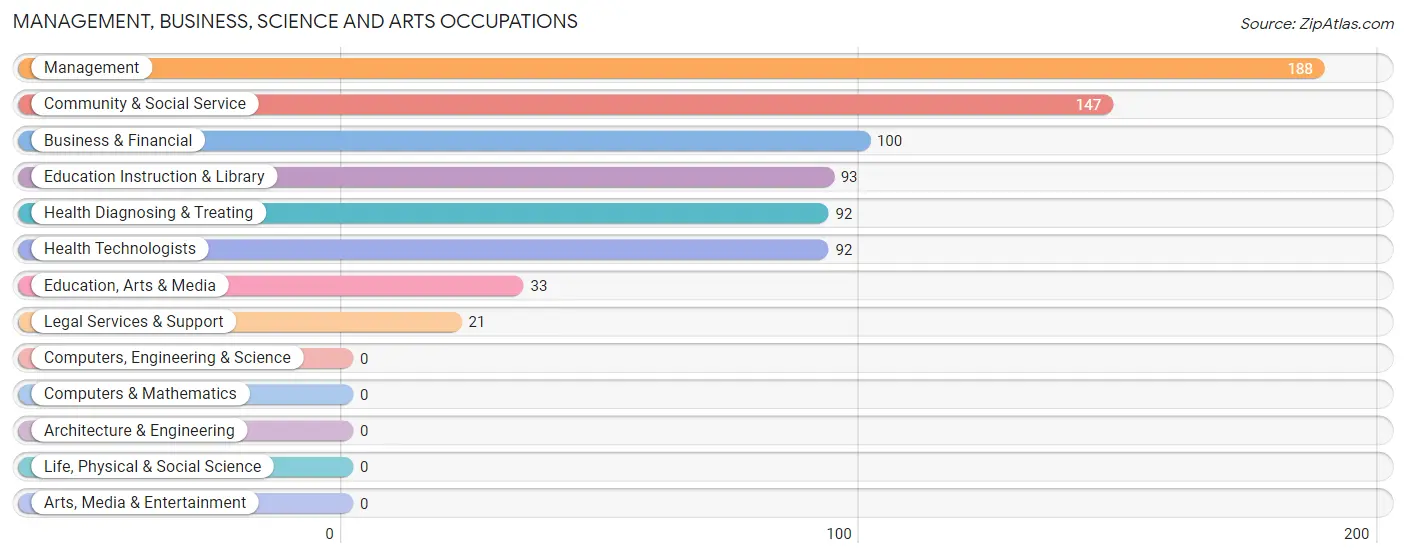
Management, Business, Science and Arts Occupations
The most common Management, Business, Science and Arts occupations in Umatilla are Management (188 | 12.4%), Community & Social Service (147 | 9.7%), Business & Financial (100 | 6.6%), Education Instruction & Library (93 | 6.1%), and Health Diagnosing & Treating (92 | 6.1%).
Management, Business, Science and Arts Occupations by Sex
Within the Management, Business, Science and Arts occupations in Umatilla, the most male-oriented occupations are Business & Financial (63.0%), and Management (39.9%), while the most female-oriented occupations are Community & Social Service (100.0%), Education, Arts & Media (100.0%), and Legal Services & Support (100.0%).
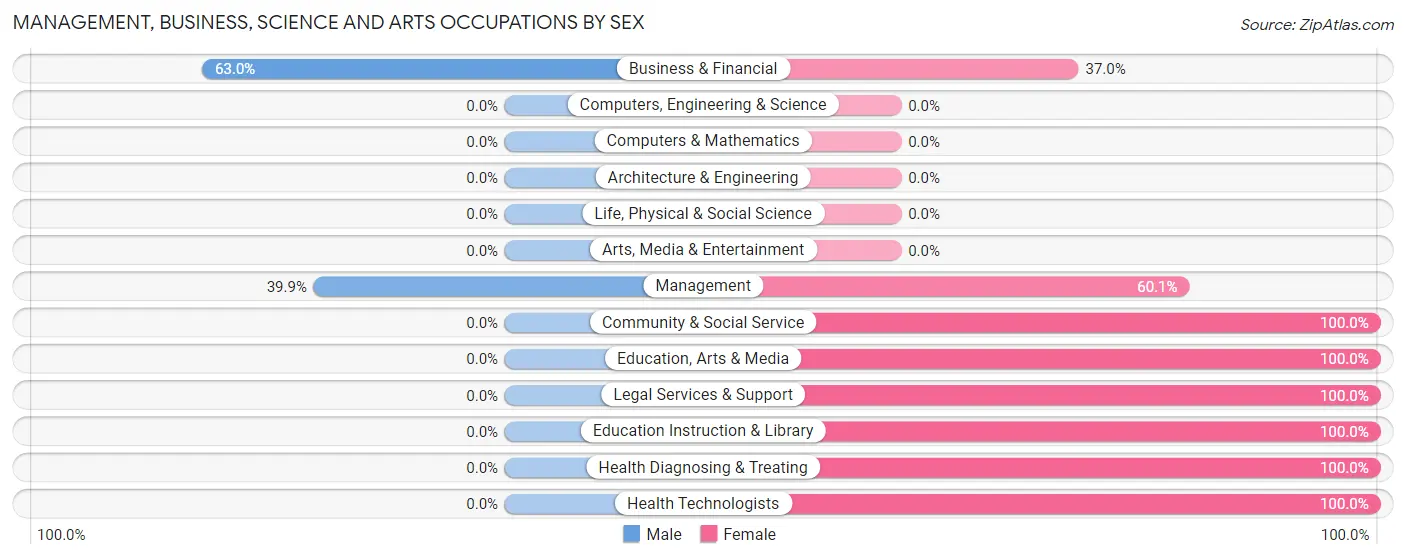
| Occupation | Male | Female |
| Management | 75 (39.9%) | 113 (60.1%) |
| Business & Financial | 63 (63.0%) | 37 (37.0%) |
| Computers, Engineering & Science | 0 (0.0%) | 0 (0.0%) |
| Computers & Mathematics | 0 (0.0%) | 0 (0.0%) |
| Architecture & Engineering | 0 (0.0%) | 0 (0.0%) |
| Life, Physical & Social Science | 0 (0.0%) | 0 (0.0%) |
| Community & Social Service | 0 (0.0%) | 147 (100.0%) |
| Education, Arts & Media | 0 (0.0%) | 33 (100.0%) |
| Legal Services & Support | 0 (0.0%) | 21 (100.0%) |
| Education Instruction & Library | 0 (0.0%) | 93 (100.0%) |
| Arts, Media & Entertainment | 0 (0.0%) | 0 (0.0%) |
| Health Diagnosing & Treating | 0 (0.0%) | 92 (100.0%) |
| Health Technologists | 0 (0.0%) | 92 (100.0%) |
| Total (Category) | 138 (26.2%) | 389 (73.8%) |
| Total (Overall) | 892 (59.0%) | 620 (41.0%) |
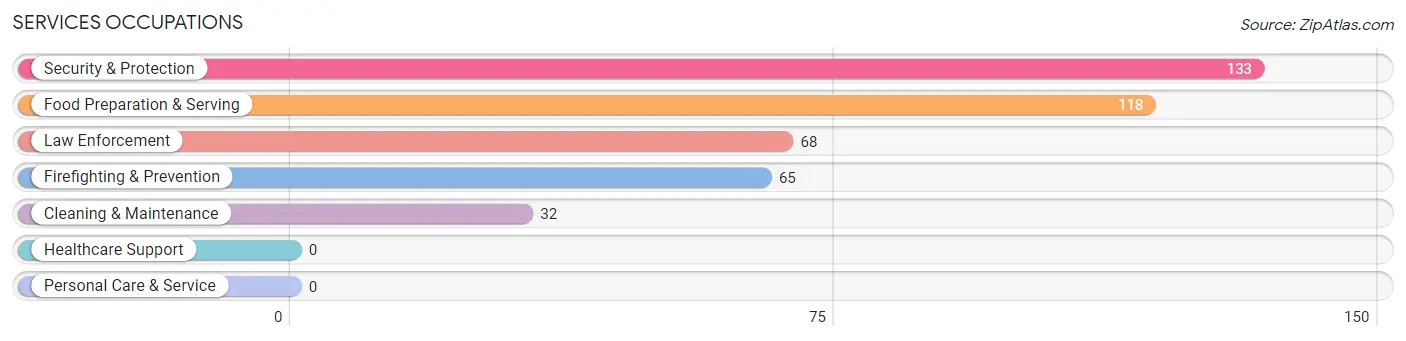
Services Occupations
The most common Services occupations in Umatilla are Security & Protection (133 | 8.8%), Food Preparation & Serving (118 | 7.8%), Law Enforcement (68 | 4.5%), Firefighting & Prevention (65 | 4.3%), and Cleaning & Maintenance (32 | 2.1%).
Services Occupations by Sex
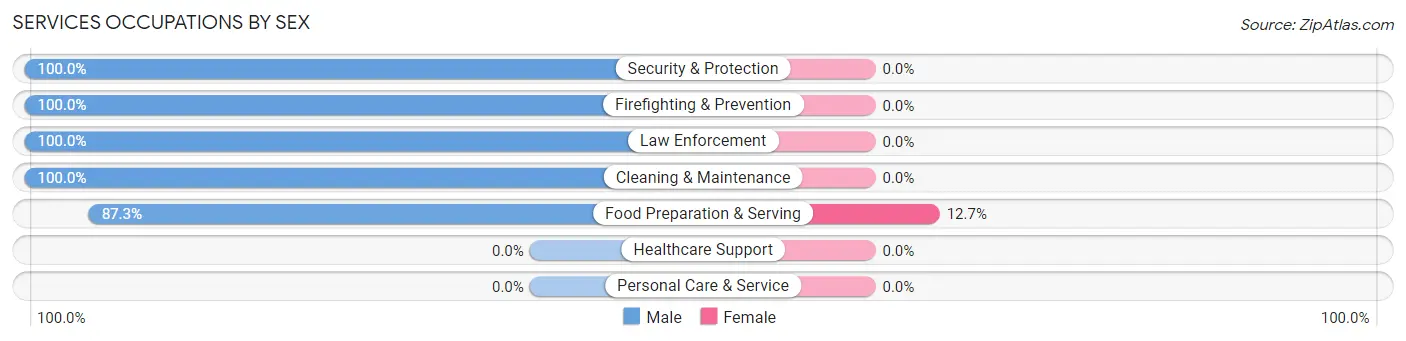
| Occupation | Male | Female |
| Healthcare Support | 0 (0.0%) | 0 (0.0%) |
| Security & Protection | 133 (100.0%) | 0 (0.0%) |
| Firefighting & Prevention | 65 (100.0%) | 0 (0.0%) |
| Law Enforcement | 68 (100.0%) | 0 (0.0%) |
| Food Preparation & Serving | 103 (87.3%) | 15 (12.7%) |
| Cleaning & Maintenance | 32 (100.0%) | 0 (0.0%) |
| Personal Care & Service | 0 (0.0%) | 0 (0.0%) |
| Total (Category) | 268 (94.7%) | 15 (5.3%) |
| Total (Overall) | 892 (59.0%) | 620 (41.0%) |
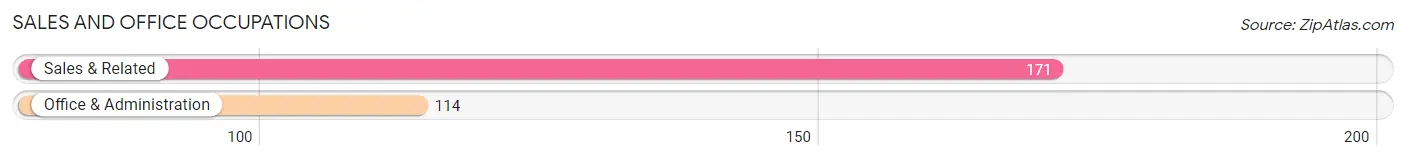
Sales and Office Occupations
The most common Sales and Office occupations in Umatilla are Sales & Related (171 | 11.3%), and Office & Administration (114 | 7.5%).
Sales and Office Occupations by Sex
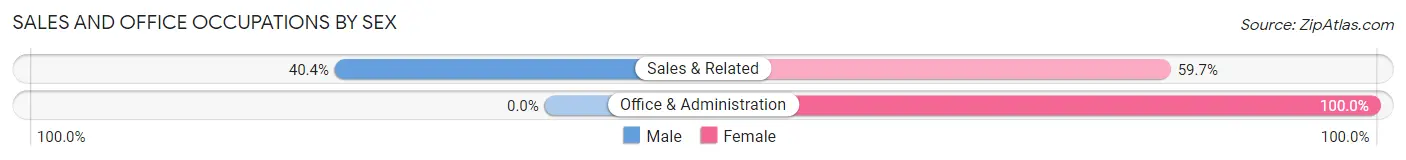
| Occupation | Male | Female |
| Sales & Related | 69 (40.4%) | 102 (59.7%) |
| Office & Administration | 0 (0.0%) | 114 (100.0%) |
| Total (Category) | 69 (24.2%) | 216 (75.8%) |
| Total (Overall) | 892 (59.0%) | 620 (41.0%) |
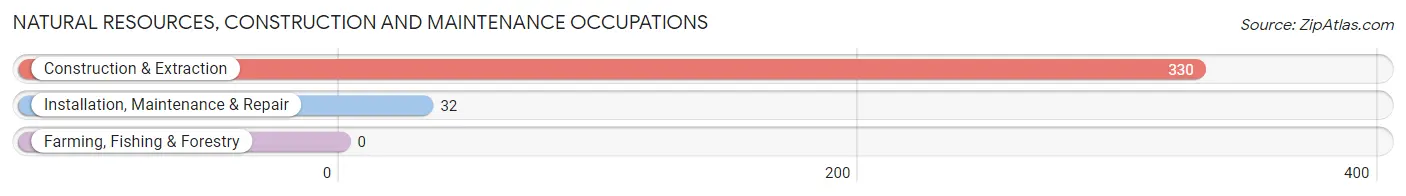
Natural Resources, Construction and Maintenance Occupations
The most common Natural Resources, Construction and Maintenance occupations in Umatilla are Construction & Extraction (330 | 21.8%), and Installation, Maintenance & Repair (32 | 2.1%).
Natural Resources, Construction and Maintenance Occupations by Sex
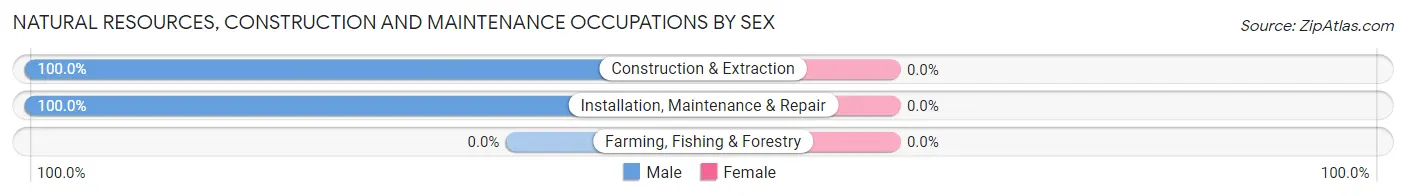
| Occupation | Male | Female |
| Farming, Fishing & Forestry | 0 (0.0%) | 0 (0.0%) |
| Construction & Extraction | 330 (100.0%) | 0 (0.0%) |
| Installation, Maintenance & Repair | 32 (100.0%) | 0 (0.0%) |
| Total (Category) | 362 (100.0%) | 0 (0.0%) |
| Total (Overall) | 892 (59.0%) | 620 (41.0%) |
Production, Transportation and Moving Occupations
The most common Production, Transportation and Moving occupations in Umatilla are Production (34 | 2.2%), and Transportation (21 | 1.4%).
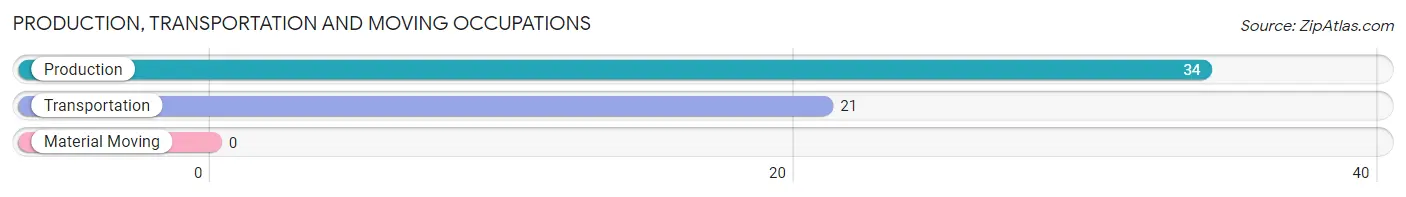
Production, Transportation and Moving Occupations by Sex
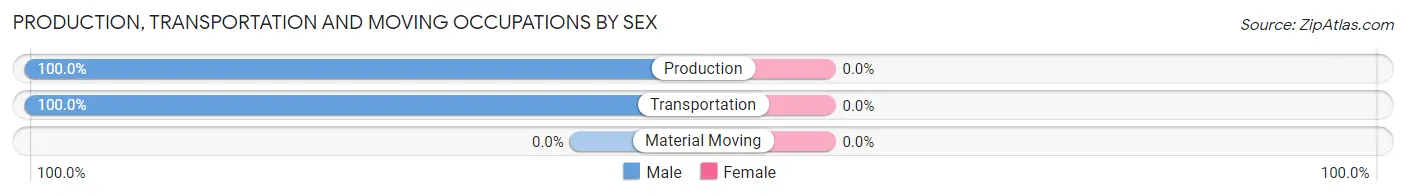
| Occupation | Male | Female |
| Production | 34 (100.0%) | 0 (0.0%) |
| Transportation | 21 (100.0%) | 0 (0.0%) |
| Material Moving | 0 (0.0%) | 0 (0.0%) |
| Total (Category) | 55 (100.0%) | 0 (0.0%) |
| Total (Overall) | 892 (59.0%) | 620 (41.0%) |
Employment Industries by Sex in Umatilla
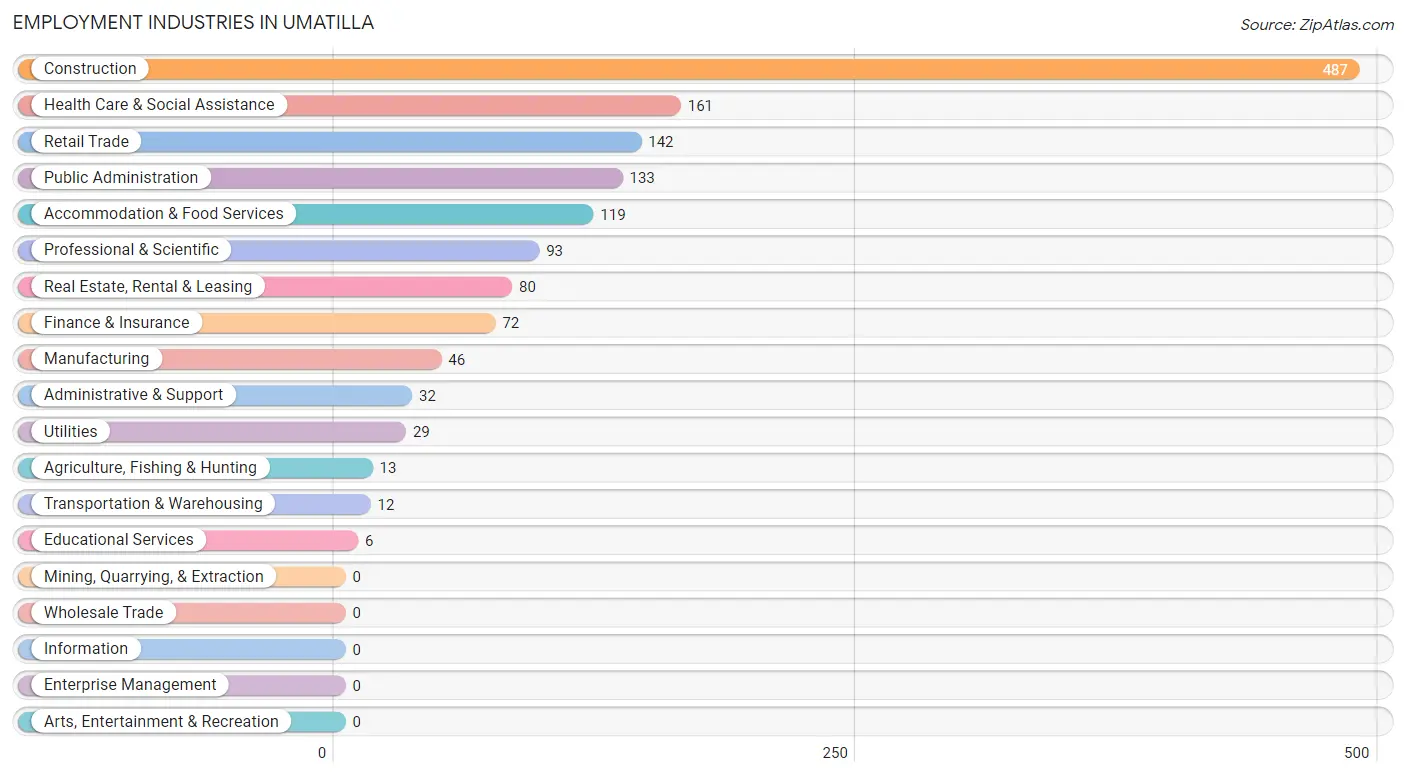
Employment Industries in Umatilla
The major employment industries in Umatilla include Construction (487 | 32.2%), Health Care & Social Assistance (161 | 10.6%), Retail Trade (142 | 9.4%), Public Administration (133 | 8.8%), and Accommodation & Food Services (119 | 7.9%).
Employment Industries by Sex in Umatilla
The Umatilla industries that see more men than women are Agriculture, Fishing & Hunting (100.0%), Transportation & Warehousing (100.0%), and Utilities (100.0%), whereas the industries that tend to have a higher number of women are Real Estate, Rental & Leasing (100.0%), Educational Services (100.0%), and Health Care & Social Assistance (100.0%).
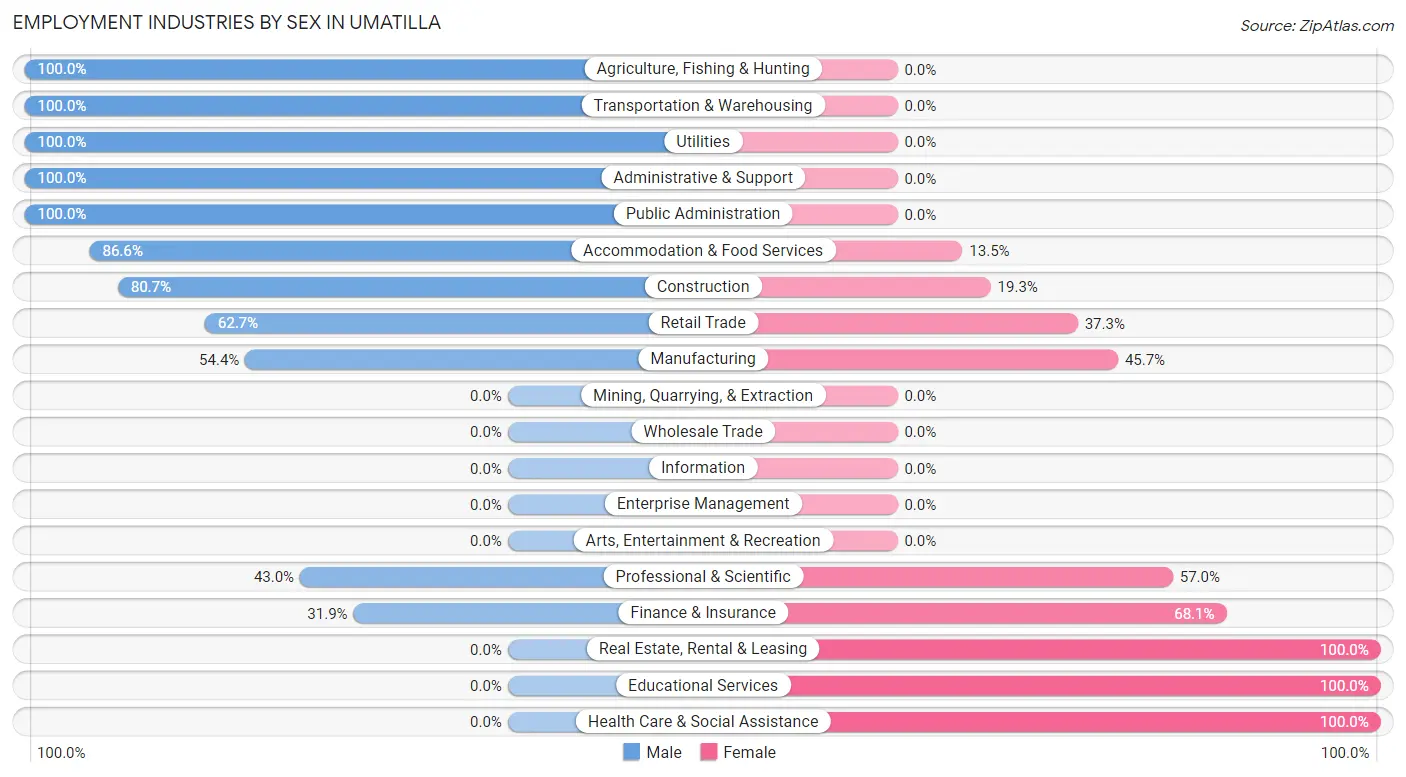
| Industry | Male | Female |
| Agriculture, Fishing & Hunting | 13 (100.0%) | 0 (0.0%) |
| Mining, Quarrying, & Extraction | 0 (0.0%) | 0 (0.0%) |
| Construction | 393 (80.7%) | 94 (19.3%) |
| Manufacturing | 25 (54.3%) | 21 (45.7%) |
| Wholesale Trade | 0 (0.0%) | 0 (0.0%) |
| Retail Trade | 89 (62.7%) | 53 (37.3%) |
| Transportation & Warehousing | 12 (100.0%) | 0 (0.0%) |
| Utilities | 29 (100.0%) | 0 (0.0%) |
| Information | 0 (0.0%) | 0 (0.0%) |
| Finance & Insurance | 23 (31.9%) | 49 (68.1%) |
| Real Estate, Rental & Leasing | 0 (0.0%) | 80 (100.0%) |
| Professional & Scientific | 40 (43.0%) | 53 (57.0%) |
| Enterprise Management | 0 (0.0%) | 0 (0.0%) |
| Administrative & Support | 32 (100.0%) | 0 (0.0%) |
| Educational Services | 0 (0.0%) | 6 (100.0%) |
| Health Care & Social Assistance | 0 (0.0%) | 161 (100.0%) |
| Arts, Entertainment & Recreation | 0 (0.0%) | 0 (0.0%) |
| Accommodation & Food Services | 103 (86.6%) | 16 (13.5%) |
| Public Administration | 133 (100.0%) | 0 (0.0%) |
| Total | 892 (59.0%) | 620 (41.0%) |
Education in Umatilla
School Enrollment in Umatilla
The most common levels of schooling among the 371 students in Umatilla are high school (148 | 39.9%), college / undergraduate (89 | 24.0%), and graduate / professional (43 | 11.6%).
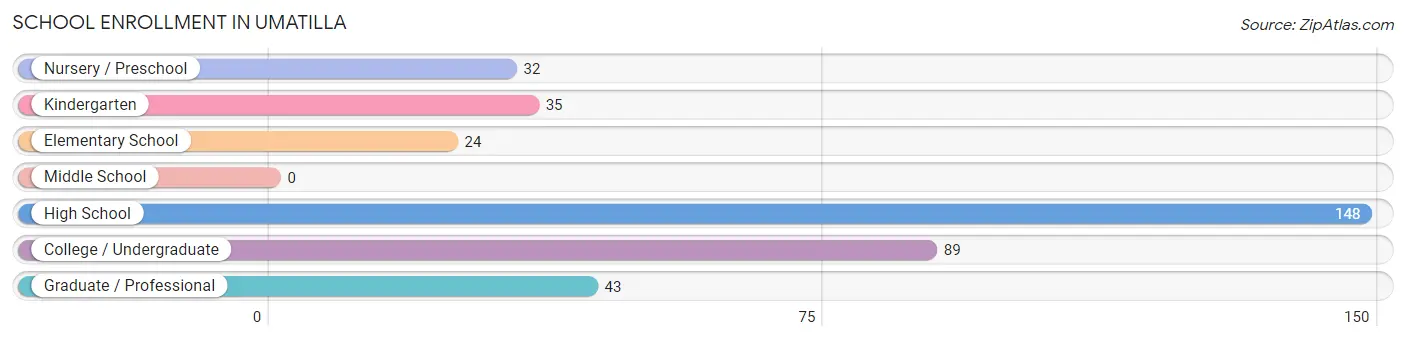
| School Level | # Students | % Students |
| Nursery / Preschool | 32 | 8.6% |
| Kindergarten | 35 | 9.4% |
| Elementary School | 24 | 6.5% |
| Middle School | 0 | 0.0% |
| High School | 148 | 39.9% |
| College / Undergraduate | 89 | 24.0% |
| Graduate / Professional | 43 | 11.6% |
| Total | 371 | 100.0% |
School Enrollment by Age by Funding Source in Umatilla
Out of a total of 371 students who are enrolled in schools in Umatilla, 33 (8.9%) attend a private institution, while the remaining 338 (91.1%) are enrolled in public schools. The age group of 35 years and over has the highest likelihood of being enrolled in private schools, with 33 (76.7% in the age bracket) enrolled. Conversely, the age group of 3 to 4 year olds has the lowest likelihood of being enrolled in a private school, with 32 (100.0% in the age bracket) attending a public institution.
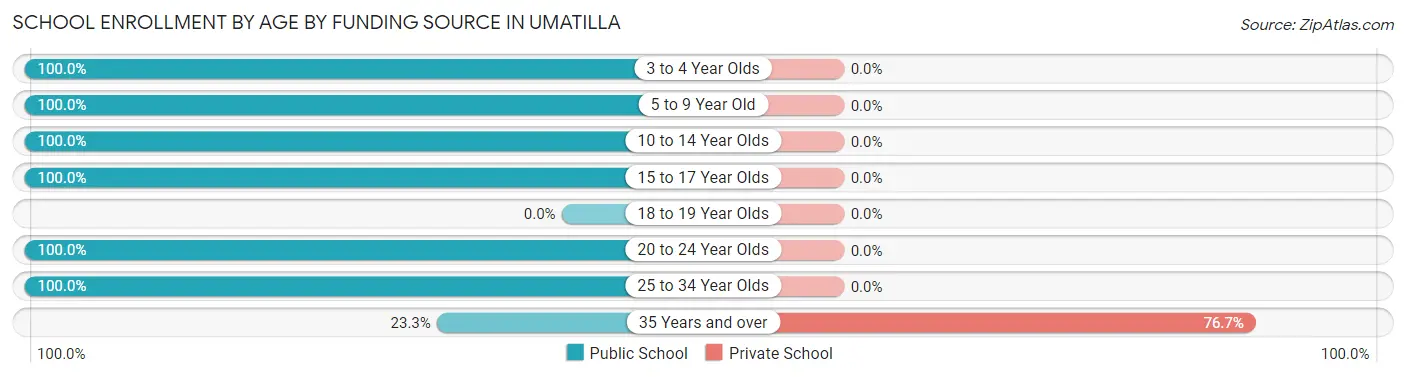
| Age Bracket | Public School | Private School |
| 3 to 4 Year Olds | 32 (100.0%) | 0 (0.0%) |
| 5 to 9 Year Old | 59 (100.0%) | 0 (0.0%) |
| 10 to 14 Year Olds | 84 (100.0%) | 0 (0.0%) |
| 15 to 17 Year Olds | 64 (100.0%) | 0 (0.0%) |
| 18 to 19 Year Olds | 0 (0.0%) | 0 (0.0%) |
| 20 to 24 Year Olds | 21 (100.0%) | 0 (0.0%) |
| 25 to 34 Year Olds | 68 (100.0%) | 0 (0.0%) |
| 35 Years and over | 10 (23.3%) | 33 (76.7%) |
| Total | 338 (91.1%) | 33 (8.9%) |
Educational Attainment by Field of Study in Umatilla
Education (202 | 29.4%), business (130 | 18.9%), arts & humanities (98 | 14.3%), engineering (90 | 13.1%), and science & technology (43 | 6.3%) are the most common fields of study among 687 individuals in Umatilla who have obtained a bachelor's degree or higher.
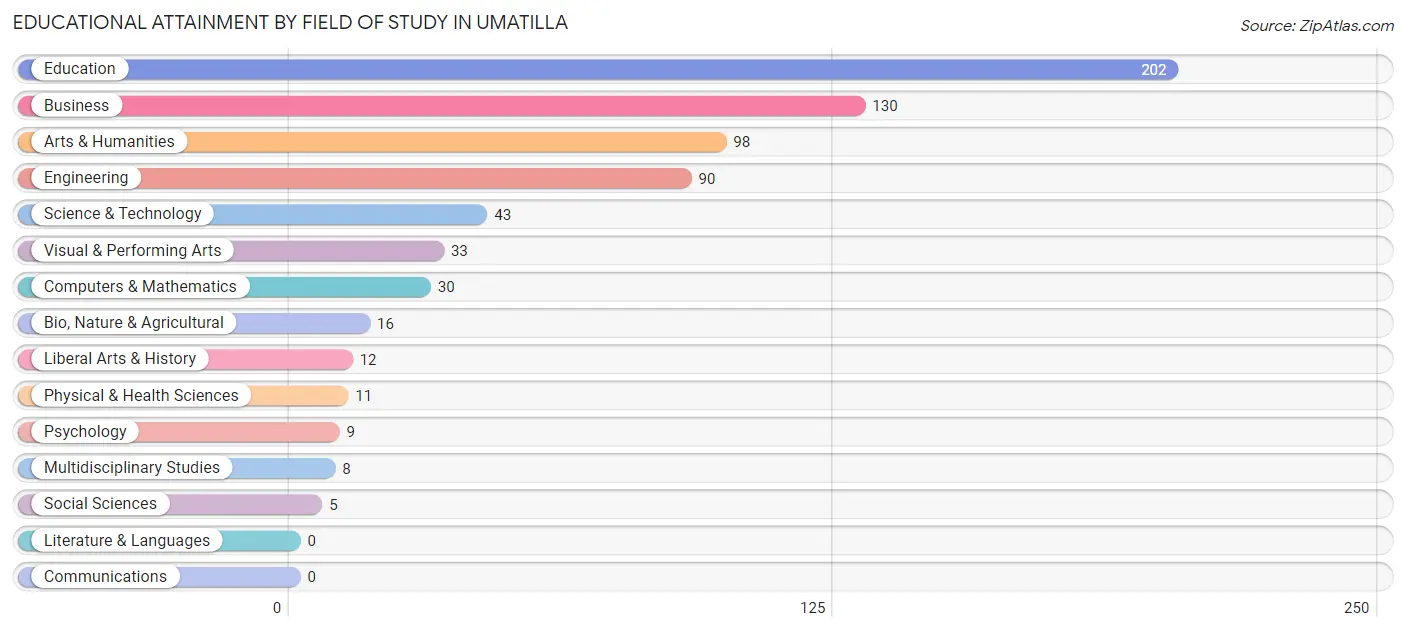
| Field of Study | # Graduates | % Graduates |
| Computers & Mathematics | 30 | 4.4% |
| Bio, Nature & Agricultural | 16 | 2.3% |
| Physical & Health Sciences | 11 | 1.6% |
| Psychology | 9 | 1.3% |
| Social Sciences | 5 | 0.7% |
| Engineering | 90 | 13.1% |
| Multidisciplinary Studies | 8 | 1.2% |
| Science & Technology | 43 | 6.3% |
| Business | 130 | 18.9% |
| Education | 202 | 29.4% |
| Literature & Languages | 0 | 0.0% |
| Liberal Arts & History | 12 | 1.8% |
| Visual & Performing Arts | 33 | 4.8% |
| Communications | 0 | 0.0% |
| Arts & Humanities | 98 | 14.3% |
| Total | 687 | 100.0% |
Transportation & Commute in Umatilla
Vehicle Availability by Sex in Umatilla
The most prevalent vehicle ownership categories in Umatilla are males with 2 vehicles (244, accounting for 27.4%) and females with 2 vehicles (229, making up 39.4%).
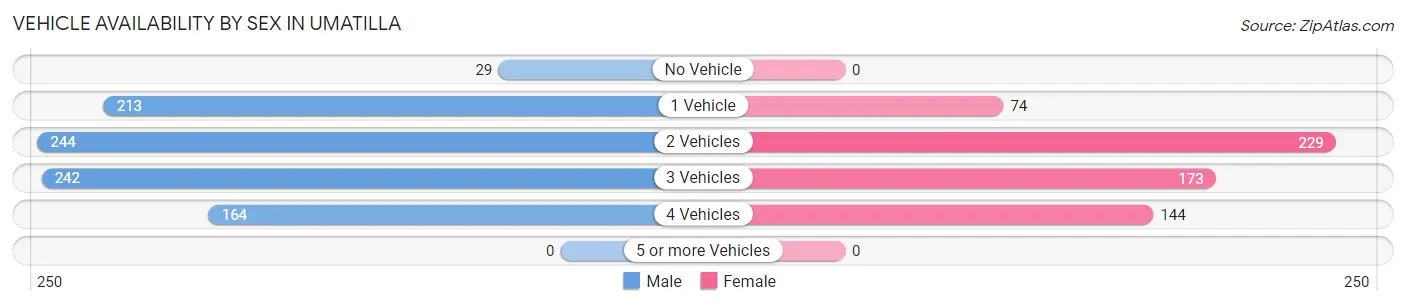
| Vehicles Available | Male | Female |
| No Vehicle | 29 (3.3%) | 0 (0.0%) |
| 1 Vehicle | 213 (23.9%) | 74 (11.9%) |
| 2 Vehicles | 244 (27.4%) | 229 (36.9%) |
| 3 Vehicles | 242 (27.1%) | 173 (27.9%) |
| 4 Vehicles | 164 (18.4%) | 144 (23.2%) |
| 5 or more Vehicles | 0 (0.0%) | 0 (0.0%) |
| Total | 892 (100.0%) | 620 (100.0%) |
Commute Time in Umatilla
The most frequently occuring commute durations in Umatilla are 20 to 24 minutes (279 commuters, 21.3%), 90 or more minutes (209 commuters, 16.0%), and 15 to 19 minutes (191 commuters, 14.6%).
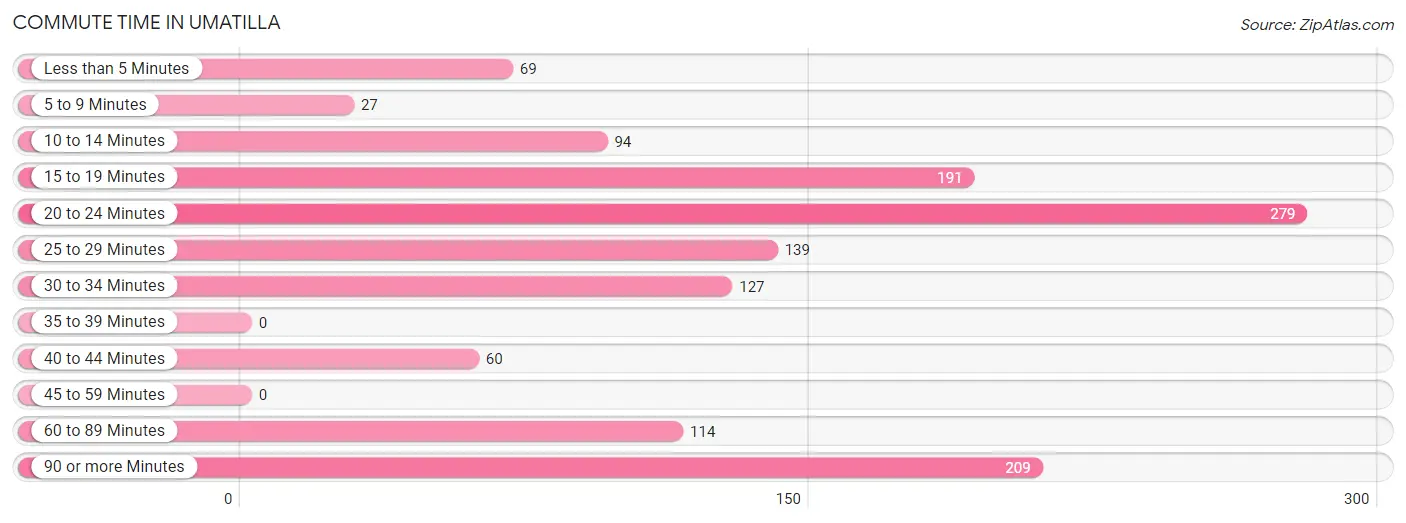
| Commute Time | # Commuters | % Commuters |
| Less than 5 Minutes | 69 | 5.3% |
| 5 to 9 Minutes | 27 | 2.1% |
| 10 to 14 Minutes | 94 | 7.2% |
| 15 to 19 Minutes | 191 | 14.6% |
| 20 to 24 Minutes | 279 | 21.3% |
| 25 to 29 Minutes | 139 | 10.6% |
| 30 to 34 Minutes | 127 | 9.7% |
| 35 to 39 Minutes | 0 | 0.0% |
| 40 to 44 Minutes | 60 | 4.6% |
| 45 to 59 Minutes | 0 | 0.0% |
| 60 to 89 Minutes | 114 | 8.7% |
| 90 or more Minutes | 209 | 16.0% |
Commute Time by Sex in Umatilla
The most common commute times in Umatilla are 15 to 19 minutes (191 commuters, 24.1%) for males and 20 to 24 minutes (242 commuters, 46.8%) for females.
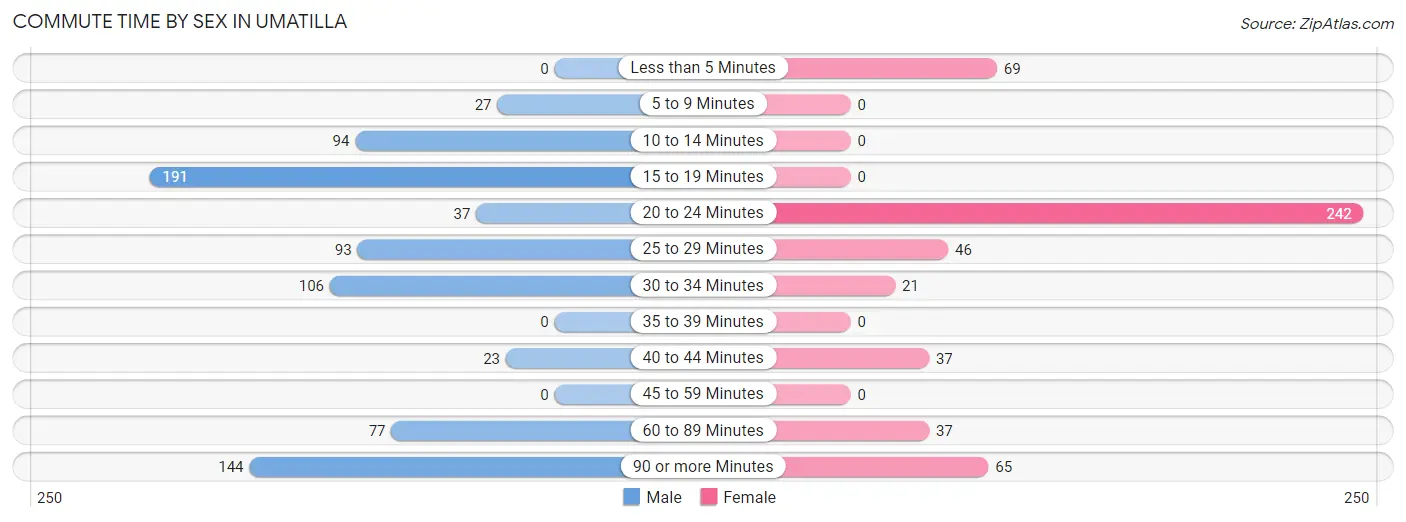
| Commute Time | Male | Female |
| Less than 5 Minutes | 0 (0.0%) | 69 (13.4%) |
| 5 to 9 Minutes | 27 (3.4%) | 0 (0.0%) |
| 10 to 14 Minutes | 94 (11.9%) | 0 (0.0%) |
| 15 to 19 Minutes | 191 (24.1%) | 0 (0.0%) |
| 20 to 24 Minutes | 37 (4.7%) | 242 (46.8%) |
| 25 to 29 Minutes | 93 (11.7%) | 46 (8.9%) |
| 30 to 34 Minutes | 106 (13.4%) | 21 (4.1%) |
| 35 to 39 Minutes | 0 (0.0%) | 0 (0.0%) |
| 40 to 44 Minutes | 23 (2.9%) | 37 (7.2%) |
| 45 to 59 Minutes | 0 (0.0%) | 0 (0.0%) |
| 60 to 89 Minutes | 77 (9.7%) | 37 (7.2%) |
| 90 or more Minutes | 144 (18.2%) | 65 (12.6%) |
Time of Departure to Work by Sex in Umatilla
The most frequent times of departure to work in Umatilla are 8:00 AM to 8:29 AM (185, 23.4%) for males and 7:00 AM to 7:29 AM (197, 38.1%) for females.
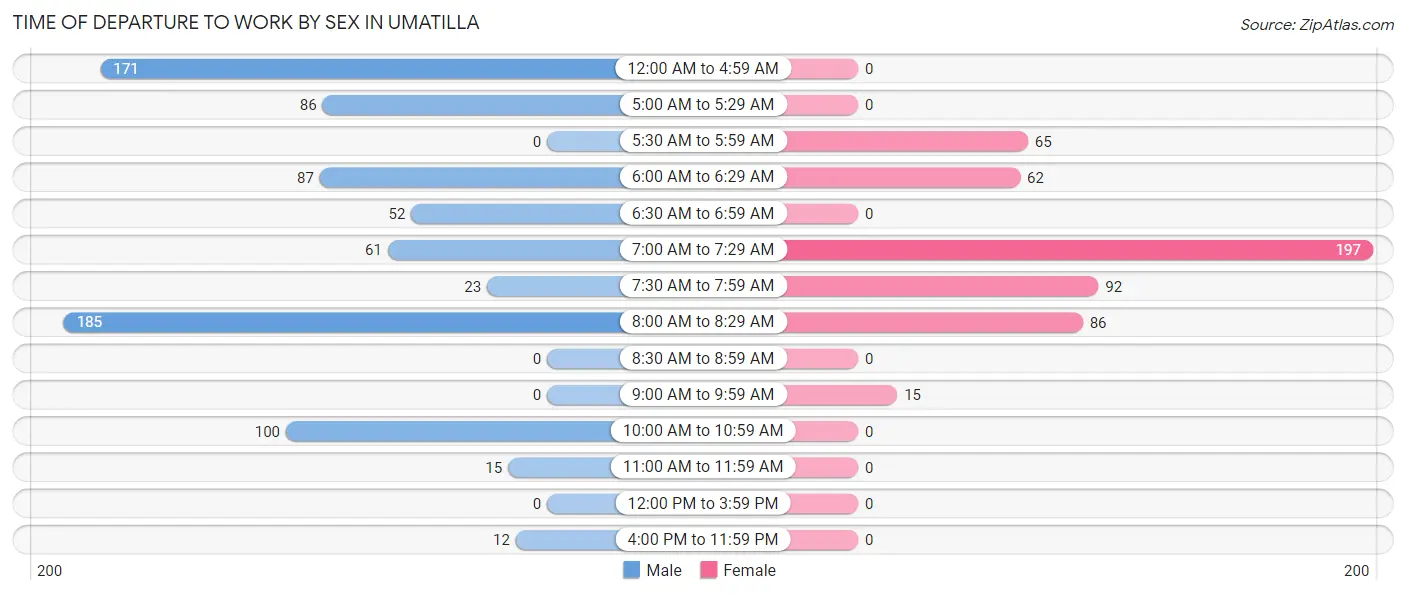
| Time of Departure | Male | Female |
| 12:00 AM to 4:59 AM | 171 (21.6%) | 0 (0.0%) |
| 5:00 AM to 5:29 AM | 86 (10.9%) | 0 (0.0%) |
| 5:30 AM to 5:59 AM | 0 (0.0%) | 65 (12.6%) |
| 6:00 AM to 6:29 AM | 87 (11.0%) | 62 (12.0%) |
| 6:30 AM to 6:59 AM | 52 (6.6%) | 0 (0.0%) |
| 7:00 AM to 7:29 AM | 61 (7.7%) | 197 (38.1%) |
| 7:30 AM to 7:59 AM | 23 (2.9%) | 92 (17.8%) |
| 8:00 AM to 8:29 AM | 185 (23.4%) | 86 (16.6%) |
| 8:30 AM to 8:59 AM | 0 (0.0%) | 0 (0.0%) |
| 9:00 AM to 9:59 AM | 0 (0.0%) | 15 (2.9%) |
| 10:00 AM to 10:59 AM | 100 (12.6%) | 0 (0.0%) |
| 11:00 AM to 11:59 AM | 15 (1.9%) | 0 (0.0%) |
| 12:00 PM to 3:59 PM | 0 (0.0%) | 0 (0.0%) |
| 4:00 PM to 11:59 PM | 12 (1.5%) | 0 (0.0%) |
| Total | 792 (100.0%) | 517 (100.0%) |
Housing Occupancy in Umatilla
Occupancy by Ownership in Umatilla
Of the total 1,935 dwellings in Umatilla, owner-occupied units account for 1,306 (67.5%), while renter-occupied units make up 629 (32.5%).
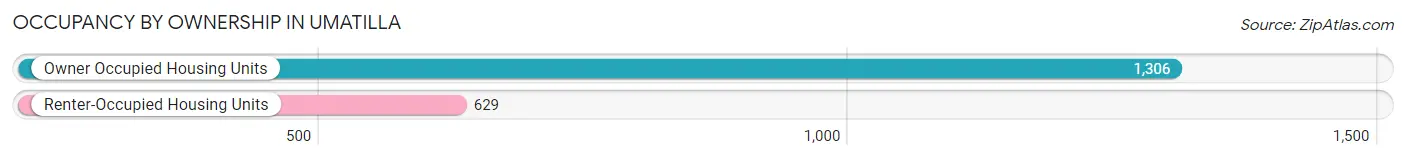
| Occupancy | # Housing Units | % Housing Units |
| Owner Occupied Housing Units | 1,306 | 67.5% |
| Renter-Occupied Housing Units | 629 | 32.5% |
| Total Occupied Housing Units | 1,935 | 100.0% |
Occupancy by Household Size in Umatilla
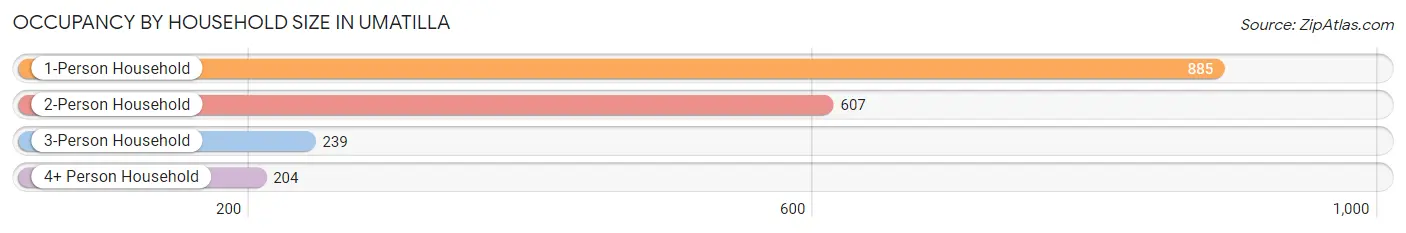
| Household Size | # Housing Units | % Housing Units |
| 1-Person Household | 885 | 45.7% |
| 2-Person Household | 607 | 31.4% |
| 3-Person Household | 239 | 12.3% |
| 4+ Person Household | 204 | 10.5% |
| Total Housing Units | 1,935 | 100.0% |
Occupancy by Ownership by Household Size in Umatilla
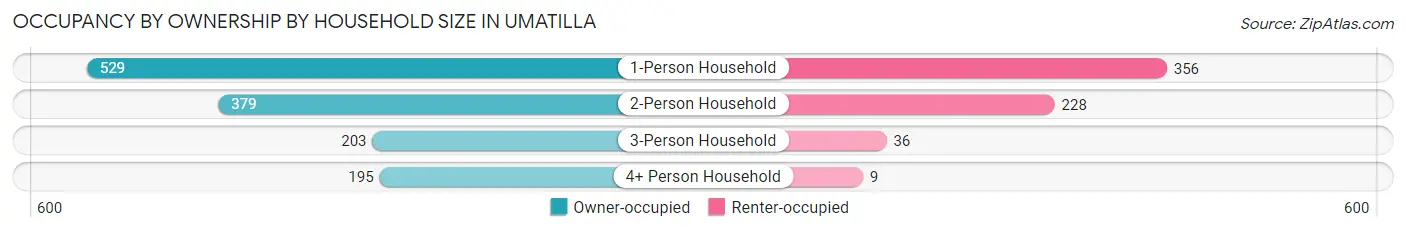
| Household Size | Owner-occupied | Renter-occupied |
| 1-Person Household | 529 (59.8%) | 356 (40.2%) |
| 2-Person Household | 379 (62.4%) | 228 (37.6%) |
| 3-Person Household | 203 (84.9%) | 36 (15.1%) |
| 4+ Person Household | 195 (95.6%) | 9 (4.4%) |
| Total Housing Units | 1,306 (67.5%) | 629 (32.5%) |
Occupancy by Educational Attainment in Umatilla
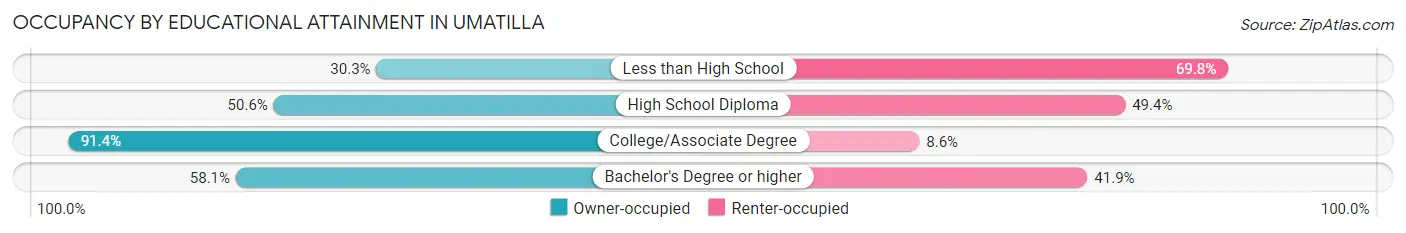
| Household Size | Owner-occupied | Renter-occupied |
| Less than High School | 36 (30.2%) | 83 (69.8%) |
| High School Diploma | 286 (50.6%) | 279 (49.4%) |
| College/Associate Degree | 705 (91.4%) | 66 (8.6%) |
| Bachelor's Degree or higher | 279 (58.1%) | 201 (41.9%) |
Occupancy by Age of Householder in Umatilla
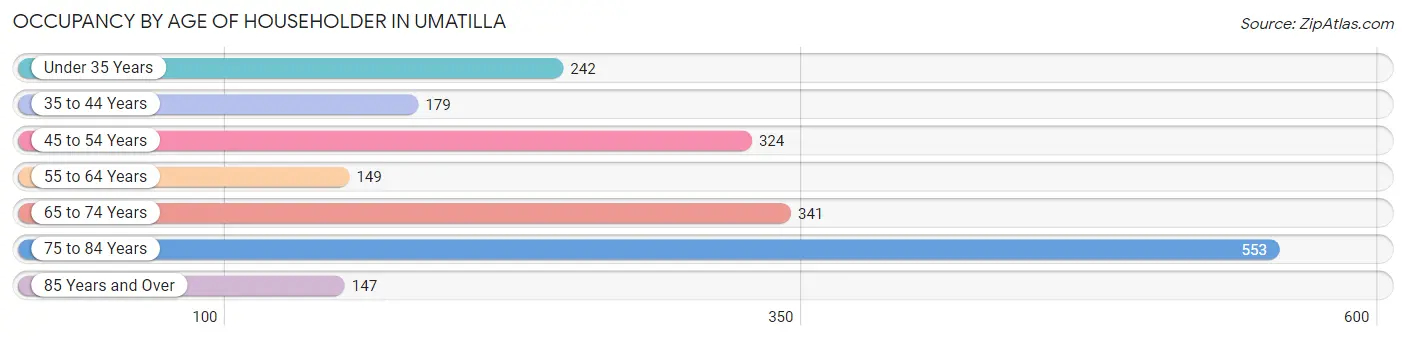
| Age Bracket | # Households | % Households |
| Under 35 Years | 242 | 12.5% |
| 35 to 44 Years | 179 | 9.2% |
| 45 to 54 Years | 324 | 16.7% |
| 55 to 64 Years | 149 | 7.7% |
| 65 to 74 Years | 341 | 17.6% |
| 75 to 84 Years | 553 | 28.6% |
| 85 Years and Over | 147 | 7.6% |
| Total | 1,935 | 100.0% |
Housing Finances in Umatilla
Median Income by Occupancy in Umatilla
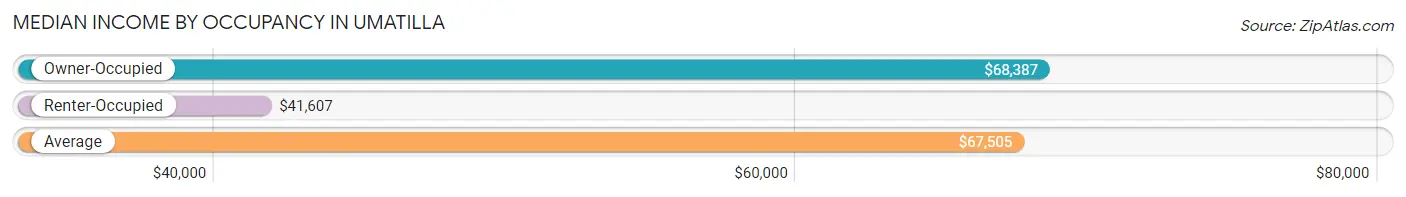
| Occupancy Type | # Households | Median Income |
| Owner-Occupied | 1,306 (67.5%) | $68,387 |
| Renter-Occupied | 629 (32.5%) | $41,607 |
| Average | 1,935 (100.0%) | $67,505 |
Occupancy by Householder Income Bracket in Umatilla
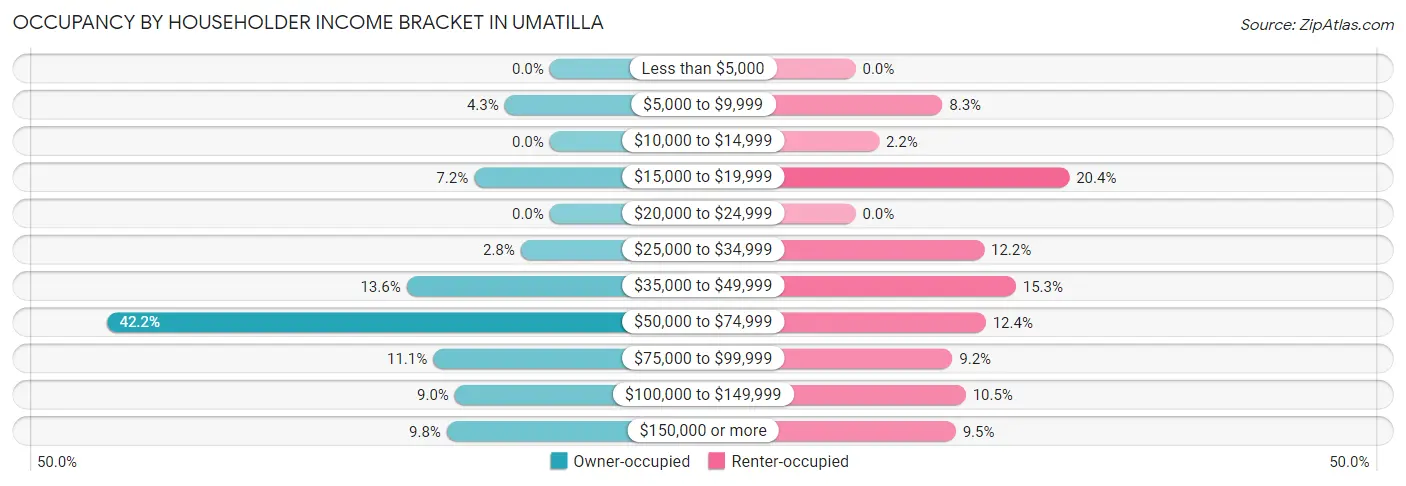
| Income Bracket | Owner-occupied | Renter-occupied |
| Less than $5,000 | 0 (0.0%) | 0 (0.0%) |
| $5,000 to $9,999 | 56 (4.3%) | 52 (8.3%) |
| $10,000 to $14,999 | 0 (0.0%) | 14 (2.2%) |
| $15,000 to $19,999 | 94 (7.2%) | 128 (20.3%) |
| $20,000 to $24,999 | 0 (0.0%) | 0 (0.0%) |
| $25,000 to $34,999 | 36 (2.8%) | 77 (12.2%) |
| $35,000 to $49,999 | 178 (13.6%) | 96 (15.3%) |
| $50,000 to $74,999 | 551 (42.2%) | 78 (12.4%) |
| $75,000 to $99,999 | 145 (11.1%) | 58 (9.2%) |
| $100,000 to $149,999 | 118 (9.0%) | 66 (10.5%) |
| $150,000 or more | 128 (9.8%) | 60 (9.5%) |
| Total | 1,306 (100.0%) | 629 (100.0%) |
Monthly Housing Cost Tiers in Umatilla
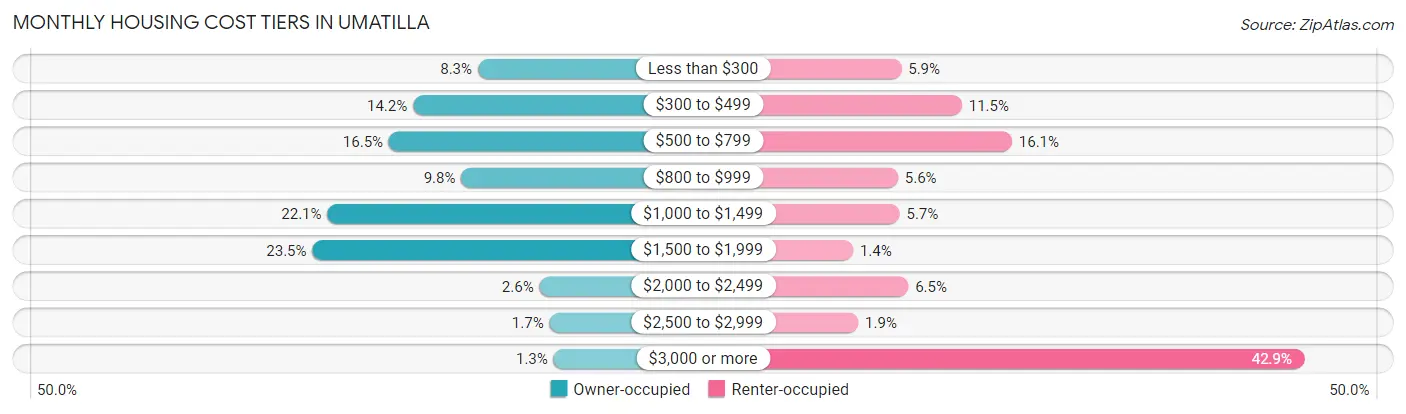
| Monthly Cost | Owner-occupied | Renter-occupied |
| Less than $300 | 108 (8.3%) | 37 (5.9%) |
| $300 to $499 | 186 (14.2%) | 72 (11.5%) |
| $500 to $799 | 215 (16.5%) | 101 (16.1%) |
| $800 to $999 | 128 (9.8%) | 35 (5.6%) |
| $1,000 to $1,499 | 289 (22.1%) | 36 (5.7%) |
| $1,500 to $1,999 | 307 (23.5%) | 9 (1.4%) |
| $2,000 to $2,499 | 34 (2.6%) | 41 (6.5%) |
| $2,500 to $2,999 | 22 (1.7%) | 12 (1.9%) |
| $3,000 or more | 17 (1.3%) | 270 (42.9%) |
| Total | 1,306 (100.0%) | 629 (100.0%) |
Physical Housing Characteristics in Umatilla
Housing Structures in Umatilla
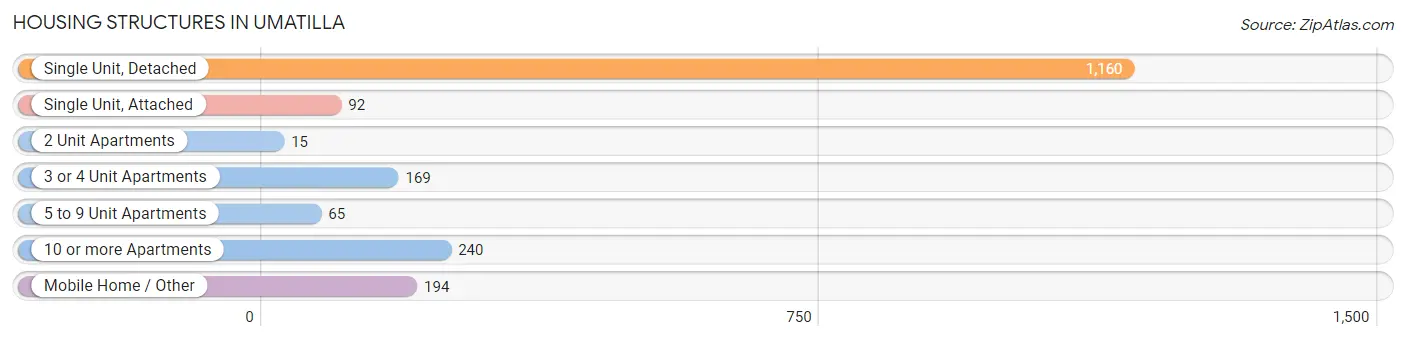
| Structure Type | # Housing Units | % Housing Units |
| Single Unit, Detached | 1,160 | 60.0% |
| Single Unit, Attached | 92 | 4.8% |
| 2 Unit Apartments | 15 | 0.8% |
| 3 or 4 Unit Apartments | 169 | 8.7% |
| 5 to 9 Unit Apartments | 65 | 3.4% |
| 10 or more Apartments | 240 | 12.4% |
| Mobile Home / Other | 194 | 10.0% |
| Total | 1,935 | 100.0% |
Housing Structures by Occupancy in Umatilla
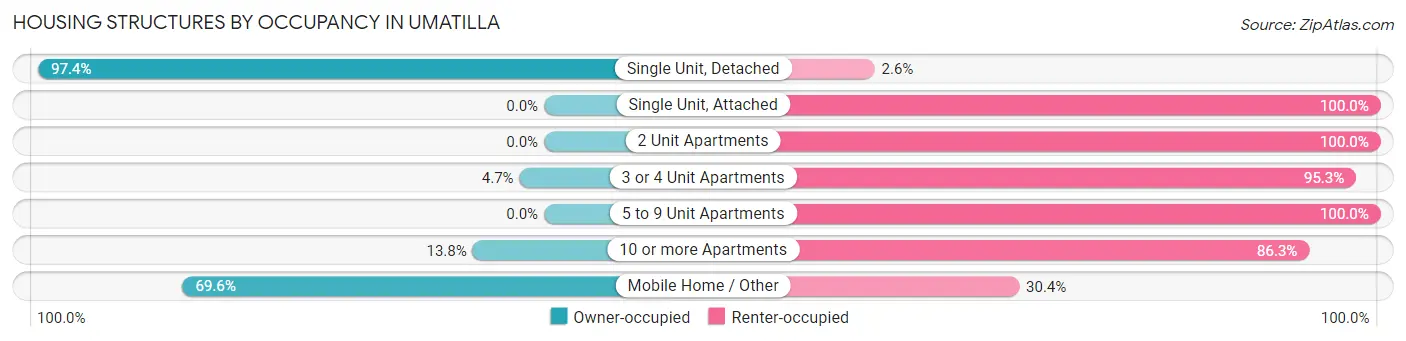
| Structure Type | Owner-occupied | Renter-occupied |
| Single Unit, Detached | 1,130 (97.4%) | 30 (2.6%) |
| Single Unit, Attached | 0 (0.0%) | 92 (100.0%) |
| 2 Unit Apartments | 0 (0.0%) | 15 (100.0%) |
| 3 or 4 Unit Apartments | 8 (4.7%) | 161 (95.3%) |
| 5 to 9 Unit Apartments | 0 (0.0%) | 65 (100.0%) |
| 10 or more Apartments | 33 (13.8%) | 207 (86.3%) |
| Mobile Home / Other | 135 (69.6%) | 59 (30.4%) |
| Total | 1,306 (67.5%) | 629 (32.5%) |
Housing Structures by Number of Rooms in Umatilla
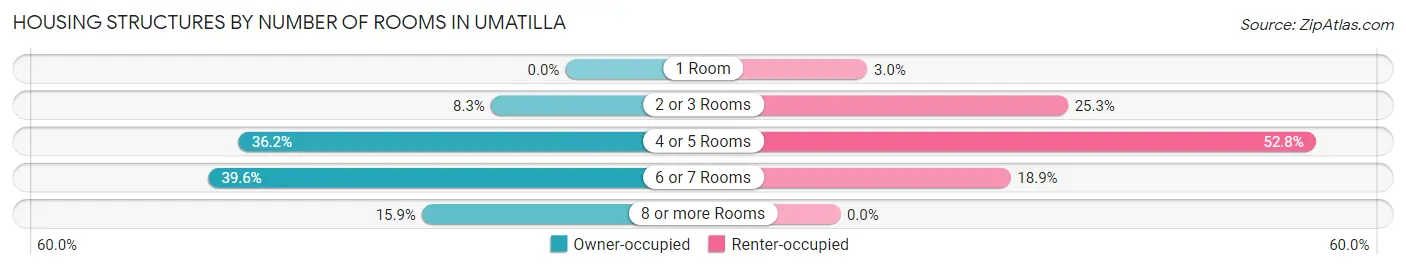
| Number of Rooms | Owner-occupied | Renter-occupied |
| 1 Room | 0 (0.0%) | 19 (3.0%) |
| 2 or 3 Rooms | 108 (8.3%) | 159 (25.3%) |
| 4 or 5 Rooms | 473 (36.2%) | 332 (52.8%) |
| 6 or 7 Rooms | 517 (39.6%) | 119 (18.9%) |
| 8 or more Rooms | 208 (15.9%) | 0 (0.0%) |
| Total | 1,306 (100.0%) | 629 (100.0%) |
Housing Structure by Heating Type in Umatilla
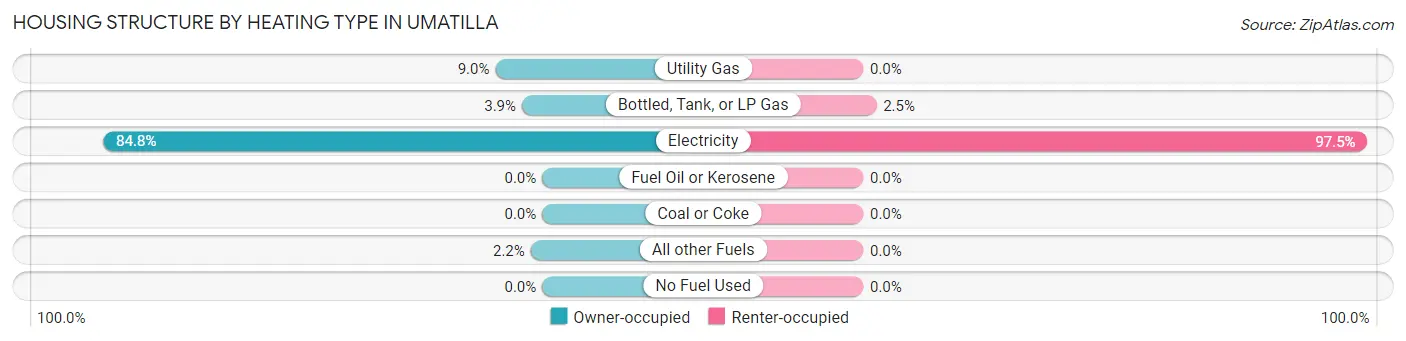
| Heating Type | Owner-occupied | Renter-occupied |
| Utility Gas | 118 (9.0%) | 0 (0.0%) |
| Bottled, Tank, or LP Gas | 51 (3.9%) | 16 (2.5%) |
| Electricity | 1,108 (84.8%) | 613 (97.5%) |
| Fuel Oil or Kerosene | 0 (0.0%) | 0 (0.0%) |
| Coal or Coke | 0 (0.0%) | 0 (0.0%) |
| All other Fuels | 29 (2.2%) | 0 (0.0%) |
| No Fuel Used | 0 (0.0%) | 0 (0.0%) |
| Total | 1,306 (100.0%) | 629 (100.0%) |
Household Vehicle Usage in Umatilla
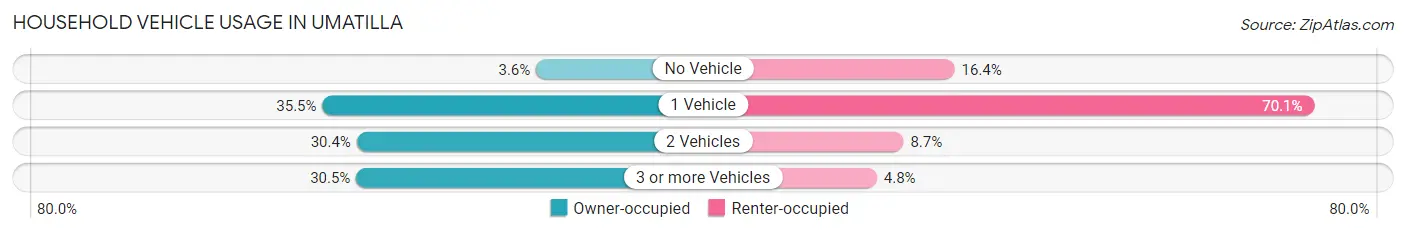
| Vehicles per Household | Owner-occupied | Renter-occupied |
| No Vehicle | 47 (3.6%) | 103 (16.4%) |
| 1 Vehicle | 464 (35.5%) | 441 (70.1%) |
| 2 Vehicles | 397 (30.4%) | 55 (8.7%) |
| 3 or more Vehicles | 398 (30.5%) | 30 (4.8%) |
| Total | 1,306 (100.0%) | 629 (100.0%) |
Real Estate & Mortgages in Umatilla
Real Estate and Mortgage Overview in Umatilla
| Characteristic | Without Mortgage | With Mortgage |
| Housing Units | 454 | 852 |
| Median Property Value | $157,100 | $231,100 |
| Median Household Income | $44,509 | $110 |
| Monthly Housing Costs | $457 | $0 |
| Real Estate Taxes | $1,415 | $0 |
Property Value by Mortgage Status in Umatilla
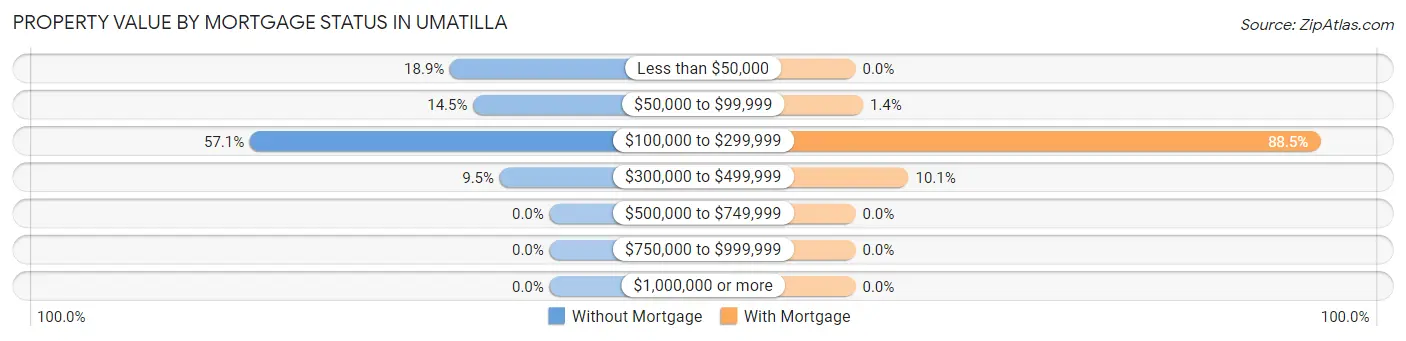
| Property Value | Without Mortgage | With Mortgage |
| Less than $50,000 | 86 (18.9%) | 0 (0.0%) |
| $50,000 to $99,999 | 66 (14.5%) | 12 (1.4%) |
| $100,000 to $299,999 | 259 (57.1%) | 754 (88.5%) |
| $300,000 to $499,999 | 43 (9.5%) | 86 (10.1%) |
| $500,000 to $749,999 | 0 (0.0%) | 0 (0.0%) |
| $750,000 to $999,999 | 0 (0.0%) | 0 (0.0%) |
| $1,000,000 or more | 0 (0.0%) | 0 (0.0%) |
| Total | 454 (100.0%) | 852 (100.0%) |
Household Income by Mortgage Status in Umatilla
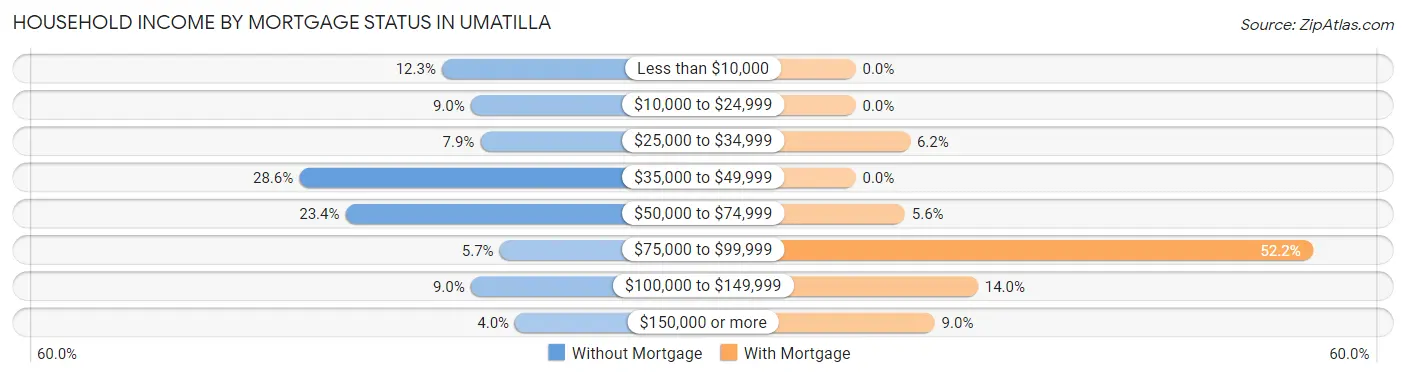
| Household Income | Without Mortgage | With Mortgage |
| Less than $10,000 | 56 (12.3%) | 0 (0.0%) |
| $10,000 to $24,999 | 41 (9.0%) | 0 (0.0%) |
| $25,000 to $34,999 | 36 (7.9%) | 53 (6.2%) |
| $35,000 to $49,999 | 130 (28.6%) | 0 (0.0%) |
| $50,000 to $74,999 | 106 (23.4%) | 48 (5.6%) |
| $75,000 to $99,999 | 26 (5.7%) | 445 (52.2%) |
| $100,000 to $149,999 | 41 (9.0%) | 119 (14.0%) |
| $150,000 or more | 18 (4.0%) | 77 (9.0%) |
| Total | 454 (100.0%) | 852 (100.0%) |
Property Value to Household Income Ratio in Umatilla
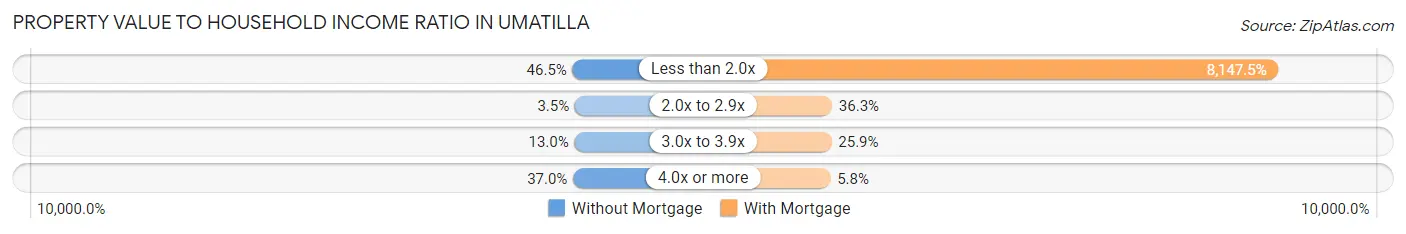
| Value-to-Income Ratio | Without Mortgage | With Mortgage |
| Less than 2.0x | 211 (46.5%) | 69,417 (8,147.5%) |
| 2.0x to 2.9x | 16 (3.5%) | 309 (36.3%) |
| 3.0x to 3.9x | 59 (13.0%) | 221 (25.9%) |
| 4.0x or more | 168 (37.0%) | 49 (5.8%) |
| Total | 454 (100.0%) | 852 (100.0%) |
Real Estate Taxes by Mortgage Status in Umatilla
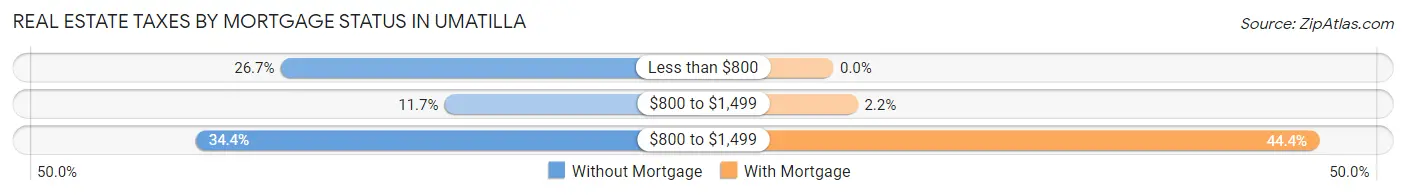
| Property Taxes | Without Mortgage | With Mortgage |
| Less than $800 | 121 (26.7%) | 0 (0.0%) |
| $800 to $1,499 | 53 (11.7%) | 19 (2.2%) |
| $800 to $1,499 | 156 (34.4%) | 378 (44.4%) |
| Total | 454 (100.0%) | 852 (100.0%) |
Health & Disability in Umatilla
Health Insurance Coverage by Age in Umatilla
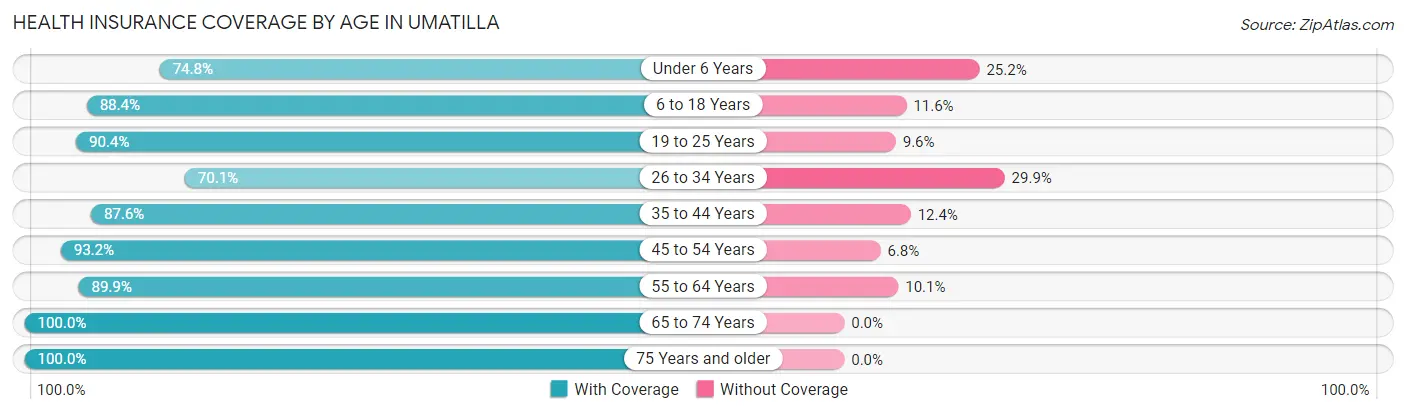
| Age Bracket | With Coverage | Without Coverage |
| Under 6 Years | 89 (74.8%) | 30 (25.2%) |
| 6 to 18 Years | 183 (88.4%) | 24 (11.6%) |
| 19 to 25 Years | 358 (90.4%) | 38 (9.6%) |
| 26 to 34 Years | 143 (70.1%) | 61 (29.9%) |
| 35 to 44 Years | 269 (87.6%) | 38 (12.4%) |
| 45 to 54 Years | 483 (93.2%) | 35 (6.8%) |
| 55 to 64 Years | 250 (89.9%) | 28 (10.1%) |
| 65 to 74 Years | 631 (100.0%) | 0 (0.0%) |
| 75 Years and older | 1,033 (100.0%) | 0 (0.0%) |
| Total | 3,439 (93.1%) | 254 (6.9%) |
Health Insurance Coverage by Citizenship Status in Umatilla
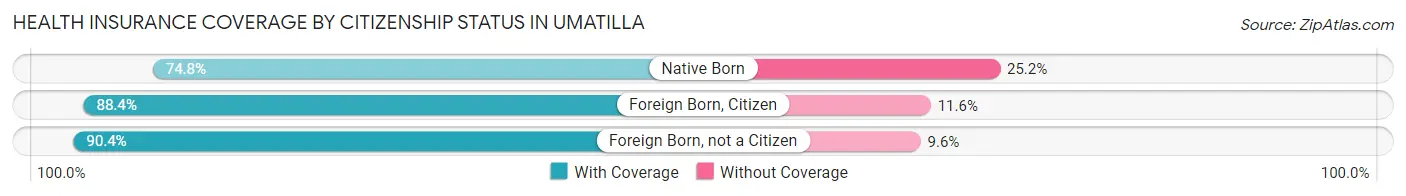
| Citizenship Status | With Coverage | Without Coverage |
| Native Born | 89 (74.8%) | 30 (25.2%) |
| Foreign Born, Citizen | 183 (88.4%) | 24 (11.6%) |
| Foreign Born, not a Citizen | 358 (90.4%) | 38 (9.6%) |
Health Insurance Coverage by Household Income in Umatilla
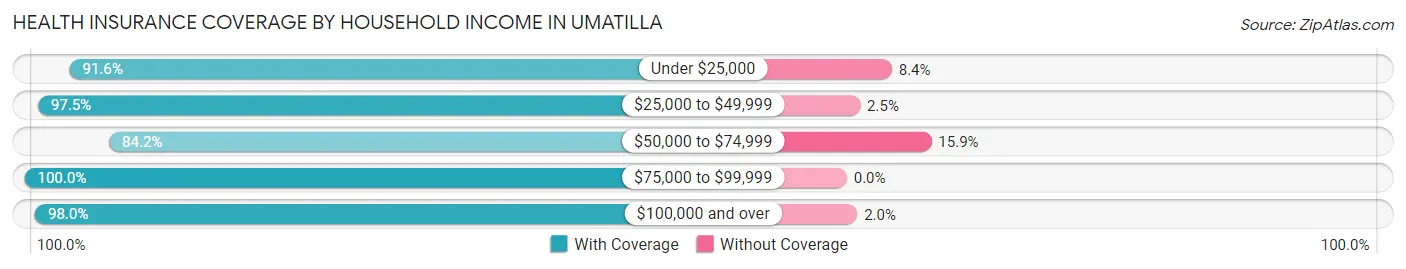
| Household Income | With Coverage | Without Coverage |
| Under $25,000 | 315 (91.6%) | 29 (8.4%) |
| $25,000 to $49,999 | 624 (97.5%) | 16 (2.5%) |
| $50,000 to $74,999 | 998 (84.2%) | 188 (15.9%) |
| $75,000 to $99,999 | 433 (100.0%) | 0 (0.0%) |
| $100,000 and over | 1,051 (98.0%) | 21 (2.0%) |
Public vs Private Health Insurance Coverage by Age in Umatilla
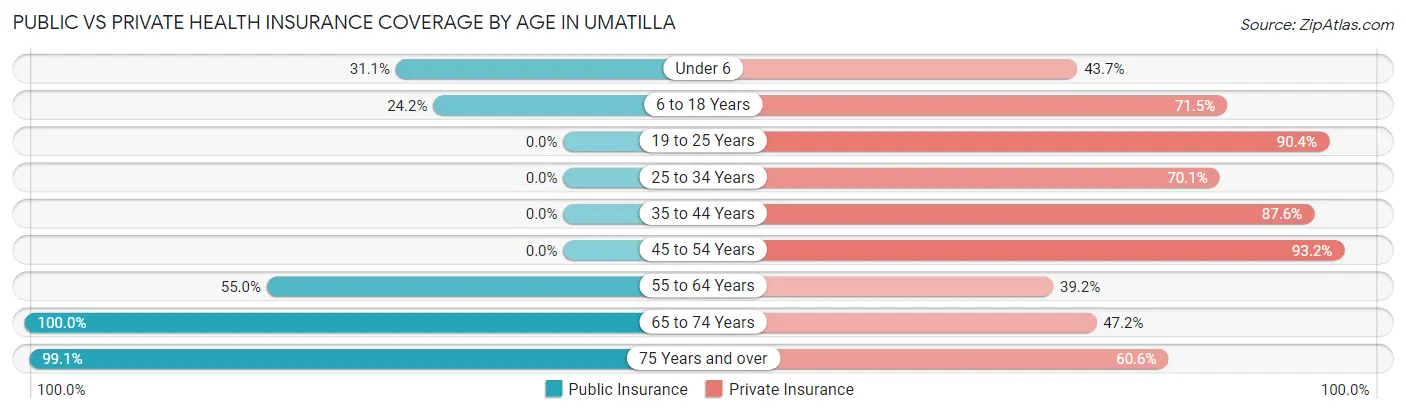
| Age Bracket | Public Insurance | Private Insurance |
| Under 6 | 37 (31.1%) | 52 (43.7%) |
| 6 to 18 Years | 50 (24.1%) | 148 (71.5%) |
| 19 to 25 Years | 0 (0.0%) | 358 (90.4%) |
| 25 to 34 Years | 0 (0.0%) | 143 (70.1%) |
| 35 to 44 Years | 0 (0.0%) | 269 (87.6%) |
| 45 to 54 Years | 0 (0.0%) | 483 (93.2%) |
| 55 to 64 Years | 153 (55.0%) | 109 (39.2%) |
| 65 to 74 Years | 631 (100.0%) | 298 (47.2%) |
| 75 Years and over | 1,024 (99.1%) | 626 (60.6%) |
| Total | 1,895 (51.3%) | 2,486 (67.3%) |
Disability Status by Sex by Age in Umatilla
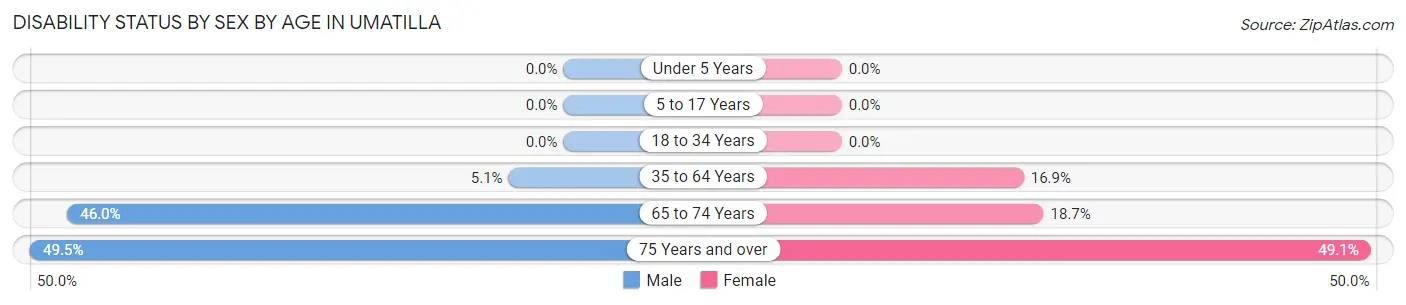
| Age Bracket | Male | Female |
| Under 5 Years | 0 (0.0%) | 0 (0.0%) |
| 5 to 17 Years | 0 (0.0%) | 0 (0.0%) |
| 18 to 34 Years | 0 (0.0%) | 0 (0.0%) |
| 35 to 64 Years | 30 (5.1%) | 87 (16.9%) |
| 65 to 74 Years | 116 (46.0%) | 71 (18.7%) |
| 75 Years and over | 243 (49.5%) | 266 (49.1%) |
Disability Class by Sex by Age in Umatilla
Disability Class: Hearing Difficulty
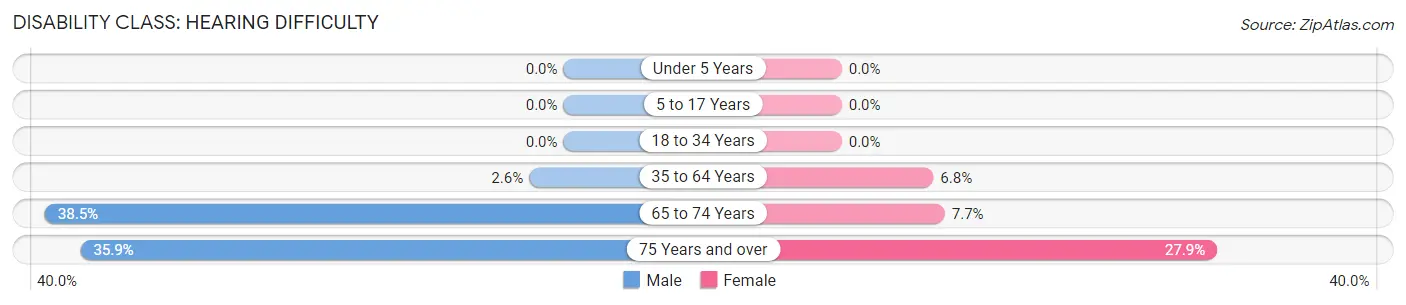
| Age Bracket | Male | Female |
| Under 5 Years | 0 (0.0%) | 0 (0.0%) |
| 5 to 17 Years | 0 (0.0%) | 0 (0.0%) |
| 18 to 34 Years | 0 (0.0%) | 0 (0.0%) |
| 35 to 64 Years | 15 (2.5%) | 35 (6.8%) |
| 65 to 74 Years | 97 (38.5%) | 29 (7.6%) |
| 75 Years and over | 176 (35.8%) | 151 (27.9%) |
Disability Class: Vision Difficulty
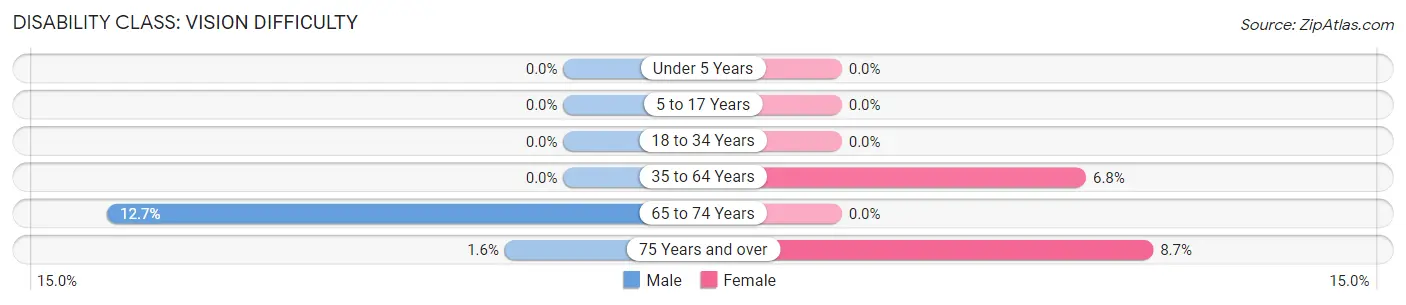
| Age Bracket | Male | Female |
| Under 5 Years | 0 (0.0%) | 0 (0.0%) |
| 5 to 17 Years | 0 (0.0%) | 0 (0.0%) |
| 18 to 34 Years | 0 (0.0%) | 0 (0.0%) |
| 35 to 64 Years | 0 (0.0%) | 35 (6.8%) |
| 65 to 74 Years | 32 (12.7%) | 0 (0.0%) |
| 75 Years and over | 8 (1.6%) | 47 (8.7%) |
Disability Class: Cognitive Difficulty
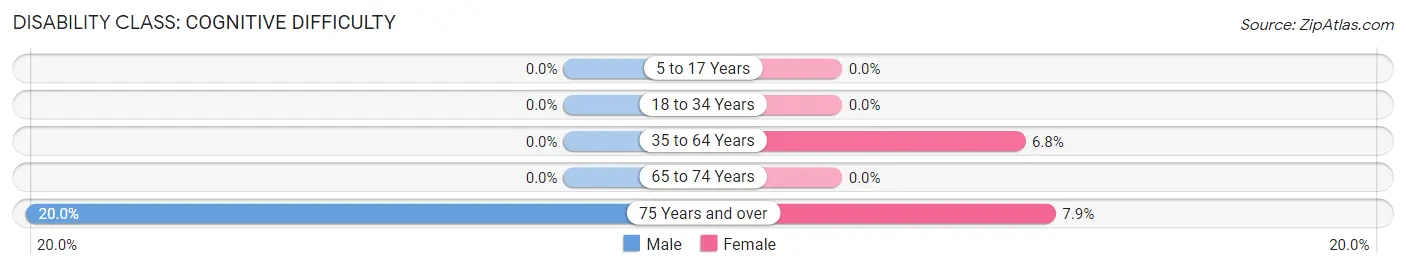
| Age Bracket | Male | Female |
| 5 to 17 Years | 0 (0.0%) | 0 (0.0%) |
| 18 to 34 Years | 0 (0.0%) | 0 (0.0%) |
| 35 to 64 Years | 0 (0.0%) | 35 (6.8%) |
| 65 to 74 Years | 0 (0.0%) | 0 (0.0%) |
| 75 Years and over | 98 (20.0%) | 43 (7.9%) |
Disability Class: Ambulatory Difficulty
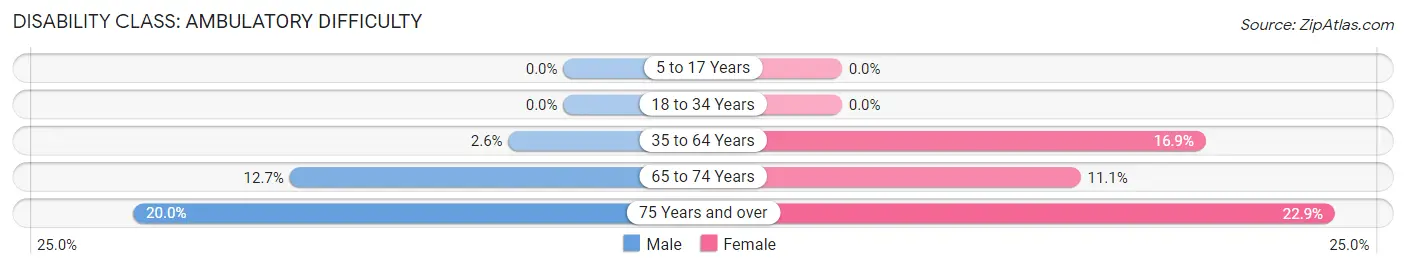
| Age Bracket | Male | Female |
| 5 to 17 Years | 0 (0.0%) | 0 (0.0%) |
| 18 to 34 Years | 0 (0.0%) | 0 (0.0%) |
| 35 to 64 Years | 15 (2.5%) | 87 (16.9%) |
| 65 to 74 Years | 32 (12.7%) | 42 (11.1%) |
| 75 Years and over | 98 (20.0%) | 124 (22.9%) |
Disability Class: Self-Care Difficulty
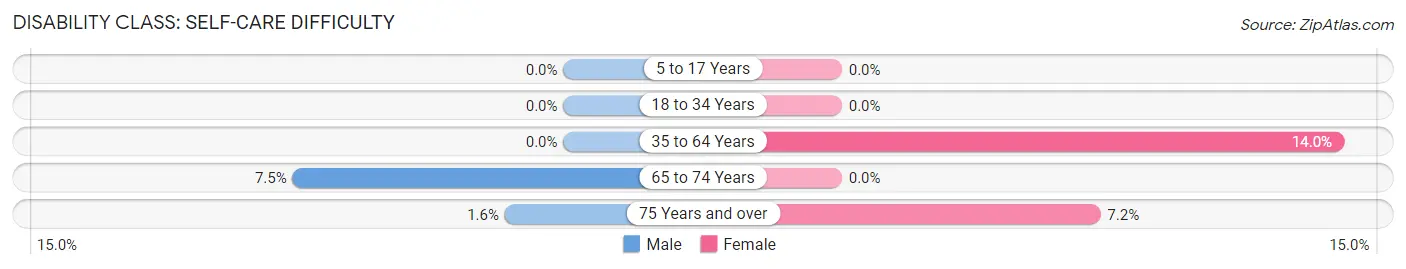
| Age Bracket | Male | Female |
| 5 to 17 Years | 0 (0.0%) | 0 (0.0%) |
| 18 to 34 Years | 0 (0.0%) | 0 (0.0%) |
| 35 to 64 Years | 0 (0.0%) | 72 (14.0%) |
| 65 to 74 Years | 19 (7.5%) | 0 (0.0%) |
| 75 Years and over | 8 (1.6%) | 39 (7.2%) |
Technology Access in Umatilla
Computing Device Access in Umatilla
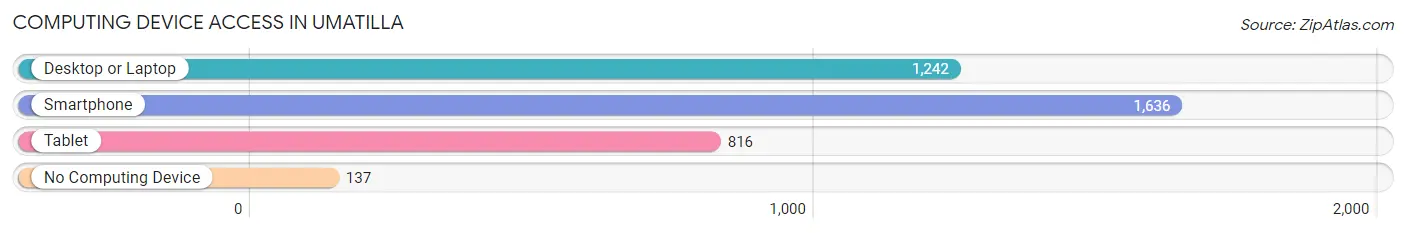
| Device Type | # Households | % Households |
| Desktop or Laptop | 1,242 | 64.2% |
| Smartphone | 1,636 | 84.6% |
| Tablet | 816 | 42.2% |
| No Computing Device | 137 | 7.1% |
| Total | 1,935 | 100.0% |
Internet Access in Umatilla
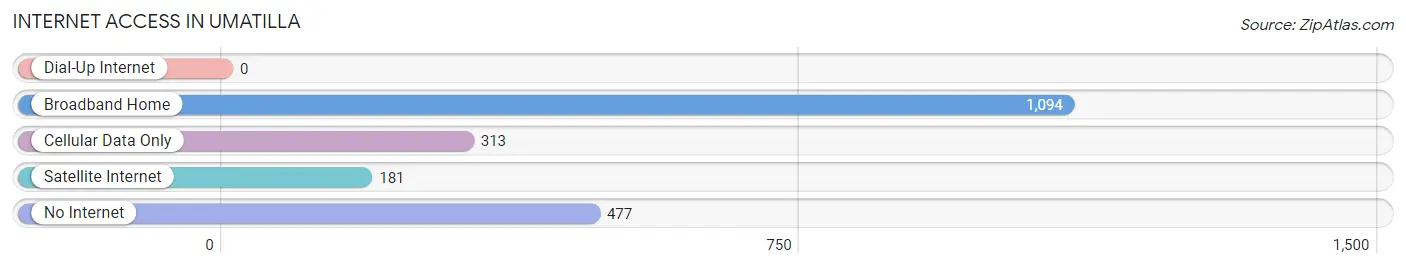
| Internet Type | # Households | % Households |
| Dial-Up Internet | 0 | 0.0% |
| Broadband Home | 1,094 | 56.5% |
| Cellular Data Only | 313 | 16.2% |
| Satellite Internet | 181 | 9.3% |
| No Internet | 477 | 24.6% |
| Total | 1,935 | 100.0% |
Umatilla Summary
Umatilla, Florida is a small town located in Lake County, Florida. It is situated on the northern shore of Lake Eustis, about 25 miles northwest of Orlando. The town has a population of approximately 2,500 people and is part of the Orlando-Kissimmee-Sanford Metropolitan Statistical Area.
History
Umatilla was founded in 1856 by settlers from Georgia and South Carolina. The town was named after the Umatilla River, which flows through the area. The town was originally a trading post and a stop on the stagecoach line between Jacksonville and Tampa. In 1887, the town was incorporated and the first mayor was elected.
In the early 1900s, Umatilla was a thriving agricultural community. The town was known for its citrus groves and vegetable farms. The town also had a thriving lumber industry. In the 1920s, the town was connected to the rest of the state by the Atlantic Coast Line Railroad.
In the 1950s, Umatilla began to experience a population boom. The town was home to several large businesses, including a paper mill, a citrus processing plant, and a canning factory. The town also had a thriving tourism industry, with several hotels and resorts.
Geography
Umatilla is located in Lake County, Florida. The town is situated on the northern shore of Lake Eustis, about 25 miles northwest of Orlando. The town is bordered by the cities of Eustis, Tavares, and Mount Dora. The town is located in the Central Florida region, and is part of the Orlando-Kissimmee-Sanford Metropolitan Statistical Area.
The town has a total area of 2.3 square miles, all of which is land. The town is located at an elevation of 75 feet above sea level. The town is located in a humid subtropical climate zone, with hot, humid summers and mild winters.
Economy
Umatilla has a diverse economy. The town is home to several large businesses, including a paper mill, a citrus processing plant, and a canning factory. The town also has a thriving tourism industry, with several hotels and resorts.
The town is also home to several small businesses, including restaurants, retail stores, and service providers. The town is also home to several manufacturing companies, including a furniture manufacturer and a boat manufacturer.
Demographics
As of the 2010 census, Umatilla had a population of 2,502. The racial makeup of the town was 79.2% White, 15.2% African American, 0.4% Native American, 0.7% Asian, 0.1% Pacific Islander, 2.3% from other races, and 2.1% from two or more races. Hispanic or Latino of any race were 8.2% of the population.
The median income for a household in the town was $37,917, and the median income for a family was $45,938. The per capita income for the town was $19,945. About 11.2% of families and 14.2% of the population were below the poverty line, including 19.2% of those under age 18 and 8.2% of those age 65 or over.
Common Questions
What is Per Capita Income in Umatilla?
Per Capita income in Umatilla is $37,882.
What is the Median Family Income in Umatilla?
Median Family Income in Umatilla is $74,602.
What is the Median Household income in Umatilla?
Median Household Income in Umatilla is $67,505.
What is Income or Wage Gap in Umatilla?
Income or Wage Gap in Umatilla is 45.9%.
Women in Umatilla earn 54.1 cents for every dollar earned by a man.
What is Inequality or Gini Index in Umatilla?
Inequality or Gini Index in Umatilla is 0.39.
What is the Total Population of Umatilla?
Total Population of Umatilla is 3,738.
What is the Total Male Population of Umatilla?
Total Male Population of Umatilla is 1,858.
What is the Total Female Population of Umatilla?
Total Female Population of Umatilla is 1,880.
What is the Ratio of Males per 100 Females in Umatilla?
There are 98.83 Males per 100 Females in Umatilla.
What is the Ratio of Females per 100 Males in Umatilla?
There are 101.18 Females per 100 Males in Umatilla.
What is the Median Population Age in Umatilla?
Median Population Age in Umatilla is 61.7 Years.
What is the Average Family Size in Umatilla
Average Family Size in Umatilla is 2.7 People.
What is the Average Household Size in Umatilla
Average Household Size in Umatilla is 1.9 People.
How Large is the Labor Force in Umatilla?
There are 1,529 People in the Labor Forcein in Umatilla.
What is the Percentage of People in the Labor Force in Umatilla?
44.0% of People are in the Labor Force in Umatilla.
What is the Unemployment Rate in Umatilla?
Unemployment Rate in Umatilla is 1.0%.