Nassau Village Ratliff, FL Map & Demographics
Nassau Village Ratliff Map
Nassau Village Ratliff Overview
$28,663
PER CAPITA INCOME
$59,457
AVG FAMILY INCOME
$54,311
AVG HOUSEHOLD INCOME
52.8%
WAGE / INCOME GAP [ % ]
47.2¢/ $1
WAGE / INCOME GAP [ $ ]
0.41
INEQUALITY / GINI INDEX
4,530
TOTAL POPULATION
2,473
MALE POPULATION
2,057
FEMALE POPULATION
120.22
MALES / 100 FEMALES
83.18
FEMALES / 100 MALES
50.1
MEDIAN AGE
2.6
AVG FAMILY SIZE
2.3
AVG HOUSEHOLD SIZE
1,783
LABOR FORCE [ PEOPLE ]
46.2%
PERCENT IN LABOR FORCE
4.7%
UNEMPLOYMENT RATE
Income in Nassau Village Ratliff
Income Overview in Nassau Village Ratliff
Per Capita Income in Nassau Village Ratliff is $28,663, while median incomes of families and households are $59,457 and $54,311 respectively.
| Characteristic | Number | Measure |
| Per Capita Income | 4,530 | $28,663 |
| Median Family Income | 1,494 | $59,457 |
| Mean Family Income | 1,494 | $69,999 |
| Median Household Income | 1,983 | $54,311 |
| Mean Household Income | 1,983 | $65,548 |
| Income Deficit | 1,494 | $0 |
| Wage / Income Gap (%) | 4,530 | 52.82% |
| Wage / Income Gap ($) | 4,530 | 47.18¢ per $1 |
| Gini / Inequality Index | 4,530 | 0.41 |
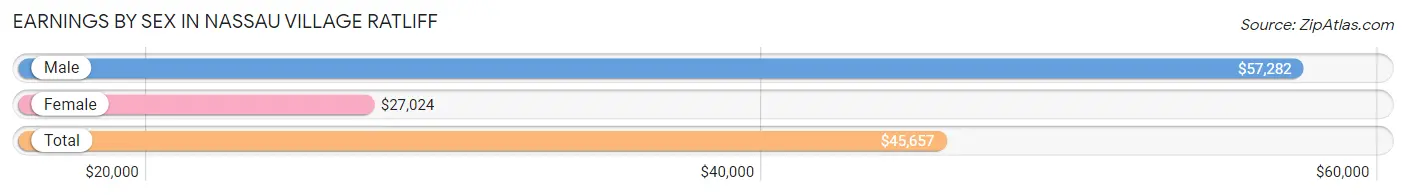
Earnings by Sex in Nassau Village Ratliff
Average Earnings in Nassau Village Ratliff are $45,657, $57,282 for men and $27,024 for women, a difference of 52.8%.
| Sex | Number | Average Earnings |
| Male | 1,159 (60.7%) | $57,282 |
| Female | 752 (39.4%) | $27,024 |
| Total | 1,911 (100.0%) | $45,657 |
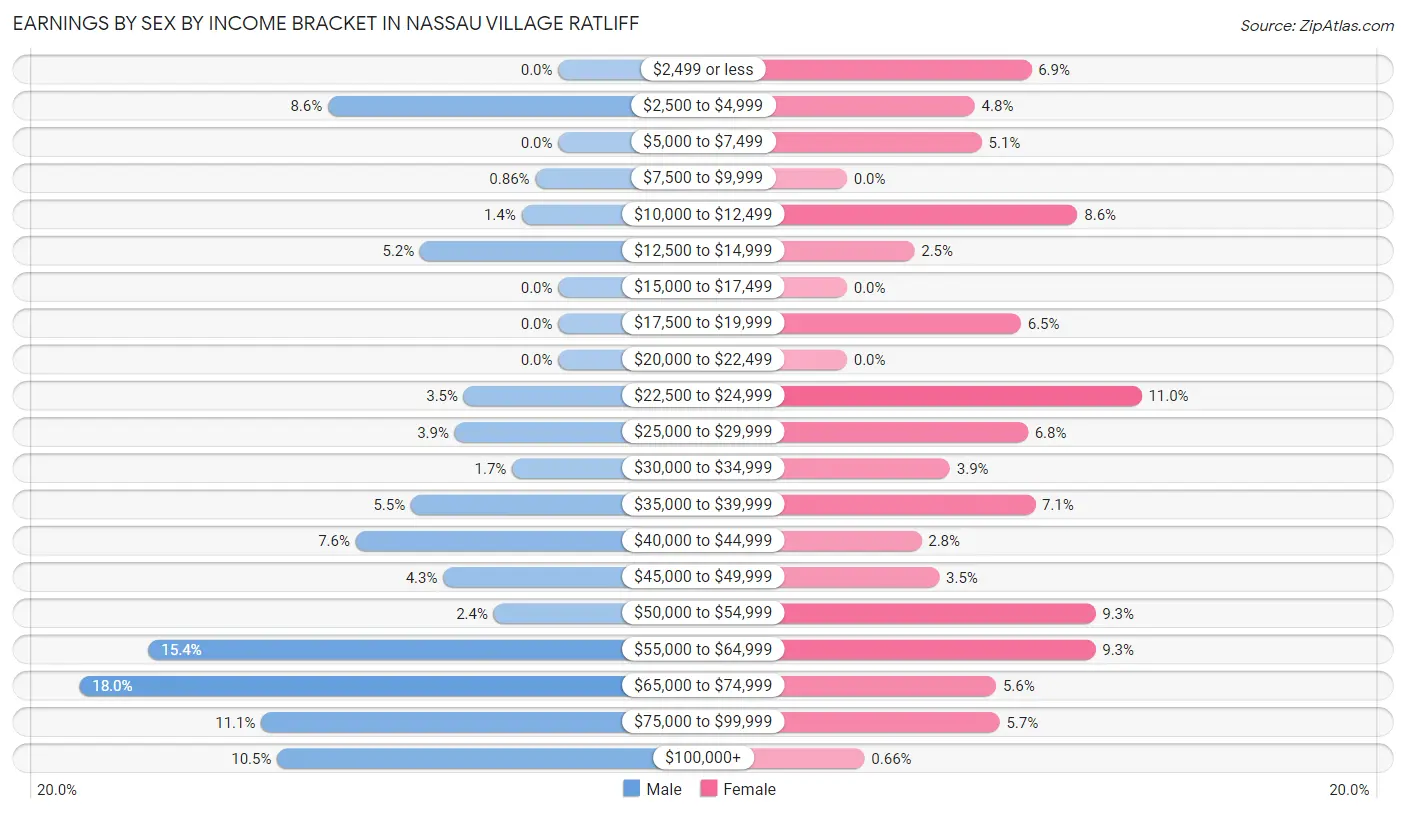
Earnings by Sex by Income Bracket in Nassau Village Ratliff
The most common earnings brackets in Nassau Village Ratliff are $65,000 to $74,999 for men (208 | 17.9%) and $22,500 to $24,999 for women (83 | 11.0%).
| Income | Male | Female |
| $2,499 or less | 0 (0.0%) | 52 (6.9%) |
| $2,500 to $4,999 | 100 (8.6%) | 36 (4.8%) |
| $5,000 to $7,499 | 0 (0.0%) | 38 (5.1%) |
| $7,500 to $9,999 | 10 (0.9%) | 0 (0.0%) |
| $10,000 to $12,499 | 16 (1.4%) | 65 (8.6%) |
| $12,500 to $14,999 | 60 (5.2%) | 19 (2.5%) |
| $15,000 to $17,499 | 0 (0.0%) | 0 (0.0%) |
| $17,500 to $19,999 | 0 (0.0%) | 49 (6.5%) |
| $20,000 to $22,499 | 0 (0.0%) | 0 (0.0%) |
| $22,500 to $24,999 | 41 (3.5%) | 83 (11.0%) |
| $25,000 to $29,999 | 45 (3.9%) | 51 (6.8%) |
| $30,000 to $34,999 | 20 (1.7%) | 29 (3.9%) |
| $35,000 to $39,999 | 64 (5.5%) | 53 (7.0%) |
| $40,000 to $44,999 | 88 (7.6%) | 21 (2.8%) |
| $45,000 to $49,999 | 50 (4.3%) | 26 (3.5%) |
| $50,000 to $54,999 | 28 (2.4%) | 70 (9.3%) |
| $55,000 to $64,999 | 178 (15.4%) | 70 (9.3%) |
| $65,000 to $74,999 | 208 (17.9%) | 42 (5.6%) |
| $75,000 to $99,999 | 129 (11.1%) | 43 (5.7%) |
| $100,000+ | 122 (10.5%) | 5 (0.7%) |
| Total | 1,159 (100.0%) | 752 (100.0%) |
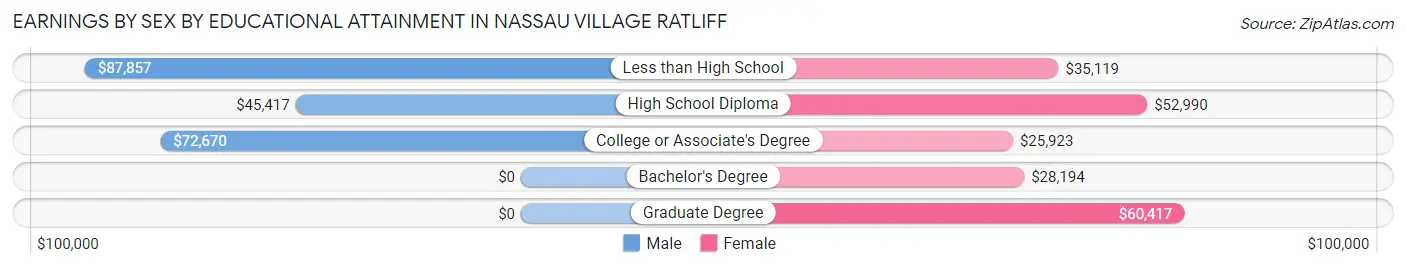
Earnings by Sex by Educational Attainment in Nassau Village Ratliff
Average earnings in Nassau Village Ratliff are $59,667 for men and $33,571 for women, a difference of 43.7%. Men with an educational attainment of less than high school enjoy the highest average annual earnings of $87,857, while those with high school diploma education earn the least with $45,417. Women with an educational attainment of graduate degree earn the most with the average annual earnings of $60,417, while those with college or associate's degree education have the smallest earnings of $25,923.
| Educational Attainment | Male Income | Female Income |
| Less than High School | $87,857 | $35,119 |
| High School Diploma | $45,417 | $52,990 |
| College or Associate's Degree | $72,670 | $25,923 |
| Bachelor's Degree | - | - |
| Graduate Degree | - | - |
| Total | $59,667 | $33,571 |
Family Income in Nassau Village Ratliff
Family Income Brackets in Nassau Village Ratliff
According to the Nassau Village Ratliff family income data, there are 318 families falling into the $50,000 to $74,999 income range, which is the most common income bracket and makes up 21.3% of all families. Conversely, the less than $10,000 income bracket is the least frequent group with only 10 families (0.7%) belonging to this category.
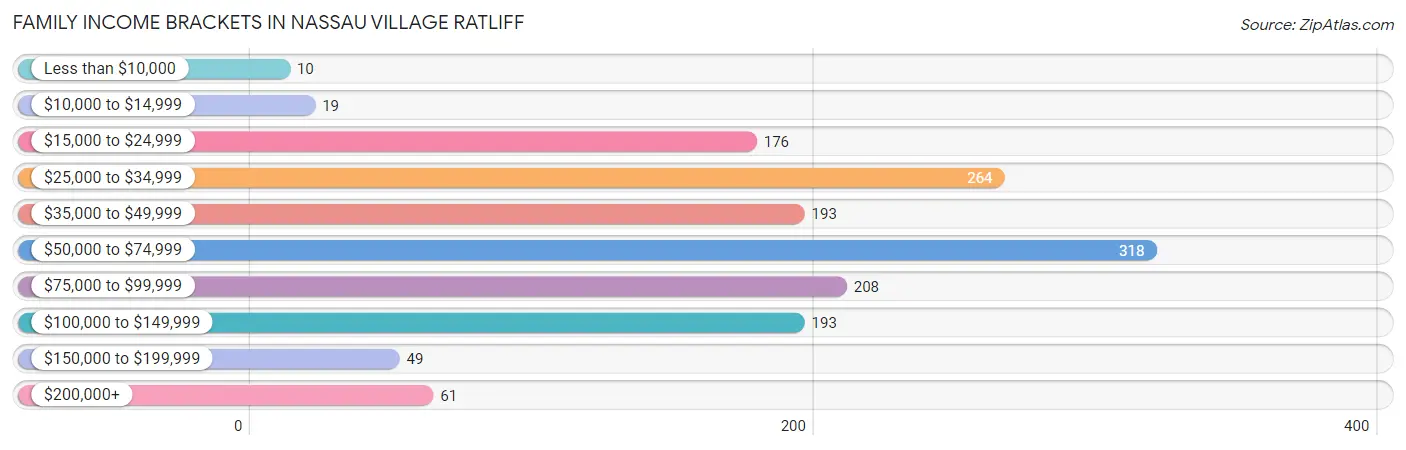
| Income Bracket | # Families | % Families |
| Less than $10,000 | 10 | 0.7% |
| $10,000 to $14,999 | 19 | 1.3% |
| $15,000 to $24,999 | 176 | 11.8% |
| $25,000 to $34,999 | 264 | 17.7% |
| $35,000 to $49,999 | 193 | 12.9% |
| $50,000 to $74,999 | 318 | 21.3% |
| $75,000 to $99,999 | 208 | 13.9% |
| $100,000 to $149,999 | 193 | 12.9% |
| $150,000 to $199,999 | 49 | 3.3% |
| $200,000+ | 61 | 4.1% |
Family Income by Famaliy Size in Nassau Village Ratliff
6-person families (32 | 2.1%) account for the highest median family income in Nassau Village Ratliff with $82,917 per family, while 2-person families (972 | 65.1%) have the highest median income of $25,132 per family member.
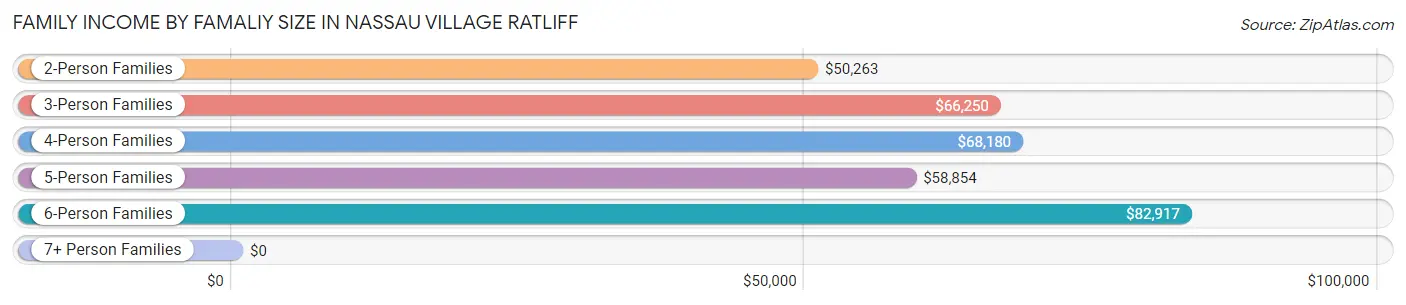
| Income Bracket | # Families | Median Income |
| 2-Person Families | 972 (65.1%) | $50,263 |
| 3-Person Families | 312 (20.9%) | $66,250 |
| 4-Person Families | 137 (9.2%) | $68,180 |
| 5-Person Families | 41 (2.7%) | $58,854 |
| 6-Person Families | 32 (2.1%) | $82,917 |
| 7+ Person Families | 0 (0.0%) | $0 |
| Total | 1,494 (100.0%) | $59,457 |
Family Income by Number of Earners in Nassau Village Ratliff
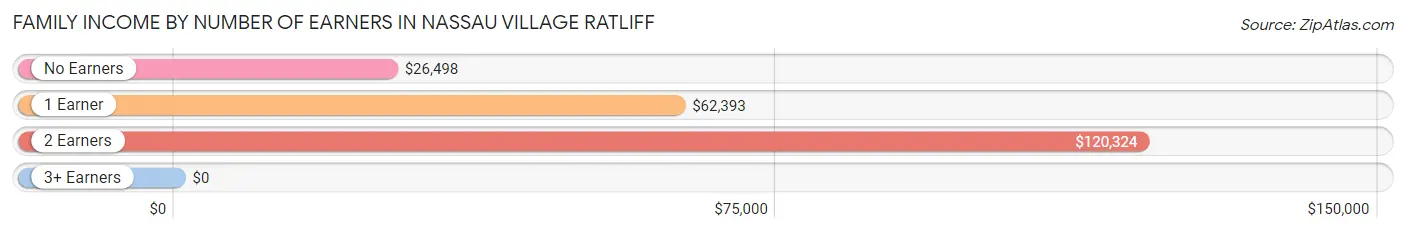
| Number of Earners | # Families | Median Income |
| No Earners | 471 (31.5%) | $26,498 |
| 1 Earner | 599 (40.1%) | $62,393 |
| 2 Earners | 375 (25.1%) | $120,324 |
| 3+ Earners | 49 (3.3%) | $0 |
| Total | 1,494 (100.0%) | $59,457 |
Household Income in Nassau Village Ratliff
Household Income Brackets in Nassau Village Ratliff
With 401 households falling in the category, the $50,000 to $74,999 income range is the most frequent in Nassau Village Ratliff, accounting for 20.2% of all households. In contrast, only 58 households (2.9%) fall into the $10,000 to $14,999 income bracket, making it the least populous group.
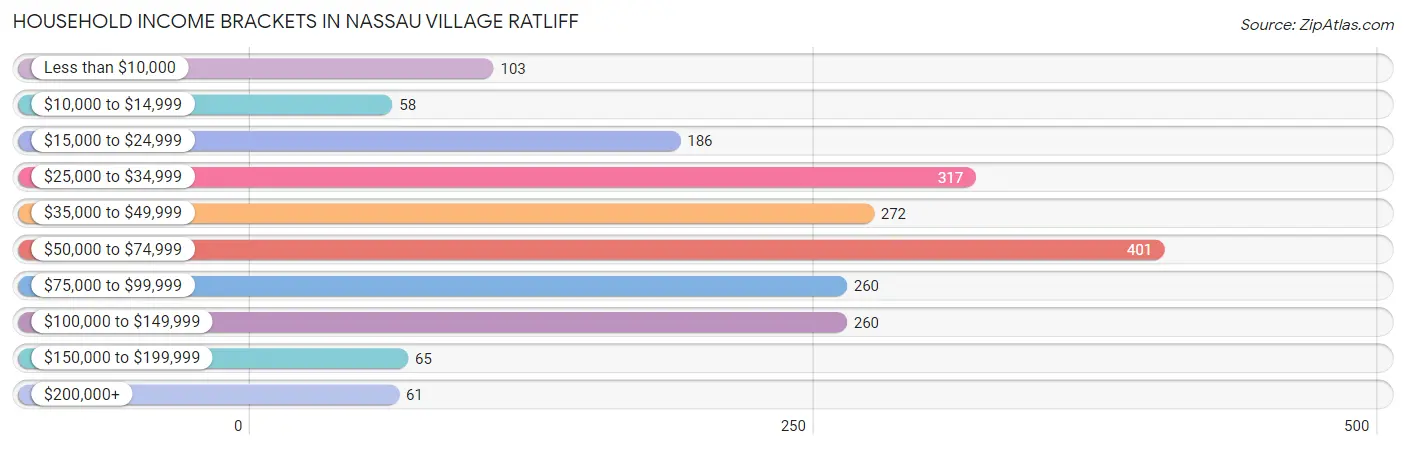
| Income Bracket | # Households | % Households |
| Less than $10,000 | 103 | 5.2% |
| $10,000 to $14,999 | 58 | 2.9% |
| $15,000 to $24,999 | 186 | 9.4% |
| $25,000 to $34,999 | 317 | 16.0% |
| $35,000 to $49,999 | 272 | 13.7% |
| $50,000 to $74,999 | 401 | 20.2% |
| $75,000 to $99,999 | 260 | 13.1% |
| $100,000 to $149,999 | 260 | 13.1% |
| $150,000 to $199,999 | 65 | 3.3% |
| $200,000+ | 61 | 3.1% |
Household Income by Householder Age in Nassau Village Ratliff
The median household income in Nassau Village Ratliff is $54,311, with the highest median household income of $68,464 found in the 25 to 44 years age bracket for the primary householder. A total of 507 households (25.6%) fall into this category.
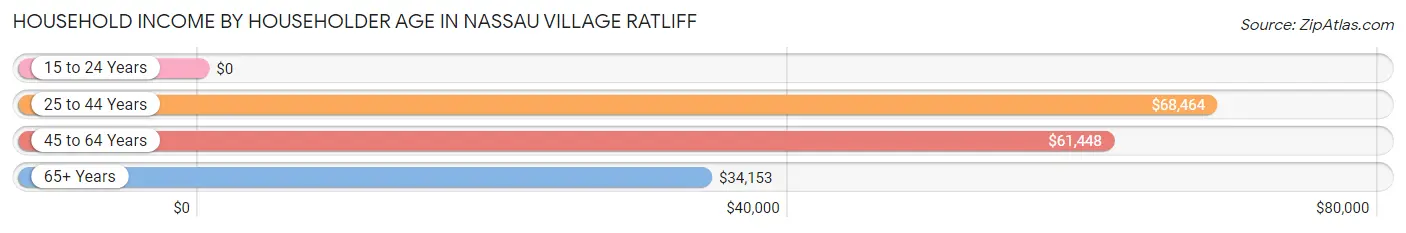
| Income Bracket | # Households | Median Income |
| 15 to 24 Years | 0 (0.0%) | $0 |
| 25 to 44 Years | 507 (25.6%) | $68,464 |
| 45 to 64 Years | 885 (44.6%) | $61,448 |
| 65+ Years | 591 (29.8%) | $34,153 |
| Total | 1,983 (100.0%) | $54,311 |
Poverty in Nassau Village Ratliff
Income Below Poverty by Sex and Age in Nassau Village Ratliff
With 13.2% poverty level for males and 10.3% for females among the residents of Nassau Village Ratliff, 55 to 64 year old males and under 5 year old females are the most vulnerable to poverty, with 157 males (36.3%) and 26 females (27.4%) in their respective age groups living below the poverty level.
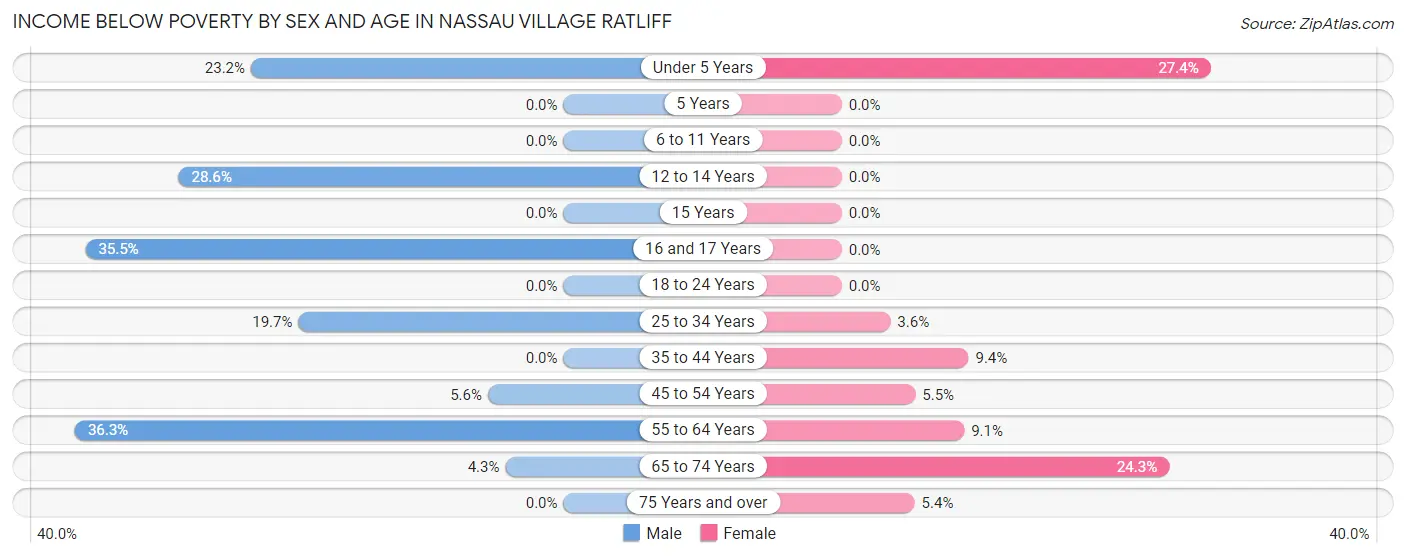
| Age Bracket | Male | Female |
| Under 5 Years | 29 (23.2%) | 26 (27.4%) |
| 5 Years | 0 (0.0%) | 0 (0.0%) |
| 6 to 11 Years | 0 (0.0%) | 0 (0.0%) |
| 12 to 14 Years | 20 (28.6%) | 0 (0.0%) |
| 15 Years | 0 (0.0%) | 0 (0.0%) |
| 16 and 17 Years | 11 (35.5%) | 0 (0.0%) |
| 18 to 24 Years | 0 (0.0%) | 0 (0.0%) |
| 25 to 34 Years | 73 (19.7%) | 9 (3.6%) |
| 35 to 44 Years | 0 (0.0%) | 19 (9.4%) |
| 45 to 54 Years | 17 (5.6%) | 19 (5.5%) |
| 55 to 64 Years | 157 (36.3%) | 25 (9.1%) |
| 65 to 74 Years | 20 (4.3%) | 103 (24.3%) |
| 75 Years and over | 0 (0.0%) | 10 (5.4%) |
| Total | 327 (13.2%) | 211 (10.3%) |
Income Above Poverty by Sex and Age in Nassau Village Ratliff
According to the poverty statistics in Nassau Village Ratliff, males aged 5 years and females aged 5 years are the age groups that are most secure financially, with 100.0% of males and 100.0% of females in these age groups living above the poverty line.
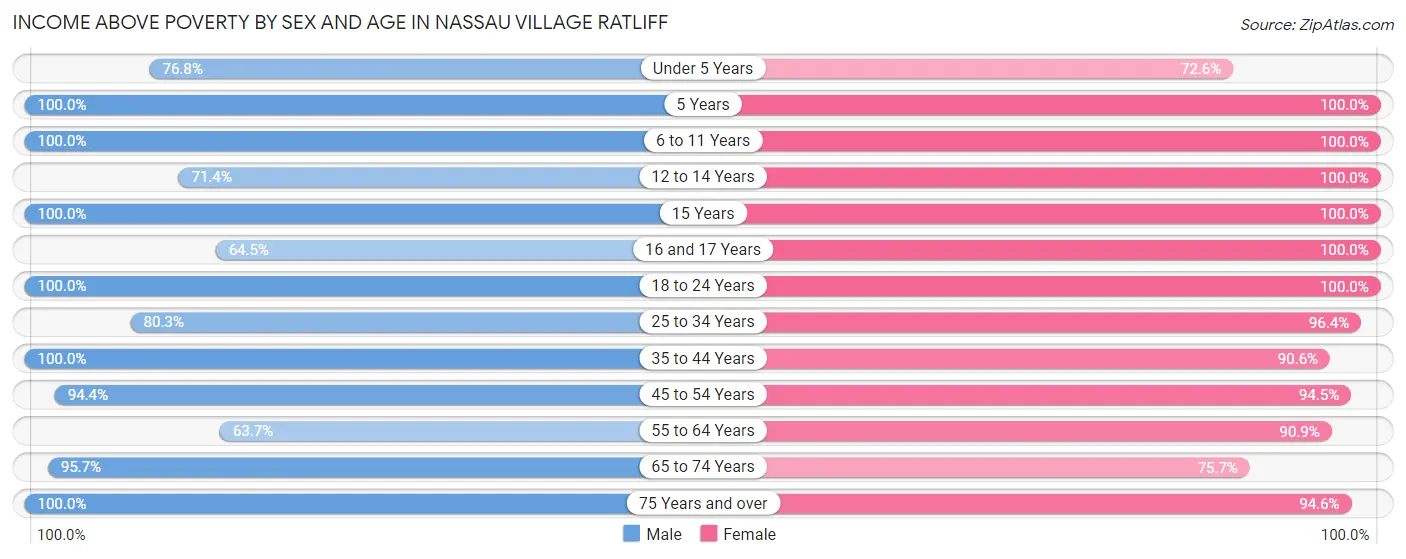
| Age Bracket | Male | Female |
| Under 5 Years | 96 (76.8%) | 69 (72.6%) |
| 5 Years | 8 (100.0%) | 3 (100.0%) |
| 6 to 11 Years | 161 (100.0%) | 71 (100.0%) |
| 12 to 14 Years | 50 (71.4%) | 40 (100.0%) |
| 15 Years | 32 (100.0%) | 65 (100.0%) |
| 16 and 17 Years | 20 (64.5%) | 12 (100.0%) |
| 18 to 24 Years | 144 (100.0%) | 88 (100.0%) |
| 25 to 34 Years | 298 (80.3%) | 240 (96.4%) |
| 35 to 44 Years | 218 (100.0%) | 183 (90.6%) |
| 45 to 54 Years | 286 (94.4%) | 329 (94.5%) |
| 55 to 64 Years | 276 (63.7%) | 250 (90.9%) |
| 65 to 74 Years | 444 (95.7%) | 321 (75.7%) |
| 75 Years and over | 113 (100.0%) | 175 (94.6%) |
| Total | 2,146 (86.8%) | 1,846 (89.7%) |
Income Below Poverty Among Married-Couple Families in Nassau Village Ratliff
The poverty statistics for married-couple families in Nassau Village Ratliff show that 9.5% or 116 of the total 1,224 families live below the poverty line. Families with no children have the highest poverty rate of 11.3%, comprising of 116 families. On the other hand, families with 1 or 2 children have the lowest poverty rate of 0.0%, which includes 0 families.
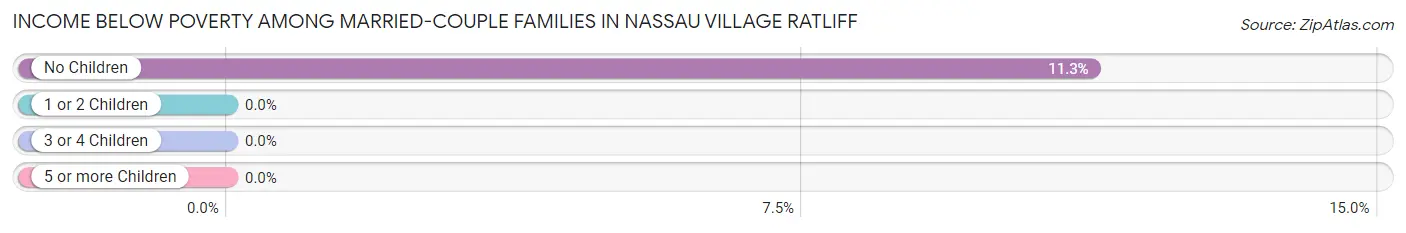
| Children | Above Poverty | Below Poverty |
| No Children | 914 (88.7%) | 116 (11.3%) |
| 1 or 2 Children | 144 (100.0%) | 0 (0.0%) |
| 3 or 4 Children | 50 (100.0%) | 0 (0.0%) |
| 5 or more Children | 0 (0.0%) | 0 (0.0%) |
| Total | 1,108 (90.5%) | 116 (9.5%) |
Income Below Poverty Among Single-Parent Households in Nassau Village Ratliff
According to the poverty data in Nassau Village Ratliff, 10.5% or 10 single-father households and 22.3% or 39 single-mother households are living below the poverty line. Among single-father households, those with no children have the highest poverty rate, with 10 households (58.8%) experiencing poverty. Likewise, among single-mother households, those with 3 or 4 children have the highest poverty rate, with 19 households (63.3%) falling below the poverty line.
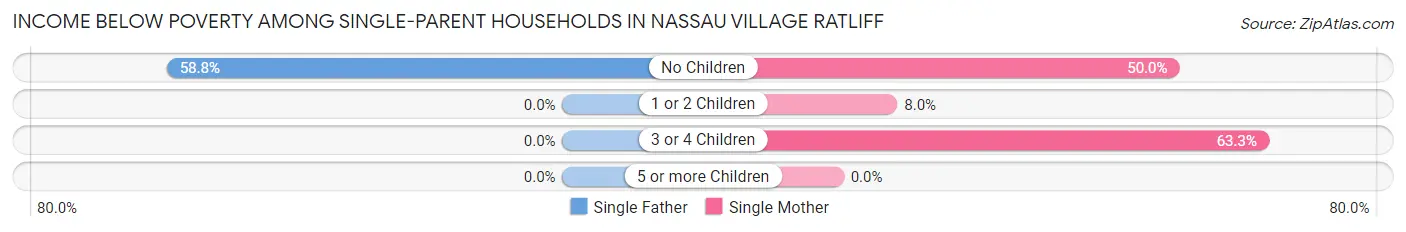
| Children | Single Father | Single Mother |
| No Children | 10 (58.8%) | 10 (50.0%) |
| 1 or 2 Children | 0 (0.0%) | 10 (8.0%) |
| 3 or 4 Children | 0 (0.0%) | 19 (63.3%) |
| 5 or more Children | 0 (0.0%) | 0 (0.0%) |
| Total | 10 (10.5%) | 39 (22.3%) |
Income Below Poverty Among Married-Couple vs Single-Parent Households in Nassau Village Ratliff
The poverty data for Nassau Village Ratliff shows that 116 of the married-couple family households (9.5%) and 49 of the single-parent households (18.1%) are living below the poverty level. Within the married-couple family households, those with no children have the highest poverty rate, with 116 households (11.3%) falling below the poverty line. Among the single-parent households, those with 3 or 4 children have the highest poverty rate, with 19 household (63.3%) living below poverty.
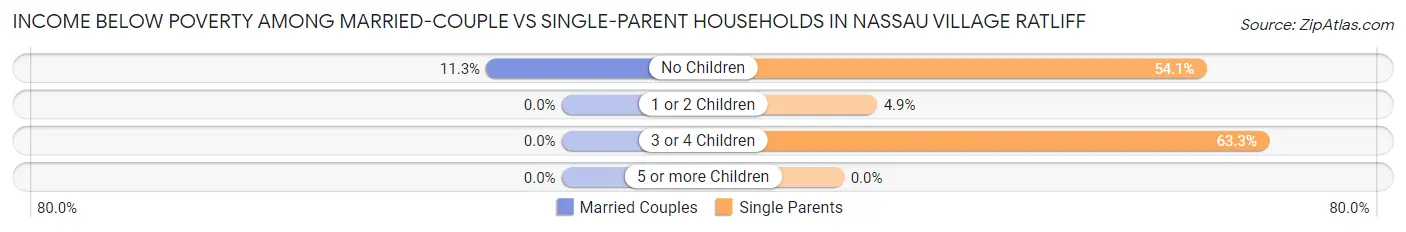
| Children | Married-Couple Families | Single-Parent Households |
| No Children | 116 (11.3%) | 20 (54.0%) |
| 1 or 2 Children | 0 (0.0%) | 10 (4.9%) |
| 3 or 4 Children | 0 (0.0%) | 19 (63.3%) |
| 5 or more Children | 0 (0.0%) | 0 (0.0%) |
| Total | 116 (9.5%) | 49 (18.1%) |
Race in Nassau Village Ratliff
The most populous races in Nassau Village Ratliff are White / Caucasian (4,375 | 96.6%), Asian (76 | 1.7%), and Two or more Races (58 | 1.3%).
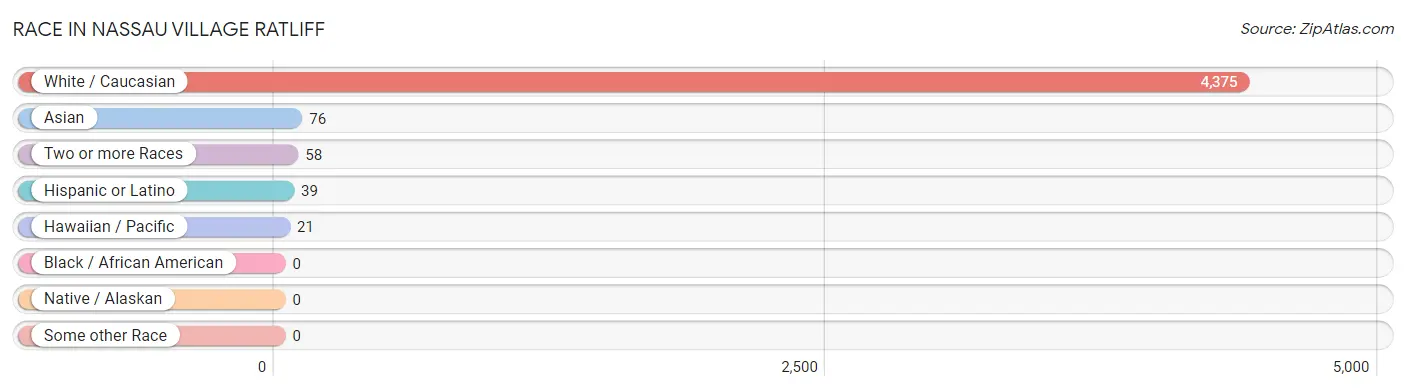
| Race | # Population | % Population |
| Asian | 76 | 1.7% |
| Black / African American | 0 | 0.0% |
| Hawaiian / Pacific | 21 | 0.5% |
| Hispanic or Latino | 39 | 0.9% |
| Native / Alaskan | 0 | 0.0% |
| White / Caucasian | 4,375 | 96.6% |
| Two or more Races | 58 | 1.3% |
| Some other Race | 0 | 0.0% |
| Total | 4,530 | 100.0% |
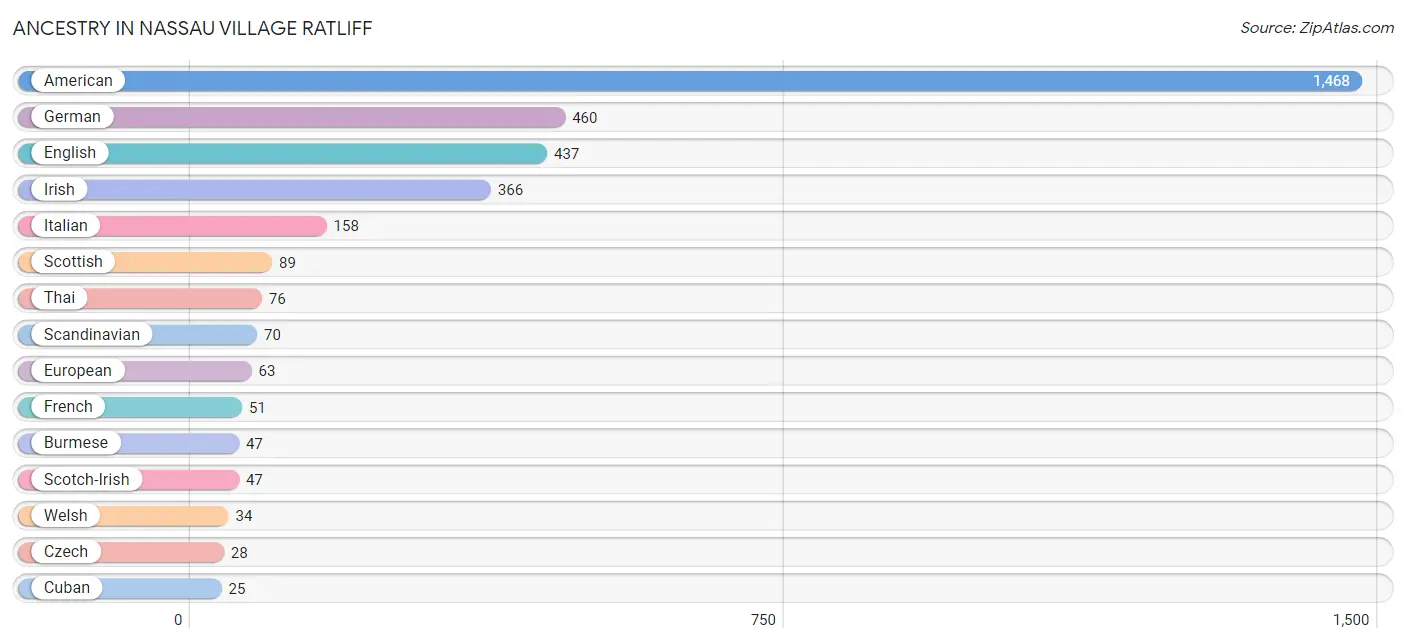
Ancestry in Nassau Village Ratliff
The most populous ancestries reported in Nassau Village Ratliff are American (1,468 | 32.4%), German (460 | 10.2%), English (437 | 9.7%), Irish (366 | 8.1%), and Italian (158 | 3.5%), together accounting for 63.8% of all Nassau Village Ratliff residents.
| Ancestry | # Population | % Population |
| American | 1,468 | 32.4% |
| British | 16 | 0.4% |
| Burmese | 47 | 1.0% |
| Central American | 5 | 0.1% |
| Cherokee | 1 | 0.0% |
| Cuban | 25 | 0.5% |
| Czech | 28 | 0.6% |
| English | 437 | 9.7% |
| European | 63 | 1.4% |
| French | 51 | 1.1% |
| French Canadian | 10 | 0.2% |
| German | 460 | 10.2% |
| Guamanian / Chamorro | 21 | 0.5% |
| Irish | 366 | 8.1% |
| Italian | 158 | 3.5% |
| Panamanian | 5 | 0.1% |
| Scandinavian | 70 | 1.5% |
| Scotch-Irish | 47 | 1.0% |
| Scottish | 89 | 2.0% |
| Slovak | 13 | 0.3% |
| Spaniard | 9 | 0.2% |
| Thai | 76 | 1.7% |
| Welsh | 34 | 0.7% | View All 23 Rows |
Immigrants in Nassau Village Ratliff
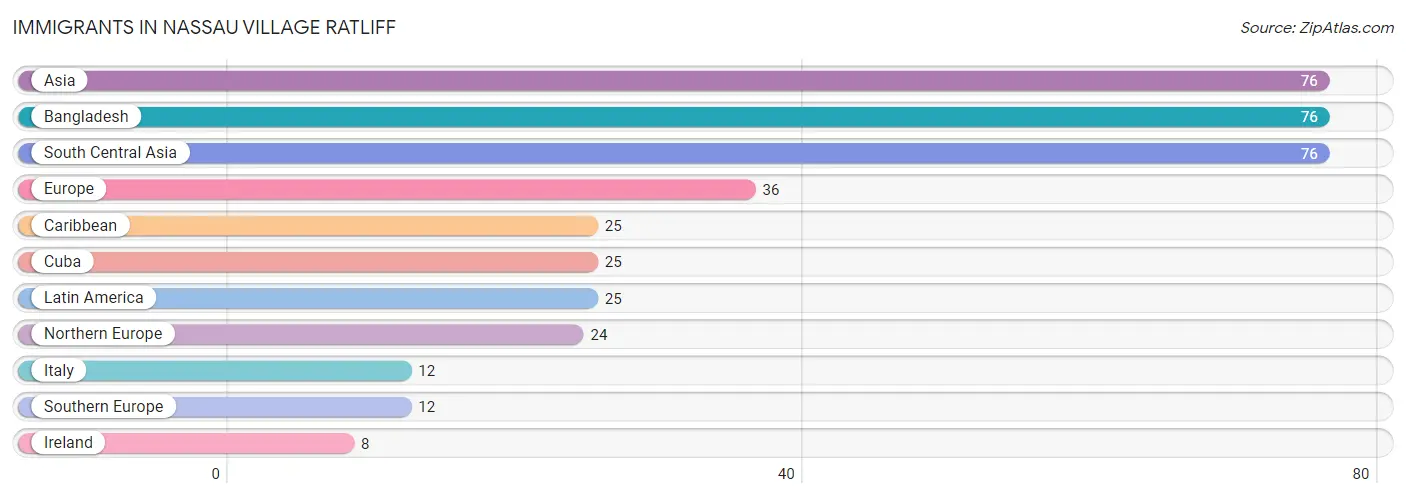
The most numerous immigrant groups reported in Nassau Village Ratliff came from Asia (76 | 1.7%), Bangladesh (76 | 1.7%), South Central Asia (76 | 1.7%), Europe (36 | 0.8%), and Caribbean (25 | 0.5%), together accounting for 6.4% of all Nassau Village Ratliff residents.
| Immigration Origin | # Population | % Population |
| Asia | 76 | 1.7% |
| Bangladesh | 76 | 1.7% |
| Caribbean | 25 | 0.5% |
| Cuba | 25 | 0.5% |
| Europe | 36 | 0.8% |
| Ireland | 8 | 0.2% |
| Italy | 12 | 0.3% |
| Latin America | 25 | 0.5% |
| Northern Europe | 24 | 0.5% |
| South Central Asia | 76 | 1.7% |
| Southern Europe | 12 | 0.3% | View All 11 Rows |
Sex and Age in Nassau Village Ratliff
Sex and Age in Nassau Village Ratliff
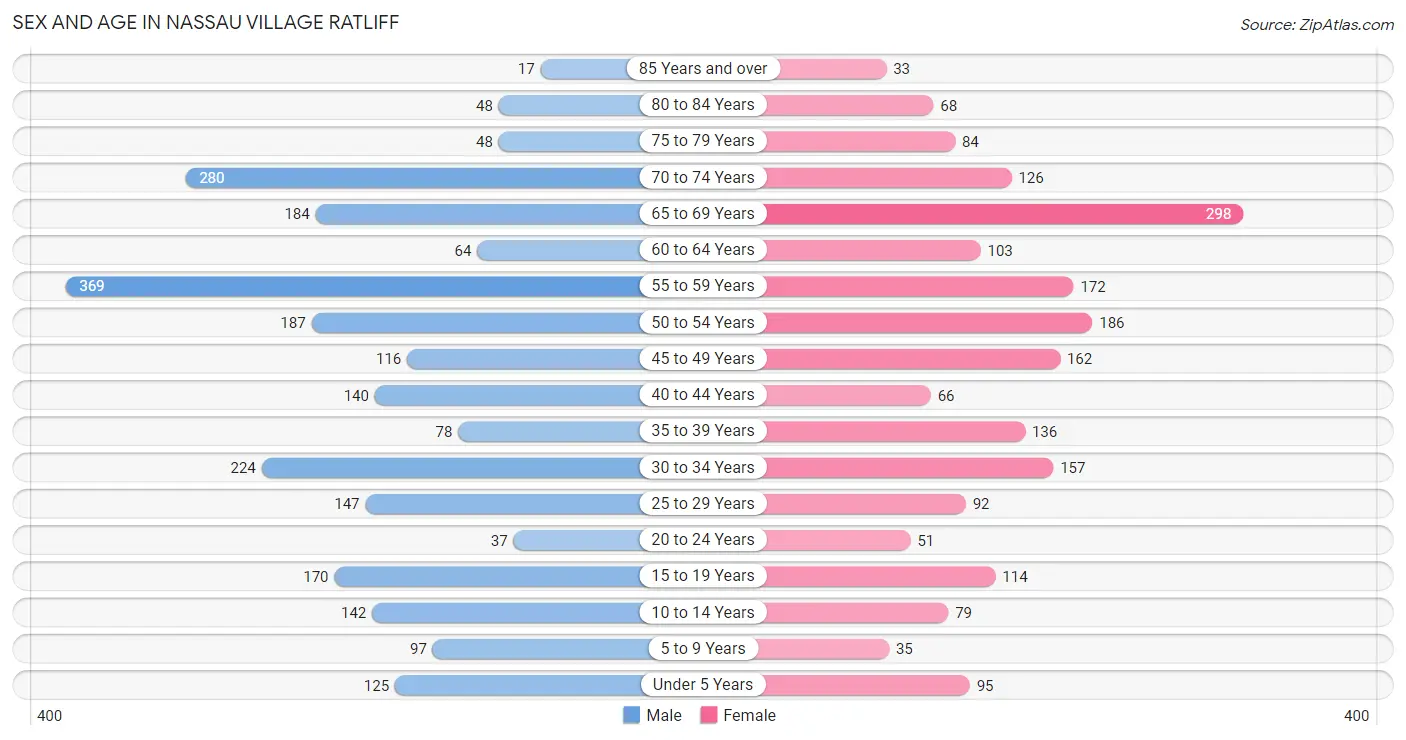
The most populous age groups in Nassau Village Ratliff are 55 to 59 Years (369 | 14.9%) for men and 65 to 69 Years (298 | 14.5%) for women.
| Age Bracket | Male | Female |
| Under 5 Years | 125 (5.1%) | 95 (4.6%) |
| 5 to 9 Years | 97 (3.9%) | 35 (1.7%) |
| 10 to 14 Years | 142 (5.7%) | 79 (3.8%) |
| 15 to 19 Years | 170 (6.9%) | 114 (5.5%) |
| 20 to 24 Years | 37 (1.5%) | 51 (2.5%) |
| 25 to 29 Years | 147 (5.9%) | 92 (4.5%) |
| 30 to 34 Years | 224 (9.1%) | 157 (7.6%) |
| 35 to 39 Years | 78 (3.2%) | 136 (6.6%) |
| 40 to 44 Years | 140 (5.7%) | 66 (3.2%) |
| 45 to 49 Years | 116 (4.7%) | 162 (7.9%) |
| 50 to 54 Years | 187 (7.6%) | 186 (9.0%) |
| 55 to 59 Years | 369 (14.9%) | 172 (8.4%) |
| 60 to 64 Years | 64 (2.6%) | 103 (5.0%) |
| 65 to 69 Years | 184 (7.4%) | 298 (14.5%) |
| 70 to 74 Years | 280 (11.3%) | 126 (6.1%) |
| 75 to 79 Years | 48 (1.9%) | 84 (4.1%) |
| 80 to 84 Years | 48 (1.9%) | 68 (3.3%) |
| 85 Years and over | 17 (0.7%) | 33 (1.6%) |
| Total | 2,473 (100.0%) | 2,057 (100.0%) |
Families and Households in Nassau Village Ratliff
Median Family Size in Nassau Village Ratliff
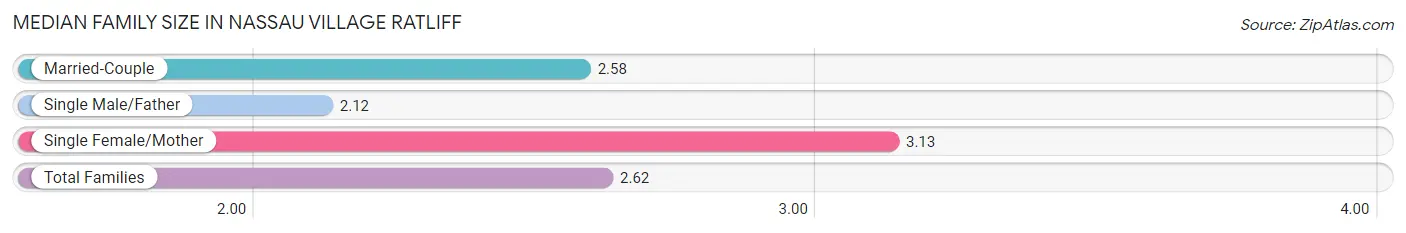
The median family size in Nassau Village Ratliff is 2.62 persons per family, with single female/mother families (175 | 11.7%) accounting for the largest median family size of 3.13 persons per family. On the other hand, single male/father families (95 | 6.4%) represent the smallest median family size with 2.12 persons per family.
| Family Type | # Families | Family Size |
| Married-Couple | 1,224 (81.9%) | 2.58 |
| Single Male/Father | 95 (6.4%) | 2.12 |
| Single Female/Mother | 175 (11.7%) | 3.13 |
| Total Families | 1,494 (100.0%) | 2.62 |
Median Household Size in Nassau Village Ratliff
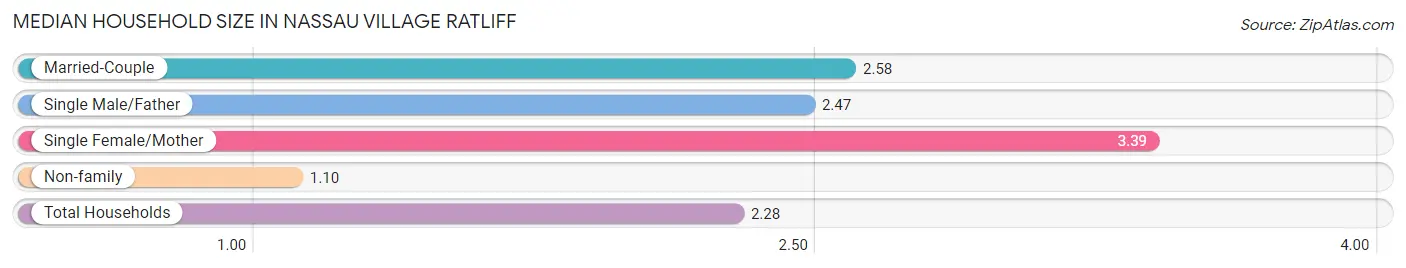
The median household size in Nassau Village Ratliff is 2.28 persons per household, with single female/mother households (175 | 8.8%) accounting for the largest median household size of 3.39 persons per household. non-family households (489 | 24.7%) represent the smallest median household size with 1.10 persons per household.
| Household Type | # Households | Household Size |
| Married-Couple | 1,224 (61.7%) | 2.58 |
| Single Male/Father | 95 (4.8%) | 2.47 |
| Single Female/Mother | 175 (8.8%) | 3.39 |
| Non-family | 489 (24.7%) | 1.10 |
| Total Households | 1,983 (100.0%) | 2.28 |
Household Size by Marriage Status in Nassau Village Ratliff
Out of a total of 1,983 households in Nassau Village Ratliff, 1,494 (75.3%) are family households, while 489 (24.7%) are nonfamily households. The most numerous type of family households are 2-person households, comprising 917, and the most common type of nonfamily households are 1-person households, comprising 449.
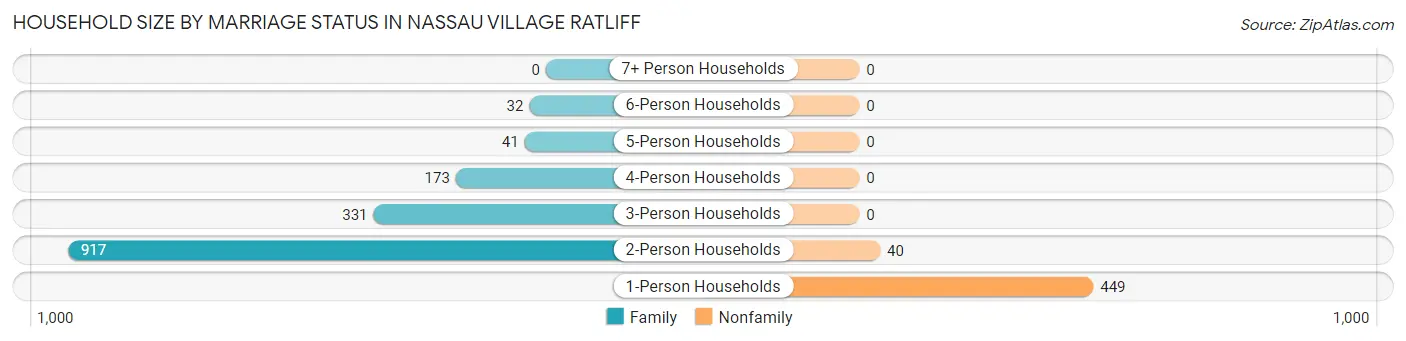
| Household Size | Family Households | Nonfamily Households |
| 1-Person Households | - | 449 (22.6%) |
| 2-Person Households | 917 (46.2%) | 40 (2.0%) |
| 3-Person Households | 331 (16.7%) | 0 (0.0%) |
| 4-Person Households | 173 (8.7%) | 0 (0.0%) |
| 5-Person Households | 41 (2.1%) | 0 (0.0%) |
| 6-Person Households | 32 (1.6%) | 0 (0.0%) |
| 7+ Person Households | 0 (0.0%) | 0 (0.0%) |
| Total | 1,494 (75.3%) | 489 (24.7%) |
Female Fertility in Nassau Village Ratliff
Fertility by Age in Nassau Village Ratliff
Average fertility rate in Nassau Village Ratliff is 24.0 births per 1,000 women. Women in the age bracket of 35 to 50 years have the highest fertility rate with 51.0 births per 1,000 women. Women in the age bracket of 35 to 50 years acount for 100.0% of all women with births.
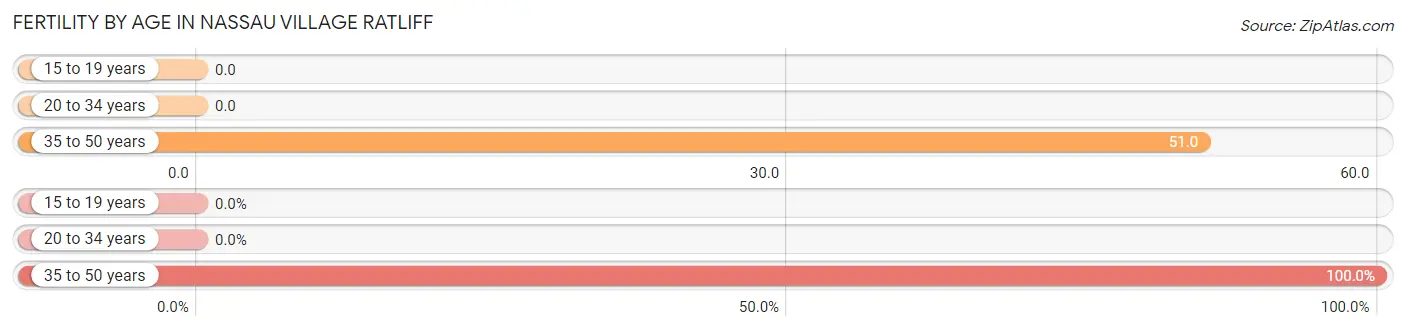
| Age Bracket | Women with Births | Births / 1,000 Women |
| 15 to 19 years | 0 (0.0%) | 0.0 |
| 20 to 34 years | 0 (0.0%) | 0.0 |
| 35 to 50 years | 19 (100.0%) | 51.0 |
| Total | 19 (100.0%) | 24.0 |
Fertility by Age by Marriage Status in Nassau Village Ratliff
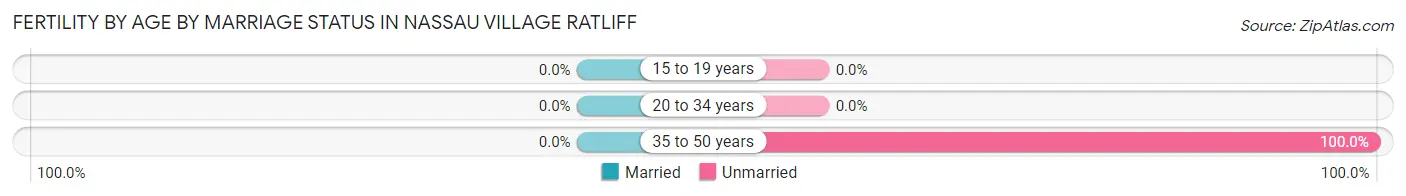
| Age Bracket | Married | Unmarried |
| 15 to 19 years | 0 (0.0%) | 0 (0.0%) |
| 20 to 34 years | 0 (0.0%) | 0 (0.0%) |
| 35 to 50 years | 0 (0.0%) | 19 (100.0%) |
| Total | 0 (0.0%) | 19 (100.0%) |
Fertility by Education in Nassau Village Ratliff
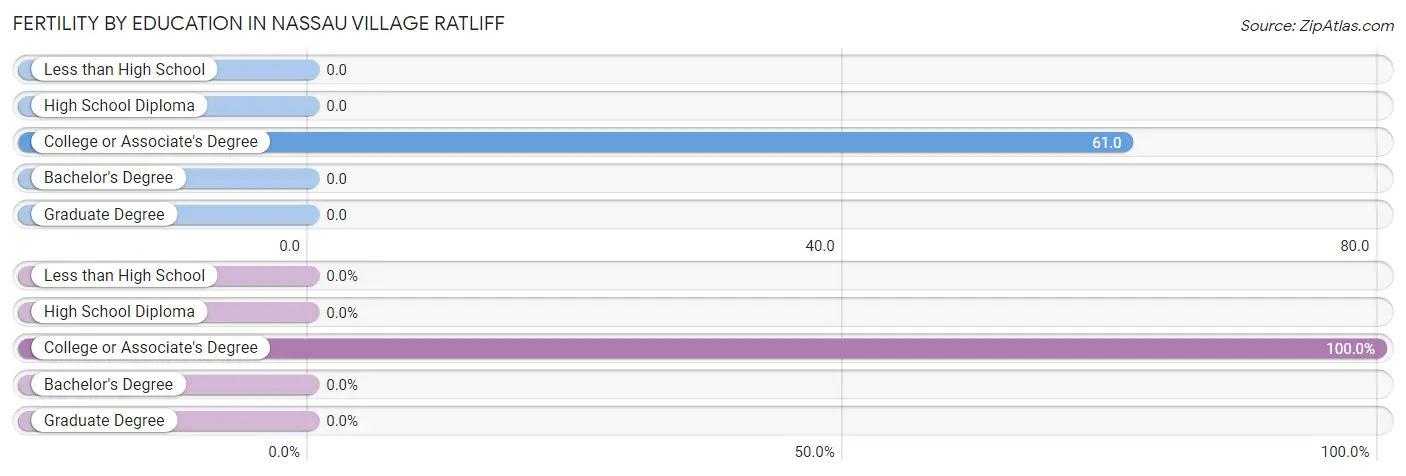
| Educational Attainment | Women with Births | Births / 1,000 Women |
| Less than High School | 0 (0.0%) | 0.0 |
| High School Diploma | 0 (0.0%) | 0.0 |
| College or Associate's Degree | 19 (100.0%) | 61.0 |
| Bachelor's Degree | 0 (0.0%) | 0.0 |
| Graduate Degree | 0 (0.0%) | 0.0 |
| Total | 19 (100.0%) | 24.0 |
Fertility by Education by Marriage Status in Nassau Village Ratliff
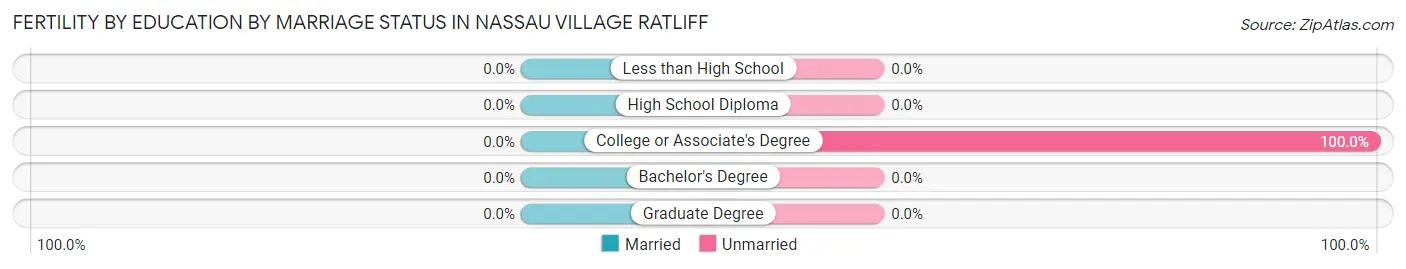
| Educational Attainment | Married | Unmarried |
| Less than High School | 0 (0.0%) | 0 (0.0%) |
| High School Diploma | 0 (0.0%) | 0 (0.0%) |
| College or Associate's Degree | 0 (0.0%) | 19 (100.0%) |
| Bachelor's Degree | 0 (0.0%) | 0 (0.0%) |
| Graduate Degree | 0 (0.0%) | 0 (0.0%) |
| Total | 0 (0.0%) | 19 (100.0%) |
Employment Characteristics in Nassau Village Ratliff
Employment by Class of Employer in Nassau Village Ratliff
Among the 1,588 employed individuals in Nassau Village Ratliff, private company employees (1,097 | 69.1%), local government employees (126 | 7.9%), and self-employed (incorporated) (100 | 6.3%) make up the most common classes of employment.
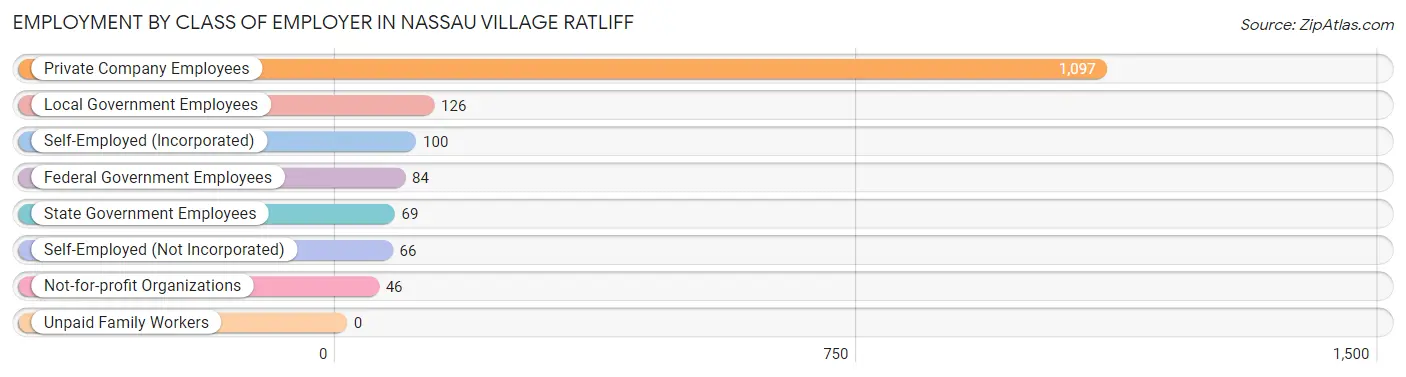
| Employer Class | # Employees | % Employees |
| Private Company Employees | 1,097 | 69.1% |
| Self-Employed (Incorporated) | 100 | 6.3% |
| Self-Employed (Not Incorporated) | 66 | 4.2% |
| Not-for-profit Organizations | 46 | 2.9% |
| Local Government Employees | 126 | 7.9% |
| State Government Employees | 69 | 4.3% |
| Federal Government Employees | 84 | 5.3% |
| Unpaid Family Workers | 0 | 0.0% |
| Total | 1,588 | 100.0% |
Employment Status by Age in Nassau Village Ratliff
According to the labor force statistics for Nassau Village Ratliff, out of the total population over 16 years of age (3,860), 46.2% or 1,783 individuals are in the labor force, with 4.7% or 84 of them unemployed. The age group with the highest labor force participation rate is 35 to 44 years, with 78.6% or 330 individuals in the labor force. Within the labor force, the 55 to 59 years age range has the highest percentage of unemployed individuals, with 19.0% or 55 of them being unemployed.
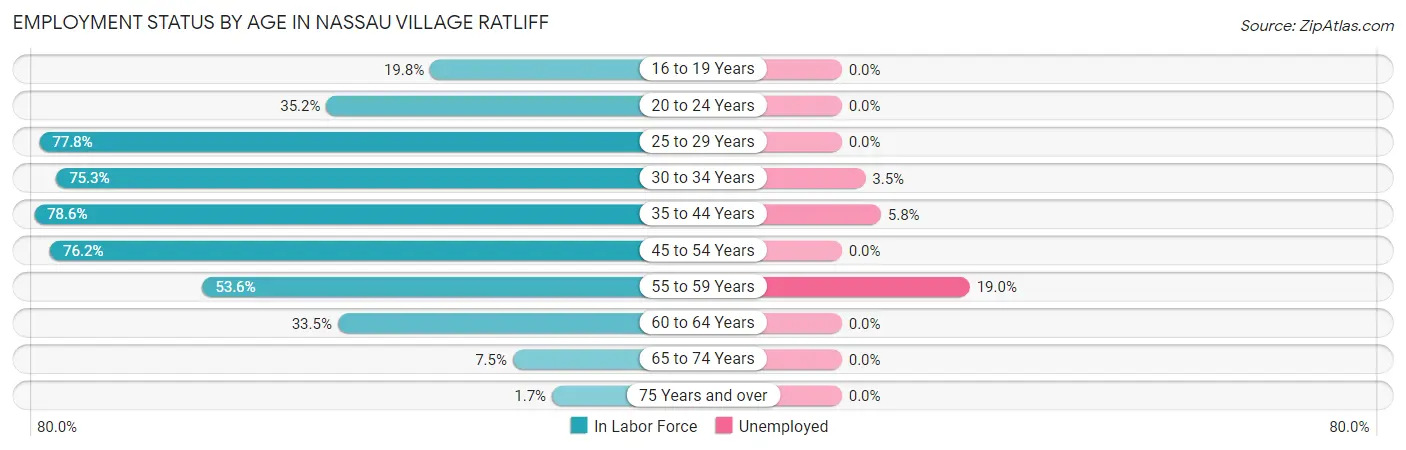
| Age Bracket | In Labor Force | Unemployed |
| 16 to 19 Years | 37 (19.8%) | 0 (0.0%) |
| 20 to 24 Years | 31 (35.2%) | 0 (0.0%) |
| 25 to 29 Years | 186 (77.8%) | 0 (0.0%) |
| 30 to 34 Years | 287 (75.3%) | 10 (3.5%) |
| 35 to 44 Years | 330 (78.6%) | 19 (5.8%) |
| 45 to 54 Years | 496 (76.2%) | 0 (0.0%) |
| 55 to 59 Years | 290 (53.6%) | 55 (19.0%) |
| 60 to 64 Years | 56 (33.5%) | 0 (0.0%) |
| 65 to 74 Years | 67 (7.5%) | 0 (0.0%) |
| 75 Years and over | 5 (1.7%) | 0 (0.0%) |
| Total | 1,783 (46.2%) | 84 (4.7%) |
Employment Status by Educational Attainment in Nassau Village Ratliff
According to labor force statistics for Nassau Village Ratliff, 68.6% of individuals (1,646) out of the total population between 25 and 64 years of age (2,399) are in the labor force, with 5.1% or 84 of them being unemployed. The group with the highest labor force participation rate are those with the educational attainment of bachelor's degree or higher, with 87.1% or 155 individuals in the labor force. Within the labor force, individuals with college / associate degree education have the highest percentage of unemployment, with 11.5% or 84 of them being unemployed.
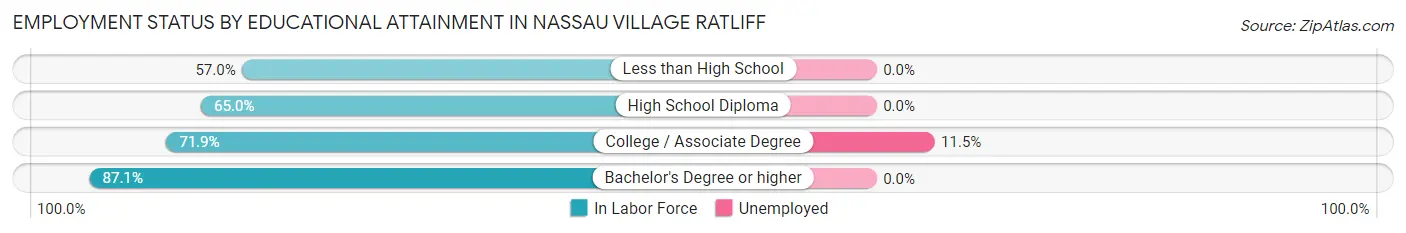
| Educational Attainment | In Labor Force | Unemployed |
| Less than High School | 172 (57.0%) | 0 (0.0%) |
| High School Diploma | 590 (65.0%) | 0 (0.0%) |
| College / Associate Degree | 728 (71.9%) | 116 (11.5%) |
| Bachelor's Degree or higher | 155 (87.1%) | 0 (0.0%) |
| Total | 1,646 (68.6%) | 122 (5.1%) |
Employment Occupations by Sex in Nassau Village Ratliff
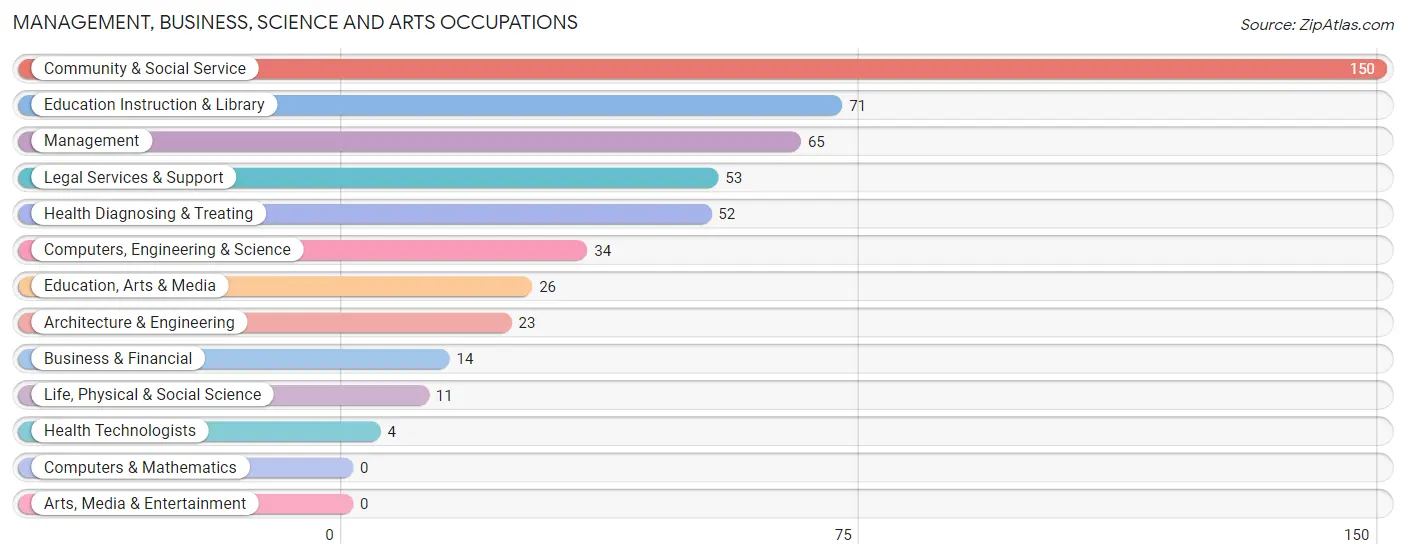
Management, Business, Science and Arts Occupations
The most common Management, Business, Science and Arts occupations in Nassau Village Ratliff are Community & Social Service (150 | 8.8%), Education Instruction & Library (71 | 4.2%), Management (65 | 3.8%), Legal Services & Support (53 | 3.1%), and Health Diagnosing & Treating (52 | 3.1%).
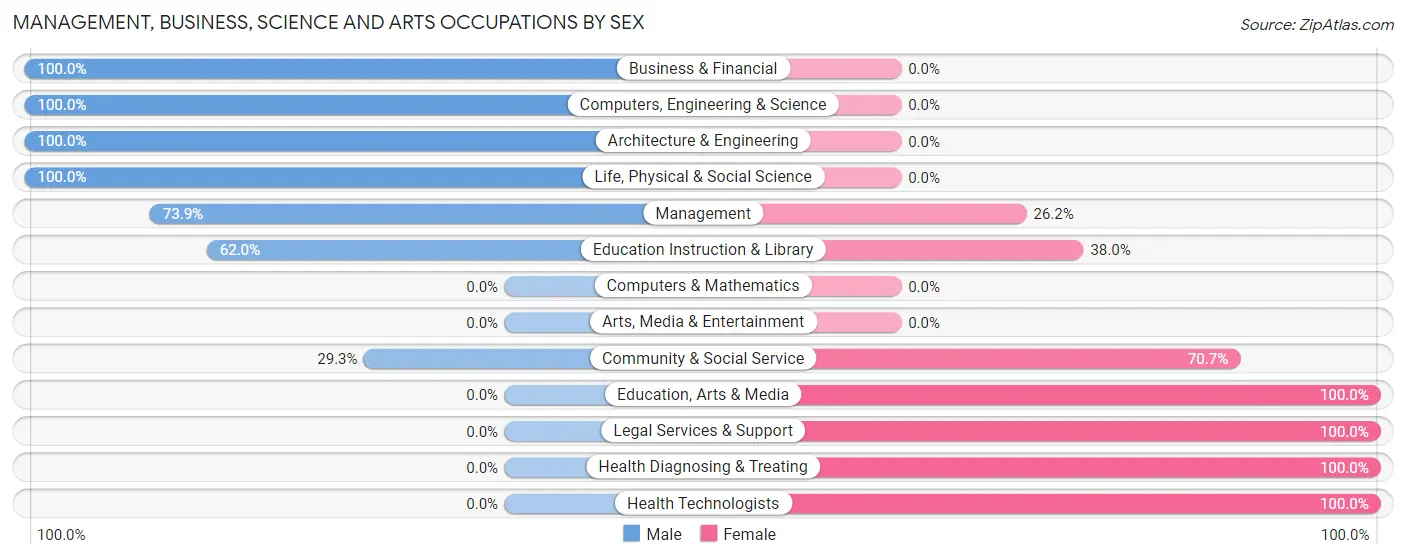
Management, Business, Science and Arts Occupations by Sex
Within the Management, Business, Science and Arts occupations in Nassau Village Ratliff, the most male-oriented occupations are Business & Financial (100.0%), Computers, Engineering & Science (100.0%), and Architecture & Engineering (100.0%), while the most female-oriented occupations are Education, Arts & Media (100.0%), Legal Services & Support (100.0%), and Health Diagnosing & Treating (100.0%).
| Occupation | Male | Female |
| Management | 48 (73.9%) | 17 (26.2%) |
| Business & Financial | 14 (100.0%) | 0 (0.0%) |
| Computers, Engineering & Science | 34 (100.0%) | 0 (0.0%) |
| Computers & Mathematics | 0 (0.0%) | 0 (0.0%) |
| Architecture & Engineering | 23 (100.0%) | 0 (0.0%) |
| Life, Physical & Social Science | 11 (100.0%) | 0 (0.0%) |
| Community & Social Service | 44 (29.3%) | 106 (70.7%) |
| Education, Arts & Media | 0 (0.0%) | 26 (100.0%) |
| Legal Services & Support | 0 (0.0%) | 53 (100.0%) |
| Education Instruction & Library | 44 (62.0%) | 27 (38.0%) |
| Arts, Media & Entertainment | 0 (0.0%) | 0 (0.0%) |
| Health Diagnosing & Treating | 0 (0.0%) | 52 (100.0%) |
| Health Technologists | 0 (0.0%) | 4 (100.0%) |
| Total (Category) | 140 (44.4%) | 175 (55.6%) |
| Total (Overall) | 1,104 (64.9%) | 597 (35.1%) |
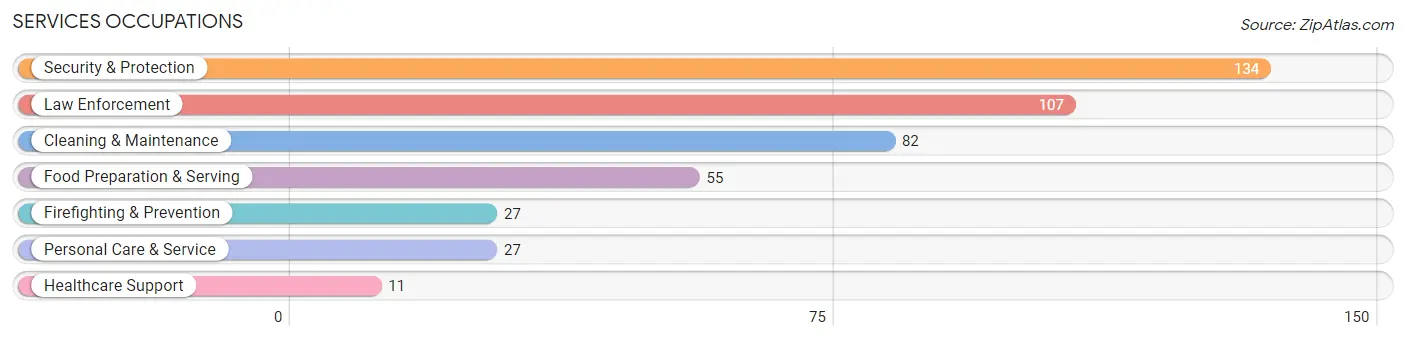
Services Occupations
The most common Services occupations in Nassau Village Ratliff are Security & Protection (134 | 7.9%), Law Enforcement (107 | 6.3%), Cleaning & Maintenance (82 | 4.8%), Food Preparation & Serving (55 | 3.2%), and Firefighting & Prevention (27 | 1.6%).
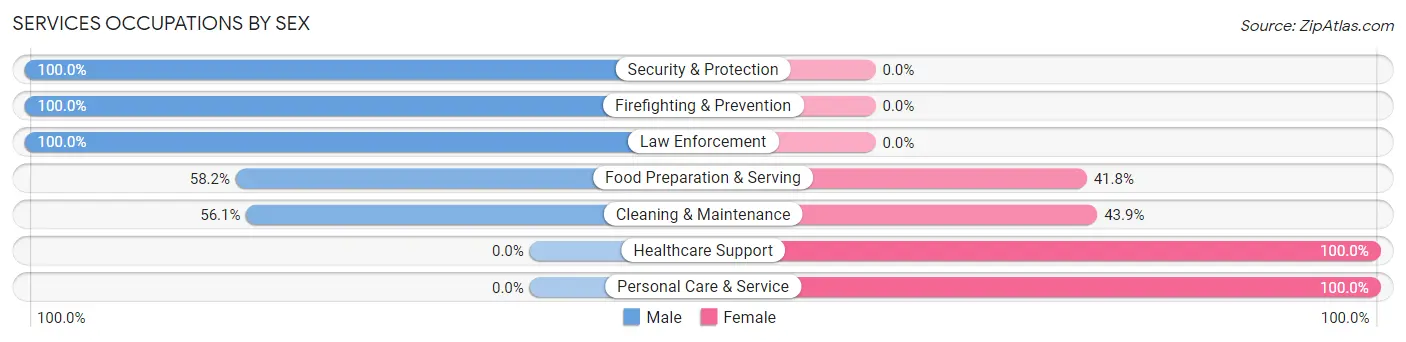
Services Occupations by Sex
Within the Services occupations in Nassau Village Ratliff, the most male-oriented occupations are Security & Protection (100.0%), Firefighting & Prevention (100.0%), and Law Enforcement (100.0%), while the most female-oriented occupations are Healthcare Support (100.0%), Personal Care & Service (100.0%), and Cleaning & Maintenance (43.9%).
| Occupation | Male | Female |
| Healthcare Support | 0 (0.0%) | 11 (100.0%) |
| Security & Protection | 134 (100.0%) | 0 (0.0%) |
| Firefighting & Prevention | 27 (100.0%) | 0 (0.0%) |
| Law Enforcement | 107 (100.0%) | 0 (0.0%) |
| Food Preparation & Serving | 32 (58.2%) | 23 (41.8%) |
| Cleaning & Maintenance | 46 (56.1%) | 36 (43.9%) |
| Personal Care & Service | 0 (0.0%) | 27 (100.0%) |
| Total (Category) | 212 (68.6%) | 97 (31.4%) |
| Total (Overall) | 1,104 (64.9%) | 597 (35.1%) |
Sales and Office Occupations
The most common Sales and Office occupations in Nassau Village Ratliff are Sales & Related (269 | 15.8%), and Office & Administration (237 | 13.9%).
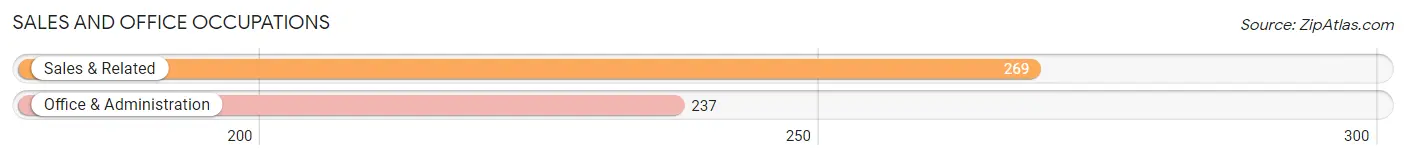
Sales and Office Occupations by Sex
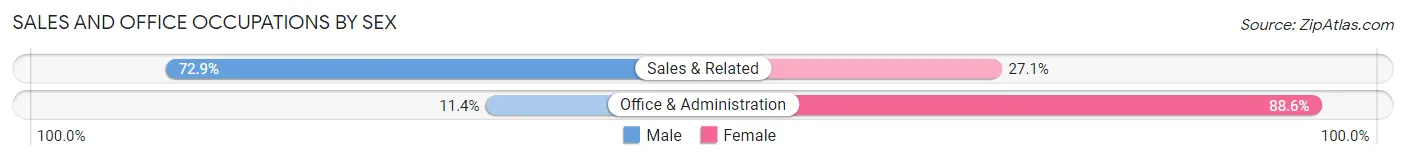
| Occupation | Male | Female |
| Sales & Related | 196 (72.9%) | 73 (27.1%) |
| Office & Administration | 27 (11.4%) | 210 (88.6%) |
| Total (Category) | 223 (44.1%) | 283 (55.9%) |
| Total (Overall) | 1,104 (64.9%) | 597 (35.1%) |
Natural Resources, Construction and Maintenance Occupations
The most common Natural Resources, Construction and Maintenance occupations in Nassau Village Ratliff are Installation, Maintenance & Repair (175 | 10.3%), and Construction & Extraction (158 | 9.3%).
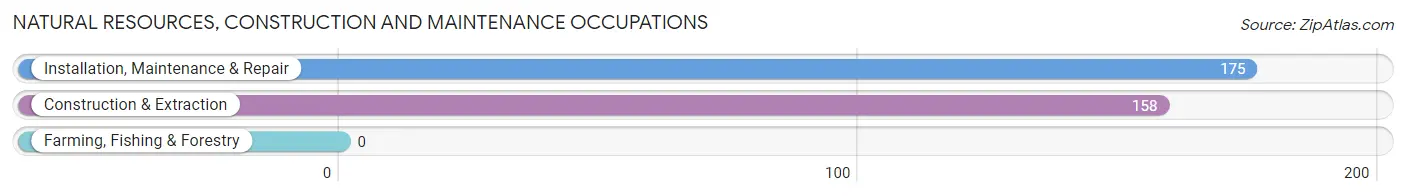
Natural Resources, Construction and Maintenance Occupations by Sex
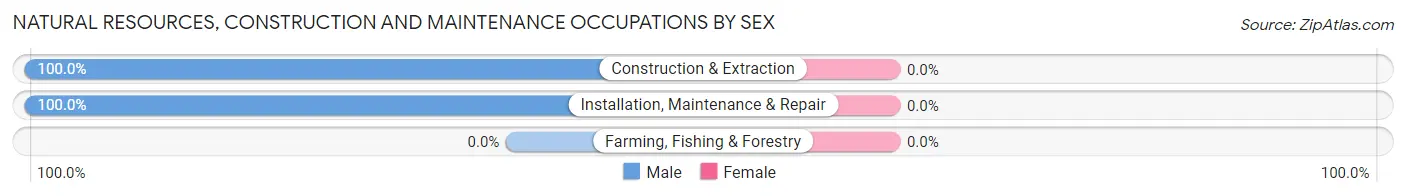
| Occupation | Male | Female |
| Farming, Fishing & Forestry | 0 (0.0%) | 0 (0.0%) |
| Construction & Extraction | 158 (100.0%) | 0 (0.0%) |
| Installation, Maintenance & Repair | 175 (100.0%) | 0 (0.0%) |
| Total (Category) | 333 (100.0%) | 0 (0.0%) |
| Total (Overall) | 1,104 (64.9%) | 597 (35.1%) |
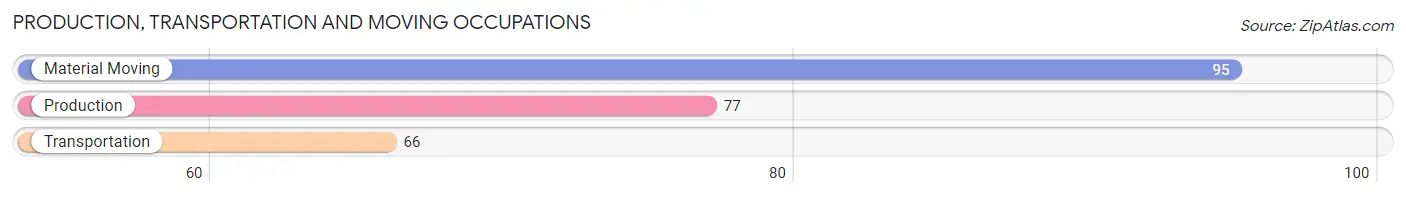
Production, Transportation and Moving Occupations
The most common Production, Transportation and Moving occupations in Nassau Village Ratliff are Material Moving (95 | 5.6%), Production (77 | 4.5%), and Transportation (66 | 3.9%).
Production, Transportation and Moving Occupations by Sex
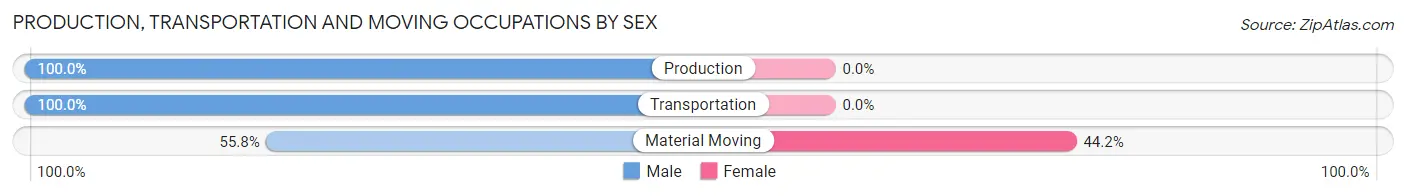
| Occupation | Male | Female |
| Production | 77 (100.0%) | 0 (0.0%) |
| Transportation | 66 (100.0%) | 0 (0.0%) |
| Material Moving | 53 (55.8%) | 42 (44.2%) |
| Total (Category) | 196 (82.4%) | 42 (17.6%) |
| Total (Overall) | 1,104 (64.9%) | 597 (35.1%) |
Employment Industries by Sex in Nassau Village Ratliff
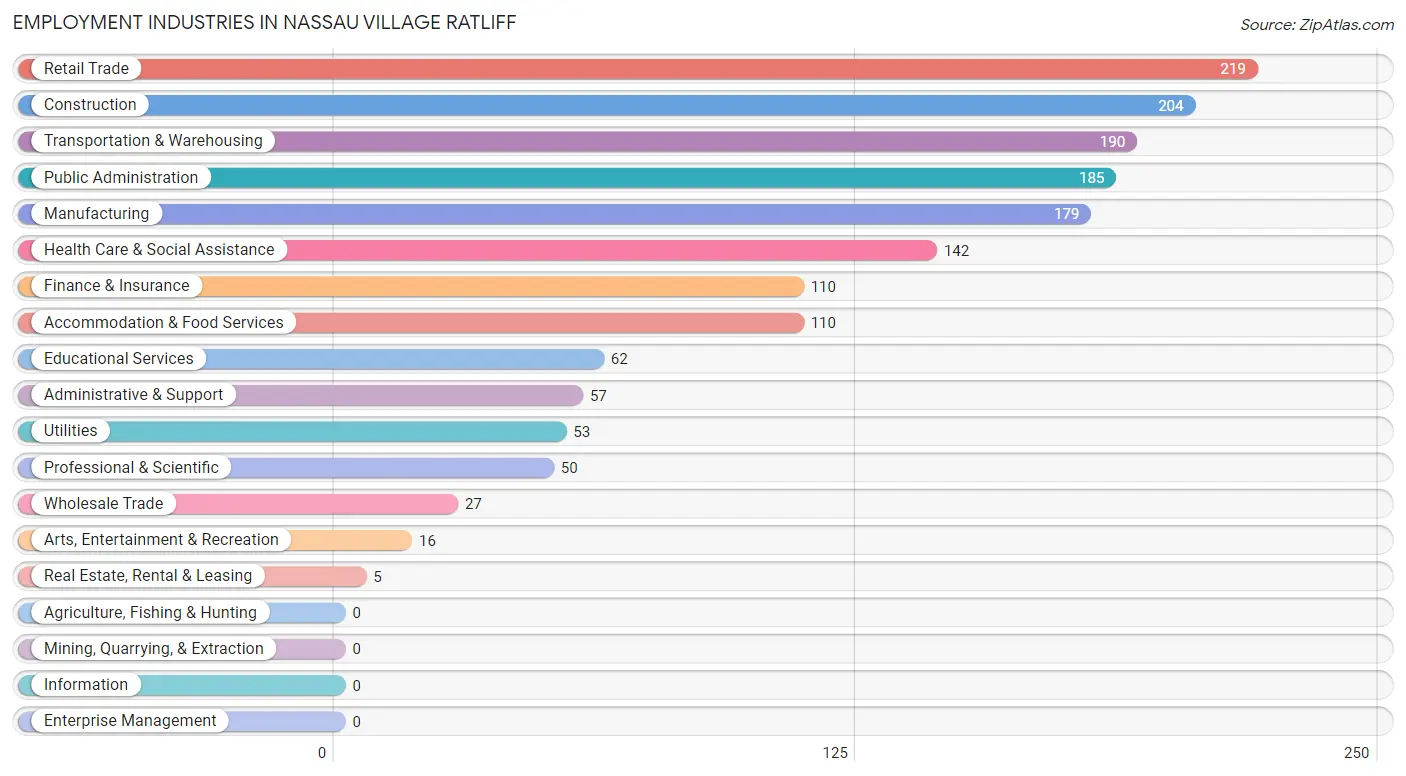
Employment Industries in Nassau Village Ratliff
The major employment industries in Nassau Village Ratliff include Retail Trade (219 | 12.9%), Construction (204 | 12.0%), Transportation & Warehousing (190 | 11.2%), Public Administration (185 | 10.9%), and Manufacturing (179 | 10.5%).
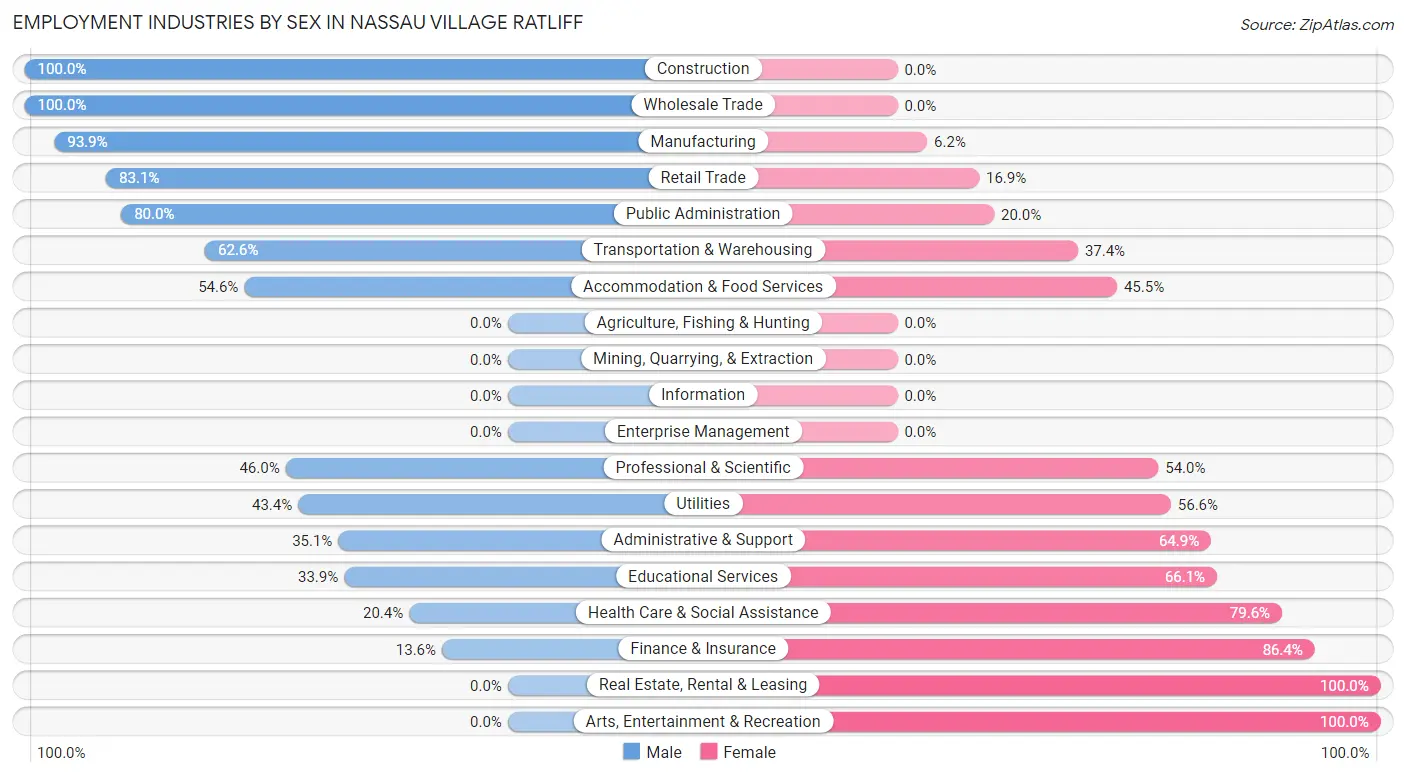
Employment Industries by Sex in Nassau Village Ratliff
The Nassau Village Ratliff industries that see more men than women are Construction (100.0%), Wholesale Trade (100.0%), and Manufacturing (93.9%), whereas the industries that tend to have a higher number of women are Real Estate, Rental & Leasing (100.0%), Arts, Entertainment & Recreation (100.0%), and Finance & Insurance (86.4%).
| Industry | Male | Female |
| Agriculture, Fishing & Hunting | 0 (0.0%) | 0 (0.0%) |
| Mining, Quarrying, & Extraction | 0 (0.0%) | 0 (0.0%) |
| Construction | 204 (100.0%) | 0 (0.0%) |
| Manufacturing | 168 (93.9%) | 11 (6.1%) |
| Wholesale Trade | 27 (100.0%) | 0 (0.0%) |
| Retail Trade | 182 (83.1%) | 37 (16.9%) |
| Transportation & Warehousing | 119 (62.6%) | 71 (37.4%) |
| Utilities | 23 (43.4%) | 30 (56.6%) |
| Information | 0 (0.0%) | 0 (0.0%) |
| Finance & Insurance | 15 (13.6%) | 95 (86.4%) |
| Real Estate, Rental & Leasing | 0 (0.0%) | 5 (100.0%) |
| Professional & Scientific | 23 (46.0%) | 27 (54.0%) |
| Enterprise Management | 0 (0.0%) | 0 (0.0%) |
| Administrative & Support | 20 (35.1%) | 37 (64.9%) |
| Educational Services | 21 (33.9%) | 41 (66.1%) |
| Health Care & Social Assistance | 29 (20.4%) | 113 (79.6%) |
| Arts, Entertainment & Recreation | 0 (0.0%) | 16 (100.0%) |
| Accommodation & Food Services | 60 (54.5%) | 50 (45.5%) |
| Public Administration | 148 (80.0%) | 37 (20.0%) |
| Total | 1,104 (64.9%) | 597 (35.1%) |
Education in Nassau Village Ratliff
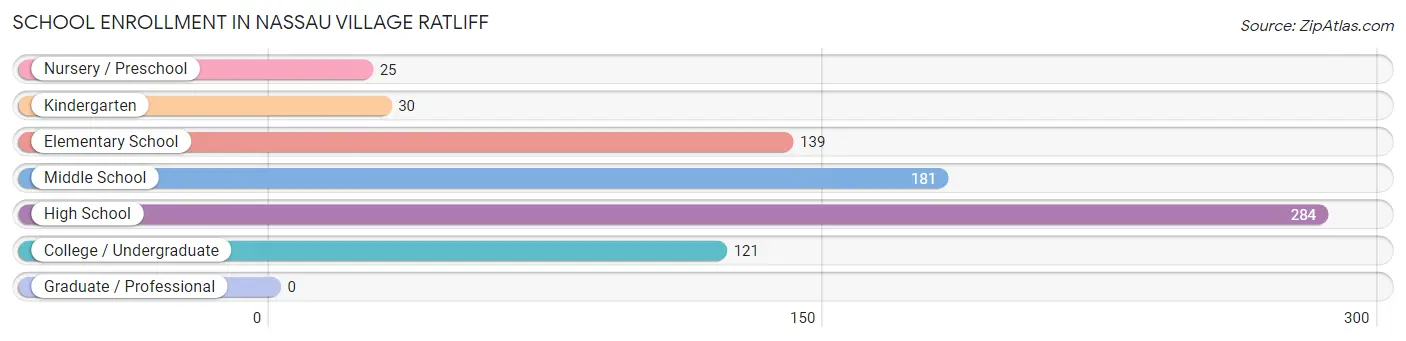
School Enrollment in Nassau Village Ratliff
The most common levels of schooling among the 780 students in Nassau Village Ratliff are high school (284 | 36.4%), middle school (181 | 23.2%), and elementary school (139 | 17.8%).
| School Level | # Students | % Students |
| Nursery / Preschool | 25 | 3.2% |
| Kindergarten | 30 | 3.8% |
| Elementary School | 139 | 17.8% |
| Middle School | 181 | 23.2% |
| High School | 284 | 36.4% |
| College / Undergraduate | 121 | 15.5% |
| Graduate / Professional | 0 | 0.0% |
| Total | 780 | 100.0% |
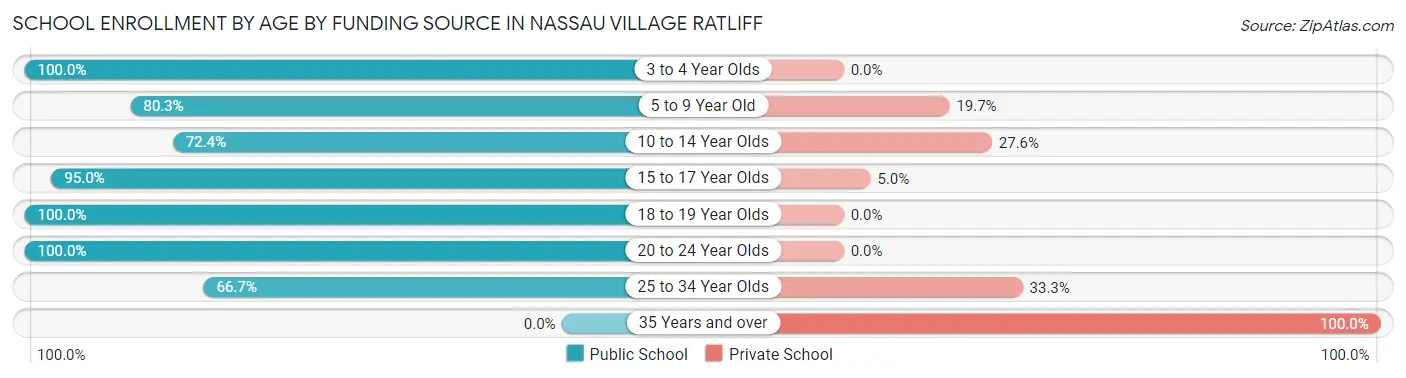
School Enrollment by Age by Funding Source in Nassau Village Ratliff
Out of a total of 780 students who are enrolled in schools in Nassau Village Ratliff, 117 (15.0%) attend a private institution, while the remaining 663 (85.0%) are enrolled in public schools. The age group of 35 years and over has the highest likelihood of being enrolled in private schools, with 8 (100.0% in the age bracket) enrolled. Conversely, the age group of 3 to 4 year olds has the lowest likelihood of being enrolled in a private school, with 22 (100.0% in the age bracket) attending a public institution.
| Age Bracket | Public School | Private School |
| 3 to 4 Year Olds | 22 (100.0%) | 0 (0.0%) |
| 5 to 9 Year Old | 106 (80.3%) | 26 (19.7%) |
| 10 to 14 Year Olds | 160 (72.4%) | 61 (27.6%) |
| 15 to 17 Year Olds | 133 (95.0%) | 7 (5.0%) |
| 18 to 19 Year Olds | 144 (100.0%) | 0 (0.0%) |
| 20 to 24 Year Olds | 68 (100.0%) | 0 (0.0%) |
| 25 to 34 Year Olds | 30 (66.7%) | 15 (33.3%) |
| 35 Years and over | 0 (0.0%) | 8 (100.0%) |
| Total | 663 (85.0%) | 117 (15.0%) |
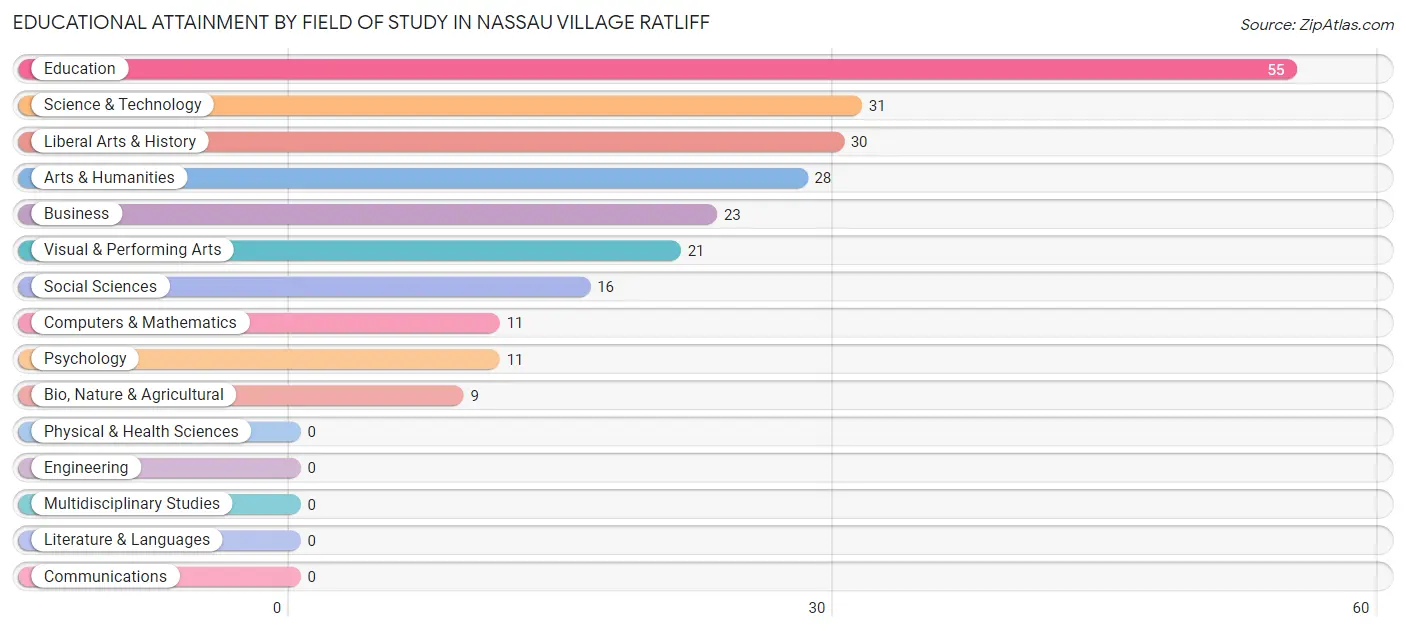
Educational Attainment by Field of Study in Nassau Village Ratliff
Education (55 | 23.4%), science & technology (31 | 13.2%), liberal arts & history (30 | 12.8%), arts & humanities (28 | 11.9%), and business (23 | 9.8%) are the most common fields of study among 235 individuals in Nassau Village Ratliff who have obtained a bachelor's degree or higher.
| Field of Study | # Graduates | % Graduates |
| Computers & Mathematics | 11 | 4.7% |
| Bio, Nature & Agricultural | 9 | 3.8% |
| Physical & Health Sciences | 0 | 0.0% |
| Psychology | 11 | 4.7% |
| Social Sciences | 16 | 6.8% |
| Engineering | 0 | 0.0% |
| Multidisciplinary Studies | 0 | 0.0% |
| Science & Technology | 31 | 13.2% |
| Business | 23 | 9.8% |
| Education | 55 | 23.4% |
| Literature & Languages | 0 | 0.0% |
| Liberal Arts & History | 30 | 12.8% |
| Visual & Performing Arts | 21 | 8.9% |
| Communications | 0 | 0.0% |
| Arts & Humanities | 28 | 11.9% |
| Total | 235 | 100.0% |
Transportation & Commute in Nassau Village Ratliff
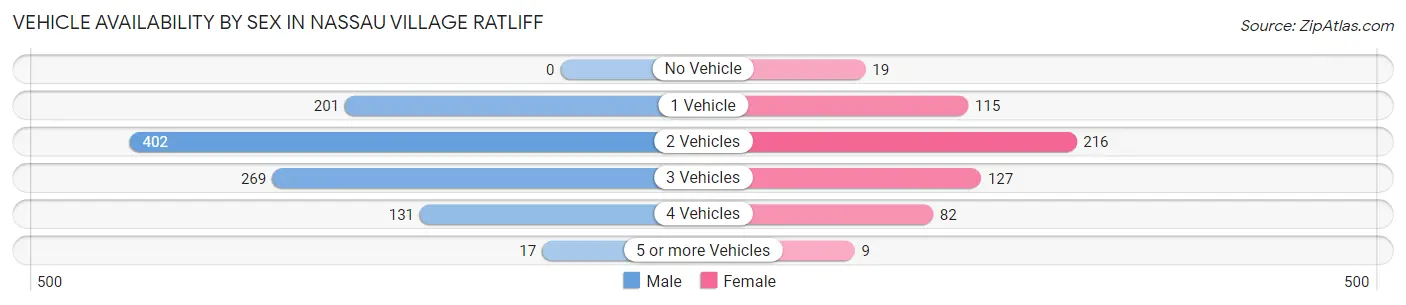
Vehicle Availability by Sex in Nassau Village Ratliff
The most prevalent vehicle ownership categories in Nassau Village Ratliff are males with 2 vehicles (402, accounting for 39.4%) and females with 2 vehicles (216, making up 70.8%).
| Vehicles Available | Male | Female |
| No Vehicle | 0 (0.0%) | 19 (3.4%) |
| 1 Vehicle | 201 (19.7%) | 115 (20.3%) |
| 2 Vehicles | 402 (39.4%) | 216 (38.0%) |
| 3 Vehicles | 269 (26.4%) | 127 (22.4%) |
| 4 Vehicles | 131 (12.8%) | 82 (14.4%) |
| 5 or more Vehicles | 17 (1.7%) | 9 (1.6%) |
| Total | 1,020 (100.0%) | 568 (100.0%) |
Commute Time in Nassau Village Ratliff
The most frequently occuring commute durations in Nassau Village Ratliff are 30 to 34 minutes (400 commuters, 26.7%), 45 to 59 minutes (285 commuters, 19.0%), and 20 to 24 minutes (249 commuters, 16.6%).
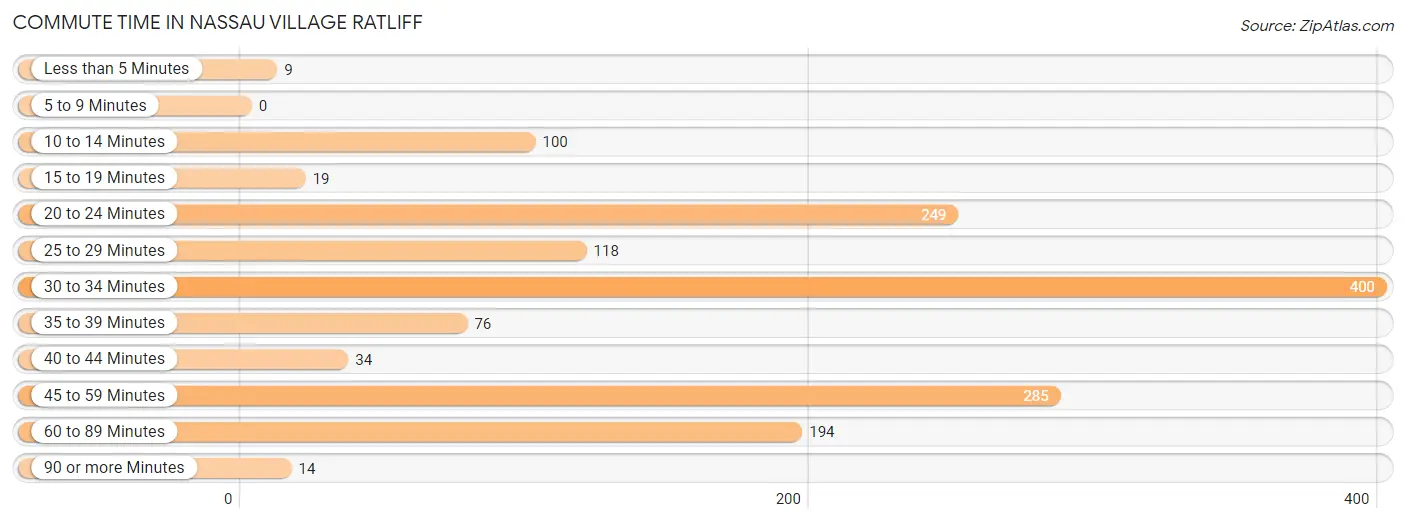
| Commute Time | # Commuters | % Commuters |
| Less than 5 Minutes | 9 | 0.6% |
| 5 to 9 Minutes | 0 | 0.0% |
| 10 to 14 Minutes | 100 | 6.7% |
| 15 to 19 Minutes | 19 | 1.3% |
| 20 to 24 Minutes | 249 | 16.6% |
| 25 to 29 Minutes | 118 | 7.9% |
| 30 to 34 Minutes | 400 | 26.7% |
| 35 to 39 Minutes | 76 | 5.1% |
| 40 to 44 Minutes | 34 | 2.3% |
| 45 to 59 Minutes | 285 | 19.0% |
| 60 to 89 Minutes | 194 | 13.0% |
| 90 or more Minutes | 14 | 0.9% |
Commute Time by Sex in Nassau Village Ratliff
The most common commute times in Nassau Village Ratliff are 30 to 34 minutes (270 commuters, 26.6%) for males and 30 to 34 minutes (130 commuters, 26.9%) for females.
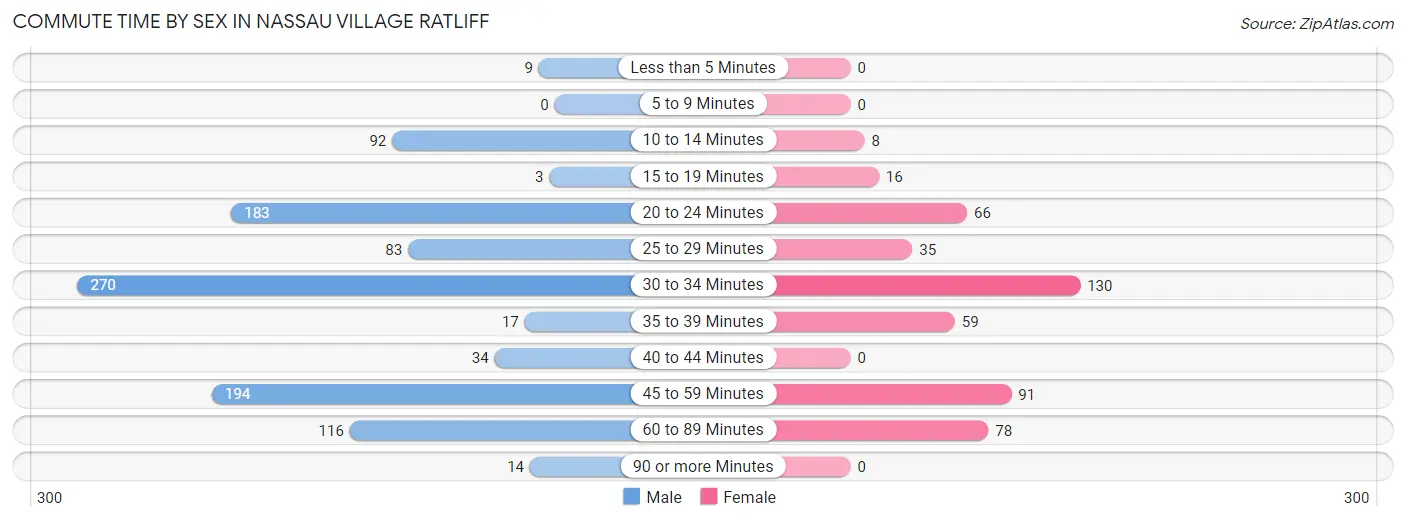
| Commute Time | Male | Female |
| Less than 5 Minutes | 9 (0.9%) | 0 (0.0%) |
| 5 to 9 Minutes | 0 (0.0%) | 0 (0.0%) |
| 10 to 14 Minutes | 92 (9.1%) | 8 (1.7%) |
| 15 to 19 Minutes | 3 (0.3%) | 16 (3.3%) |
| 20 to 24 Minutes | 183 (18.0%) | 66 (13.7%) |
| 25 to 29 Minutes | 83 (8.2%) | 35 (7.2%) |
| 30 to 34 Minutes | 270 (26.6%) | 130 (26.9%) |
| 35 to 39 Minutes | 17 (1.7%) | 59 (12.2%) |
| 40 to 44 Minutes | 34 (3.4%) | 0 (0.0%) |
| 45 to 59 Minutes | 194 (19.1%) | 91 (18.8%) |
| 60 to 89 Minutes | 116 (11.4%) | 78 (16.2%) |
| 90 or more Minutes | 14 (1.4%) | 0 (0.0%) |
Time of Departure to Work by Sex in Nassau Village Ratliff
The most frequent times of departure to work in Nassau Village Ratliff are 5:30 AM to 5:59 AM (209, 20.6%) for males and 12:00 PM to 3:59 PM (90, 18.6%) for females.
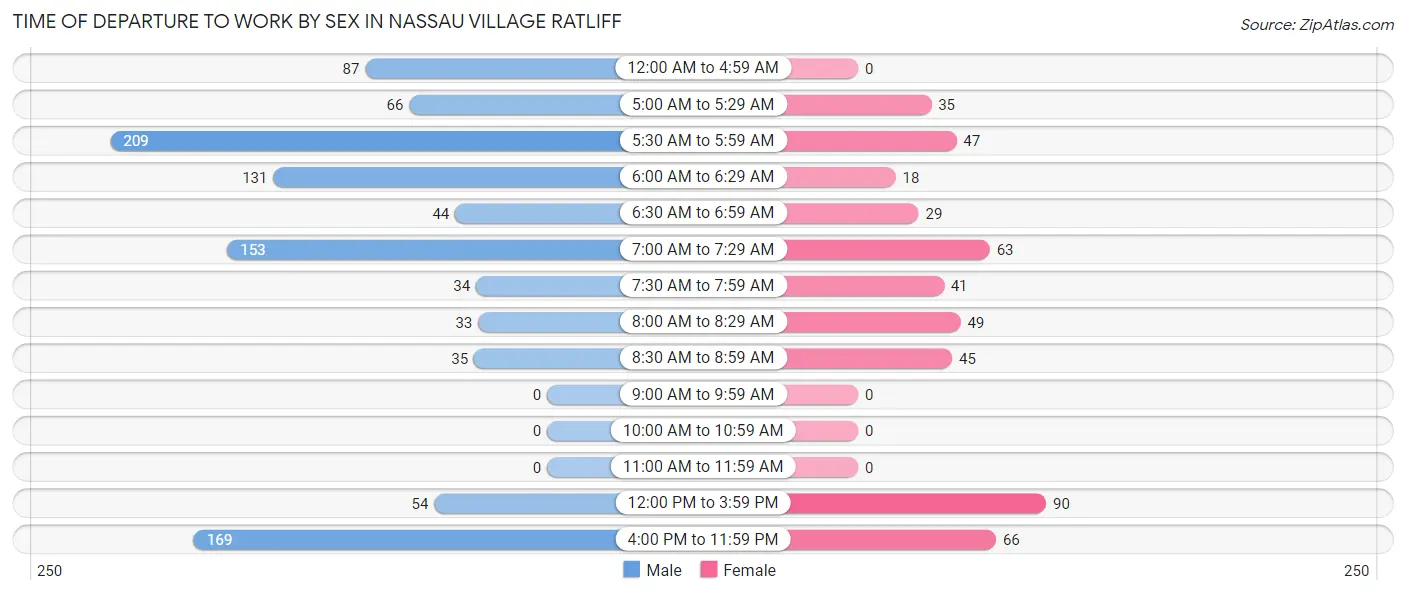
| Time of Departure | Male | Female |
| 12:00 AM to 4:59 AM | 87 (8.6%) | 0 (0.0%) |
| 5:00 AM to 5:29 AM | 66 (6.5%) | 35 (7.2%) |
| 5:30 AM to 5:59 AM | 209 (20.6%) | 47 (9.7%) |
| 6:00 AM to 6:29 AM | 131 (12.9%) | 18 (3.7%) |
| 6:30 AM to 6:59 AM | 44 (4.3%) | 29 (6.0%) |
| 7:00 AM to 7:29 AM | 153 (15.1%) | 63 (13.0%) |
| 7:30 AM to 7:59 AM | 34 (3.4%) | 41 (8.5%) |
| 8:00 AM to 8:29 AM | 33 (3.3%) | 49 (10.1%) |
| 8:30 AM to 8:59 AM | 35 (3.5%) | 45 (9.3%) |
| 9:00 AM to 9:59 AM | 0 (0.0%) | 0 (0.0%) |
| 10:00 AM to 10:59 AM | 0 (0.0%) | 0 (0.0%) |
| 11:00 AM to 11:59 AM | 0 (0.0%) | 0 (0.0%) |
| 12:00 PM to 3:59 PM | 54 (5.3%) | 90 (18.6%) |
| 4:00 PM to 11:59 PM | 169 (16.7%) | 66 (13.7%) |
| Total | 1,015 (100.0%) | 483 (100.0%) |
Housing Occupancy in Nassau Village Ratliff
Occupancy by Ownership in Nassau Village Ratliff
Of the total 1,983 dwellings in Nassau Village Ratliff, owner-occupied units account for 1,588 (80.1%), while renter-occupied units make up 395 (19.9%).
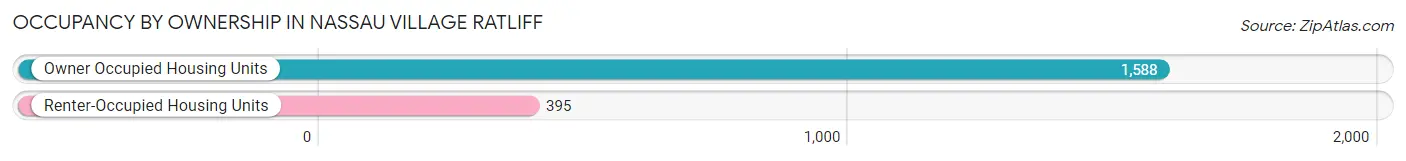
| Occupancy | # Housing Units | % Housing Units |
| Owner Occupied Housing Units | 1,588 | 80.1% |
| Renter-Occupied Housing Units | 395 | 19.9% |
| Total Occupied Housing Units | 1,983 | 100.0% |
Occupancy by Household Size in Nassau Village Ratliff
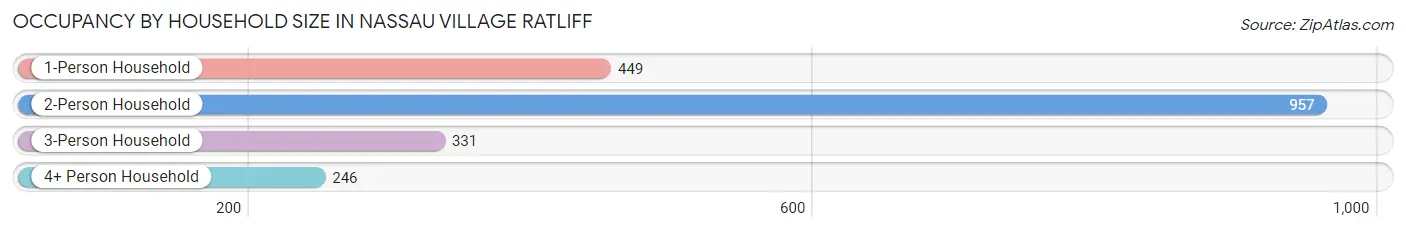
| Household Size | # Housing Units | % Housing Units |
| 1-Person Household | 449 | 22.6% |
| 2-Person Household | 957 | 48.3% |
| 3-Person Household | 331 | 16.7% |
| 4+ Person Household | 246 | 12.4% |
| Total Housing Units | 1,983 | 100.0% |
Occupancy by Ownership by Household Size in Nassau Village Ratliff
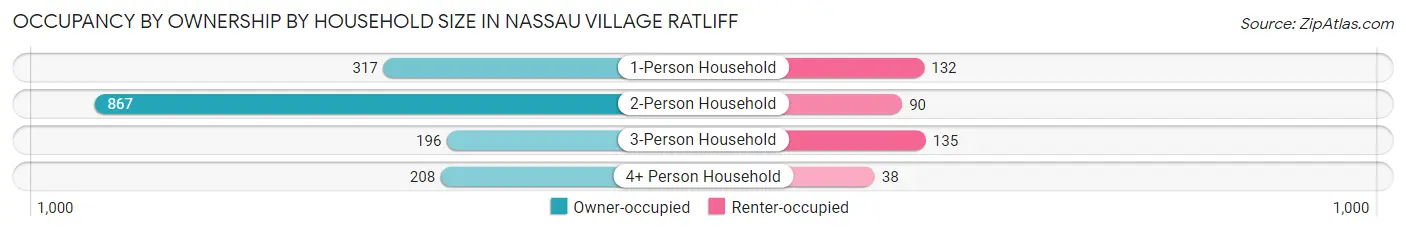
| Household Size | Owner-occupied | Renter-occupied |
| 1-Person Household | 317 (70.6%) | 132 (29.4%) |
| 2-Person Household | 867 (90.6%) | 90 (9.4%) |
| 3-Person Household | 196 (59.2%) | 135 (40.8%) |
| 4+ Person Household | 208 (84.6%) | 38 (15.4%) |
| Total Housing Units | 1,588 (80.1%) | 395 (19.9%) |
Occupancy by Educational Attainment in Nassau Village Ratliff
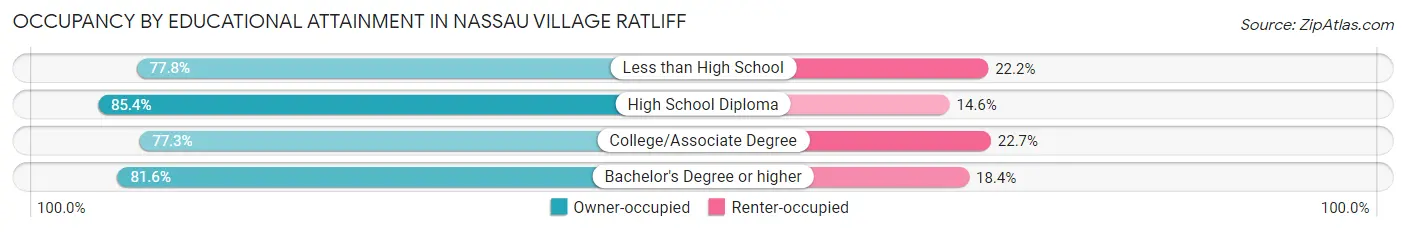
| Household Size | Owner-occupied | Renter-occupied |
| Less than High School | 322 (77.8%) | 92 (22.2%) |
| High School Diploma | 493 (85.4%) | 84 (14.6%) |
| College/Associate Degree | 649 (77.3%) | 191 (22.7%) |
| Bachelor's Degree or higher | 124 (81.6%) | 28 (18.4%) |
Occupancy by Age of Householder in Nassau Village Ratliff
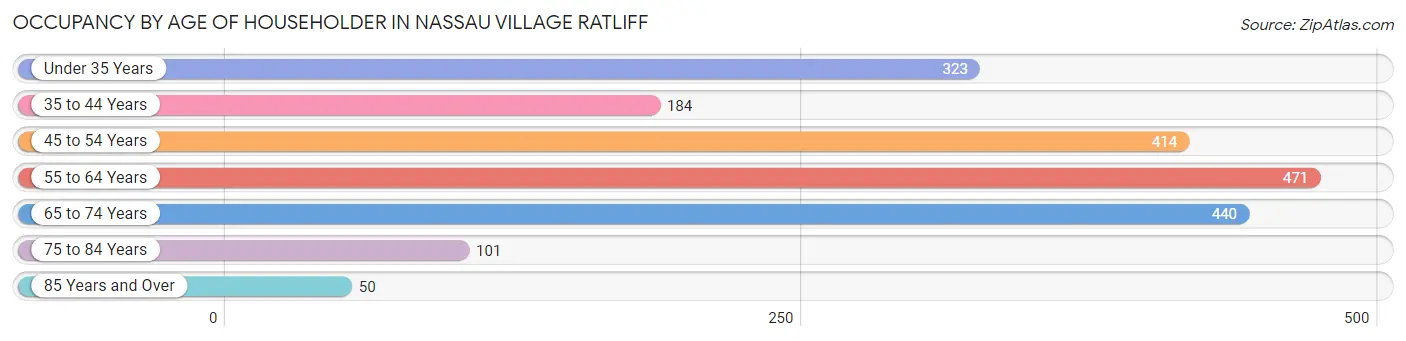
| Age Bracket | # Households | % Households |
| Under 35 Years | 323 | 16.3% |
| 35 to 44 Years | 184 | 9.3% |
| 45 to 54 Years | 414 | 20.9% |
| 55 to 64 Years | 471 | 23.7% |
| 65 to 74 Years | 440 | 22.2% |
| 75 to 84 Years | 101 | 5.1% |
| 85 Years and Over | 50 | 2.5% |
| Total | 1,983 | 100.0% |
Housing Finances in Nassau Village Ratliff
Median Income by Occupancy in Nassau Village Ratliff
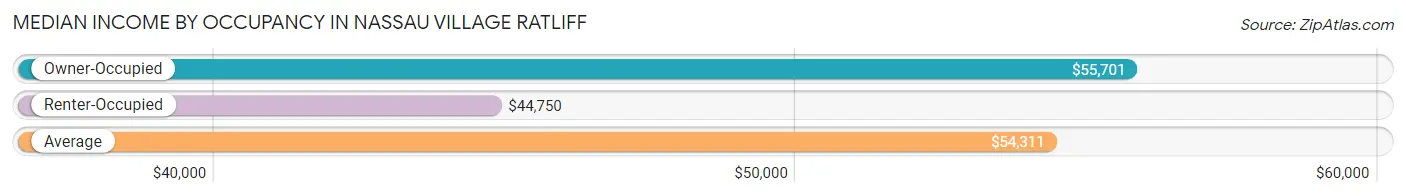
| Occupancy Type | # Households | Median Income |
| Owner-Occupied | 1,588 (80.1%) | $55,701 |
| Renter-Occupied | 395 (19.9%) | $44,750 |
| Average | 1,983 (100.0%) | $54,311 |
Occupancy by Householder Income Bracket in Nassau Village Ratliff
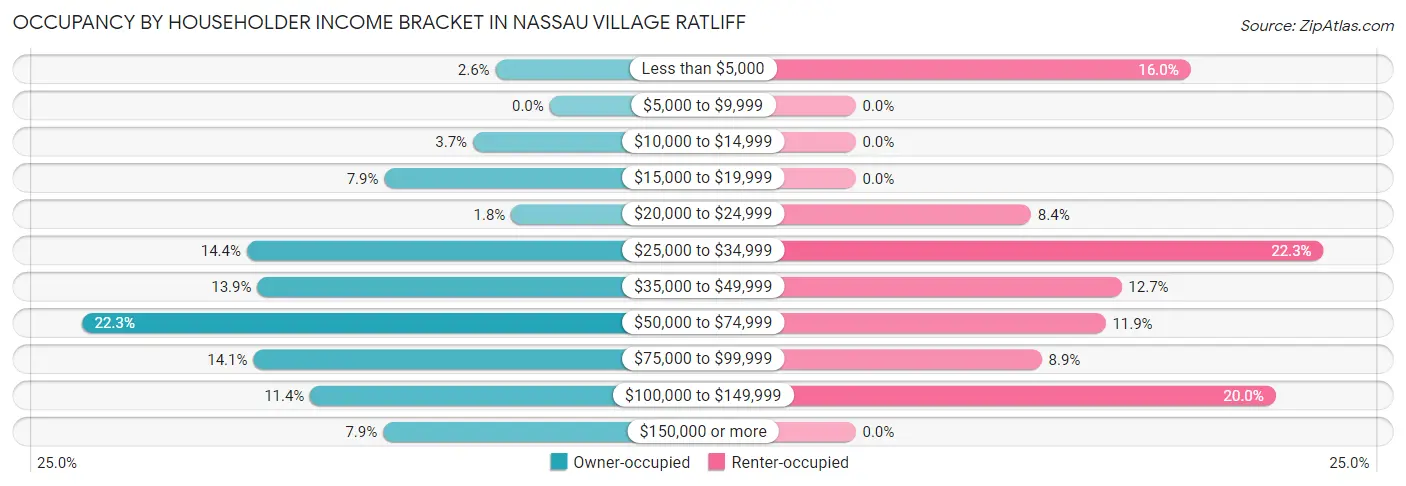
| Income Bracket | Owner-occupied | Renter-occupied |
| Less than $5,000 | 41 (2.6%) | 63 (16.0%) |
| $5,000 to $9,999 | 0 (0.0%) | 0 (0.0%) |
| $10,000 to $14,999 | 58 (3.6%) | 0 (0.0%) |
| $15,000 to $19,999 | 125 (7.9%) | 0 (0.0%) |
| $20,000 to $24,999 | 29 (1.8%) | 33 (8.4%) |
| $25,000 to $34,999 | 229 (14.4%) | 88 (22.3%) |
| $35,000 to $49,999 | 221 (13.9%) | 50 (12.7%) |
| $50,000 to $74,999 | 354 (22.3%) | 47 (11.9%) |
| $75,000 to $99,999 | 224 (14.1%) | 35 (8.9%) |
| $100,000 to $149,999 | 181 (11.4%) | 79 (20.0%) |
| $150,000 or more | 126 (7.9%) | 0 (0.0%) |
| Total | 1,588 (100.0%) | 395 (100.0%) |
Monthly Housing Cost Tiers in Nassau Village Ratliff
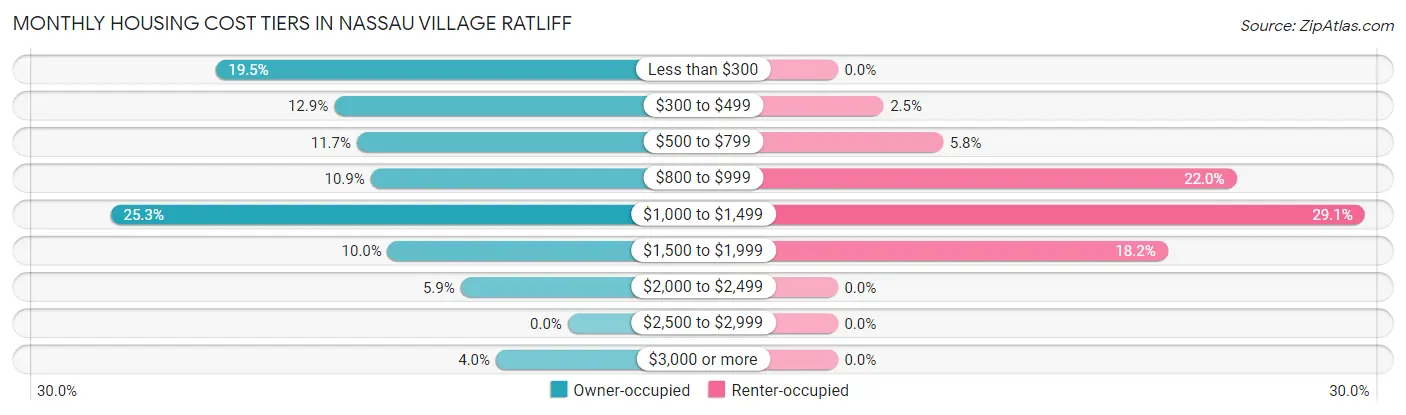
| Monthly Cost | Owner-occupied | Renter-occupied |
| Less than $300 | 309 (19.5%) | 0 (0.0%) |
| $300 to $499 | 205 (12.9%) | 10 (2.5%) |
| $500 to $799 | 185 (11.7%) | 23 (5.8%) |
| $800 to $999 | 173 (10.9%) | 87 (22.0%) |
| $1,000 to $1,499 | 401 (25.3%) | 115 (29.1%) |
| $1,500 to $1,999 | 158 (10.0%) | 72 (18.2%) |
| $2,000 to $2,499 | 94 (5.9%) | 0 (0.0%) |
| $2,500 to $2,999 | 0 (0.0%) | 0 (0.0%) |
| $3,000 or more | 63 (4.0%) | 0 (0.0%) |
| Total | 1,588 (100.0%) | 395 (100.0%) |
Physical Housing Characteristics in Nassau Village Ratliff
Housing Structures in Nassau Village Ratliff
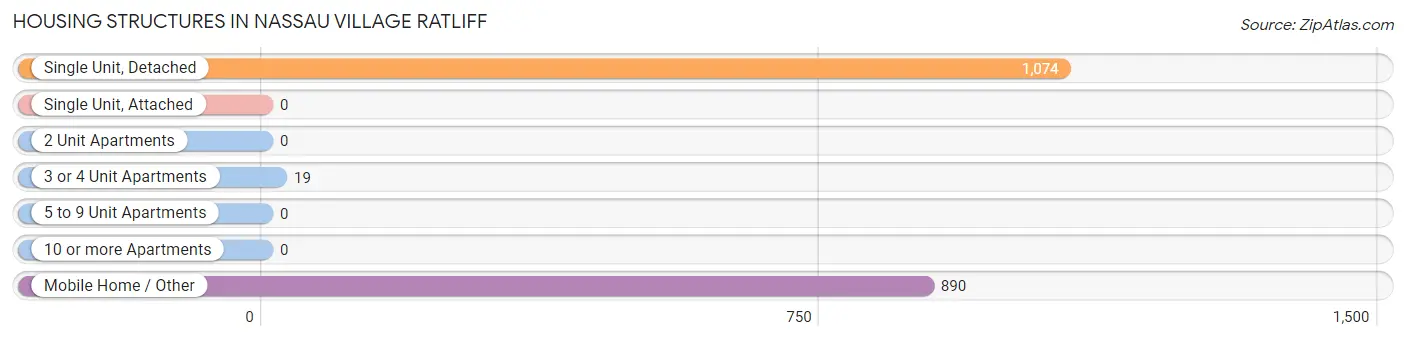
| Structure Type | # Housing Units | % Housing Units |
| Single Unit, Detached | 1,074 | 54.2% |
| Single Unit, Attached | 0 | 0.0% |
| 2 Unit Apartments | 0 | 0.0% |
| 3 or 4 Unit Apartments | 19 | 1.0% |
| 5 to 9 Unit Apartments | 0 | 0.0% |
| 10 or more Apartments | 0 | 0.0% |
| Mobile Home / Other | 890 | 44.9% |
| Total | 1,983 | 100.0% |
Housing Structures by Occupancy in Nassau Village Ratliff
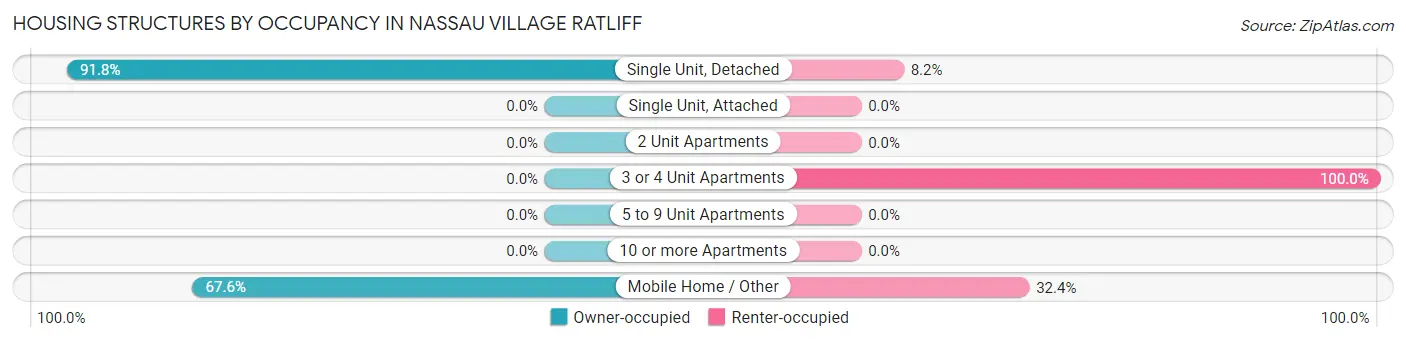
| Structure Type | Owner-occupied | Renter-occupied |
| Single Unit, Detached | 986 (91.8%) | 88 (8.2%) |
| Single Unit, Attached | 0 (0.0%) | 0 (0.0%) |
| 2 Unit Apartments | 0 (0.0%) | 0 (0.0%) |
| 3 or 4 Unit Apartments | 0 (0.0%) | 19 (100.0%) |
| 5 to 9 Unit Apartments | 0 (0.0%) | 0 (0.0%) |
| 10 or more Apartments | 0 (0.0%) | 0 (0.0%) |
| Mobile Home / Other | 602 (67.6%) | 288 (32.4%) |
| Total | 1,588 (80.1%) | 395 (19.9%) |
Housing Structures by Number of Rooms in Nassau Village Ratliff
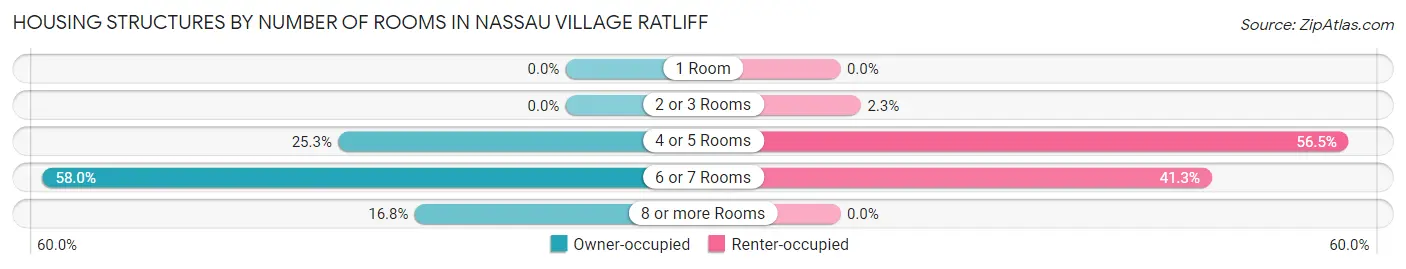
| Number of Rooms | Owner-occupied | Renter-occupied |
| 1 Room | 0 (0.0%) | 0 (0.0%) |
| 2 or 3 Rooms | 0 (0.0%) | 9 (2.3%) |
| 4 or 5 Rooms | 401 (25.3%) | 223 (56.5%) |
| 6 or 7 Rooms | 921 (58.0%) | 163 (41.3%) |
| 8 or more Rooms | 266 (16.8%) | 0 (0.0%) |
| Total | 1,588 (100.0%) | 395 (100.0%) |
Housing Structure by Heating Type in Nassau Village Ratliff

| Heating Type | Owner-occupied | Renter-occupied |
| Utility Gas | 0 (0.0%) | 0 (0.0%) |
| Bottled, Tank, or LP Gas | 16 (1.0%) | 0 (0.0%) |
| Electricity | 1,569 (98.8%) | 303 (76.7%) |
| Fuel Oil or Kerosene | 3 (0.2%) | 63 (16.0%) |
| Coal or Coke | 0 (0.0%) | 0 (0.0%) |
| All other Fuels | 0 (0.0%) | 0 (0.0%) |
| No Fuel Used | 0 (0.0%) | 29 (7.3%) |
| Total | 1,588 (100.0%) | 395 (100.0%) |
Household Vehicle Usage in Nassau Village Ratliff
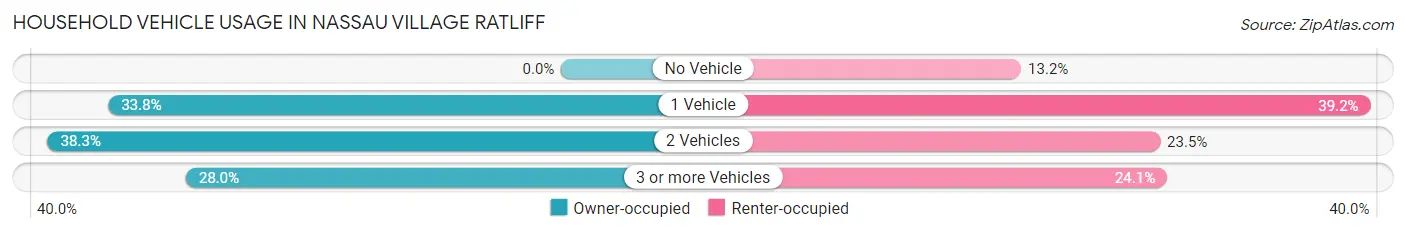
| Vehicles per Household | Owner-occupied | Renter-occupied |
| No Vehicle | 0 (0.0%) | 52 (13.2%) |
| 1 Vehicle | 536 (33.8%) | 155 (39.2%) |
| 2 Vehicles | 608 (38.3%) | 93 (23.5%) |
| 3 or more Vehicles | 444 (28.0%) | 95 (24.0%) |
| Total | 1,588 (100.0%) | 395 (100.0%) |
Real Estate & Mortgages in Nassau Village Ratliff
Real Estate and Mortgage Overview in Nassau Village Ratliff
| Characteristic | Without Mortgage | With Mortgage |
| Housing Units | 663 | 925 |
| Median Property Value | $172,100 | $194,500 |
| Median Household Income | $39,125 | $108 |
| Monthly Housing Costs | $328 | $63 |
| Real Estate Taxes | $1,181 | $4 |
Property Value by Mortgage Status in Nassau Village Ratliff
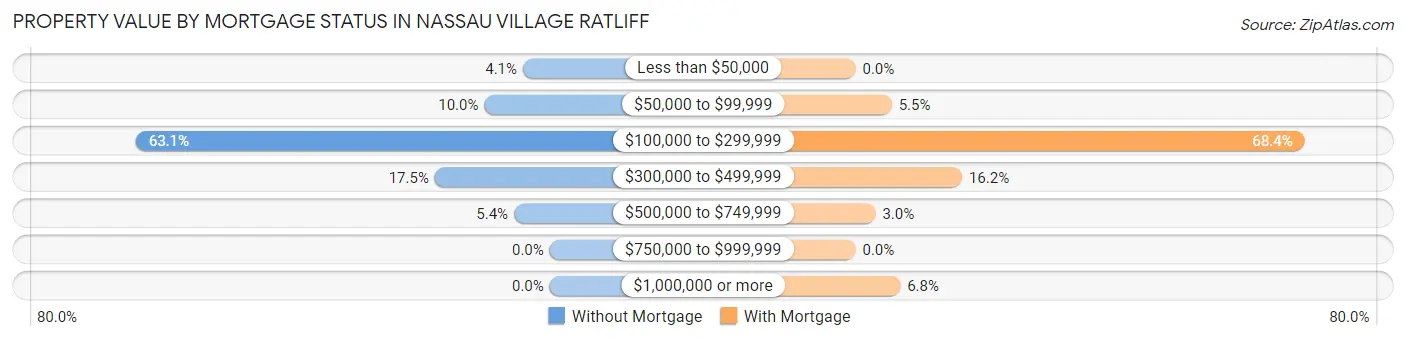
| Property Value | Without Mortgage | With Mortgage |
| Less than $50,000 | 27 (4.1%) | 0 (0.0%) |
| $50,000 to $99,999 | 66 (10.0%) | 51 (5.5%) |
| $100,000 to $299,999 | 418 (63.0%) | 633 (68.4%) |
| $300,000 to $499,999 | 116 (17.5%) | 150 (16.2%) |
| $500,000 to $749,999 | 36 (5.4%) | 28 (3.0%) |
| $750,000 to $999,999 | 0 (0.0%) | 0 (0.0%) |
| $1,000,000 or more | 0 (0.0%) | 63 (6.8%) |
| Total | 663 (100.0%) | 925 (100.0%) |
Household Income by Mortgage Status in Nassau Village Ratliff
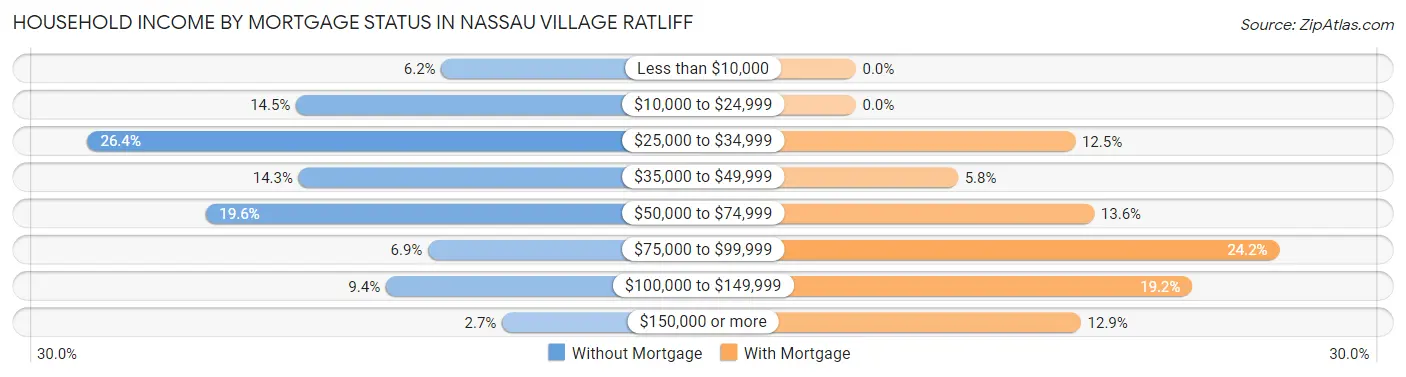
| Household Income | Without Mortgage | With Mortgage |
| Less than $10,000 | 41 (6.2%) | 0 (0.0%) |
| $10,000 to $24,999 | 96 (14.5%) | 0 (0.0%) |
| $25,000 to $34,999 | 175 (26.4%) | 116 (12.5%) |
| $35,000 to $49,999 | 95 (14.3%) | 54 (5.8%) |
| $50,000 to $74,999 | 130 (19.6%) | 126 (13.6%) |
| $75,000 to $99,999 | 46 (6.9%) | 224 (24.2%) |
| $100,000 to $149,999 | 62 (9.3%) | 178 (19.2%) |
| $150,000 or more | 18 (2.7%) | 119 (12.9%) |
| Total | 663 (100.0%) | 925 (100.0%) |
Property Value to Household Income Ratio in Nassau Village Ratliff
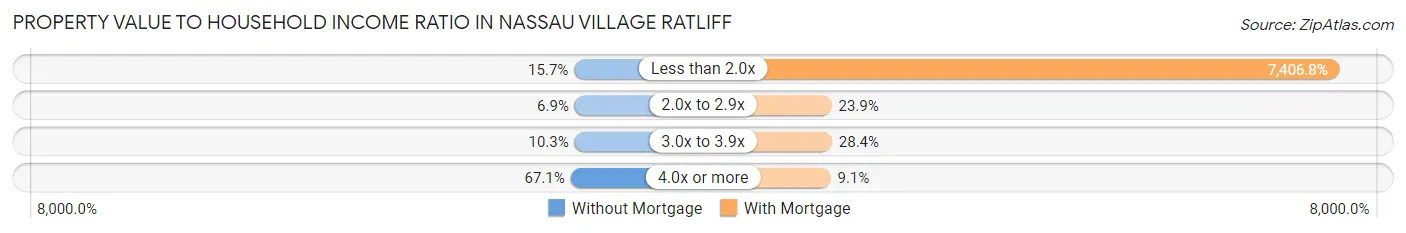
| Value-to-Income Ratio | Without Mortgage | With Mortgage |
| Less than 2.0x | 104 (15.7%) | 68,513 (7,406.8%) |
| 2.0x to 2.9x | 46 (6.9%) | 221 (23.9%) |
| 3.0x to 3.9x | 68 (10.3%) | 263 (28.4%) |
| 4.0x or more | 445 (67.1%) | 84 (9.1%) |
| Total | 663 (100.0%) | 925 (100.0%) |
Real Estate Taxes by Mortgage Status in Nassau Village Ratliff
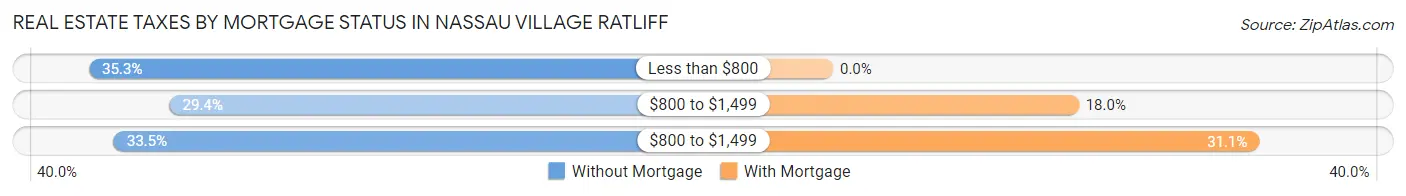
| Property Taxes | Without Mortgage | With Mortgage |
| Less than $800 | 234 (35.3%) | 0 (0.0%) |
| $800 to $1,499 | 195 (29.4%) | 166 (17.9%) |
| $800 to $1,499 | 222 (33.5%) | 288 (31.1%) |
| Total | 663 (100.0%) | 925 (100.0%) |
Health & Disability in Nassau Village Ratliff
Health Insurance Coverage by Age in Nassau Village Ratliff
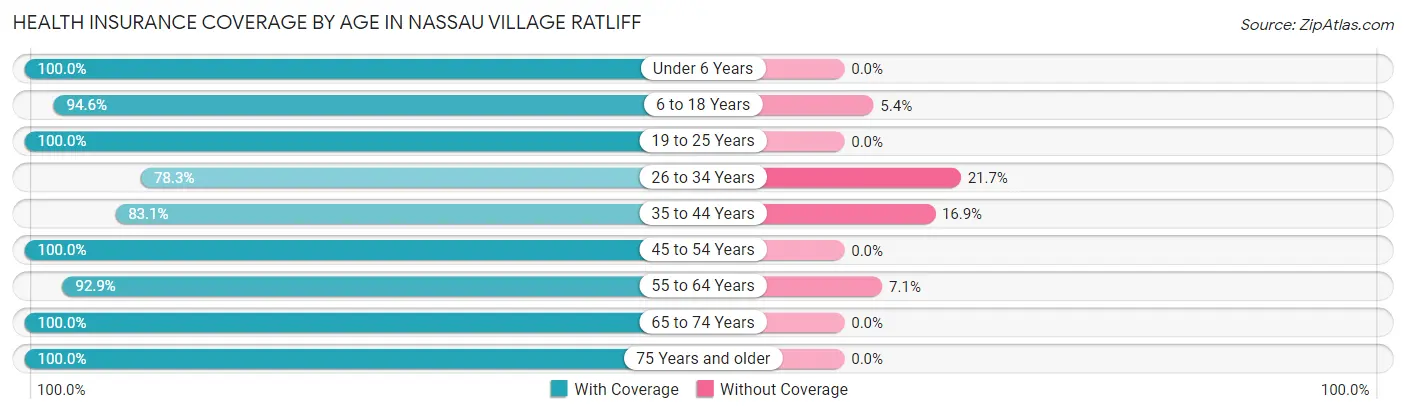
| Age Bracket | With Coverage | Without Coverage |
| Under 6 Years | 231 (100.0%) | 0 (0.0%) |
| 6 to 18 Years | 592 (94.6%) | 34 (5.4%) |
| 19 to 25 Years | 123 (100.0%) | 0 (0.0%) |
| 26 to 34 Years | 458 (78.3%) | 127 (21.7%) |
| 35 to 44 Years | 349 (83.1%) | 71 (16.9%) |
| 45 to 54 Years | 651 (100.0%) | 0 (0.0%) |
| 55 to 64 Years | 658 (92.9%) | 50 (7.1%) |
| 65 to 74 Years | 888 (100.0%) | 0 (0.0%) |
| 75 Years and older | 298 (100.0%) | 0 (0.0%) |
| Total | 4,248 (93.8%) | 282 (6.2%) |
Health Insurance Coverage by Citizenship Status in Nassau Village Ratliff
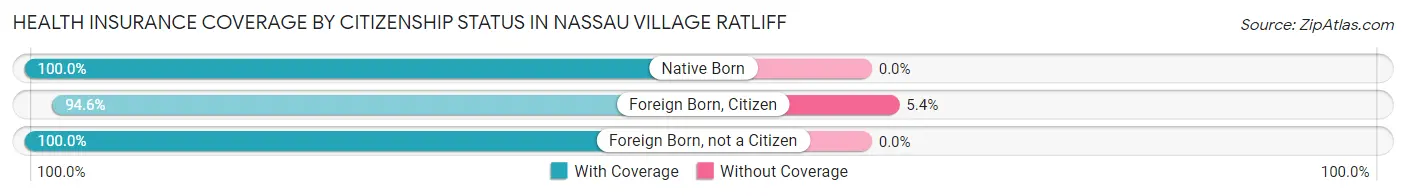
| Citizenship Status | With Coverage | Without Coverage |
| Native Born | 231 (100.0%) | 0 (0.0%) |
| Foreign Born, Citizen | 592 (94.6%) | 34 (5.4%) |
| Foreign Born, not a Citizen | 123 (100.0%) | 0 (0.0%) |
Health Insurance Coverage by Household Income in Nassau Village Ratliff
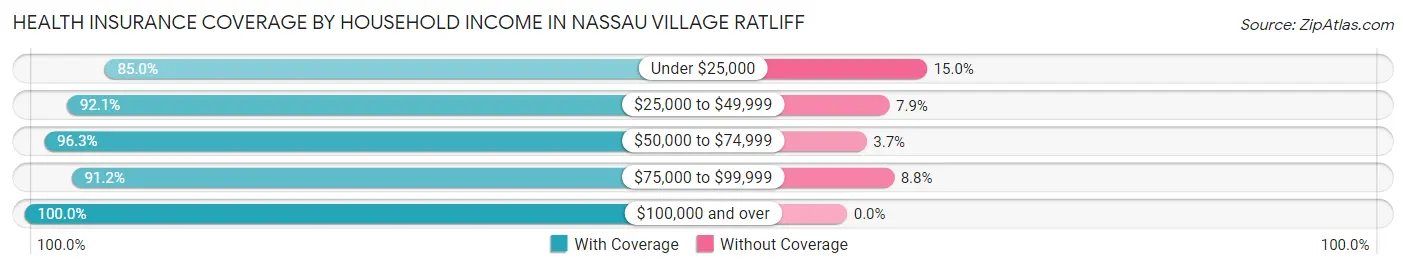
| Household Income | With Coverage | Without Coverage |
| Under $25,000 | 477 (85.0%) | 84 (15.0%) |
| $25,000 to $49,999 | 1,185 (92.1%) | 102 (7.9%) |
| $50,000 to $74,999 | 1,076 (96.3%) | 41 (3.7%) |
| $75,000 to $99,999 | 571 (91.2%) | 55 (8.8%) |
| $100,000 and over | 939 (100.0%) | 0 (0.0%) |
Public vs Private Health Insurance Coverage by Age in Nassau Village Ratliff
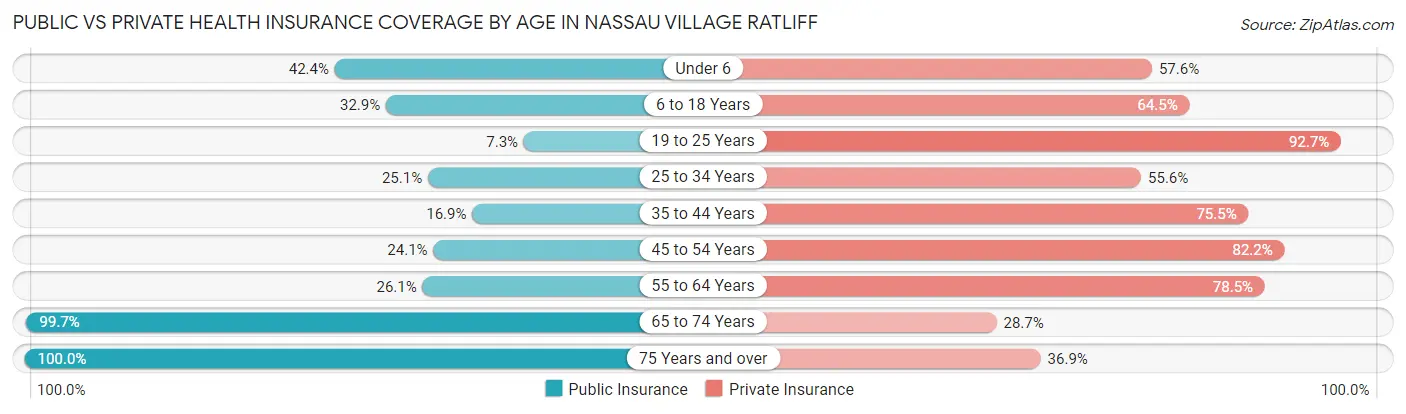
| Age Bracket | Public Insurance | Private Insurance |
| Under 6 | 98 (42.4%) | 133 (57.6%) |
| 6 to 18 Years | 206 (32.9%) | 404 (64.5%) |
| 19 to 25 Years | 9 (7.3%) | 114 (92.7%) |
| 25 to 34 Years | 147 (25.1%) | 325 (55.6%) |
| 35 to 44 Years | 71 (16.9%) | 317 (75.5%) |
| 45 to 54 Years | 157 (24.1%) | 535 (82.2%) |
| 55 to 64 Years | 185 (26.1%) | 556 (78.5%) |
| 65 to 74 Years | 885 (99.7%) | 255 (28.7%) |
| 75 Years and over | 298 (100.0%) | 110 (36.9%) |
| Total | 2,056 (45.4%) | 2,749 (60.7%) |
Disability Status by Sex by Age in Nassau Village Ratliff
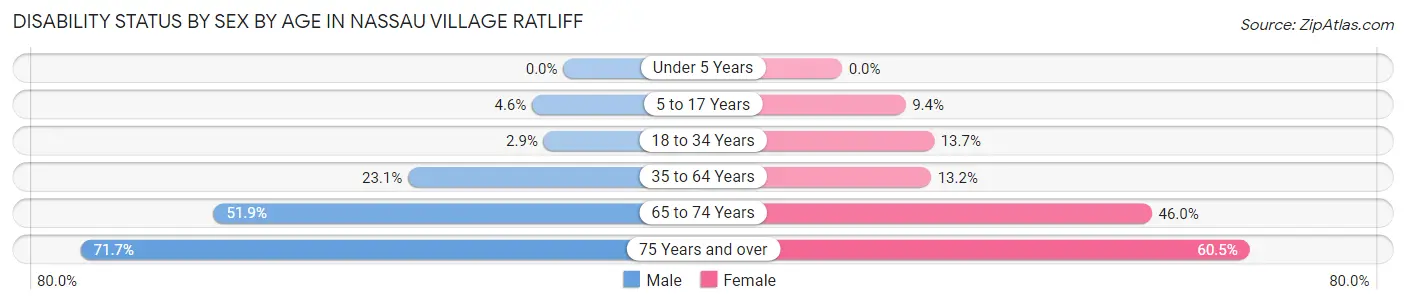
| Age Bracket | Male | Female |
| Under 5 Years | 0 (0.0%) | 0 (0.0%) |
| 5 to 17 Years | 14 (4.6%) | 18 (9.4%) |
| 18 to 34 Years | 15 (2.9%) | 46 (13.7%) |
| 35 to 64 Years | 220 (23.1%) | 109 (13.2%) |
| 65 to 74 Years | 241 (51.9%) | 195 (46.0%) |
| 75 Years and over | 81 (71.7%) | 112 (60.5%) |
Disability Class by Sex by Age in Nassau Village Ratliff
Disability Class: Hearing Difficulty
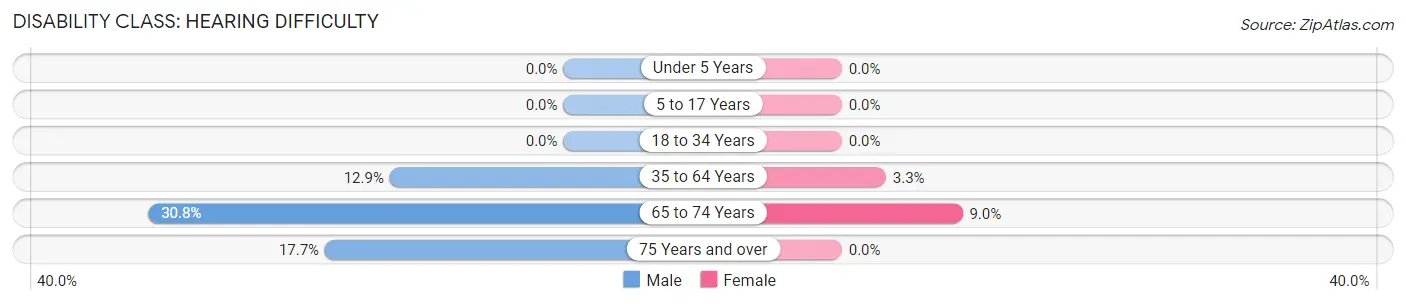
| Age Bracket | Male | Female |
| Under 5 Years | 0 (0.0%) | 0 (0.0%) |
| 5 to 17 Years | 0 (0.0%) | 0 (0.0%) |
| 18 to 34 Years | 0 (0.0%) | 0 (0.0%) |
| 35 to 64 Years | 123 (12.9%) | 27 (3.3%) |
| 65 to 74 Years | 143 (30.8%) | 38 (9.0%) |
| 75 Years and over | 20 (17.7%) | 0 (0.0%) |
Disability Class: Vision Difficulty
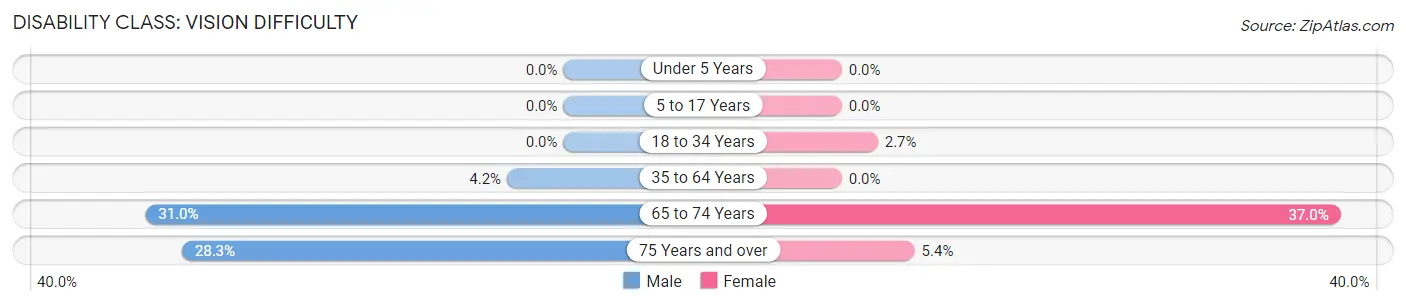
| Age Bracket | Male | Female |
| Under 5 Years | 0 (0.0%) | 0 (0.0%) |
| 5 to 17 Years | 0 (0.0%) | 0 (0.0%) |
| 18 to 34 Years | 0 (0.0%) | 9 (2.7%) |
| 35 to 64 Years | 40 (4.2%) | 0 (0.0%) |
| 65 to 74 Years | 144 (31.0%) | 157 (37.0%) |
| 75 Years and over | 32 (28.3%) | 10 (5.4%) |
Disability Class: Cognitive Difficulty
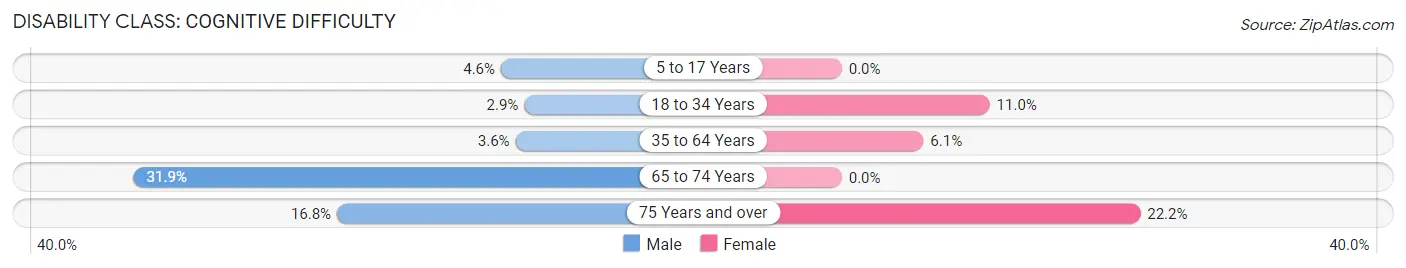
| Age Bracket | Male | Female |
| 5 to 17 Years | 14 (4.6%) | 0 (0.0%) |
| 18 to 34 Years | 15 (2.9%) | 37 (11.0%) |
| 35 to 64 Years | 34 (3.6%) | 50 (6.1%) |
| 65 to 74 Years | 148 (31.9%) | 0 (0.0%) |
| 75 Years and over | 19 (16.8%) | 41 (22.2%) |
Disability Class: Ambulatory Difficulty
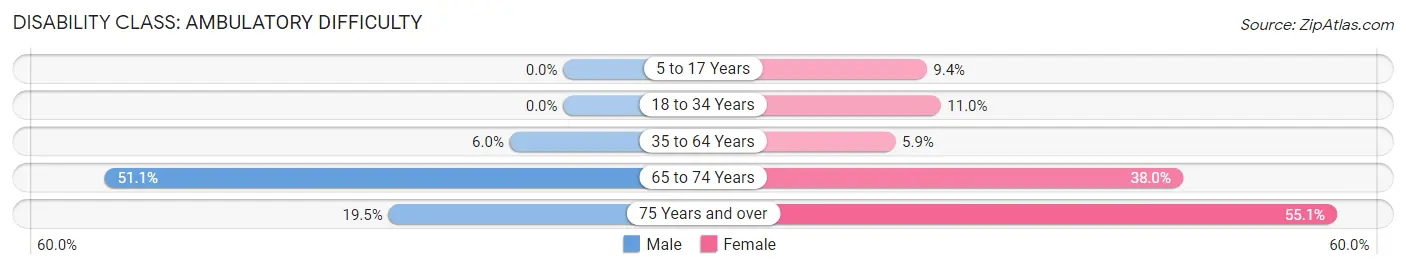
| Age Bracket | Male | Female |
| 5 to 17 Years | 0 (0.0%) | 18 (9.4%) |
| 18 to 34 Years | 0 (0.0%) | 37 (11.0%) |
| 35 to 64 Years | 57 (6.0%) | 49 (5.9%) |
| 65 to 74 Years | 237 (51.1%) | 161 (38.0%) |
| 75 Years and over | 22 (19.5%) | 102 (55.1%) |
Disability Class: Self-Care Difficulty
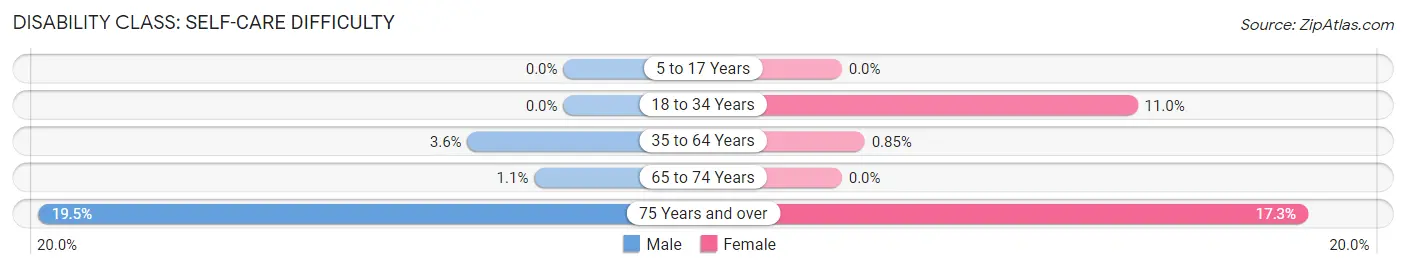
| Age Bracket | Male | Female |
| 5 to 17 Years | 0 (0.0%) | 0 (0.0%) |
| 18 to 34 Years | 0 (0.0%) | 37 (11.0%) |
| 35 to 64 Years | 34 (3.6%) | 7 (0.9%) |
| 65 to 74 Years | 5 (1.1%) | 0 (0.0%) |
| 75 Years and over | 22 (19.5%) | 32 (17.3%) |
Technology Access in Nassau Village Ratliff
Computing Device Access in Nassau Village Ratliff
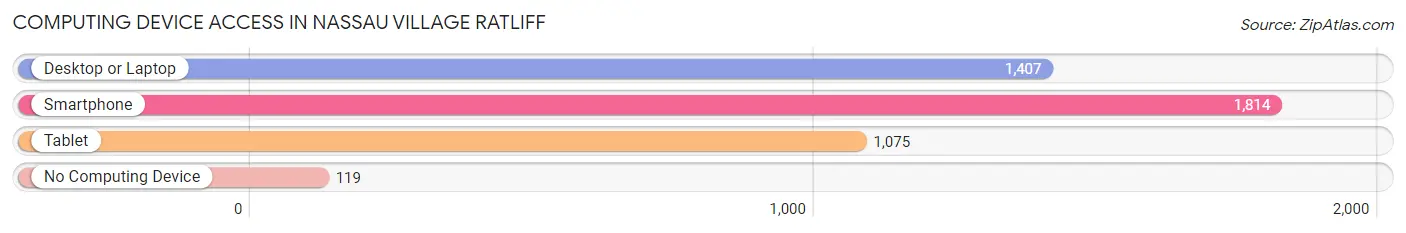
| Device Type | # Households | % Households |
| Desktop or Laptop | 1,407 | 71.0% |
| Smartphone | 1,814 | 91.5% |
| Tablet | 1,075 | 54.2% |
| No Computing Device | 119 | 6.0% |
| Total | 1,983 | 100.0% |
Internet Access in Nassau Village Ratliff
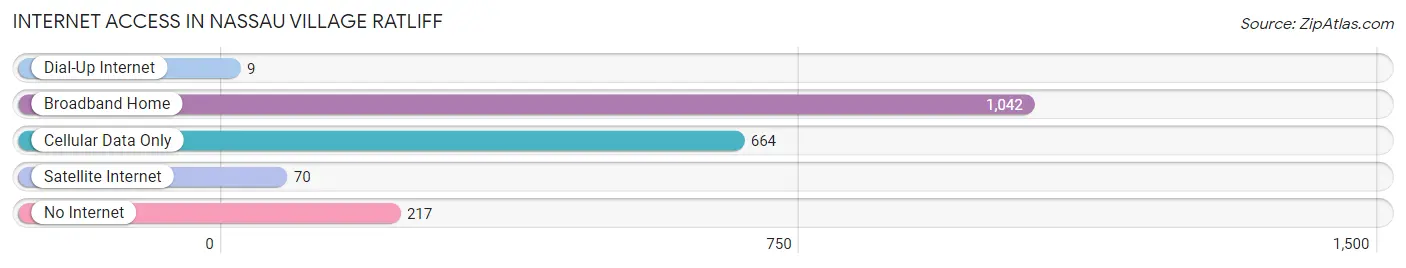
| Internet Type | # Households | % Households |
| Dial-Up Internet | 9 | 0.4% |
| Broadband Home | 1,042 | 52.5% |
| Cellular Data Only | 664 | 33.5% |
| Satellite Internet | 70 | 3.5% |
| No Internet | 217 | 10.9% |
| Total | 1,983 | 100.0% |
Nassau Village Ratliff Summary
Nassau Village Ratliff is a small unincorporated community located in Nassau County, Florida. It is situated on the western side of the county, just south of the city of Fernandina Beach. The community is bordered by the Nassau River to the north, the Atlantic Ocean to the east, and the Amelia River to the south. The population of Nassau Village Ratliff was estimated to be 1,845 in 2020.
History
Nassau Village Ratliff was originally inhabited by the Timucuan Indians, who lived in the area for thousands of years before the arrival of Europeans. The first Europeans to settle in the area were the Spanish, who established a mission in the area in 1573. The mission was abandoned in 1587, but the Spanish continued to use the area as a trading post.
In 1783, the British took control of the area and established a trading post at the mouth of the Nassau River. The trading post was named Nassau Village, after the Duke of Nassau. The village grew slowly over the next few decades, and by the mid-1800s, it had become a thriving community.
In 1868, the village was renamed Ratliff after a local family. The Ratliff family had been living in the area since the early 1800s and had become an important part of the community.
Geography
Nassau Village Ratliff is located in the western part of Nassau County, Florida. It is situated on the western side of the county, just south of the city of Fernandina Beach. The community is bordered by the Nassau River to the north, the Atlantic Ocean to the east, and the Amelia River to the south.
The terrain of Nassau Village Ratliff is mostly flat, with some low hills in the area. The soil is sandy and the climate is humid subtropical, with hot summers and mild winters.
Economy
The economy of Nassau Village Ratliff is largely based on tourism and fishing. The area is home to several popular tourist attractions, including the Amelia Island Plantation, Fort Clinch State Park, and the Amelia Island Lighthouse. The area is also home to several marinas, which provide access to the Atlantic Ocean for fishing and other recreational activities.
In addition to tourism and fishing, the area is also home to several small businesses, including restaurants, retail stores, and service providers. The area is also home to several small farms, which produce a variety of crops, including corn, soybeans, and cotton.
Demographics
As of 2020, the population of Nassau Village Ratliff was estimated to be 1,845. The racial makeup of the community was 79.3% White, 15.2% African American, 0.7% Native American, 0.7% Asian, 0.1% Pacific Islander, and 3.9% from other races. The median household income was $45,938, and the median home value was $179,000.
Conclusion
Nassau Village Ratliff is a small unincorporated community located in Nassau County, Florida. It is situated on the western side of the county, just south of the city of Fernandina Beach. The community is bordered by the Nassau River to the north, the Atlantic Ocean to the east, and the Amelia River to the south. The population of Nassau Village Ratliff was estimated to be 1,845 in 2020. The economy of the area is largely based on tourism and fishing, and the area is home to several small businesses, farms, and tourist attractions. The racial makeup of the community was 79.3% White, 15.2% African American, 0.7% Native American, 0.7% Asian, 0.1% Pacific Islander, and 3.9% from other races. The median household income was $45,938, and the median home value was $179,000.
Common Questions
What is Per Capita Income in Nassau Village Ratliff?
Per Capita income in Nassau Village Ratliff is $28,663.
What is the Median Family Income in Nassau Village Ratliff?
Median Family Income in Nassau Village Ratliff is $59,457.
What is the Median Household income in Nassau Village Ratliff?
Median Household Income in Nassau Village Ratliff is $54,311.
What is Income or Wage Gap in Nassau Village Ratliff?
Income or Wage Gap in Nassau Village Ratliff is 52.8%.
Women in Nassau Village Ratliff earn 47.2 cents for every dollar earned by a man.
What is Inequality or Gini Index in Nassau Village Ratliff?
Inequality or Gini Index in Nassau Village Ratliff is 0.41.
What is the Total Population of Nassau Village Ratliff?
Total Population of Nassau Village Ratliff is 4,530.
What is the Total Male Population of Nassau Village Ratliff?
Total Male Population of Nassau Village Ratliff is 2,473.
What is the Total Female Population of Nassau Village Ratliff?
Total Female Population of Nassau Village Ratliff is 2,057.
What is the Ratio of Males per 100 Females in Nassau Village Ratliff?
There are 120.22 Males per 100 Females in Nassau Village Ratliff.
What is the Ratio of Females per 100 Males in Nassau Village Ratliff?
There are 83.18 Females per 100 Males in Nassau Village Ratliff.
What is the Median Population Age in Nassau Village Ratliff?
Median Population Age in Nassau Village Ratliff is 50.1 Years.
What is the Average Family Size in Nassau Village Ratliff
Average Family Size in Nassau Village Ratliff is 2.6 People.
What is the Average Household Size in Nassau Village Ratliff
Average Household Size in Nassau Village Ratliff is 2.3 People.
How Large is the Labor Force in Nassau Village Ratliff?
There are 1,783 People in the Labor Forcein in Nassau Village Ratliff.
What is the Percentage of People in the Labor Force in Nassau Village Ratliff?
46.2% of People are in the Labor Force in Nassau Village Ratliff.
What is the Unemployment Rate in Nassau Village Ratliff?
Unemployment Rate in Nassau Village Ratliff is 4.7%.