Oakleaf Plantation, FL Map & Demographics
Oakleaf Plantation Map
Oakleaf Plantation Overview
$34,258
PER CAPITA INCOME
$103,013
AVG FAMILY INCOME
$102,791
AVG HOUSEHOLD INCOME
36.9%
WAGE / INCOME GAP [ % ]
63.1¢/ $1
WAGE / INCOME GAP [ $ ]
$15,560
FAMILY INCOME DEFICIT
0.34
INEQUALITY / GINI INDEX
29,265
TOTAL POPULATION
13,873
MALE POPULATION
15,392
FEMALE POPULATION
90.13
MALES / 100 FEMALES
110.95
FEMALES / 100 MALES
35.2
MEDIAN AGE
3.5
AVG FAMILY SIZE
3.3
AVG HOUSEHOLD SIZE
14,441
LABOR FORCE [ PEOPLE ]
68.2%
PERCENT IN LABOR FORCE
2.7%
UNEMPLOYMENT RATE
Income in Oakleaf Plantation
Income Overview in Oakleaf Plantation
Per Capita Income in Oakleaf Plantation is $34,258, while median incomes of families and households are $103,013 and $102,791 respectively.
| Characteristic | Number | Measure |
| Per Capita Income | 29,265 | $34,258 |
| Median Family Income | 7,775 | $103,013 |
| Mean Family Income | 7,775 | $112,923 |
| Median Household Income | 8,977 | $102,791 |
| Mean Household Income | 8,977 | $108,619 |
| Income Deficit | 7,775 | $15,560 |
| Wage / Income Gap (%) | 29,265 | 36.91% |
| Wage / Income Gap ($) | 29,265 | 63.09¢ per $1 |
| Gini / Inequality Index | 29,265 | 0.34 |
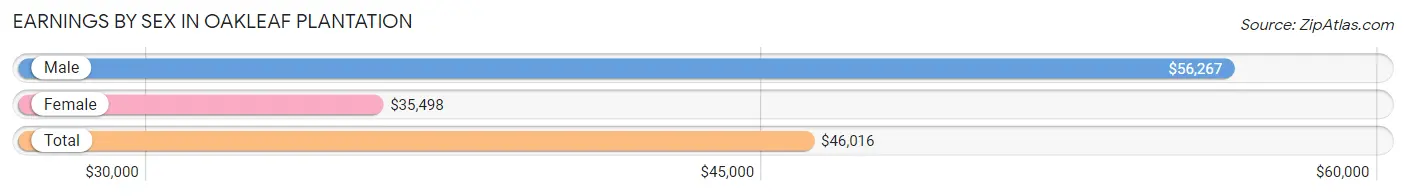
Earnings by Sex in Oakleaf Plantation
Average Earnings in Oakleaf Plantation are $46,016, $56,267 for men and $35,498 for women, a difference of 36.9%.
| Sex | Number | Average Earnings |
| Male | 7,216 (47.6%) | $56,267 |
| Female | 7,947 (52.4%) | $35,498 |
| Total | 15,163 (100.0%) | $46,016 |
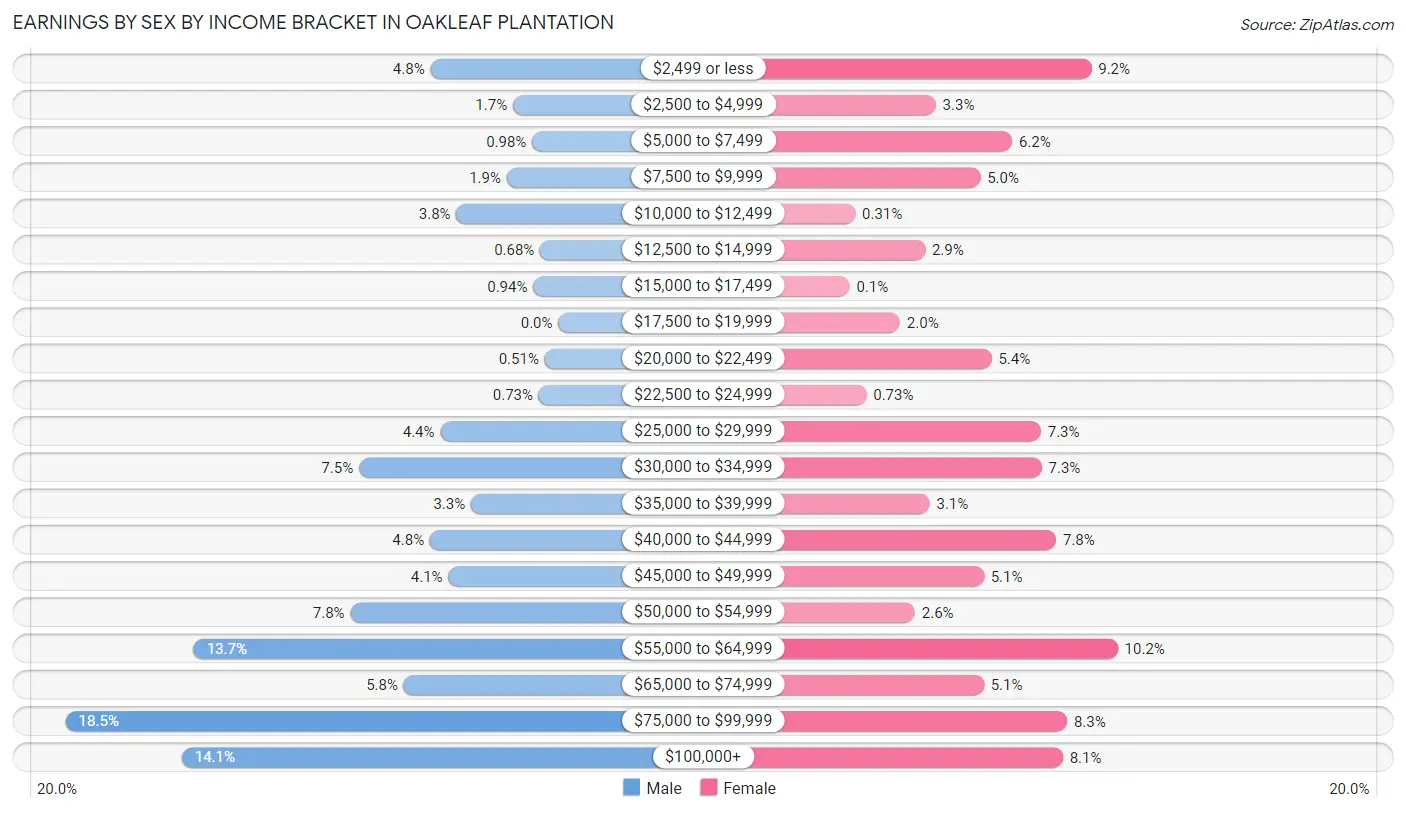
Earnings by Sex by Income Bracket in Oakleaf Plantation
The most common earnings brackets in Oakleaf Plantation are $75,000 to $99,999 for men (1,332 | 18.5%) and $55,000 to $64,999 for women (807 | 10.2%).
| Income | Male | Female |
| $2,499 or less | 346 (4.8%) | 728 (9.2%) |
| $2,500 to $4,999 | 123 (1.7%) | 265 (3.3%) |
| $5,000 to $7,499 | 71 (1.0%) | 492 (6.2%) |
| $7,500 to $9,999 | 139 (1.9%) | 397 (5.0%) |
| $10,000 to $12,499 | 276 (3.8%) | 25 (0.3%) |
| $12,500 to $14,999 | 49 (0.7%) | 233 (2.9%) |
| $15,000 to $17,499 | 68 (0.9%) | 8 (0.1%) |
| $17,500 to $19,999 | 0 (0.0%) | 158 (2.0%) |
| $20,000 to $22,499 | 37 (0.5%) | 431 (5.4%) |
| $22,500 to $24,999 | 53 (0.7%) | 58 (0.7%) |
| $25,000 to $29,999 | 319 (4.4%) | 578 (7.3%) |
| $30,000 to $34,999 | 539 (7.5%) | 580 (7.3%) |
| $35,000 to $39,999 | 236 (3.3%) | 246 (3.1%) |
| $40,000 to $44,999 | 347 (4.8%) | 623 (7.8%) |
| $45,000 to $49,999 | 297 (4.1%) | 408 (5.1%) |
| $50,000 to $54,999 | 562 (7.8%) | 203 (2.5%) |
| $55,000 to $64,999 | 986 (13.7%) | 807 (10.2%) |
| $65,000 to $74,999 | 418 (5.8%) | 408 (5.1%) |
| $75,000 to $99,999 | 1,332 (18.5%) | 656 (8.3%) |
| $100,000+ | 1,018 (14.1%) | 643 (8.1%) |
| Total | 7,216 (100.0%) | 7,947 (100.0%) |
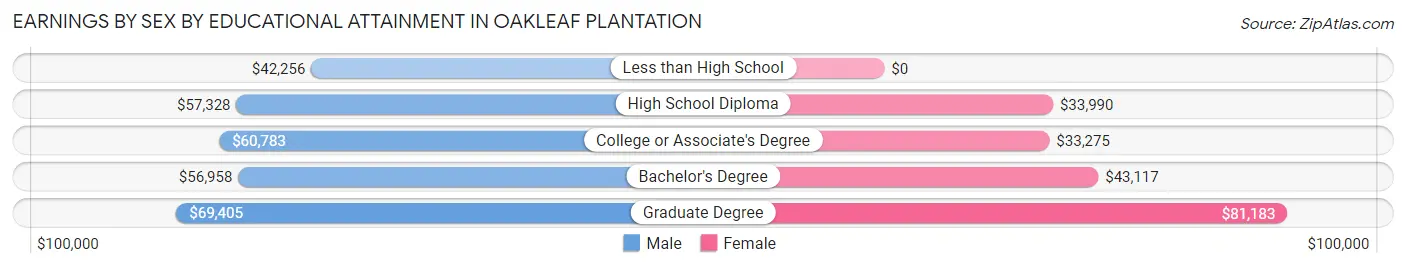
Earnings by Sex by Educational Attainment in Oakleaf Plantation
Average earnings in Oakleaf Plantation are $60,301 for men and $43,348 for women, a difference of 28.1%. Men with an educational attainment of graduate degree enjoy the highest average annual earnings of $69,405, while those with less than high school education earn the least with $42,256. Women with an educational attainment of graduate degree earn the most with the average annual earnings of $81,183, while those with college or associate's degree education have the smallest earnings of $33,275.
| Educational Attainment | Male Income | Female Income |
| Less than High School | $42,256 | $0 |
| High School Diploma | $57,328 | $33,990 |
| College or Associate's Degree | $60,783 | $33,275 |
| Bachelor's Degree | $56,958 | $43,117 |
| Graduate Degree | $69,405 | $81,183 |
| Total | $60,301 | $43,348 |
Family Income in Oakleaf Plantation
Family Income Brackets in Oakleaf Plantation
According to the Oakleaf Plantation family income data, there are 2,395 families falling into the $100,000 to $149,999 income range, which is the most common income bracket and makes up 30.8% of all families. Conversely, the $15,000 to $24,999 income bracket is the least frequent group with only 86 families (1.1%) belonging to this category.
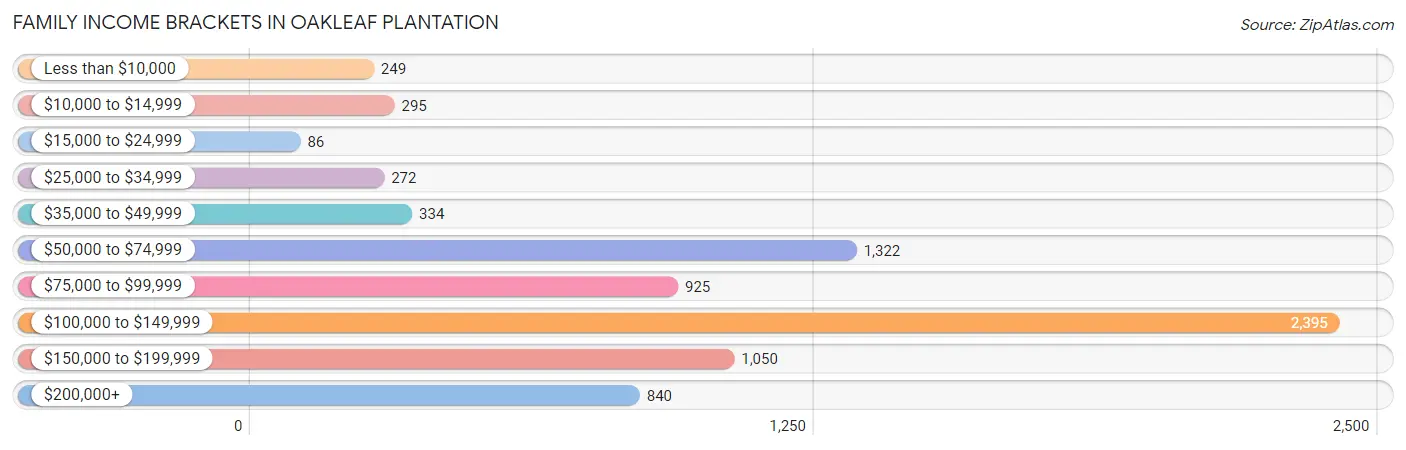
| Income Bracket | # Families | % Families |
| Less than $10,000 | 249 | 3.2% |
| $10,000 to $14,999 | 295 | 3.8% |
| $15,000 to $24,999 | 86 | 1.1% |
| $25,000 to $34,999 | 272 | 3.5% |
| $35,000 to $49,999 | 334 | 4.3% |
| $50,000 to $74,999 | 1,322 | 17.0% |
| $75,000 to $99,999 | 925 | 11.9% |
| $100,000 to $149,999 | 2,395 | 30.8% |
| $150,000 to $199,999 | 1,050 | 13.5% |
| $200,000+ | 840 | 10.8% |
Family Income by Famaliy Size in Oakleaf Plantation
6-person families (246 | 3.2%) account for the highest median family income in Oakleaf Plantation with $177,069 per family, while 2-person families (2,270 | 29.2%) have the highest median income of $51,010 per family member.
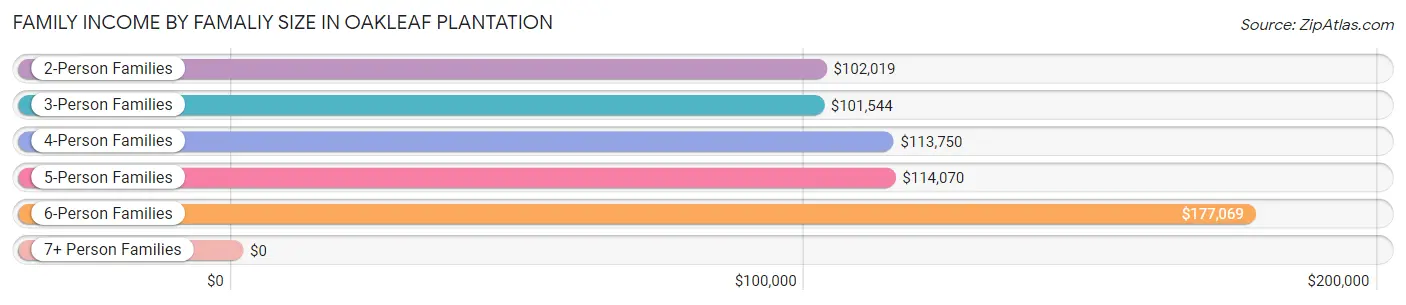
| Income Bracket | # Families | Median Income |
| 2-Person Families | 2,270 (29.2%) | $102,019 |
| 3-Person Families | 1,761 (22.7%) | $101,544 |
| 4-Person Families | 1,734 (22.3%) | $113,750 |
| 5-Person Families | 1,578 (20.3%) | $114,070 |
| 6-Person Families | 246 (3.2%) | $177,069 |
| 7+ Person Families | 186 (2.4%) | $0 |
| Total | 7,775 (100.0%) | $103,013 |
Family Income by Number of Earners in Oakleaf Plantation
The median family income in Oakleaf Plantation is $103,013, with families comprising 3+ earners (970) having the highest median family income of $139,052, while families with no earners (669) have the lowest median family income of $70,366, accounting for 12.5% and 8.6% of families, respectively.
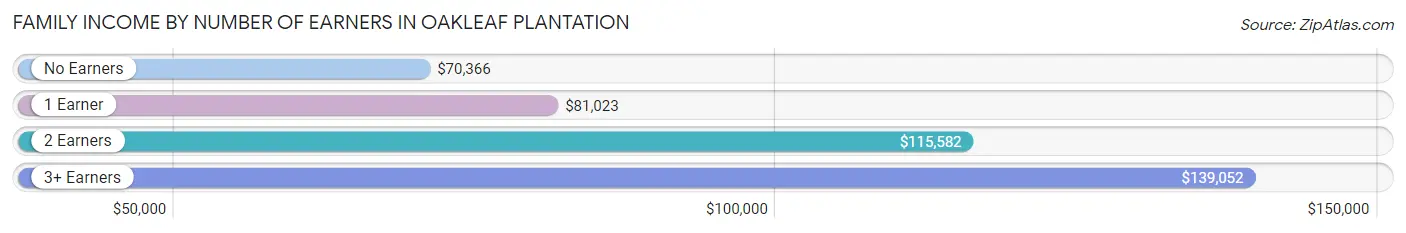
| Number of Earners | # Families | Median Income |
| No Earners | 669 (8.6%) | $70,366 |
| 1 Earner | 2,365 (30.4%) | $81,023 |
| 2 Earners | 3,771 (48.5%) | $115,582 |
| 3+ Earners | 970 (12.5%) | $139,052 |
| Total | 7,775 (100.0%) | $103,013 |
Household Income in Oakleaf Plantation
Household Income Brackets in Oakleaf Plantation
With 2,810 households falling in the category, the $100,000 to $149,999 income range is the most frequent in Oakleaf Plantation, accounting for 31.3% of all households. In contrast, only 162 households (1.8%) fall into the $15,000 to $24,999 income bracket, making it the least populous group.
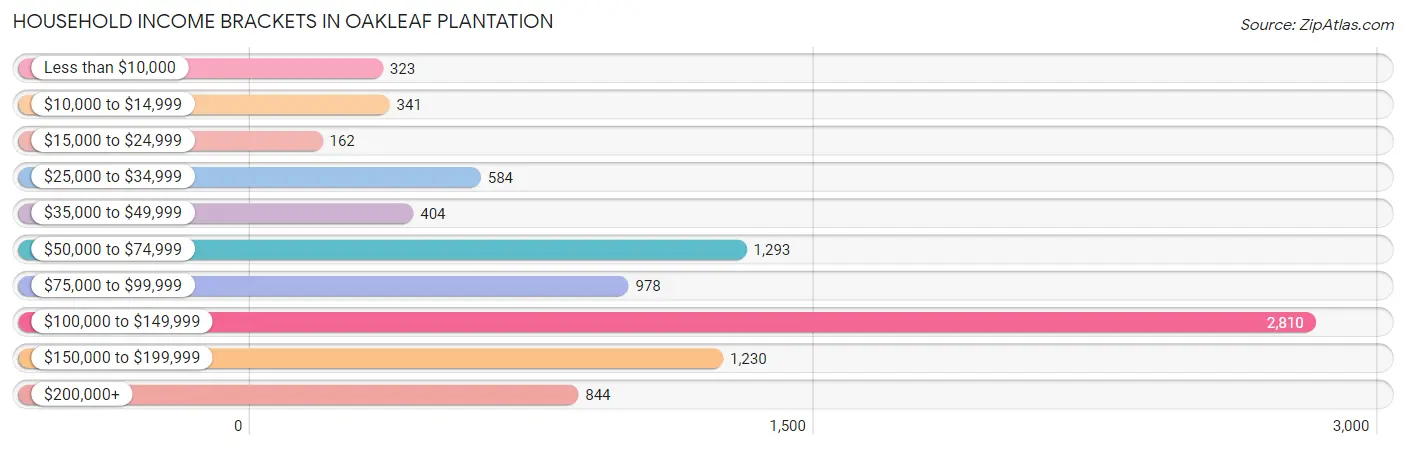
| Income Bracket | # Households | % Households |
| Less than $10,000 | 323 | 3.6% |
| $10,000 to $14,999 | 341 | 3.8% |
| $15,000 to $24,999 | 162 | 1.8% |
| $25,000 to $34,999 | 584 | 6.5% |
| $35,000 to $49,999 | 404 | 4.5% |
| $50,000 to $74,999 | 1,293 | 14.4% |
| $75,000 to $99,999 | 978 | 10.9% |
| $100,000 to $149,999 | 2,810 | 31.3% |
| $150,000 to $199,999 | 1,230 | 13.7% |
| $200,000+ | 844 | 9.4% |
Household Income by Householder Age in Oakleaf Plantation
The median household income in Oakleaf Plantation is $102,791, with the highest median household income of $128,589 found in the 45 to 64 years age bracket for the primary householder. A total of 3,602 households (40.1%) fall into this category. Meanwhile, the 15 to 24 years age bracket for the primary householder has the lowest median household income of $0, with 19 households (0.2%) in this group.
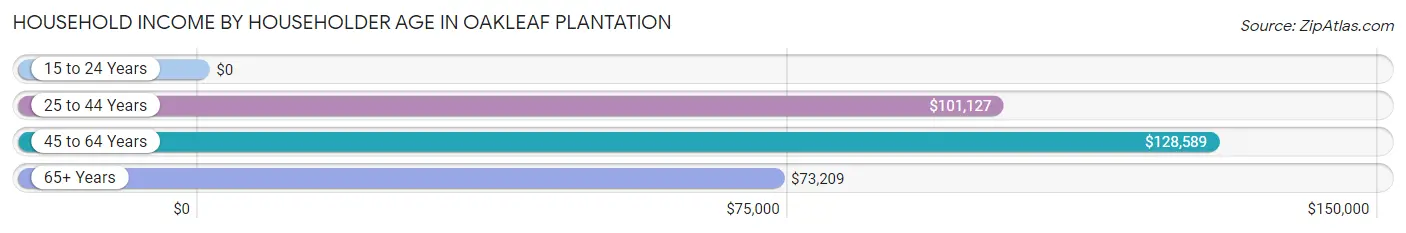
| Income Bracket | # Households | Median Income |
| 15 to 24 Years | 19 (0.2%) | $0 |
| 25 to 44 Years | 4,031 (44.9%) | $101,127 |
| 45 to 64 Years | 3,602 (40.1%) | $128,589 |
| 65+ Years | 1,325 (14.8%) | $73,209 |
| Total | 8,977 (100.0%) | $102,791 |
Poverty in Oakleaf Plantation
Income Below Poverty by Sex and Age in Oakleaf Plantation
With 7.1% poverty level for males and 9.2% for females among the residents of Oakleaf Plantation, 15 year old males and 16 and 17 year old females are the most vulnerable to poverty, with 98 males (32.2%) and 104 females (16.0%) in their respective age groups living below the poverty level.
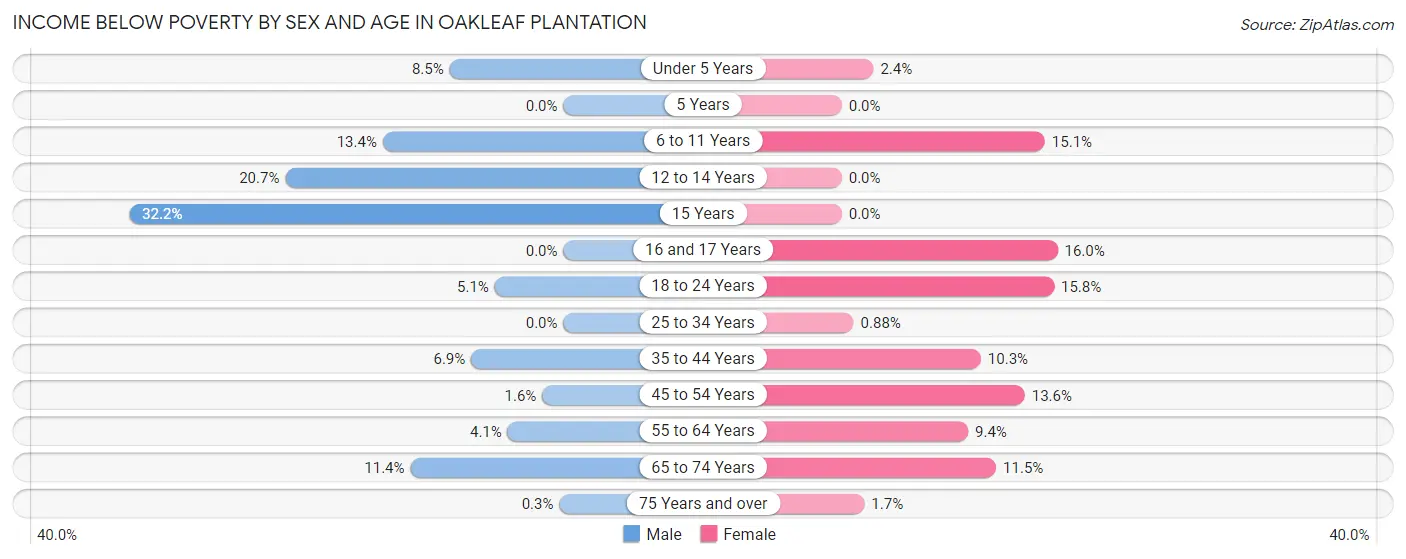
| Age Bracket | Male | Female |
| Under 5 Years | 77 (8.5%) | 20 (2.4%) |
| 5 Years | 0 (0.0%) | 0 (0.0%) |
| 6 to 11 Years | 209 (13.4%) | 222 (15.1%) |
| 12 to 14 Years | 210 (20.6%) | 0 (0.0%) |
| 15 Years | 98 (32.2%) | 0 (0.0%) |
| 16 and 17 Years | 0 (0.0%) | 104 (16.0%) |
| 18 to 24 Years | 39 (5.1%) | 201 (15.8%) |
| 25 to 34 Years | 0 (0.0%) | 14 (0.9%) |
| 35 to 44 Years | 162 (6.9%) | 329 (10.3%) |
| 45 to 54 Years | 31 (1.6%) | 278 (13.6%) |
| 55 to 64 Years | 61 (4.1%) | 105 (9.4%) |
| 65 to 74 Years | 91 (11.4%) | 121 (11.5%) |
| 75 Years and over | 1 (0.3%) | 8 (1.7%) |
| Total | 979 (7.1%) | 1,402 (9.2%) |
Income Above Poverty by Sex and Age in Oakleaf Plantation
According to the poverty statistics in Oakleaf Plantation, males aged 5 years and females aged 5 years are the age groups that are most secure financially, with 100.0% of males and 100.0% of females in these age groups living above the poverty line.
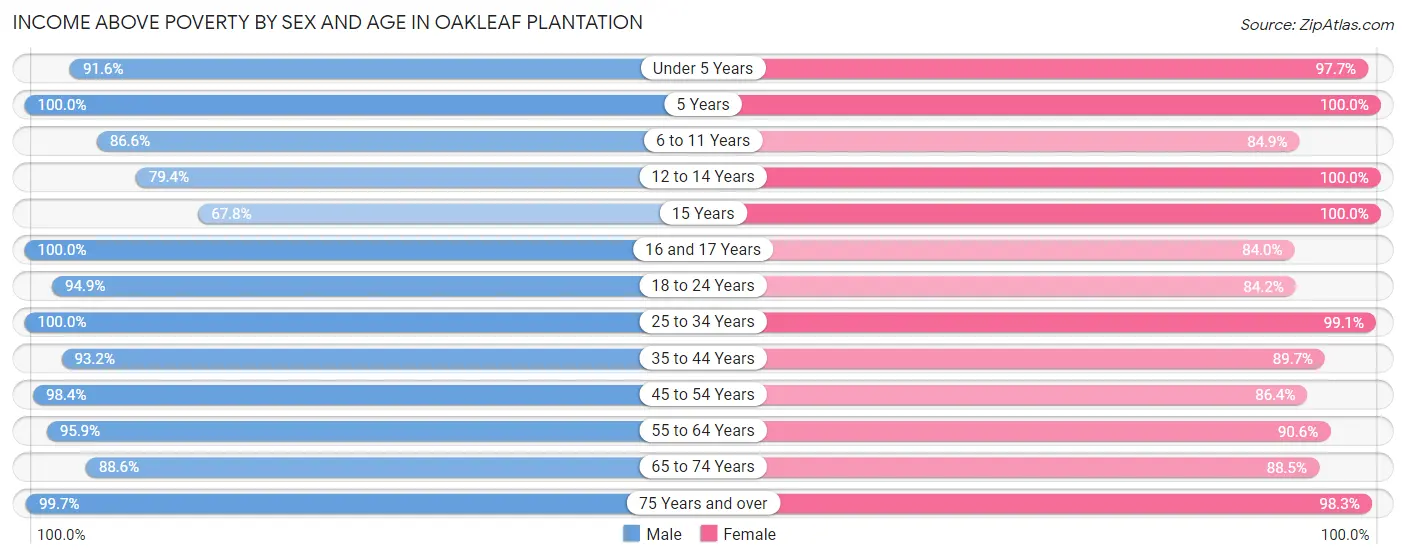
| Age Bracket | Male | Female |
| Under 5 Years | 834 (91.5%) | 831 (97.7%) |
| 5 Years | 182 (100.0%) | 317 (100.0%) |
| 6 to 11 Years | 1,349 (86.6%) | 1,250 (84.9%) |
| 12 to 14 Years | 807 (79.3%) | 966 (100.0%) |
| 15 Years | 206 (67.8%) | 266 (100.0%) |
| 16 and 17 Years | 520 (100.0%) | 545 (84.0%) |
| 18 to 24 Years | 726 (94.9%) | 1,074 (84.2%) |
| 25 to 34 Years | 1,547 (100.0%) | 1,577 (99.1%) |
| 35 to 44 Years | 2,202 (93.1%) | 2,857 (89.7%) |
| 45 to 54 Years | 1,946 (98.4%) | 1,767 (86.4%) |
| 55 to 64 Years | 1,412 (95.9%) | 1,015 (90.6%) |
| 65 to 74 Years | 710 (88.6%) | 935 (88.5%) |
| 75 Years and over | 329 (99.7%) | 468 (98.3%) |
| Total | 12,770 (92.9%) | 13,868 (90.8%) |
Income Below Poverty Among Married-Couple Families in Oakleaf Plantation
The poverty statistics for married-couple families in Oakleaf Plantation show that 6.4% or 385 of the total 6,043 families live below the poverty line. Families with 3 or 4 children have the highest poverty rate of 21.3%, comprising of 268 families. On the other hand, families with 1 or 2 children have the lowest poverty rate of 0.0%, which includes 0 families.
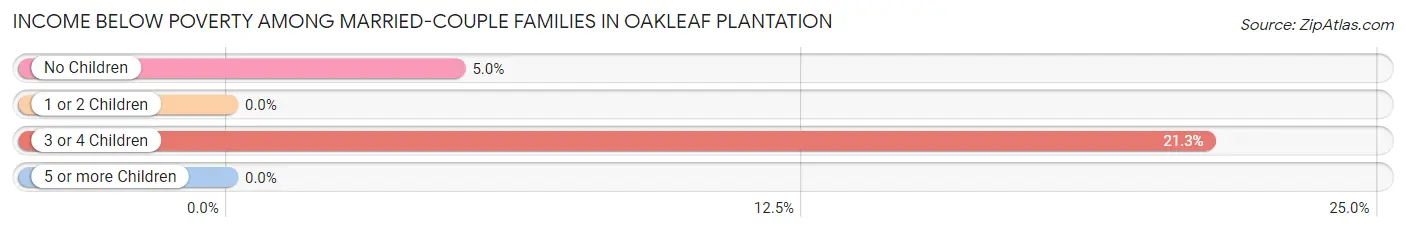
| Children | Above Poverty | Below Poverty |
| No Children | 2,247 (95.1%) | 117 (5.0%) |
| 1 or 2 Children | 2,322 (100.0%) | 0 (0.0%) |
| 3 or 4 Children | 992 (78.7%) | 268 (21.3%) |
| 5 or more Children | 97 (100.0%) | 0 (0.0%) |
| Total | 5,658 (93.6%) | 385 (6.4%) |
Income Below Poverty Among Single-Parent Households in Oakleaf Plantation
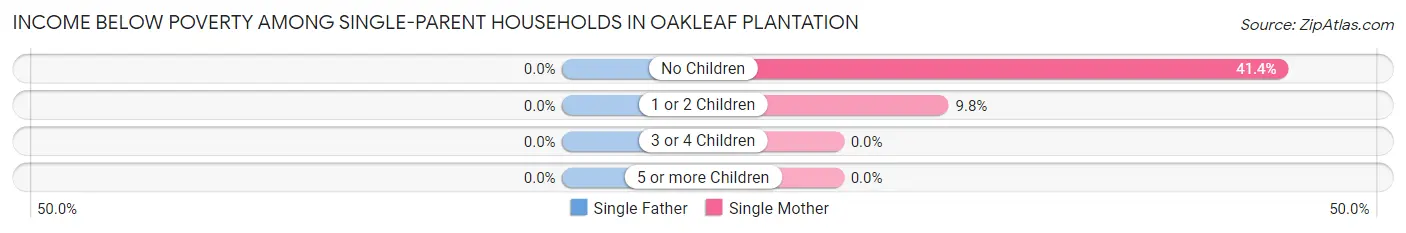
| Children | Single Father | Single Mother |
| No Children | 0 (0.0%) | 159 (41.4%) |
| 1 or 2 Children | 0 (0.0%) | 67 (9.8%) |
| 3 or 4 Children | 0 (0.0%) | 0 (0.0%) |
| 5 or more Children | 0 (0.0%) | 0 (0.0%) |
| Total | 0 (0.0%) | 226 (18.9%) |
Income Below Poverty Among Married-Couple vs Single-Parent Households in Oakleaf Plantation
The poverty data for Oakleaf Plantation shows that 385 of the married-couple family households (6.4%) and 226 of the single-parent households (13.1%) are living below the poverty level. Within the married-couple family households, those with 3 or 4 children have the highest poverty rate, with 268 households (21.3%) falling below the poverty line. Among the single-parent households, those with no children have the highest poverty rate, with 159 household (31.8%) living below poverty.
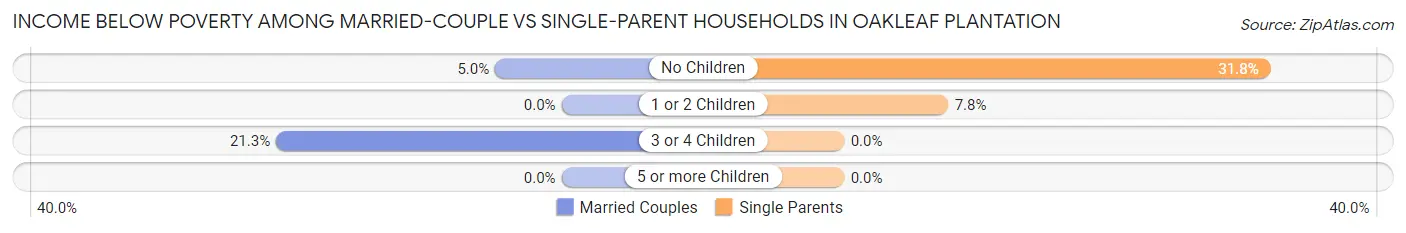
| Children | Married-Couple Families | Single-Parent Households |
| No Children | 117 (5.0%) | 159 (31.8%) |
| 1 or 2 Children | 0 (0.0%) | 67 (7.7%) |
| 3 or 4 Children | 268 (21.3%) | 0 (0.0%) |
| 5 or more Children | 0 (0.0%) | 0 (0.0%) |
| Total | 385 (6.4%) | 226 (13.1%) |
Race in Oakleaf Plantation
The most populous races in Oakleaf Plantation are White / Caucasian (14,798 | 50.6%), Black / African American (6,764 | 23.1%), and Hispanic or Latino (4,226 | 14.4%).
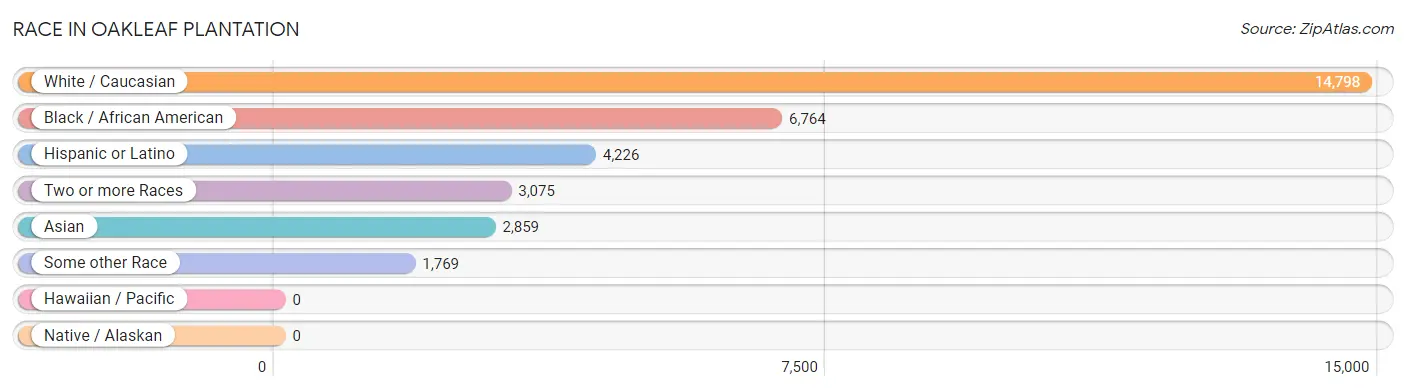
| Race | # Population | % Population |
| Asian | 2,859 | 9.8% |
| Black / African American | 6,764 | 23.1% |
| Hawaiian / Pacific | 0 | 0.0% |
| Hispanic or Latino | 4,226 | 14.4% |
| Native / Alaskan | 0 | 0.0% |
| White / Caucasian | 14,798 | 50.6% |
| Two or more Races | 3,075 | 10.5% |
| Some other Race | 1,769 | 6.0% |
| Total | 29,265 | 100.0% |
Ancestry in Oakleaf Plantation
The most populous ancestries reported in Oakleaf Plantation are Irish (3,756 | 12.8%), German (3,650 | 12.5%), Korean (2,491 | 8.5%), Puerto Rican (2,215 | 7.6%), and English (1,889 | 6.5%), together accounting for 47.8% of all Oakleaf Plantation residents.
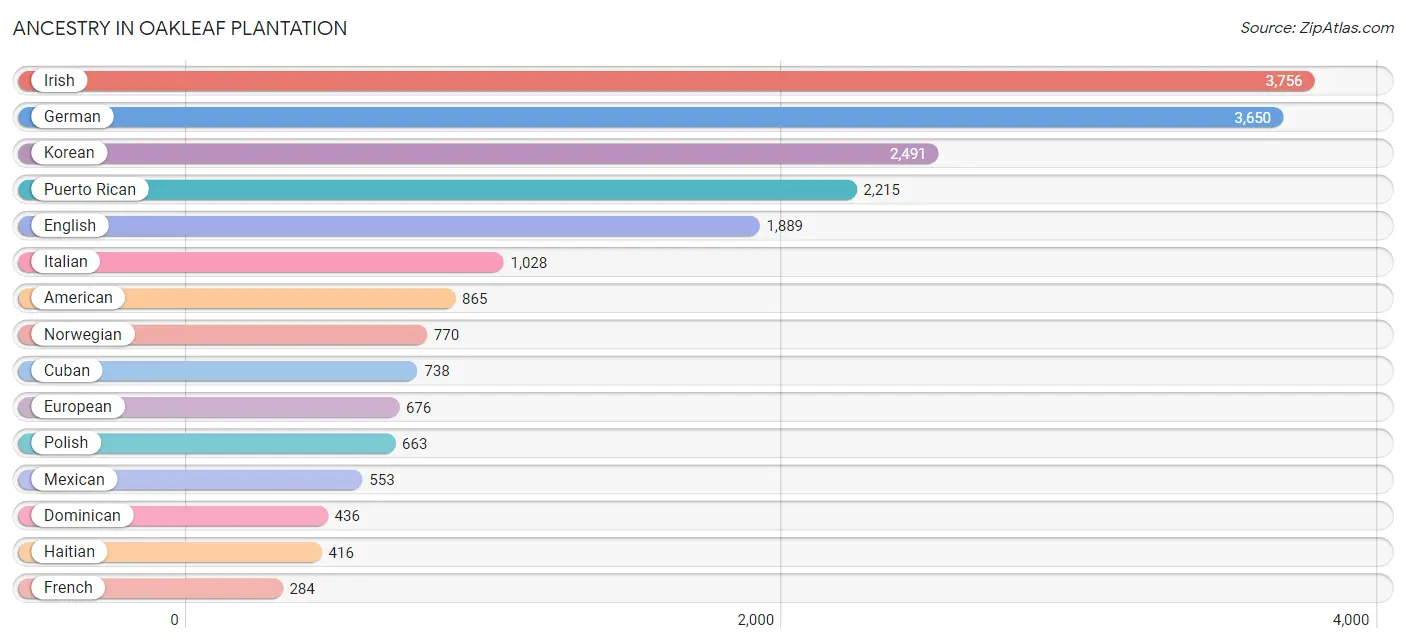
| Ancestry | # Population | % Population |
| African | 57 | 0.2% |
| American | 865 | 3.0% |
| Arab | 100 | 0.3% |
| Armenian | 38 | 0.1% |
| Bhutanese | 261 | 0.9% |
| Brazilian | 47 | 0.2% |
| British | 29 | 0.1% |
| Burmese | 135 | 0.5% |
| Central American | 174 | 0.6% |
| Cherokee | 24 | 0.1% |
| Chilean | 19 | 0.1% |
| Croatian | 15 | 0.1% |
| Cuban | 738 | 2.5% |
| Czech | 30 | 0.1% |
| Dominican | 436 | 1.5% |
| Dutch | 103 | 0.4% |
| Eastern European | 63 | 0.2% |
| English | 1,889 | 6.5% |
| European | 676 | 2.3% |
| Filipino | 77 | 0.3% |
| French | 284 | 1.0% |
| French Canadian | 57 | 0.2% |
| German | 3,650 | 12.5% |
| Greek | 23 | 0.1% |
| Guyanese | 25 | 0.1% |
| Haitian | 416 | 1.4% |
| Honduran | 151 | 0.5% |
| Indian (Asian) | 171 | 0.6% |
| Irish | 3,756 | 12.8% |
| Italian | 1,028 | 3.5% |
| Korean | 2,491 | 8.5% |
| Mexican | 553 | 1.9% |
| Native Hawaiian | 42 | 0.1% |
| Nigerian | 59 | 0.2% |
| Northern European | 91 | 0.3% |
| Norwegian | 770 | 2.6% |
| Palestinian | 100 | 0.3% |
| Pennsylvania German | 33 | 0.1% |
| Peruvian | 40 | 0.1% |
| Polish | 663 | 2.3% |
| Portuguese | 42 | 0.1% |
| Puerto Rican | 2,215 | 7.6% |
| Russian | 39 | 0.1% |
| Salvadoran | 23 | 0.1% |
| Scandinavian | 141 | 0.5% |
| Scotch-Irish | 72 | 0.3% |
| Scottish | 201 | 0.7% |
| South American | 90 | 0.3% |
| Spaniard | 20 | 0.1% |
| Sri Lankan | 77 | 0.3% |
| Subsaharan African | 116 | 0.4% |
| Swedish | 74 | 0.3% |
| Thai | 240 | 0.8% |
| Trinidadian and Tobagonian | 50 | 0.2% |
| Ukrainian | 57 | 0.2% |
| Venezuelan | 31 | 0.1% |
| Welsh | 93 | 0.3% |
| West Indian | 47 | 0.2% | View All 58 Rows |
Immigrants in Oakleaf Plantation
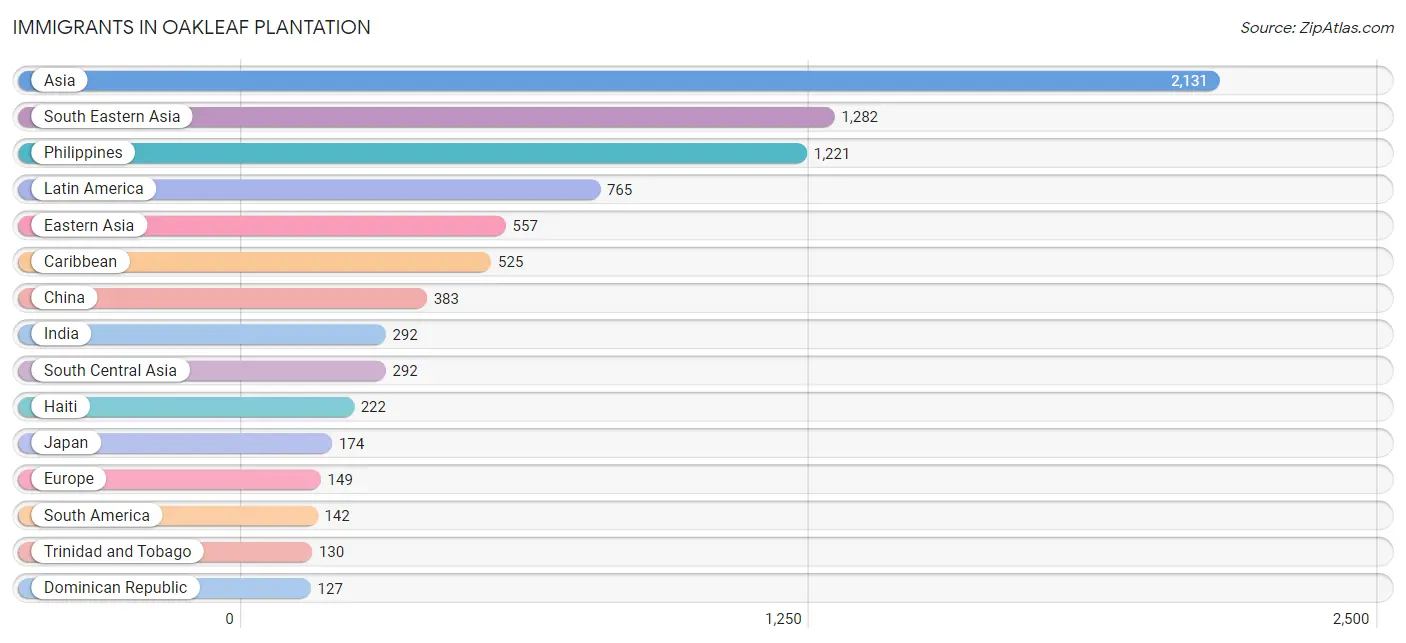
The most numerous immigrant groups reported in Oakleaf Plantation came from Asia (2,131 | 7.3%), South Eastern Asia (1,282 | 4.4%), Philippines (1,221 | 4.2%), Latin America (765 | 2.6%), and Eastern Asia (557 | 1.9%), together accounting for 20.3% of all Oakleaf Plantation residents.
| Immigration Origin | # Population | % Population |
| Asia | 2,131 | 7.3% |
| Brazil | 26 | 0.1% |
| Canada | 88 | 0.3% |
| Caribbean | 525 | 1.8% |
| Central America | 98 | 0.3% |
| China | 383 | 1.3% |
| Colombia | 20 | 0.1% |
| Cuba | 46 | 0.2% |
| Dominican Republic | 127 | 0.4% |
| Eastern Asia | 557 | 1.9% |
| Europe | 149 | 0.5% |
| Guyana | 25 | 0.1% |
| Haiti | 222 | 0.8% |
| Honduras | 29 | 0.1% |
| India | 292 | 1.0% |
| Italy | 112 | 0.4% |
| Japan | 174 | 0.6% |
| Latin America | 765 | 2.6% |
| Mexico | 69 | 0.2% |
| Northern Europe | 37 | 0.1% |
| Peru | 40 | 0.1% |
| Philippines | 1,221 | 4.2% |
| South America | 142 | 0.5% |
| South Central Asia | 292 | 1.0% |
| South Eastern Asia | 1,282 | 4.4% |
| Southern Europe | 112 | 0.4% |
| Taiwan | 77 | 0.3% |
| Trinidad and Tobago | 130 | 0.4% |
| Venezuela | 31 | 0.1% |
| Vietnam | 61 | 0.2% | View All 30 Rows |
Sex and Age in Oakleaf Plantation
Sex and Age in Oakleaf Plantation
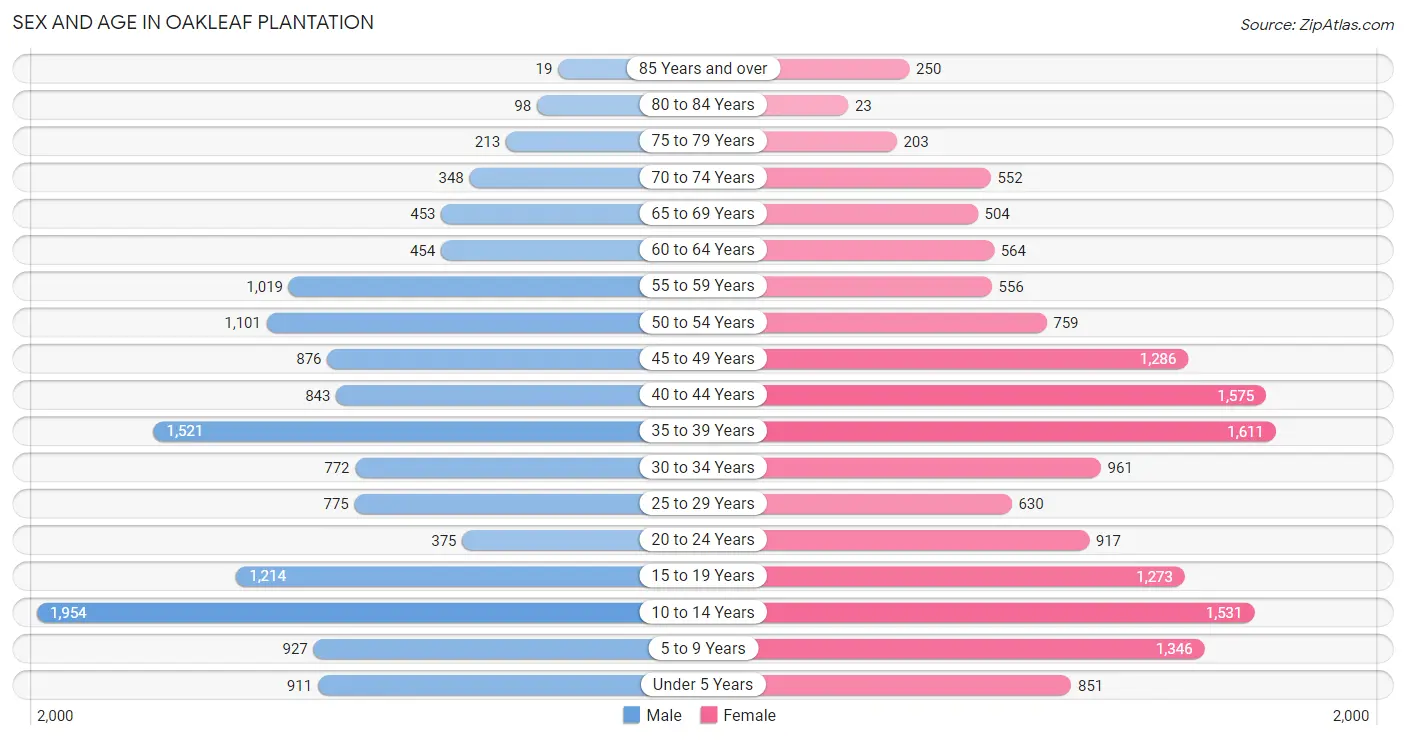
The most populous age groups in Oakleaf Plantation are 10 to 14 Years (1,954 | 14.1%) for men and 35 to 39 Years (1,611 | 10.5%) for women.
| Age Bracket | Male | Female |
| Under 5 Years | 911 (6.6%) | 851 (5.5%) |
| 5 to 9 Years | 927 (6.7%) | 1,346 (8.7%) |
| 10 to 14 Years | 1,954 (14.1%) | 1,531 (10.0%) |
| 15 to 19 Years | 1,214 (8.7%) | 1,273 (8.3%) |
| 20 to 24 Years | 375 (2.7%) | 917 (6.0%) |
| 25 to 29 Years | 775 (5.6%) | 630 (4.1%) |
| 30 to 34 Years | 772 (5.6%) | 961 (6.2%) |
| 35 to 39 Years | 1,521 (11.0%) | 1,611 (10.5%) |
| 40 to 44 Years | 843 (6.1%) | 1,575 (10.2%) |
| 45 to 49 Years | 876 (6.3%) | 1,286 (8.4%) |
| 50 to 54 Years | 1,101 (7.9%) | 759 (4.9%) |
| 55 to 59 Years | 1,019 (7.3%) | 556 (3.6%) |
| 60 to 64 Years | 454 (3.3%) | 564 (3.7%) |
| 65 to 69 Years | 453 (3.3%) | 504 (3.3%) |
| 70 to 74 Years | 348 (2.5%) | 552 (3.6%) |
| 75 to 79 Years | 213 (1.5%) | 203 (1.3%) |
| 80 to 84 Years | 98 (0.7%) | 23 (0.2%) |
| 85 Years and over | 19 (0.1%) | 250 (1.6%) |
| Total | 13,873 (100.0%) | 15,392 (100.0%) |
Families and Households in Oakleaf Plantation
Median Family Size in Oakleaf Plantation
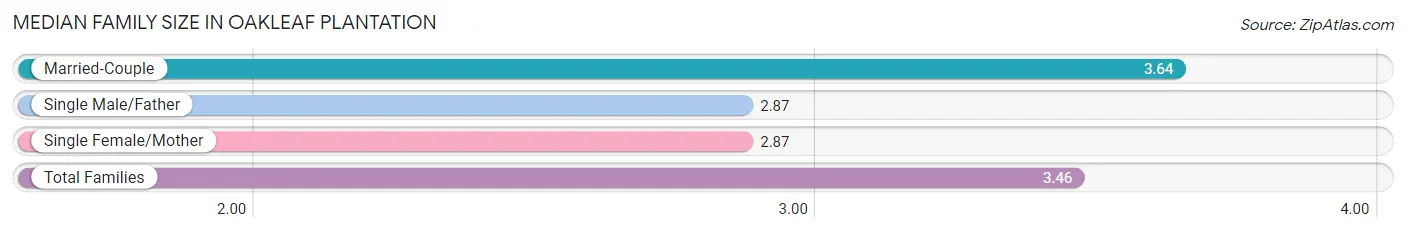
The median family size in Oakleaf Plantation is 3.46 persons per family, with married-couple families (6,043 | 77.7%) accounting for the largest median family size of 3.64 persons per family. On the other hand, single male/father families (538 | 6.9%) represent the smallest median family size with 2.87 persons per family.
| Family Type | # Families | Family Size |
| Married-Couple | 6,043 (77.7%) | 3.64 |
| Single Male/Father | 538 (6.9%) | 2.87 |
| Single Female/Mother | 1,194 (15.4%) | 2.87 |
| Total Families | 7,775 (100.0%) | 3.46 |
Median Household Size in Oakleaf Plantation
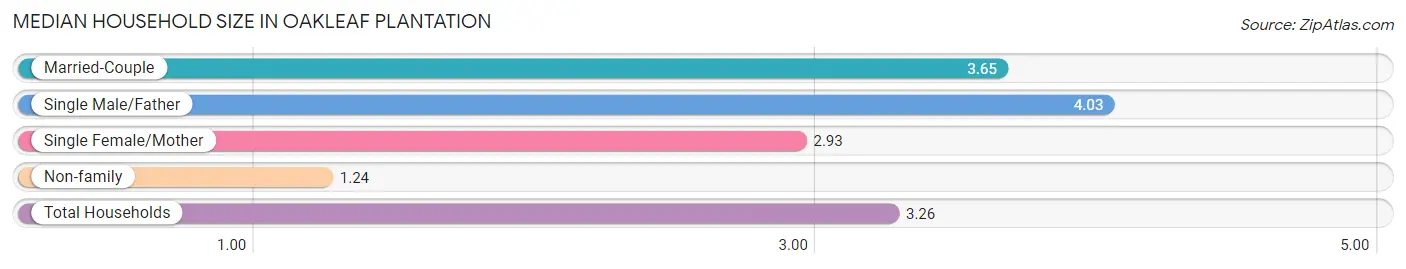
The median household size in Oakleaf Plantation is 3.26 persons per household, with single male/father households (538 | 6.0%) accounting for the largest median household size of 4.03 persons per household. non-family households (1,202 | 13.4%) represent the smallest median household size with 1.24 persons per household.
| Household Type | # Households | Household Size |
| Married-Couple | 6,043 (67.3%) | 3.65 |
| Single Male/Father | 538 (6.0%) | 4.03 |
| Single Female/Mother | 1,194 (13.3%) | 2.93 |
| Non-family | 1,202 (13.4%) | 1.24 |
| Total Households | 8,977 (100.0%) | 3.26 |
Household Size by Marriage Status in Oakleaf Plantation
Out of a total of 8,977 households in Oakleaf Plantation, 7,775 (86.6%) are family households, while 1,202 (13.4%) are nonfamily households. The most numerous type of family households are 2-person households, comprising 2,226, and the most common type of nonfamily households are 1-person households, comprising 959.
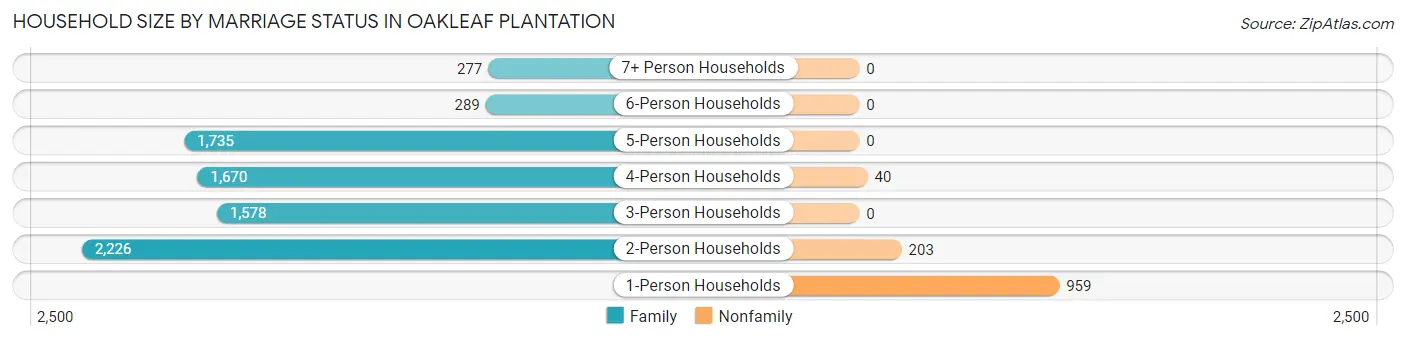
| Household Size | Family Households | Nonfamily Households |
| 1-Person Households | - | 959 (10.7%) |
| 2-Person Households | 2,226 (24.8%) | 203 (2.3%) |
| 3-Person Households | 1,578 (17.6%) | 0 (0.0%) |
| 4-Person Households | 1,670 (18.6%) | 40 (0.4%) |
| 5-Person Households | 1,735 (19.3%) | 0 (0.0%) |
| 6-Person Households | 289 (3.2%) | 0 (0.0%) |
| 7+ Person Households | 277 (3.1%) | 0 (0.0%) |
| Total | 7,775 (86.6%) | 1,202 (13.4%) |
Female Fertility in Oakleaf Plantation
Fertility by Age in Oakleaf Plantation
Average fertility rate in Oakleaf Plantation is 75.0 births per 1,000 women. Women in the age bracket of 20 to 34 years have the highest fertility rate with 100.0 births per 1,000 women. Women in the age bracket of 35 to 50 years acount for 59.8% of all women with births.
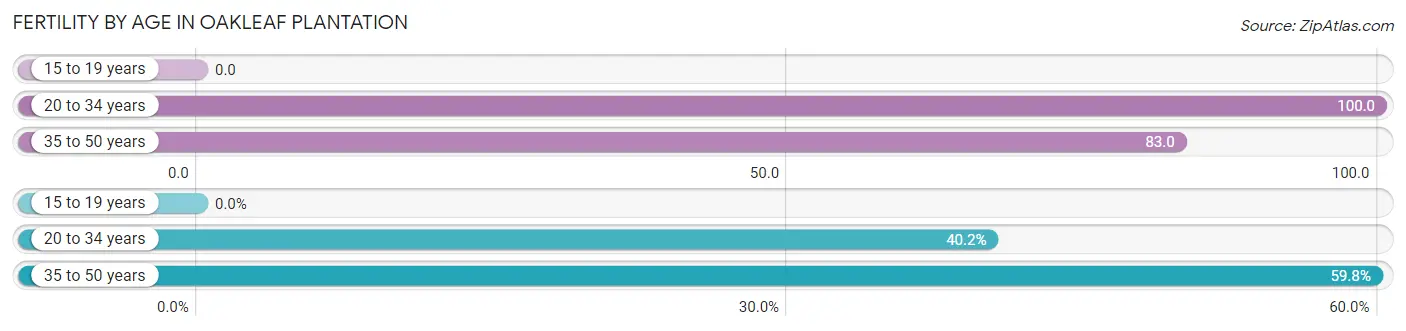
| Age Bracket | Women with Births | Births / 1,000 Women |
| 15 to 19 years | 0 (0.0%) | 0.0 |
| 20 to 34 years | 251 (40.2%) | 100.0 |
| 35 to 50 years | 373 (59.8%) | 83.0 |
| Total | 624 (100.0%) | 75.0 |
Fertility by Age by Marriage Status in Oakleaf Plantation
67.9% of women with births (624) in Oakleaf Plantation are married. The highest percentage of unmarried women with births falls into 35 to 50 years age bracket with 53.6% of them unmarried at the time of birth, while the lowest percentage of unmarried women with births belong to 20 to 34 years age bracket with 0.0% of them unmarried.
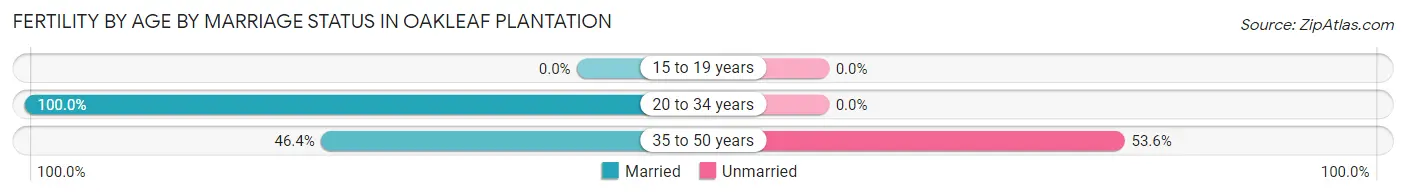
| Age Bracket | Married | Unmarried |
| 15 to 19 years | 0 (0.0%) | 0 (0.0%) |
| 20 to 34 years | 251 (100.0%) | 0 (0.0%) |
| 35 to 50 years | 173 (46.4%) | 200 (53.6%) |
| Total | 424 (67.9%) | 200 (32.1%) |
Fertility by Education in Oakleaf Plantation
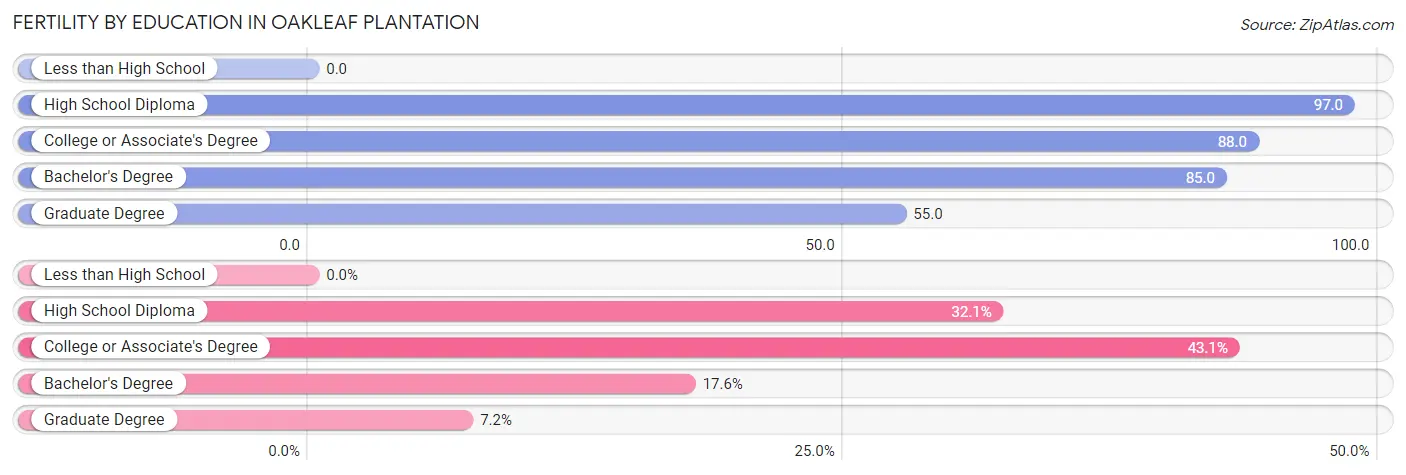
| Educational Attainment | Women with Births | Births / 1,000 Women |
| Less than High School | 0 (0.0%) | 0.0 |
| High School Diploma | 200 (32.1%) | 97.0 |
| College or Associate's Degree | 269 (43.1%) | 88.0 |
| Bachelor's Degree | 110 (17.6%) | 85.0 |
| Graduate Degree | 45 (7.2%) | 55.0 |
| Total | 624 (100.0%) | 75.0 |
Fertility by Education by Marriage Status in Oakleaf Plantation
32.1% of women with births in Oakleaf Plantation are unmarried. Women with the educational attainment of college or associate's degree are most likely to be married with 100.0% of them married at childbirth, while women with the educational attainment of high school diploma are least likely to be married with 100.0% of them unmarried at childbirth.
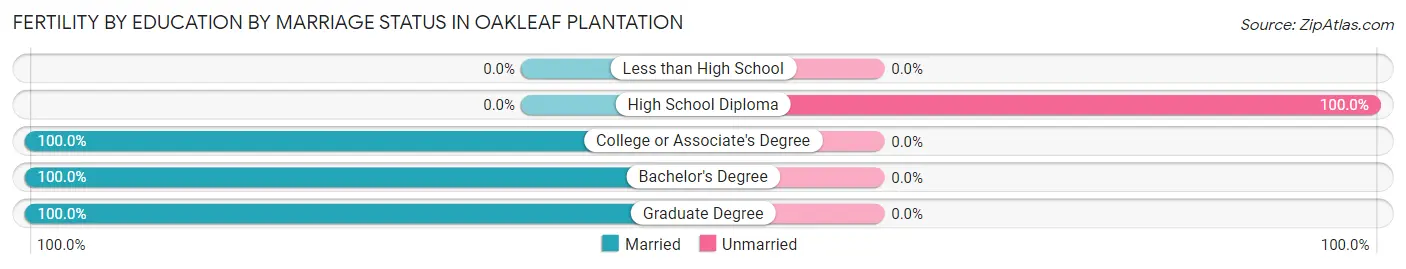
| Educational Attainment | Married | Unmarried |
| Less than High School | 0 (0.0%) | 0 (0.0%) |
| High School Diploma | 0 (0.0%) | 200 (100.0%) |
| College or Associate's Degree | 269 (100.0%) | 0 (0.0%) |
| Bachelor's Degree | 110 (100.0%) | 0 (0.0%) |
| Graduate Degree | 45 (100.0%) | 0 (0.0%) |
| Total | 424 (67.9%) | 200 (32.1%) |
Employment Characteristics in Oakleaf Plantation
Employment by Class of Employer in Oakleaf Plantation
Among the 13,782 employed individuals in Oakleaf Plantation, private company employees (9,795 | 71.1%), federal government employees (1,287 | 9.3%), and not-for-profit organizations (850 | 6.2%) make up the most common classes of employment.
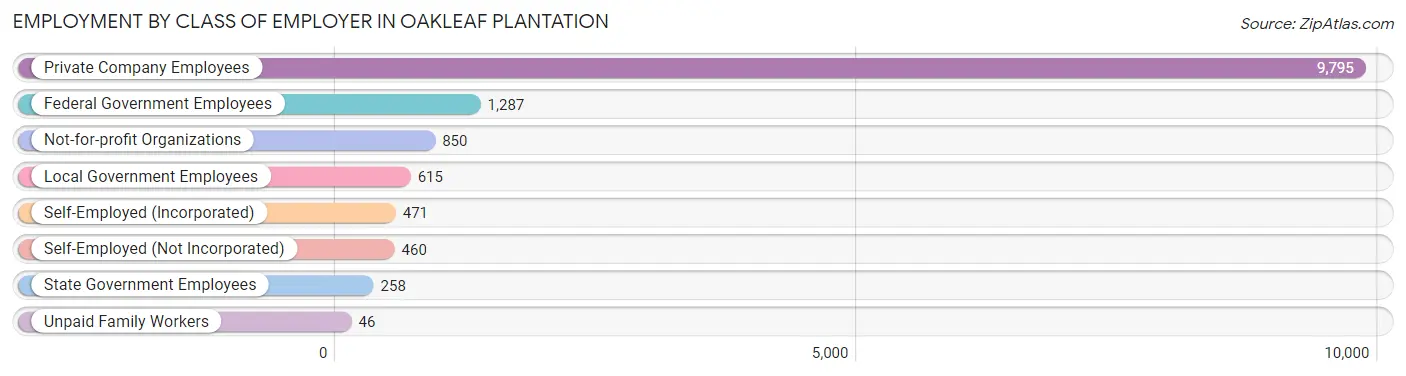
| Employer Class | # Employees | % Employees |
| Private Company Employees | 9,795 | 71.1% |
| Self-Employed (Incorporated) | 471 | 3.4% |
| Self-Employed (Not Incorporated) | 460 | 3.3% |
| Not-for-profit Organizations | 850 | 6.2% |
| Local Government Employees | 615 | 4.5% |
| State Government Employees | 258 | 1.9% |
| Federal Government Employees | 1,287 | 9.3% |
| Unpaid Family Workers | 46 | 0.3% |
| Total | 13,782 | 100.0% |
Employment Status by Age in Oakleaf Plantation
According to the labor force statistics for Oakleaf Plantation, out of the total population over 16 years of age (21,175), 68.2% or 14,441 individuals are in the labor force, with 2.7% or 390 of them unemployed. The age group with the highest labor force participation rate is 30 to 34 years, with 93.8% or 1,626 individuals in the labor force. Within the labor force, the 65 to 74 years age range has the highest percentage of unemployed individuals, with 25.4% or 58 of them being unemployed.
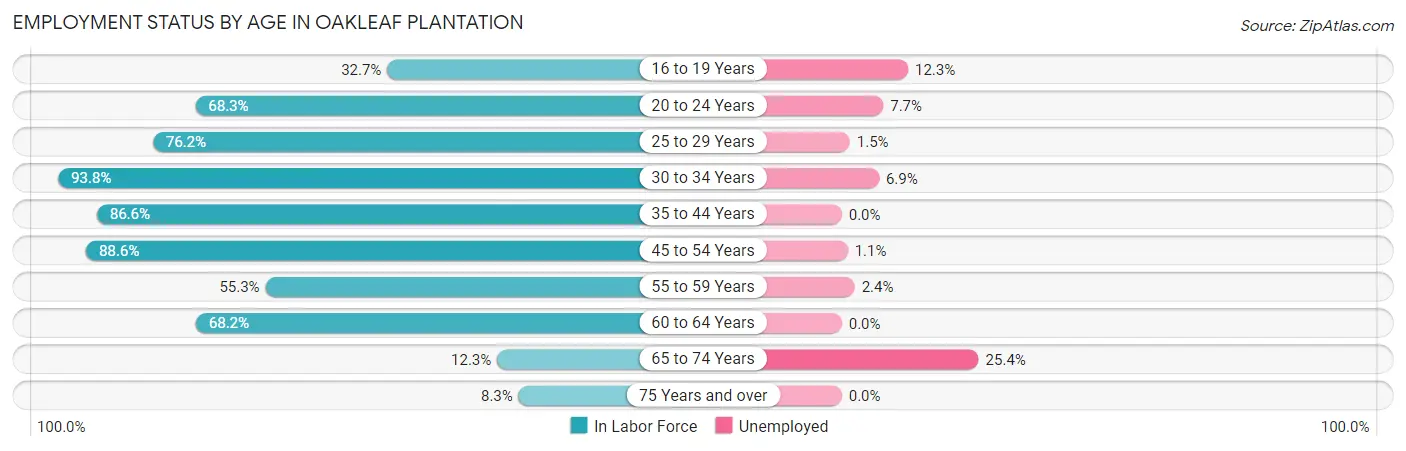
| Age Bracket | In Labor Force | Unemployed |
| 16 to 19 Years | 627 (32.7%) | 77 (12.3%) |
| 20 to 24 Years | 882 (68.3%) | 68 (7.7%) |
| 25 to 29 Years | 1,071 (76.2%) | 16 (1.5%) |
| 30 to 34 Years | 1,626 (93.8%) | 112 (6.9%) |
| 35 to 44 Years | 4,806 (86.6%) | 0 (0.0%) |
| 45 to 54 Years | 3,563 (88.6%) | 39 (1.1%) |
| 55 to 59 Years | 871 (55.3%) | 21 (2.4%) |
| 60 to 64 Years | 694 (68.2%) | 0 (0.0%) |
| 65 to 74 Years | 228 (12.3%) | 58 (25.4%) |
| 75 Years and over | 67 (8.3%) | 0 (0.0%) |
| Total | 14,441 (68.2%) | 390 (2.7%) |
Employment Status by Educational Attainment in Oakleaf Plantation
According to labor force statistics for Oakleaf Plantation, 82.5% of individuals (12,625) out of the total population between 25 and 64 years of age (15,303) are in the labor force, with 1.4% or 177 of them being unemployed. The group with the highest labor force participation rate are those with the educational attainment of bachelor's degree or higher, with 87.8% or 4,371 individuals in the labor force. Within the labor force, individuals with college / associate degree education have the highest percentage of unemployment, with 2.0% or 117 of them being unemployed.
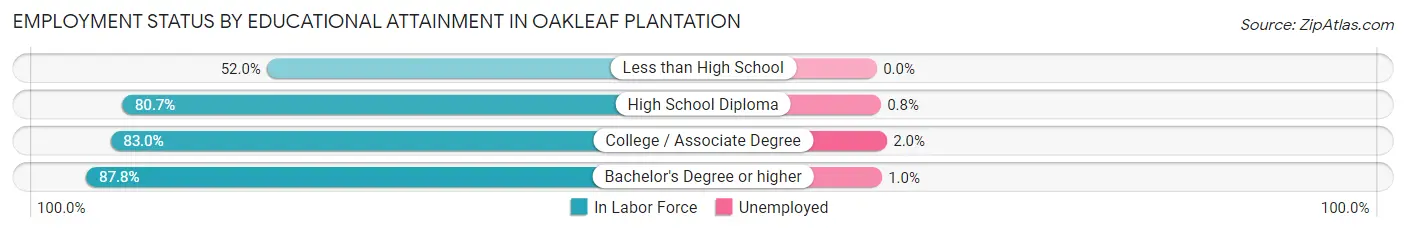
| Educational Attainment | In Labor Force | Unemployed |
| Less than High School | 415 (52.0%) | 0 (0.0%) |
| High School Diploma | 2,003 (80.7%) | 20 (0.8%) |
| College / Associate Degree | 5,847 (83.0%) | 141 (2.0%) |
| Bachelor's Degree or higher | 4,371 (87.8%) | 50 (1.0%) |
| Total | 12,625 (82.5%) | 214 (1.4%) |
Employment Occupations by Sex in Oakleaf Plantation
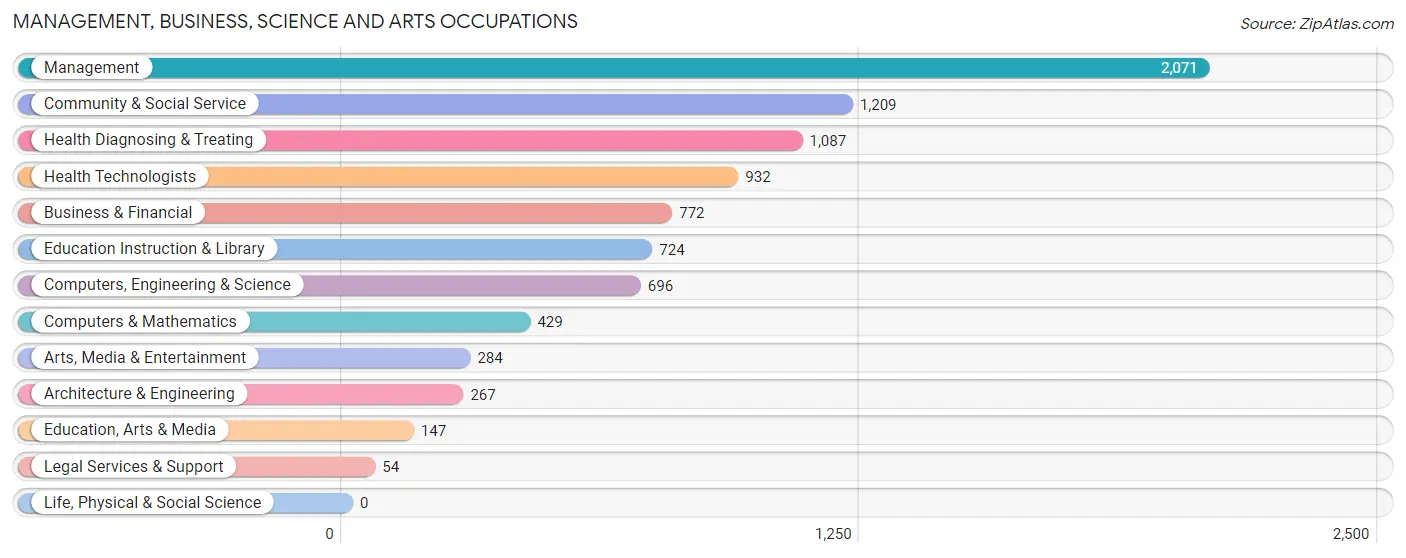
Management, Business, Science and Arts Occupations
The most common Management, Business, Science and Arts occupations in Oakleaf Plantation are Management (2,071 | 15.2%), Community & Social Service (1,209 | 8.9%), Health Diagnosing & Treating (1,087 | 8.0%), Health Technologists (932 | 6.8%), and Business & Financial (772 | 5.7%).
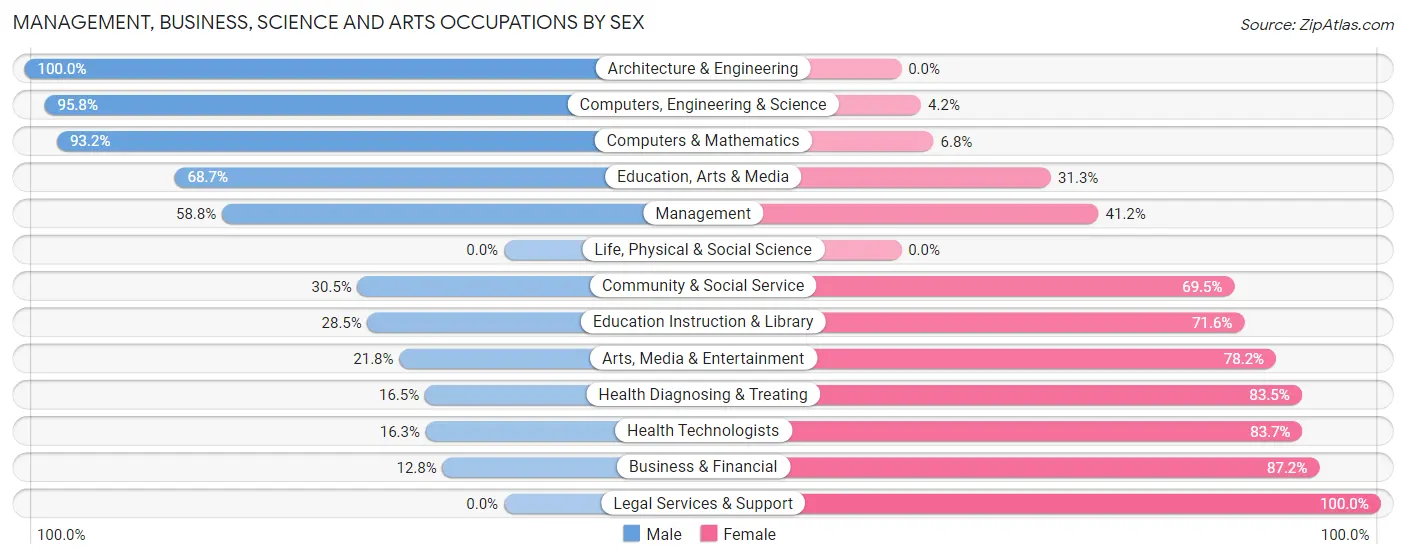
Management, Business, Science and Arts Occupations by Sex
Within the Management, Business, Science and Arts occupations in Oakleaf Plantation, the most male-oriented occupations are Architecture & Engineering (100.0%), Computers, Engineering & Science (95.8%), and Computers & Mathematics (93.2%), while the most female-oriented occupations are Legal Services & Support (100.0%), Business & Financial (87.2%), and Health Technologists (83.7%).
| Occupation | Male | Female |
| Management | 1,218 (58.8%) | 853 (41.2%) |
| Business & Financial | 99 (12.8%) | 673 (87.2%) |
| Computers, Engineering & Science | 667 (95.8%) | 29 (4.2%) |
| Computers & Mathematics | 400 (93.2%) | 29 (6.8%) |
| Architecture & Engineering | 267 (100.0%) | 0 (0.0%) |
| Life, Physical & Social Science | 0 (0.0%) | 0 (0.0%) |
| Community & Social Service | 369 (30.5%) | 840 (69.5%) |
| Education, Arts & Media | 101 (68.7%) | 46 (31.3%) |
| Legal Services & Support | 0 (0.0%) | 54 (100.0%) |
| Education Instruction & Library | 206 (28.4%) | 518 (71.6%) |
| Arts, Media & Entertainment | 62 (21.8%) | 222 (78.2%) |
| Health Diagnosing & Treating | 179 (16.5%) | 908 (83.5%) |
| Health Technologists | 152 (16.3%) | 780 (83.7%) |
| Total (Category) | 2,532 (43.4%) | 3,303 (56.6%) |
| Total (Overall) | 6,421 (47.1%) | 7,215 (52.9%) |
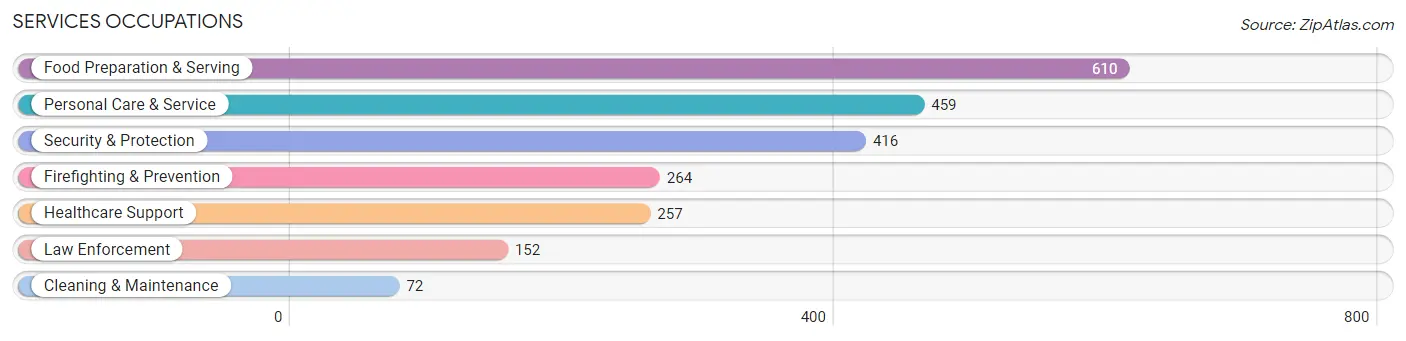
Services Occupations
The most common Services occupations in Oakleaf Plantation are Food Preparation & Serving (610 | 4.5%), Personal Care & Service (459 | 3.4%), Security & Protection (416 | 3.0%), Firefighting & Prevention (264 | 1.9%), and Healthcare Support (257 | 1.9%).
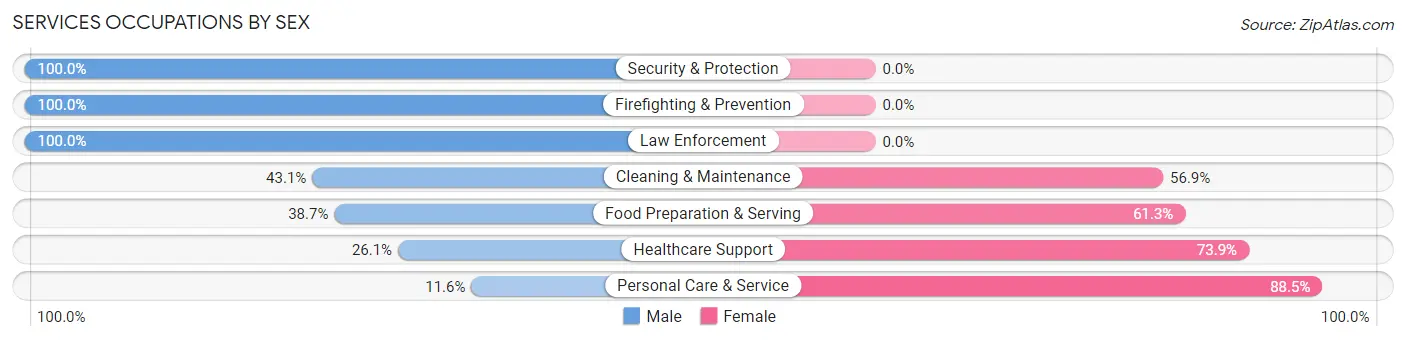
Services Occupations by Sex
Within the Services occupations in Oakleaf Plantation, the most male-oriented occupations are Security & Protection (100.0%), Firefighting & Prevention (100.0%), and Law Enforcement (100.0%), while the most female-oriented occupations are Personal Care & Service (88.4%), Healthcare Support (73.9%), and Food Preparation & Serving (61.3%).
| Occupation | Male | Female |
| Healthcare Support | 67 (26.1%) | 190 (73.9%) |
| Security & Protection | 416 (100.0%) | 0 (0.0%) |
| Firefighting & Prevention | 264 (100.0%) | 0 (0.0%) |
| Law Enforcement | 152 (100.0%) | 0 (0.0%) |
| Food Preparation & Serving | 236 (38.7%) | 374 (61.3%) |
| Cleaning & Maintenance | 31 (43.1%) | 41 (56.9%) |
| Personal Care & Service | 53 (11.6%) | 406 (88.4%) |
| Total (Category) | 803 (44.3%) | 1,011 (55.7%) |
| Total (Overall) | 6,421 (47.1%) | 7,215 (52.9%) |
Sales and Office Occupations
The most common Sales and Office occupations in Oakleaf Plantation are Office & Administration (2,285 | 16.8%), and Sales & Related (2,035 | 14.9%).
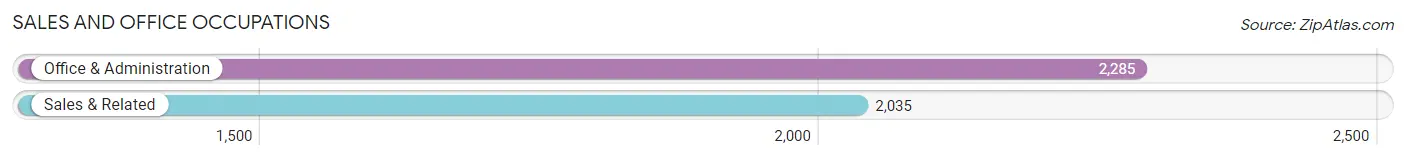
Sales and Office Occupations by Sex
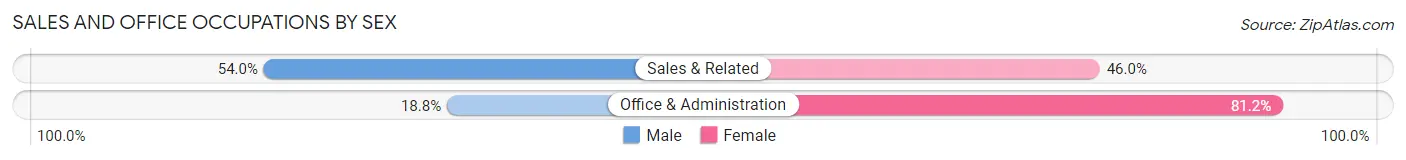
| Occupation | Male | Female |
| Sales & Related | 1,099 (54.0%) | 936 (46.0%) |
| Office & Administration | 429 (18.8%) | 1,856 (81.2%) |
| Total (Category) | 1,528 (35.4%) | 2,792 (64.6%) |
| Total (Overall) | 6,421 (47.1%) | 7,215 (52.9%) |
Natural Resources, Construction and Maintenance Occupations
The most common Natural Resources, Construction and Maintenance occupations in Oakleaf Plantation are Installation, Maintenance & Repair (234 | 1.7%), and Construction & Extraction (157 | 1.1%).
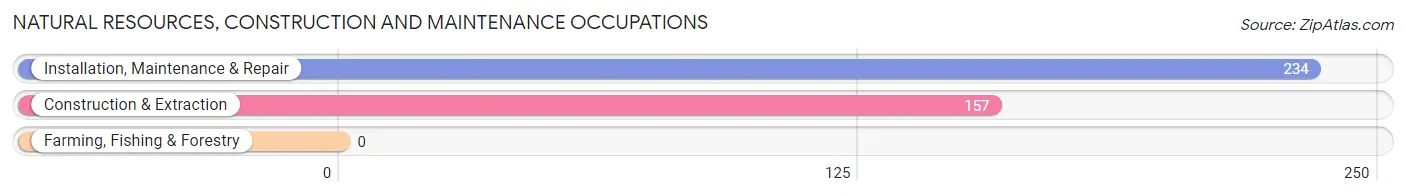
Natural Resources, Construction and Maintenance Occupations by Sex
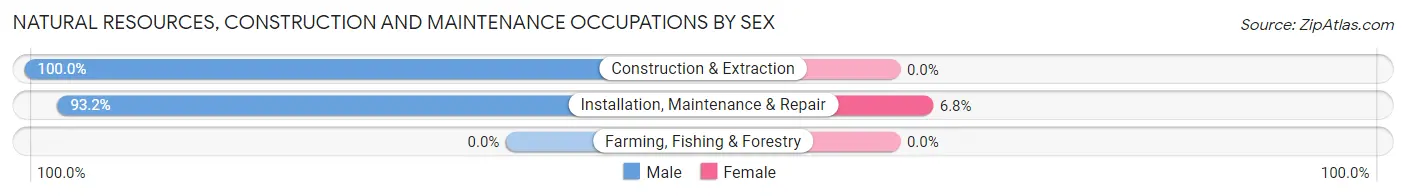
| Occupation | Male | Female |
| Farming, Fishing & Forestry | 0 (0.0%) | 0 (0.0%) |
| Construction & Extraction | 157 (100.0%) | 0 (0.0%) |
| Installation, Maintenance & Repair | 218 (93.2%) | 16 (6.8%) |
| Total (Category) | 375 (95.9%) | 16 (4.1%) |
| Total (Overall) | 6,421 (47.1%) | 7,215 (52.9%) |
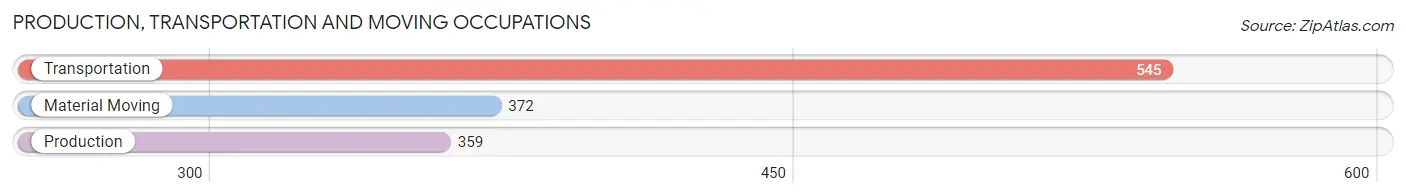
Production, Transportation and Moving Occupations
The most common Production, Transportation and Moving occupations in Oakleaf Plantation are Transportation (545 | 4.0%), Material Moving (372 | 2.7%), and Production (359 | 2.6%).
Production, Transportation and Moving Occupations by Sex
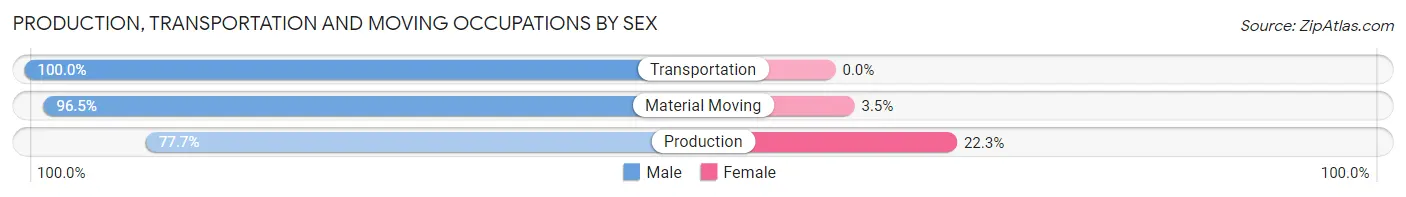
| Occupation | Male | Female |
| Production | 279 (77.7%) | 80 (22.3%) |
| Transportation | 545 (100.0%) | 0 (0.0%) |
| Material Moving | 359 (96.5%) | 13 (3.5%) |
| Total (Category) | 1,183 (92.7%) | 93 (7.3%) |
| Total (Overall) | 6,421 (47.1%) | 7,215 (52.9%) |
Employment Industries by Sex in Oakleaf Plantation
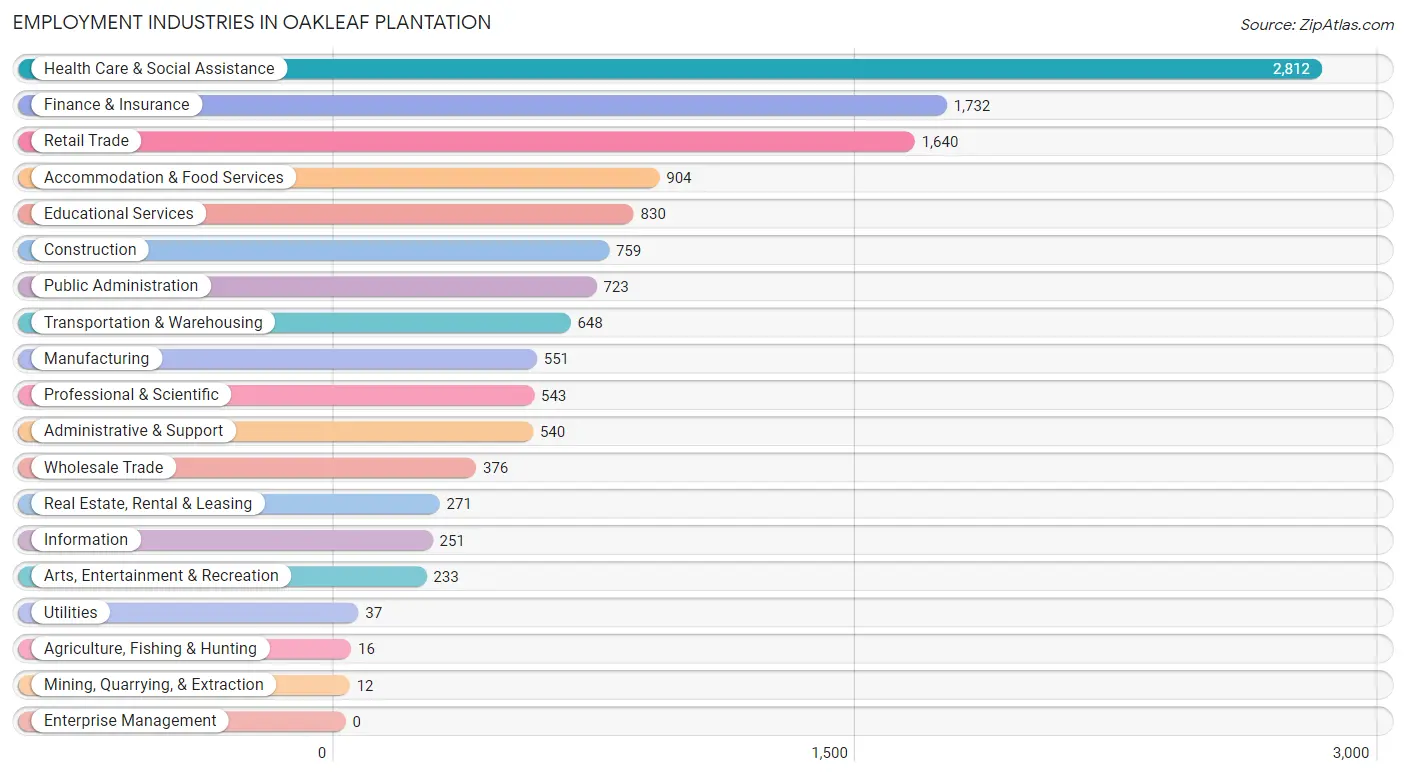
Employment Industries in Oakleaf Plantation
The major employment industries in Oakleaf Plantation include Health Care & Social Assistance (2,812 | 20.6%), Finance & Insurance (1,732 | 12.7%), Retail Trade (1,640 | 12.0%), Accommodation & Food Services (904 | 6.6%), and Educational Services (830 | 6.1%).
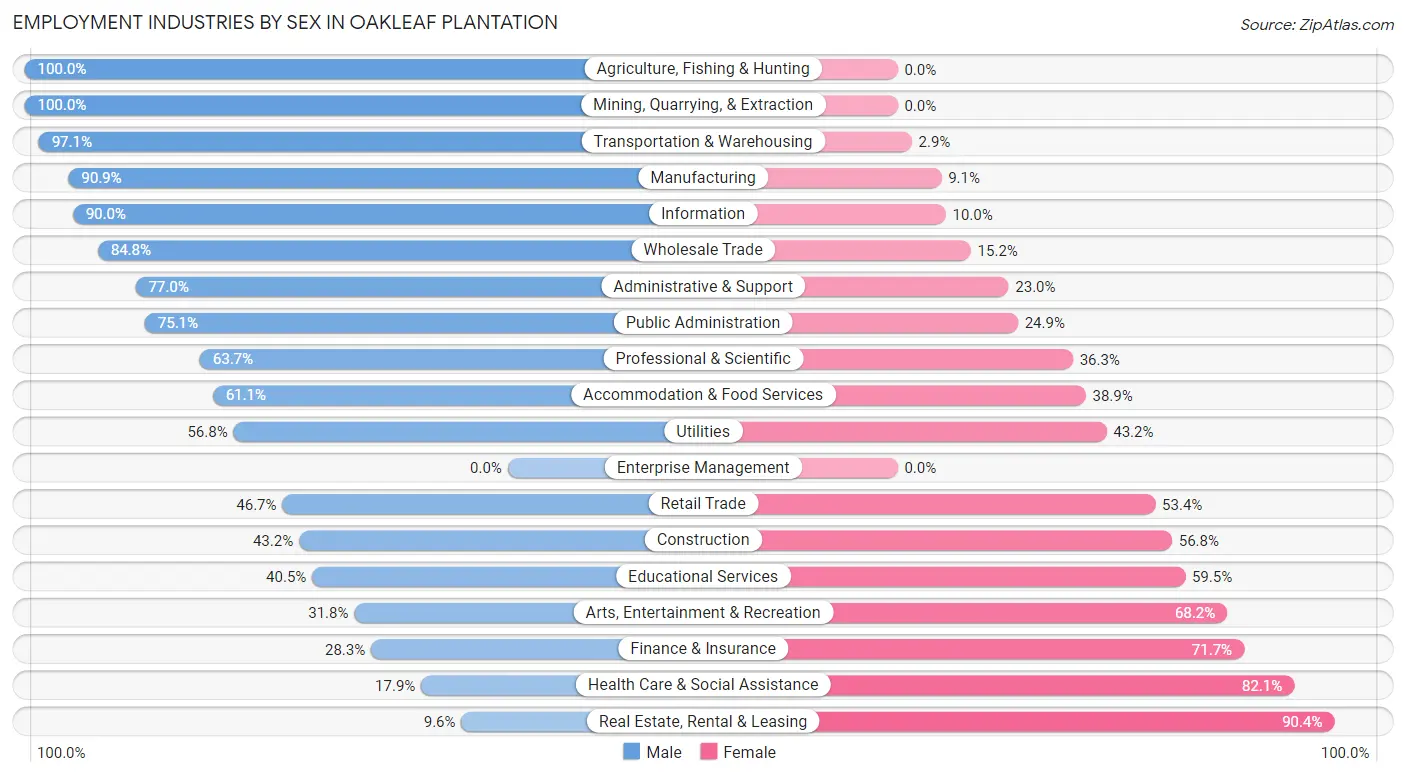
Employment Industries by Sex in Oakleaf Plantation
The Oakleaf Plantation industries that see more men than women are Agriculture, Fishing & Hunting (100.0%), Mining, Quarrying, & Extraction (100.0%), and Transportation & Warehousing (97.1%), whereas the industries that tend to have a higher number of women are Real Estate, Rental & Leasing (90.4%), Health Care & Social Assistance (82.1%), and Finance & Insurance (71.7%).
| Industry | Male | Female |
| Agriculture, Fishing & Hunting | 16 (100.0%) | 0 (0.0%) |
| Mining, Quarrying, & Extraction | 12 (100.0%) | 0 (0.0%) |
| Construction | 328 (43.2%) | 431 (56.8%) |
| Manufacturing | 501 (90.9%) | 50 (9.1%) |
| Wholesale Trade | 319 (84.8%) | 57 (15.2%) |
| Retail Trade | 765 (46.7%) | 875 (53.3%) |
| Transportation & Warehousing | 629 (97.1%) | 19 (2.9%) |
| Utilities | 21 (56.8%) | 16 (43.2%) |
| Information | 226 (90.0%) | 25 (10.0%) |
| Finance & Insurance | 490 (28.3%) | 1,242 (71.7%) |
| Real Estate, Rental & Leasing | 26 (9.6%) | 245 (90.4%) |
| Professional & Scientific | 346 (63.7%) | 197 (36.3%) |
| Enterprise Management | 0 (0.0%) | 0 (0.0%) |
| Administrative & Support | 416 (77.0%) | 124 (23.0%) |
| Educational Services | 336 (40.5%) | 494 (59.5%) |
| Health Care & Social Assistance | 504 (17.9%) | 2,308 (82.1%) |
| Arts, Entertainment & Recreation | 74 (31.8%) | 159 (68.2%) |
| Accommodation & Food Services | 552 (61.1%) | 352 (38.9%) |
| Public Administration | 543 (75.1%) | 180 (24.9%) |
| Total | 6,421 (47.1%) | 7,215 (52.9%) |
Education in Oakleaf Plantation
School Enrollment in Oakleaf Plantation
The most common levels of schooling among the 9,604 students in Oakleaf Plantation are high school (2,638 | 27.5%), middle school (2,611 | 27.2%), and elementary school (1,891 | 19.7%).
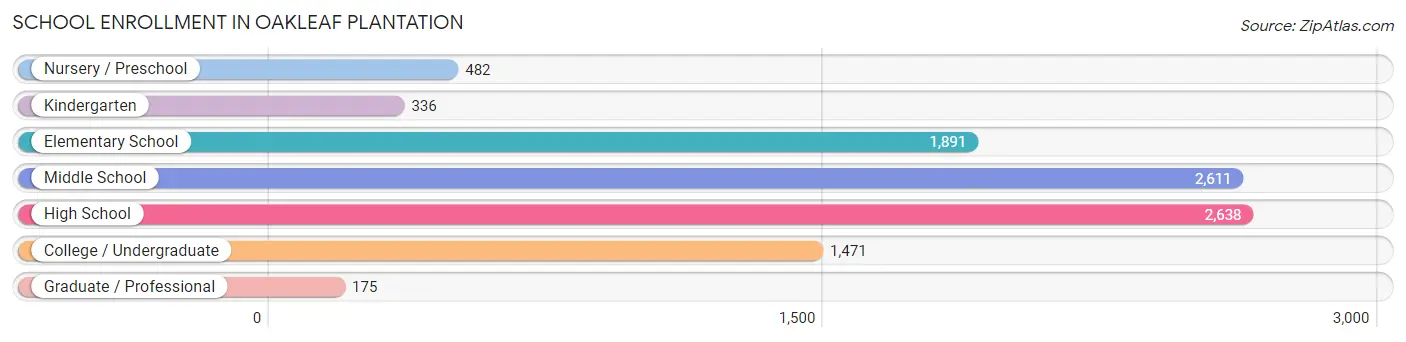
| School Level | # Students | % Students |
| Nursery / Preschool | 482 | 5.0% |
| Kindergarten | 336 | 3.5% |
| Elementary School | 1,891 | 19.7% |
| Middle School | 2,611 | 27.2% |
| High School | 2,638 | 27.5% |
| College / Undergraduate | 1,471 | 15.3% |
| Graduate / Professional | 175 | 1.8% |
| Total | 9,604 | 100.0% |
School Enrollment by Age by Funding Source in Oakleaf Plantation
Out of a total of 9,604 students who are enrolled in schools in Oakleaf Plantation, 1,258 (13.1%) attend a private institution, while the remaining 8,346 (86.9%) are enrolled in public schools. The age group of 3 to 4 year olds has the highest likelihood of being enrolled in private schools, with 66 (24.2% in the age bracket) enrolled. Conversely, the age group of 20 to 24 year olds has the lowest likelihood of being enrolled in a private school, with 398 (100.0% in the age bracket) attending a public institution.
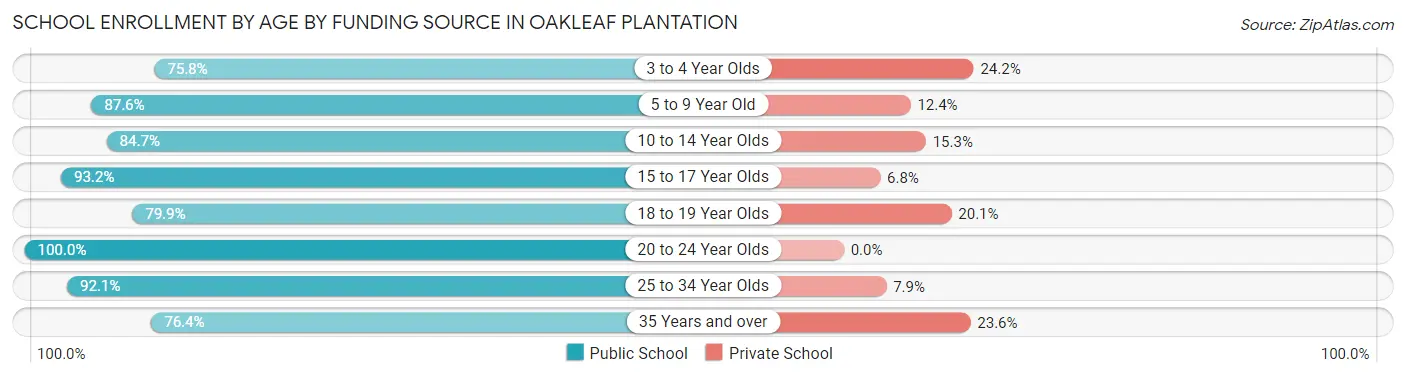
| Age Bracket | Public School | Private School |
| 3 to 4 Year Olds | 207 (75.8%) | 66 (24.2%) |
| 5 to 9 Year Old | 1,823 (87.6%) | 259 (12.4%) |
| 10 to 14 Year Olds | 2,952 (84.7%) | 533 (15.3%) |
| 15 to 17 Year Olds | 1,621 (93.2%) | 118 (6.8%) |
| 18 to 19 Year Olds | 271 (79.9%) | 68 (20.1%) |
| 20 to 24 Year Olds | 398 (100.0%) | 0 (0.0%) |
| 25 to 34 Year Olds | 511 (92.1%) | 44 (7.9%) |
| 35 Years and over | 560 (76.4%) | 173 (23.6%) |
| Total | 8,346 (86.9%) | 1,258 (13.1%) |
Educational Attainment by Field of Study in Oakleaf Plantation
Business (1,394 | 22.6%), science & technology (1,034 | 16.8%), education (936 | 15.2%), psychology (489 | 7.9%), and computers & mathematics (430 | 7.0%) are the most common fields of study among 6,169 individuals in Oakleaf Plantation who have obtained a bachelor's degree or higher.
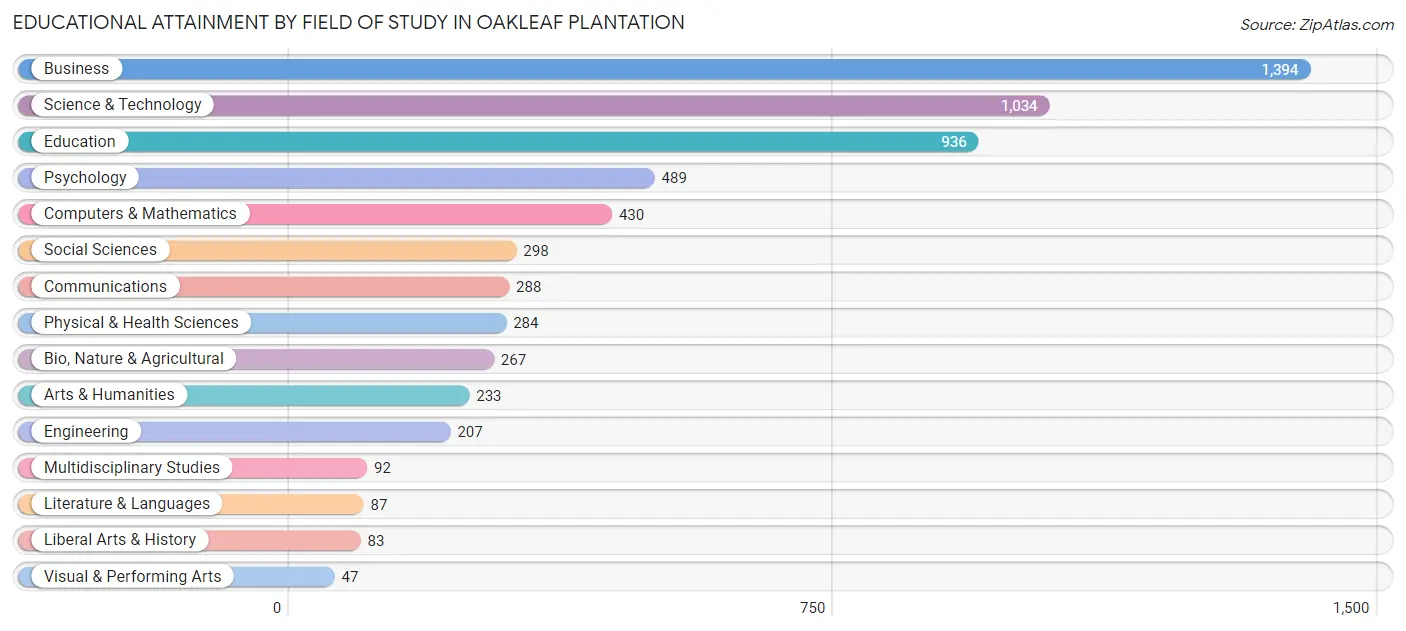
| Field of Study | # Graduates | % Graduates |
| Computers & Mathematics | 430 | 7.0% |
| Bio, Nature & Agricultural | 267 | 4.3% |
| Physical & Health Sciences | 284 | 4.6% |
| Psychology | 489 | 7.9% |
| Social Sciences | 298 | 4.8% |
| Engineering | 207 | 3.4% |
| Multidisciplinary Studies | 92 | 1.5% |
| Science & Technology | 1,034 | 16.8% |
| Business | 1,394 | 22.6% |
| Education | 936 | 15.2% |
| Literature & Languages | 87 | 1.4% |
| Liberal Arts & History | 83 | 1.3% |
| Visual & Performing Arts | 47 | 0.8% |
| Communications | 288 | 4.7% |
| Arts & Humanities | 233 | 3.8% |
| Total | 6,169 | 100.0% |
Transportation & Commute in Oakleaf Plantation
Vehicle Availability by Sex in Oakleaf Plantation
The most prevalent vehicle ownership categories in Oakleaf Plantation are males with 2 vehicles (3,445, accounting for 51.4%) and females with 2 vehicles (2,869, making up 48.6%).
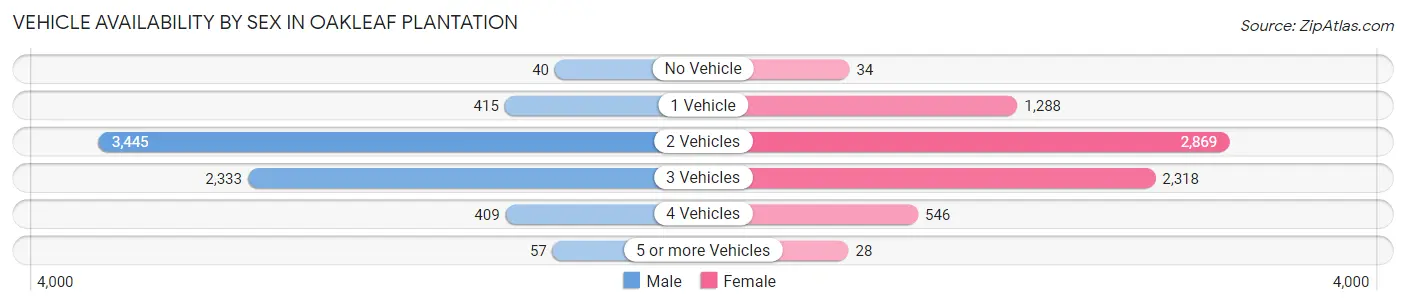
| Vehicles Available | Male | Female |
| No Vehicle | 40 (0.6%) | 34 (0.5%) |
| 1 Vehicle | 415 (6.2%) | 1,288 (18.2%) |
| 2 Vehicles | 3,445 (51.4%) | 2,869 (40.5%) |
| 3 Vehicles | 2,333 (34.8%) | 2,318 (32.7%) |
| 4 Vehicles | 409 (6.1%) | 546 (7.7%) |
| 5 or more Vehicles | 57 (0.9%) | 28 (0.4%) |
| Total | 6,699 (100.0%) | 7,083 (100.0%) |
Commute Time in Oakleaf Plantation
The most frequently occuring commute durations in Oakleaf Plantation are 30 to 34 minutes (2,193 commuters, 19.4%), 45 to 59 minutes (2,113 commuters, 18.6%), and 20 to 24 minutes (2,050 commuters, 18.1%).
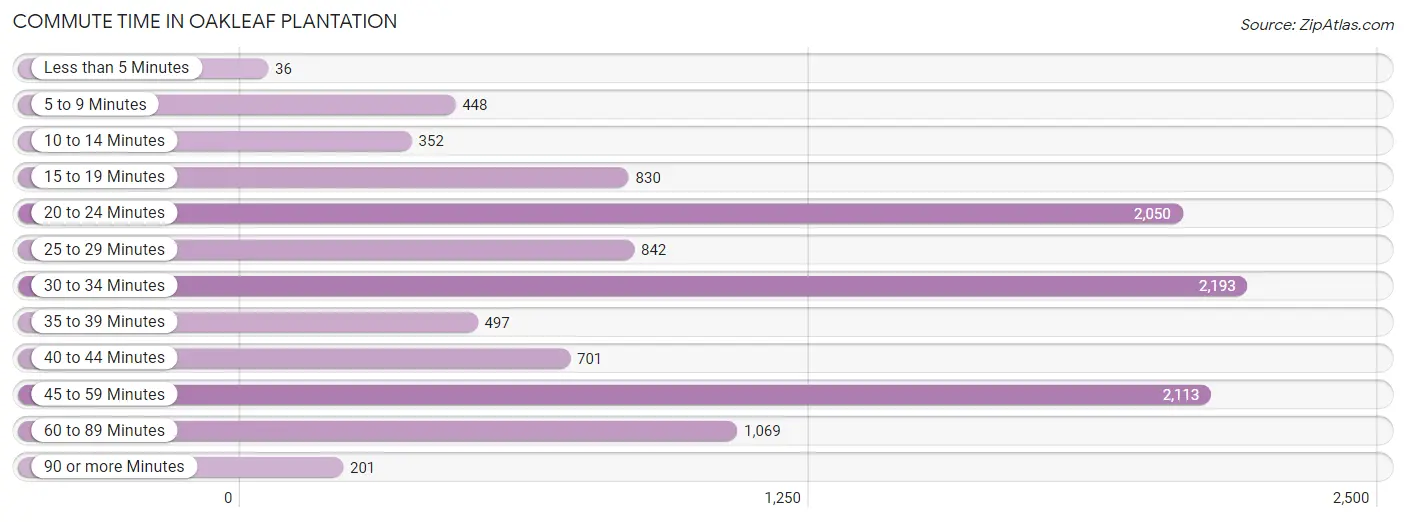
| Commute Time | # Commuters | % Commuters |
| Less than 5 Minutes | 36 | 0.3% |
| 5 to 9 Minutes | 448 | 4.0% |
| 10 to 14 Minutes | 352 | 3.1% |
| 15 to 19 Minutes | 830 | 7.3% |
| 20 to 24 Minutes | 2,050 | 18.1% |
| 25 to 29 Minutes | 842 | 7.4% |
| 30 to 34 Minutes | 2,193 | 19.4% |
| 35 to 39 Minutes | 497 | 4.4% |
| 40 to 44 Minutes | 701 | 6.2% |
| 45 to 59 Minutes | 2,113 | 18.6% |
| 60 to 89 Minutes | 1,069 | 9.4% |
| 90 or more Minutes | 201 | 1.8% |
Commute Time by Sex in Oakleaf Plantation
The most common commute times in Oakleaf Plantation are 30 to 34 minutes (1,518 commuters, 24.6%) for males and 20 to 24 minutes (1,574 commuters, 30.5%) for females.
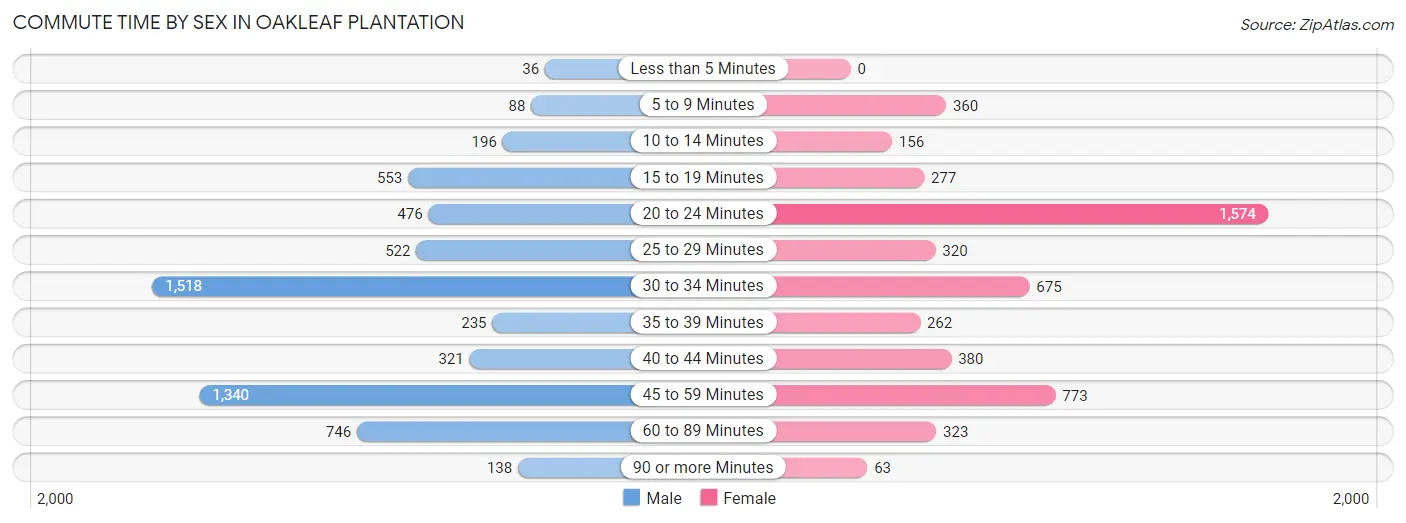
| Commute Time | Male | Female |
| Less than 5 Minutes | 36 (0.6%) | 0 (0.0%) |
| 5 to 9 Minutes | 88 (1.4%) | 360 (7.0%) |
| 10 to 14 Minutes | 196 (3.2%) | 156 (3.0%) |
| 15 to 19 Minutes | 553 (9.0%) | 277 (5.4%) |
| 20 to 24 Minutes | 476 (7.7%) | 1,574 (30.5%) |
| 25 to 29 Minutes | 522 (8.5%) | 320 (6.2%) |
| 30 to 34 Minutes | 1,518 (24.6%) | 675 (13.1%) |
| 35 to 39 Minutes | 235 (3.8%) | 262 (5.1%) |
| 40 to 44 Minutes | 321 (5.2%) | 380 (7.4%) |
| 45 to 59 Minutes | 1,340 (21.7%) | 773 (15.0%) |
| 60 to 89 Minutes | 746 (12.1%) | 323 (6.3%) |
| 90 or more Minutes | 138 (2.2%) | 63 (1.2%) |
Time of Departure to Work by Sex in Oakleaf Plantation
The most frequent times of departure to work in Oakleaf Plantation are 7:00 AM to 7:29 AM (987, 16.0%) for males and 6:00 AM to 6:29 AM (1,241, 24.0%) for females.
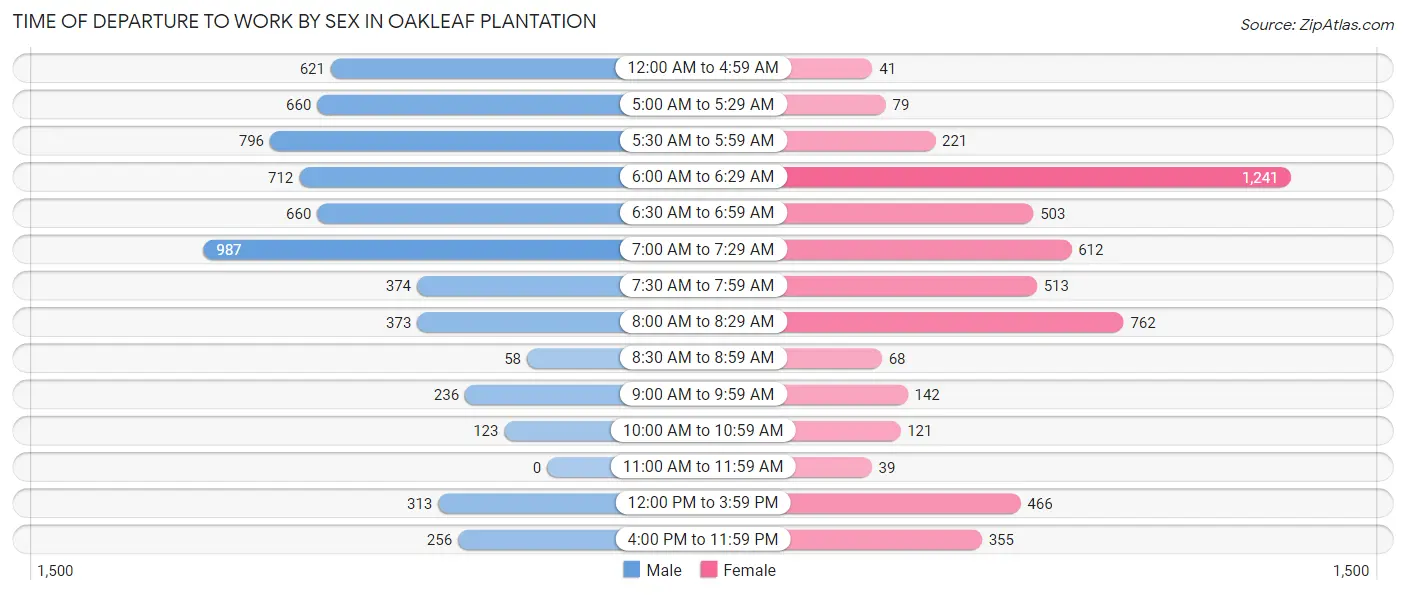
| Time of Departure | Male | Female |
| 12:00 AM to 4:59 AM | 621 (10.1%) | 41 (0.8%) |
| 5:00 AM to 5:29 AM | 660 (10.7%) | 79 (1.5%) |
| 5:30 AM to 5:59 AM | 796 (12.9%) | 221 (4.3%) |
| 6:00 AM to 6:29 AM | 712 (11.5%) | 1,241 (24.0%) |
| 6:30 AM to 6:59 AM | 660 (10.7%) | 503 (9.7%) |
| 7:00 AM to 7:29 AM | 987 (16.0%) | 612 (11.8%) |
| 7:30 AM to 7:59 AM | 374 (6.1%) | 513 (9.9%) |
| 8:00 AM to 8:29 AM | 373 (6.0%) | 762 (14.8%) |
| 8:30 AM to 8:59 AM | 58 (0.9%) | 68 (1.3%) |
| 9:00 AM to 9:59 AM | 236 (3.8%) | 142 (2.8%) |
| 10:00 AM to 10:59 AM | 123 (2.0%) | 121 (2.3%) |
| 11:00 AM to 11:59 AM | 0 (0.0%) | 39 (0.8%) |
| 12:00 PM to 3:59 PM | 313 (5.1%) | 466 (9.0%) |
| 4:00 PM to 11:59 PM | 256 (4.2%) | 355 (6.9%) |
| Total | 6,169 (100.0%) | 5,163 (100.0%) |
Housing Occupancy in Oakleaf Plantation
Occupancy by Ownership in Oakleaf Plantation
Of the total 8,977 dwellings in Oakleaf Plantation, owner-occupied units account for 7,472 (83.2%), while renter-occupied units make up 1,505 (16.8%).
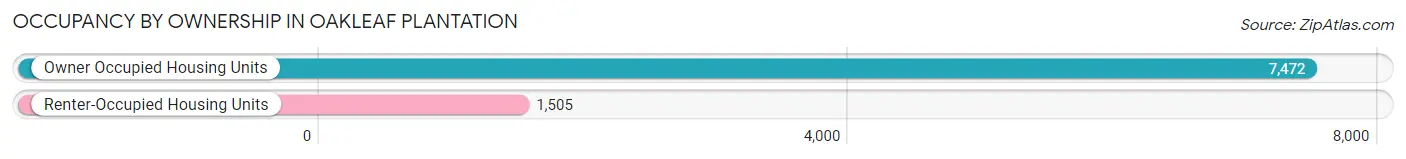
| Occupancy | # Housing Units | % Housing Units |
| Owner Occupied Housing Units | 7,472 | 83.2% |
| Renter-Occupied Housing Units | 1,505 | 16.8% |
| Total Occupied Housing Units | 8,977 | 100.0% |
Occupancy by Household Size in Oakleaf Plantation
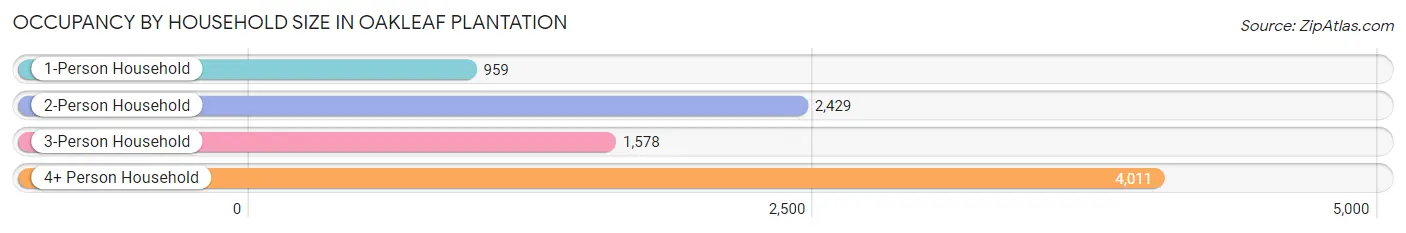
| Household Size | # Housing Units | % Housing Units |
| 1-Person Household | 959 | 10.7% |
| 2-Person Household | 2,429 | 27.1% |
| 3-Person Household | 1,578 | 17.6% |
| 4+ Person Household | 4,011 | 44.7% |
| Total Housing Units | 8,977 | 100.0% |
Occupancy by Ownership by Household Size in Oakleaf Plantation
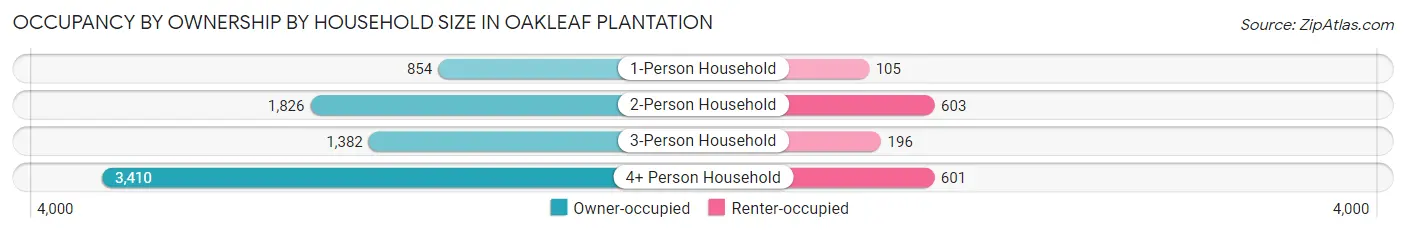
| Household Size | Owner-occupied | Renter-occupied |
| 1-Person Household | 854 (89.0%) | 105 (11.0%) |
| 2-Person Household | 1,826 (75.2%) | 603 (24.8%) |
| 3-Person Household | 1,382 (87.6%) | 196 (12.4%) |
| 4+ Person Household | 3,410 (85.0%) | 601 (15.0%) |
| Total Housing Units | 7,472 (83.2%) | 1,505 (16.8%) |
Occupancy by Educational Attainment in Oakleaf Plantation
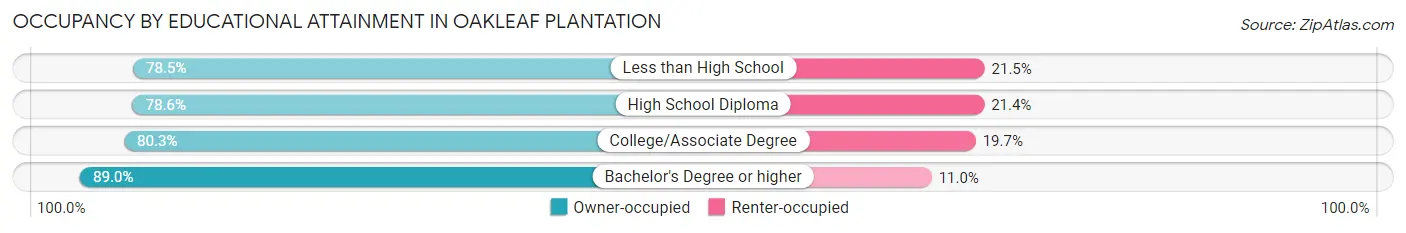
| Household Size | Owner-occupied | Renter-occupied |
| Less than High School | 376 (78.5%) | 103 (21.5%) |
| High School Diploma | 785 (78.6%) | 214 (21.4%) |
| College/Associate Degree | 3,329 (80.3%) | 819 (19.7%) |
| Bachelor's Degree or higher | 2,982 (89.0%) | 369 (11.0%) |
Occupancy by Age of Householder in Oakleaf Plantation
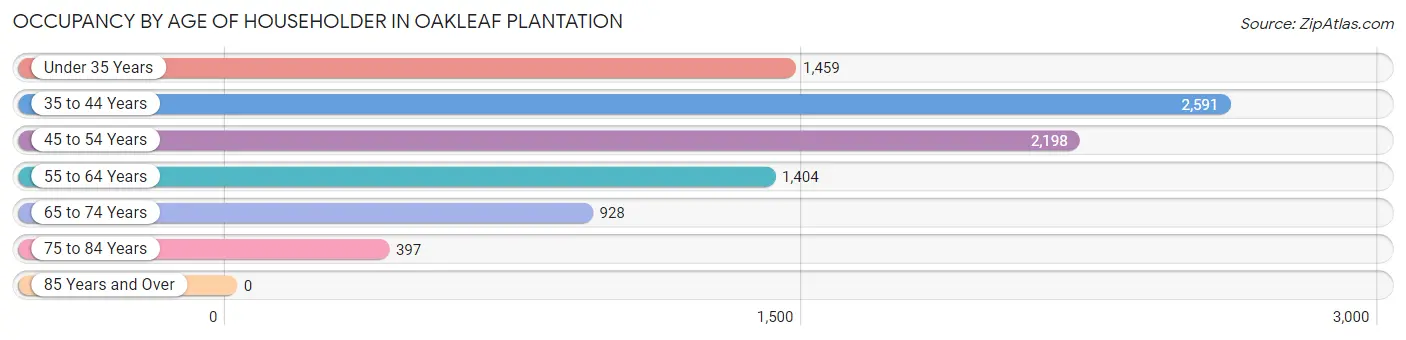
| Age Bracket | # Households | % Households |
| Under 35 Years | 1,459 | 16.3% |
| 35 to 44 Years | 2,591 | 28.9% |
| 45 to 54 Years | 2,198 | 24.5% |
| 55 to 64 Years | 1,404 | 15.6% |
| 65 to 74 Years | 928 | 10.3% |
| 75 to 84 Years | 397 | 4.4% |
| 85 Years and Over | 0 | 0.0% |
| Total | 8,977 | 100.0% |
Housing Finances in Oakleaf Plantation
Median Income by Occupancy in Oakleaf Plantation
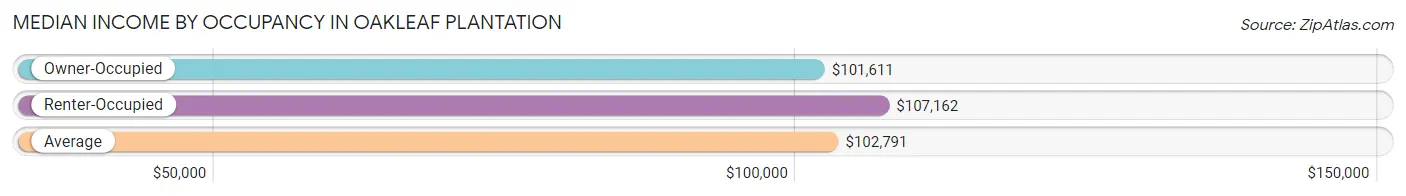
| Occupancy Type | # Households | Median Income |
| Owner-Occupied | 7,472 (83.2%) | $101,611 |
| Renter-Occupied | 1,505 (16.8%) | $107,162 |
| Average | 8,977 (100.0%) | $102,791 |
Occupancy by Householder Income Bracket in Oakleaf Plantation
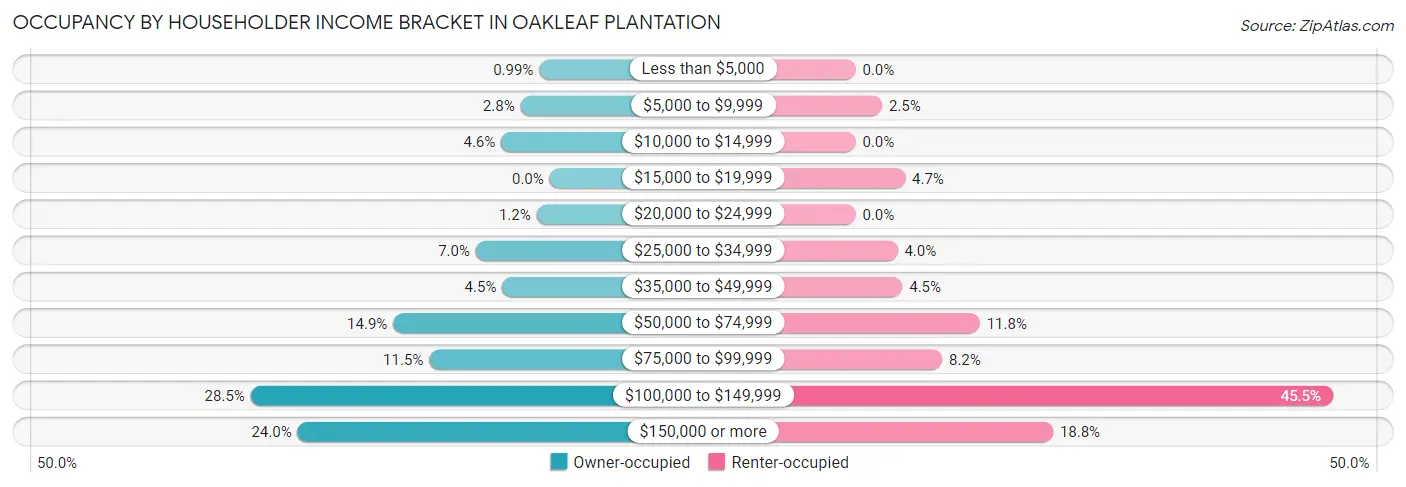
| Income Bracket | Owner-occupied | Renter-occupied |
| Less than $5,000 | 74 (1.0%) | 0 (0.0%) |
| $5,000 to $9,999 | 207 (2.8%) | 38 (2.5%) |
| $10,000 to $14,999 | 345 (4.6%) | 0 (0.0%) |
| $15,000 to $19,999 | 0 (0.0%) | 71 (4.7%) |
| $20,000 to $24,999 | 93 (1.2%) | 0 (0.0%) |
| $25,000 to $34,999 | 525 (7.0%) | 60 (4.0%) |
| $35,000 to $49,999 | 337 (4.5%) | 67 (4.4%) |
| $50,000 to $74,999 | 1,113 (14.9%) | 178 (11.8%) |
| $75,000 to $99,999 | 857 (11.5%) | 124 (8.2%) |
| $100,000 to $149,999 | 2,127 (28.5%) | 684 (45.5%) |
| $150,000 or more | 1,794 (24.0%) | 283 (18.8%) |
| Total | 7,472 (100.0%) | 1,505 (100.0%) |
Monthly Housing Cost Tiers in Oakleaf Plantation
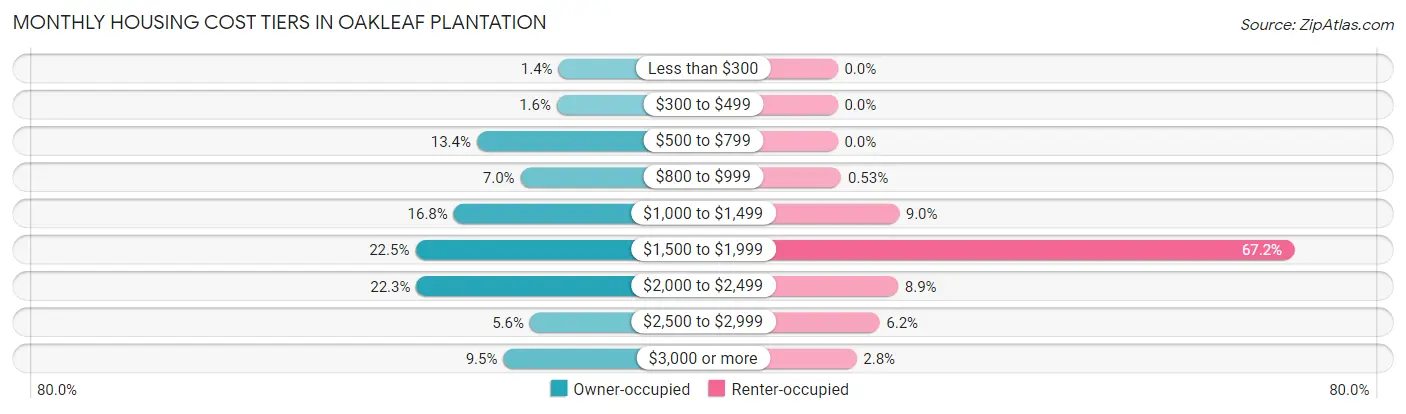
| Monthly Cost | Owner-occupied | Renter-occupied |
| Less than $300 | 102 (1.4%) | 0 (0.0%) |
| $300 to $499 | 120 (1.6%) | 0 (0.0%) |
| $500 to $799 | 1,001 (13.4%) | 0 (0.0%) |
| $800 to $999 | 521 (7.0%) | 8 (0.5%) |
| $1,000 to $1,499 | 1,256 (16.8%) | 136 (9.0%) |
| $1,500 to $1,999 | 1,678 (22.5%) | 1,012 (67.2%) |
| $2,000 to $2,499 | 1,667 (22.3%) | 134 (8.9%) |
| $2,500 to $2,999 | 418 (5.6%) | 93 (6.2%) |
| $3,000 or more | 709 (9.5%) | 42 (2.8%) |
| Total | 7,472 (100.0%) | 1,505 (100.0%) |
Physical Housing Characteristics in Oakleaf Plantation
Housing Structures in Oakleaf Plantation
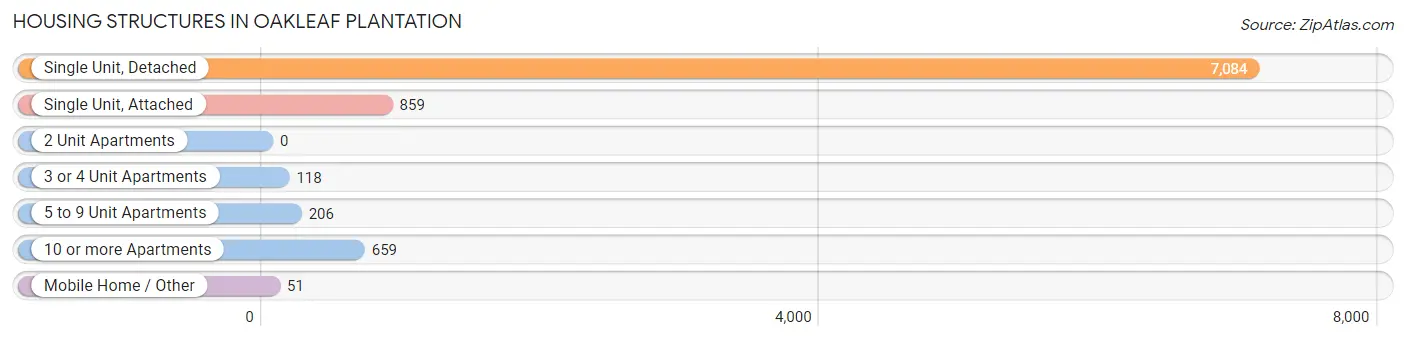
| Structure Type | # Housing Units | % Housing Units |
| Single Unit, Detached | 7,084 | 78.9% |
| Single Unit, Attached | 859 | 9.6% |
| 2 Unit Apartments | 0 | 0.0% |
| 3 or 4 Unit Apartments | 118 | 1.3% |
| 5 to 9 Unit Apartments | 206 | 2.3% |
| 10 or more Apartments | 659 | 7.3% |
| Mobile Home / Other | 51 | 0.6% |
| Total | 8,977 | 100.0% |
Housing Structures by Occupancy in Oakleaf Plantation
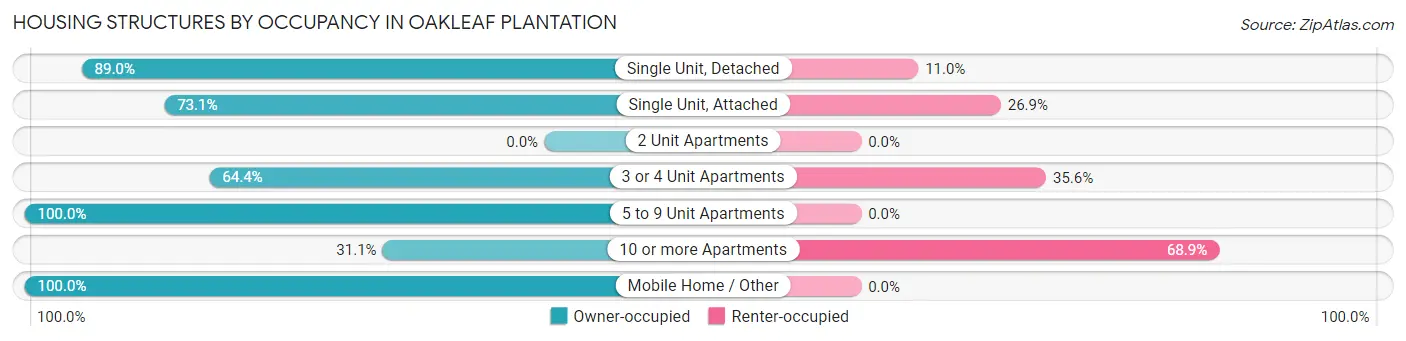
| Structure Type | Owner-occupied | Renter-occupied |
| Single Unit, Detached | 6,306 (89.0%) | 778 (11.0%) |
| Single Unit, Attached | 628 (73.1%) | 231 (26.9%) |
| 2 Unit Apartments | 0 (0.0%) | 0 (0.0%) |
| 3 or 4 Unit Apartments | 76 (64.4%) | 42 (35.6%) |
| 5 to 9 Unit Apartments | 206 (100.0%) | 0 (0.0%) |
| 10 or more Apartments | 205 (31.1%) | 454 (68.9%) |
| Mobile Home / Other | 51 (100.0%) | 0 (0.0%) |
| Total | 7,472 (83.2%) | 1,505 (16.8%) |
Housing Structures by Number of Rooms in Oakleaf Plantation
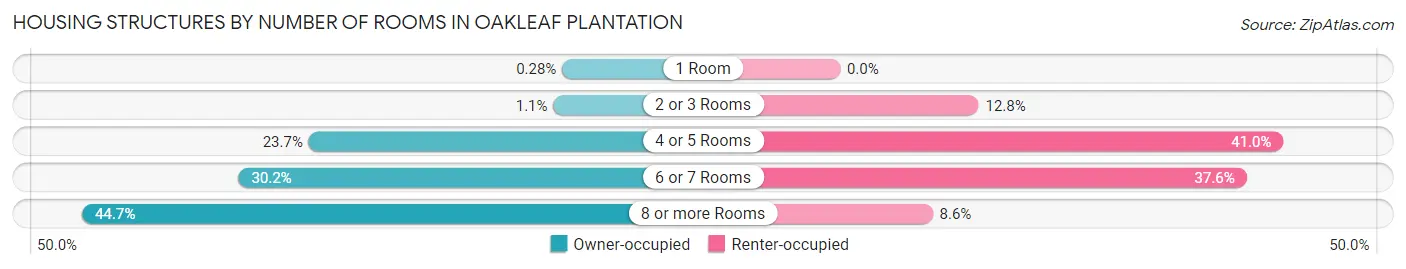
| Number of Rooms | Owner-occupied | Renter-occupied |
| 1 Room | 21 (0.3%) | 0 (0.0%) |
| 2 or 3 Rooms | 82 (1.1%) | 193 (12.8%) |
| 4 or 5 Rooms | 1,772 (23.7%) | 617 (41.0%) |
| 6 or 7 Rooms | 2,258 (30.2%) | 566 (37.6%) |
| 8 or more Rooms | 3,339 (44.7%) | 129 (8.6%) |
| Total | 7,472 (100.0%) | 1,505 (100.0%) |
Housing Structure by Heating Type in Oakleaf Plantation
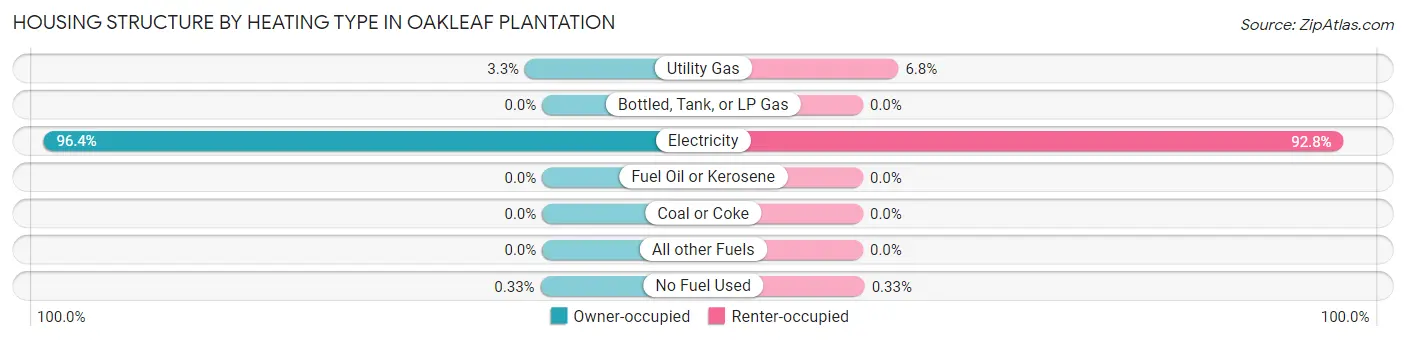
| Heating Type | Owner-occupied | Renter-occupied |
| Utility Gas | 248 (3.3%) | 103 (6.8%) |
| Bottled, Tank, or LP Gas | 0 (0.0%) | 0 (0.0%) |
| Electricity | 7,199 (96.4%) | 1,397 (92.8%) |
| Fuel Oil or Kerosene | 0 (0.0%) | 0 (0.0%) |
| Coal or Coke | 0 (0.0%) | 0 (0.0%) |
| All other Fuels | 0 (0.0%) | 0 (0.0%) |
| No Fuel Used | 25 (0.3%) | 5 (0.3%) |
| Total | 7,472 (100.0%) | 1,505 (100.0%) |
Household Vehicle Usage in Oakleaf Plantation
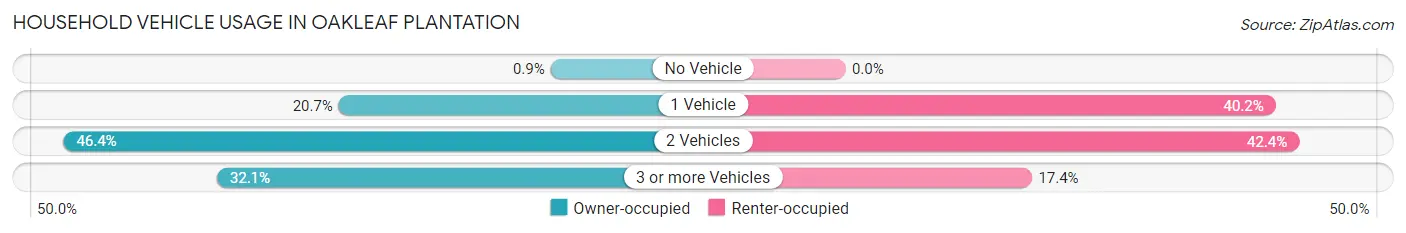
| Vehicles per Household | Owner-occupied | Renter-occupied |
| No Vehicle | 67 (0.9%) | 0 (0.0%) |
| 1 Vehicle | 1,545 (20.7%) | 605 (40.2%) |
| 2 Vehicles | 3,465 (46.4%) | 638 (42.4%) |
| 3 or more Vehicles | 2,395 (32.1%) | 262 (17.4%) |
| Total | 7,472 (100.0%) | 1,505 (100.0%) |
Real Estate & Mortgages in Oakleaf Plantation
Real Estate and Mortgage Overview in Oakleaf Plantation
| Characteristic | Without Mortgage | With Mortgage |
| Housing Units | 1,424 | 6,048 |
| Median Property Value | $288,500 | $283,500 |
| Median Household Income | $76,212 | $1,570 |
| Monthly Housing Costs | $678 | $709 |
| Real Estate Taxes | $3,419 | $136 |
Property Value by Mortgage Status in Oakleaf Plantation
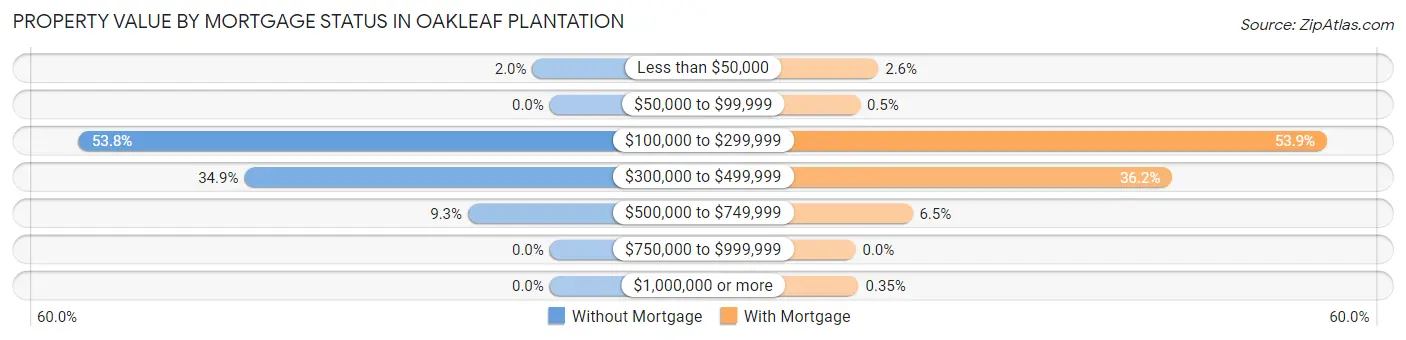
| Property Value | Without Mortgage | With Mortgage |
| Less than $50,000 | 28 (2.0%) | 157 (2.6%) |
| $50,000 to $99,999 | 0 (0.0%) | 30 (0.5%) |
| $100,000 to $299,999 | 766 (53.8%) | 3,258 (53.9%) |
| $300,000 to $499,999 | 497 (34.9%) | 2,189 (36.2%) |
| $500,000 to $749,999 | 133 (9.3%) | 393 (6.5%) |
| $750,000 to $999,999 | 0 (0.0%) | 0 (0.0%) |
| $1,000,000 or more | 0 (0.0%) | 21 (0.4%) |
| Total | 1,424 (100.0%) | 6,048 (100.0%) |
Household Income by Mortgage Status in Oakleaf Plantation
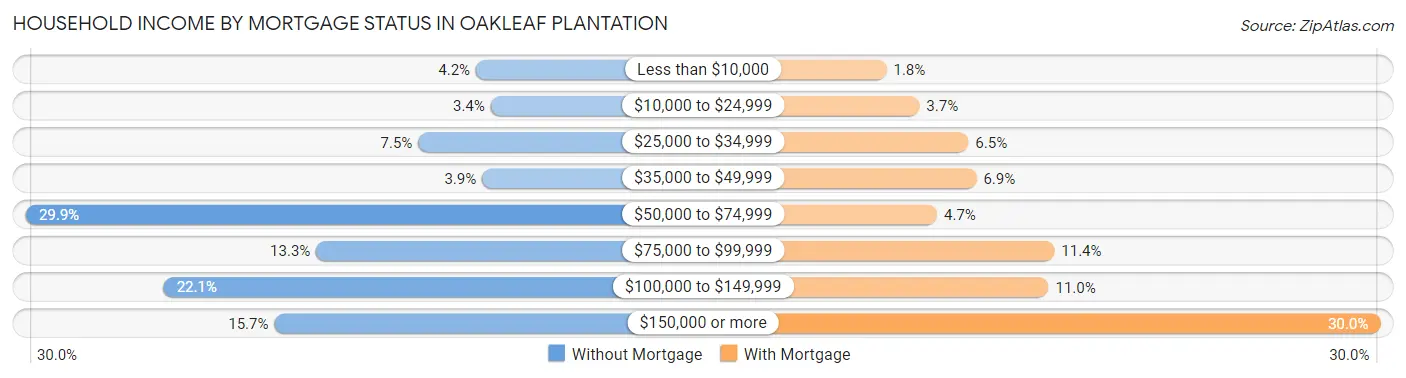
| Household Income | Without Mortgage | With Mortgage |
| Less than $10,000 | 60 (4.2%) | 107 (1.8%) |
| $10,000 to $24,999 | 48 (3.4%) | 221 (3.6%) |
| $25,000 to $34,999 | 107 (7.5%) | 390 (6.5%) |
| $35,000 to $49,999 | 55 (3.9%) | 418 (6.9%) |
| $50,000 to $74,999 | 426 (29.9%) | 282 (4.7%) |
| $75,000 to $99,999 | 190 (13.3%) | 687 (11.4%) |
| $100,000 to $149,999 | 314 (22.1%) | 667 (11.0%) |
| $150,000 or more | 224 (15.7%) | 1,813 (30.0%) |
| Total | 1,424 (100.0%) | 6,048 (100.0%) |
Property Value to Household Income Ratio in Oakleaf Plantation
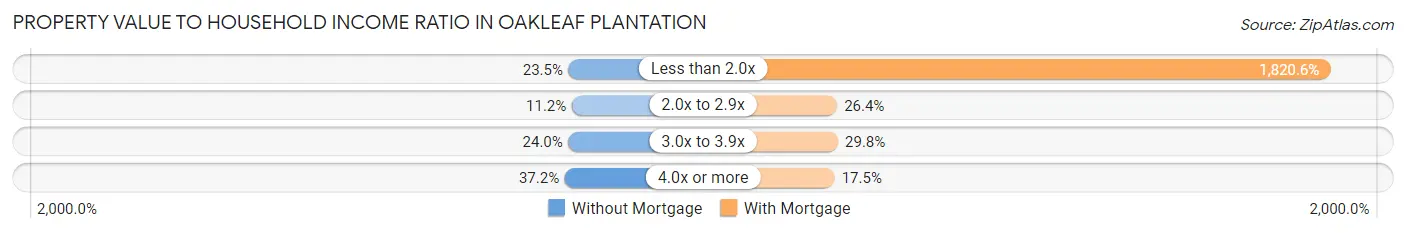
| Value-to-Income Ratio | Without Mortgage | With Mortgage |
| Less than 2.0x | 334 (23.5%) | 110,110 (1,820.6%) |
| 2.0x to 2.9x | 160 (11.2%) | 1,597 (26.4%) |
| 3.0x to 3.9x | 341 (23.9%) | 1,805 (29.8%) |
| 4.0x or more | 529 (37.1%) | 1,056 (17.5%) |
| Total | 1,424 (100.0%) | 6,048 (100.0%) |
Real Estate Taxes by Mortgage Status in Oakleaf Plantation
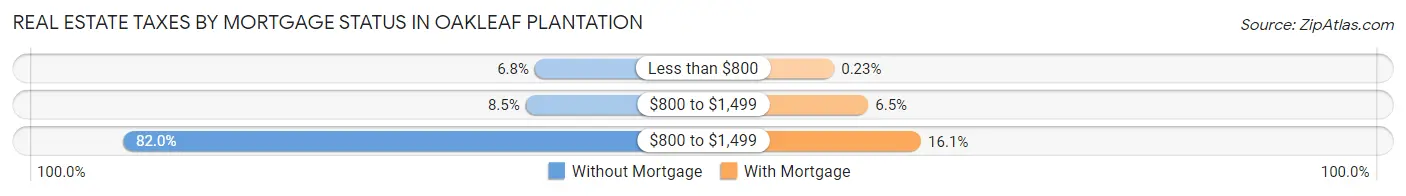
| Property Taxes | Without Mortgage | With Mortgage |
| Less than $800 | 97 (6.8%) | 14 (0.2%) |
| $800 to $1,499 | 121 (8.5%) | 390 (6.5%) |
| $800 to $1,499 | 1,168 (82.0%) | 973 (16.1%) |
| Total | 1,424 (100.0%) | 6,048 (100.0%) |
Health & Disability in Oakleaf Plantation
Health Insurance Coverage by Age in Oakleaf Plantation
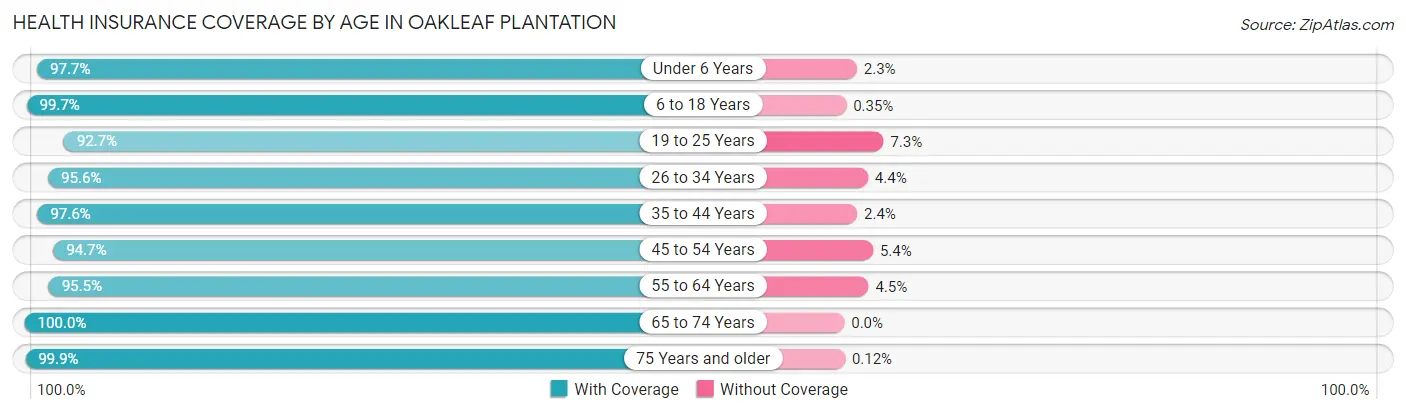
| Age Bracket | With Coverage | Without Coverage |
| Under 6 Years | 2,253 (97.7%) | 54 (2.3%) |
| 6 to 18 Years | 7,335 (99.7%) | 26 (0.4%) |
| 19 to 25 Years | 1,636 (92.7%) | 129 (7.3%) |
| 26 to 34 Years | 2,606 (95.6%) | 120 (4.4%) |
| 35 to 44 Years | 5,275 (97.6%) | 129 (2.4%) |
| 45 to 54 Years | 3,807 (94.7%) | 215 (5.3%) |
| 55 to 64 Years | 2,476 (95.5%) | 117 (4.5%) |
| 65 to 74 Years | 1,857 (100.0%) | 0 (0.0%) |
| 75 Years and older | 805 (99.9%) | 1 (0.1%) |
| Total | 28,050 (97.3%) | 791 (2.7%) |
Health Insurance Coverage by Citizenship Status in Oakleaf Plantation
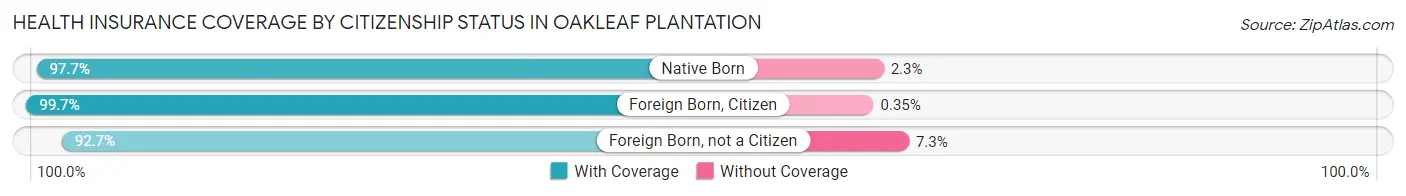
| Citizenship Status | With Coverage | Without Coverage |
| Native Born | 2,253 (97.7%) | 54 (2.3%) |
| Foreign Born, Citizen | 7,335 (99.7%) | 26 (0.4%) |
| Foreign Born, not a Citizen | 1,636 (92.7%) | 129 (7.3%) |
Health Insurance Coverage by Household Income in Oakleaf Plantation
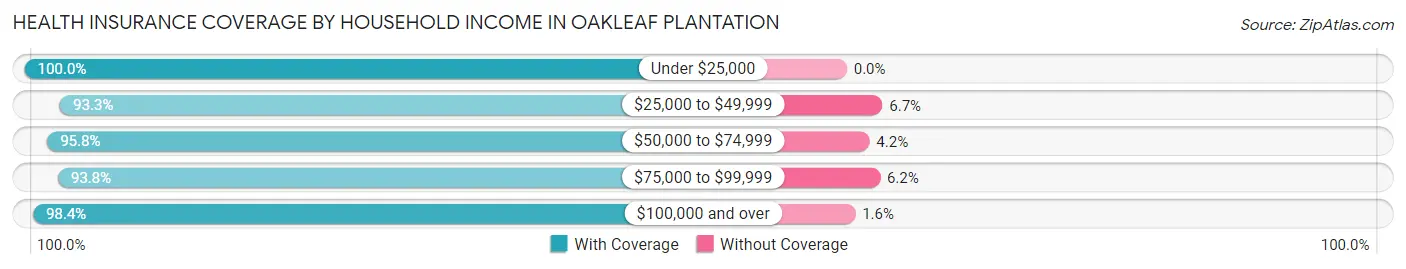
| Household Income | With Coverage | Without Coverage |
| Under $25,000 | 2,232 (100.0%) | 0 (0.0%) |
| $25,000 to $49,999 | 1,683 (93.3%) | 120 (6.7%) |
| $50,000 to $74,999 | 3,858 (95.8%) | 171 (4.2%) |
| $75,000 to $99,999 | 3,483 (93.8%) | 231 (6.2%) |
| $100,000 and over | 16,776 (98.4%) | 268 (1.6%) |
Public vs Private Health Insurance Coverage by Age in Oakleaf Plantation
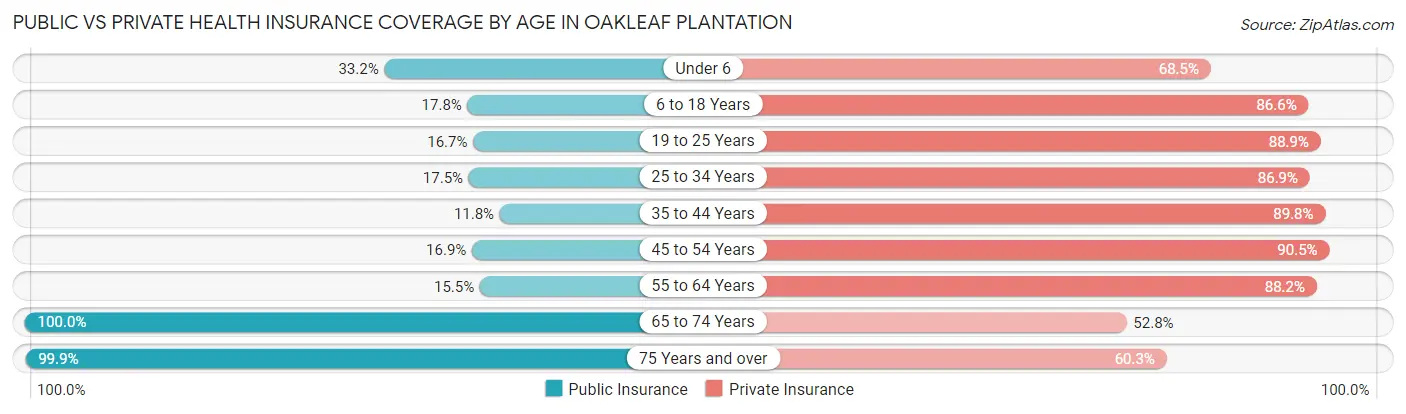
| Age Bracket | Public Insurance | Private Insurance |
| Under 6 | 766 (33.2%) | 1,580 (68.5%) |
| 6 to 18 Years | 1,307 (17.8%) | 6,376 (86.6%) |
| 19 to 25 Years | 295 (16.7%) | 1,569 (88.9%) |
| 25 to 34 Years | 478 (17.5%) | 2,368 (86.9%) |
| 35 to 44 Years | 636 (11.8%) | 4,850 (89.7%) |
| 45 to 54 Years | 681 (16.9%) | 3,640 (90.5%) |
| 55 to 64 Years | 401 (15.5%) | 2,286 (88.2%) |
| 65 to 74 Years | 1,857 (100.0%) | 981 (52.8%) |
| 75 Years and over | 805 (99.9%) | 486 (60.3%) |
| Total | 7,226 (25.1%) | 24,136 (83.7%) |
Disability Status by Sex by Age in Oakleaf Plantation
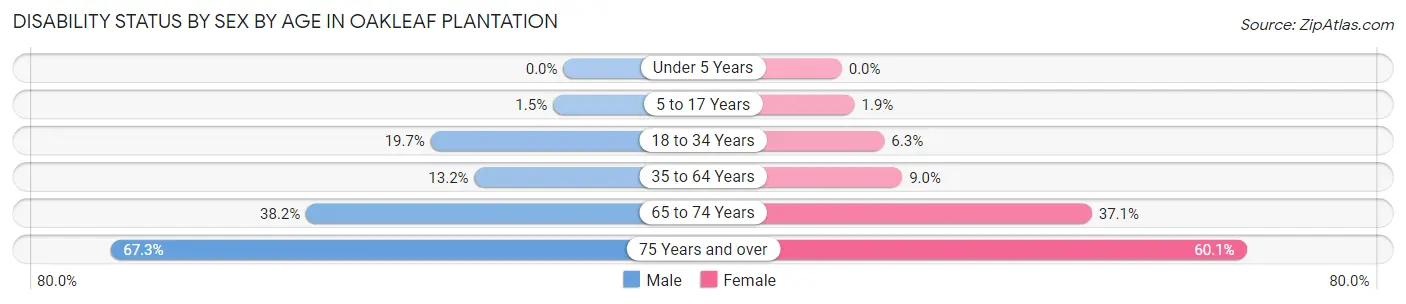
| Age Bracket | Male | Female |
| Under 5 Years | 0 (0.0%) | 0 (0.0%) |
| 5 to 17 Years | 57 (1.5%) | 72 (1.9%) |
| 18 to 34 Years | 408 (19.7%) | 179 (6.3%) |
| 35 to 64 Years | 749 (13.2%) | 570 (9.0%) |
| 65 to 74 Years | 306 (38.2%) | 392 (37.1%) |
| 75 Years and over | 222 (67.3%) | 286 (60.1%) |
Disability Class by Sex by Age in Oakleaf Plantation
Disability Class: Hearing Difficulty
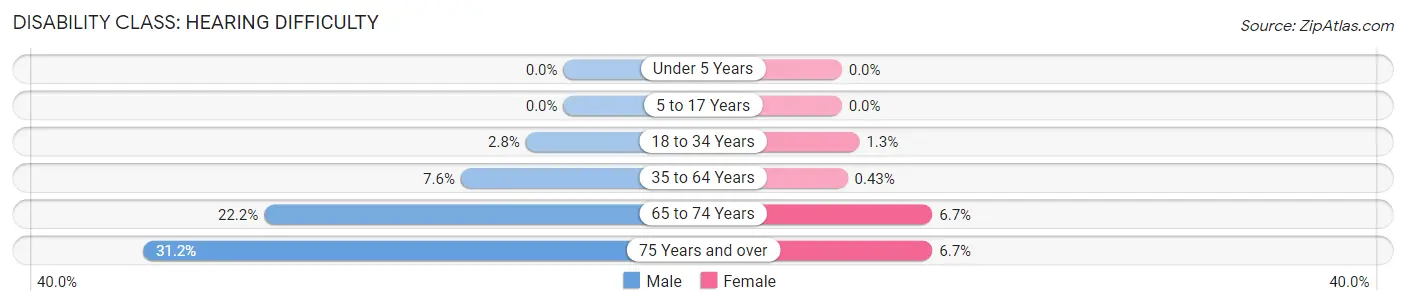
| Age Bracket | Male | Female |
| Under 5 Years | 0 (0.0%) | 0 (0.0%) |
| 5 to 17 Years | 0 (0.0%) | 0 (0.0%) |
| 18 to 34 Years | 58 (2.8%) | 37 (1.3%) |
| 35 to 64 Years | 432 (7.6%) | 27 (0.4%) |
| 65 to 74 Years | 178 (22.2%) | 71 (6.7%) |
| 75 Years and over | 103 (31.2%) | 32 (6.7%) |
Disability Class: Vision Difficulty
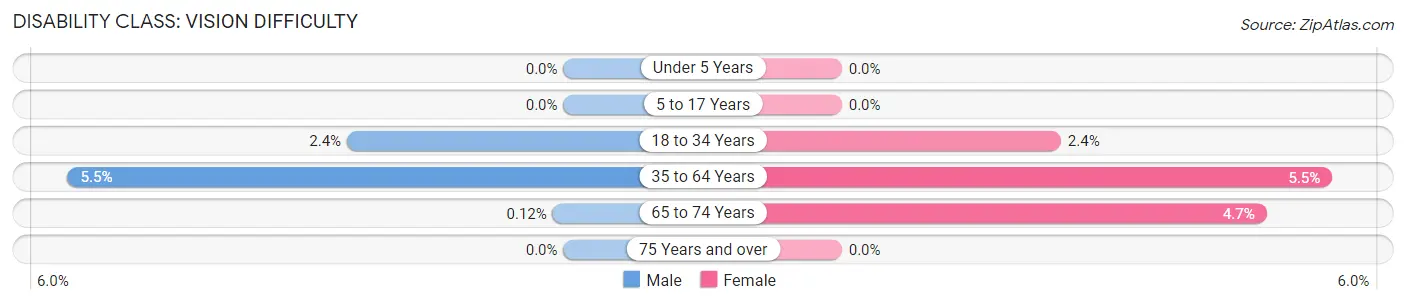
| Age Bracket | Male | Female |
| Under 5 Years | 0 (0.0%) | 0 (0.0%) |
| 5 to 17 Years | 0 (0.0%) | 0 (0.0%) |
| 18 to 34 Years | 50 (2.4%) | 69 (2.4%) |
| 35 to 64 Years | 313 (5.5%) | 347 (5.5%) |
| 65 to 74 Years | 1 (0.1%) | 50 (4.7%) |
| 75 Years and over | 0 (0.0%) | 0 (0.0%) |
Disability Class: Cognitive Difficulty
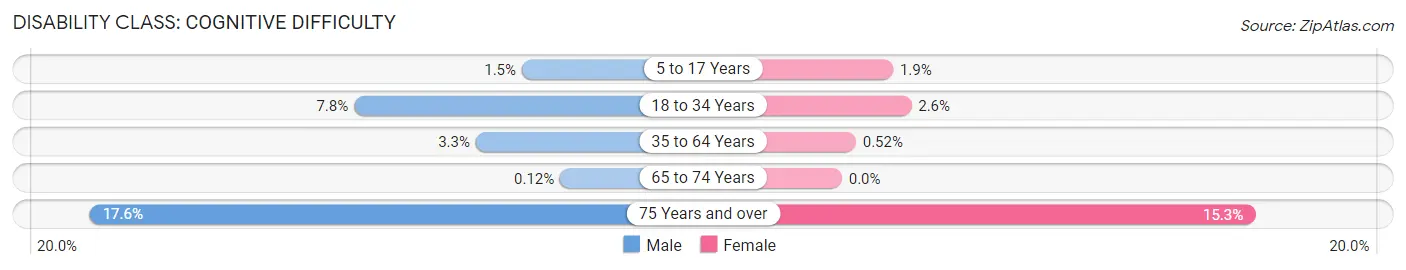
| Age Bracket | Male | Female |
| 5 to 17 Years | 57 (1.5%) | 72 (1.9%) |
| 18 to 34 Years | 161 (7.8%) | 73 (2.6%) |
| 35 to 64 Years | 184 (3.3%) | 33 (0.5%) |
| 65 to 74 Years | 1 (0.1%) | 0 (0.0%) |
| 75 Years and over | 58 (17.6%) | 73 (15.3%) |
Disability Class: Ambulatory Difficulty
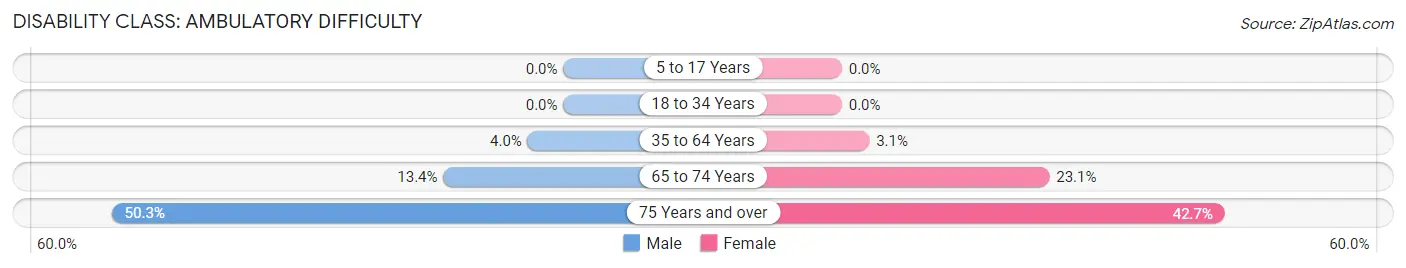
| Age Bracket | Male | Female |
| 5 to 17 Years | 0 (0.0%) | 0 (0.0%) |
| 18 to 34 Years | 0 (0.0%) | 0 (0.0%) |
| 35 to 64 Years | 225 (4.0%) | 194 (3.0%) |
| 65 to 74 Years | 107 (13.4%) | 244 (23.1%) |
| 75 Years and over | 166 (50.3%) | 203 (42.6%) |
Disability Class: Self-Care Difficulty
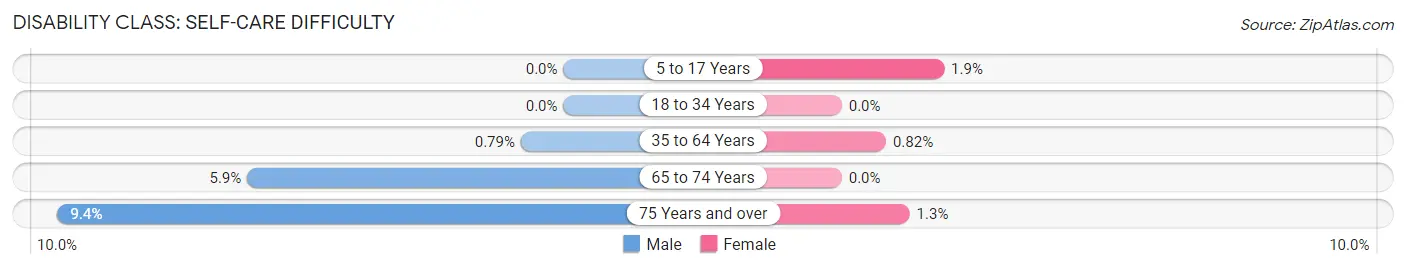
| Age Bracket | Male | Female |
| 5 to 17 Years | 0 (0.0%) | 72 (1.9%) |
| 18 to 34 Years | 0 (0.0%) | 0 (0.0%) |
| 35 to 64 Years | 45 (0.8%) | 52 (0.8%) |
| 65 to 74 Years | 47 (5.9%) | 0 (0.0%) |
| 75 Years and over | 31 (9.4%) | 6 (1.3%) |
Technology Access in Oakleaf Plantation
Computing Device Access in Oakleaf Plantation
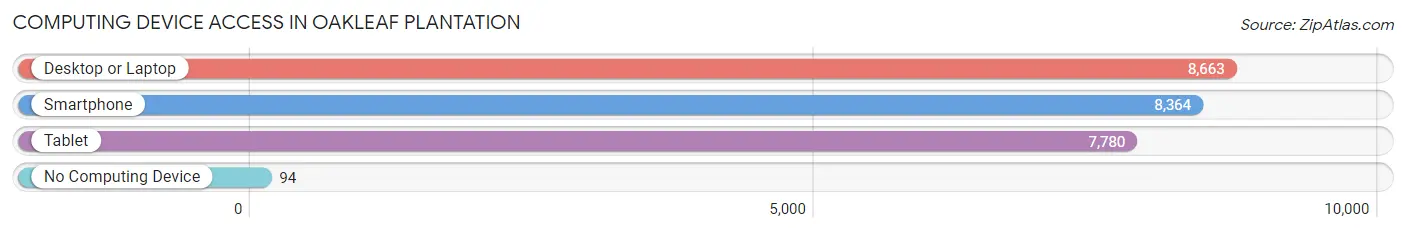
| Device Type | # Households | % Households |
| Desktop or Laptop | 8,663 | 96.5% |
| Smartphone | 8,364 | 93.2% |
| Tablet | 7,780 | 86.7% |
| No Computing Device | 94 | 1.1% |
| Total | 8,977 | 100.0% |
Internet Access in Oakleaf Plantation
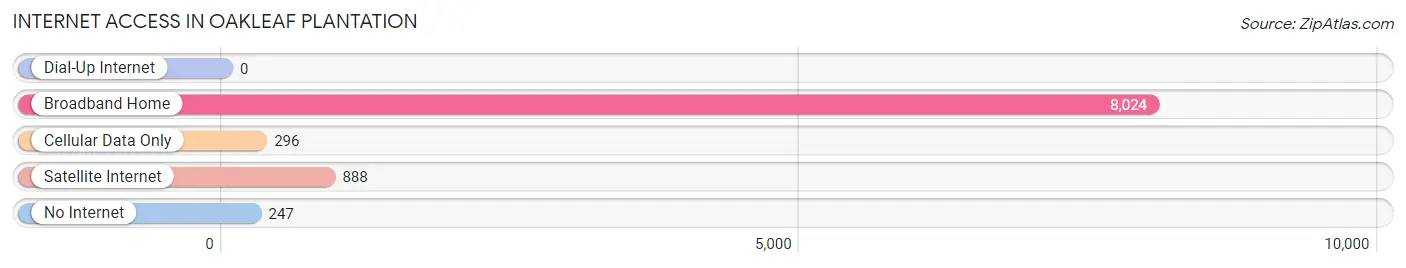
| Internet Type | # Households | % Households |
| Dial-Up Internet | 0 | 0.0% |
| Broadband Home | 8,024 | 89.4% |
| Cellular Data Only | 296 | 3.3% |
| Satellite Internet | 888 | 9.9% |
| No Internet | 247 | 2.8% |
| Total | 8,977 | 100.0% |
Oakleaf Plantation Summary
Oakleaf Plantation is a census-designated place (CDP) located in Clay County, Florida, United States. It is part of the Jacksonville metropolitan area. As of the 2010 census, the population of Oakleaf Plantation was 16,945.
History
Oakleaf Plantation was originally part of the Timucuan Indian territory. The area was first settled by Europeans in the late 1700s. The first settlers were mostly farmers and ranchers who were attracted to the area by its fertile soil and abundant wildlife. The area was known as “Oakleaf” because of the abundance of oak trees in the area.
In the early 1900s, the area began to be developed as a residential community. The first homes were built in the 1920s and 1930s. The area was officially incorporated as a town in 1949.
Geography
Oakleaf Plantation is located in Clay County, Florida, approximately 20 miles southwest of Jacksonville. It is bordered by the cities of Orange Park and Middleburg to the north, Green Cove Springs to the east, and Keystone Heights to the south. The CDP has a total area of 8.3 square miles, all of which is land.
Economy
Oakleaf Plantation is primarily a residential community, but it does have some commercial and industrial businesses. The largest employers in the area are the Clay County School District, Orange Park Medical Center, and the Clay County Sheriff’s Office.
Demographics
As of the 2010 census, there were 16,945 people, 6,717 households, and 4,845 families residing in the CDP. The population density was 2,039.3 people per square mile. The racial makeup of the CDP was 79.2% White, 11.3% African American, 0.4% Native American, 3.2% Asian, 0.1% Pacific Islander, 3.2% from other races, and 2.7% from two or more races. Hispanic or Latino of any race were 8.3% of the population.
The median income for a household in the CDP was $63,945, and the median income for a family was $71,945. Males had a median income of $50,945 versus $37,945 for females. The per capita income for the CDP was $27,945. About 4.2% of families and 5.7% of the population were below the poverty line, including 8.2% of those under age 18 and 4.2% of those age 65 or over.
Conclusion
Oakleaf Plantation is a census-designated place located in Clay County, Florida. It is part of the Jacksonville metropolitan area and has a population of 16,945 as of the 2010 census. The area was originally part of the Timucuan Indian territory and was first settled by Europeans in the late 1700s. The economy of Oakleaf Plantation is primarily residential, but it does have some commercial and industrial businesses. The racial makeup of the CDP is 79.2% White, 11.3% African American, 0.4% Native American, 3.2% Asian, 0.1% Pacific Islander, 3.2% from other races, and 2.7% from two or more races. The median income for a household in the CDP was $63,945, and the median income for a family was $71,945.
Common Questions
What is Per Capita Income in Oakleaf Plantation?
Per Capita income in Oakleaf Plantation is $34,258.
What is the Median Family Income in Oakleaf Plantation?
Median Family Income in Oakleaf Plantation is $103,013.
What is the Median Household income in Oakleaf Plantation?
Median Household Income in Oakleaf Plantation is $102,791.
What is Income or Wage Gap in Oakleaf Plantation?
Income or Wage Gap in Oakleaf Plantation is 36.9%.
Women in Oakleaf Plantation earn 63.1 cents for every dollar earned by a man.
What is Family Income Deficit in Oakleaf Plantation?
Family Income Deficit in Oakleaf Plantation is $15,560.
Families that are below poverty line in Oakleaf Plantation earn $15,560 less on average than the poverty threshold level.
What is Inequality or Gini Index in Oakleaf Plantation?
Inequality or Gini Index in Oakleaf Plantation is 0.34.
What is the Total Population of Oakleaf Plantation?
Total Population of Oakleaf Plantation is 29,265.
What is the Total Male Population of Oakleaf Plantation?
Total Male Population of Oakleaf Plantation is 13,873.
What is the Total Female Population of Oakleaf Plantation?
Total Female Population of Oakleaf Plantation is 15,392.
What is the Ratio of Males per 100 Females in Oakleaf Plantation?
There are 90.13 Males per 100 Females in Oakleaf Plantation.
What is the Ratio of Females per 100 Males in Oakleaf Plantation?
There are 110.95 Females per 100 Males in Oakleaf Plantation.
What is the Median Population Age in Oakleaf Plantation?
Median Population Age in Oakleaf Plantation is 35.2 Years.
What is the Average Family Size in Oakleaf Plantation
Average Family Size in Oakleaf Plantation is 3.5 People.
What is the Average Household Size in Oakleaf Plantation
Average Household Size in Oakleaf Plantation is 3.3 People.
How Large is the Labor Force in Oakleaf Plantation?
There are 14,441 People in the Labor Forcein in Oakleaf Plantation.
What is the Percentage of People in the Labor Force in Oakleaf Plantation?
68.2% of People are in the Labor Force in Oakleaf Plantation.
What is the Unemployment Rate in Oakleaf Plantation?
Unemployment Rate in Oakleaf Plantation is 2.7%.