Zip Codes with the Highest Percentage of Population Employed in Computer & Mathematics in Alabama
RELATED REPORTS & OPTIONS
Computer & Mathematics
Alabama
Compare Zip Codes
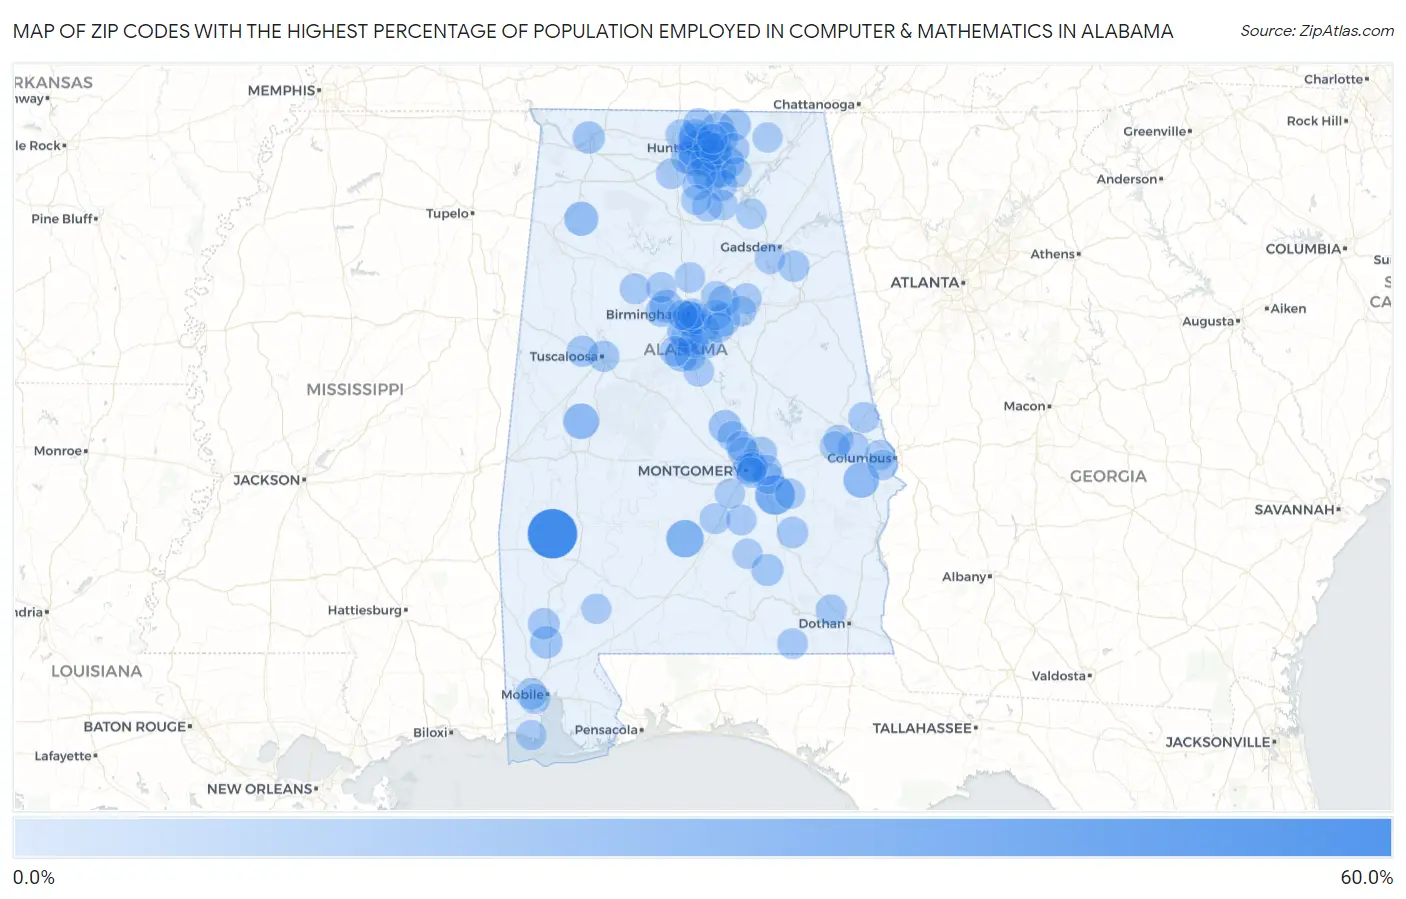
Map of Zip Codes with the Highest Percentage of Population Employed in Computer & Mathematics in Alabama
0.0%
60.0%
Zip Codes with the Highest Percentage of Population Employed in Computer & Mathematics in Alabama
| Zip Code | % Employed | vs State | vs National | |
| 1. | 36727 | 53.2% | 2.5%(+50.6)#1 | 3.5%(+49.7)#11 |
| 2. | 36052 | 26.6% | 2.5%(+24.1)#2 | 3.5%(+23.1)#69 |
| 3. | 36030 | 21.4% | 2.5%(+18.9)#3 | 3.5%(+17.9)#113 |
| 4. | 36858 | 16.5% | 2.5%(+14.0)#4 | 3.5%(+13.0)#200 |
| 5. | 36776 | 16.4% | 2.5%(+13.8)#5 | 3.5%(+12.9)#206 |
| 6. | 35543 | 12.7% | 2.5%(+10.1)#6 | 3.5%(+9.15)#382 |
| 7. | 35758 | 12.6% | 2.5%(+10.0)#7 | 3.5%(+9.04)#394 |
| 8. | 35806 | 10.8% | 2.5%(+8.25)#8 | 3.5%(+7.27)#592 |
| 9. | 35757 | 10.6% | 2.5%(+8.03)#9 | 3.5%(+7.05)#620 |
| 10. | 35114 | 10.4% | 2.5%(+7.81)#10 | 3.5%(+6.83)#652 |
| 11. | 35763 | 10.2% | 2.5%(+7.63)#11 | 3.5%(+6.65)#678 |
| 12. | 35759 | 10.1% | 2.5%(+7.55)#12 | 3.5%(+6.56)#696 |
| 13. | 35176 | 9.8% | 2.5%(+7.25)#13 | 3.5%(+6.27)#742 |
| 14. | 35754 | 9.8% | 2.5%(+7.22)#14 | 3.5%(+6.24)#746 |
| 15. | 35005 | 9.5% | 2.5%(+6.97)#15 | 3.5%(+5.99)#791 |
| 16. | 35824 | 9.1% | 2.5%(+6.52)#16 | 3.5%(+5.54)#894 |
| 17. | 35756 | 9.0% | 2.5%(+6.43)#17 | 3.5%(+5.45)#905 |
| 18. | 36051 | 8.7% | 2.5%(+6.20)#18 | 3.5%(+5.22)#970 |
| 19. | 35803 | 8.5% | 2.5%(+5.92)#19 | 3.5%(+4.94)#1,061 |
| 20. | 36560 | 8.3% | 2.5%(+5.75)#20 | 3.5%(+4.77)#1,119 |
| 21. | 35632 | 8.3% | 2.5%(+5.72)#21 | 3.5%(+4.73)#1,131 |
| 22. | 36034 | 7.1% | 2.5%(+4.57)#22 | 3.5%(+3.59)#1,561 |
| 23. | 35761 | 6.9% | 2.5%(+4.31)#23 | 3.5%(+3.33)#1,706 |
| 24. | 35808 | 6.8% | 2.5%(+4.31)#24 | 3.5%(+3.32)#1,712 |
| 25. | 35749 | 6.7% | 2.5%(+4.18)#25 | 3.5%(+3.20)#1,775 |
| 26. | 35205 | 6.7% | 2.5%(+4.17)#26 | 3.5%(+3.19)#1,784 |
| 27. | 35175 | 6.6% | 2.5%(+4.08)#27 | 3.5%(+3.10)#1,842 |
| 28. | 35802 | 6.5% | 2.5%(+3.96)#28 | 3.5%(+2.97)#1,925 |
| 29. | 35811 | 6.5% | 2.5%(+3.92)#29 | 3.5%(+2.94)#1,964 |
| 30. | 35801 | 6.4% | 2.5%(+3.82)#30 | 3.5%(+2.84)#2,030 |
| 31. | 36093 | 6.3% | 2.5%(+3.76)#31 | 3.5%(+2.77)#2,087 |
| 32. | 36081 | 6.3% | 2.5%(+3.73)#32 | 3.5%(+2.75)#2,097 |
| 33. | 36553 | 6.2% | 2.5%(+3.62)#33 | 3.5%(+2.64)#2,168 |
| 34. | 35043 | 6.2% | 2.5%(+3.61)#34 | 3.5%(+2.63)#2,175 |
| 35. | 35748 | 6.0% | 2.5%(+3.50)#35 | 3.5%(+2.52)#2,279 |
| 36. | 35613 | 6.0% | 2.5%(+3.43)#36 | 3.5%(+2.45)#2,328 |
| 37. | 35007 | 5.8% | 2.5%(+3.29)#37 | 3.5%(+2.31)#2,472 |
| 38. | 36115 | 5.8% | 2.5%(+3.26)#38 | 3.5%(+2.28)#2,492 |
| 39. | 36279 | 5.7% | 2.5%(+3.17)#39 | 3.5%(+2.18)#2,575 |
| 40. | 35118 | 5.7% | 2.5%(+3.13)#40 | 3.5%(+2.15)#2,612 |
| 41. | 35487 | 5.6% | 2.5%(+3.10)#41 | 3.5%(+2.12)#2,644 |
| 42. | 35446 | 5.6% | 2.5%(+3.09)#42 | 3.5%(+2.10)#2,652 |
| 43. | 35773 | 5.4% | 2.5%(+2.87)#43 | 3.5%(+1.89)#2,883 |
| 44. | 36688 | 5.3% | 2.5%(+2.77)#44 | 3.5%(+1.79)#2,988 |
| 45. | 35244 | 5.3% | 2.5%(+2.72)#45 | 3.5%(+1.74)#3,056 |
| 46. | 36371 | 5.1% | 2.5%(+2.58)#46 | 3.5%(+1.60)#3,198 |
| 47. | 35004 | 4.7% | 2.5%(+2.15)#47 | 3.5%(+1.17)#3,806 |
| 48. | 35226 | 4.6% | 2.5%(+2.08)#48 | 3.5%(+1.10)#3,908 |
| 49. | 35229 | 4.6% | 2.5%(+2.07)#49 | 3.5%(+1.08)#3,931 |
| 50. | 36852 | 4.6% | 2.5%(+2.01)#50 | 3.5%(+1.03)#4,003 |
| 51. | 36064 | 4.5% | 2.5%(+1.95)#51 | 3.5%(+0.974)#4,077 |
| 52. | 36032 | 4.5% | 2.5%(+1.94)#52 | 3.5%(+0.958)#4,107 |
| 53. | 35580 | 4.4% | 2.5%(+1.87)#53 | 3.5%(+0.890)#4,244 |
| 54. | 36804 | 4.4% | 2.5%(+1.83)#54 | 3.5%(+0.853)#4,302 |
| 55. | 35125 | 4.4% | 2.5%(+1.83)#55 | 3.5%(+0.849)#4,308 |
| 56. | 35242 | 4.4% | 2.5%(+1.82)#56 | 3.5%(+0.840)#4,324 |
| 57. | 36340 | 4.2% | 2.5%(+1.70)#57 | 3.5%(+0.716)#4,535 |
| 58. | 35816 | 4.1% | 2.5%(+1.60)#58 | 3.5%(+0.617)#4,722 |
| 59. | 36022 | 4.1% | 2.5%(+1.59)#59 | 3.5%(+0.605)#4,758 |
| 60. | 36020 | 4.1% | 2.5%(+1.58)#60 | 3.5%(+0.594)#4,777 |
| 61. | 35040 | 4.1% | 2.5%(+1.54)#61 | 3.5%(+0.563)#4,843 |
| 62. | 35223 | 4.0% | 2.5%(+1.49)#62 | 3.5%(+0.512)#4,956 |
| 63. | 36117 | 4.0% | 2.5%(+1.44)#63 | 3.5%(+0.456)#5,090 |
| 64. | 36107 | 4.0% | 2.5%(+1.43)#64 | 3.5%(+0.447)#5,110 |
| 65. | 35603 | 3.9% | 2.5%(+1.34)#65 | 3.5%(+0.364)#5,276 |
| 66. | 35016 | 3.9% | 2.5%(+1.31)#66 | 3.5%(+0.330)#5,349 |
| 67. | 35124 | 3.8% | 2.5%(+1.31)#67 | 3.5%(+0.324)#5,360 |
| 68. | 35019 | 3.8% | 2.5%(+1.27)#68 | 3.5%(+0.293)#5,437 |
| 69. | 35091 | 3.8% | 2.5%(+1.25)#69 | 3.5%(+0.268)#5,505 |
| 70. | 36046 | 3.8% | 2.5%(+1.25)#70 | 3.5%(+0.265)#5,509 |
| 71. | 35670 | 3.8% | 2.5%(+1.22)#71 | 3.5%(+0.238)#5,569 |
| 72. | 35062 | 3.8% | 2.5%(+1.22)#72 | 3.5%(+0.237)#5,572 |
| 73. | 35950 | 3.7% | 2.5%(+1.16)#73 | 3.5%(+0.182)#5,708 |
| 74. | 35906 | 3.7% | 2.5%(+1.14)#74 | 3.5%(+0.155)#5,783 |
| 75. | 35080 | 3.7% | 2.5%(+1.12)#75 | 3.5%(+0.143)#5,805 |
| 76. | 36025 | 3.7% | 2.5%(+1.12)#76 | 3.5%(+0.136)#5,819 |
| 77. | 36109 | 3.6% | 2.5%(+1.10)#77 | 3.5%(+0.117)#5,863 |
| 78. | 35775 | 3.6% | 2.5%(+1.06)#78 | 3.5%(+0.084)#5,944 |
| 79. | 36609 | 3.6% | 2.5%(+1.04)#79 | 3.5%(+0.062)#5,980 |
| 80. | 36029 | 3.6% | 2.5%(+1.01)#80 | 3.5%(+0.029)#6,066 |
| 81. | 36849 | 3.5% | 2.5%(+0.985)#81 | 3.5%(+0.004)#6,136 |
| 82. | 35233 | 3.5% | 2.5%(+0.948)#82 | 3.5%(-0.033)#6,228 |
| 83. | 35621 | 3.5% | 2.5%(+0.907)#83 | 3.5%(-0.074)#6,341 |
| 84. | 35128 | 3.4% | 2.5%(+0.884)#84 | 3.5%(-0.097)#6,397 |
| 85. | 36830 | 3.4% | 2.5%(+0.863)#85 | 3.5%(-0.118)#6,469 |
| 86. | 35222 | 3.4% | 2.5%(+0.857)#86 | 3.5%(-0.124)#6,484 |
| 87. | 35094 | 3.4% | 2.5%(+0.852)#87 | 3.5%(-0.129)#6,493 |
| 88. | 35760 | 3.4% | 2.5%(+0.822)#88 | 3.5%(-0.159)#6,581 |
| 89. | 36106 | 3.4% | 2.5%(+0.822)#89 | 3.5%(-0.159)#6,583 |
| 90. | 35254 | 3.3% | 2.5%(+0.804)#90 | 3.5%(-0.177)#6,631 |
| 91. | 35810 | 3.3% | 2.5%(+0.800)#91 | 3.5%(-0.181)#6,644 |
| 92. | 36523 | 3.3% | 2.5%(+0.772)#92 | 3.5%(-0.209)#6,729 |
| 93. | 36043 | 3.3% | 2.5%(+0.766)#93 | 3.5%(-0.214)#6,744 |
| 94. | 36870 | 3.3% | 2.5%(+0.764)#94 | 3.5%(-0.217)#6,752 |
| 95. | 36869 | 3.3% | 2.5%(+0.726)#95 | 3.5%(-0.255)#6,876 |
| 96. | 35768 | 3.2% | 2.5%(+0.686)#96 | 3.5%(-0.295)#7,004 |
| 97. | 35147 | 3.2% | 2.5%(+0.680)#97 | 3.5%(-0.301)#7,027 |
| 98. | 35173 | 3.2% | 2.5%(+0.634)#98 | 3.5%(-0.347)#7,164 |
| 99. | 36049 | 3.1% | 2.5%(+0.592)#99 | 3.5%(-0.389)#7,307 |
| 100. | 36480 | 3.1% | 2.5%(+0.562)#100 | 3.5%(-0.419)#7,393 |
Common Questions
What are the Top 10 Zip Codes with the Highest Percentage of Population Employed in Computer & Mathematics in Alabama?
Top 10 Zip Codes with the Highest Percentage of Population Employed in Computer & Mathematics in Alabama are:
What zip code has the Highest Percentage of Population Employed in Computer & Mathematics in Alabama?
36727 has the Highest Percentage of Population Employed in Computer & Mathematics in Alabama with 53.2%.
What is the Percentage of Population Employed in Computer & Mathematics in the State of Alabama?
Percentage of Population Employed in Computer & Mathematics in Alabama is 2.5%.
What is the Percentage of Population Employed in Computer & Mathematics in the United States?
Percentage of Population Employed in Computer & Mathematics in the United States is 3.5%.