Livingston, AL Map & Demographics
Livingston Map
Livingston Overview
$14,776
PER CAPITA INCOME
$20,417
AVG HOUSEHOLD INCOME
$11,272
FAMILY INCOME DEFICIT
0.57
INEQUALITY / GINI INDEX
3,297
TOTAL POPULATION
1,348
MALE POPULATION
1,949
FEMALE POPULATION
69.16
MALES / 100 FEMALES
144.58
FEMALES / 100 MALES
21.2
MEDIAN AGE
3.8
AVG FAMILY SIZE
2.7
AVG HOUSEHOLD SIZE
1,443
LABOR FORCE [ PEOPLE ]
53.5%
PERCENT IN LABOR FORCE
11.1%
UNEMPLOYMENT RATE
Livingston Zip Codes
Livingston Area Codes
Income in Livingston
Income Overview in Livingston
| Characteristic | Number | Measure |
| Per Capita Income | 3,297 | $14,776 |
| Median Family Income | 426 | $0 |
| Mean Family Income | 426 | $86,606 |
| Median Household Income | 778 | $20,417 |
| Mean Household Income | 778 | $55,327 |
| Income Deficit | 426 | $11,272 |
| Wage / Income Gap (%) | 3,297 | 0.00% |
| Wage / Income Gap ($) | 3,297 | 100.00¢ per $1 |
| Gini / Inequality Index | 3,297 | 0.57 |
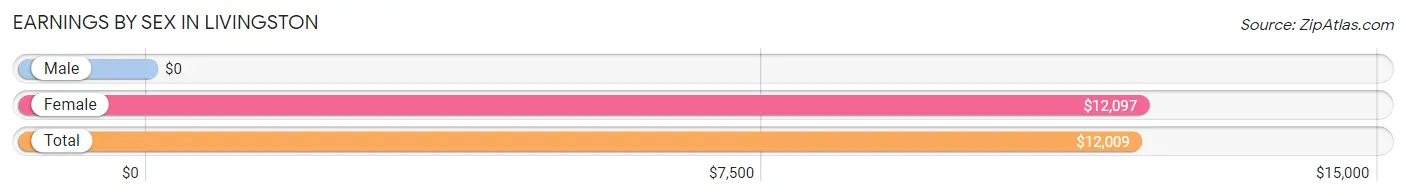
Earnings by Sex in Livingston
| Sex | Number | Average Earnings |
| Male | 708 (43.8%) | $0 |
| Female | 910 (56.2%) | $12,097 |
| Total | 1,618 (100.0%) | $12,009 |
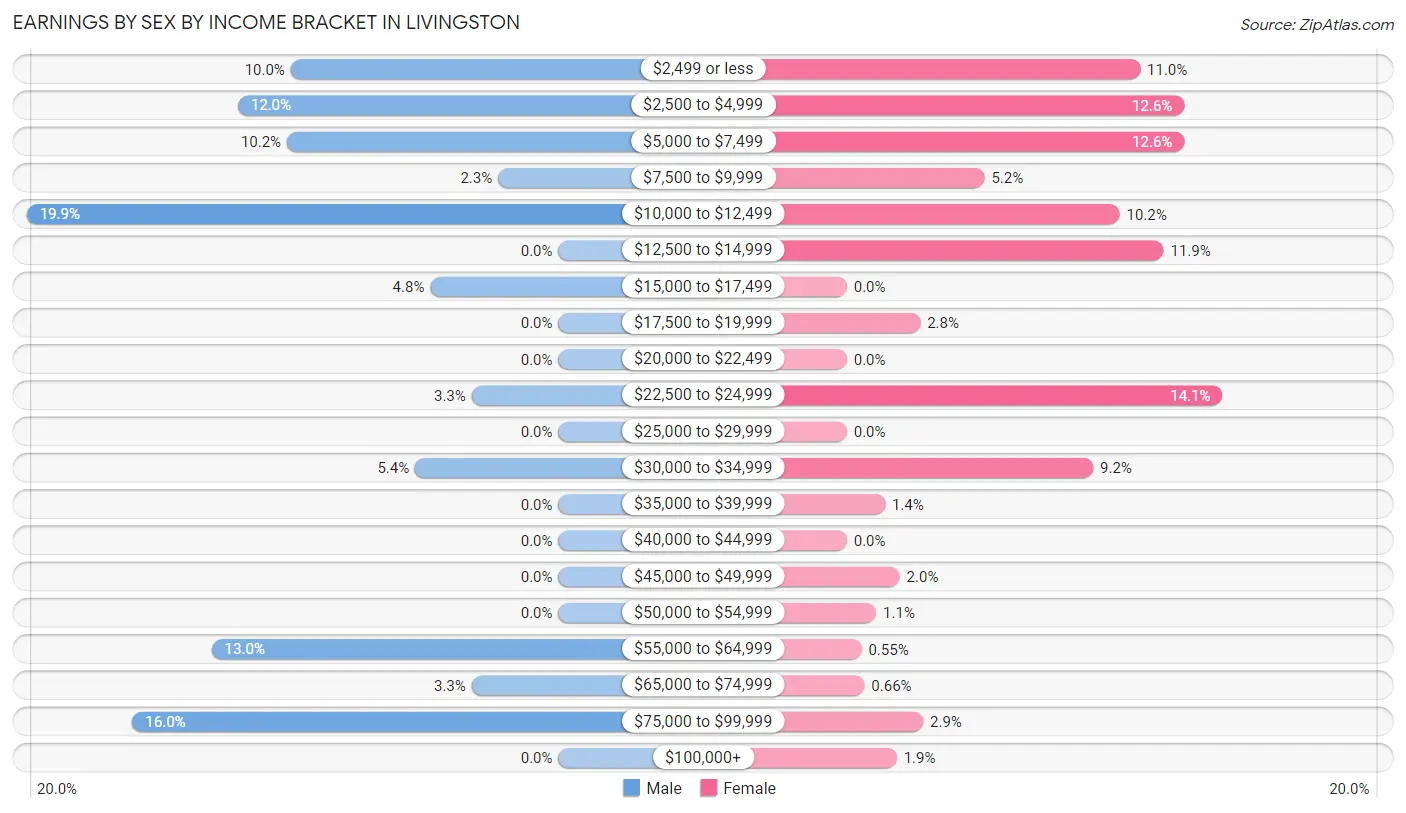
Earnings by Sex by Income Bracket in Livingston
The most common earnings brackets in Livingston are $10,000 to $12,499 for men (141 | 19.9%) and $22,500 to $24,999 for women (128 | 14.1%).
| Income | Male | Female |
| $2,499 or less | 71 (10.0%) | 100 (11.0%) |
| $2,500 to $4,999 | 85 (12.0%) | 115 (12.6%) |
| $5,000 to $7,499 | 72 (10.2%) | 115 (12.6%) |
| $7,500 to $9,999 | 16 (2.3%) | 47 (5.2%) |
| $10,000 to $12,499 | 141 (19.9%) | 93 (10.2%) |
| $12,500 to $14,999 | 0 (0.0%) | 108 (11.9%) |
| $15,000 to $17,499 | 34 (4.8%) | 0 (0.0%) |
| $17,500 to $19,999 | 0 (0.0%) | 25 (2.8%) |
| $20,000 to $22,499 | 0 (0.0%) | 0 (0.0%) |
| $22,500 to $24,999 | 23 (3.3%) | 128 (14.1%) |
| $25,000 to $29,999 | 0 (0.0%) | 0 (0.0%) |
| $30,000 to $34,999 | 38 (5.4%) | 84 (9.2%) |
| $35,000 to $39,999 | 0 (0.0%) | 13 (1.4%) |
| $40,000 to $44,999 | 0 (0.0%) | 0 (0.0%) |
| $45,000 to $49,999 | 0 (0.0%) | 18 (2.0%) |
| $50,000 to $54,999 | 0 (0.0%) | 10 (1.1%) |
| $55,000 to $64,999 | 92 (13.0%) | 5 (0.5%) |
| $65,000 to $74,999 | 23 (3.3%) | 6 (0.7%) |
| $75,000 to $99,999 | 113 (16.0%) | 26 (2.9%) |
| $100,000+ | 0 (0.0%) | 17 (1.9%) |
| Total | 708 (100.0%) | 910 (100.0%) |
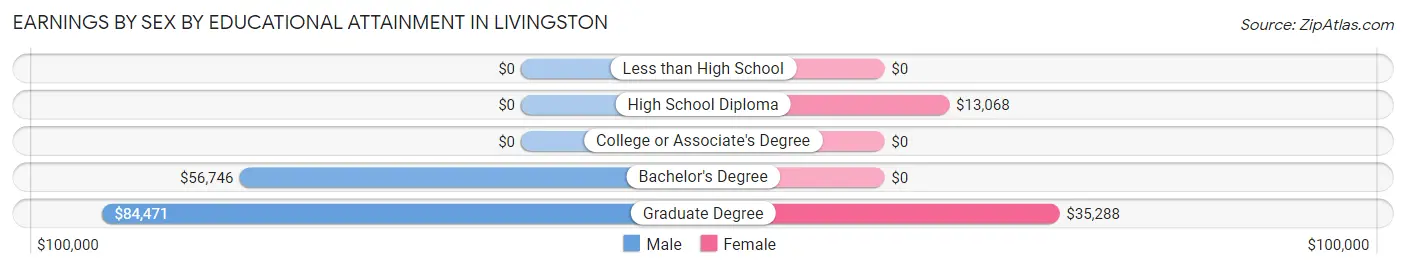
Earnings by Sex by Educational Attainment in Livingston
Average earnings in Livingston are $58,125 for men and $23,516 for women, a difference of 59.5%. Men with an educational attainment of graduate degree enjoy the highest average annual earnings of $84,471, while those with bachelor's degree education earn the least with $56,746. Women with an educational attainment of graduate degree earn the most with the average annual earnings of $35,288, while those with high school diploma education have the smallest earnings of $13,068.
| Educational Attainment | Male Income | Female Income |
| Less than High School | - | - |
| High School Diploma | - | - |
| College or Associate's Degree | - | - |
| Bachelor's Degree | $56,746 | $0 |
| Graduate Degree | $84,471 | $35,288 |
| Total | $58,125 | $23,516 |
Family Income in Livingston
Family Income Brackets in Livingston
According to the Livingston family income data, there are 134 families falling into the $100,000 to $149,999 income range, which is the most common income bracket and makes up 31.5% of all families.
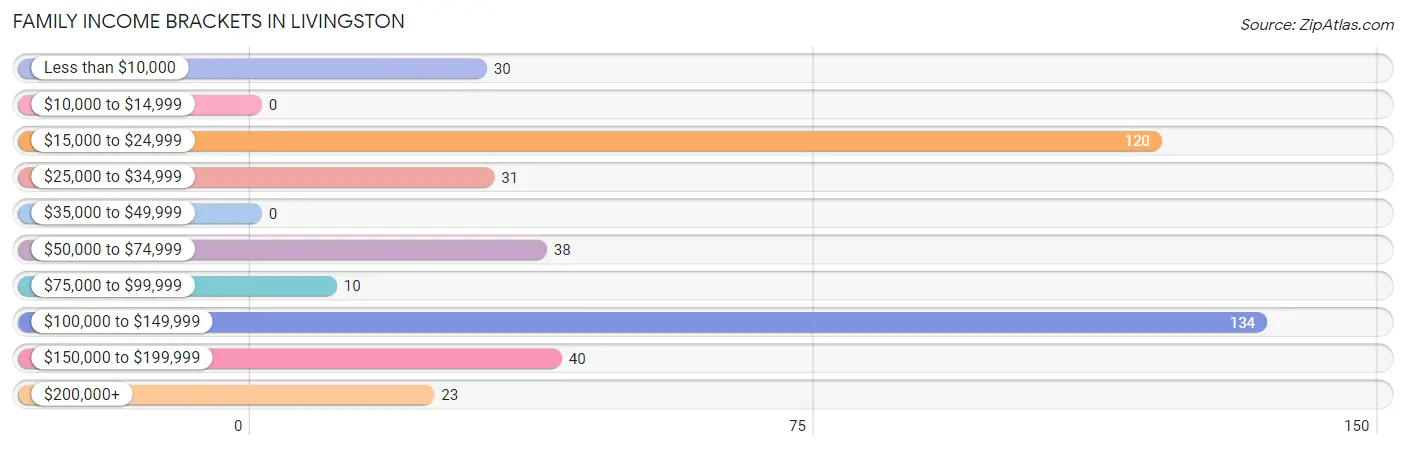
| Income Bracket | # Families | % Families |
| Less than $10,000 | 30 | 7.0% |
| $10,000 to $14,999 | 0 | 0.0% |
| $15,000 to $24,999 | 120 | 28.2% |
| $25,000 to $34,999 | 31 | 7.3% |
| $35,000 to $49,999 | 0 | 0.0% |
| $50,000 to $74,999 | 38 | 8.9% |
| $75,000 to $99,999 | 10 | 2.3% |
| $100,000 to $149,999 | 134 | 31.5% |
| $150,000 to $199,999 | 40 | 9.4% |
| $200,000+ | 23 | 5.4% |
Family Income by Famaliy Size in Livingston
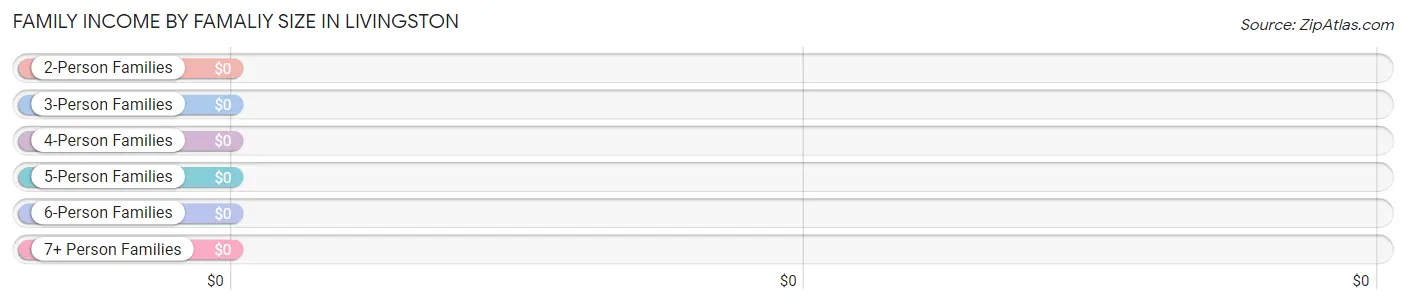
| Income Bracket | # Families | Median Income |
| 2-Person Families | 194 (45.5%) | $0 |
| 3-Person Families | 63 (14.8%) | $0 |
| 4-Person Families | 149 (35.0%) | $0 |
| 5-Person Families | 0 (0.0%) | $0 |
| 6-Person Families | 0 (0.0%) | $0 |
| 7+ Person Families | 20 (4.7%) | $0 |
| Total | 426 (100.0%) | $0 |
Family Income by Number of Earners in Livingston
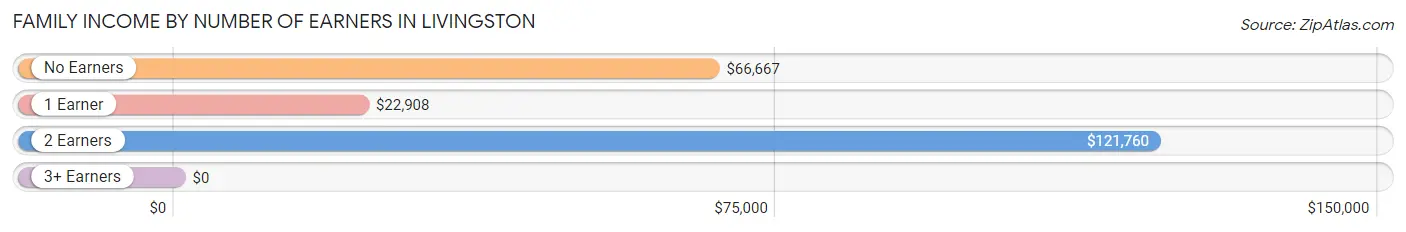
| Number of Earners | # Families | Median Income |
| No Earners | 46 (10.8%) | $66,667 |
| 1 Earner | 151 (35.4%) | $22,908 |
| 2 Earners | 209 (49.1%) | $121,760 |
| 3+ Earners | 20 (4.7%) | $0 |
| Total | 426 (100.0%) | $0 |
Household Income in Livingston
Household Income Brackets in Livingston
With 281 households falling in the category, the $15,000 to $24,999 income range is the most frequent in Livingston, accounting for 36.1% of all households.
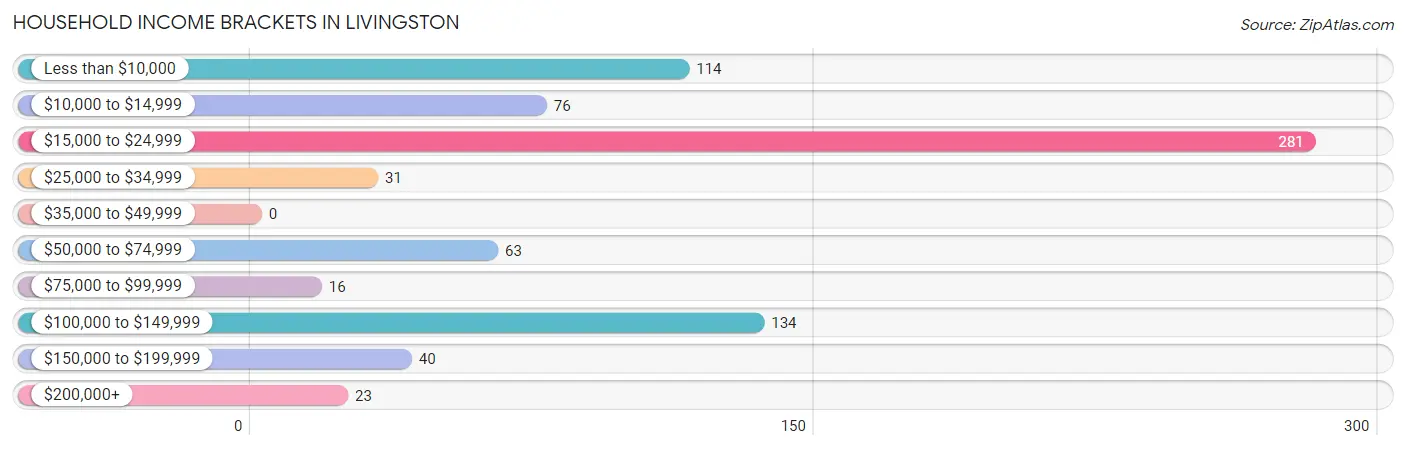
| Income Bracket | # Households | % Households |
| Less than $10,000 | 114 | 14.7% |
| $10,000 to $14,999 | 76 | 9.8% |
| $15,000 to $24,999 | 281 | 36.1% |
| $25,000 to $34,999 | 31 | 4.0% |
| $35,000 to $49,999 | 0 | 0.0% |
| $50,000 to $74,999 | 63 | 8.1% |
| $75,000 to $99,999 | 16 | 2.1% |
| $100,000 to $149,999 | 134 | 17.2% |
| $150,000 to $199,999 | 40 | 5.1% |
| $200,000+ | 23 | 3.0% |
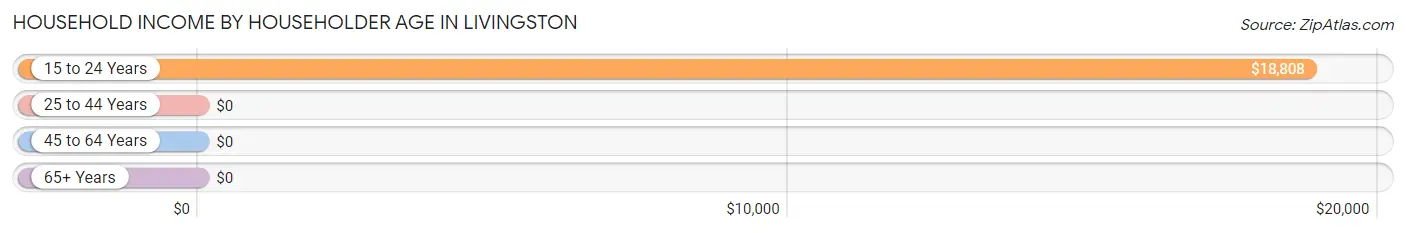
Household Income by Householder Age in Livingston
The median household income in Livingston is $20,417, with the highest median household income of $18,808 found in the 15 to 24 years age bracket for the primary householder. A total of 200 households (25.7%) fall into this category. Meanwhile, the 25 to 44 years age bracket for the primary householder has the lowest median household income of $0, with 261 households (33.6%) in this group.
| Income Bracket | # Households | Median Income |
| 15 to 24 Years | 200 (25.7%) | $18,808 |
| 25 to 44 Years | 261 (33.6%) | $0 |
| 45 to 64 Years | 215 (27.6%) | $0 |
| 65+ Years | 102 (13.1%) | $0 |
| Total | 778 (100.0%) | $20,417 |
Poverty in Livingston
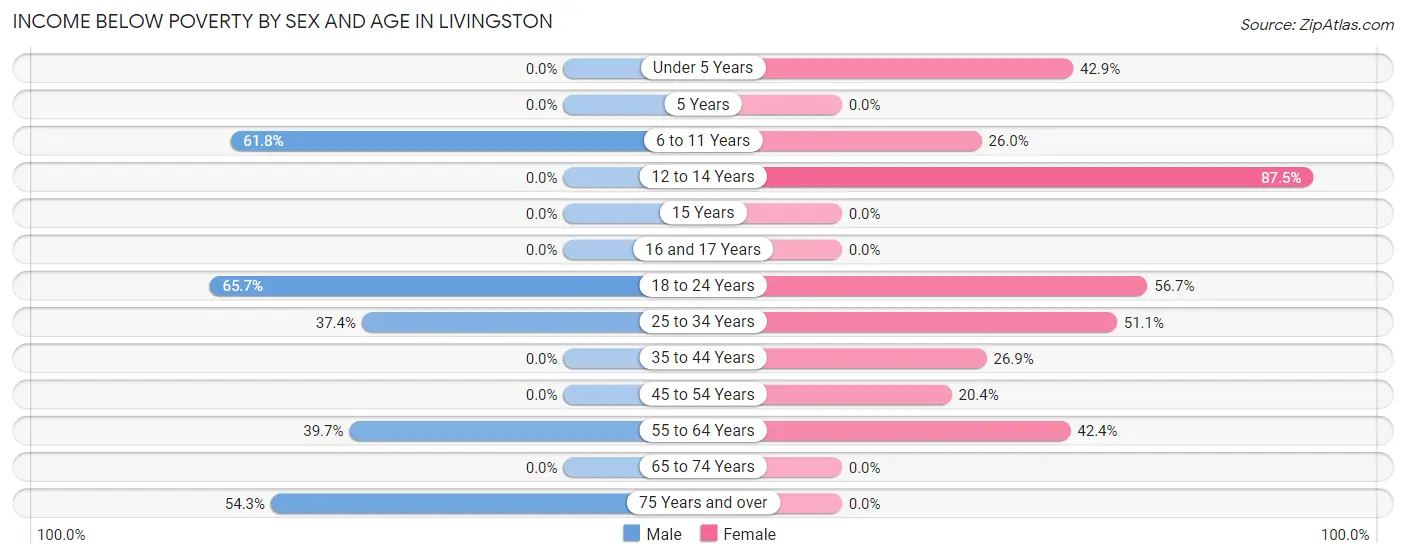
Income Below Poverty by Sex and Age in Livingston
With 38.4% poverty level for males and 41.7% for females among the residents of Livingston, 18 to 24 year old males and 12 to 14 year old females are the most vulnerable to poverty, with 132 males (65.7%) and 49 females (87.5%) in their respective age groups living below the poverty level.
| Age Bracket | Male | Female |
| Under 5 Years | 0 (0.0%) | 85 (42.9%) |
| 5 Years | 0 (0.0%) | 0 (0.0%) |
| 6 to 11 Years | 102 (61.8%) | 34 (26.0%) |
| 12 to 14 Years | 0 (0.0%) | 49 (87.5%) |
| 15 Years | 0 (0.0%) | 0 (0.0%) |
| 16 and 17 Years | 0 (0.0%) | 0 (0.0%) |
| 18 to 24 Years | 132 (65.7%) | 186 (56.7%) |
| 25 to 34 Years | 58 (37.4%) | 73 (51.0%) |
| 35 to 44 Years | 0 (0.0%) | 36 (26.9%) |
| 45 to 54 Years | 0 (0.0%) | 11 (20.4%) |
| 55 to 64 Years | 31 (39.7%) | 28 (42.4%) |
| 65 to 74 Years | 0 (0.0%) | 0 (0.0%) |
| 75 Years and over | 19 (54.3%) | 0 (0.0%) |
| Total | 342 (38.4%) | 502 (41.7%) |
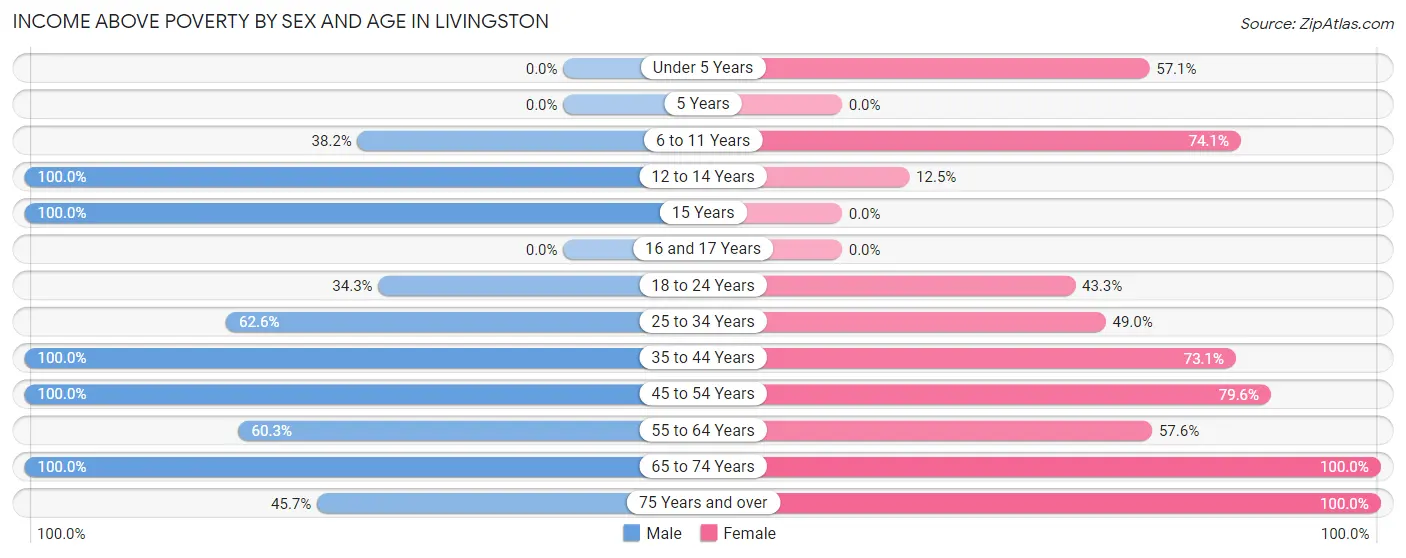
Income Above Poverty by Sex and Age in Livingston
According to the poverty statistics in Livingston, males aged 12 to 14 years and females aged 65 to 74 years are the age groups that are most secure financially, with 100.0% of males and 100.0% of females in these age groups living above the poverty line.
| Age Bracket | Male | Female |
| Under 5 Years | 0 (0.0%) | 113 (57.1%) |
| 5 Years | 0 (0.0%) | 0 (0.0%) |
| 6 to 11 Years | 63 (38.2%) | 97 (74.1%) |
| 12 to 14 Years | 22 (100.0%) | 7 (12.5%) |
| 15 Years | 27 (100.0%) | 0 (0.0%) |
| 16 and 17 Years | 0 (0.0%) | 0 (0.0%) |
| 18 to 24 Years | 69 (34.3%) | 142 (43.3%) |
| 25 to 34 Years | 97 (62.6%) | 70 (48.9%) |
| 35 to 44 Years | 107 (100.0%) | 98 (73.1%) |
| 45 to 54 Years | 79 (100.0%) | 43 (79.6%) |
| 55 to 64 Years | 47 (60.3%) | 38 (57.6%) |
| 65 to 74 Years | 21 (100.0%) | 58 (100.0%) |
| 75 Years and over | 16 (45.7%) | 35 (100.0%) |
| Total | 548 (61.6%) | 701 (58.3%) |
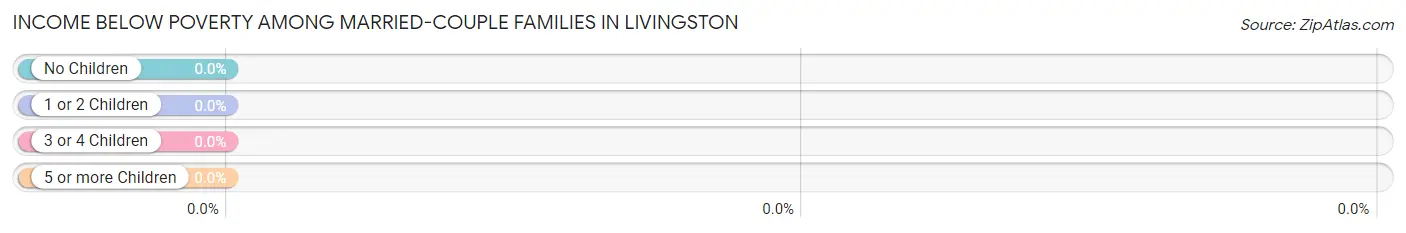
Income Below Poverty Among Married-Couple Families in Livingston
| Children | Above Poverty | Below Poverty |
| No Children | 171 (100.0%) | 0 (0.0%) |
| 1 or 2 Children | 81 (100.0%) | 0 (0.0%) |
| 3 or 4 Children | 0 (0.0%) | 0 (0.0%) |
| 5 or more Children | 20 (100.0%) | 0 (0.0%) |
| Total | 272 (100.0%) | 0 (0.0%) |
Income Below Poverty Among Single-Parent Households in Livingston
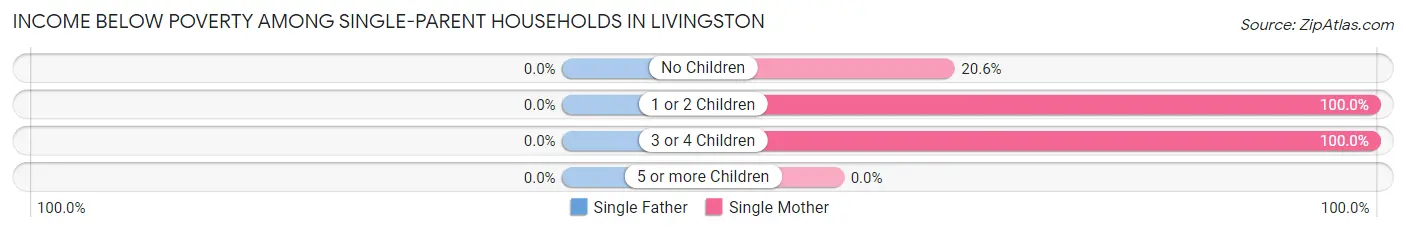
| Children | Single Father | Single Mother |
| No Children | 0 (0.0%) | 13 (20.6%) |
| 1 or 2 Children | 0 (0.0%) | 61 (100.0%) |
| 3 or 4 Children | 0 (0.0%) | 30 (100.0%) |
| 5 or more Children | 0 (0.0%) | 0 (0.0%) |
| Total | 0 (0.0%) | 104 (67.5%) |
Income Below Poverty Among Married-Couple vs Single-Parent Households in Livingston
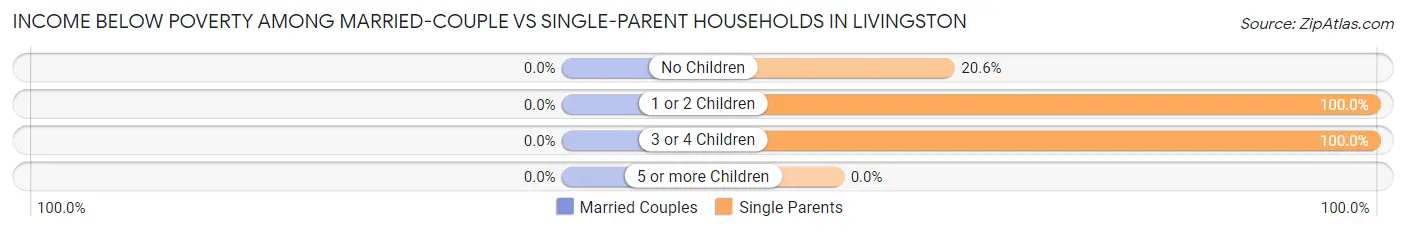
| Children | Married-Couple Families | Single-Parent Households |
| No Children | 0 (0.0%) | 13 (20.6%) |
| 1 or 2 Children | 0 (0.0%) | 61 (100.0%) |
| 3 or 4 Children | 0 (0.0%) | 30 (100.0%) |
| 5 or more Children | 0 (0.0%) | 0 (0.0%) |
| Total | 0 (0.0%) | 104 (67.5%) |
Race in Livingston
The most populous races in Livingston are Black / African American (1,851 | 56.1%), White / Caucasian (1,327 | 40.3%), and Two or more Races (56 | 1.7%).
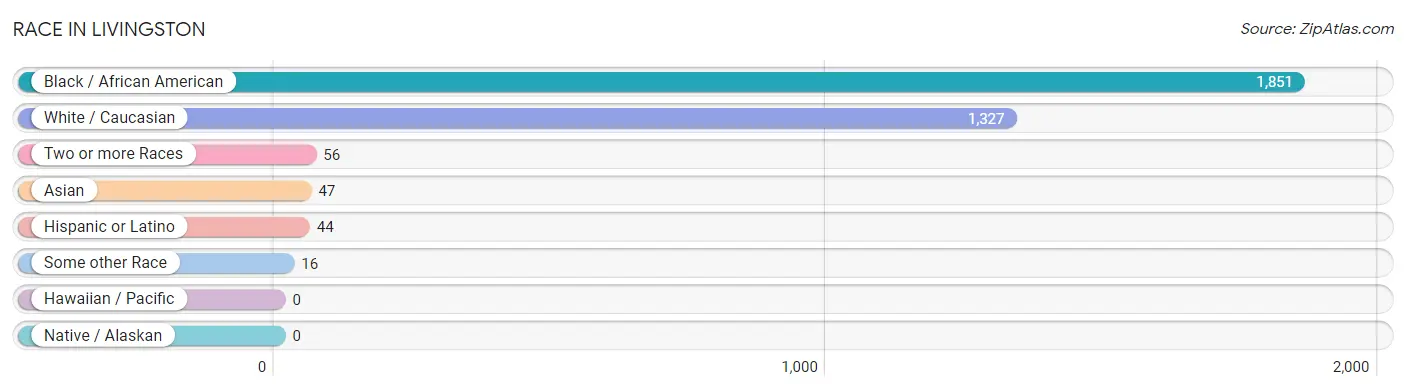
| Race | # Population | % Population |
| Asian | 47 | 1.4% |
| Black / African American | 1,851 | 56.1% |
| Hawaiian / Pacific | 0 | 0.0% |
| Hispanic or Latino | 44 | 1.3% |
| Native / Alaskan | 0 | 0.0% |
| White / Caucasian | 1,327 | 40.3% |
| Two or more Races | 56 | 1.7% |
| Some other Race | 16 | 0.5% |
| Total | 3,297 | 100.0% |
Ancestry in Livingston
The most populous ancestries reported in Livingston are American (513 | 15.6%), Scottish (279 | 8.5%), European (131 | 4.0%), English (128 | 3.9%), and French (55 | 1.7%), together accounting for 33.5% of all Livingston residents.
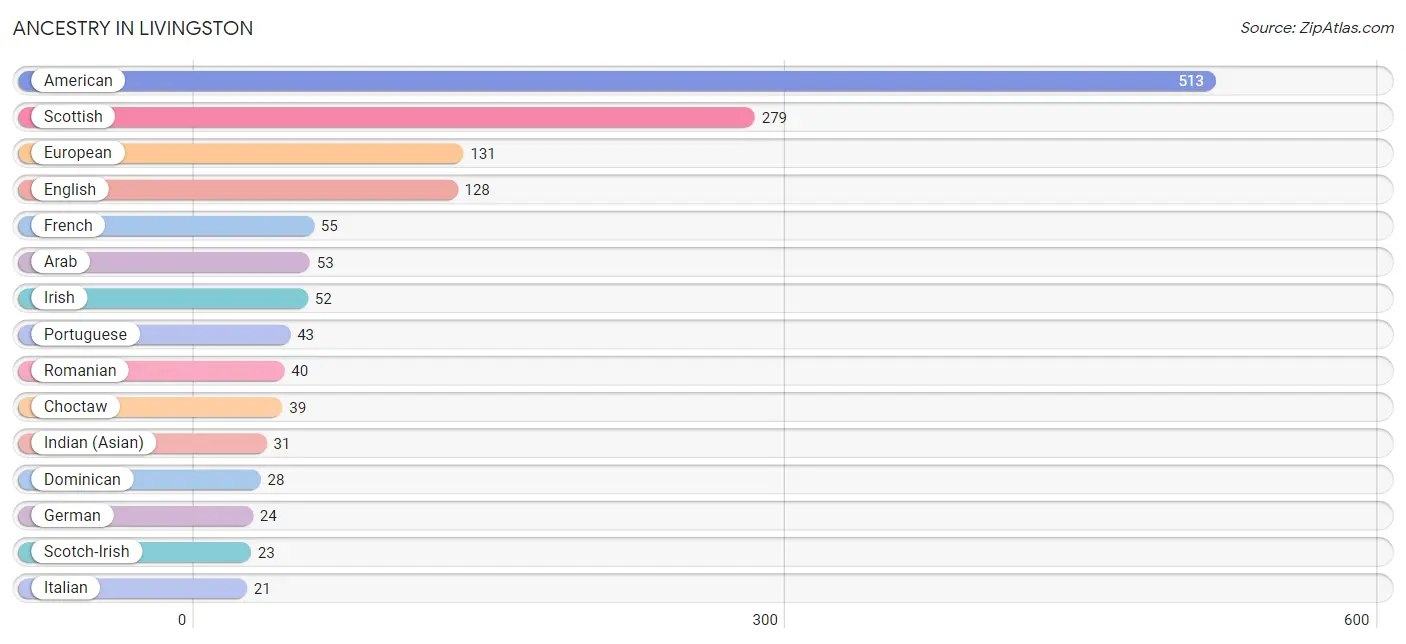
| Ancestry | # Population | % Population |
| American | 513 | 15.6% |
| Arab | 53 | 1.6% |
| Bhutanese | 16 | 0.5% |
| British | 3 | 0.1% |
| Choctaw | 39 | 1.2% |
| Dominican | 28 | 0.9% |
| English | 128 | 3.9% |
| European | 131 | 4.0% |
| French | 55 | 1.7% |
| German | 24 | 0.7% |
| Indian (Asian) | 31 | 0.9% |
| Irish | 52 | 1.6% |
| Italian | 21 | 0.6% |
| Mexican | 16 | 0.5% |
| Portuguese | 43 | 1.3% |
| Romanian | 40 | 1.2% |
| Scotch-Irish | 23 | 0.7% |
| Scottish | 279 | 8.5% |
| Slovak | 5 | 0.2% |
| Swedish | 12 | 0.4% |
| Swiss | 3 | 0.1% | View All 21 Rows |
Immigrants in Livingston
The most numerous immigrant groups reported in Livingston came from Africa (53 | 1.6%), Egypt (53 | 1.6%), Northern Africa (53 | 1.6%), Brazil (43 | 1.3%), and Latin America (43 | 1.3%), together accounting for 7.4% of all Livingston residents.
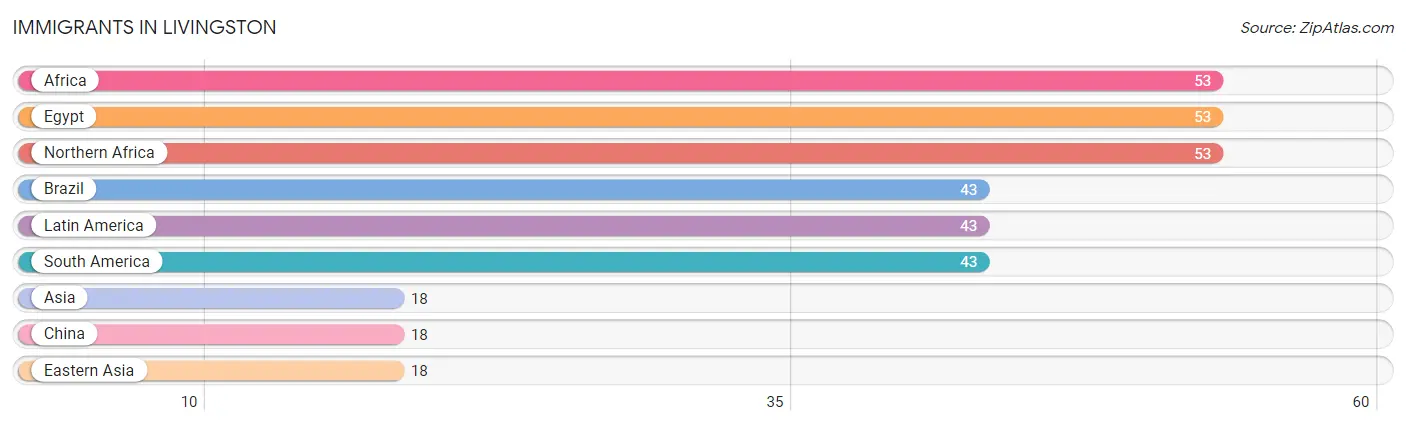
| Immigration Origin | # Population | % Population |
| Africa | 53 | 1.6% |
| Asia | 18 | 0.5% |
| Brazil | 43 | 1.3% |
| China | 18 | 0.5% |
| Eastern Asia | 18 | 0.5% |
| Egypt | 53 | 1.6% |
| Latin America | 43 | 1.3% |
| Northern Africa | 53 | 1.6% |
| South America | 43 | 1.3% | View All 9 Rows |
Sex and Age in Livingston
Sex and Age in Livingston
The most populous age groups in Livingston are 20 to 24 Years (482 | 35.8%) for men and 20 to 24 Years (572 | 29.3%) for women.
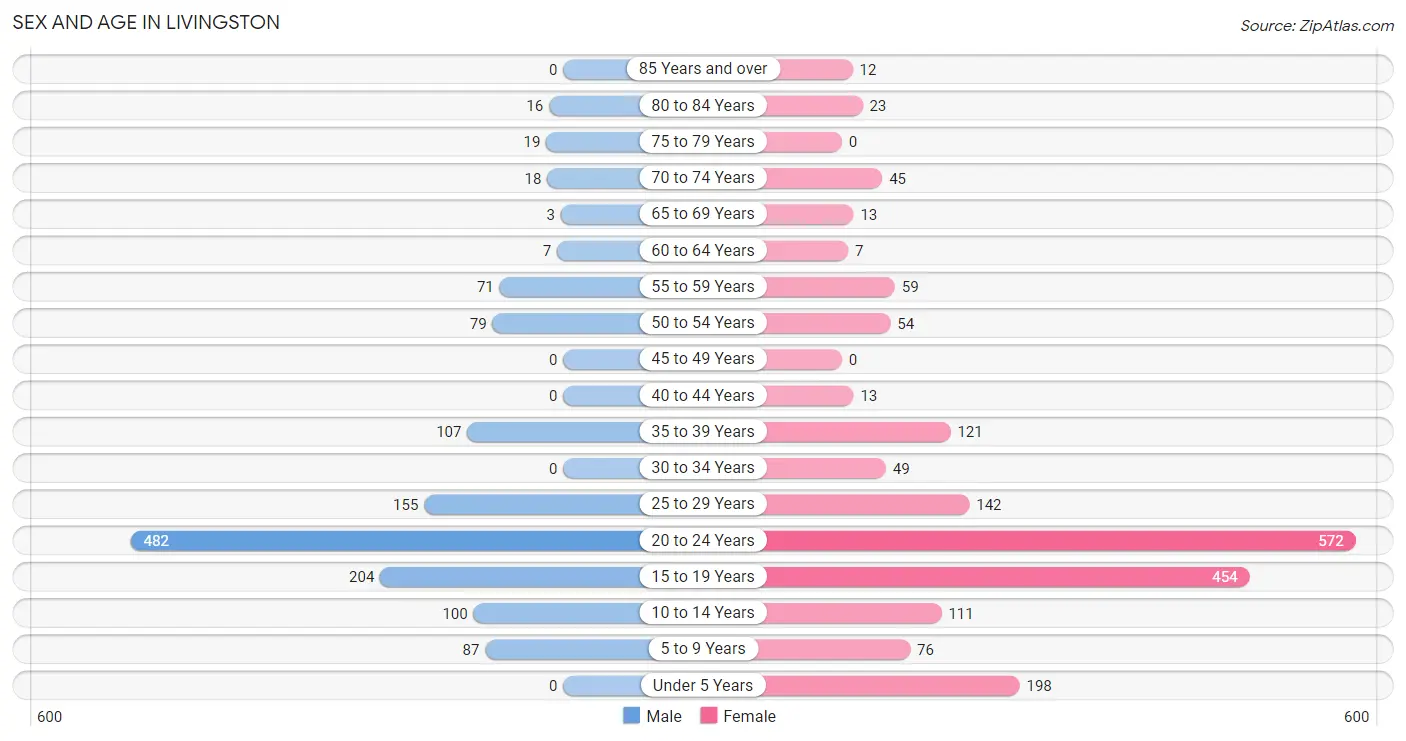
| Age Bracket | Male | Female |
| Under 5 Years | 0 (0.0%) | 198 (10.2%) |
| 5 to 9 Years | 87 (6.5%) | 76 (3.9%) |
| 10 to 14 Years | 100 (7.4%) | 111 (5.7%) |
| 15 to 19 Years | 204 (15.1%) | 454 (23.3%) |
| 20 to 24 Years | 482 (35.8%) | 572 (29.3%) |
| 25 to 29 Years | 155 (11.5%) | 142 (7.3%) |
| 30 to 34 Years | 0 (0.0%) | 49 (2.5%) |
| 35 to 39 Years | 107 (7.9%) | 121 (6.2%) |
| 40 to 44 Years | 0 (0.0%) | 13 (0.7%) |
| 45 to 49 Years | 0 (0.0%) | 0 (0.0%) |
| 50 to 54 Years | 79 (5.9%) | 54 (2.8%) |
| 55 to 59 Years | 71 (5.3%) | 59 (3.0%) |
| 60 to 64 Years | 7 (0.5%) | 7 (0.4%) |
| 65 to 69 Years | 3 (0.2%) | 13 (0.7%) |
| 70 to 74 Years | 18 (1.3%) | 45 (2.3%) |
| 75 to 79 Years | 19 (1.4%) | 0 (0.0%) |
| 80 to 84 Years | 16 (1.2%) | 23 (1.2%) |
| 85 Years and over | 0 (0.0%) | 12 (0.6%) |
| Total | 1,348 (100.0%) | 1,949 (100.0%) |
Families and Households in Livingston
Median Family Size in Livingston
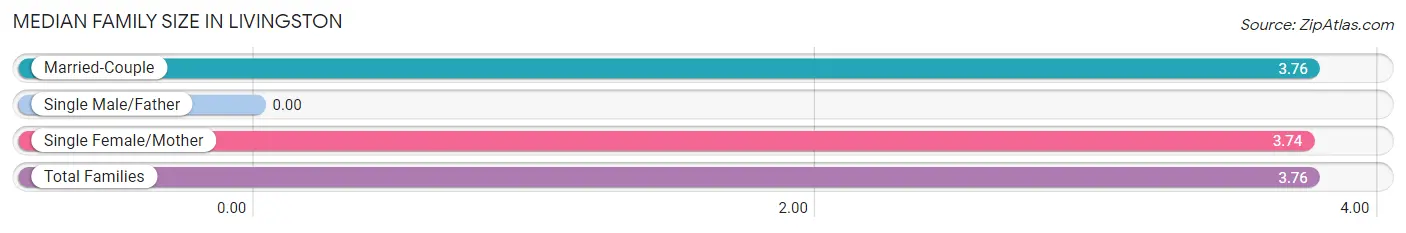
| Family Type | # Families | Family Size |
| Married-Couple | 272 (63.8%) | 3.76 |
| Single Male/Father | 0 (0.0%) | - |
| Single Female/Mother | 154 (36.1%) | 3.74 |
| Total Families | 426 (100.0%) | 3.76 |
Median Household Size in Livingston
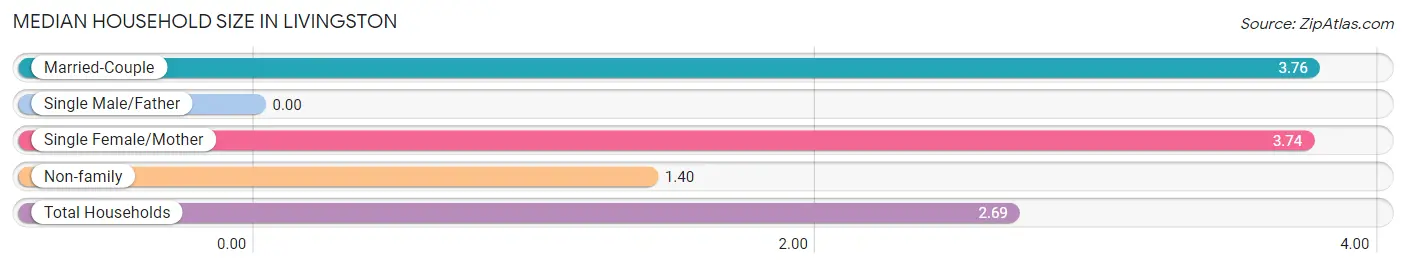
| Household Type | # Households | Household Size |
| Married-Couple | 272 (35.0%) | 3.76 |
| Single Male/Father | 0 (0.0%) | - |
| Single Female/Mother | 154 (19.8%) | 3.74 |
| Non-family | 352 (45.2%) | 1.40 |
| Total Households | 778 (100.0%) | 2.69 |
Household Size by Marriage Status in Livingston
Out of a total of 778 households in Livingston, 426 (54.8%) are family households, while 352 (45.2%) are nonfamily households. The most numerous type of family households are 2-person households, comprising 194, and the most common type of nonfamily households are 1-person households, comprising 231.
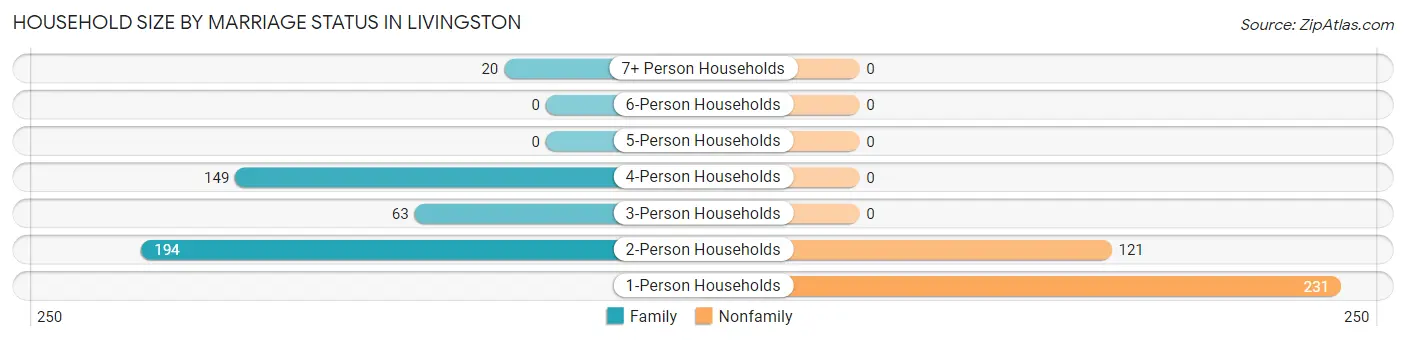
| Household Size | Family Households | Nonfamily Households |
| 1-Person Households | - | 231 (29.7%) |
| 2-Person Households | 194 (24.9%) | 121 (15.5%) |
| 3-Person Households | 63 (8.1%) | 0 (0.0%) |
| 4-Person Households | 149 (19.2%) | 0 (0.0%) |
| 5-Person Households | 0 (0.0%) | 0 (0.0%) |
| 6-Person Households | 0 (0.0%) | 0 (0.0%) |
| 7+ Person Households | 20 (2.6%) | 0 (0.0%) |
| Total | 426 (54.8%) | 352 (45.2%) |
Female Fertility in Livingston
Fertility by Age in Livingston
Average fertility rate in Livingston is 28.0 births per 1,000 women. Women in the age bracket of 35 to 50 years have the highest fertility rate with 128.0 births per 1,000 women. Women in the age bracket of 35 to 50 years acount for 52.6% of all women with births.
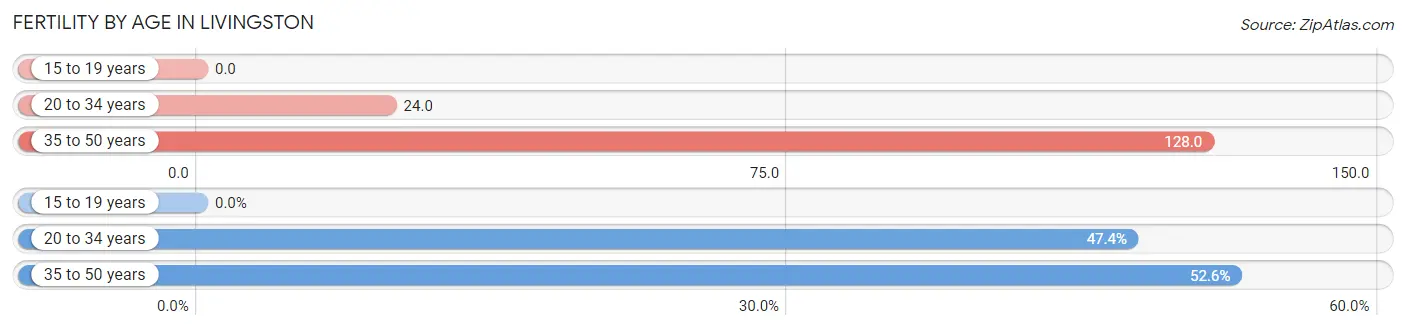
| Age Bracket | Women with Births | Births / 1,000 Women |
| 15 to 19 years | 0 (0.0%) | 0.0 |
| 20 to 34 years | 18 (47.4%) | 24.0 |
| 35 to 50 years | 20 (52.6%) | 128.0 |
| Total | 38 (100.0%) | 28.0 |
Fertility by Age by Marriage Status in Livingston
52.6% of women with births (38) in Livingston are married. The highest percentage of unmarried women with births falls into 20 to 34 years age bracket with 100.0% of them unmarried at the time of birth, while the lowest percentage of unmarried women with births belong to 35 to 50 years age bracket with 0.0% of them unmarried.
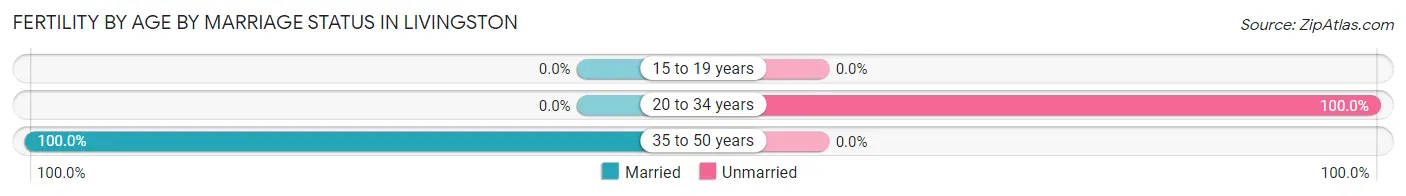
| Age Bracket | Married | Unmarried |
| 15 to 19 years | 0 (0.0%) | 0 (0.0%) |
| 20 to 34 years | 0 (0.0%) | 18 (100.0%) |
| 35 to 50 years | 20 (100.0%) | 0 (0.0%) |
| Total | 20 (52.6%) | 18 (47.4%) |
Fertility by Education in Livingston
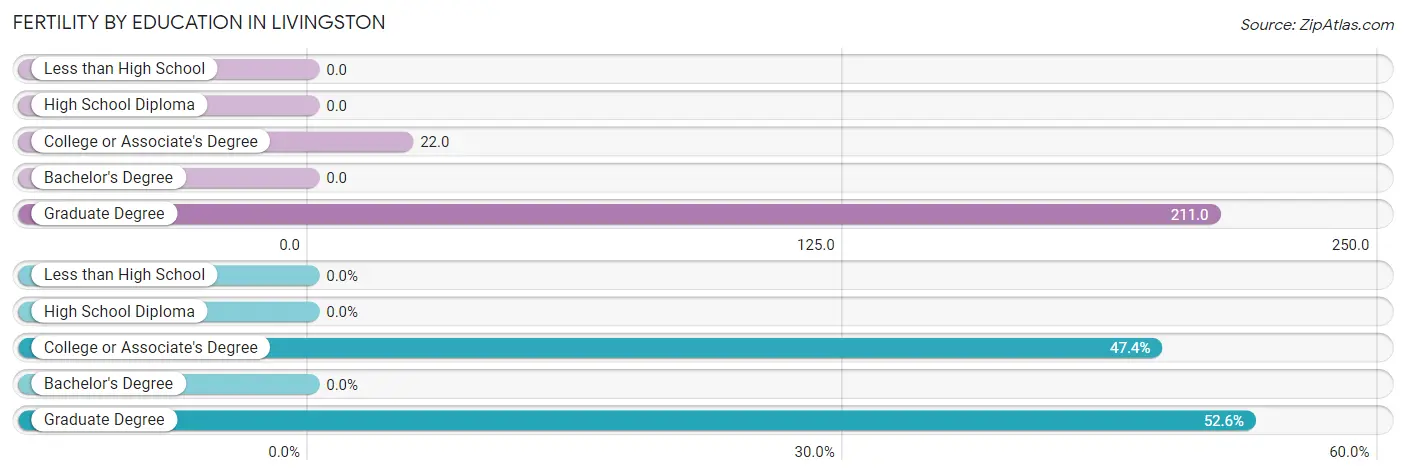
| Educational Attainment | Women with Births | Births / 1,000 Women |
| Less than High School | 0 (0.0%) | 0.0 |
| High School Diploma | 0 (0.0%) | 0.0 |
| College or Associate's Degree | 18 (47.4%) | 22.0 |
| Bachelor's Degree | 0 (0.0%) | 0.0 |
| Graduate Degree | 20 (52.6%) | 211.0 |
| Total | 38 (100.0%) | 28.0 |
Fertility by Education by Marriage Status in Livingston
47.4% of women with births in Livingston are unmarried. Women with the educational attainment of graduate degree are most likely to be married with 100.0% of them married at childbirth, while women with the educational attainment of college or associate's degree are least likely to be married with 100.0% of them unmarried at childbirth.
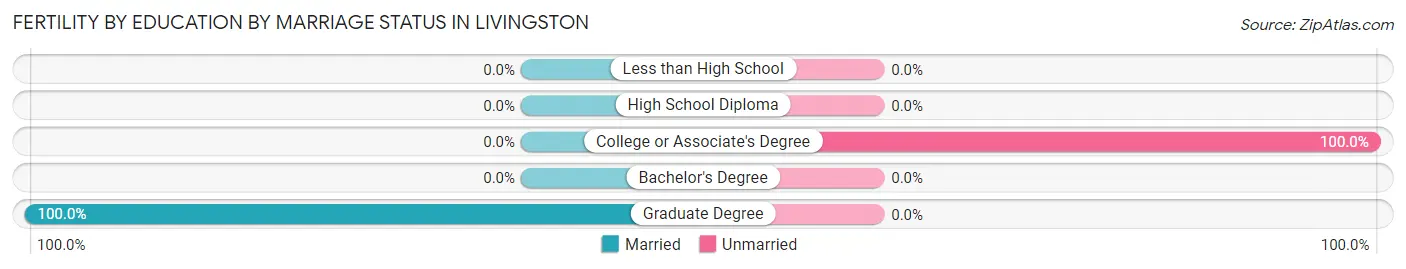
| Educational Attainment | Married | Unmarried |
| Less than High School | 0 (0.0%) | 0 (0.0%) |
| High School Diploma | 0 (0.0%) | 0 (0.0%) |
| College or Associate's Degree | 0 (0.0%) | 18 (100.0%) |
| Bachelor's Degree | 0 (0.0%) | 0 (0.0%) |
| Graduate Degree | 20 (100.0%) | 0 (0.0%) |
| Total | 20 (52.6%) | 18 (47.4%) |
Employment Characteristics in Livingston
Employment by Class of Employer in Livingston
Among the 1,283 employed individuals in Livingston, state government employees (437 | 34.1%), private company employees (418 | 32.6%), and not-for-profit organizations (185 | 14.4%) make up the most common classes of employment.
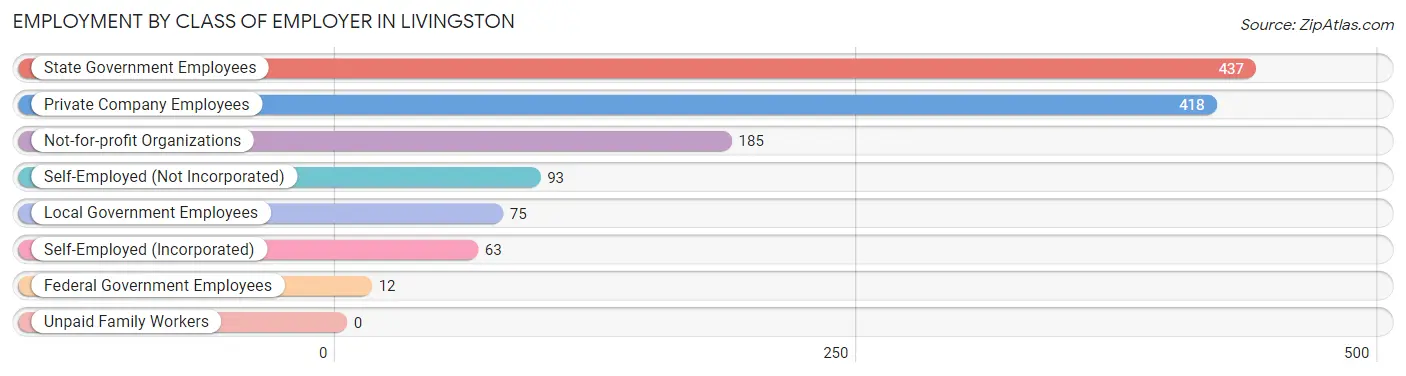
| Employer Class | # Employees | % Employees |
| Private Company Employees | 418 | 32.6% |
| Self-Employed (Incorporated) | 63 | 4.9% |
| Self-Employed (Not Incorporated) | 93 | 7.2% |
| Not-for-profit Organizations | 185 | 14.4% |
| Local Government Employees | 75 | 5.9% |
| State Government Employees | 437 | 34.1% |
| Federal Government Employees | 12 | 0.9% |
| Unpaid Family Workers | 0 | 0.0% |
| Total | 1,283 | 100.0% |
Employment Status by Age in Livingston
According to the labor force statistics for Livingston, out of the total population over 16 years of age (2,698), 53.5% or 1,443 individuals are in the labor force, with 11.1% or 160 of them unemployed. The age group with the highest labor force participation rate is 30 to 34 years, with 100.0% or 49 individuals in the labor force. Within the labor force, the 25 to 29 years age range has the highest percentage of unemployed individuals, with 23.3% or 58 of them being unemployed.
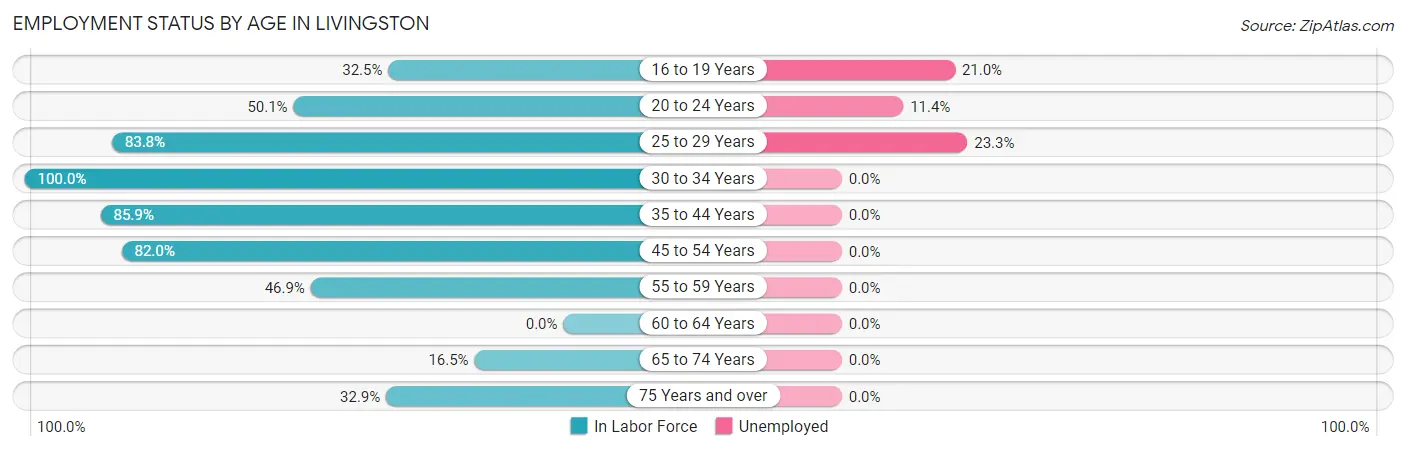
| Age Bracket | In Labor Force | Unemployed |
| 16 to 19 Years | 205 (32.5%) | 43 (21.0%) |
| 20 to 24 Years | 528 (50.1%) | 60 (11.4%) |
| 25 to 29 Years | 249 (83.8%) | 58 (23.3%) |
| 30 to 34 Years | 49 (100.0%) | 0 (0.0%) |
| 35 to 44 Years | 207 (85.9%) | 0 (0.0%) |
| 45 to 54 Years | 109 (82.0%) | 0 (0.0%) |
| 55 to 59 Years | 61 (46.9%) | 0 (0.0%) |
| 60 to 64 Years | 0 (0.0%) | 0 (0.0%) |
| 65 to 74 Years | 13 (16.5%) | 0 (0.0%) |
| 75 Years and over | 23 (32.9%) | 0 (0.0%) |
| Total | 1,443 (53.5%) | 160 (11.1%) |
Employment Status by Educational Attainment in Livingston
According to labor force statistics for Livingston, 78.1% of individuals (675) out of the total population between 25 and 64 years of age (864) are in the labor force, with 8.6% or 58 of them being unemployed. The group with the highest labor force participation rate are those with the educational attainment of less than high school, with 100.0% or 11 individuals in the labor force. Within the labor force, individuals with high school diploma education have the highest percentage of unemployment, with 32.2% or 58 of them being unemployed.
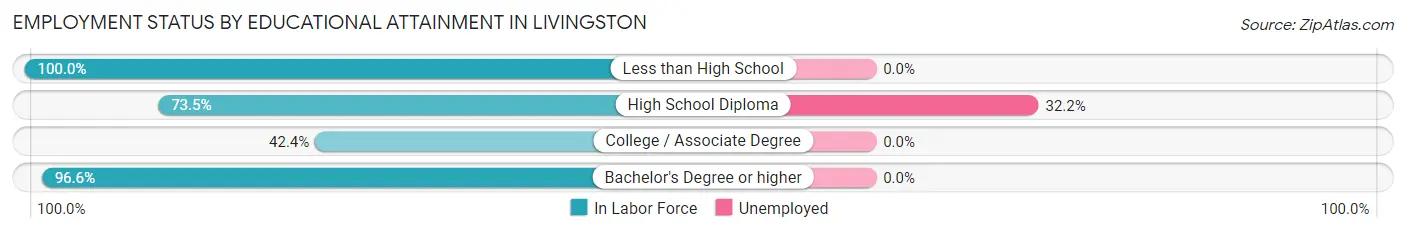
| Educational Attainment | In Labor Force | Unemployed |
| Less than High School | 11 (100.0%) | 0 (0.0%) |
| High School Diploma | 180 (73.5%) | 79 (32.2%) |
| College / Associate Degree | 81 (42.4%) | 0 (0.0%) |
| Bachelor's Degree or higher | 403 (96.6%) | 0 (0.0%) |
| Total | 675 (78.1%) | 74 (8.6%) |
Employment Occupations by Sex in Livingston
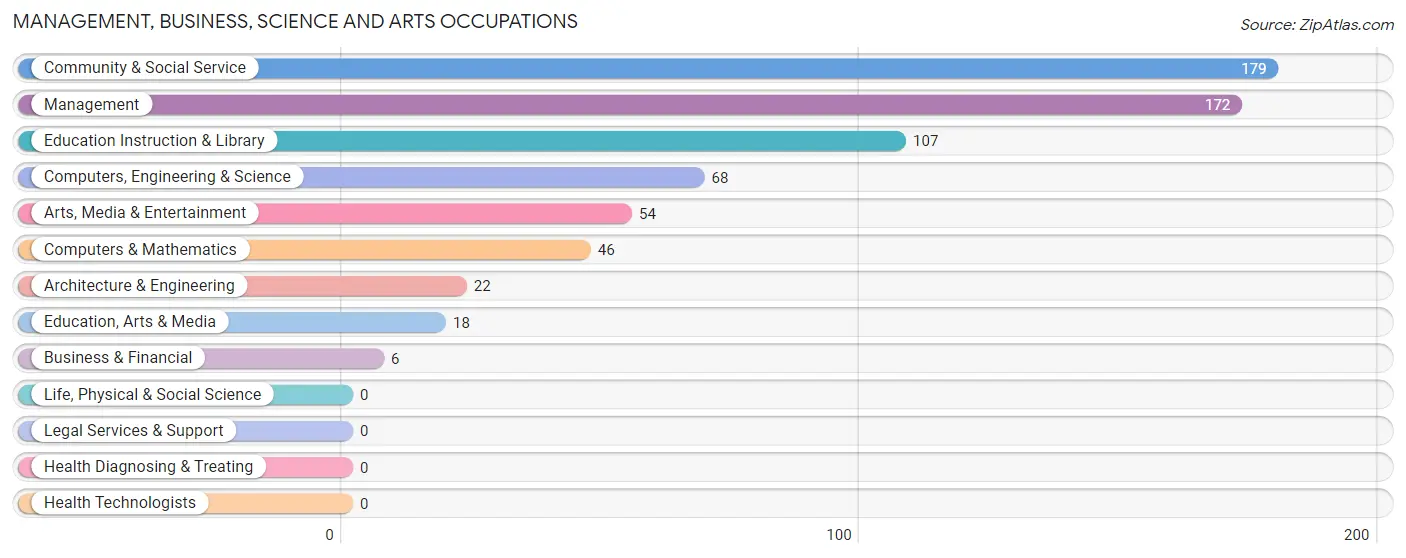
Management, Business, Science and Arts Occupations
The most common Management, Business, Science and Arts occupations in Livingston are Community & Social Service (179 | 14.0%), Management (172 | 13.4%), Education Instruction & Library (107 | 8.3%), Computers, Engineering & Science (68 | 5.3%), and Arts, Media & Entertainment (54 | 4.2%).
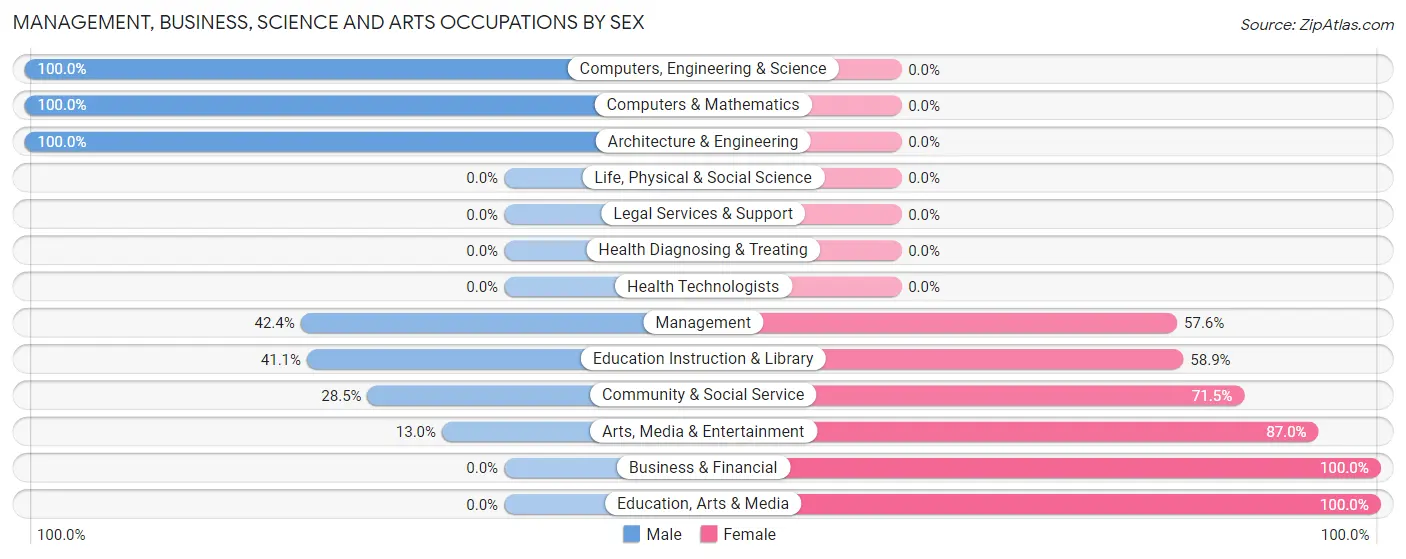
Management, Business, Science and Arts Occupations by Sex
Within the Management, Business, Science and Arts occupations in Livingston, the most male-oriented occupations are Computers, Engineering & Science (100.0%), Computers & Mathematics (100.0%), and Architecture & Engineering (100.0%), while the most female-oriented occupations are Business & Financial (100.0%), Education, Arts & Media (100.0%), and Arts, Media & Entertainment (87.0%).
| Occupation | Male | Female |
| Management | 73 (42.4%) | 99 (57.6%) |
| Business & Financial | 0 (0.0%) | 6 (100.0%) |
| Computers, Engineering & Science | 68 (100.0%) | 0 (0.0%) |
| Computers & Mathematics | 46 (100.0%) | 0 (0.0%) |
| Architecture & Engineering | 22 (100.0%) | 0 (0.0%) |
| Life, Physical & Social Science | 0 (0.0%) | 0 (0.0%) |
| Community & Social Service | 51 (28.5%) | 128 (71.5%) |
| Education, Arts & Media | 0 (0.0%) | 18 (100.0%) |
| Legal Services & Support | 0 (0.0%) | 0 (0.0%) |
| Education Instruction & Library | 44 (41.1%) | 63 (58.9%) |
| Arts, Media & Entertainment | 7 (13.0%) | 47 (87.0%) |
| Health Diagnosing & Treating | 0 (0.0%) | 0 (0.0%) |
| Health Technologists | 0 (0.0%) | 0 (0.0%) |
| Total (Category) | 192 (45.2%) | 233 (54.8%) |
| Total (Overall) | 550 (42.9%) | 733 (57.1%) |
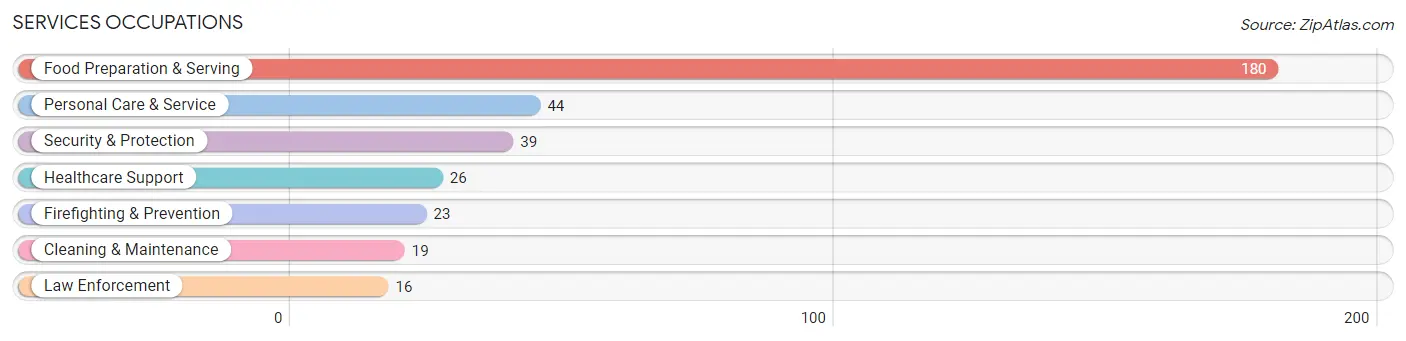
Services Occupations
The most common Services occupations in Livingston are Food Preparation & Serving (180 | 14.0%), Personal Care & Service (44 | 3.4%), Security & Protection (39 | 3.0%), Healthcare Support (26 | 2.0%), and Firefighting & Prevention (23 | 1.8%).
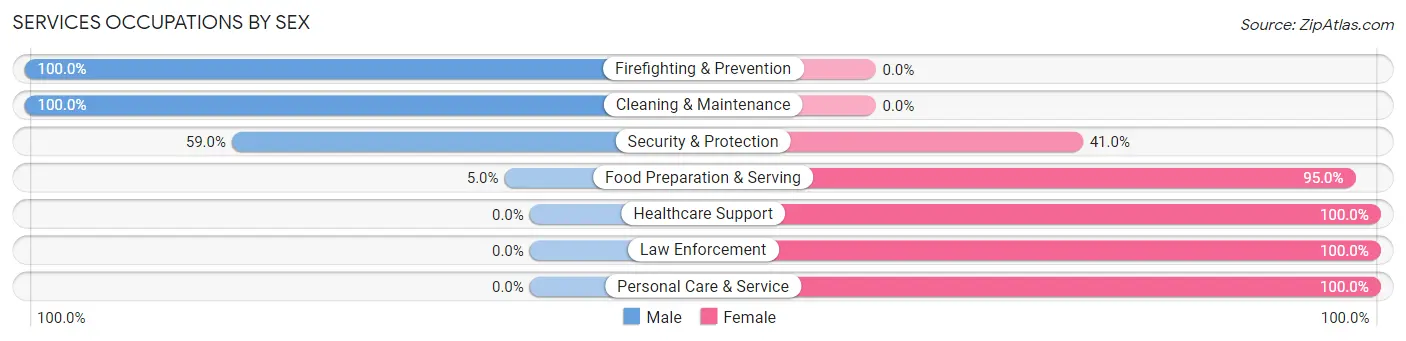
Services Occupations by Sex
Within the Services occupations in Livingston, the most male-oriented occupations are Firefighting & Prevention (100.0%), Cleaning & Maintenance (100.0%), and Security & Protection (59.0%), while the most female-oriented occupations are Healthcare Support (100.0%), Law Enforcement (100.0%), and Personal Care & Service (100.0%).
| Occupation | Male | Female |
| Healthcare Support | 0 (0.0%) | 26 (100.0%) |
| Security & Protection | 23 (59.0%) | 16 (41.0%) |
| Firefighting & Prevention | 23 (100.0%) | 0 (0.0%) |
| Law Enforcement | 0 (0.0%) | 16 (100.0%) |
| Food Preparation & Serving | 9 (5.0%) | 171 (95.0%) |
| Cleaning & Maintenance | 19 (100.0%) | 0 (0.0%) |
| Personal Care & Service | 0 (0.0%) | 44 (100.0%) |
| Total (Category) | 51 (16.6%) | 257 (83.4%) |
| Total (Overall) | 550 (42.9%) | 733 (57.1%) |
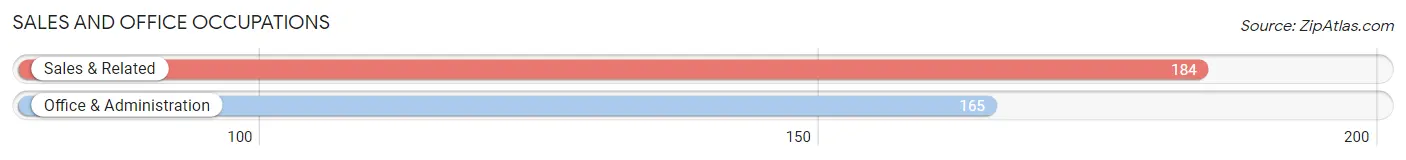
Sales and Office Occupations
The most common Sales and Office occupations in Livingston are Sales & Related (184 | 14.3%), and Office & Administration (165 | 12.9%).
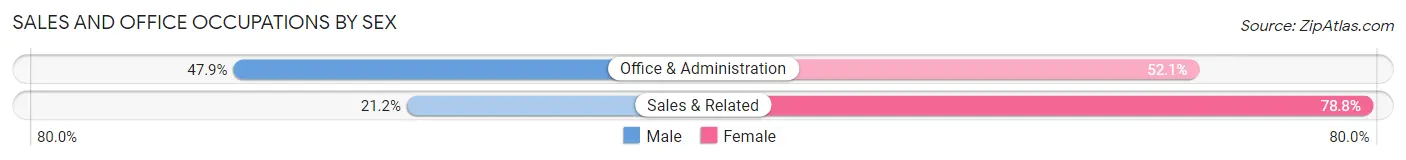
Sales and Office Occupations by Sex
| Occupation | Male | Female |
| Sales & Related | 39 (21.2%) | 145 (78.8%) |
| Office & Administration | 79 (47.9%) | 86 (52.1%) |
| Total (Category) | 118 (33.8%) | 231 (66.2%) |
| Total (Overall) | 550 (42.9%) | 733 (57.1%) |
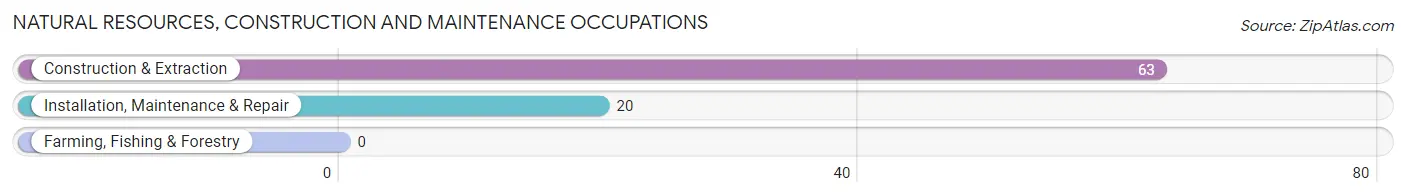
Natural Resources, Construction and Maintenance Occupations
The most common Natural Resources, Construction and Maintenance occupations in Livingston are Construction & Extraction (63 | 4.9%), and Installation, Maintenance & Repair (20 | 1.6%).
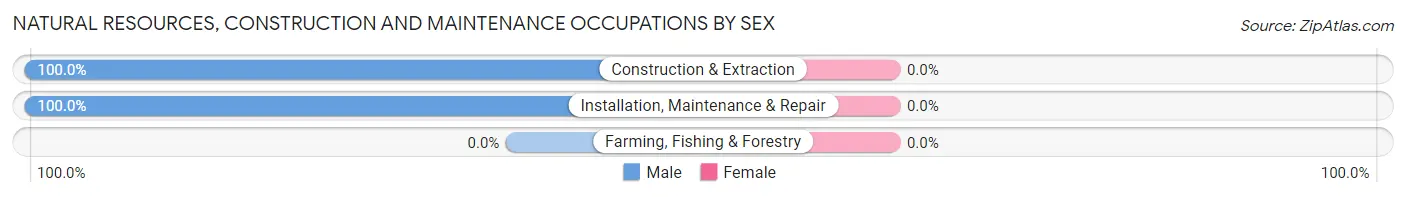
Natural Resources, Construction and Maintenance Occupations by Sex
| Occupation | Male | Female |
| Farming, Fishing & Forestry | 0 (0.0%) | 0 (0.0%) |
| Construction & Extraction | 63 (100.0%) | 0 (0.0%) |
| Installation, Maintenance & Repair | 20 (100.0%) | 0 (0.0%) |
| Total (Category) | 83 (100.0%) | 0 (0.0%) |
| Total (Overall) | 550 (42.9%) | 733 (57.1%) |
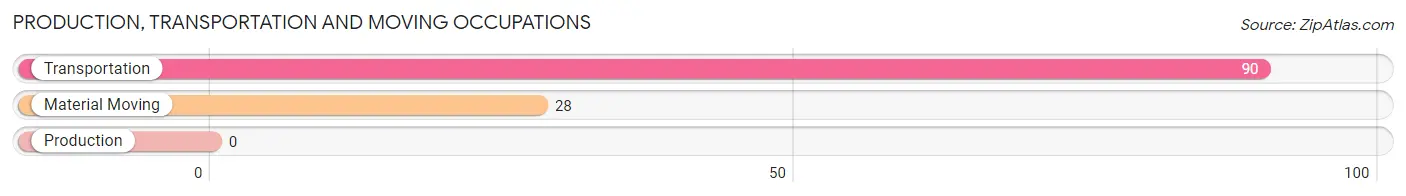
Production, Transportation and Moving Occupations
The most common Production, Transportation and Moving occupations in Livingston are Transportation (90 | 7.0%), and Material Moving (28 | 2.2%).
Production, Transportation and Moving Occupations by Sex
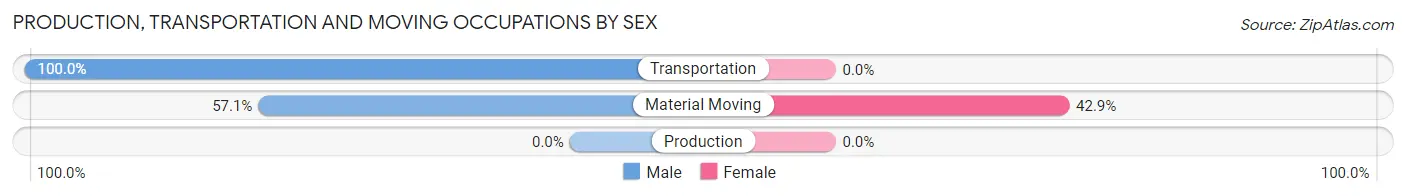
| Occupation | Male | Female |
| Production | 0 (0.0%) | 0 (0.0%) |
| Transportation | 90 (100.0%) | 0 (0.0%) |
| Material Moving | 16 (57.1%) | 12 (42.9%) |
| Total (Category) | 106 (89.8%) | 12 (10.2%) |
| Total (Overall) | 550 (42.9%) | 733 (57.1%) |
Employment Industries by Sex in Livingston
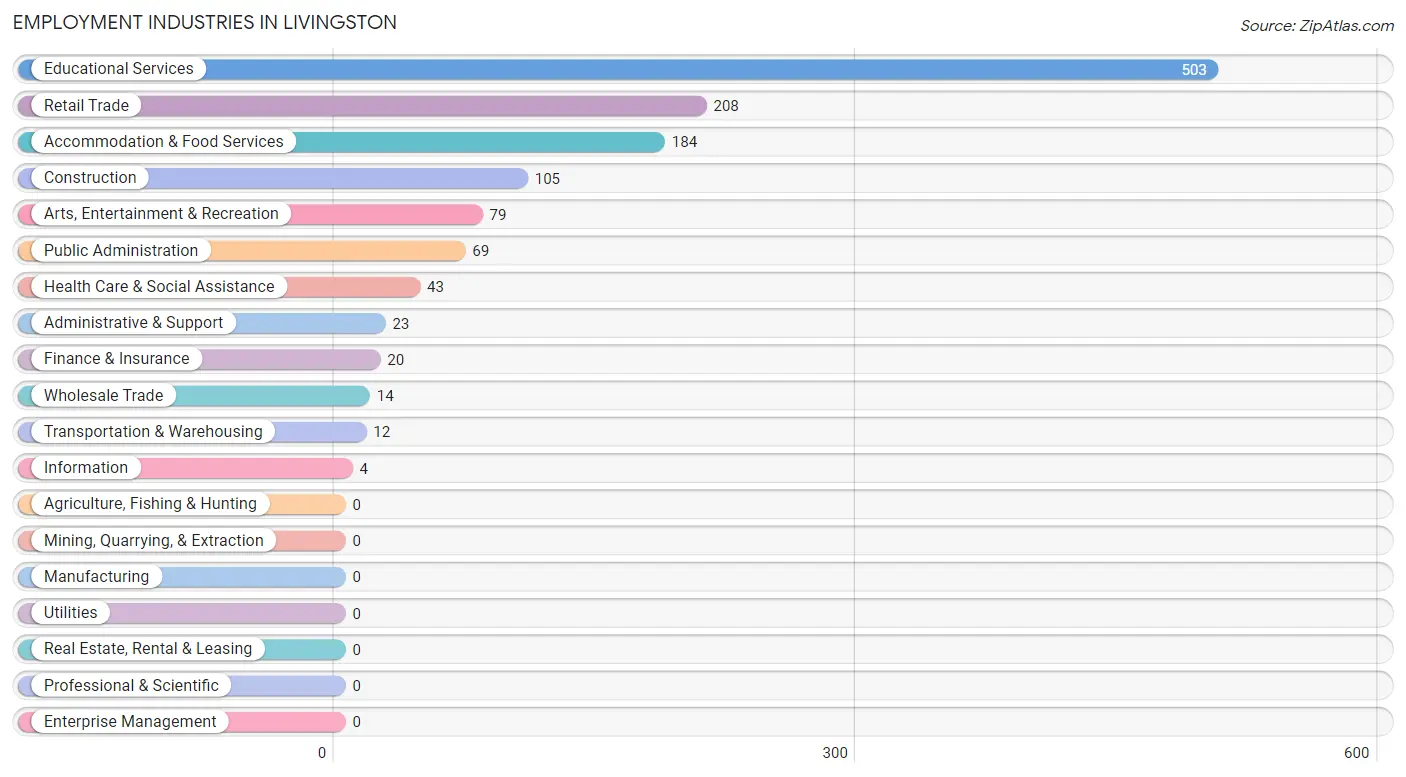
Employment Industries in Livingston
The major employment industries in Livingston include Educational Services (503 | 39.2%), Retail Trade (208 | 16.2%), Accommodation & Food Services (184 | 14.3%), Construction (105 | 8.2%), and Arts, Entertainment & Recreation (79 | 6.2%).
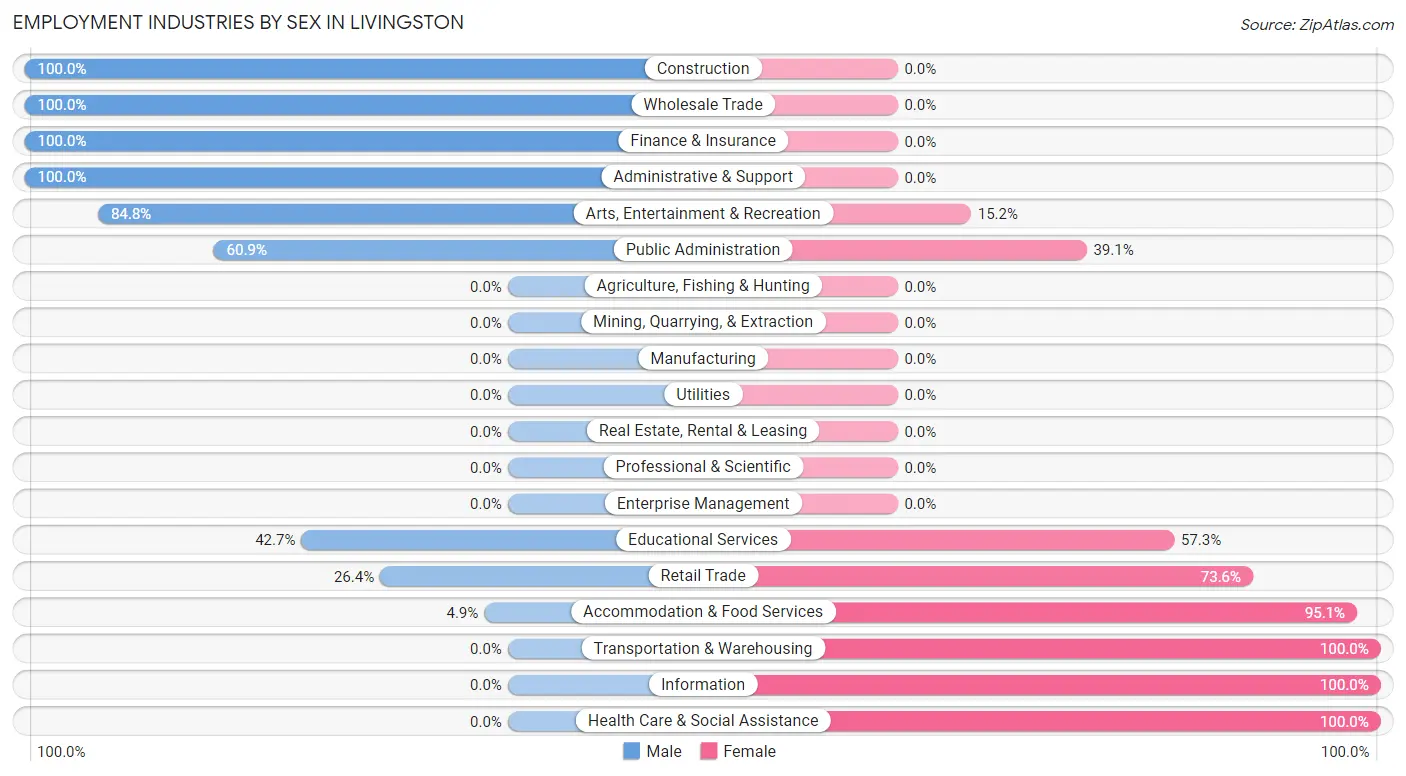
Employment Industries by Sex in Livingston
The Livingston industries that see more men than women are Construction (100.0%), Wholesale Trade (100.0%), and Finance & Insurance (100.0%), whereas the industries that tend to have a higher number of women are Transportation & Warehousing (100.0%), Information (100.0%), and Health Care & Social Assistance (100.0%).
| Industry | Male | Female |
| Agriculture, Fishing & Hunting | 0 (0.0%) | 0 (0.0%) |
| Mining, Quarrying, & Extraction | 0 (0.0%) | 0 (0.0%) |
| Construction | 105 (100.0%) | 0 (0.0%) |
| Manufacturing | 0 (0.0%) | 0 (0.0%) |
| Wholesale Trade | 14 (100.0%) | 0 (0.0%) |
| Retail Trade | 55 (26.4%) | 153 (73.6%) |
| Transportation & Warehousing | 0 (0.0%) | 12 (100.0%) |
| Utilities | 0 (0.0%) | 0 (0.0%) |
| Information | 0 (0.0%) | 4 (100.0%) |
| Finance & Insurance | 20 (100.0%) | 0 (0.0%) |
| Real Estate, Rental & Leasing | 0 (0.0%) | 0 (0.0%) |
| Professional & Scientific | 0 (0.0%) | 0 (0.0%) |
| Enterprise Management | 0 (0.0%) | 0 (0.0%) |
| Administrative & Support | 23 (100.0%) | 0 (0.0%) |
| Educational Services | 215 (42.7%) | 288 (57.3%) |
| Health Care & Social Assistance | 0 (0.0%) | 43 (100.0%) |
| Arts, Entertainment & Recreation | 67 (84.8%) | 12 (15.2%) |
| Accommodation & Food Services | 9 (4.9%) | 175 (95.1%) |
| Public Administration | 42 (60.9%) | 27 (39.1%) |
| Total | 550 (42.9%) | 733 (57.1%) |
Education in Livingston
School Enrollment in Livingston
The most common levels of schooling among the 1,896 students in Livingston are college / undergraduate (1,410 | 74.4%), elementary school (225 | 11.9%), and nursery / preschool (120 | 6.3%).
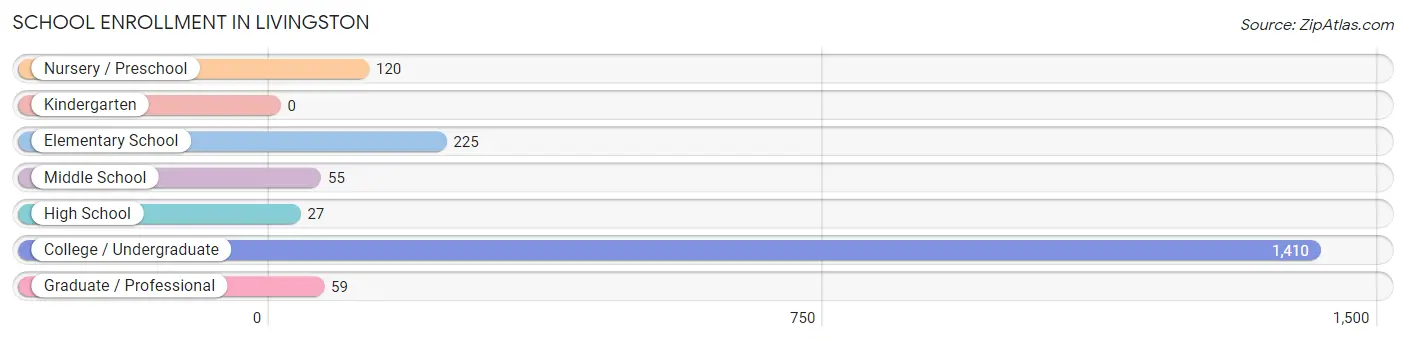
| School Level | # Students | % Students |
| Nursery / Preschool | 120 | 6.3% |
| Kindergarten | 0 | 0.0% |
| Elementary School | 225 | 11.9% |
| Middle School | 55 | 2.9% |
| High School | 27 | 1.4% |
| College / Undergraduate | 1,410 | 74.4% |
| Graduate / Professional | 59 | 3.1% |
| Total | 1,896 | 100.0% |
School Enrollment by Age by Funding Source in Livingston
Out of a total of 1,896 students who are enrolled in schools in Livingston, 78 (4.1%) attend a private institution, while the remaining 1,818 (95.9%) are enrolled in public schools. The age group of 20 to 24 year olds has the highest likelihood of being enrolled in private schools, with 53 (6.1% in the age bracket) enrolled. Conversely, the age group of 3 to 4 year olds has the lowest likelihood of being enrolled in a private school, with 120 (100.0% in the age bracket) attending a public institution.
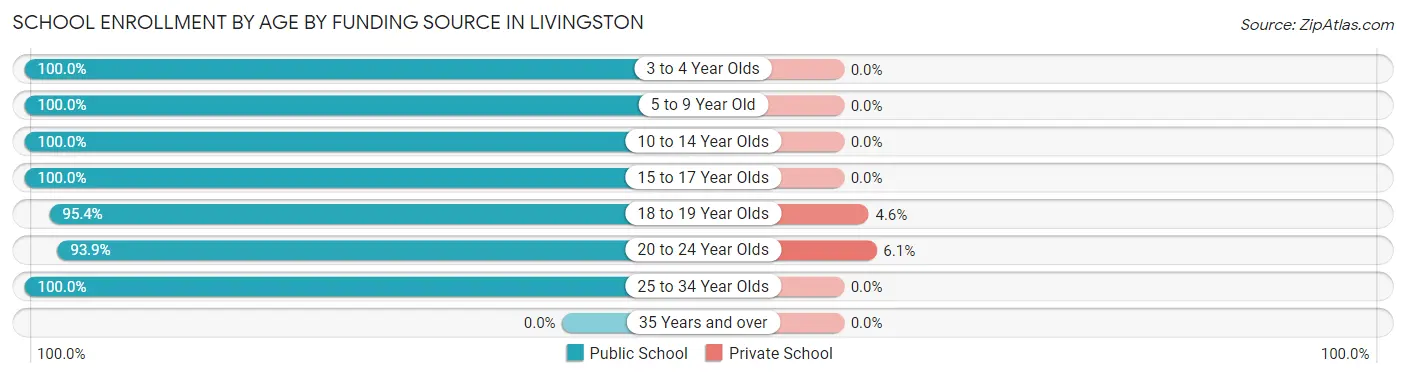
| Age Bracket | Public School | Private School |
| 3 to 4 Year Olds | 120 (100.0%) | 0 (0.0%) |
| 5 to 9 Year Old | 163 (100.0%) | 0 (0.0%) |
| 10 to 14 Year Olds | 117 (100.0%) | 0 (0.0%) |
| 15 to 17 Year Olds | 27 (100.0%) | 0 (0.0%) |
| 18 to 19 Year Olds | 494 (95.4%) | 24 (4.6%) |
| 20 to 24 Year Olds | 816 (93.9%) | 53 (6.1%) |
| 25 to 34 Year Olds | 82 (100.0%) | 0 (0.0%) |
| 35 Years and over | 0 (0.0%) | 0 (0.0%) |
| Total | 1,818 (95.9%) | 78 (4.1%) |
Educational Attainment by Field of Study in Livingston
Science & technology (106 | 20.5%), education (81 | 15.7%), bio, nature & agricultural (71 | 13.8%), communications (67 | 13.0%), and social sciences (63 | 12.2%) are the most common fields of study among 516 individuals in Livingston who have obtained a bachelor's degree or higher.
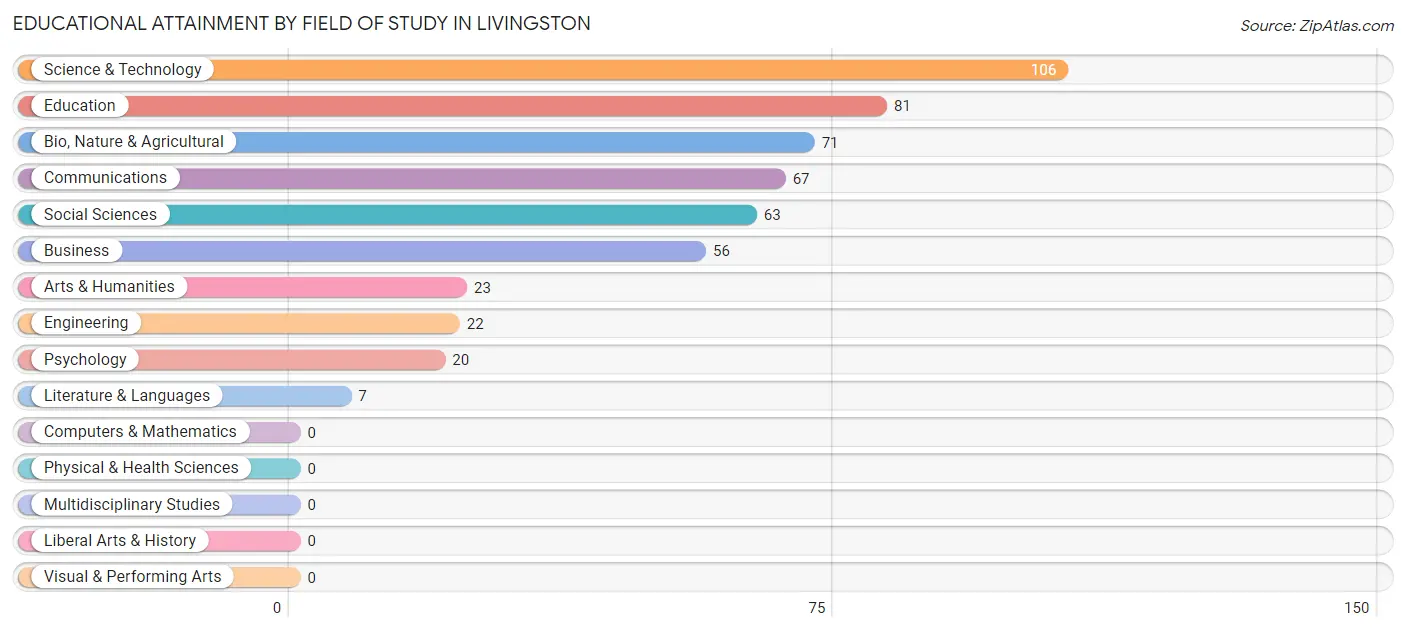
| Field of Study | # Graduates | % Graduates |
| Computers & Mathematics | 0 | 0.0% |
| Bio, Nature & Agricultural | 71 | 13.8% |
| Physical & Health Sciences | 0 | 0.0% |
| Psychology | 20 | 3.9% |
| Social Sciences | 63 | 12.2% |
| Engineering | 22 | 4.3% |
| Multidisciplinary Studies | 0 | 0.0% |
| Science & Technology | 106 | 20.5% |
| Business | 56 | 10.8% |
| Education | 81 | 15.7% |
| Literature & Languages | 7 | 1.4% |
| Liberal Arts & History | 0 | 0.0% |
| Visual & Performing Arts | 0 | 0.0% |
| Communications | 67 | 13.0% |
| Arts & Humanities | 23 | 4.5% |
| Total | 516 | 100.0% |
Transportation & Commute in Livingston
Vehicle Availability by Sex in Livingston
The most prevalent vehicle ownership categories in Livingston are males with 2 vehicles (249, accounting for 54.6%) and females with 2 vehicles (256, making up 46.8%).
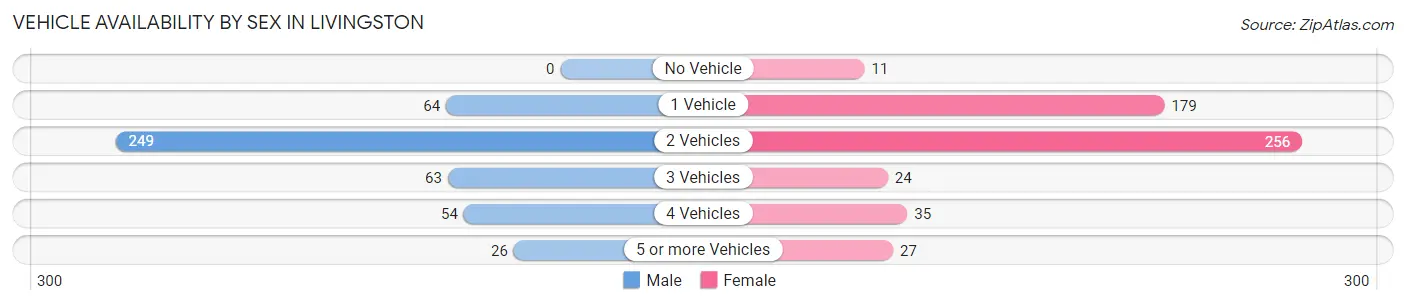
| Vehicles Available | Male | Female |
| No Vehicle | 0 (0.0%) | 11 (2.1%) |
| 1 Vehicle | 64 (14.0%) | 179 (33.7%) |
| 2 Vehicles | 249 (54.6%) | 256 (48.1%) |
| 3 Vehicles | 63 (13.8%) | 24 (4.5%) |
| 4 Vehicles | 54 (11.8%) | 35 (6.6%) |
| 5 or more Vehicles | 26 (5.7%) | 27 (5.1%) |
| Total | 456 (100.0%) | 532 (100.0%) |
Commute Time in Livingston
The most frequently occuring commute durations in Livingston are 5 to 9 minutes (582 commuters, 49.4%), less than 5 minutes (181 commuters, 15.4%), and 60 to 89 minutes (101 commuters, 8.6%).
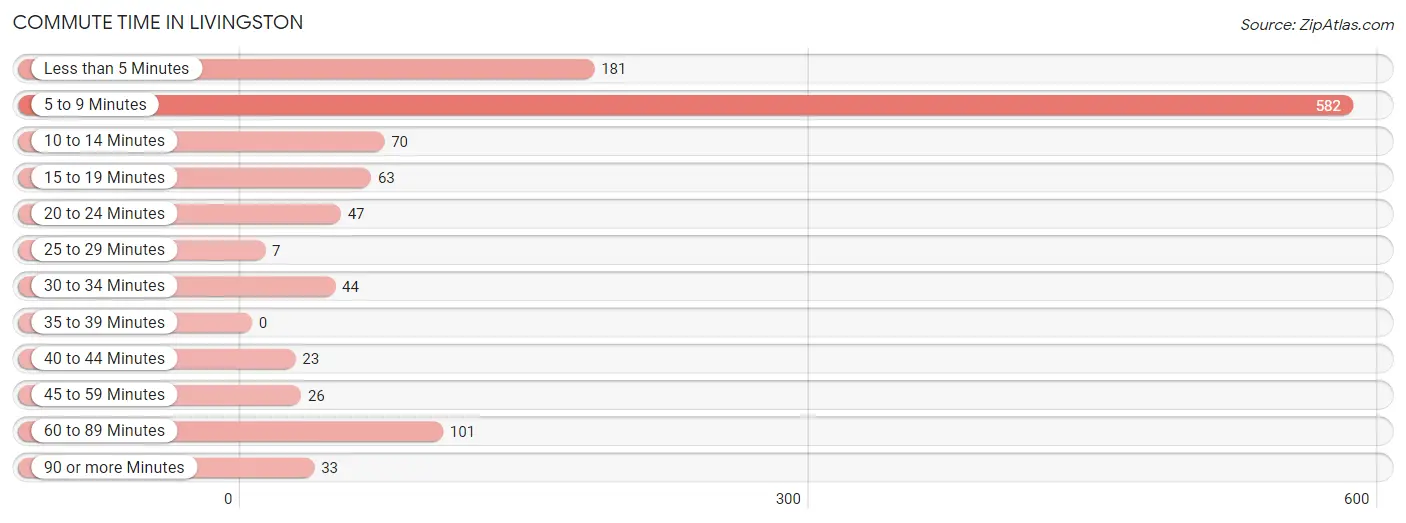
| Commute Time | # Commuters | % Commuters |
| Less than 5 Minutes | 181 | 15.4% |
| 5 to 9 Minutes | 582 | 49.4% |
| 10 to 14 Minutes | 70 | 5.9% |
| 15 to 19 Minutes | 63 | 5.3% |
| 20 to 24 Minutes | 47 | 4.0% |
| 25 to 29 Minutes | 7 | 0.6% |
| 30 to 34 Minutes | 44 | 3.7% |
| 35 to 39 Minutes | 0 | 0.0% |
| 40 to 44 Minutes | 23 | 1.9% |
| 45 to 59 Minutes | 26 | 2.2% |
| 60 to 89 Minutes | 101 | 8.6% |
| 90 or more Minutes | 33 | 2.8% |
Commute Time by Sex in Livingston
The most common commute times in Livingston are 5 to 9 minutes (218 commuters, 40.8%) for males and 5 to 9 minutes (364 commuters, 56.6%) for females.
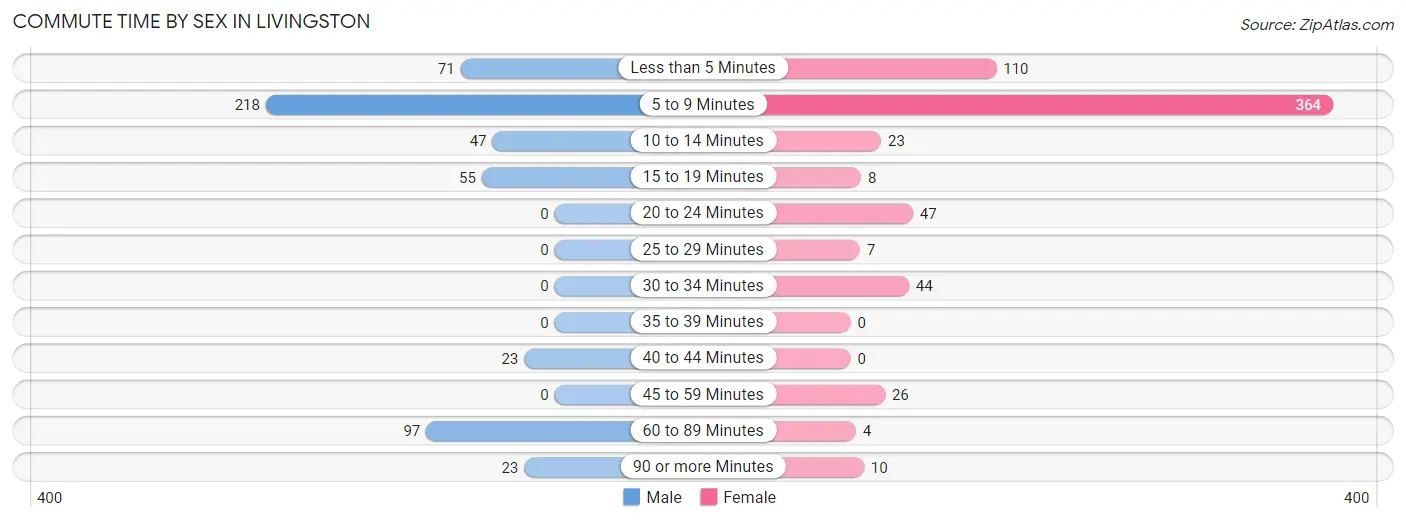
| Commute Time | Male | Female |
| Less than 5 Minutes | 71 (13.3%) | 110 (17.1%) |
| 5 to 9 Minutes | 218 (40.8%) | 364 (56.6%) |
| 10 to 14 Minutes | 47 (8.8%) | 23 (3.6%) |
| 15 to 19 Minutes | 55 (10.3%) | 8 (1.2%) |
| 20 to 24 Minutes | 0 (0.0%) | 47 (7.3%) |
| 25 to 29 Minutes | 0 (0.0%) | 7 (1.1%) |
| 30 to 34 Minutes | 0 (0.0%) | 44 (6.8%) |
| 35 to 39 Minutes | 0 (0.0%) | 0 (0.0%) |
| 40 to 44 Minutes | 23 (4.3%) | 0 (0.0%) |
| 45 to 59 Minutes | 0 (0.0%) | 26 (4.0%) |
| 60 to 89 Minutes | 97 (18.2%) | 4 (0.6%) |
| 90 or more Minutes | 23 (4.3%) | 10 (1.6%) |
Time of Departure to Work by Sex in Livingston
The most frequent times of departure to work in Livingston are 7:30 AM to 7:59 AM (146, 27.3%) for males and 7:30 AM to 7:59 AM (156, 24.3%) for females.
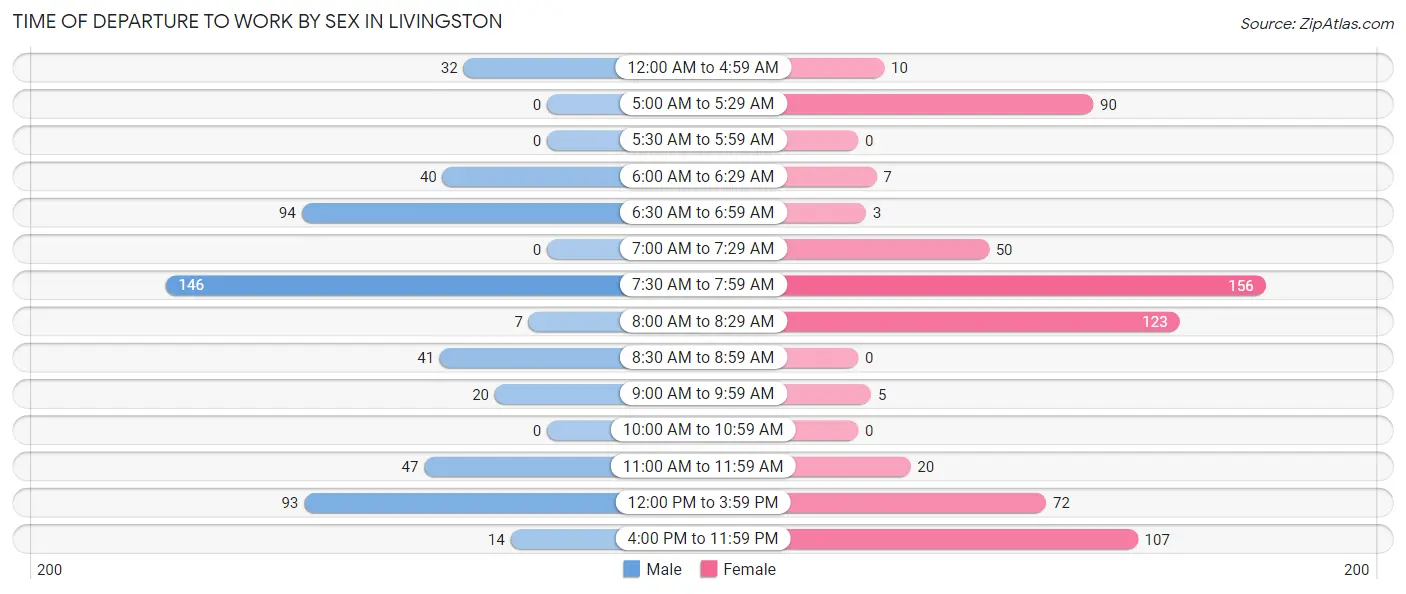
| Time of Departure | Male | Female |
| 12:00 AM to 4:59 AM | 32 (6.0%) | 10 (1.6%) |
| 5:00 AM to 5:29 AM | 0 (0.0%) | 90 (14.0%) |
| 5:30 AM to 5:59 AM | 0 (0.0%) | 0 (0.0%) |
| 6:00 AM to 6:29 AM | 40 (7.5%) | 7 (1.1%) |
| 6:30 AM to 6:59 AM | 94 (17.6%) | 3 (0.5%) |
| 7:00 AM to 7:29 AM | 0 (0.0%) | 50 (7.8%) |
| 7:30 AM to 7:59 AM | 146 (27.3%) | 156 (24.3%) |
| 8:00 AM to 8:29 AM | 7 (1.3%) | 123 (19.1%) |
| 8:30 AM to 8:59 AM | 41 (7.7%) | 0 (0.0%) |
| 9:00 AM to 9:59 AM | 20 (3.7%) | 5 (0.8%) |
| 10:00 AM to 10:59 AM | 0 (0.0%) | 0 (0.0%) |
| 11:00 AM to 11:59 AM | 47 (8.8%) | 20 (3.1%) |
| 12:00 PM to 3:59 PM | 93 (17.4%) | 72 (11.2%) |
| 4:00 PM to 11:59 PM | 14 (2.6%) | 107 (16.6%) |
| Total | 534 (100.0%) | 643 (100.0%) |
Housing Occupancy in Livingston
Occupancy by Ownership in Livingston
Of the total 778 dwellings in Livingston, owner-occupied units account for 252 (32.4%), while renter-occupied units make up 526 (67.6%).
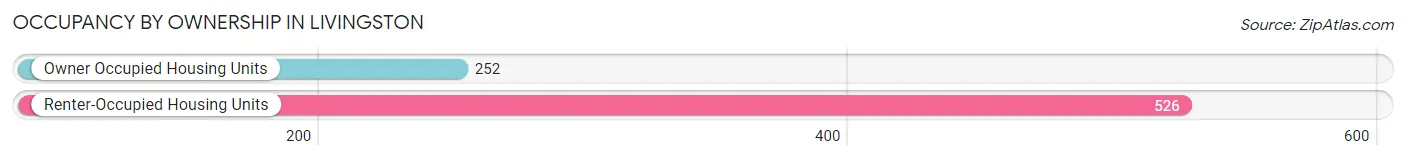
| Occupancy | # Housing Units | % Housing Units |
| Owner Occupied Housing Units | 252 | 32.4% |
| Renter-Occupied Housing Units | 526 | 67.6% |
| Total Occupied Housing Units | 778 | 100.0% |
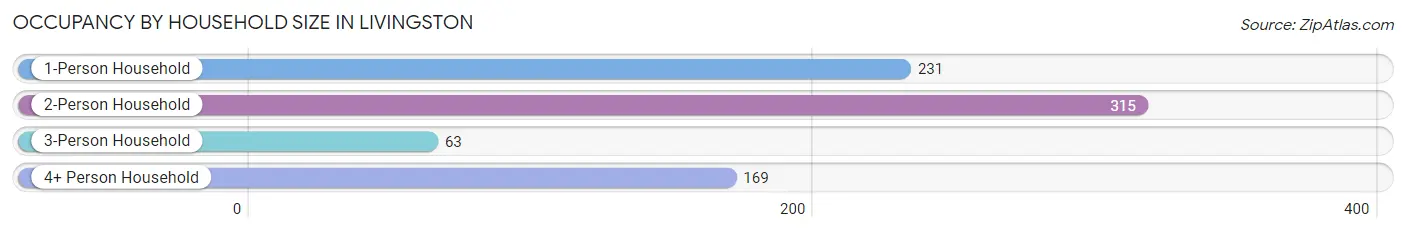
Occupancy by Household Size in Livingston
| Household Size | # Housing Units | % Housing Units |
| 1-Person Household | 231 | 29.7% |
| 2-Person Household | 315 | 40.5% |
| 3-Person Household | 63 | 8.1% |
| 4+ Person Household | 169 | 21.7% |
| Total Housing Units | 778 | 100.0% |
Occupancy by Ownership by Household Size in Livingston
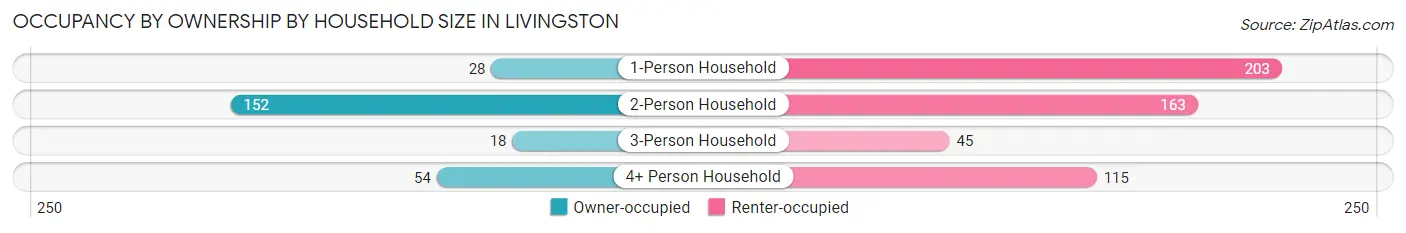
| Household Size | Owner-occupied | Renter-occupied |
| 1-Person Household | 28 (12.1%) | 203 (87.9%) |
| 2-Person Household | 152 (48.2%) | 163 (51.7%) |
| 3-Person Household | 18 (28.6%) | 45 (71.4%) |
| 4+ Person Household | 54 (32.0%) | 115 (68.0%) |
| Total Housing Units | 252 (32.4%) | 526 (67.6%) |
Occupancy by Educational Attainment in Livingston
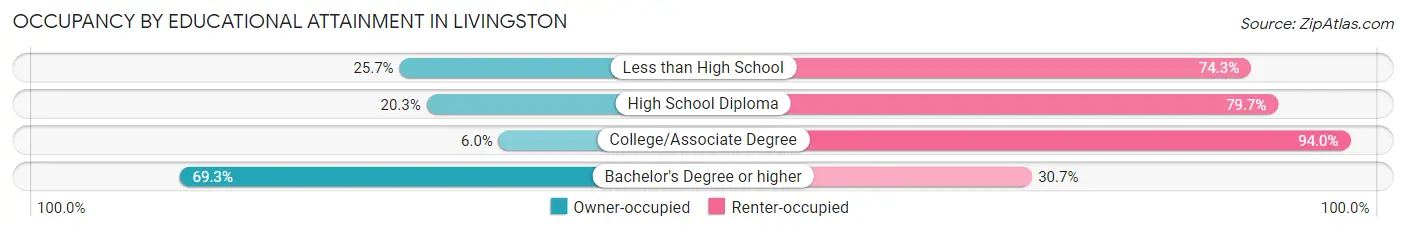
| Household Size | Owner-occupied | Renter-occupied |
| Less than High School | 19 (25.7%) | 55 (74.3%) |
| High School Diploma | 40 (20.3%) | 157 (79.7%) |
| College/Associate Degree | 15 (6.0%) | 235 (94.0%) |
| Bachelor's Degree or higher | 178 (69.3%) | 79 (30.7%) |
Occupancy by Age of Householder in Livingston
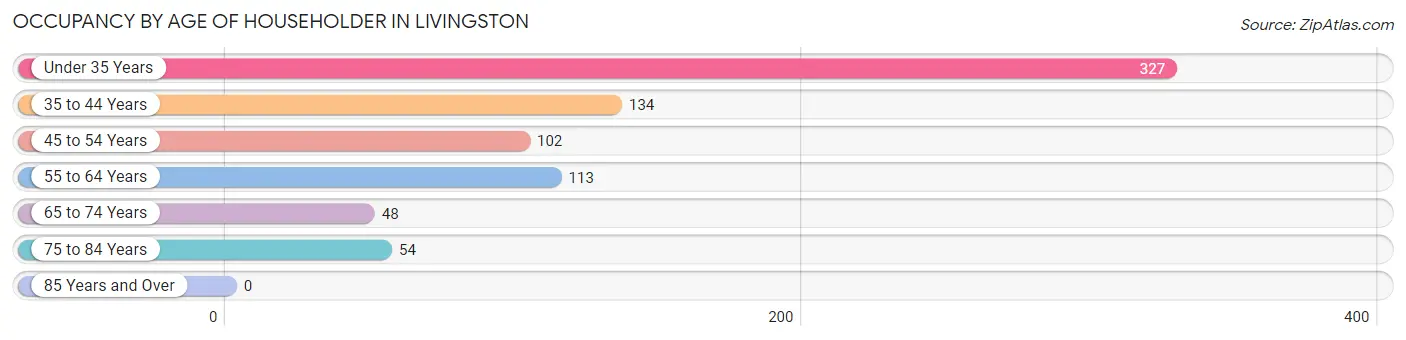
| Age Bracket | # Households | % Households |
| Under 35 Years | 327 | 42.0% |
| 35 to 44 Years | 134 | 17.2% |
| 45 to 54 Years | 102 | 13.1% |
| 55 to 64 Years | 113 | 14.5% |
| 65 to 74 Years | 48 | 6.2% |
| 75 to 84 Years | 54 | 6.9% |
| 85 Years and Over | 0 | 0.0% |
| Total | 778 | 100.0% |
Housing Finances in Livingston
Median Income by Occupancy in Livingston
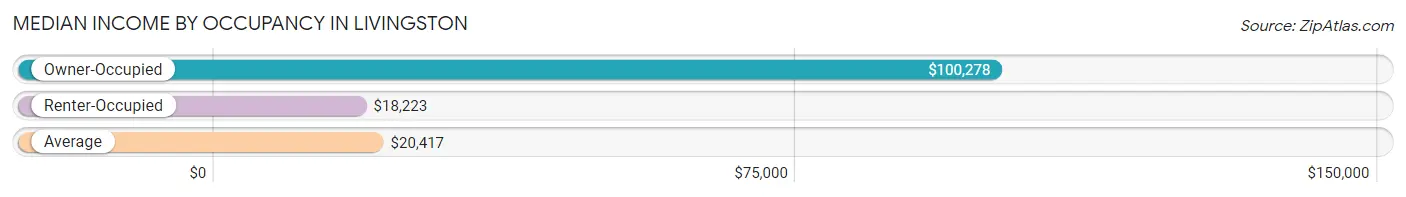
| Occupancy Type | # Households | Median Income |
| Owner-Occupied | 252 (32.4%) | $100,278 |
| Renter-Occupied | 526 (67.6%) | $18,223 |
| Average | 778 (100.0%) | $20,417 |
Occupancy by Householder Income Bracket in Livingston
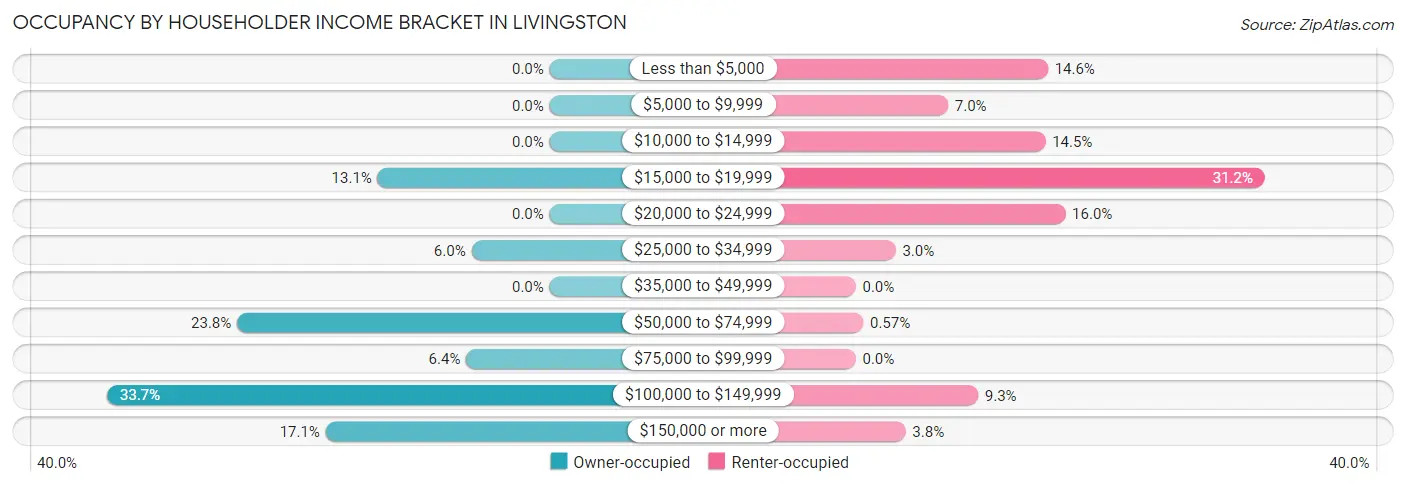
| Income Bracket | Owner-occupied | Renter-occupied |
| Less than $5,000 | 0 (0.0%) | 77 (14.6%) |
| $5,000 to $9,999 | 0 (0.0%) | 37 (7.0%) |
| $10,000 to $14,999 | 0 (0.0%) | 76 (14.4%) |
| $15,000 to $19,999 | 33 (13.1%) | 164 (31.2%) |
| $20,000 to $24,999 | 0 (0.0%) | 84 (16.0%) |
| $25,000 to $34,999 | 15 (5.9%) | 16 (3.0%) |
| $35,000 to $49,999 | 0 (0.0%) | 0 (0.0%) |
| $50,000 to $74,999 | 60 (23.8%) | 3 (0.6%) |
| $75,000 to $99,999 | 16 (6.4%) | 0 (0.0%) |
| $100,000 to $149,999 | 85 (33.7%) | 49 (9.3%) |
| $150,000 or more | 43 (17.1%) | 20 (3.8%) |
| Total | 252 (100.0%) | 526 (100.0%) |
Monthly Housing Cost Tiers in Livingston
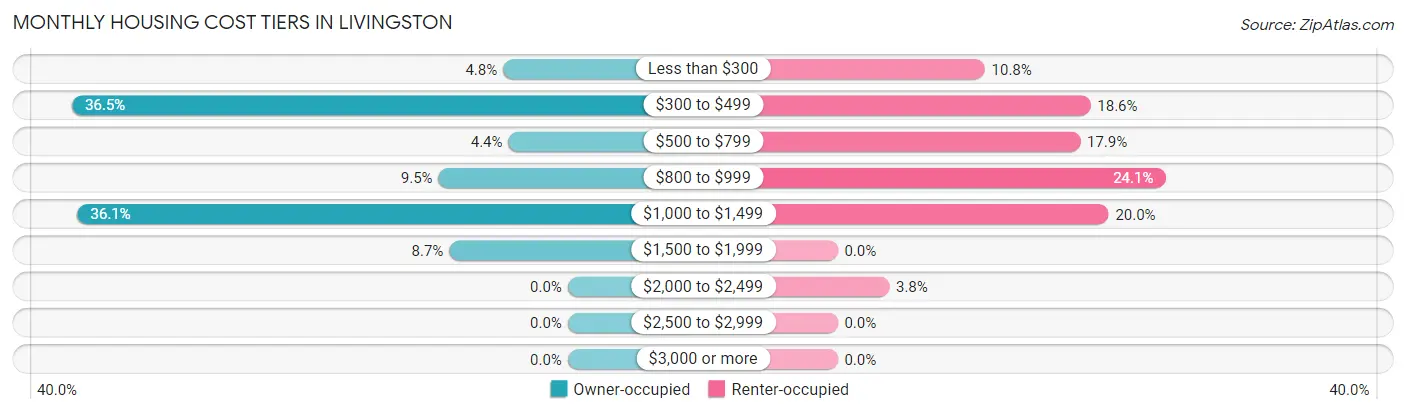
| Monthly Cost | Owner-occupied | Renter-occupied |
| Less than $300 | 12 (4.8%) | 57 (10.8%) |
| $300 to $499 | 92 (36.5%) | 98 (18.6%) |
| $500 to $799 | 11 (4.4%) | 94 (17.9%) |
| $800 to $999 | 24 (9.5%) | 127 (24.1%) |
| $1,000 to $1,499 | 91 (36.1%) | 105 (20.0%) |
| $1,500 to $1,999 | 22 (8.7%) | 0 (0.0%) |
| $2,000 to $2,499 | 0 (0.0%) | 20 (3.8%) |
| $2,500 to $2,999 | 0 (0.0%) | 0 (0.0%) |
| $3,000 or more | 0 (0.0%) | 0 (0.0%) |
| Total | 252 (100.0%) | 526 (100.0%) |
Physical Housing Characteristics in Livingston
Housing Structures in Livingston
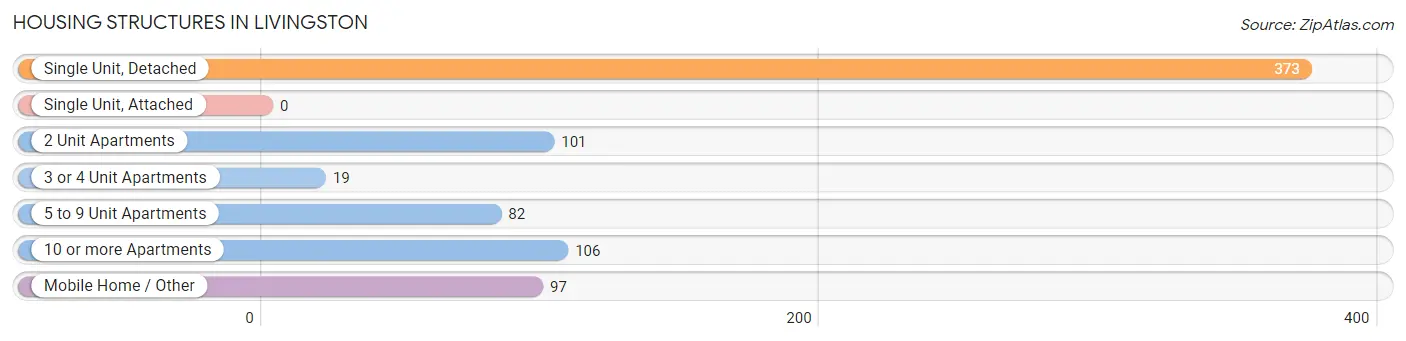
| Structure Type | # Housing Units | % Housing Units |
| Single Unit, Detached | 373 | 47.9% |
| Single Unit, Attached | 0 | 0.0% |
| 2 Unit Apartments | 101 | 13.0% |
| 3 or 4 Unit Apartments | 19 | 2.4% |
| 5 to 9 Unit Apartments | 82 | 10.5% |
| 10 or more Apartments | 106 | 13.6% |
| Mobile Home / Other | 97 | 12.5% |
| Total | 778 | 100.0% |
Housing Structures by Occupancy in Livingston
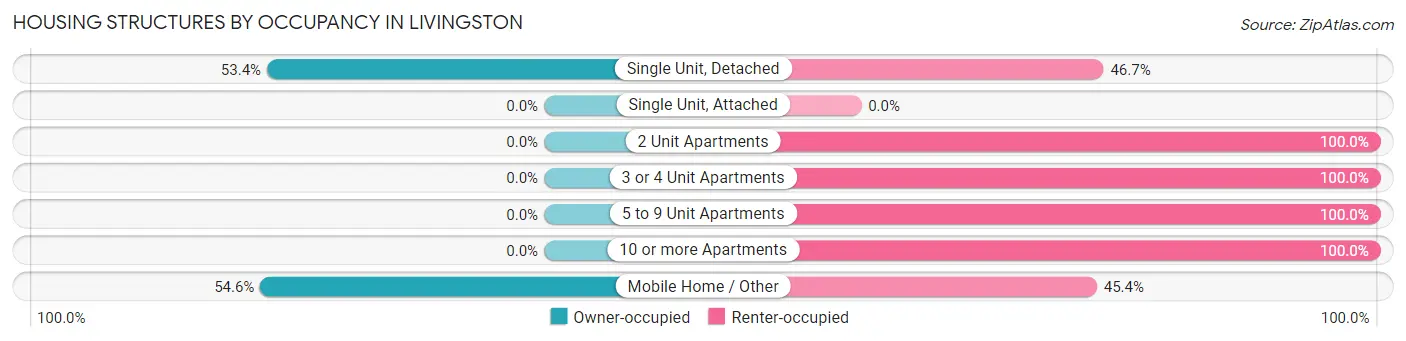
| Structure Type | Owner-occupied | Renter-occupied |
| Single Unit, Detached | 199 (53.3%) | 174 (46.7%) |
| Single Unit, Attached | 0 (0.0%) | 0 (0.0%) |
| 2 Unit Apartments | 0 (0.0%) | 101 (100.0%) |
| 3 or 4 Unit Apartments | 0 (0.0%) | 19 (100.0%) |
| 5 to 9 Unit Apartments | 0 (0.0%) | 82 (100.0%) |
| 10 or more Apartments | 0 (0.0%) | 106 (100.0%) |
| Mobile Home / Other | 53 (54.6%) | 44 (45.4%) |
| Total | 252 (32.4%) | 526 (67.6%) |
Housing Structures by Number of Rooms in Livingston
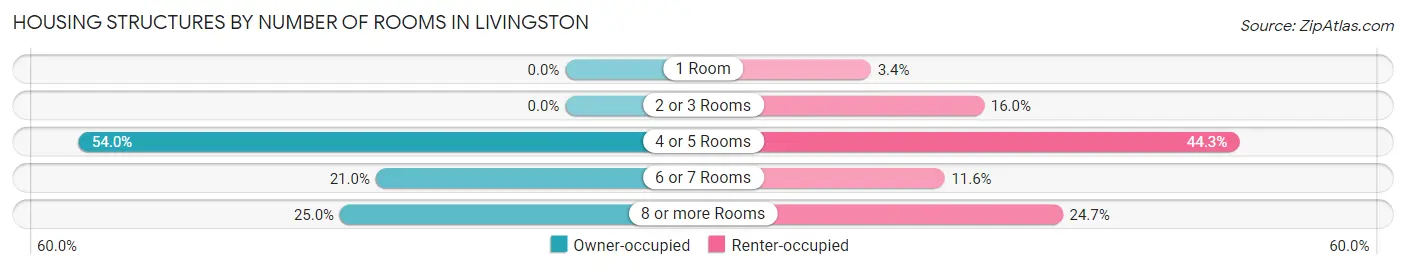
| Number of Rooms | Owner-occupied | Renter-occupied |
| 1 Room | 0 (0.0%) | 18 (3.4%) |
| 2 or 3 Rooms | 0 (0.0%) | 84 (16.0%) |
| 4 or 5 Rooms | 136 (54.0%) | 233 (44.3%) |
| 6 or 7 Rooms | 53 (21.0%) | 61 (11.6%) |
| 8 or more Rooms | 63 (25.0%) | 130 (24.7%) |
| Total | 252 (100.0%) | 526 (100.0%) |
Housing Structure by Heating Type in Livingston
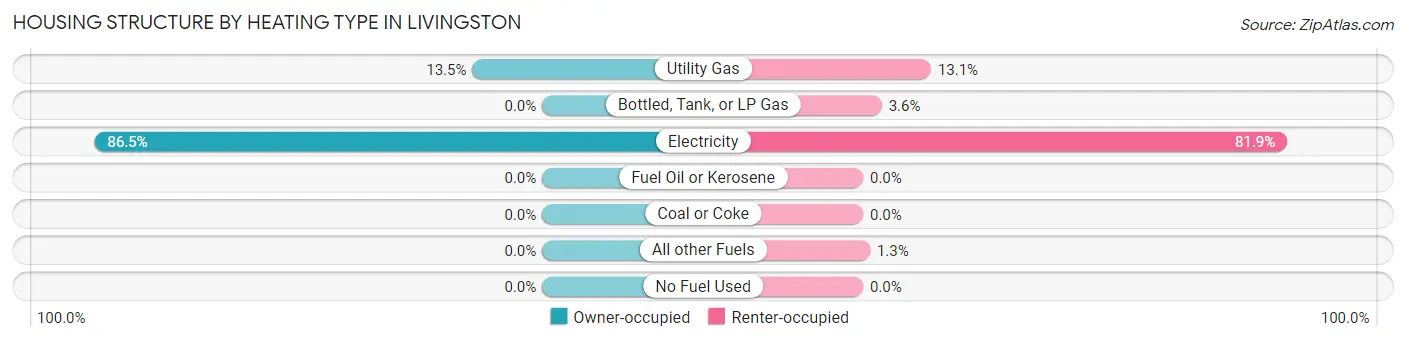
| Heating Type | Owner-occupied | Renter-occupied |
| Utility Gas | 34 (13.5%) | 69 (13.1%) |
| Bottled, Tank, or LP Gas | 0 (0.0%) | 19 (3.6%) |
| Electricity | 218 (86.5%) | 431 (81.9%) |
| Fuel Oil or Kerosene | 0 (0.0%) | 0 (0.0%) |
| Coal or Coke | 0 (0.0%) | 0 (0.0%) |
| All other Fuels | 0 (0.0%) | 7 (1.3%) |
| No Fuel Used | 0 (0.0%) | 0 (0.0%) |
| Total | 252 (100.0%) | 526 (100.0%) |
Household Vehicle Usage in Livingston
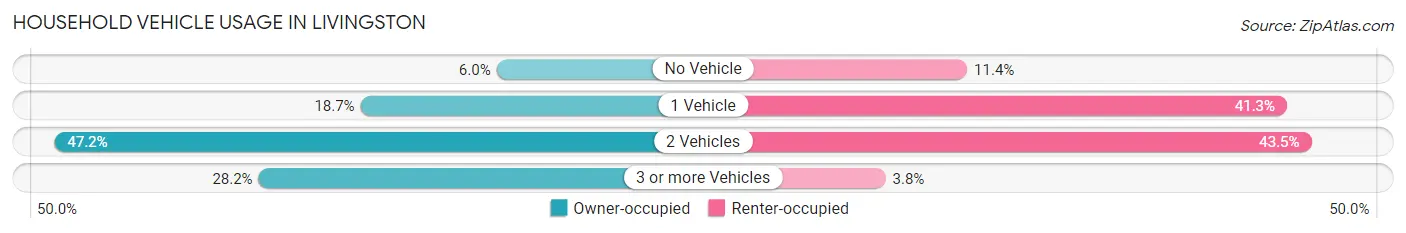
| Vehicles per Household | Owner-occupied | Renter-occupied |
| No Vehicle | 15 (5.9%) | 60 (11.4%) |
| 1 Vehicle | 47 (18.6%) | 217 (41.2%) |
| 2 Vehicles | 119 (47.2%) | 229 (43.5%) |
| 3 or more Vehicles | 71 (28.2%) | 20 (3.8%) |
| Total | 252 (100.0%) | 526 (100.0%) |
Real Estate & Mortgages in Livingston
Real Estate and Mortgage Overview in Livingston
| Characteristic | Without Mortgage | With Mortgage |
| Housing Units | 104 | 148 |
| Median Property Value | $63,500 | $214,900 |
| Median Household Income | - | - |
| Monthly Housing Costs | $429 | $0 |
| Real Estate Taxes | - | - |
Property Value by Mortgage Status in Livingston
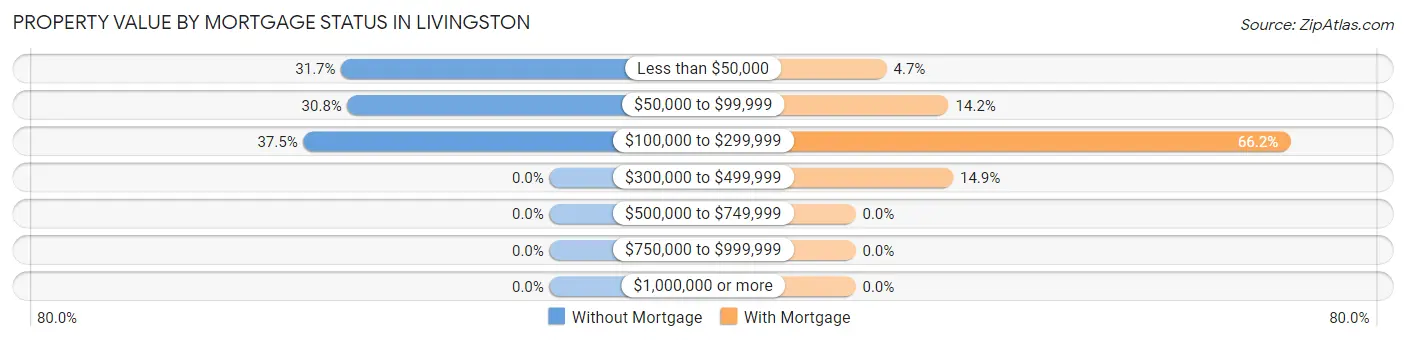
| Property Value | Without Mortgage | With Mortgage |
| Less than $50,000 | 33 (31.7%) | 7 (4.7%) |
| $50,000 to $99,999 | 32 (30.8%) | 21 (14.2%) |
| $100,000 to $299,999 | 39 (37.5%) | 98 (66.2%) |
| $300,000 to $499,999 | 0 (0.0%) | 22 (14.9%) |
| $500,000 to $749,999 | 0 (0.0%) | 0 (0.0%) |
| $750,000 to $999,999 | 0 (0.0%) | 0 (0.0%) |
| $1,000,000 or more | 0 (0.0%) | 0 (0.0%) |
| Total | 104 (100.0%) | 148 (100.0%) |
Household Income by Mortgage Status in Livingston
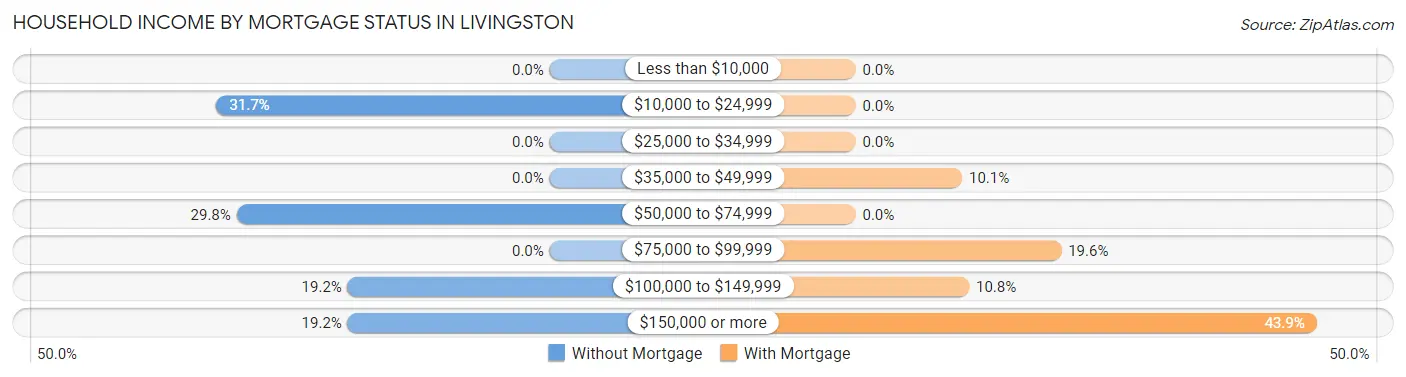
| Household Income | Without Mortgage | With Mortgage |
| Less than $10,000 | 0 (0.0%) | 0 (0.0%) |
| $10,000 to $24,999 | 33 (31.7%) | 0 (0.0%) |
| $25,000 to $34,999 | 0 (0.0%) | 0 (0.0%) |
| $35,000 to $49,999 | 0 (0.0%) | 15 (10.1%) |
| $50,000 to $74,999 | 31 (29.8%) | 0 (0.0%) |
| $75,000 to $99,999 | 0 (0.0%) | 29 (19.6%) |
| $100,000 to $149,999 | 20 (19.2%) | 16 (10.8%) |
| $150,000 or more | 20 (19.2%) | 65 (43.9%) |
| Total | 104 (100.0%) | 148 (100.0%) |
Property Value to Household Income Ratio in Livingston
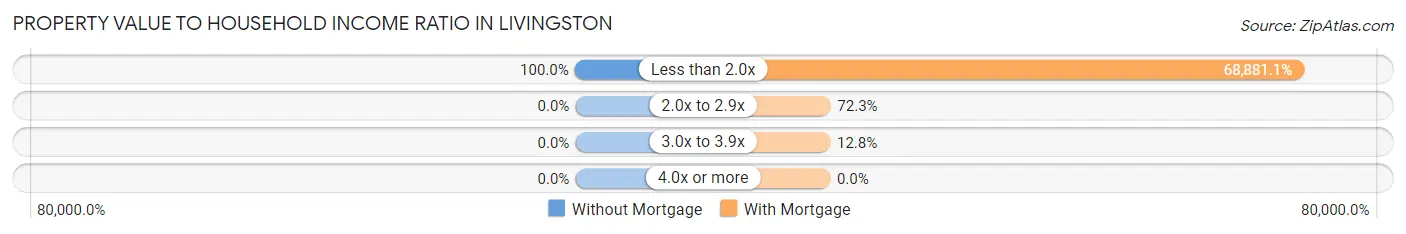
| Value-to-Income Ratio | Without Mortgage | With Mortgage |
| Less than 2.0x | 104 (100.0%) | 101,944 (68,881.1%) |
| 2.0x to 2.9x | 0 (0.0%) | 107 (72.3%) |
| 3.0x to 3.9x | 0 (0.0%) | 19 (12.8%) |
| 4.0x or more | 0 (0.0%) | 0 (0.0%) |
| Total | 104 (100.0%) | 148 (100.0%) |
Real Estate Taxes by Mortgage Status in Livingston
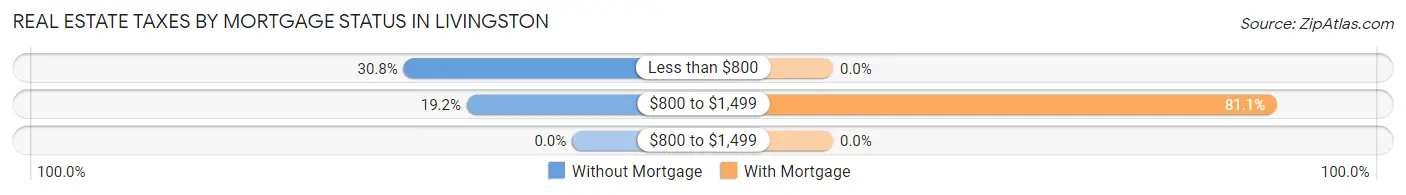
| Property Taxes | Without Mortgage | With Mortgage |
| Less than $800 | 32 (30.8%) | 0 (0.0%) |
| $800 to $1,499 | 20 (19.2%) | 120 (81.1%) |
| $800 to $1,499 | 0 (0.0%) | 0 (0.0%) |
| Total | 104 (100.0%) | 148 (100.0%) |
Health & Disability in Livingston
Health Insurance Coverage by Age in Livingston
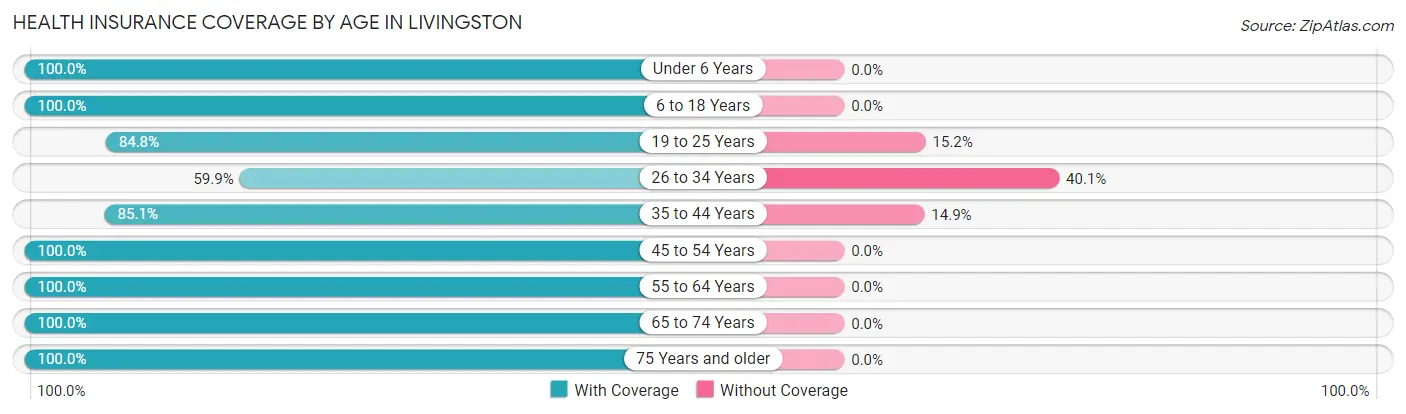
| Age Bracket | With Coverage | Without Coverage |
| Under 6 Years | 198 (100.0%) | 0 (0.0%) |
| 6 to 18 Years | 773 (100.0%) | 0 (0.0%) |
| 19 to 25 Years | 1,181 (84.8%) | 211 (15.2%) |
| 26 to 34 Years | 160 (59.9%) | 107 (40.1%) |
| 35 to 44 Years | 205 (85.1%) | 36 (14.9%) |
| 45 to 54 Years | 133 (100.0%) | 0 (0.0%) |
| 55 to 64 Years | 144 (100.0%) | 0 (0.0%) |
| 65 to 74 Years | 79 (100.0%) | 0 (0.0%) |
| 75 Years and older | 70 (100.0%) | 0 (0.0%) |
| Total | 2,943 (89.3%) | 354 (10.7%) |
Health Insurance Coverage by Citizenship Status in Livingston
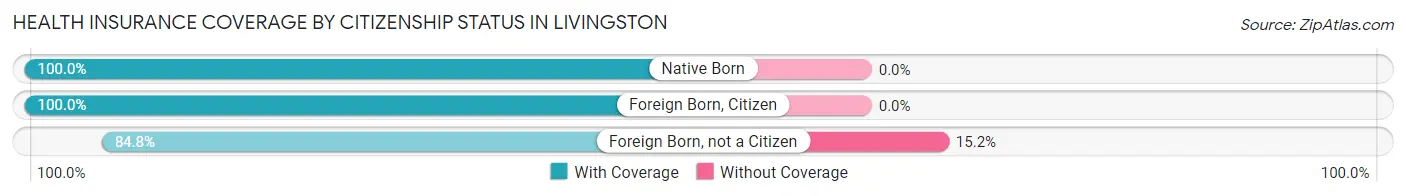
| Citizenship Status | With Coverage | Without Coverage |
| Native Born | 198 (100.0%) | 0 (0.0%) |
| Foreign Born, Citizen | 773 (100.0%) | 0 (0.0%) |
| Foreign Born, not a Citizen | 1,181 (84.8%) | 211 (15.2%) |
Health Insurance Coverage by Household Income in Livingston
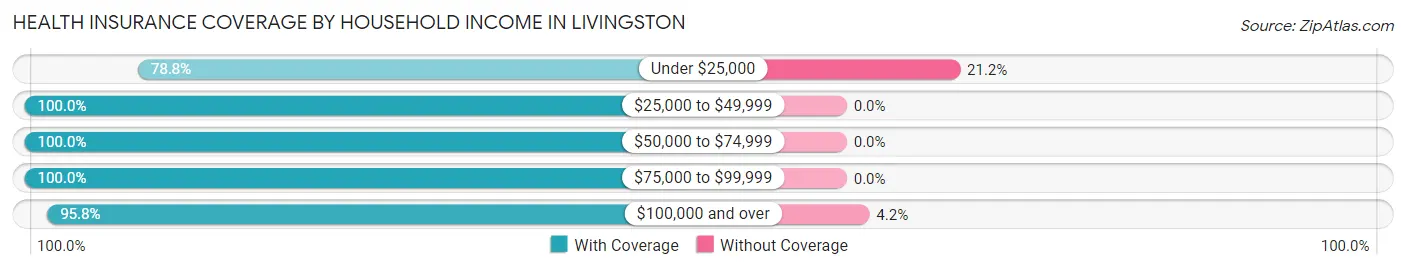
| Household Income | With Coverage | Without Coverage |
| Under $25,000 | 861 (78.8%) | 232 (21.2%) |
| $25,000 to $49,999 | 72 (100.0%) | 0 (0.0%) |
| $50,000 to $74,999 | 104 (100.0%) | 0 (0.0%) |
| $75,000 to $99,999 | 23 (100.0%) | 0 (0.0%) |
| $100,000 and over | 767 (95.8%) | 34 (4.2%) |
Public vs Private Health Insurance Coverage by Age in Livingston
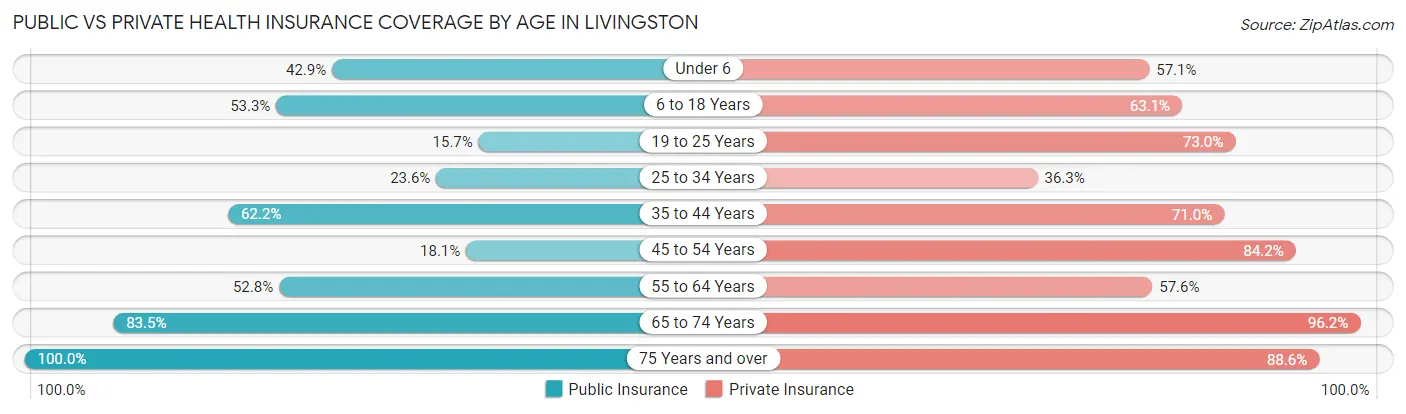
| Age Bracket | Public Insurance | Private Insurance |
| Under 6 | 85 (42.9%) | 113 (57.1%) |
| 6 to 18 Years | 412 (53.3%) | 488 (63.1%) |
| 19 to 25 Years | 219 (15.7%) | 1,016 (73.0%) |
| 25 to 34 Years | 63 (23.6%) | 97 (36.3%) |
| 35 to 44 Years | 150 (62.2%) | 171 (71.0%) |
| 45 to 54 Years | 24 (18.0%) | 112 (84.2%) |
| 55 to 64 Years | 76 (52.8%) | 83 (57.6%) |
| 65 to 74 Years | 66 (83.5%) | 76 (96.2%) |
| 75 Years and over | 70 (100.0%) | 62 (88.6%) |
| Total | 1,165 (35.3%) | 2,218 (67.3%) |
Disability Status by Sex by Age in Livingston
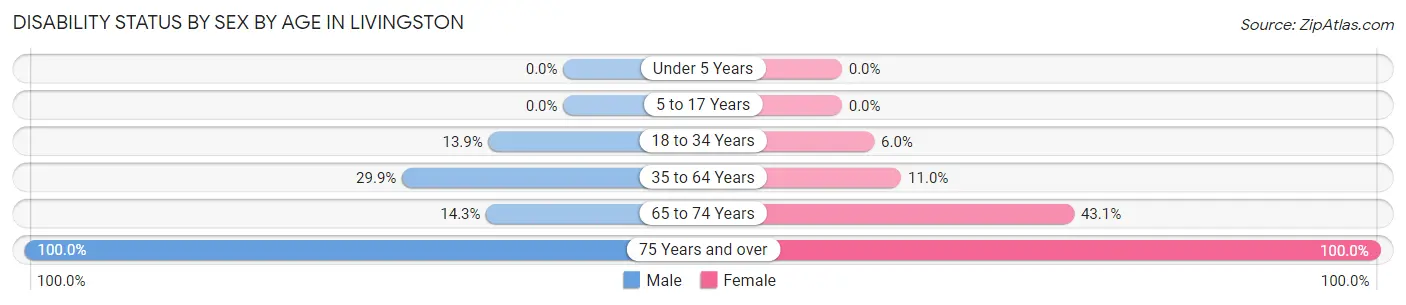
| Age Bracket | Male | Female |
| Under 5 Years | 0 (0.0%) | 0 (0.0%) |
| 5 to 17 Years | 0 (0.0%) | 0 (0.0%) |
| 18 to 34 Years | 113 (13.9%) | 73 (6.0%) |
| 35 to 64 Years | 79 (29.9%) | 28 (11.0%) |
| 65 to 74 Years | 3 (14.3%) | 25 (43.1%) |
| 75 Years and over | 35 (100.0%) | 35 (100.0%) |
Disability Class by Sex by Age in Livingston
Disability Class: Hearing Difficulty
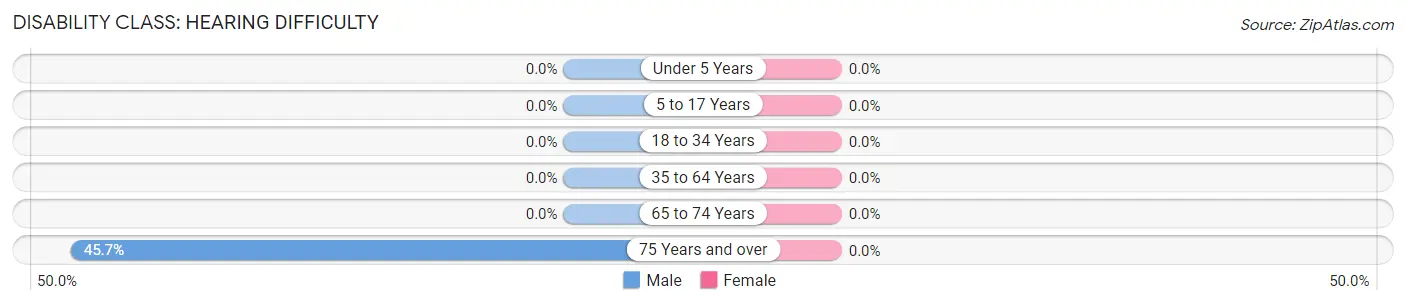
| Age Bracket | Male | Female |
| Under 5 Years | 0 (0.0%) | 0 (0.0%) |
| 5 to 17 Years | 0 (0.0%) | 0 (0.0%) |
| 18 to 34 Years | 0 (0.0%) | 0 (0.0%) |
| 35 to 64 Years | 0 (0.0%) | 0 (0.0%) |
| 65 to 74 Years | 0 (0.0%) | 0 (0.0%) |
| 75 Years and over | 16 (45.7%) | 0 (0.0%) |
Disability Class: Vision Difficulty
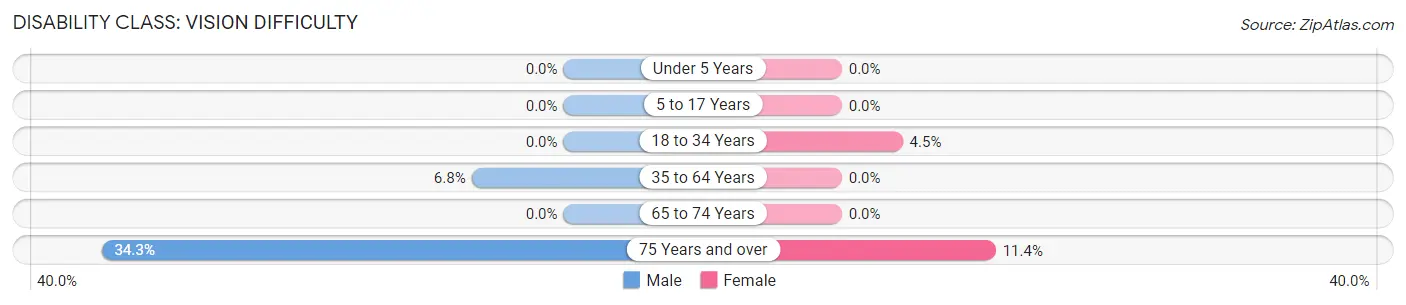
| Age Bracket | Male | Female |
| Under 5 Years | 0 (0.0%) | 0 (0.0%) |
| 5 to 17 Years | 0 (0.0%) | 0 (0.0%) |
| 18 to 34 Years | 0 (0.0%) | 55 (4.5%) |
| 35 to 64 Years | 18 (6.8%) | 0 (0.0%) |
| 65 to 74 Years | 0 (0.0%) | 0 (0.0%) |
| 75 Years and over | 12 (34.3%) | 4 (11.4%) |
Disability Class: Cognitive Difficulty
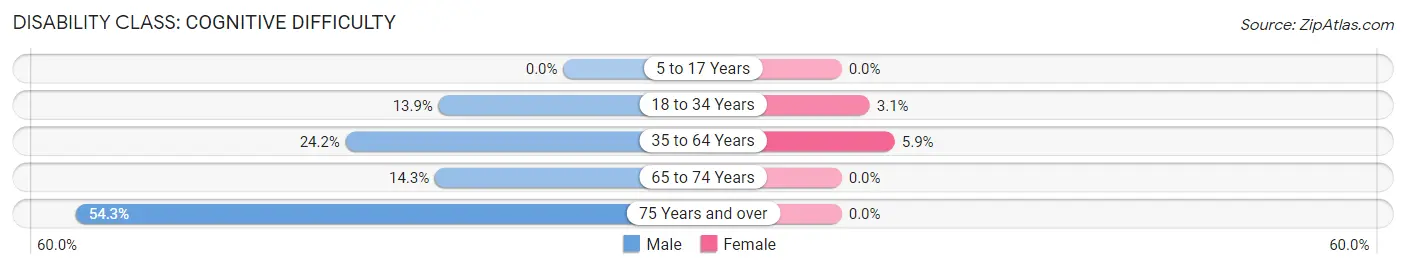
| Age Bracket | Male | Female |
| 5 to 17 Years | 0 (0.0%) | 0 (0.0%) |
| 18 to 34 Years | 113 (13.9%) | 38 (3.1%) |
| 35 to 64 Years | 64 (24.2%) | 15 (5.9%) |
| 65 to 74 Years | 3 (14.3%) | 0 (0.0%) |
| 75 Years and over | 19 (54.3%) | 0 (0.0%) |
Disability Class: Ambulatory Difficulty
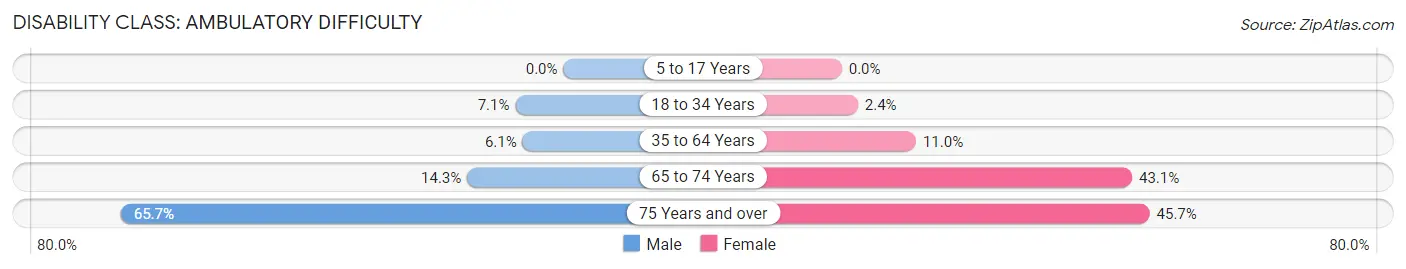
| Age Bracket | Male | Female |
| 5 to 17 Years | 0 (0.0%) | 0 (0.0%) |
| 18 to 34 Years | 58 (7.1%) | 29 (2.4%) |
| 35 to 64 Years | 16 (6.1%) | 28 (11.0%) |
| 65 to 74 Years | 3 (14.3%) | 25 (43.1%) |
| 75 Years and over | 23 (65.7%) | 16 (45.7%) |
Disability Class: Self-Care Difficulty
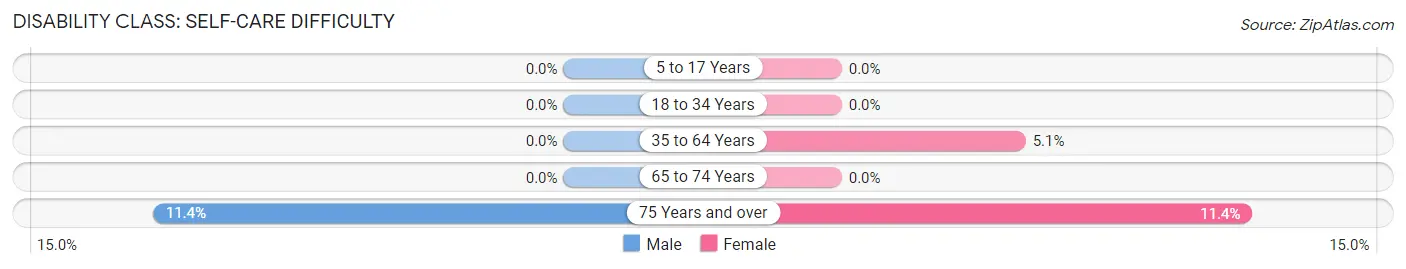
| Age Bracket | Male | Female |
| 5 to 17 Years | 0 (0.0%) | 0 (0.0%) |
| 18 to 34 Years | 0 (0.0%) | 0 (0.0%) |
| 35 to 64 Years | 0 (0.0%) | 13 (5.1%) |
| 65 to 74 Years | 0 (0.0%) | 0 (0.0%) |
| 75 Years and over | 4 (11.4%) | 4 (11.4%) |
Technology Access in Livingston
Computing Device Access in Livingston
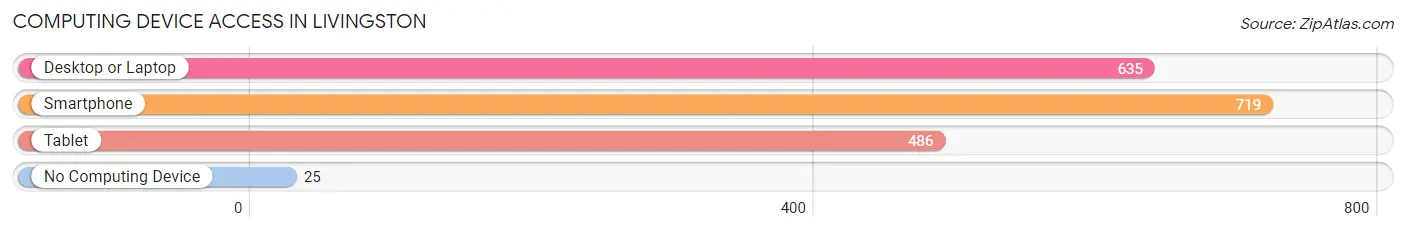
| Device Type | # Households | % Households |
| Desktop or Laptop | 635 | 81.6% |
| Smartphone | 719 | 92.4% |
| Tablet | 486 | 62.5% |
| No Computing Device | 25 | 3.2% |
| Total | 778 | 100.0% |
Internet Access in Livingston
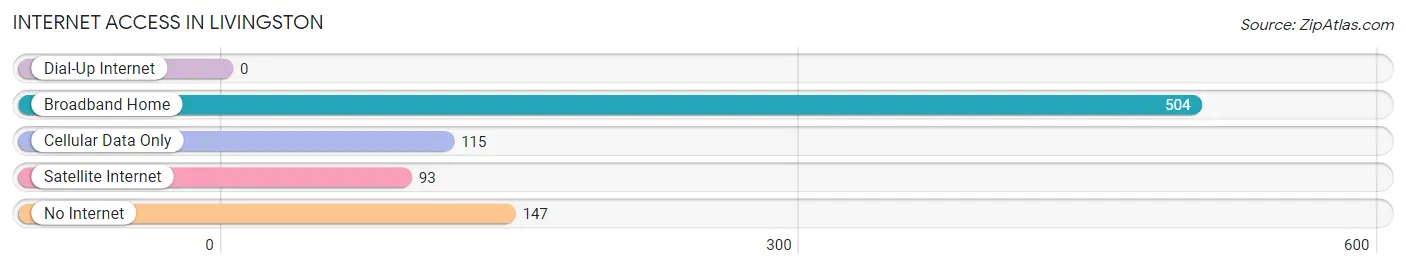
| Internet Type | # Households | % Households |
| Dial-Up Internet | 0 | 0.0% |
| Broadband Home | 504 | 64.8% |
| Cellular Data Only | 115 | 14.8% |
| Satellite Internet | 93 | 11.9% |
| No Internet | 147 | 18.9% |
| Total | 778 | 100.0% |
Livingston Summary
Livingston, Alabama is a small town located in Sumter County, Alabama. It is situated in the western part of the state, about an hour and a half from the state capital of Montgomery. The town has a population of approximately 3,000 people and is the county seat of Sumter County.
Livingston is located in the Black Belt region of Alabama, which is known for its rich soil and agricultural production. The town is situated on the banks of the Tombigbee River, which provides a source of water for the town and its surrounding areas. The town is also located near the Tombigbee National Forest, which provides a variety of recreational activities for residents and visitors alike.
The town of Livingston was founded in 1835 and was named after Edward Livingston, a prominent lawyer and politician from New York. The town was originally a trading post and was used as a stopover for travelers heading to the Gulf Coast. The town was also a major stop on the Mobile and Ohio Railroad, which connected the town to other parts of the state.
Livingston has a rich history and is home to several historic sites, including the Sumter County Courthouse, which was built in 1837 and is the oldest courthouse in the state. The town is also home to the Livingston Depot, which was built in 1854 and is the oldest railroad depot in the state.
Livingston has a humid subtropical climate, with hot summers and mild winters. The average temperature in the summer is around 90 degrees Fahrenheit, while the average temperature in the winter is around 50 degrees Fahrenheit. The town receives an average of 48 inches of rain per year.
Livingston has a diverse economy, with a variety of industries and businesses. The town is home to several manufacturing companies, including a paper mill, a furniture factory, and a textile mill. The town is also home to several retail stores, restaurants, and other businesses.
Livingston has a diverse population, with a mix of African American, White, and Hispanic residents. The town has a median household income of $30,000, and the median age of residents is 37. The town has a high school graduation rate of 85%, and the unemployment rate is 6.3%.
Livingston is a small town with a rich history and a diverse economy. The town is home to several historic sites, and its diverse population makes it a great place to live and work. The town is also located near the Tombigbee National Forest, which provides a variety of recreational activities for residents and visitors alike.
Common Questions
What is Per Capita Income in Livingston?
Per Capita income in Livingston is $14,776.
What is the Median Household income in Livingston?
Median Household Income in Livingston is $20,417.
What is Family Income Deficit in Livingston?
Family Income Deficit in Livingston is $11,272.
Families that are below poverty line in Livingston earn $11,272 less on average than the poverty threshold level.
What is Inequality or Gini Index in Livingston?
Inequality or Gini Index in Livingston is 0.57.
What is the Total Population of Livingston?
Total Population of Livingston is 3,297.
What is the Total Male Population of Livingston?
Total Male Population of Livingston is 1,348.
What is the Total Female Population of Livingston?
Total Female Population of Livingston is 1,949.
What is the Ratio of Males per 100 Females in Livingston?
There are 69.16 Males per 100 Females in Livingston.
What is the Ratio of Females per 100 Males in Livingston?
There are 144.58 Females per 100 Males in Livingston.
What is the Median Population Age in Livingston?
Median Population Age in Livingston is 21.2 Years.
What is the Average Family Size in Livingston
Average Family Size in Livingston is 3.8 People.
What is the Average Household Size in Livingston
Average Household Size in Livingston is 2.7 People.
How Large is the Labor Force in Livingston?
There are 1,443 People in the Labor Forcein in Livingston.
What is the Percentage of People in the Labor Force in Livingston?
53.5% of People are in the Labor Force in Livingston.
What is the Unemployment Rate in Livingston?
Unemployment Rate in Livingston is 11.1%.