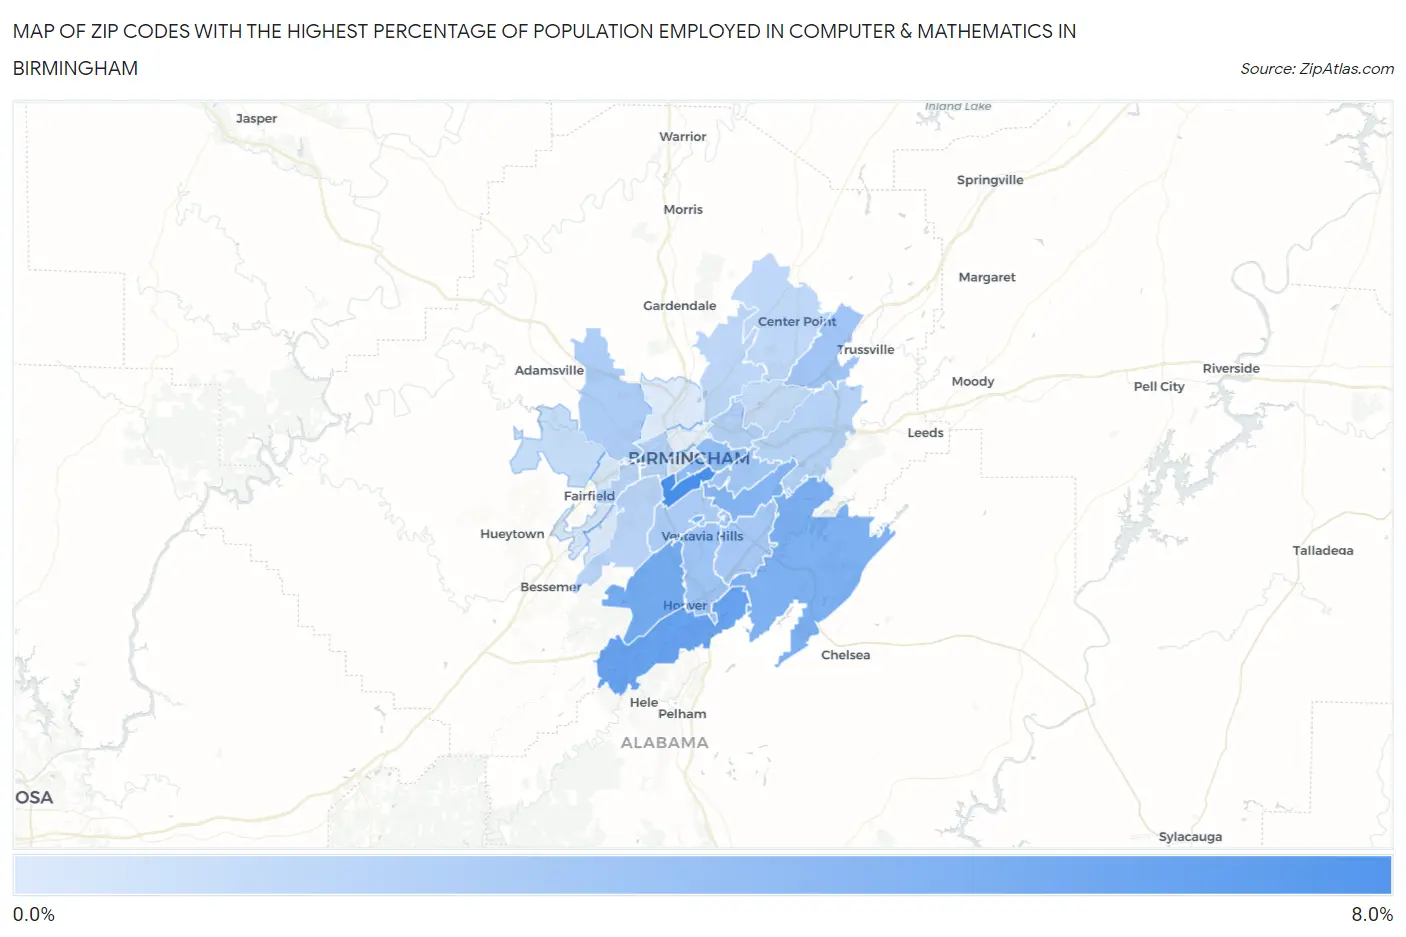
Zip Codes with the Highest Percentage of Population Employed in Computer & Mathematics in Birmingham, AL
RELATED REPORTS & OPTIONS
Computer & Mathematics
Birmingham
Compare Zip Codes
Map of Zip Codes with the Highest Percentage of Population Employed in Computer & Mathematics in Birmingham
0.18%
6.7%
Zip Codes with the Highest Percentage of Population Employed in Computer & Mathematics in Birmingham, AL
| Zip Code | % Employed | vs State | vs National | |
| 1. | 35205 | 6.7% | 2.5%(+4.17)#26 | 3.5%(+3.19)#1,784 |
| 2. | 35244 | 5.3% | 2.5%(+2.72)#45 | 3.5%(+1.74)#3,056 |
| 3. | 35226 | 4.6% | 2.5%(+2.08)#48 | 3.5%(+1.10)#3,908 |
| 4. | 35229 | 4.6% | 2.5%(+2.07)#49 | 3.5%(+1.08)#3,931 |
| 5. | 35242 | 4.4% | 2.5%(+1.82)#56 | 3.5%(+0.840)#4,324 |
| 6. | 35223 | 4.0% | 2.5%(+1.49)#62 | 3.5%(+0.512)#4,956 |
| 7. | 35233 | 3.5% | 2.5%(+0.948)#82 | 3.5%(-0.033)#6,228 |
| 8. | 35222 | 3.4% | 2.5%(+0.857)#86 | 3.5%(-0.124)#6,484 |
| 9. | 35254 | 3.3% | 2.5%(+0.804)#90 | 3.5%(-0.177)#6,631 |
| 10. | 35216 | 2.8% | 2.5%(+0.300)#111 | 3.5%(-0.681)#8,298 |
| 11. | 35235 | 2.7% | 2.5%(+0.190)#116 | 3.5%(-0.791)#8,700 |
| 12. | 35213 | 2.6% | 2.5%(+0.070)#126 | 3.5%(-0.911)#9,159 |
| 13. | 35243 | 2.5% | 2.5%(-0.002)#131 | 3.5%(-0.983)#9,454 |
| 14. | 35209 | 2.3% | 2.5%(-0.240)#144 | 3.5%(-1.22)#10,431 |
| 15. | 35214 | 2.2% | 2.5%(-0.298)#148 | 3.5%(-1.28)#10,695 |
| 16. | 35212 | 1.9% | 2.5%(-0.617)#176 | 3.5%(-1.60)#12,167 |
| 17. | 35204 | 1.8% | 2.5%(-0.698)#185 | 3.5%(-1.68)#12,549 |
| 18. | 35210 | 1.8% | 2.5%(-0.740)#192 | 3.5%(-1.72)#12,743 |
| 19. | 35211 | 1.8% | 2.5%(-0.764)#195 | 3.5%(-1.74)#12,840 |
| 20. | 35208 | 1.7% | 2.5%(-0.802)#197 | 3.5%(-1.78)#13,017 |
| 21. | 35217 | 1.6% | 2.5%(-0.984)#220 | 3.5%(-1.96)#14,028 |
| 22. | 35215 | 1.4% | 2.5%(-1.10)#238 | 3.5%(-2.08)#14,700 |
| 23. | 35206 | 1.1% | 2.5%(-1.41)#273 | 3.5%(-2.39)#16,533 |
| 24. | 35224 | 1.1% | 2.5%(-1.41)#274 | 3.5%(-2.40)#16,550 |
| 25. | 35218 | 0.46% | 2.5%(-2.09)#369 | 3.5%(-3.07)#20,756 |
| 26. | 35228 | 0.36% | 2.5%(-2.18)#382 | 3.5%(-3.16)#21,283 |
| 27. | 35203 | 0.33% | 2.5%(-2.22)#391 | 3.5%(-3.20)#21,498 |
| 28. | 35221 | 0.32% | 2.5%(-2.22)#392 | 3.5%(-3.20)#21,520 |
| 29. | 35207 | 0.18% | 2.5%(-2.37)#419 | 3.5%(-3.35)#22,146 |
1
Common Questions
What are the Top 10 Zip Codes with the Highest Percentage of Population Employed in Computer & Mathematics in Birmingham, AL?
Top 10 Zip Codes with the Highest Percentage of Population Employed in Computer & Mathematics in Birmingham, AL are:
What zip code has the Highest Percentage of Population Employed in Computer & Mathematics in Birmingham, AL?
35205 has the Highest Percentage of Population Employed in Computer & Mathematics in Birmingham, AL with 6.7%.
What is the Percentage of Population Employed in Computer & Mathematics in Birmingham, AL?
Percentage of Population Employed in Computer & Mathematics in Birmingham is 2.5%.
What is the Percentage of Population Employed in Computer & Mathematics in Alabama?
Percentage of Population Employed in Computer & Mathematics in Alabama is 2.5%.
What is the Percentage of Population Employed in Computer & Mathematics in the United States?
Percentage of Population Employed in Computer & Mathematics in the United States is 3.5%.