Sylvester, WV Map & Demographics
Sylvester Map
Sylvester Overview
$25,605
PER CAPITA INCOME
$83,750
AVG FAMILY INCOME
$61,000
AVG HOUSEHOLD INCOME
0.39
INEQUALITY / GINI INDEX
169
TOTAL POPULATION
73
MALE POPULATION
96
FEMALE POPULATION
76.04
MALES / 100 FEMALES
131.51
FEMALES / 100 MALES
42.3
MEDIAN AGE
3.6
AVG FAMILY SIZE
2.8
AVG HOUSEHOLD SIZE
50
LABOR FORCE [ PEOPLE ]
36.0%
PERCENT IN LABOR FORCE
20.0%
UNEMPLOYMENT RATE
Sylvester Zip Codes
Sylvester Area Codes
Income in Sylvester
Income Overview in Sylvester
Per Capita Income in Sylvester is $25,605, while median incomes of families and households are $83,750 and $61,000 respectively.
| Characteristic | Number | Measure |
| Per Capita Income | 169 | $25,605 |
| Median Family Income | 38 | $83,750 |
| Mean Family Income | 38 | $88,313 |
| Median Household Income | 60 | $61,000 |
| Mean Household Income | 60 | $68,037 |
| Income Deficit | 38 | $0 |
| Wage / Income Gap (%) | 169 | 0.00% |
| Wage / Income Gap ($) | 169 | 100.00¢ per $1 |
| Gini / Inequality Index | 169 | 0.39 |
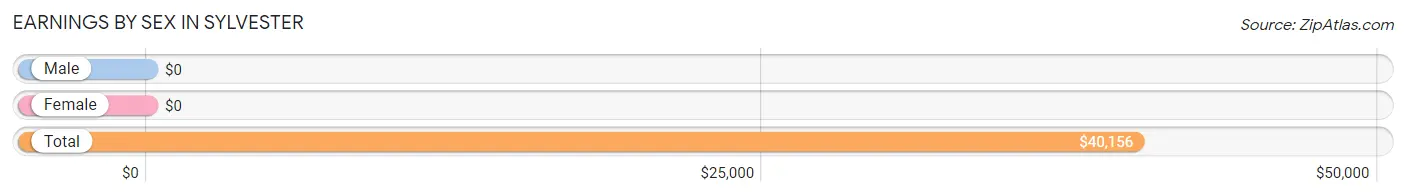
Earnings by Sex in Sylvester
| Sex | Number | Average Earnings |
| Male | 25 (42.4%) | $0 |
| Female | 34 (57.6%) | $0 |
| Total | 59 (100.0%) | $40,156 |
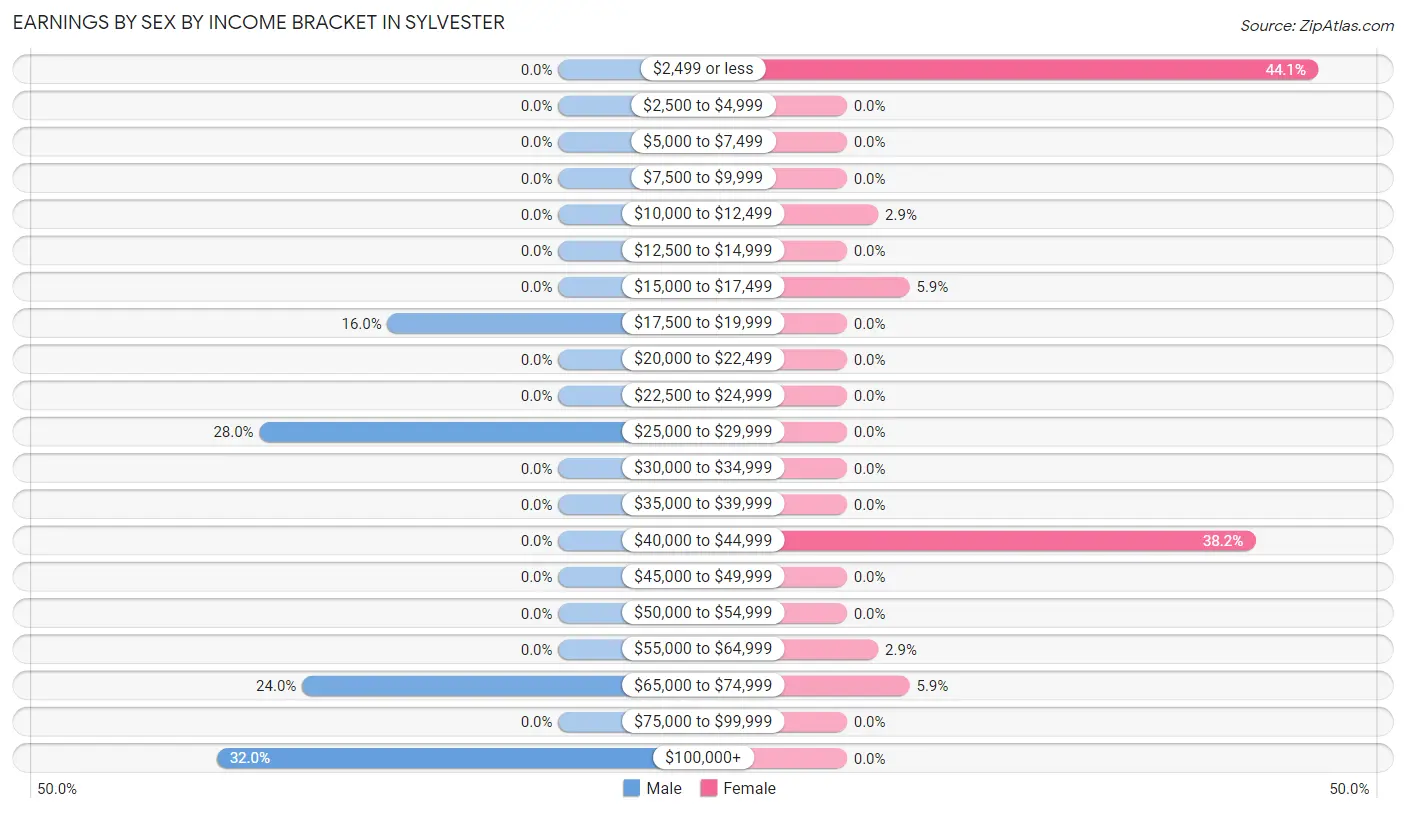
Earnings by Sex by Income Bracket in Sylvester
The most common earnings brackets in Sylvester are $100,000+ for men (8 | 32.0%) and $2,499 or less for women (15 | 44.1%).
| Income | Male | Female |
| $2,499 or less | 0 (0.0%) | 15 (44.1%) |
| $2,500 to $4,999 | 0 (0.0%) | 0 (0.0%) |
| $5,000 to $7,499 | 0 (0.0%) | 0 (0.0%) |
| $7,500 to $9,999 | 0 (0.0%) | 0 (0.0%) |
| $10,000 to $12,499 | 0 (0.0%) | 1 (2.9%) |
| $12,500 to $14,999 | 0 (0.0%) | 0 (0.0%) |
| $15,000 to $17,499 | 0 (0.0%) | 2 (5.9%) |
| $17,500 to $19,999 | 4 (16.0%) | 0 (0.0%) |
| $20,000 to $22,499 | 0 (0.0%) | 0 (0.0%) |
| $22,500 to $24,999 | 0 (0.0%) | 0 (0.0%) |
| $25,000 to $29,999 | 7 (28.0%) | 0 (0.0%) |
| $30,000 to $34,999 | 0 (0.0%) | 0 (0.0%) |
| $35,000 to $39,999 | 0 (0.0%) | 0 (0.0%) |
| $40,000 to $44,999 | 0 (0.0%) | 13 (38.2%) |
| $45,000 to $49,999 | 0 (0.0%) | 0 (0.0%) |
| $50,000 to $54,999 | 0 (0.0%) | 0 (0.0%) |
| $55,000 to $64,999 | 0 (0.0%) | 1 (2.9%) |
| $65,000 to $74,999 | 6 (24.0%) | 2 (5.9%) |
| $75,000 to $99,999 | 0 (0.0%) | 0 (0.0%) |
| $100,000+ | 8 (32.0%) | 0 (0.0%) |
| Total | 25 (100.0%) | 34 (100.0%) |
Earnings by Sex by Educational Attainment in Sylvester
| Educational Attainment | Male Income | Female Income |
| Less than High School | - | - |
| High School Diploma | - | - |
| College or Associate's Degree | - | - |
| Bachelor's Degree | - | - |
| Graduate Degree | - | - |
| Total | - | - |
Family Income in Sylvester
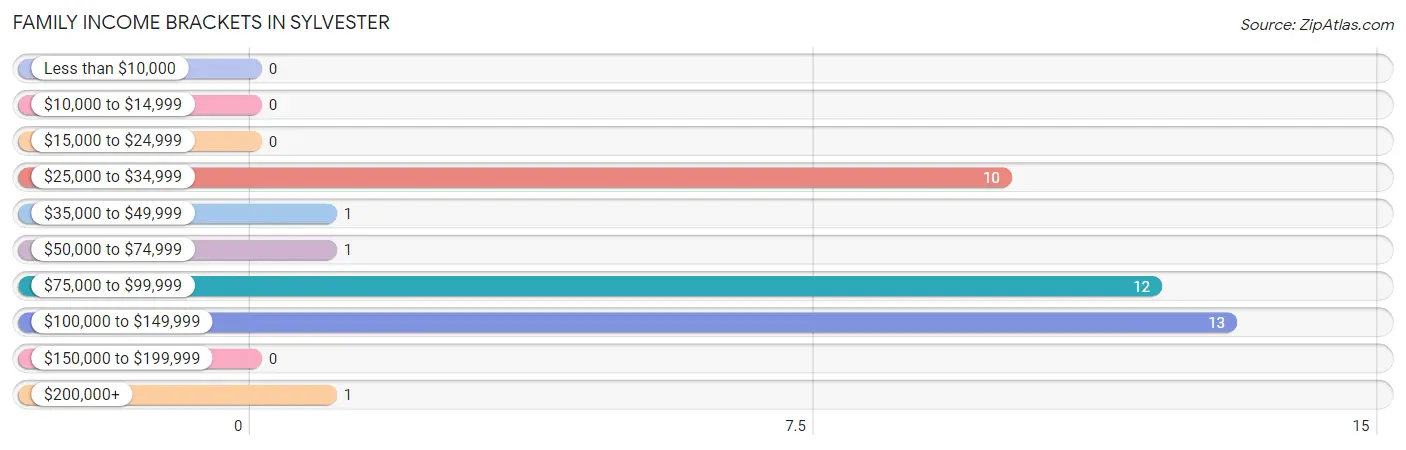
Family Income Brackets in Sylvester
According to the Sylvester family income data, there are 13 families falling into the $100,000 to $149,999 income range, which is the most common income bracket and makes up 34.2% of all families.
| Income Bracket | # Families | % Families |
| Less than $10,000 | 0 | 0.0% |
| $10,000 to $14,999 | 0 | 0.0% |
| $15,000 to $24,999 | 0 | 0.0% |
| $25,000 to $34,999 | 10 | 26.3% |
| $35,000 to $49,999 | 1 | 2.6% |
| $50,000 to $74,999 | 1 | 2.6% |
| $75,000 to $99,999 | 12 | 31.6% |
| $100,000 to $149,999 | 13 | 34.2% |
| $150,000 to $199,999 | 0 | 0.0% |
| $200,000+ | 1 | 2.6% |
Family Income by Famaliy Size in Sylvester
| Income Bracket | # Families | Median Income |
| 2-Person Families | 14 (36.8%) | $0 |
| 3-Person Families | 18 (47.4%) | $0 |
| 4-Person Families | 0 (0.0%) | $0 |
| 5-Person Families | 0 (0.0%) | $0 |
| 6-Person Families | 0 (0.0%) | $0 |
| 7+ Person Families | 6 (15.8%) | $0 |
| Total | 38 (100.0%) | $83,750 |
Family Income by Number of Earners in Sylvester
| Number of Earners | # Families | Median Income |
| No Earners | 14 (36.8%) | $0 |
| 1 Earner | 5 (13.2%) | $0 |
| 2 Earners | 13 (34.2%) | $0 |
| 3+ Earners | 6 (15.8%) | $0 |
| Total | 38 (100.0%) | $83,750 |
Household Income in Sylvester
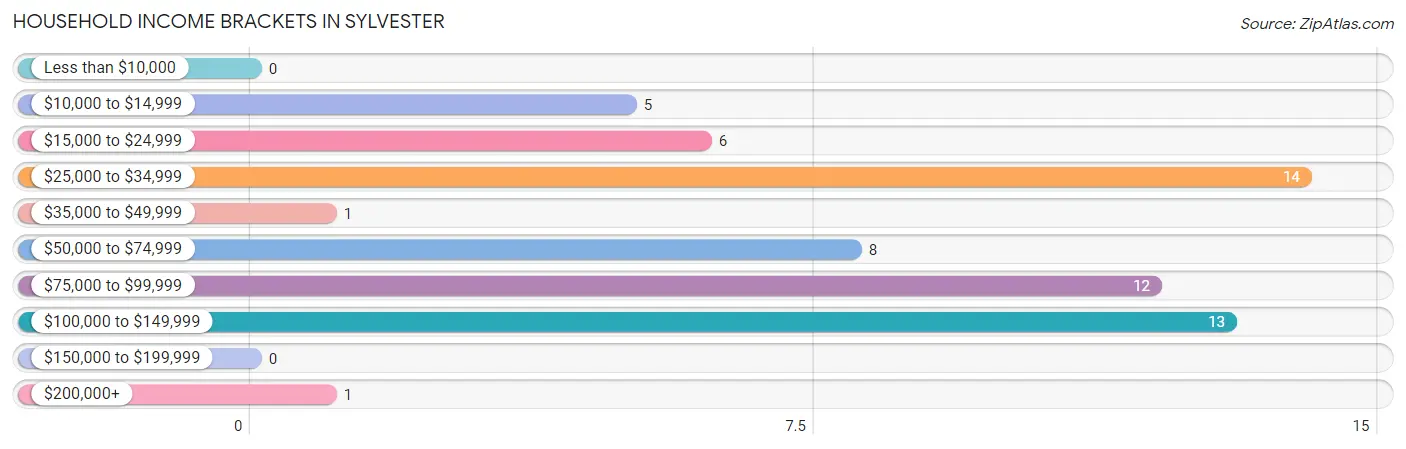
Household Income Brackets in Sylvester
With 14 households falling in the category, the $25,000 to $34,999 income range is the most frequent in Sylvester, accounting for 23.3% of all households.
| Income Bracket | # Households | % Households |
| Less than $10,000 | 0 | 0.0% |
| $10,000 to $14,999 | 5 | 8.3% |
| $15,000 to $24,999 | 6 | 10.0% |
| $25,000 to $34,999 | 14 | 23.3% |
| $35,000 to $49,999 | 1 | 1.7% |
| $50,000 to $74,999 | 8 | 13.3% |
| $75,000 to $99,999 | 12 | 20.0% |
| $100,000 to $149,999 | 13 | 21.7% |
| $150,000 to $199,999 | 0 | 0.0% |
| $200,000+ | 1 | 1.7% |
Household Income by Householder Age in Sylvester
The median household income in Sylvester is $61,000, with the highest median household income of $29,375 found in the 65+ years age bracket for the primary householder. A total of 33 households (55.0%) fall into this category.
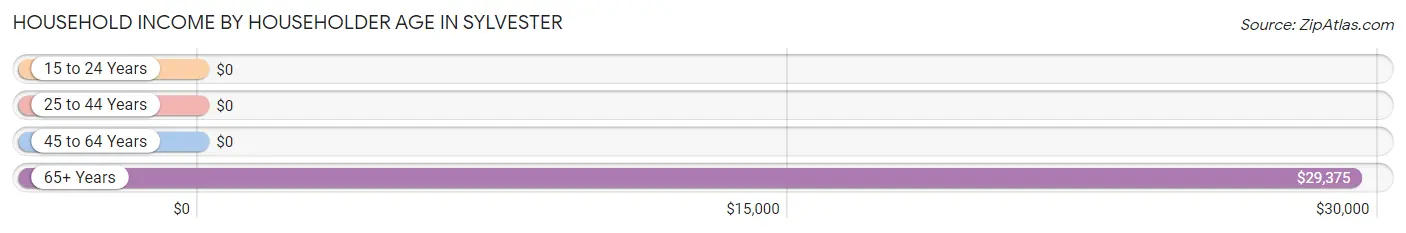
| Income Bracket | # Households | Median Income |
| 15 to 24 Years | 0 (0.0%) | $0 |
| 25 to 44 Years | 6 (10.0%) | $0 |
| 45 to 64 Years | 21 (35.0%) | $0 |
| 65+ Years | 33 (55.0%) | $29,375 |
| Total | 60 (100.0%) | $61,000 |
Poverty in Sylvester
Income Below Poverty by Sex and Age in Sylvester
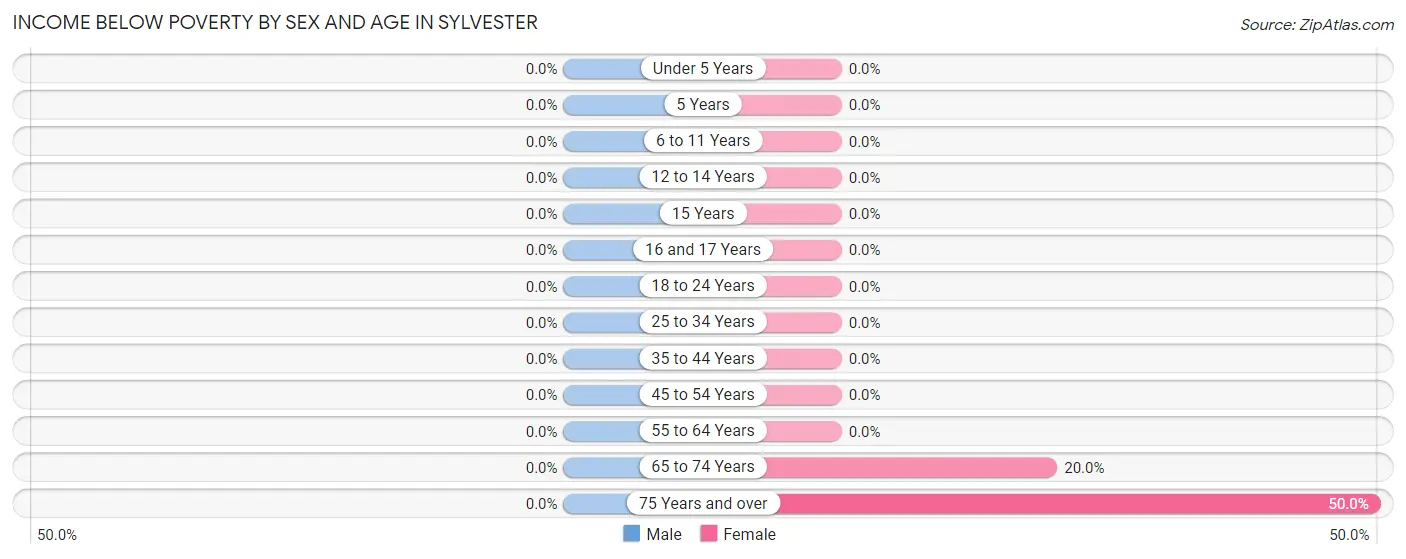
| Age Bracket | Male | Female |
| Under 5 Years | 0 (0.0%) | 0 (0.0%) |
| 5 Years | 0 (0.0%) | 0 (0.0%) |
| 6 to 11 Years | 0 (0.0%) | 0 (0.0%) |
| 12 to 14 Years | 0 (0.0%) | 0 (0.0%) |
| 15 Years | 0 (0.0%) | 0 (0.0%) |
| 16 and 17 Years | 0 (0.0%) | 0 (0.0%) |
| 18 to 24 Years | 0 (0.0%) | 0 (0.0%) |
| 25 to 34 Years | 0 (0.0%) | 0 (0.0%) |
| 35 to 44 Years | 0 (0.0%) | 0 (0.0%) |
| 45 to 54 Years | 0 (0.0%) | 0 (0.0%) |
| 55 to 64 Years | 0 (0.0%) | 0 (0.0%) |
| 65 to 74 Years | 0 (0.0%) | 3 (20.0%) |
| 75 Years and over | 0 (0.0%) | 5 (50.0%) |
| Total | 0 (0.0%) | 8 (8.7%) |
Income Above Poverty by Sex and Age in Sylvester
According to the poverty statistics in Sylvester, males aged 5 years and females aged 16 and 17 years are the age groups that are most secure financially, with 100.0% of males and 100.0% of females in these age groups living above the poverty line.
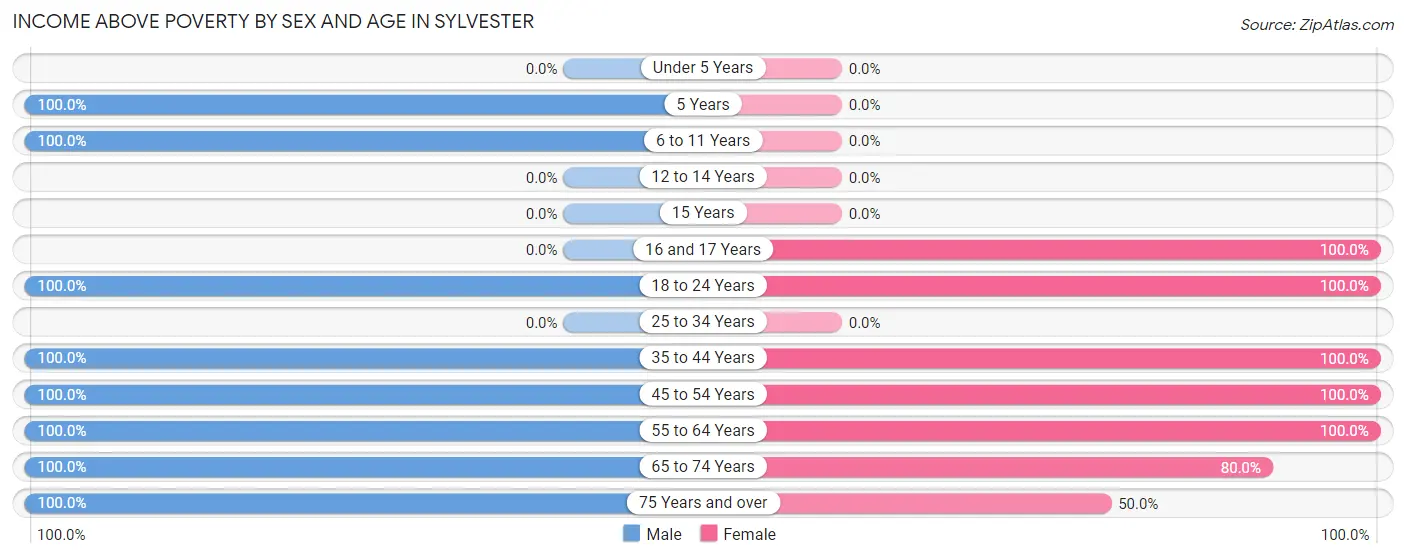
| Age Bracket | Male | Female |
| Under 5 Years | 0 (0.0%) | 0 (0.0%) |
| 5 Years | 7 (100.0%) | 0 (0.0%) |
| 6 to 11 Years | 17 (100.0%) | 0 (0.0%) |
| 12 to 14 Years | 0 (0.0%) | 0 (0.0%) |
| 15 Years | 0 (0.0%) | 0 (0.0%) |
| 16 and 17 Years | 0 (0.0%) | 7 (100.0%) |
| 18 to 24 Years | 7 (100.0%) | 24 (100.0%) |
| 25 to 34 Years | 0 (0.0%) | 0 (0.0%) |
| 35 to 44 Years | 6 (100.0%) | 16 (100.0%) |
| 45 to 54 Years | 12 (100.0%) | 14 (100.0%) |
| 55 to 64 Years | 2 (100.0%) | 6 (100.0%) |
| 65 to 74 Years | 2 (100.0%) | 12 (80.0%) |
| 75 Years and over | 18 (100.0%) | 5 (50.0%) |
| Total | 71 (100.0%) | 84 (91.3%) |
Income Below Poverty Among Married-Couple Families in Sylvester
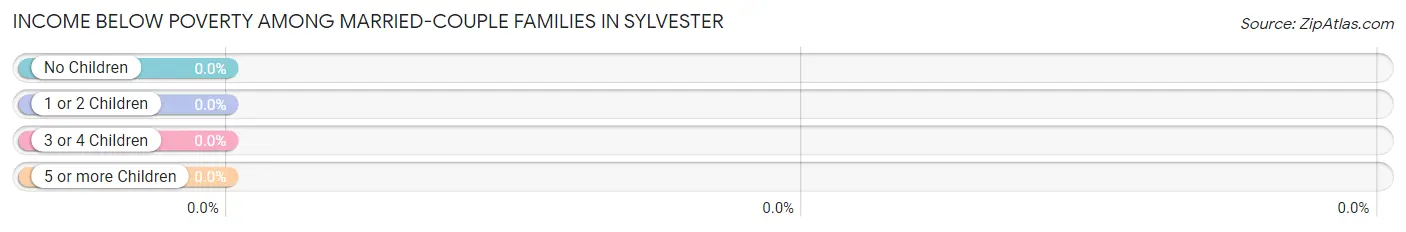
| Children | Above Poverty | Below Poverty |
| No Children | 24 (100.0%) | 0 (0.0%) |
| 1 or 2 Children | 2 (100.0%) | 0 (0.0%) |
| 3 or 4 Children | 6 (100.0%) | 0 (0.0%) |
| 5 or more Children | 0 (0.0%) | 0 (0.0%) |
| Total | 32 (100.0%) | 0 (0.0%) |
Income Below Poverty Among Single-Parent Households in Sylvester
| Children | Single Father | Single Mother |
| No Children | 0 (0.0%) | 0 (0.0%) |
| 1 or 2 Children | 0 (0.0%) | 0 (0.0%) |
| 3 or 4 Children | 0 (0.0%) | 0 (0.0%) |
| 5 or more Children | 0 (0.0%) | 0 (0.0%) |
| Total | 0 (0.0%) | 0 (0.0%) |
Income Below Poverty Among Married-Couple vs Single-Parent Households in Sylvester
| Children | Married-Couple Families | Single-Parent Households |
| No Children | 0 (0.0%) | 0 (0.0%) |
| 1 or 2 Children | 0 (0.0%) | 0 (0.0%) |
| 3 or 4 Children | 0 (0.0%) | 0 (0.0%) |
| 5 or more Children | 0 (0.0%) | 0 (0.0%) |
| Total | 0 (0.0%) | 0 (0.0%) |
Race in Sylvester
The most populous races in Sylvester are , and White / Caucasian (169 | 100.0%).
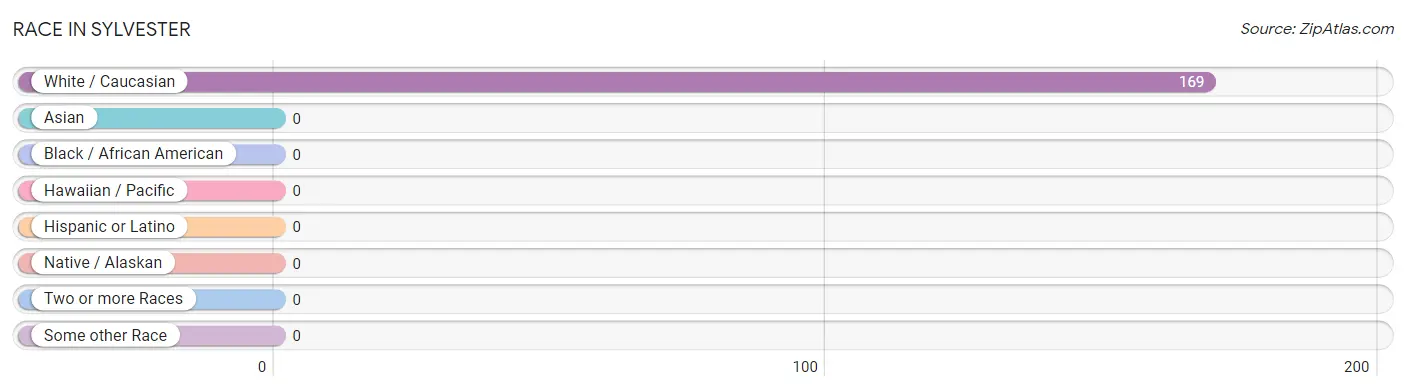
| Race | # Population | % Population |
| Asian | 0 | 0.0% |
| Black / African American | 0 | 0.0% |
| Hawaiian / Pacific | 0 | 0.0% |
| Hispanic or Latino | 0 | 0.0% |
| Native / Alaskan | 0 | 0.0% |
| White / Caucasian | 169 | 100.0% |
| Two or more Races | 0 | 0.0% |
| Some other Race | 0 | 0.0% |
| Total | 169 | 100.0% |
Ancestry in Sylvester
The most populous ancestries reported in Sylvester are American (50 | 29.6%), Irish (11 | 6.5%), English (7 | 4.1%), and Welsh (6 | 3.5%), together accounting for 43.8% of all Sylvester residents.
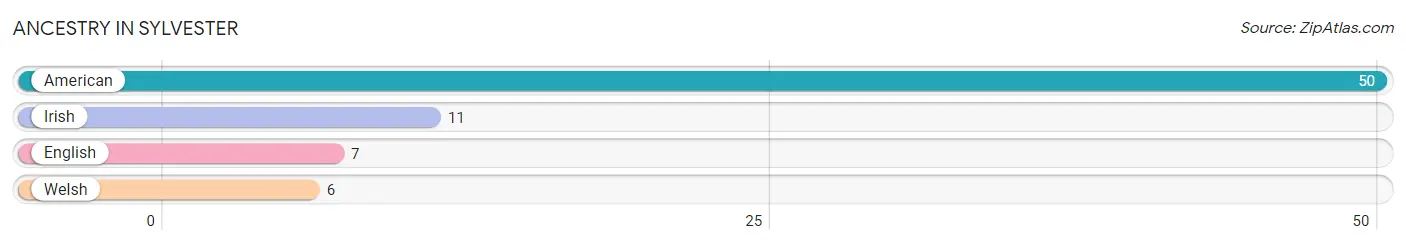
| Ancestry | # Population | % Population |
| American | 50 | 29.6% |
| English | 7 | 4.1% |
| Irish | 11 | 6.5% |
| Welsh | 6 | 3.5% | View All 4 Rows |
Immigrants in Sylvester

| Immigration Origin | # Population | % Population | View All 0 Rows |
Sex and Age in Sylvester
Sex and Age in Sylvester
The most populous age groups in Sylvester are 5 to 9 Years (19 | 26.0%) for men and 15 to 19 Years (22 | 22.9%) for women.
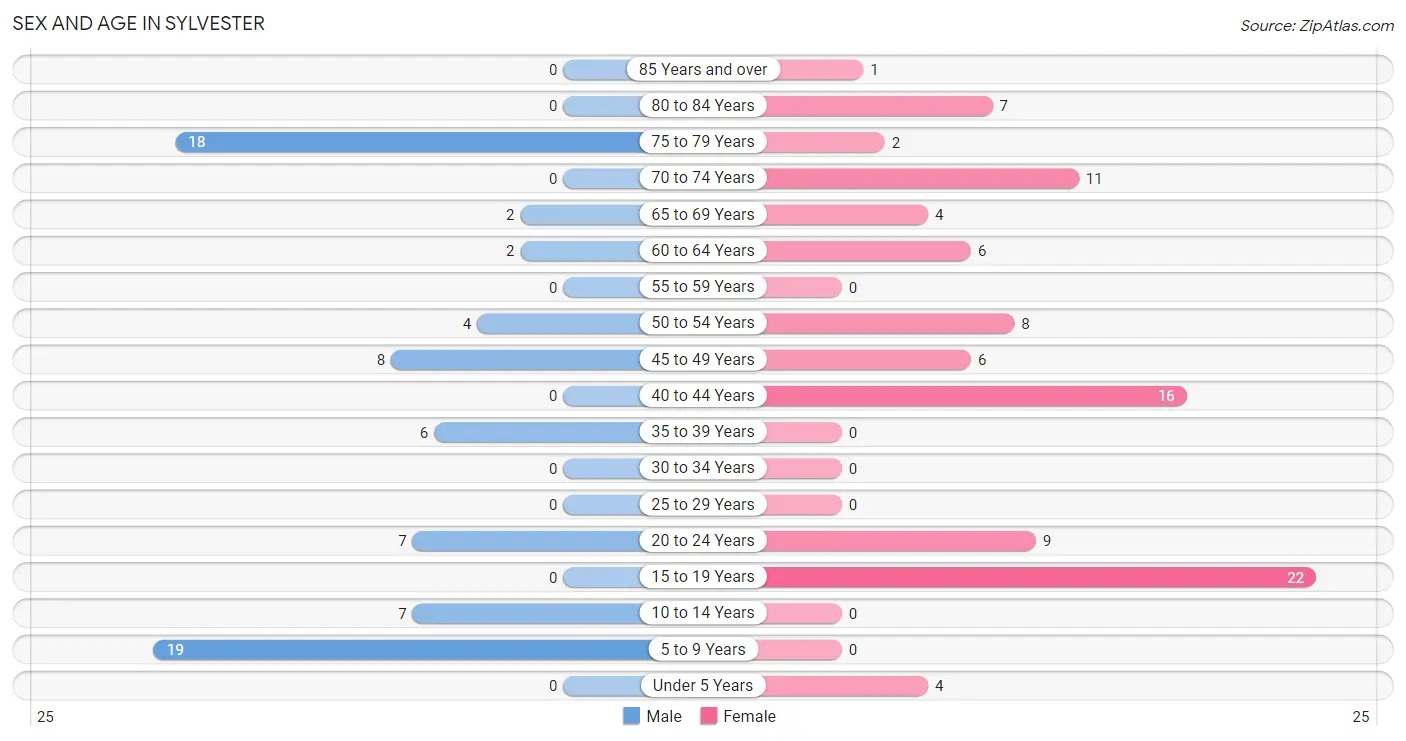
| Age Bracket | Male | Female |
| Under 5 Years | 0 (0.0%) | 4 (4.2%) |
| 5 to 9 Years | 19 (26.0%) | 0 (0.0%) |
| 10 to 14 Years | 7 (9.6%) | 0 (0.0%) |
| 15 to 19 Years | 0 (0.0%) | 22 (22.9%) |
| 20 to 24 Years | 7 (9.6%) | 9 (9.4%) |
| 25 to 29 Years | 0 (0.0%) | 0 (0.0%) |
| 30 to 34 Years | 0 (0.0%) | 0 (0.0%) |
| 35 to 39 Years | 6 (8.2%) | 0 (0.0%) |
| 40 to 44 Years | 0 (0.0%) | 16 (16.7%) |
| 45 to 49 Years | 8 (11.0%) | 6 (6.2%) |
| 50 to 54 Years | 4 (5.5%) | 8 (8.3%) |
| 55 to 59 Years | 0 (0.0%) | 0 (0.0%) |
| 60 to 64 Years | 2 (2.7%) | 6 (6.2%) |
| 65 to 69 Years | 2 (2.7%) | 4 (4.2%) |
| 70 to 74 Years | 0 (0.0%) | 11 (11.5%) |
| 75 to 79 Years | 18 (24.7%) | 2 (2.1%) |
| 80 to 84 Years | 0 (0.0%) | 7 (7.3%) |
| 85 Years and over | 0 (0.0%) | 1 (1.0%) |
| Total | 73 (100.0%) | 96 (100.0%) |
Families and Households in Sylvester
Median Family Size in Sylvester
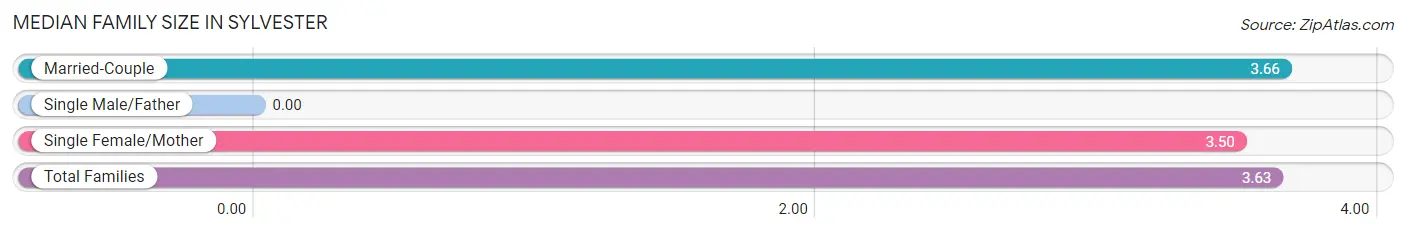
| Family Type | # Families | Family Size |
| Married-Couple | 32 (84.2%) | 3.66 |
| Single Male/Father | 0 (0.0%) | - |
| Single Female/Mother | 6 (15.8%) | 3.50 |
| Total Families | 38 (100.0%) | 3.63 |
Median Household Size in Sylvester
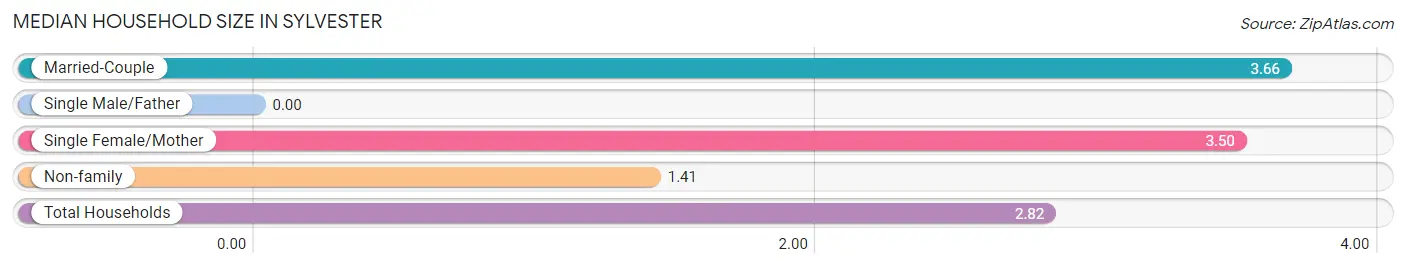
| Household Type | # Households | Household Size |
| Married-Couple | 32 (53.3%) | 3.66 |
| Single Male/Father | 0 (0.0%) | - |
| Single Female/Mother | 6 (10.0%) | 3.50 |
| Non-family | 22 (36.7%) | 1.41 |
| Total Households | 60 (100.0%) | 2.82 |
Household Size by Marriage Status in Sylvester
Out of a total of 60 households in Sylvester, 38 (63.3%) are family households, while 22 (36.7%) are nonfamily households. The most numerous type of family households are 3-person households, comprising 18, and the most common type of nonfamily households are 1-person households, comprising 18.
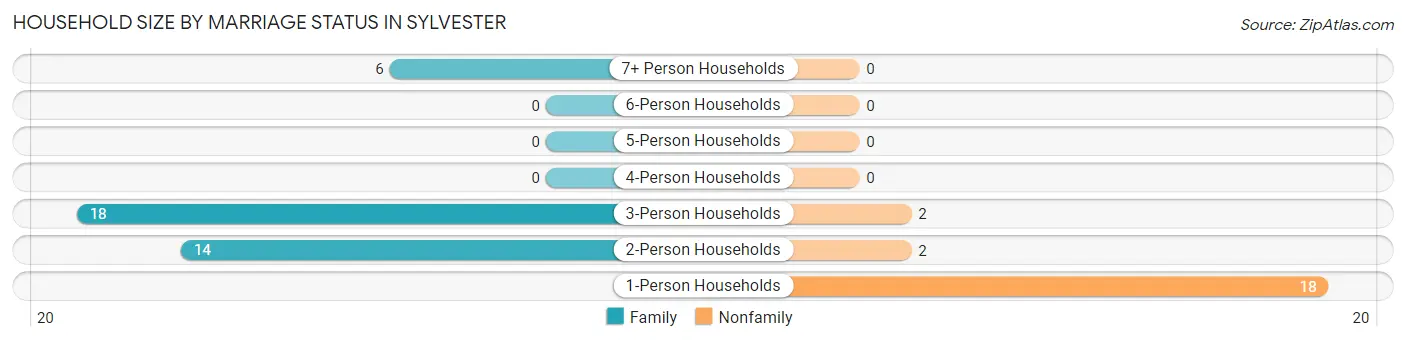
| Household Size | Family Households | Nonfamily Households |
| 1-Person Households | - | 18 (30.0%) |
| 2-Person Households | 14 (23.3%) | 2 (3.3%) |
| 3-Person Households | 18 (30.0%) | 2 (3.3%) |
| 4-Person Households | 0 (0.0%) | 0 (0.0%) |
| 5-Person Households | 0 (0.0%) | 0 (0.0%) |
| 6-Person Households | 0 (0.0%) | 0 (0.0%) |
| 7+ Person Households | 6 (10.0%) | 0 (0.0%) |
| Total | 38 (63.3%) | 22 (36.7%) |
Female Fertility in Sylvester
Fertility by Age in Sylvester
| Age Bracket | Women with Births | Births / 1,000 Women |
| 15 to 19 years | 0 (0.0%) | 0.0 |
| 20 to 34 years | 0 (0.0%) | 0.0 |
| 35 to 50 years | 0 (0.0%) | 0.0 |
| Total | 0 (0.0%) | 0.0 |
Fertility by Age by Marriage Status in Sylvester
| Age Bracket | Married | Unmarried |
| 15 to 19 years | 0 (0.0%) | 0 (0.0%) |
| 20 to 34 years | 0 (0.0%) | 0 (0.0%) |
| 35 to 50 years | 0 (0.0%) | 0 (0.0%) |
| Total | 0 (0.0%) | 0 (0.0%) |
Fertility by Education in Sylvester
| Educational Attainment | Women with Births | Births / 1,000 Women |
| Less than High School | 0 (0.0%) | 0.0 |
| High School Diploma | 0 (0.0%) | 0.0 |
| College or Associate's Degree | 0 (0.0%) | 0.0 |
| Bachelor's Degree | 0 (0.0%) | 0.0 |
| Graduate Degree | 0 (0.0%) | 0.0 |
| Total | 0 (0.0%) | 0.0 |
Fertility by Education by Marriage Status in Sylvester
| Educational Attainment | Married | Unmarried |
| Less than High School | 0 (0.0%) | 0 (0.0%) |
| High School Diploma | 0 (0.0%) | 0 (0.0%) |
| College or Associate's Degree | 0 (0.0%) | 0 (0.0%) |
| Bachelor's Degree | 0 (0.0%) | 0 (0.0%) |
| Graduate Degree | 0 (0.0%) | 0 (0.0%) |
| Total | 0 (0.0%) | 0 (0.0%) |
Employment Characteristics in Sylvester
Employment by Class of Employer in Sylvester
Among the 31 employed individuals in Sylvester, private company employees (23 | 74.2%), federal government employees (7 | 22.6%), and state government employees (1 | 3.2%) make up the most common classes of employment.
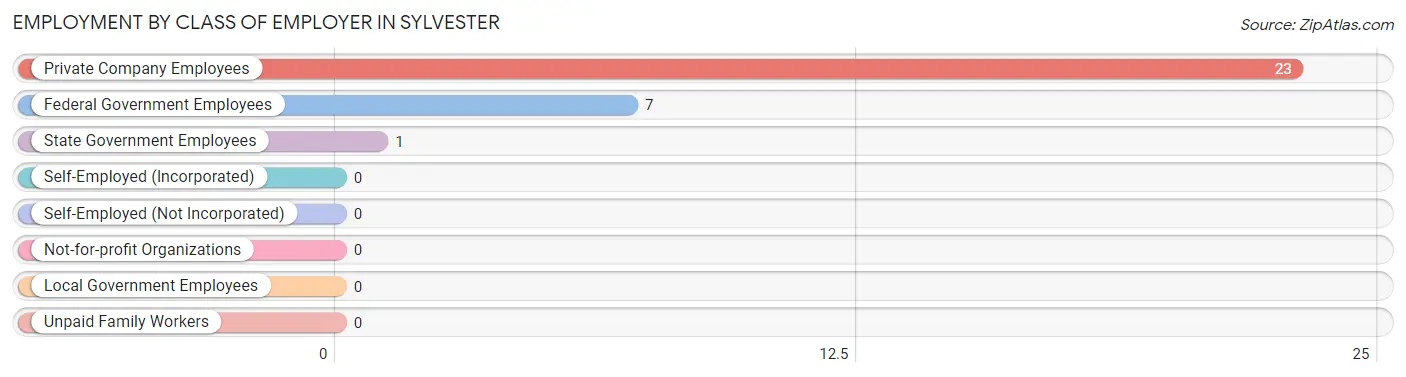
| Employer Class | # Employees | % Employees |
| Private Company Employees | 23 | 74.2% |
| Self-Employed (Incorporated) | 0 | 0.0% |
| Self-Employed (Not Incorporated) | 0 | 0.0% |
| Not-for-profit Organizations | 0 | 0.0% |
| Local Government Employees | 0 | 0.0% |
| State Government Employees | 1 | 3.2% |
| Federal Government Employees | 7 | 22.6% |
| Unpaid Family Workers | 0 | 0.0% |
| Total | 31 | 100.0% |
Employment Status by Age in Sylvester
According to the labor force statistics for Sylvester, out of the total population over 16 years of age (139), 36.0% or 50 individuals are in the labor force, with 20.0% or 10 of them unemployed. The age group with the highest labor force participation rate is 35 to 44 years, with 63.6% or 14 individuals in the labor force. Within the labor force, the 16 to 19 years age range has the highest percentage of unemployed individuals, with 100.0% or 10 of them being unemployed.
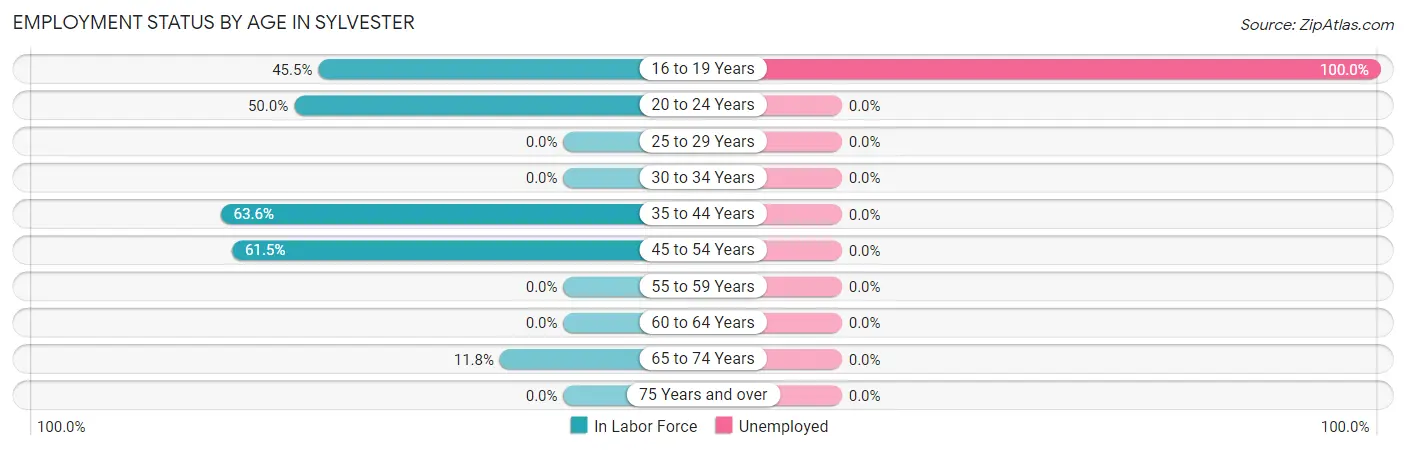
| Age Bracket | In Labor Force | Unemployed |
| 16 to 19 Years | 10 (45.5%) | 10 (100.0%) |
| 20 to 24 Years | 8 (50.0%) | 0 (0.0%) |
| 25 to 29 Years | 0 (0.0%) | 0 (0.0%) |
| 30 to 34 Years | 0 (0.0%) | 0 (0.0%) |
| 35 to 44 Years | 14 (63.6%) | 0 (0.0%) |
| 45 to 54 Years | 16 (61.5%) | 0 (0.0%) |
| 55 to 59 Years | 0 (0.0%) | 0 (0.0%) |
| 60 to 64 Years | 0 (0.0%) | 0 (0.0%) |
| 65 to 74 Years | 2 (11.8%) | 0 (0.0%) |
| 75 Years and over | 0 (0.0%) | 0 (0.0%) |
| Total | 50 (36.0%) | 10 (20.0%) |
Employment Status by Educational Attainment in Sylvester
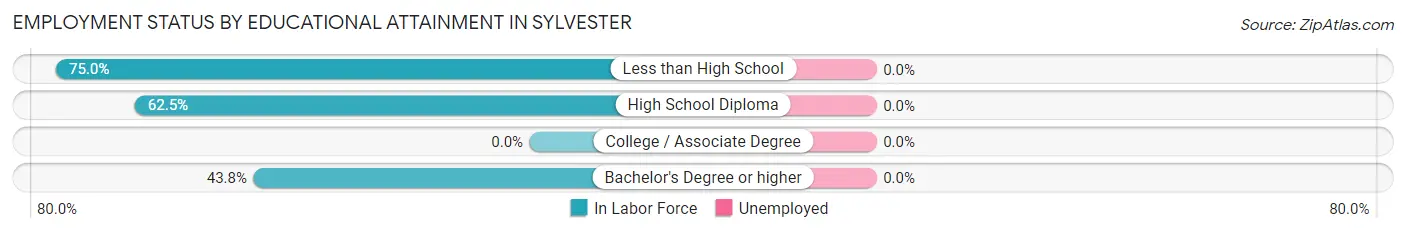
| Educational Attainment | In Labor Force | Unemployed |
| Less than High School | 6 (75.0%) | 0 (0.0%) |
| High School Diploma | 10 (62.5%) | 0 (0.0%) |
| College / Associate Degree | 0 (0.0%) | 0 (0.0%) |
| Bachelor's Degree or higher | 14 (43.8%) | 0 (0.0%) |
| Total | 30 (53.6%) | 0 (0.0%) |
Employment Occupations by Sex in Sylvester
Management, Business, Science and Arts Occupations
The most common Management, Business, Science and Arts occupations in Sylvester are Business & Financial (12 | 30.0%), Management (2 | 5.0%), Community & Social Service (2 | 5.0%), Education Instruction & Library (2 | 5.0%), and Health Diagnosing & Treating (1 | 2.5%).
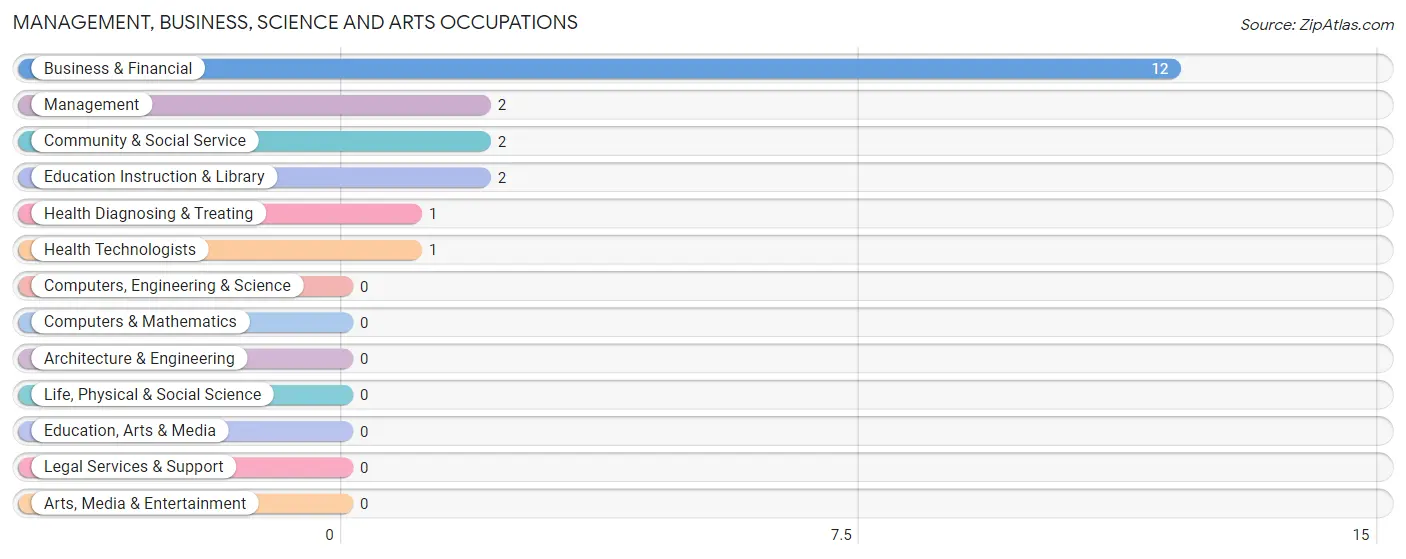
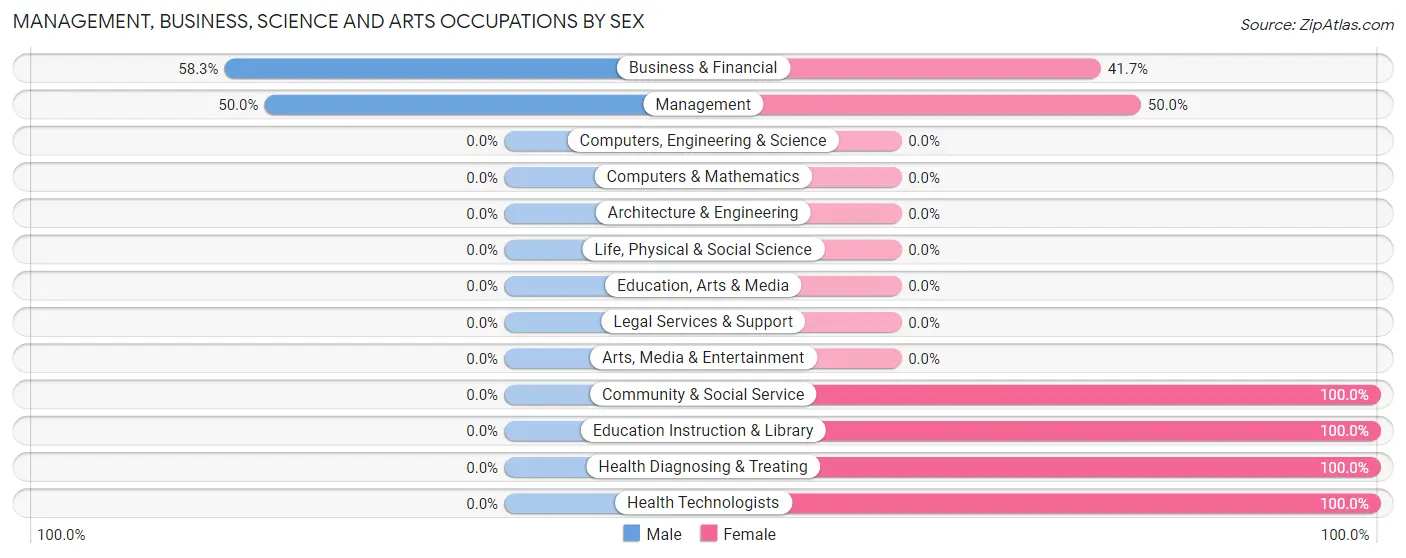
Management, Business, Science and Arts Occupations by Sex
Within the Management, Business, Science and Arts occupations in Sylvester, the most male-oriented occupations are Business & Financial (58.3%), and Management (50.0%), while the most female-oriented occupations are Community & Social Service (100.0%), Education Instruction & Library (100.0%), and Health Diagnosing & Treating (100.0%).
| Occupation | Male | Female |
| Management | 1 (50.0%) | 1 (50.0%) |
| Business & Financial | 7 (58.3%) | 5 (41.7%) |
| Computers, Engineering & Science | 0 (0.0%) | 0 (0.0%) |
| Computers & Mathematics | 0 (0.0%) | 0 (0.0%) |
| Architecture & Engineering | 0 (0.0%) | 0 (0.0%) |
| Life, Physical & Social Science | 0 (0.0%) | 0 (0.0%) |
| Community & Social Service | 0 (0.0%) | 2 (100.0%) |
| Education, Arts & Media | 0 (0.0%) | 0 (0.0%) |
| Legal Services & Support | 0 (0.0%) | 0 (0.0%) |
| Education Instruction & Library | 0 (0.0%) | 2 (100.0%) |
| Arts, Media & Entertainment | 0 (0.0%) | 0 (0.0%) |
| Health Diagnosing & Treating | 0 (0.0%) | 1 (100.0%) |
| Health Technologists | 0 (0.0%) | 1 (100.0%) |
| Total (Category) | 8 (47.1%) | 9 (52.9%) |
| Total (Overall) | 21 (52.5%) | 19 (47.5%) |
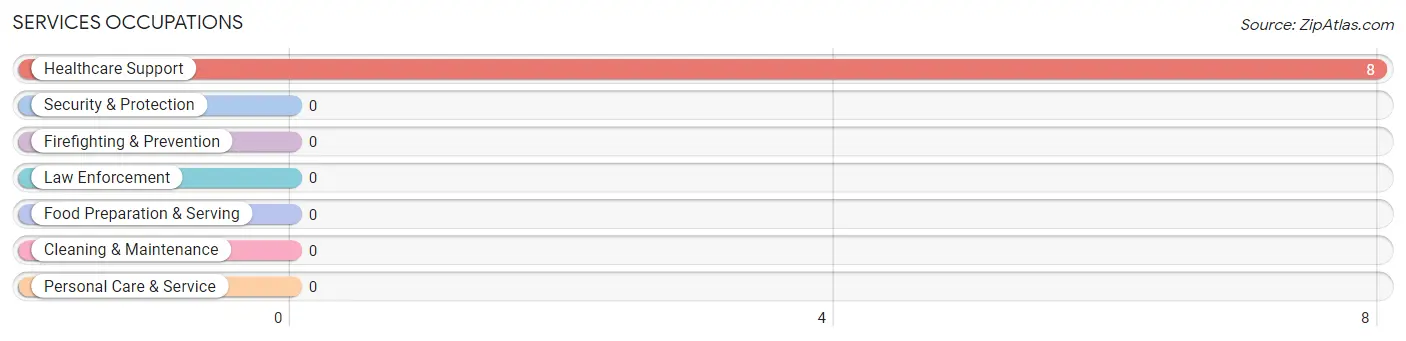
Services Occupations
The most common Services occupations in Sylvester are , and Healthcare Support (8 | 20.0%).
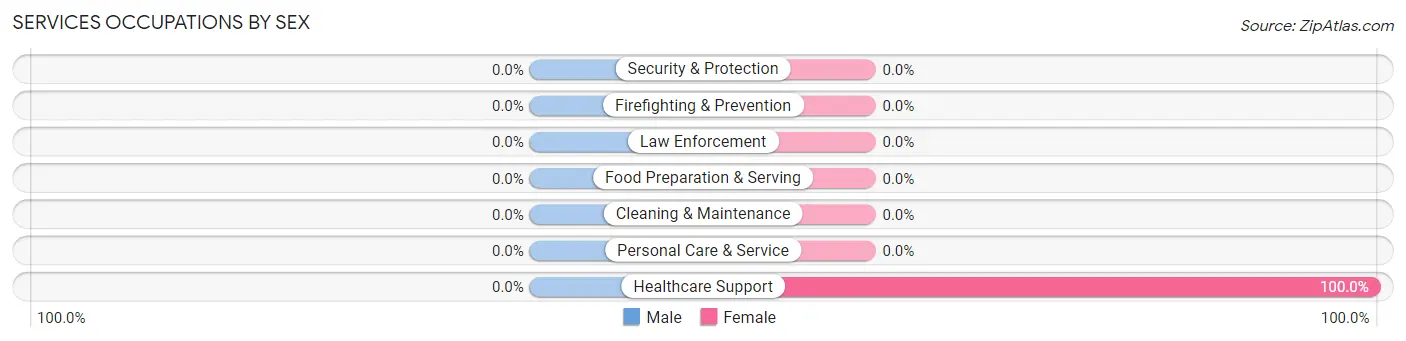
Services Occupations by Sex
| Occupation | Male | Female |
| Healthcare Support | 0 (0.0%) | 8 (100.0%) |
| Security & Protection | 0 (0.0%) | 0 (0.0%) |
| Firefighting & Prevention | 0 (0.0%) | 0 (0.0%) |
| Law Enforcement | 0 (0.0%) | 0 (0.0%) |
| Food Preparation & Serving | 0 (0.0%) | 0 (0.0%) |
| Cleaning & Maintenance | 0 (0.0%) | 0 (0.0%) |
| Personal Care & Service | 0 (0.0%) | 0 (0.0%) |
| Total (Category) | 0 (0.0%) | 8 (100.0%) |
| Total (Overall) | 21 (52.5%) | 19 (47.5%) |
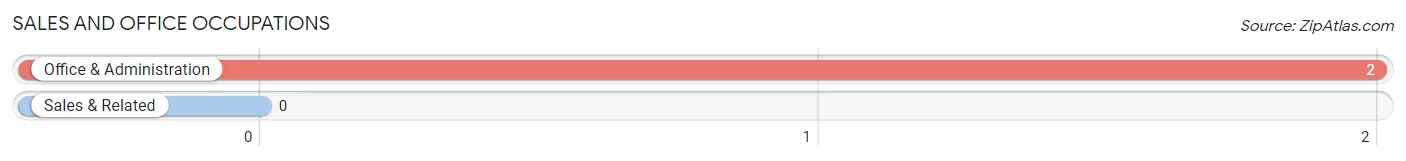
Sales and Office Occupations
The most common Sales and Office occupations in Sylvester are , and Office & Administration (2 | 5.0%).
Sales and Office Occupations by Sex
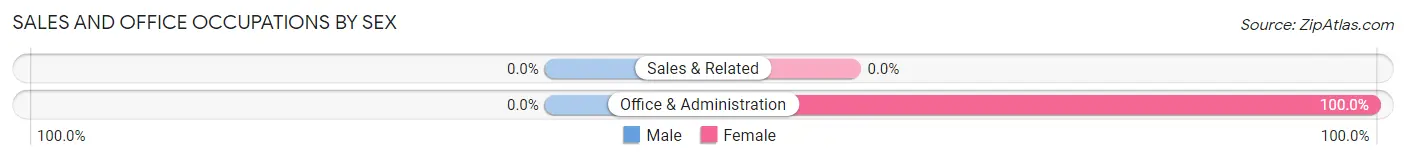
| Occupation | Male | Female |
| Sales & Related | 0 (0.0%) | 0 (0.0%) |
| Office & Administration | 0 (0.0%) | 2 (100.0%) |
| Total (Category) | 0 (0.0%) | 2 (100.0%) |
| Total (Overall) | 21 (52.5%) | 19 (47.5%) |
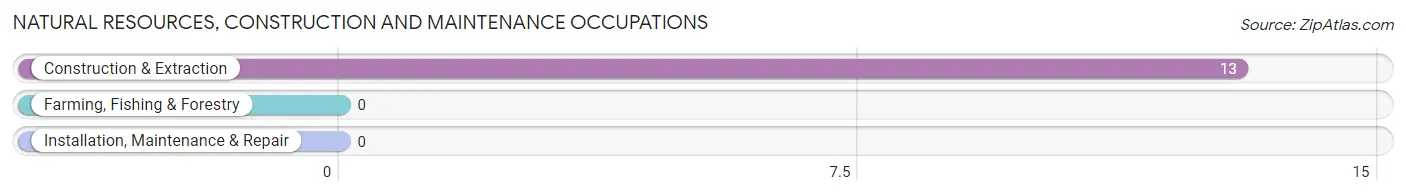
Natural Resources, Construction and Maintenance Occupations
The most common Natural Resources, Construction and Maintenance occupations in Sylvester are , and Construction & Extraction (13 | 32.5%).
Natural Resources, Construction and Maintenance Occupations by Sex
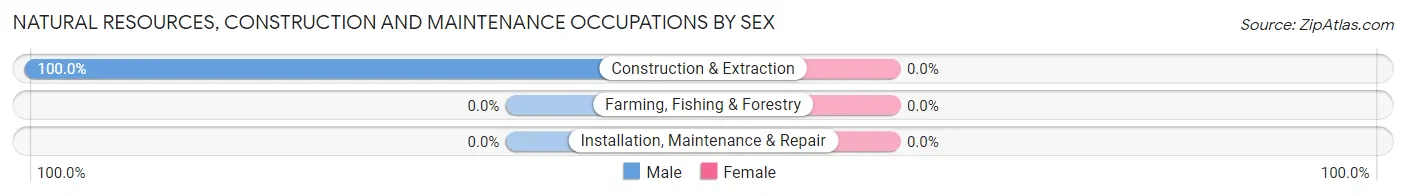
| Occupation | Male | Female |
| Farming, Fishing & Forestry | 0 (0.0%) | 0 (0.0%) |
| Construction & Extraction | 13 (100.0%) | 0 (0.0%) |
| Installation, Maintenance & Repair | 0 (0.0%) | 0 (0.0%) |
| Total (Category) | 13 (100.0%) | 0 (0.0%) |
| Total (Overall) | 21 (52.5%) | 19 (47.5%) |
Production, Transportation and Moving Occupations
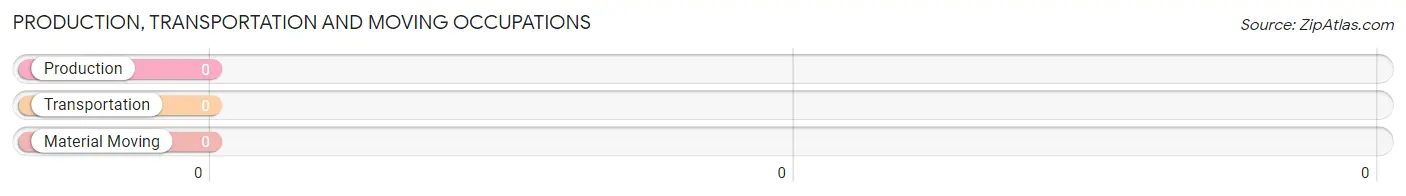
Production, Transportation and Moving Occupations by Sex
| Occupation | Male | Female |
| Production | 0 (0.0%) | 0 (0.0%) |
| Transportation | 0 (0.0%) | 0 (0.0%) |
| Material Moving | 0 (0.0%) | 0 (0.0%) |
| Total (Category) | 0 (0.0%) | 0 (0.0%) |
| Total (Overall) | 21 (52.5%) | 19 (47.5%) |
Employment Industries by Sex in Sylvester
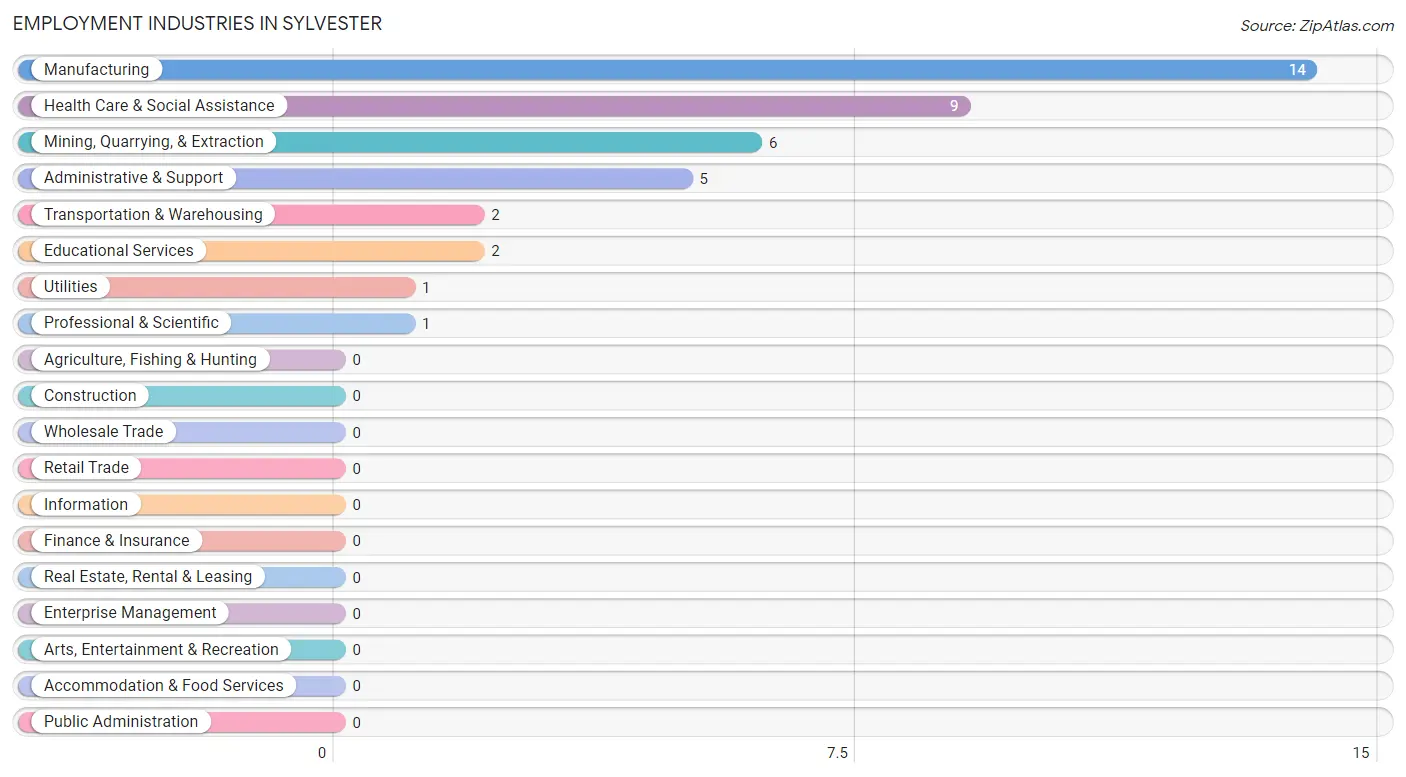
Employment Industries in Sylvester
The major employment industries in Sylvester include Manufacturing (14 | 35.0%), Health Care & Social Assistance (9 | 22.5%), Mining, Quarrying, & Extraction (6 | 15.0%), Administrative & Support (5 | 12.5%), and Transportation & Warehousing (2 | 5.0%).
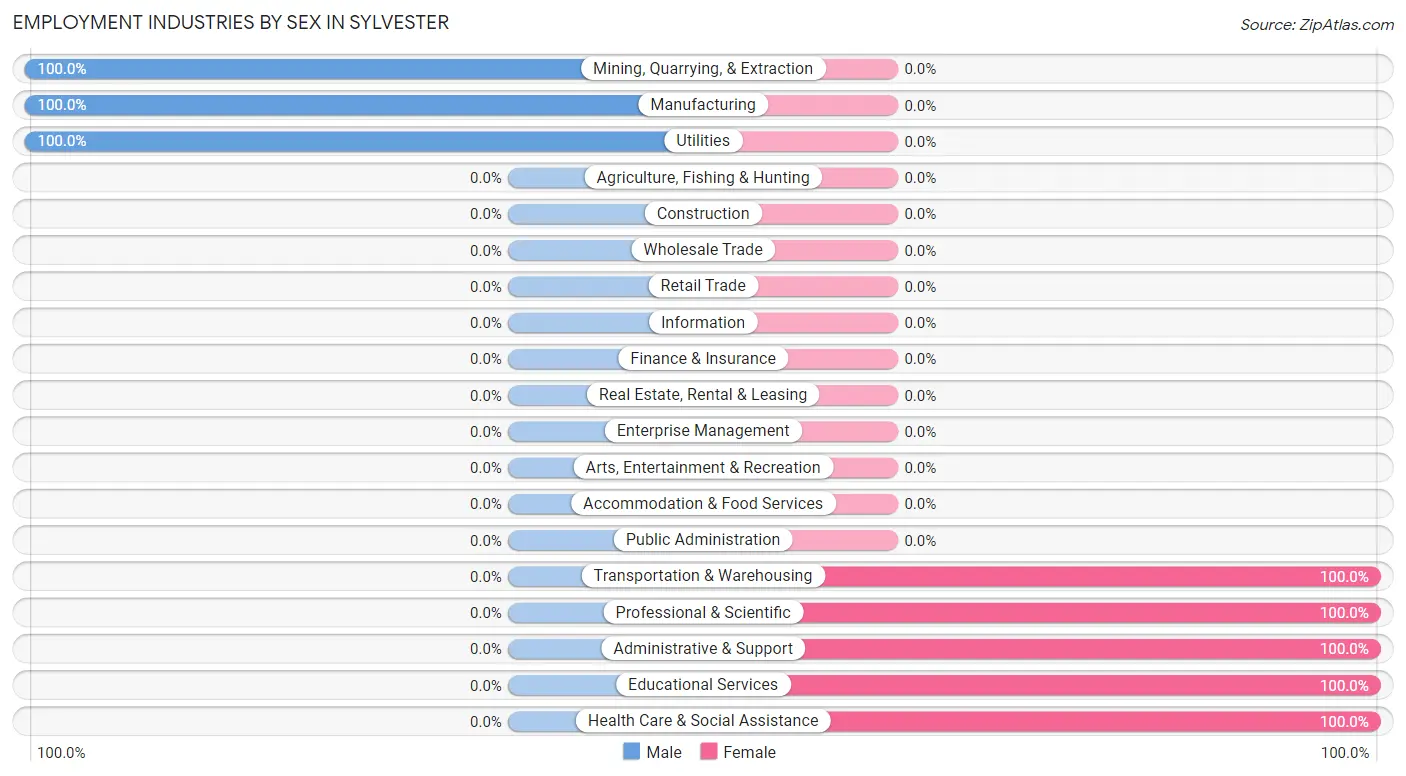
Employment Industries by Sex in Sylvester
The Sylvester industries that see more men than women are Mining, Quarrying, & Extraction (100.0%), Manufacturing (100.0%), and Utilities (100.0%), whereas the industries that tend to have a higher number of women are Transportation & Warehousing (100.0%), Professional & Scientific (100.0%), and Administrative & Support (100.0%).
| Industry | Male | Female |
| Agriculture, Fishing & Hunting | 0 (0.0%) | 0 (0.0%) |
| Mining, Quarrying, & Extraction | 6 (100.0%) | 0 (0.0%) |
| Construction | 0 (0.0%) | 0 (0.0%) |
| Manufacturing | 14 (100.0%) | 0 (0.0%) |
| Wholesale Trade | 0 (0.0%) | 0 (0.0%) |
| Retail Trade | 0 (0.0%) | 0 (0.0%) |
| Transportation & Warehousing | 0 (0.0%) | 2 (100.0%) |
| Utilities | 1 (100.0%) | 0 (0.0%) |
| Information | 0 (0.0%) | 0 (0.0%) |
| Finance & Insurance | 0 (0.0%) | 0 (0.0%) |
| Real Estate, Rental & Leasing | 0 (0.0%) | 0 (0.0%) |
| Professional & Scientific | 0 (0.0%) | 1 (100.0%) |
| Enterprise Management | 0 (0.0%) | 0 (0.0%) |
| Administrative & Support | 0 (0.0%) | 5 (100.0%) |
| Educational Services | 0 (0.0%) | 2 (100.0%) |
| Health Care & Social Assistance | 0 (0.0%) | 9 (100.0%) |
| Arts, Entertainment & Recreation | 0 (0.0%) | 0 (0.0%) |
| Accommodation & Food Services | 0 (0.0%) | 0 (0.0%) |
| Public Administration | 0 (0.0%) | 0 (0.0%) |
| Total | 21 (52.5%) | 19 (47.5%) |
Education in Sylvester
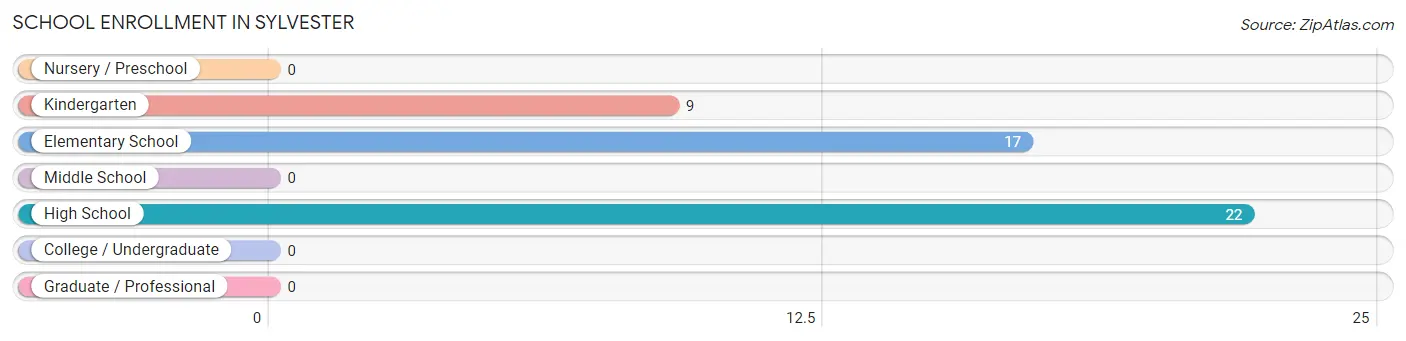
School Enrollment in Sylvester
The most common levels of schooling among the 48 students in Sylvester are high school (22 | 45.8%), elementary school (17 | 35.4%), and kindergarten (9 | 18.8%).
| School Level | # Students | % Students |
| Nursery / Preschool | 0 | 0.0% |
| Kindergarten | 9 | 18.8% |
| Elementary School | 17 | 35.4% |
| Middle School | 0 | 0.0% |
| High School | 22 | 45.8% |
| College / Undergraduate | 0 | 0.0% |
| Graduate / Professional | 0 | 0.0% |
| Total | 48 | 100.0% |
School Enrollment by Age by Funding Source in Sylvester
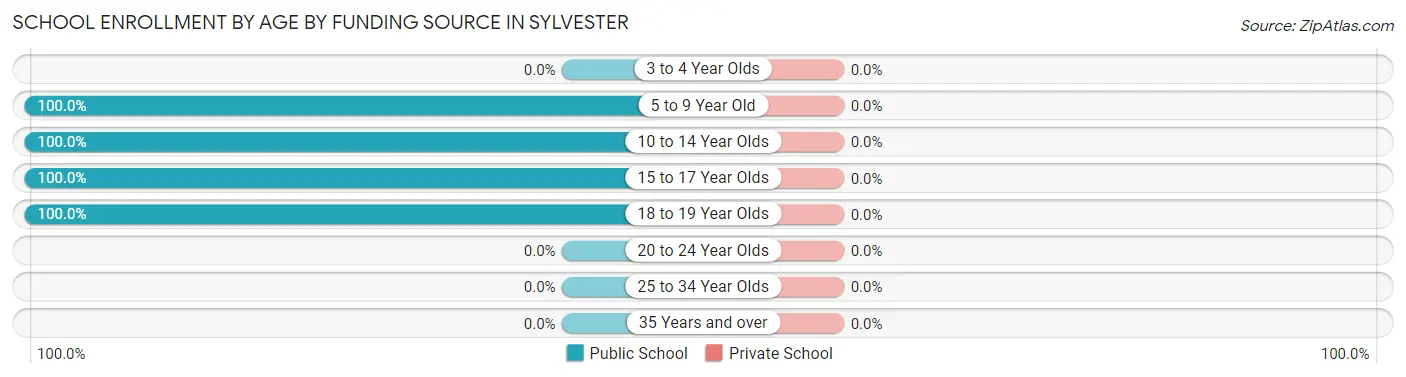
| Age Bracket | Public School | Private School |
| 3 to 4 Year Olds | 0 (0.0%) | 0 (0.0%) |
| 5 to 9 Year Old | 19 (100.0%) | 0 (0.0%) |
| 10 to 14 Year Olds | 7 (100.0%) | 0 (0.0%) |
| 15 to 17 Year Olds | 7 (100.0%) | 0 (0.0%) |
| 18 to 19 Year Olds | 15 (100.0%) | 0 (0.0%) |
| 20 to 24 Year Olds | 0 (0.0%) | 0 (0.0%) |
| 25 to 34 Year Olds | 0 (0.0%) | 0 (0.0%) |
| 35 Years and over | 0 (0.0%) | 0 (0.0%) |
| Total | 48 (100.0%) | 0 (0.0%) |
Educational Attainment by Field of Study in Sylvester
Business (15 | 38.5%), education (15 | 38.5%), science & technology (5 | 12.8%), and liberal arts & history (4 | 10.3%) are the most common fields of study among 39 individuals in Sylvester who have obtained a bachelor's degree or higher.
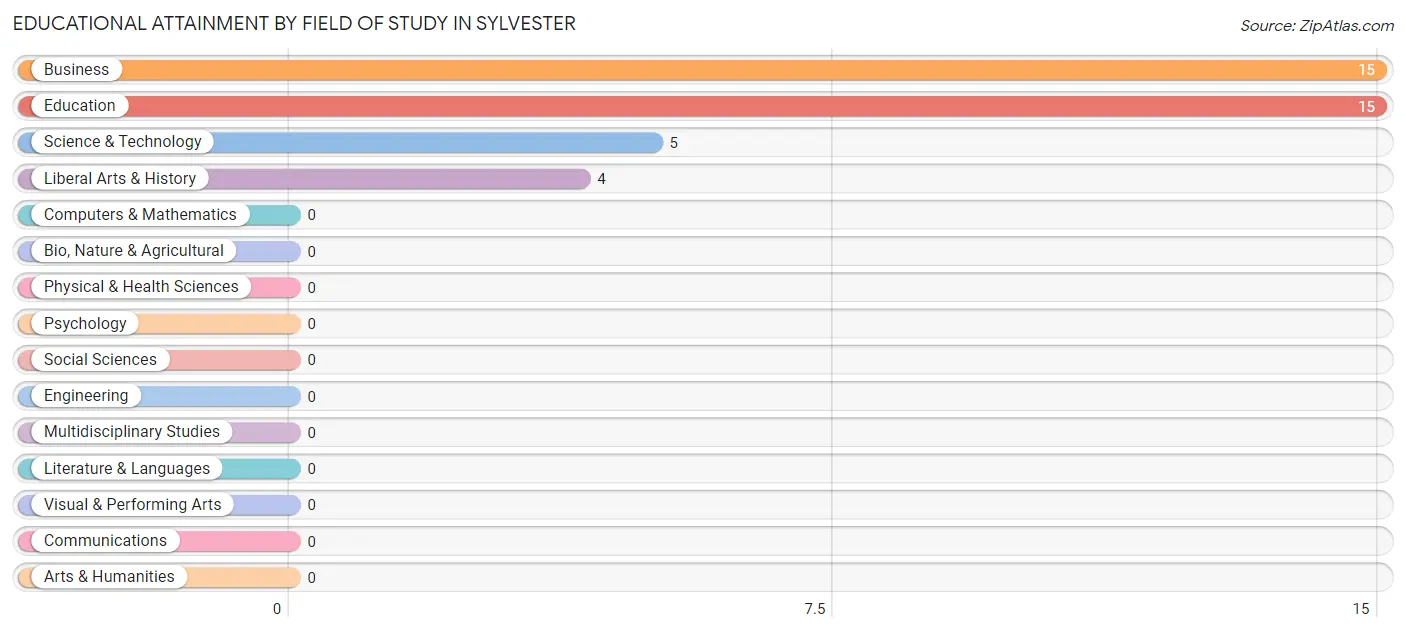
| Field of Study | # Graduates | % Graduates |
| Computers & Mathematics | 0 | 0.0% |
| Bio, Nature & Agricultural | 0 | 0.0% |
| Physical & Health Sciences | 0 | 0.0% |
| Psychology | 0 | 0.0% |
| Social Sciences | 0 | 0.0% |
| Engineering | 0 | 0.0% |
| Multidisciplinary Studies | 0 | 0.0% |
| Science & Technology | 5 | 12.8% |
| Business | 15 | 38.5% |
| Education | 15 | 38.5% |
| Literature & Languages | 0 | 0.0% |
| Liberal Arts & History | 4 | 10.3% |
| Visual & Performing Arts | 0 | 0.0% |
| Communications | 0 | 0.0% |
| Arts & Humanities | 0 | 0.0% |
| Total | 39 | 100.0% |
Transportation & Commute in Sylvester
Vehicle Availability by Sex in Sylvester
The most prevalent vehicle ownership categories in Sylvester are males with 3 vehicles (7, accounting for 50.0%) and females with 3 vehicles (0, making up 41.2%).
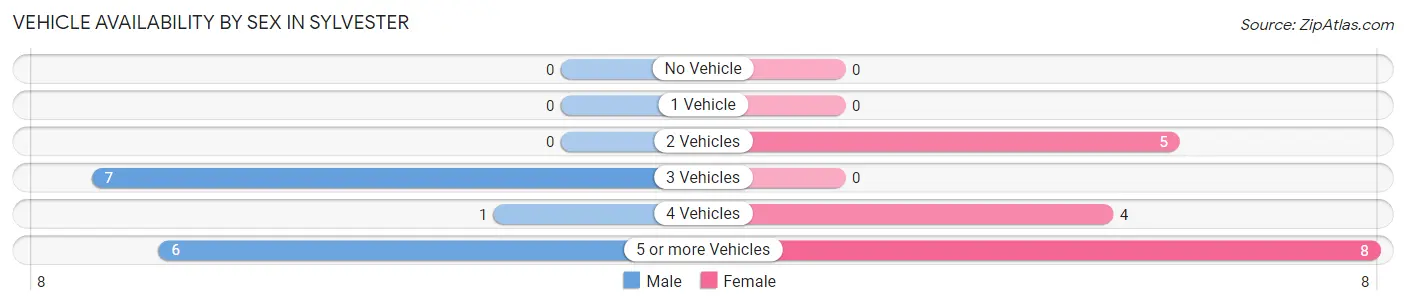
| Vehicles Available | Male | Female |
| No Vehicle | 0 (0.0%) | 0 (0.0%) |
| 1 Vehicle | 0 (0.0%) | 0 (0.0%) |
| 2 Vehicles | 0 (0.0%) | 5 (29.4%) |
| 3 Vehicles | 7 (50.0%) | 0 (0.0%) |
| 4 Vehicles | 1 (7.1%) | 4 (23.5%) |
| 5 or more Vehicles | 6 (42.9%) | 8 (47.1%) |
| Total | 14 (100.0%) | 17 (100.0%) |
Commute Time in Sylvester
The most frequently occuring commute durations in Sylvester are 45 to 59 minutes (15 commuters, 65.2%), 30 to 34 minutes (6 commuters, 26.1%), and 60 to 89 minutes (2 commuters, 8.7%).
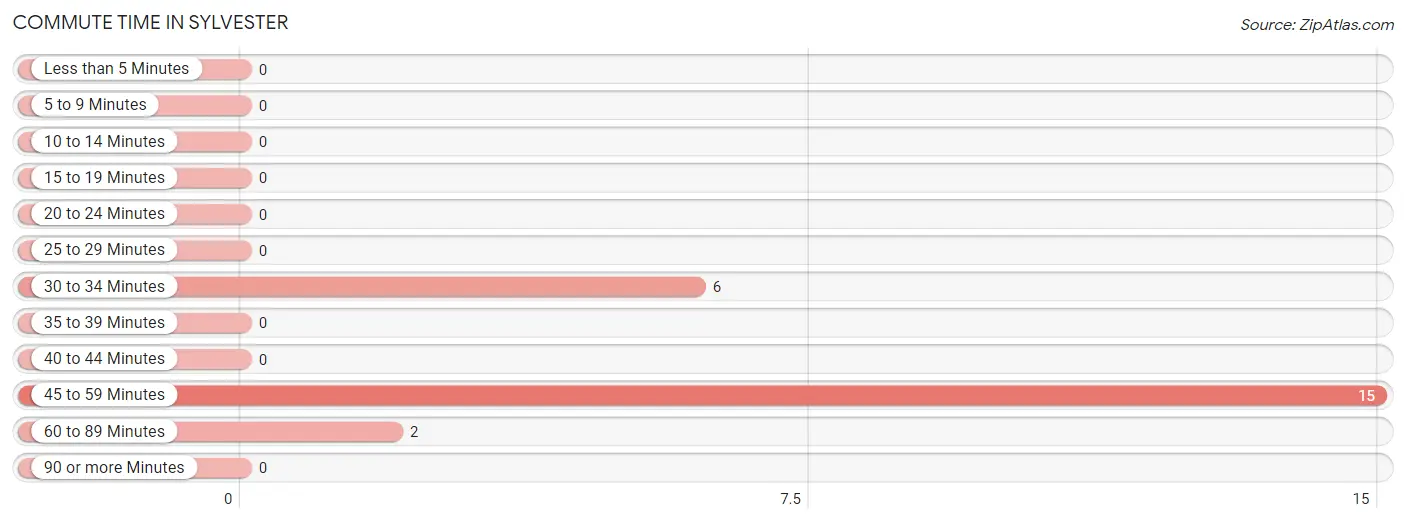
| Commute Time | # Commuters | % Commuters |
| Less than 5 Minutes | 0 | 0.0% |
| 5 to 9 Minutes | 0 | 0.0% |
| 10 to 14 Minutes | 0 | 0.0% |
| 15 to 19 Minutes | 0 | 0.0% |
| 20 to 24 Minutes | 0 | 0.0% |
| 25 to 29 Minutes | 0 | 0.0% |
| 30 to 34 Minutes | 6 | 26.1% |
| 35 to 39 Minutes | 0 | 0.0% |
| 40 to 44 Minutes | 0 | 0.0% |
| 45 to 59 Minutes | 15 | 65.2% |
| 60 to 89 Minutes | 2 | 8.7% |
| 90 or more Minutes | 0 | 0.0% |
Commute Time by Sex in Sylvester
The most common commute times in Sylvester are 45 to 59 minutes (8 commuters, 57.1%) for males and 45 to 59 minutes (7 commuters, 77.8%) for females.
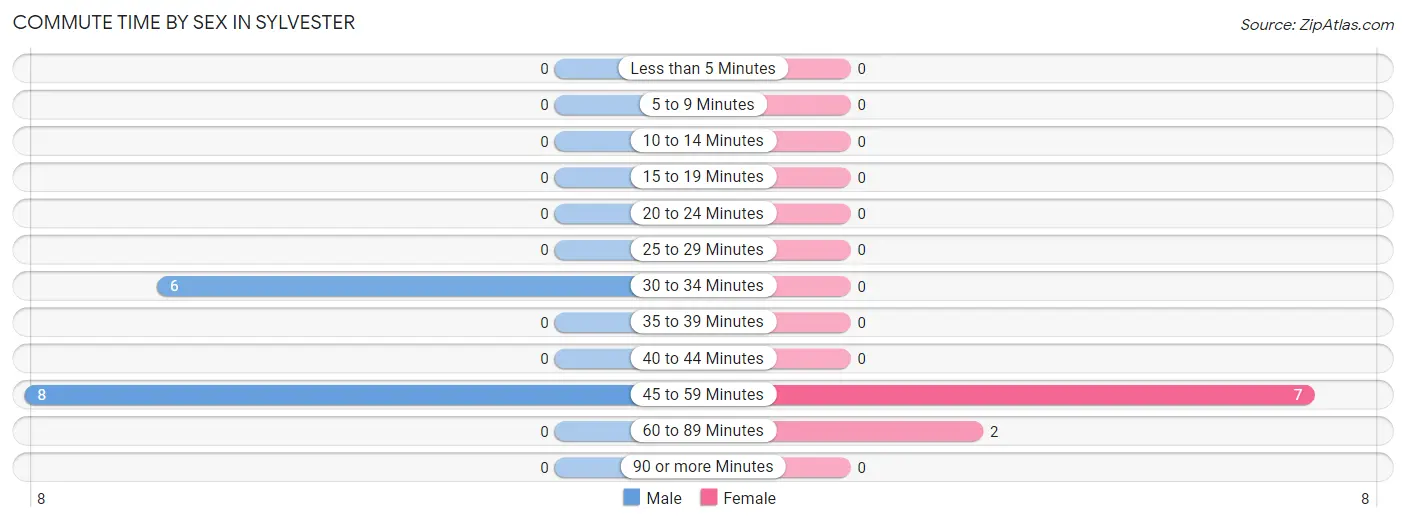
| Commute Time | Male | Female |
| Less than 5 Minutes | 0 (0.0%) | 0 (0.0%) |
| 5 to 9 Minutes | 0 (0.0%) | 0 (0.0%) |
| 10 to 14 Minutes | 0 (0.0%) | 0 (0.0%) |
| 15 to 19 Minutes | 0 (0.0%) | 0 (0.0%) |
| 20 to 24 Minutes | 0 (0.0%) | 0 (0.0%) |
| 25 to 29 Minutes | 0 (0.0%) | 0 (0.0%) |
| 30 to 34 Minutes | 6 (42.9%) | 0 (0.0%) |
| 35 to 39 Minutes | 0 (0.0%) | 0 (0.0%) |
| 40 to 44 Minutes | 0 (0.0%) | 0 (0.0%) |
| 45 to 59 Minutes | 8 (57.1%) | 7 (77.8%) |
| 60 to 89 Minutes | 0 (0.0%) | 2 (22.2%) |
| 90 or more Minutes | 0 (0.0%) | 0 (0.0%) |
Time of Departure to Work by Sex in Sylvester
The most frequent times of departure to work in Sylvester are 5:30 AM to 5:59 AM (7, 50.0%) for males and 6:00 AM to 6:29 AM (5, 55.6%) for females.
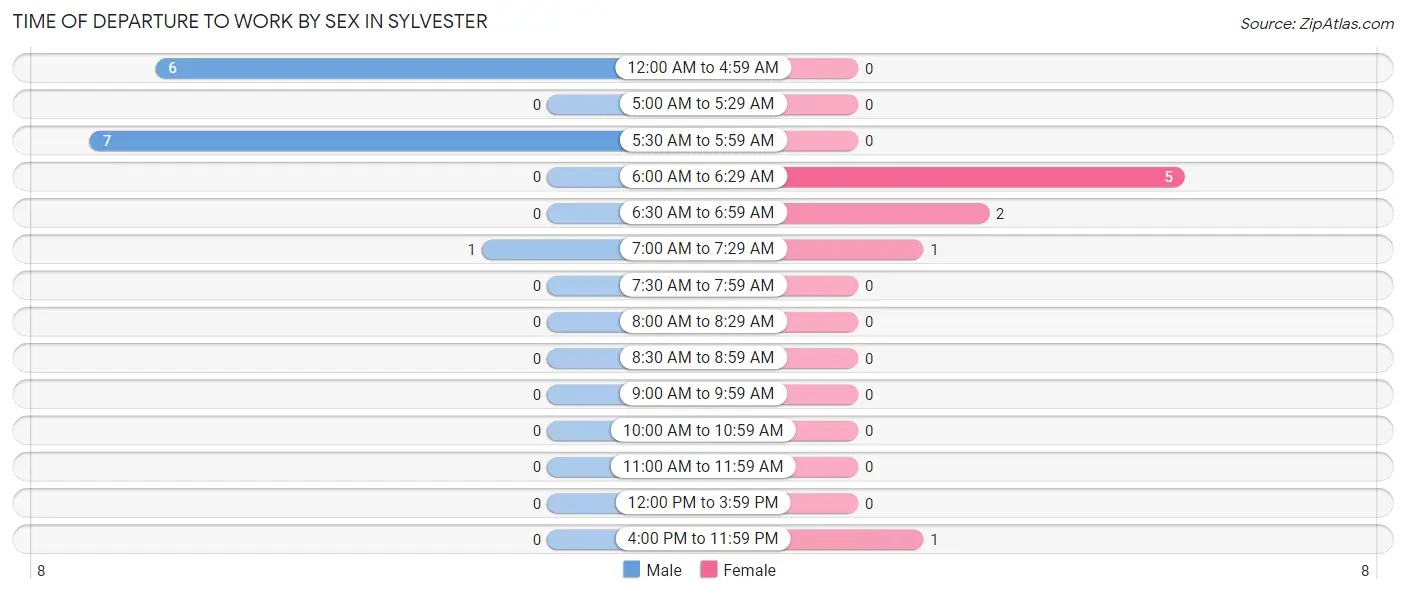
| Time of Departure | Male | Female |
| 12:00 AM to 4:59 AM | 6 (42.9%) | 0 (0.0%) |
| 5:00 AM to 5:29 AM | 0 (0.0%) | 0 (0.0%) |
| 5:30 AM to 5:59 AM | 7 (50.0%) | 0 (0.0%) |
| 6:00 AM to 6:29 AM | 0 (0.0%) | 5 (55.6%) |
| 6:30 AM to 6:59 AM | 0 (0.0%) | 2 (22.2%) |
| 7:00 AM to 7:29 AM | 1 (7.1%) | 1 (11.1%) |
| 7:30 AM to 7:59 AM | 0 (0.0%) | 0 (0.0%) |
| 8:00 AM to 8:29 AM | 0 (0.0%) | 0 (0.0%) |
| 8:30 AM to 8:59 AM | 0 (0.0%) | 0 (0.0%) |
| 9:00 AM to 9:59 AM | 0 (0.0%) | 0 (0.0%) |
| 10:00 AM to 10:59 AM | 0 (0.0%) | 0 (0.0%) |
| 11:00 AM to 11:59 AM | 0 (0.0%) | 0 (0.0%) |
| 12:00 PM to 3:59 PM | 0 (0.0%) | 0 (0.0%) |
| 4:00 PM to 11:59 PM | 0 (0.0%) | 1 (11.1%) |
| Total | 14 (100.0%) | 9 (100.0%) |
Housing Occupancy in Sylvester
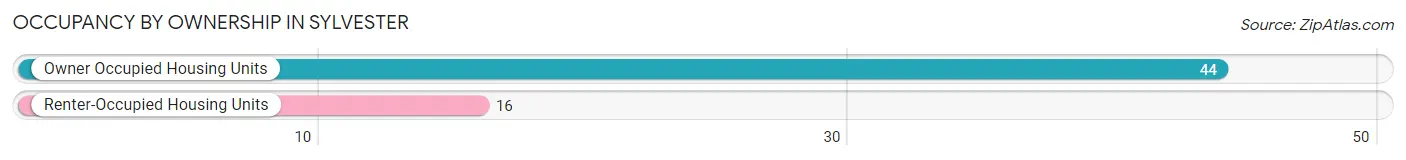
Occupancy by Ownership in Sylvester
Of the total 60 dwellings in Sylvester, owner-occupied units account for 44 (73.3%), while renter-occupied units make up 16 (26.7%).
| Occupancy | # Housing Units | % Housing Units |
| Owner Occupied Housing Units | 44 | 73.3% |
| Renter-Occupied Housing Units | 16 | 26.7% |
| Total Occupied Housing Units | 60 | 100.0% |
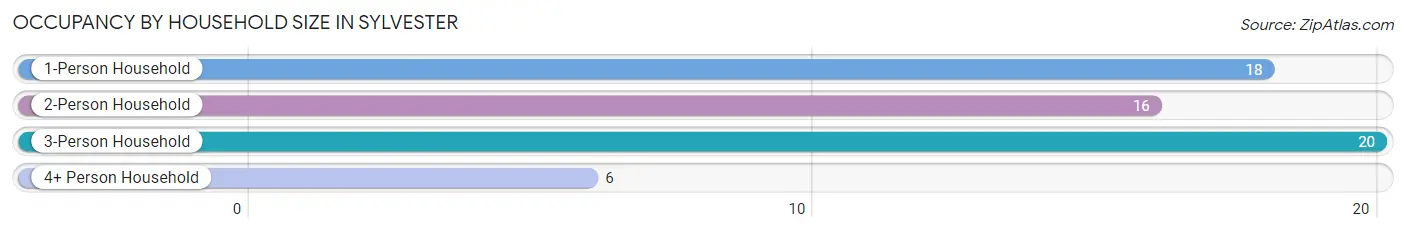
Occupancy by Household Size in Sylvester
| Household Size | # Housing Units | % Housing Units |
| 1-Person Household | 18 | 30.0% |
| 2-Person Household | 16 | 26.7% |
| 3-Person Household | 20 | 33.3% |
| 4+ Person Household | 6 | 10.0% |
| Total Housing Units | 60 | 100.0% |
Occupancy by Ownership by Household Size in Sylvester
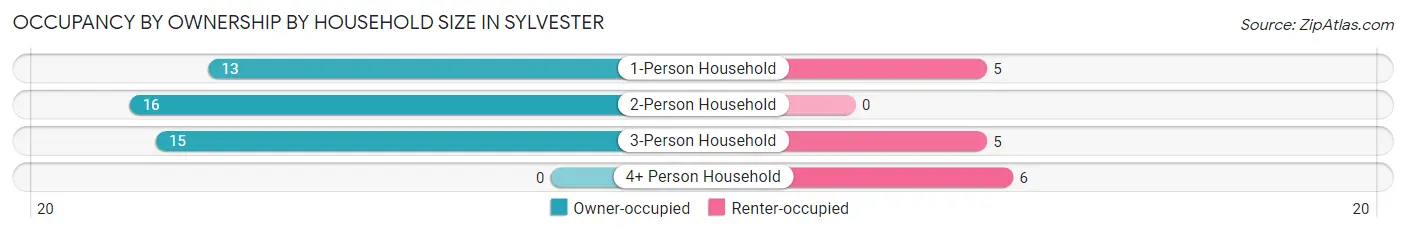
| Household Size | Owner-occupied | Renter-occupied |
| 1-Person Household | 13 (72.2%) | 5 (27.8%) |
| 2-Person Household | 16 (100.0%) | 0 (0.0%) |
| 3-Person Household | 15 (75.0%) | 5 (25.0%) |
| 4+ Person Household | 0 (0.0%) | 6 (100.0%) |
| Total Housing Units | 44 (73.3%) | 16 (26.7%) |
Occupancy by Educational Attainment in Sylvester
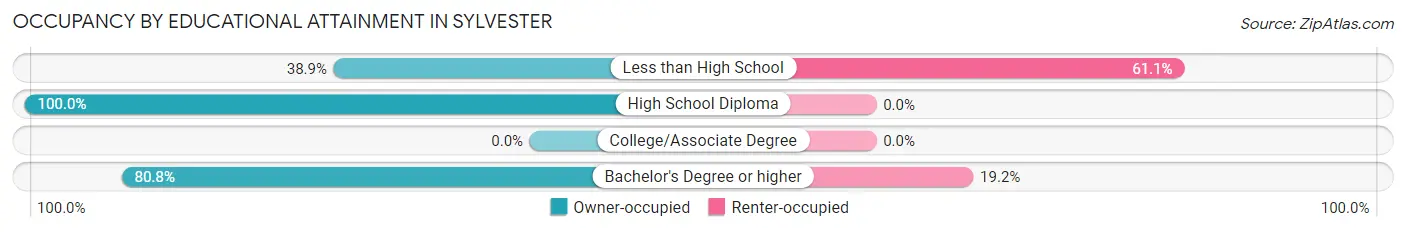
| Household Size | Owner-occupied | Renter-occupied |
| Less than High School | 7 (38.9%) | 11 (61.1%) |
| High School Diploma | 16 (100.0%) | 0 (0.0%) |
| College/Associate Degree | 0 (0.0%) | 0 (0.0%) |
| Bachelor's Degree or higher | 21 (80.8%) | 5 (19.2%) |
Occupancy by Age of Householder in Sylvester
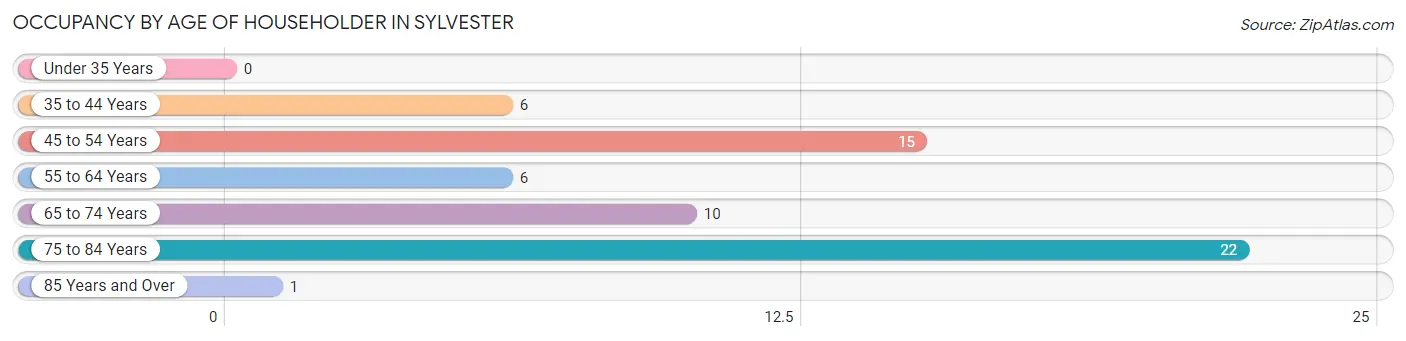
| Age Bracket | # Households | % Households |
| Under 35 Years | 0 | 0.0% |
| 35 to 44 Years | 6 | 10.0% |
| 45 to 54 Years | 15 | 25.0% |
| 55 to 64 Years | 6 | 10.0% |
| 65 to 74 Years | 10 | 16.7% |
| 75 to 84 Years | 22 | 36.7% |
| 85 Years and Over | 1 | 1.7% |
| Total | 60 | 100.0% |
Housing Finances in Sylvester
Median Income by Occupancy in Sylvester
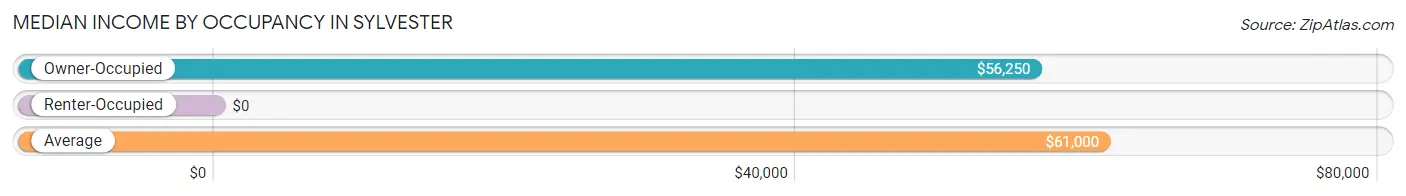
| Occupancy Type | # Households | Median Income |
| Owner-Occupied | 44 (73.3%) | $56,250 |
| Renter-Occupied | 16 (26.7%) | $0 |
| Average | 60 (100.0%) | $61,000 |
Occupancy by Householder Income Bracket in Sylvester
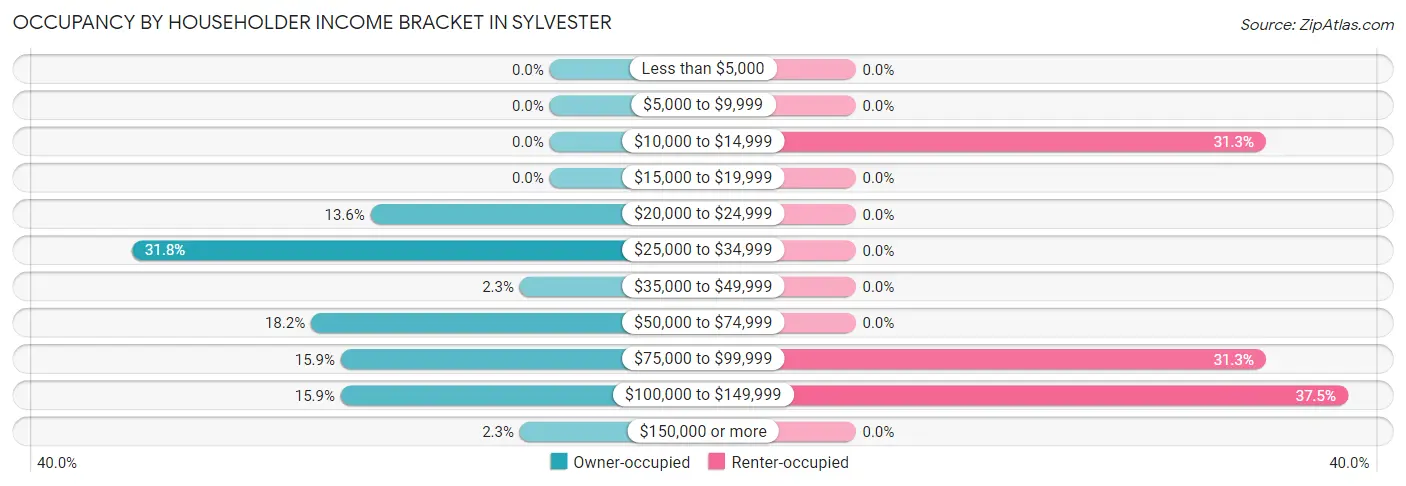
| Income Bracket | Owner-occupied | Renter-occupied |
| Less than $5,000 | 0 (0.0%) | 0 (0.0%) |
| $5,000 to $9,999 | 0 (0.0%) | 0 (0.0%) |
| $10,000 to $14,999 | 0 (0.0%) | 5 (31.2%) |
| $15,000 to $19,999 | 0 (0.0%) | 0 (0.0%) |
| $20,000 to $24,999 | 6 (13.6%) | 0 (0.0%) |
| $25,000 to $34,999 | 14 (31.8%) | 0 (0.0%) |
| $35,000 to $49,999 | 1 (2.3%) | 0 (0.0%) |
| $50,000 to $74,999 | 8 (18.2%) | 0 (0.0%) |
| $75,000 to $99,999 | 7 (15.9%) | 5 (31.2%) |
| $100,000 to $149,999 | 7 (15.9%) | 6 (37.5%) |
| $150,000 or more | 1 (2.3%) | 0 (0.0%) |
| Total | 44 (100.0%) | 16 (100.0%) |
Monthly Housing Cost Tiers in Sylvester
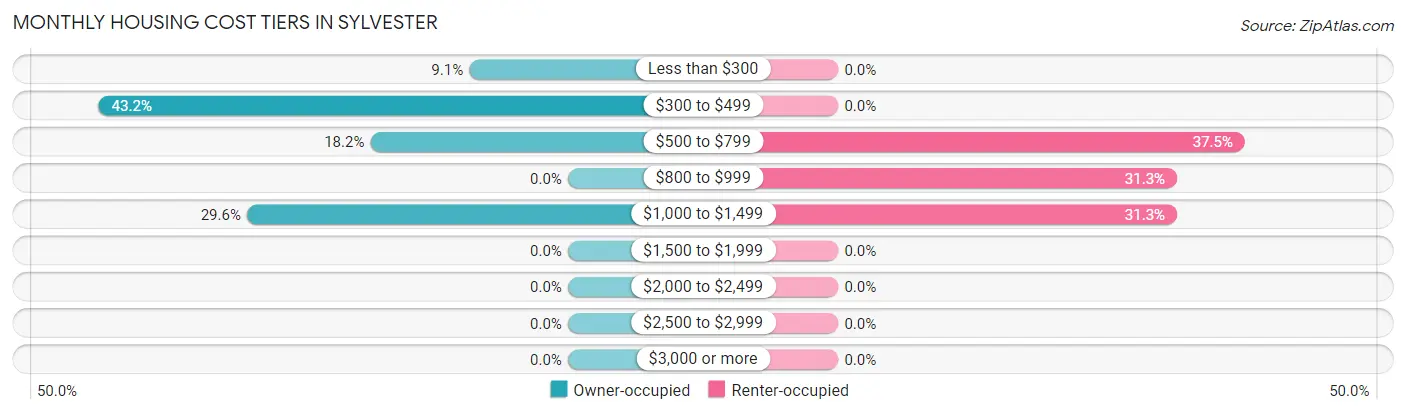
| Monthly Cost | Owner-occupied | Renter-occupied |
| Less than $300 | 4 (9.1%) | 0 (0.0%) |
| $300 to $499 | 19 (43.2%) | 0 (0.0%) |
| $500 to $799 | 8 (18.2%) | 6 (37.5%) |
| $800 to $999 | 0 (0.0%) | 5 (31.2%) |
| $1,000 to $1,499 | 13 (29.5%) | 5 (31.2%) |
| $1,500 to $1,999 | 0 (0.0%) | 0 (0.0%) |
| $2,000 to $2,499 | 0 (0.0%) | 0 (0.0%) |
| $2,500 to $2,999 | 0 (0.0%) | 0 (0.0%) |
| $3,000 or more | 0 (0.0%) | 0 (0.0%) |
| Total | 44 (100.0%) | 16 (100.0%) |
Physical Housing Characteristics in Sylvester
Housing Structures in Sylvester
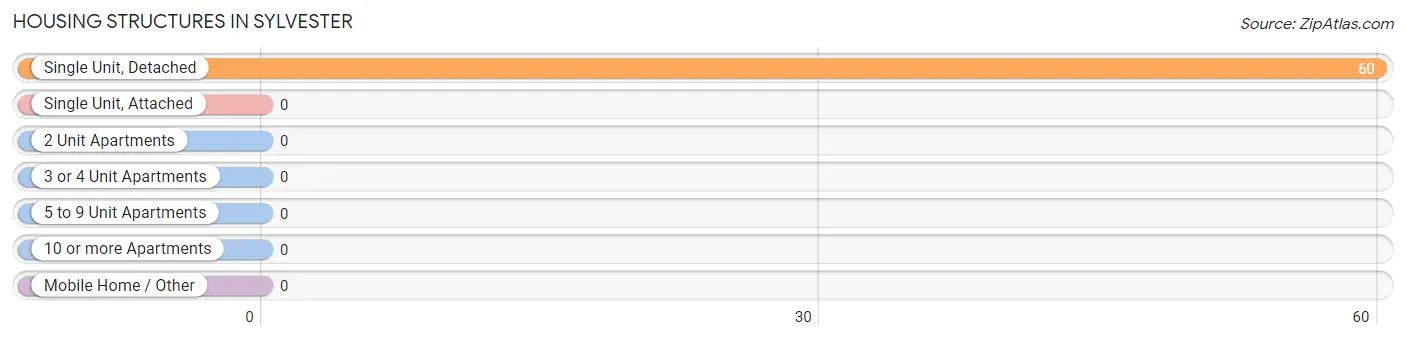
| Structure Type | # Housing Units | % Housing Units |
| Single Unit, Detached | 60 | 100.0% |
| Single Unit, Attached | 0 | 0.0% |
| 2 Unit Apartments | 0 | 0.0% |
| 3 or 4 Unit Apartments | 0 | 0.0% |
| 5 to 9 Unit Apartments | 0 | 0.0% |
| 10 or more Apartments | 0 | 0.0% |
| Mobile Home / Other | 0 | 0.0% |
| Total | 60 | 100.0% |
Housing Structures by Occupancy in Sylvester
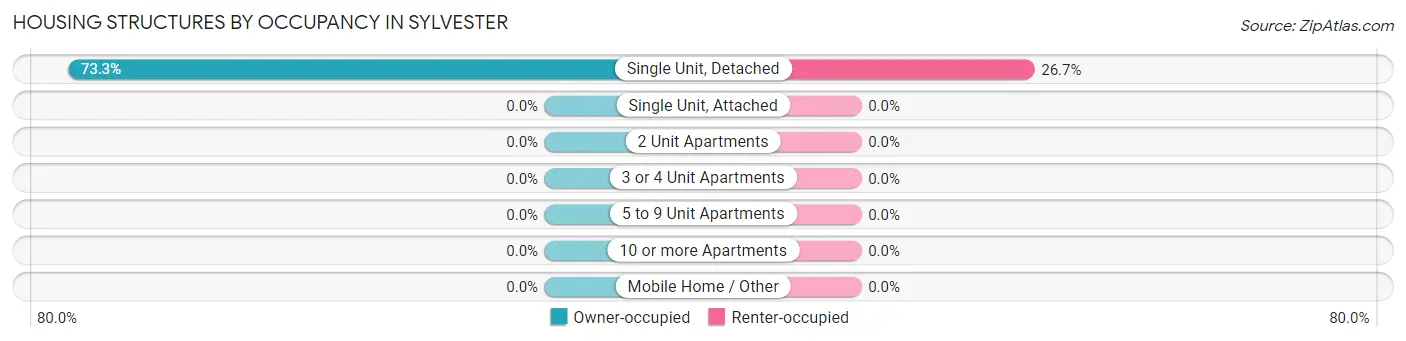
| Structure Type | Owner-occupied | Renter-occupied |
| Single Unit, Detached | 44 (73.3%) | 16 (26.7%) |
| Single Unit, Attached | 0 (0.0%) | 0 (0.0%) |
| 2 Unit Apartments | 0 (0.0%) | 0 (0.0%) |
| 3 or 4 Unit Apartments | 0 (0.0%) | 0 (0.0%) |
| 5 to 9 Unit Apartments | 0 (0.0%) | 0 (0.0%) |
| 10 or more Apartments | 0 (0.0%) | 0 (0.0%) |
| Mobile Home / Other | 0 (0.0%) | 0 (0.0%) |
| Total | 44 (73.3%) | 16 (26.7%) |
Housing Structures by Number of Rooms in Sylvester
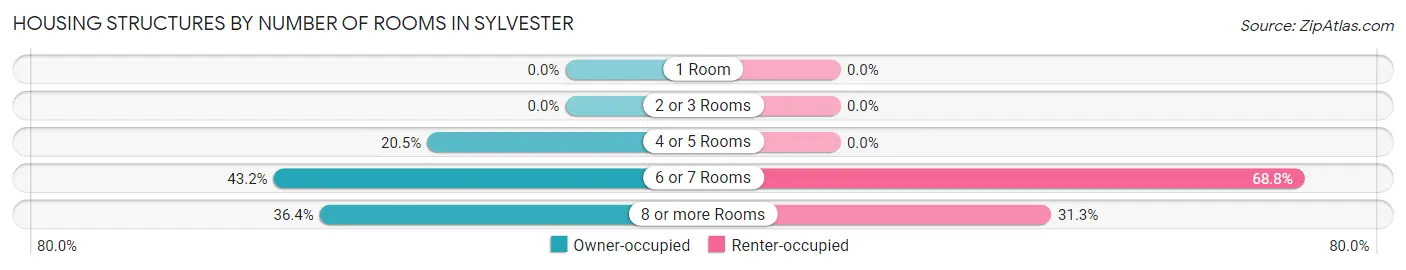
| Number of Rooms | Owner-occupied | Renter-occupied |
| 1 Room | 0 (0.0%) | 0 (0.0%) |
| 2 or 3 Rooms | 0 (0.0%) | 0 (0.0%) |
| 4 or 5 Rooms | 9 (20.4%) | 0 (0.0%) |
| 6 or 7 Rooms | 19 (43.2%) | 11 (68.8%) |
| 8 or more Rooms | 16 (36.4%) | 5 (31.2%) |
| Total | 44 (100.0%) | 16 (100.0%) |
Housing Structure by Heating Type in Sylvester
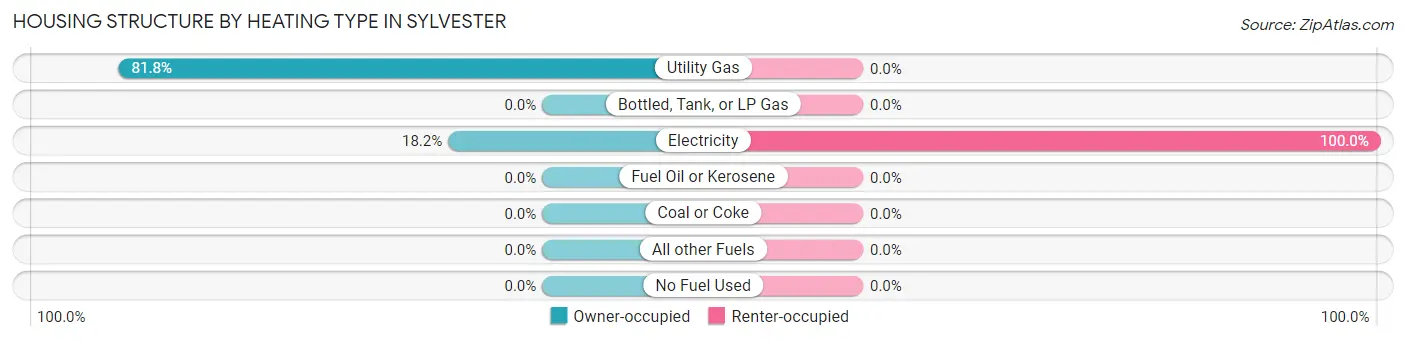
| Heating Type | Owner-occupied | Renter-occupied |
| Utility Gas | 36 (81.8%) | 0 (0.0%) |
| Bottled, Tank, or LP Gas | 0 (0.0%) | 0 (0.0%) |
| Electricity | 8 (18.2%) | 16 (100.0%) |
| Fuel Oil or Kerosene | 0 (0.0%) | 0 (0.0%) |
| Coal or Coke | 0 (0.0%) | 0 (0.0%) |
| All other Fuels | 0 (0.0%) | 0 (0.0%) |
| No Fuel Used | 0 (0.0%) | 0 (0.0%) |
| Total | 44 (100.0%) | 16 (100.0%) |
Household Vehicle Usage in Sylvester
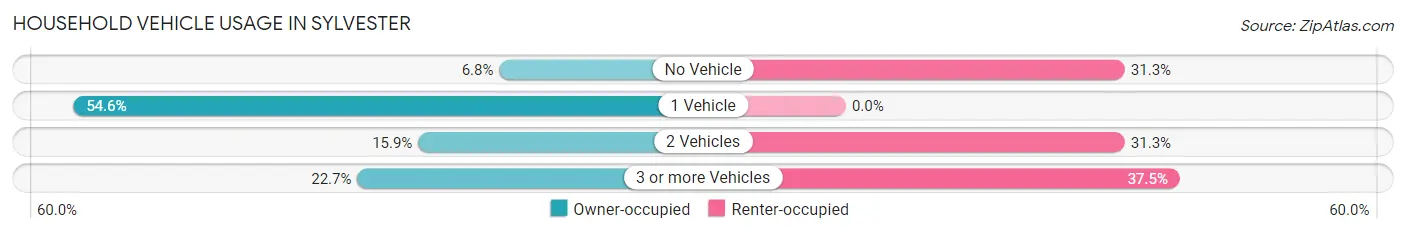
| Vehicles per Household | Owner-occupied | Renter-occupied |
| No Vehicle | 3 (6.8%) | 5 (31.2%) |
| 1 Vehicle | 24 (54.5%) | 0 (0.0%) |
| 2 Vehicles | 7 (15.9%) | 5 (31.2%) |
| 3 or more Vehicles | 10 (22.7%) | 6 (37.5%) |
| Total | 44 (100.0%) | 16 (100.0%) |
Real Estate & Mortgages in Sylvester
Real Estate and Mortgage Overview in Sylvester
| Characteristic | Without Mortgage | With Mortgage |
| Housing Units | 25 | 19 |
| Median Property Value | $78,300 | $129,700 |
| Median Household Income | $55,625 | $1 |
| Monthly Housing Costs | $328 | $0 |
| Real Estate Taxes | - | - |
Property Value by Mortgage Status in Sylvester
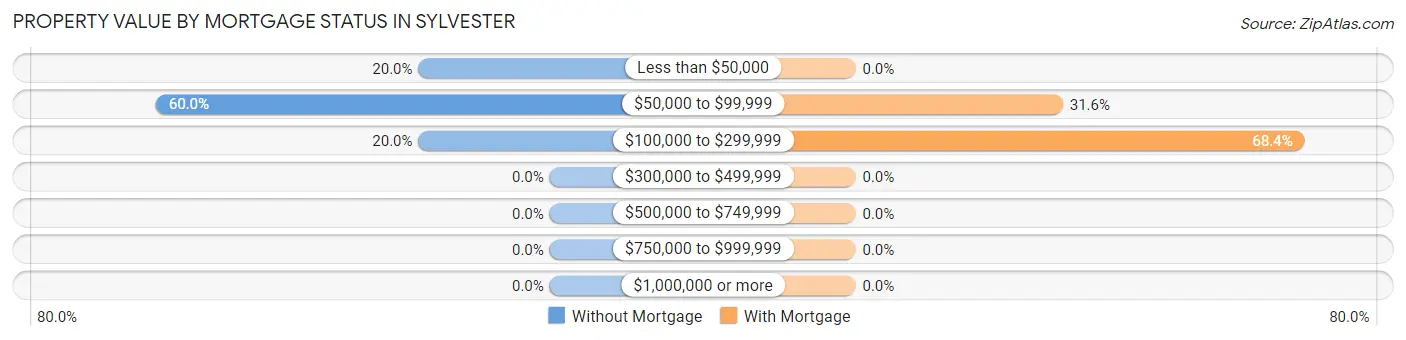
| Property Value | Without Mortgage | With Mortgage |
| Less than $50,000 | 5 (20.0%) | 0 (0.0%) |
| $50,000 to $99,999 | 15 (60.0%) | 6 (31.6%) |
| $100,000 to $299,999 | 5 (20.0%) | 13 (68.4%) |
| $300,000 to $499,999 | 0 (0.0%) | 0 (0.0%) |
| $500,000 to $749,999 | 0 (0.0%) | 0 (0.0%) |
| $750,000 to $999,999 | 0 (0.0%) | 0 (0.0%) |
| $1,000,000 or more | 0 (0.0%) | 0 (0.0%) |
| Total | 25 (100.0%) | 19 (100.0%) |
Household Income by Mortgage Status in Sylvester
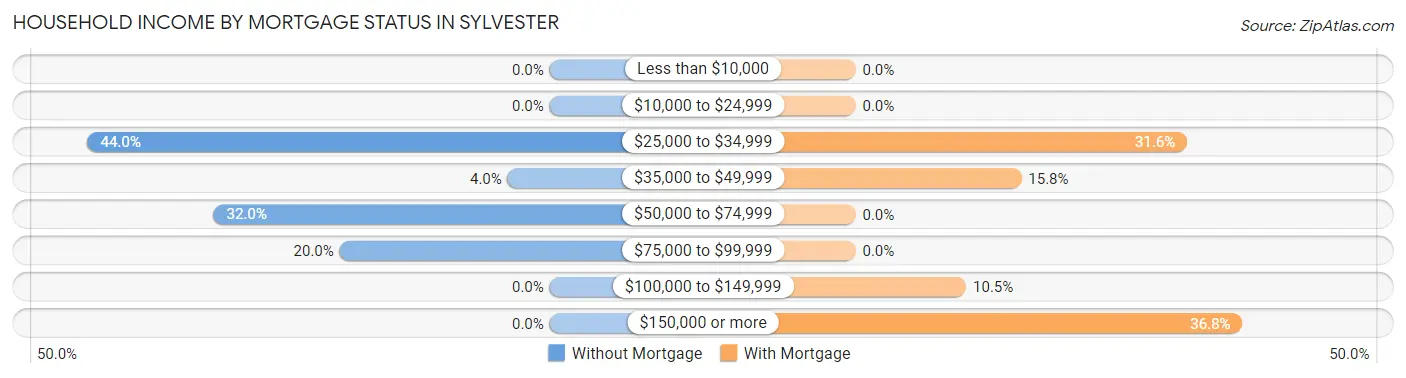
| Household Income | Without Mortgage | With Mortgage |
| Less than $10,000 | 0 (0.0%) | 0 (0.0%) |
| $10,000 to $24,999 | 0 (0.0%) | 0 (0.0%) |
| $25,000 to $34,999 | 11 (44.0%) | 6 (31.6%) |
| $35,000 to $49,999 | 1 (4.0%) | 3 (15.8%) |
| $50,000 to $74,999 | 8 (32.0%) | 0 (0.0%) |
| $75,000 to $99,999 | 5 (20.0%) | 0 (0.0%) |
| $100,000 to $149,999 | 0 (0.0%) | 2 (10.5%) |
| $150,000 or more | 0 (0.0%) | 7 (36.8%) |
| Total | 25 (100.0%) | 19 (100.0%) |
Property Value to Household Income Ratio in Sylvester
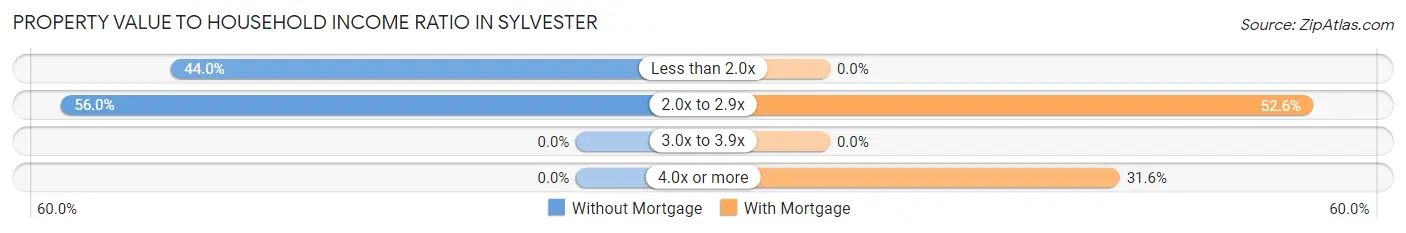
| Value-to-Income Ratio | Without Mortgage | With Mortgage |
| Less than 2.0x | 11 (44.0%) | 0 (0.0%) |
| 2.0x to 2.9x | 14 (56.0%) | 10 (52.6%) |
| 3.0x to 3.9x | 0 (0.0%) | 0 (0.0%) |
| 4.0x or more | 0 (0.0%) | 6 (31.6%) |
| Total | 25 (100.0%) | 19 (100.0%) |
Real Estate Taxes by Mortgage Status in Sylvester
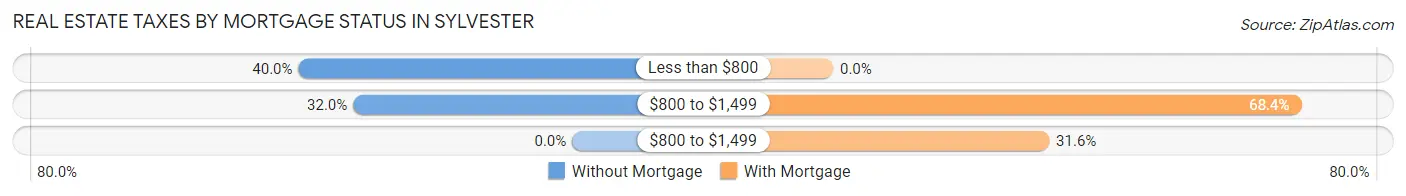
| Property Taxes | Without Mortgage | With Mortgage |
| Less than $800 | 10 (40.0%) | 0 (0.0%) |
| $800 to $1,499 | 8 (32.0%) | 13 (68.4%) |
| $800 to $1,499 | 0 (0.0%) | 6 (31.6%) |
| Total | 25 (100.0%) | 19 (100.0%) |
Health & Disability in Sylvester
Health Insurance Coverage by Age in Sylvester
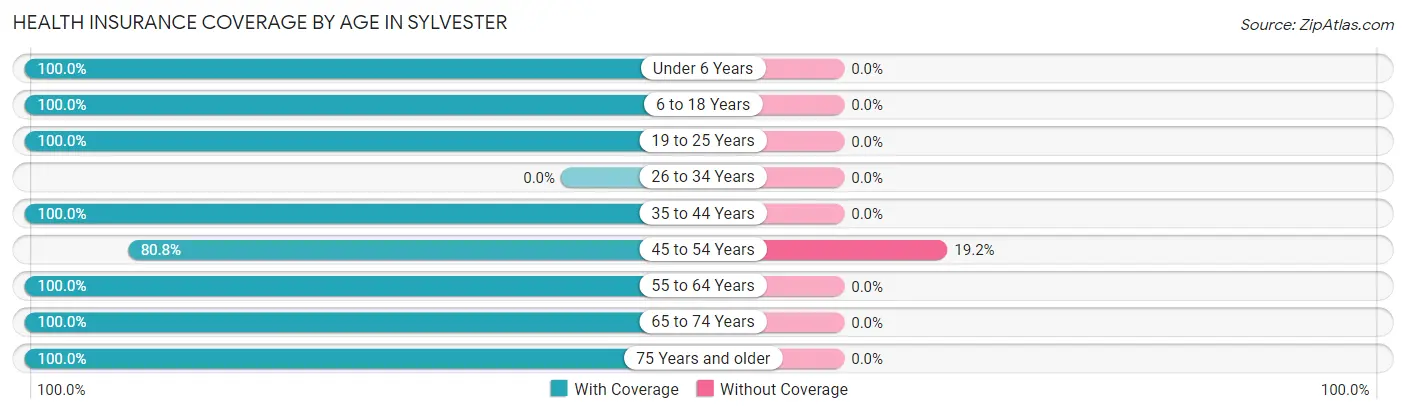
| Age Bracket | With Coverage | Without Coverage |
| Under 6 Years | 11 (100.0%) | 0 (0.0%) |
| 6 to 18 Years | 41 (100.0%) | 0 (0.0%) |
| 19 to 25 Years | 16 (100.0%) | 0 (0.0%) |
| 26 to 34 Years | 0 (0.0%) | 0 (0.0%) |
| 35 to 44 Years | 22 (100.0%) | 0 (0.0%) |
| 45 to 54 Years | 21 (80.8%) | 5 (19.2%) |
| 55 to 64 Years | 8 (100.0%) | 0 (0.0%) |
| 65 to 74 Years | 17 (100.0%) | 0 (0.0%) |
| 75 Years and older | 28 (100.0%) | 0 (0.0%) |
| Total | 164 (97.0%) | 5 (3.0%) |
Health Insurance Coverage by Citizenship Status in Sylvester
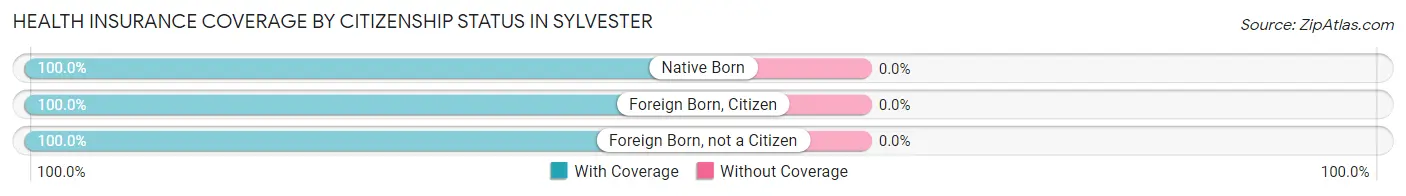
| Citizenship Status | With Coverage | Without Coverage |
| Native Born | 11 (100.0%) | 0 (0.0%) |
| Foreign Born, Citizen | 41 (100.0%) | 0 (0.0%) |
| Foreign Born, not a Citizen | 16 (100.0%) | 0 (0.0%) |
Health Insurance Coverage by Household Income in Sylvester
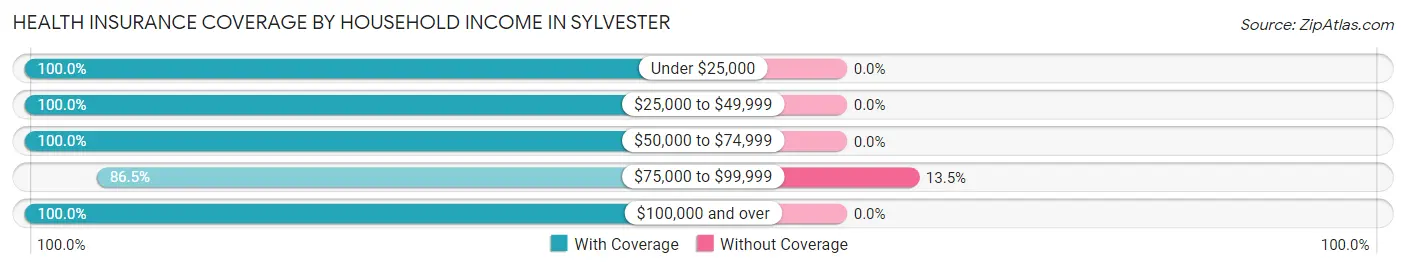
| Household Income | With Coverage | Without Coverage |
| Under $25,000 | 11 (100.0%) | 0 (0.0%) |
| $25,000 to $49,999 | 27 (100.0%) | 0 (0.0%) |
| $50,000 to $74,999 | 17 (100.0%) | 0 (0.0%) |
| $75,000 to $99,999 | 32 (86.5%) | 5 (13.5%) |
| $100,000 and over | 77 (100.0%) | 0 (0.0%) |
Public vs Private Health Insurance Coverage by Age in Sylvester
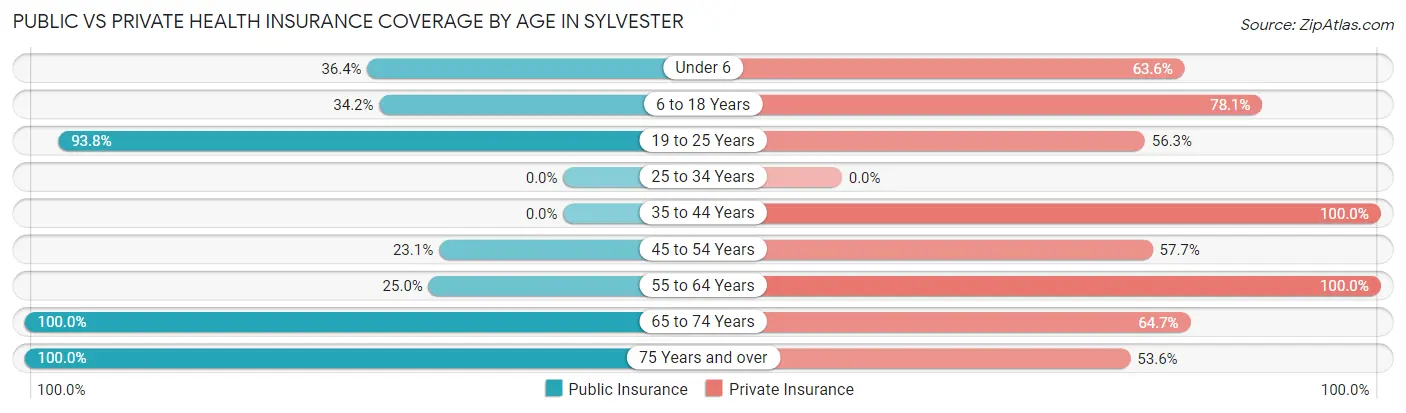
| Age Bracket | Public Insurance | Private Insurance |
| Under 6 | 4 (36.4%) | 7 (63.6%) |
| 6 to 18 Years | 14 (34.2%) | 32 (78.0%) |
| 19 to 25 Years | 15 (93.8%) | 9 (56.2%) |
| 25 to 34 Years | 0 (0.0%) | 0 (0.0%) |
| 35 to 44 Years | 0 (0.0%) | 22 (100.0%) |
| 45 to 54 Years | 6 (23.1%) | 15 (57.7%) |
| 55 to 64 Years | 2 (25.0%) | 8 (100.0%) |
| 65 to 74 Years | 17 (100.0%) | 11 (64.7%) |
| 75 Years and over | 28 (100.0%) | 15 (53.6%) |
| Total | 86 (50.9%) | 119 (70.4%) |
Disability Status by Sex by Age in Sylvester
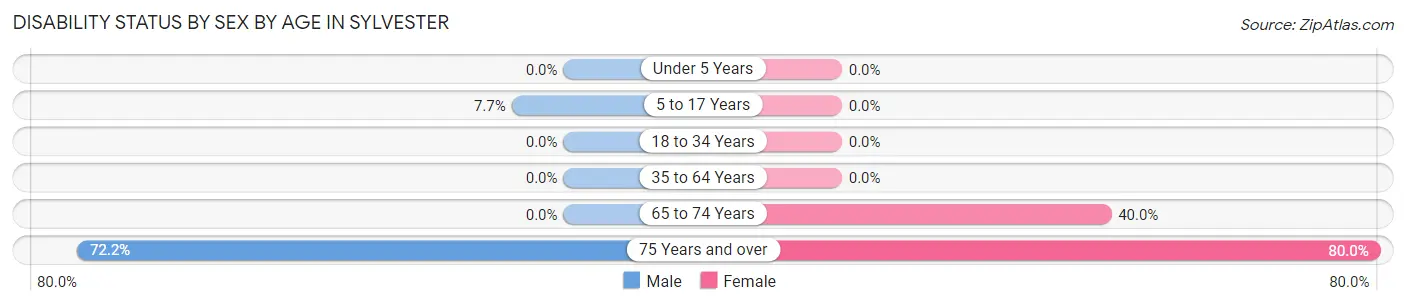
| Age Bracket | Male | Female |
| Under 5 Years | 0 (0.0%) | 0 (0.0%) |
| 5 to 17 Years | 2 (7.7%) | 0 (0.0%) |
| 18 to 34 Years | 0 (0.0%) | 0 (0.0%) |
| 35 to 64 Years | 0 (0.0%) | 0 (0.0%) |
| 65 to 74 Years | 0 (0.0%) | 6 (40.0%) |
| 75 Years and over | 13 (72.2%) | 8 (80.0%) |
Disability Class by Sex by Age in Sylvester
Disability Class: Hearing Difficulty
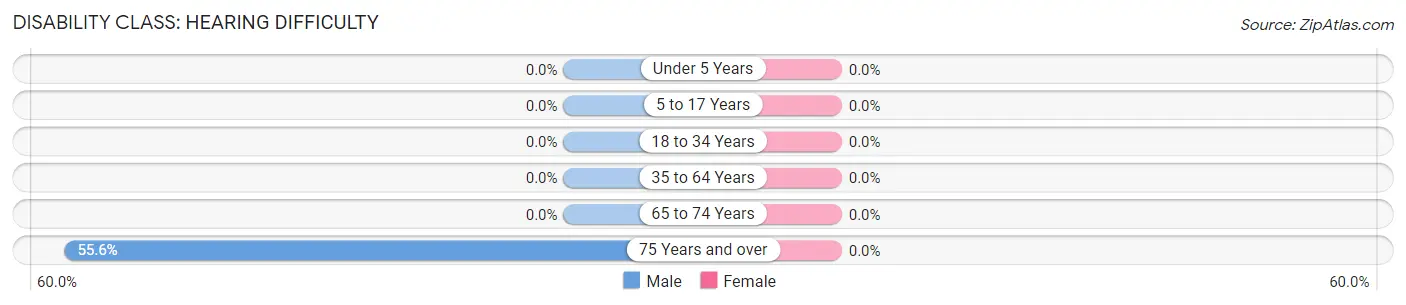
| Age Bracket | Male | Female |
| Under 5 Years | 0 (0.0%) | 0 (0.0%) |
| 5 to 17 Years | 0 (0.0%) | 0 (0.0%) |
| 18 to 34 Years | 0 (0.0%) | 0 (0.0%) |
| 35 to 64 Years | 0 (0.0%) | 0 (0.0%) |
| 65 to 74 Years | 0 (0.0%) | 0 (0.0%) |
| 75 Years and over | 10 (55.6%) | 0 (0.0%) |
Disability Class: Vision Difficulty
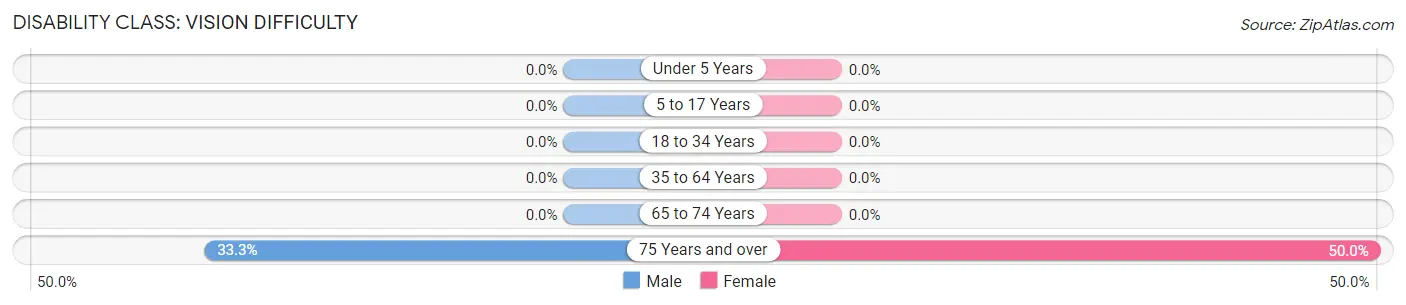
| Age Bracket | Male | Female |
| Under 5 Years | 0 (0.0%) | 0 (0.0%) |
| 5 to 17 Years | 0 (0.0%) | 0 (0.0%) |
| 18 to 34 Years | 0 (0.0%) | 0 (0.0%) |
| 35 to 64 Years | 0 (0.0%) | 0 (0.0%) |
| 65 to 74 Years | 0 (0.0%) | 0 (0.0%) |
| 75 Years and over | 6 (33.3%) | 5 (50.0%) |
Disability Class: Cognitive Difficulty
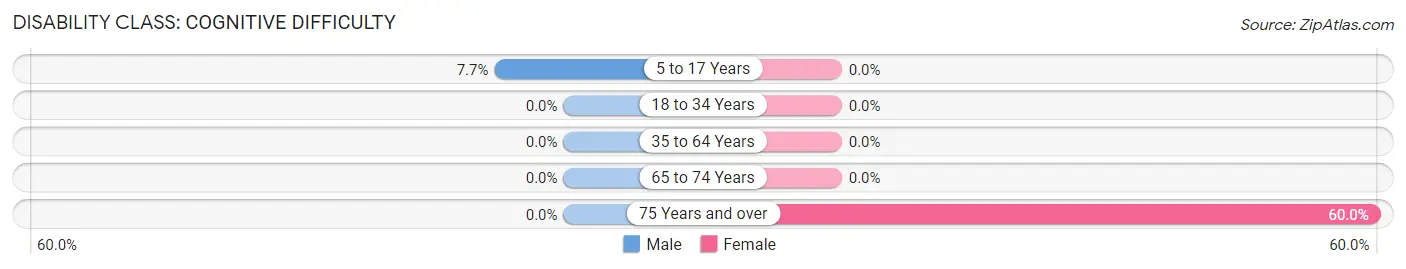
| Age Bracket | Male | Female |
| 5 to 17 Years | 2 (7.7%) | 0 (0.0%) |
| 18 to 34 Years | 0 (0.0%) | 0 (0.0%) |
| 35 to 64 Years | 0 (0.0%) | 0 (0.0%) |
| 65 to 74 Years | 0 (0.0%) | 0 (0.0%) |
| 75 Years and over | 0 (0.0%) | 6 (60.0%) |
Disability Class: Ambulatory Difficulty
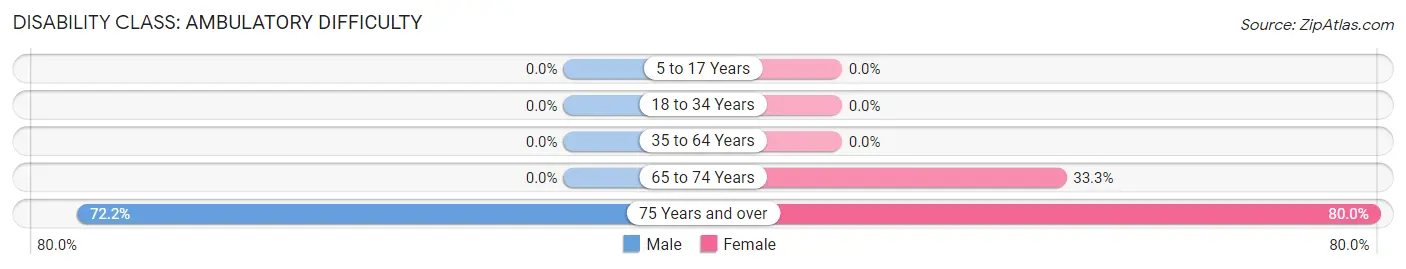
| Age Bracket | Male | Female |
| 5 to 17 Years | 0 (0.0%) | 0 (0.0%) |
| 18 to 34 Years | 0 (0.0%) | 0 (0.0%) |
| 35 to 64 Years | 0 (0.0%) | 0 (0.0%) |
| 65 to 74 Years | 0 (0.0%) | 5 (33.3%) |
| 75 Years and over | 13 (72.2%) | 8 (80.0%) |
Disability Class: Self-Care Difficulty
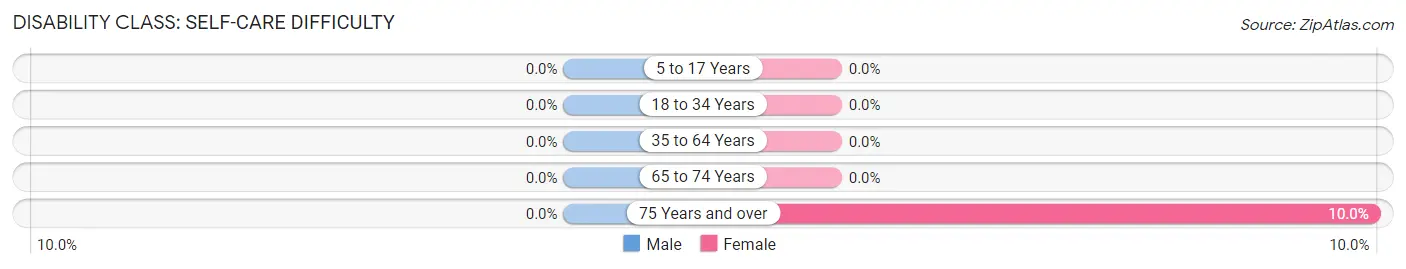
| Age Bracket | Male | Female |
| 5 to 17 Years | 0 (0.0%) | 0 (0.0%) |
| 18 to 34 Years | 0 (0.0%) | 0 (0.0%) |
| 35 to 64 Years | 0 (0.0%) | 0 (0.0%) |
| 65 to 74 Years | 0 (0.0%) | 0 (0.0%) |
| 75 Years and over | 0 (0.0%) | 1 (10.0%) |
Technology Access in Sylvester
Computing Device Access in Sylvester
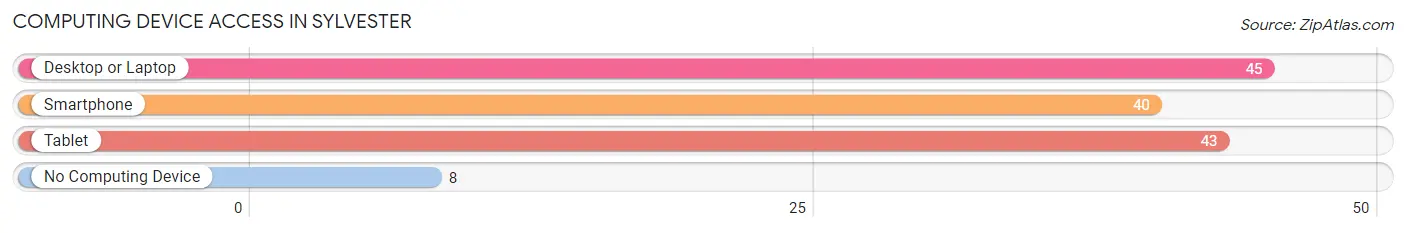
| Device Type | # Households | % Households |
| Desktop or Laptop | 45 | 75.0% |
| Smartphone | 40 | 66.7% |
| Tablet | 43 | 71.7% |
| No Computing Device | 8 | 13.3% |
| Total | 60 | 100.0% |
Internet Access in Sylvester
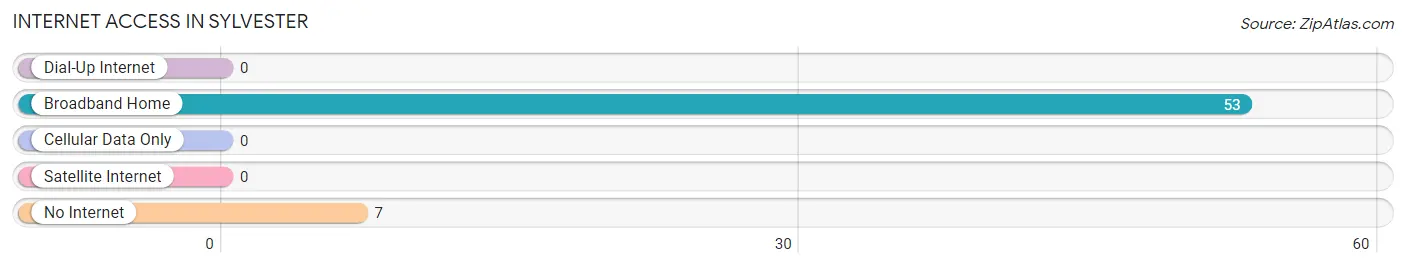
| Internet Type | # Households | % Households |
| Dial-Up Internet | 0 | 0.0% |
| Broadband Home | 53 | 88.3% |
| Cellular Data Only | 0 | 0.0% |
| Satellite Internet | 0 | 0.0% |
| No Internet | 7 | 11.7% |
| Total | 60 | 100.0% |
Sylvester Summary
Sylvester is a small unincorporated community located in the northern part of Wetzel County, West Virginia. It is situated along the Ohio River, approximately 10 miles south of New Martinsville. The community was named after Sylvester H. Smith, a local landowner.
Geography
Sylvester is located at 39°25'45"N 80°51'45"W (39.4292, -80.8625). It is situated along the Ohio River, approximately 10 miles south of New Martinsville. The community is located in the northern part of Wetzel County, West Virginia. The terrain is mostly flat with some rolling hills. The area is heavily forested with a mix of hardwood and coniferous trees.
Demographics
As of the 2010 census, the population of Sylvester was 545. The racial makeup of the community was 97.3% White, 0.7% African American, 0.2% Native American, 0.2% Asian, 0.2% from other races, and 1.6% from two or more races. Hispanic or Latino of any race were 0.7% of the population.
Economy
The economy of Sylvester is largely based on agriculture and timber. The area is home to several small farms and timber companies. The community also has a few small businesses, including a gas station, a convenience store, and a restaurant.
History
Sylvester was first settled in the early 1800s by settlers from Pennsylvania and Virginia. The community was named after Sylvester H. Smith, a local landowner. The first post office was established in 1883.
In the early 1900s, Sylvester was a thriving community with several stores, a school, and a church. The community was also home to a number of coal mines. The mines provided employment for many of the residents.
In the late 1950s, the coal mines began to close and the population of Sylvester began to decline. The decline continued into the 1970s and 1980s. By the 1990s, the population had dropped to less than 500.
Today, Sylvester is a small, rural community. The population has remained relatively stable since the 1990s. The community is home to a few small businesses and is a popular destination for outdoor recreation.
Common Questions
What is Per Capita Income in Sylvester?
Per Capita income in Sylvester is $25,605.
What is the Median Family Income in Sylvester?
Median Family Income in Sylvester is $83,750.
What is the Median Household income in Sylvester?
Median Household Income in Sylvester is $61,000.
What is Inequality or Gini Index in Sylvester?
Inequality or Gini Index in Sylvester is 0.39.
What is the Total Population of Sylvester?
Total Population of Sylvester is 169.
What is the Total Male Population of Sylvester?
Total Male Population of Sylvester is 73.
What is the Total Female Population of Sylvester?
Total Female Population of Sylvester is 96.
What is the Ratio of Males per 100 Females in Sylvester?
There are 76.04 Males per 100 Females in Sylvester.
What is the Ratio of Females per 100 Males in Sylvester?
There are 131.51 Females per 100 Males in Sylvester.
What is the Median Population Age in Sylvester?
Median Population Age in Sylvester is 42.3 Years.
What is the Average Family Size in Sylvester
Average Family Size in Sylvester is 3.6 People.
What is the Average Household Size in Sylvester
Average Household Size in Sylvester is 2.8 People.
How Large is the Labor Force in Sylvester?
There are 50 People in the Labor Forcein in Sylvester.
What is the Percentage of People in the Labor Force in Sylvester?
36.0% of People are in the Labor Force in Sylvester.
What is the Unemployment Rate in Sylvester?
Unemployment Rate in Sylvester is 20.0%.