Hometown, WV Map & Demographics
Hometown Map
Hometown Overview
$24,370
PER CAPITA INCOME
$41,611
AVG HOUSEHOLD INCOME
0.34
INEQUALITY / GINI INDEX
869
TOTAL POPULATION
470
MALE POPULATION
399
FEMALE POPULATION
117.79
MALES / 100 FEMALES
84.89
FEMALES / 100 MALES
56.4
MEDIAN AGE
2.6
AVG FAMILY SIZE
2.6
AVG HOUSEHOLD SIZE
337
LABOR FORCE [ PEOPLE ]
40.6%
PERCENT IN LABOR FORCE
11.0%
UNEMPLOYMENT RATE
Hometown Zip Codes
Hometown Area Codes
Income in Hometown
Income Overview in Hometown
| Characteristic | Number | Measure |
| Per Capita Income | 869 | $24,370 |
| Median Family Income | 220 | $0 |
| Mean Family Income | 220 | $57,111 |
| Median Household Income | 335 | $41,611 |
| Mean Household Income | 335 | $53,874 |
| Income Deficit | 220 | $0 |
| Wage / Income Gap (%) | 869 | 0.00% |
| Wage / Income Gap ($) | 869 | 100.00¢ per $1 |
| Gini / Inequality Index | 869 | 0.34 |
Earnings by Sex in Hometown
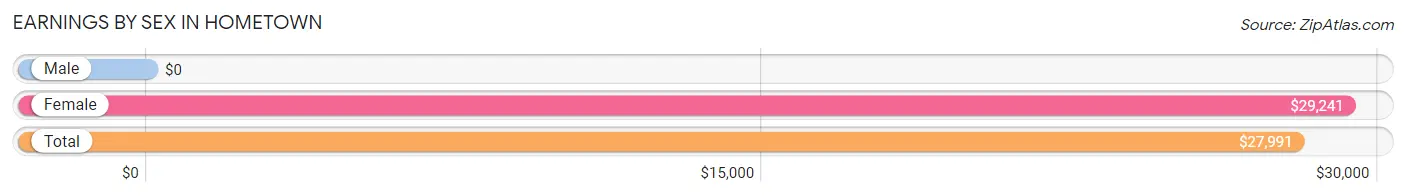
| Sex | Number | Average Earnings |
| Male | 288 (71.8%) | $0 |
| Female | 113 (28.2%) | $29,241 |
| Total | 401 (100.0%) | $27,991 |
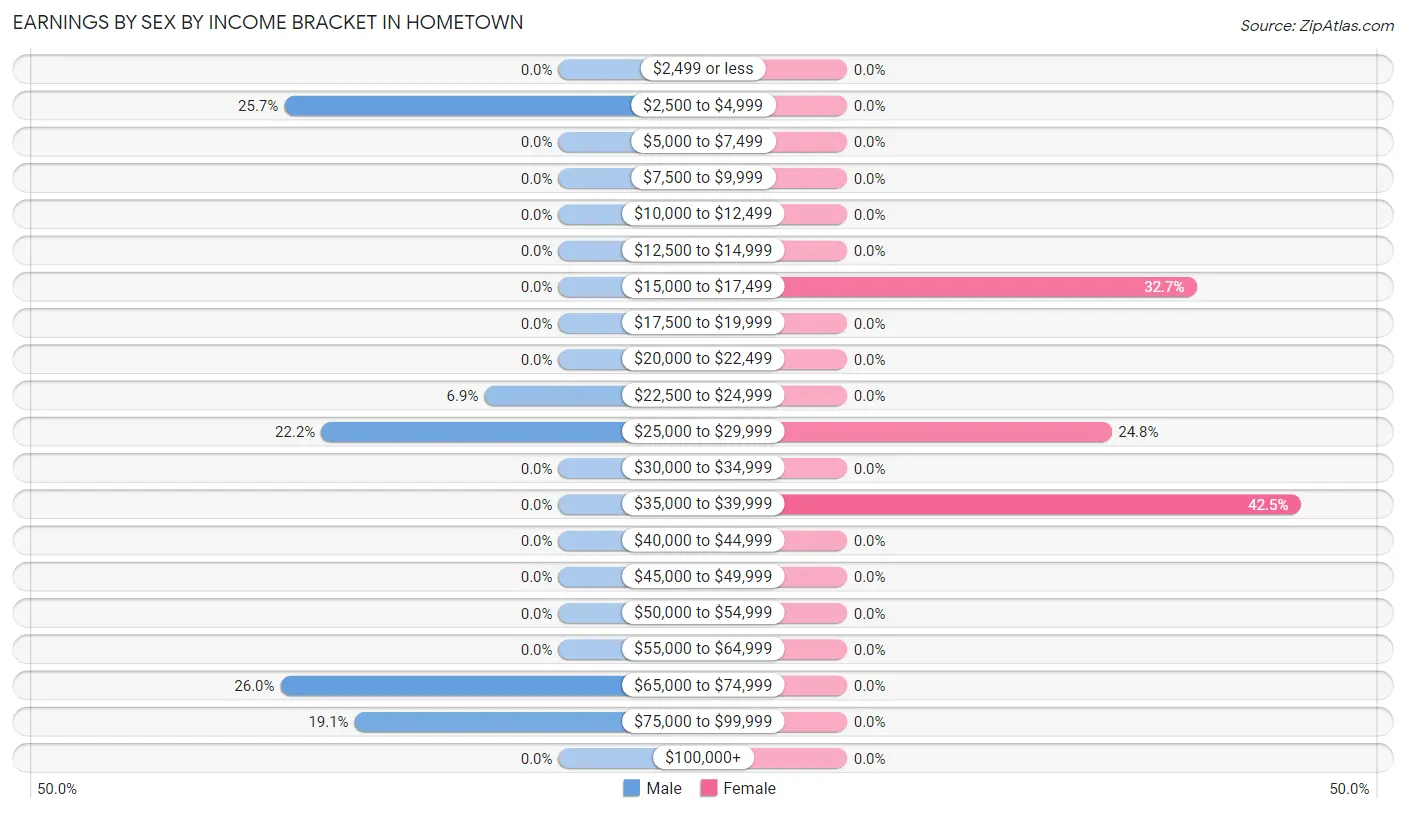
Earnings by Sex by Income Bracket in Hometown
The most common earnings brackets in Hometown are $65,000 to $74,999 for men (75 | 26.0%) and $35,000 to $39,999 for women (48 | 42.5%).
| Income | Male | Female |
| $2,499 or less | 0 (0.0%) | 0 (0.0%) |
| $2,500 to $4,999 | 74 (25.7%) | 0 (0.0%) |
| $5,000 to $7,499 | 0 (0.0%) | 0 (0.0%) |
| $7,500 to $9,999 | 0 (0.0%) | 0 (0.0%) |
| $10,000 to $12,499 | 0 (0.0%) | 0 (0.0%) |
| $12,500 to $14,999 | 0 (0.0%) | 0 (0.0%) |
| $15,000 to $17,499 | 0 (0.0%) | 37 (32.7%) |
| $17,500 to $19,999 | 0 (0.0%) | 0 (0.0%) |
| $20,000 to $22,499 | 0 (0.0%) | 0 (0.0%) |
| $22,500 to $24,999 | 20 (6.9%) | 0 (0.0%) |
| $25,000 to $29,999 | 64 (22.2%) | 28 (24.8%) |
| $30,000 to $34,999 | 0 (0.0%) | 0 (0.0%) |
| $35,000 to $39,999 | 0 (0.0%) | 48 (42.5%) |
| $40,000 to $44,999 | 0 (0.0%) | 0 (0.0%) |
| $45,000 to $49,999 | 0 (0.0%) | 0 (0.0%) |
| $50,000 to $54,999 | 0 (0.0%) | 0 (0.0%) |
| $55,000 to $64,999 | 0 (0.0%) | 0 (0.0%) |
| $65,000 to $74,999 | 75 (26.0%) | 0 (0.0%) |
| $75,000 to $99,999 | 55 (19.1%) | 0 (0.0%) |
| $100,000+ | 0 (0.0%) | 0 (0.0%) |
| Total | 288 (100.0%) | 113 (100.0%) |
Earnings by Sex by Educational Attainment in Hometown
| Educational Attainment | Male Income | Female Income |
| Less than High School | - | - |
| High School Diploma | - | - |
| College or Associate's Degree | - | - |
| Bachelor's Degree | - | - |
| Graduate Degree | - | - |
| Total | - | - |
Family Income in Hometown
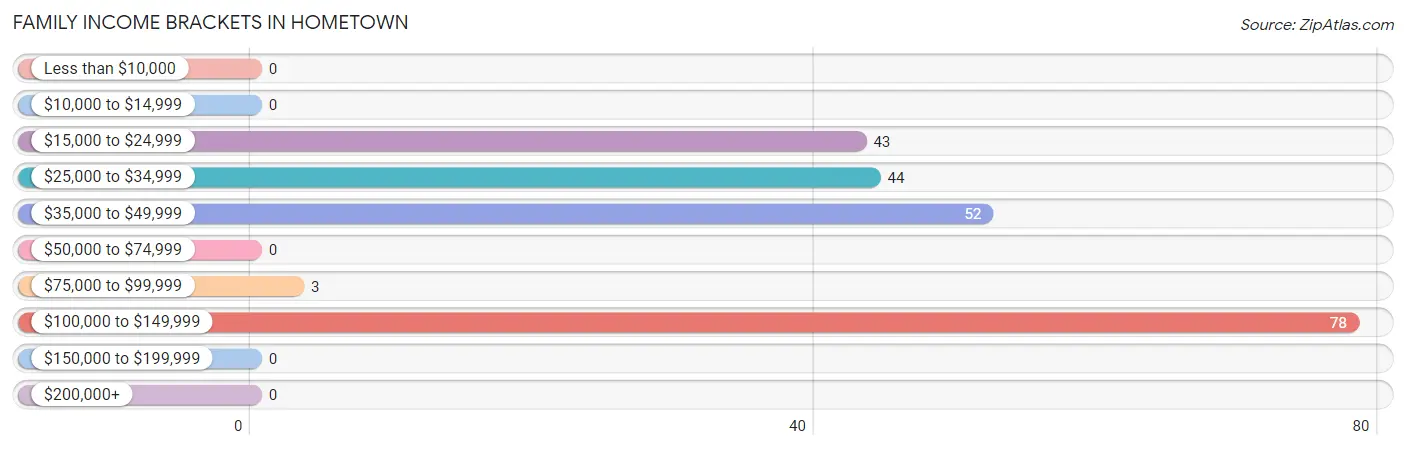
Family Income Brackets in Hometown
According to the Hometown family income data, there are 78 families falling into the $100,000 to $149,999 income range, which is the most common income bracket and makes up 35.4% of all families.
| Income Bracket | # Families | % Families |
| Less than $10,000 | 0 | 0.0% |
| $10,000 to $14,999 | 0 | 0.0% |
| $15,000 to $24,999 | 43 | 19.5% |
| $25,000 to $34,999 | 44 | 20.0% |
| $35,000 to $49,999 | 52 | 23.6% |
| $50,000 to $74,999 | 0 | 0.0% |
| $75,000 to $99,999 | 3 | 1.4% |
| $100,000 to $149,999 | 78 | 35.5% |
| $150,000 to $199,999 | 0 | 0.0% |
| $200,000+ | 0 | 0.0% |
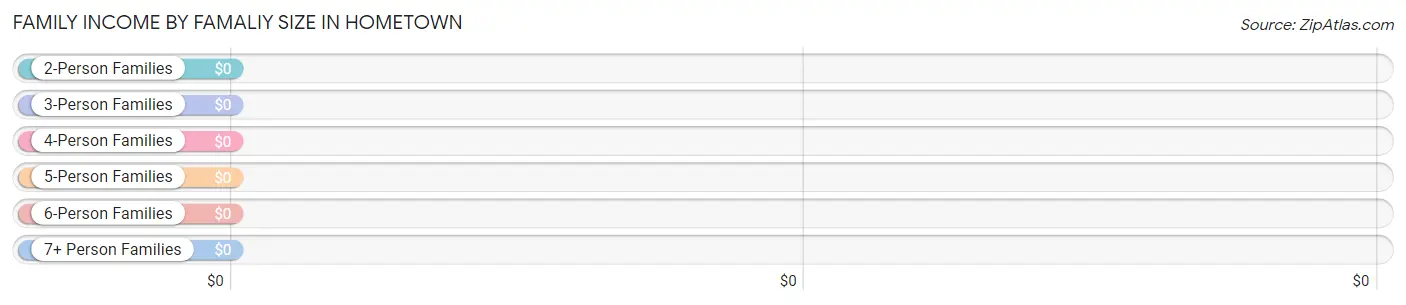
Family Income by Famaliy Size in Hometown
| Income Bracket | # Families | Median Income |
| 2-Person Families | 144 (65.4%) | $0 |
| 3-Person Families | 76 (34.5%) | $0 |
| 4-Person Families | 0 (0.0%) | $0 |
| 5-Person Families | 0 (0.0%) | $0 |
| 6-Person Families | 0 (0.0%) | $0 |
| 7+ Person Families | 0 (0.0%) | $0 |
| Total | 220 (100.0%) | $0 |
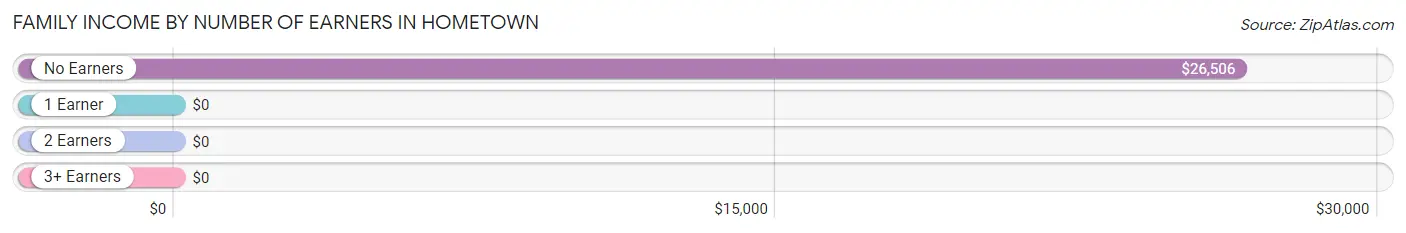
Family Income by Number of Earners in Hometown
| Number of Earners | # Families | Median Income |
| No Earners | 139 (63.2%) | $26,506 |
| 1 Earner | 3 (1.4%) | $0 |
| 2 Earners | 78 (35.4%) | $0 |
| 3+ Earners | 0 (0.0%) | $0 |
| Total | 220 (100.0%) | $0 |
Household Income in Hometown
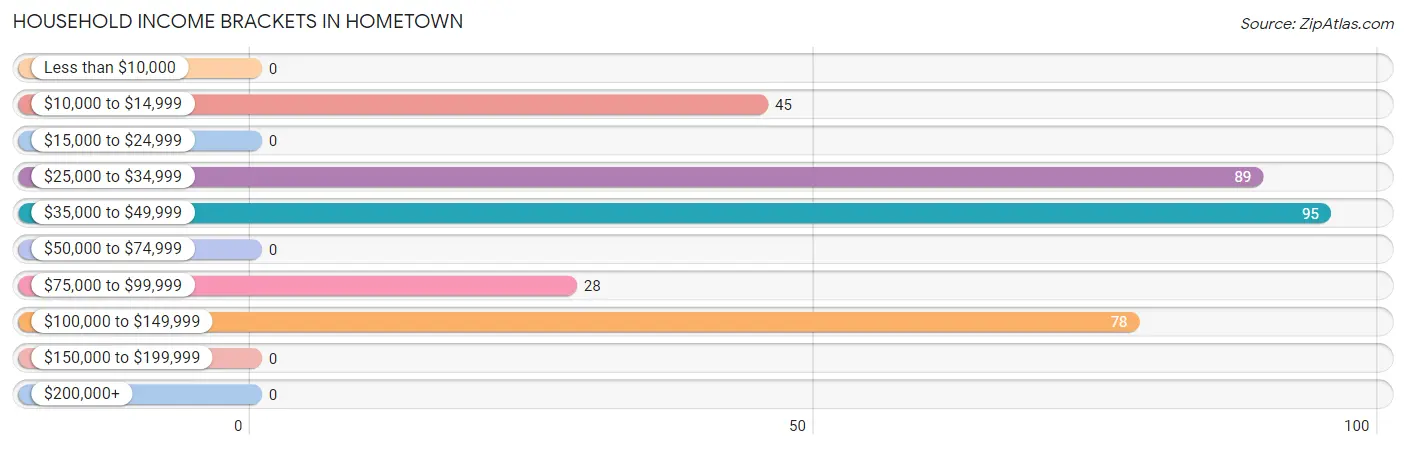
Household Income Brackets in Hometown
With 95 households falling in the category, the $35,000 to $49,999 income range is the most frequent in Hometown, accounting for 28.4% of all households.
| Income Bracket | # Households | % Households |
| Less than $10,000 | 0 | 0.0% |
| $10,000 to $14,999 | 45 | 13.4% |
| $15,000 to $24,999 | 0 | 0.0% |
| $25,000 to $34,999 | 89 | 26.6% |
| $35,000 to $49,999 | 95 | 28.4% |
| $50,000 to $74,999 | 0 | 0.0% |
| $75,000 to $99,999 | 28 | 8.4% |
| $100,000 to $149,999 | 78 | 23.3% |
| $150,000 to $199,999 | 0 | 0.0% |
| $200,000+ | 0 | 0.0% |
Household Income by Householder Age in Hometown
The median household income in Hometown is $41,611, with the highest median household income of $41,274 found in the 65+ years age bracket for the primary householder. A total of 143 households (42.7%) fall into this category.
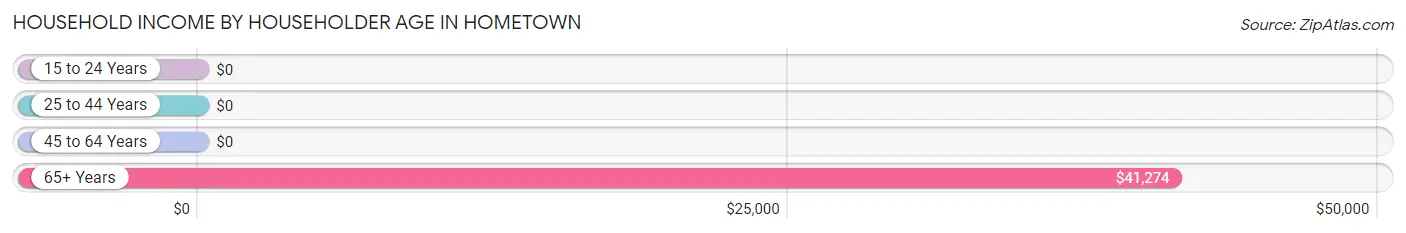
| Income Bracket | # Households | Median Income |
| 15 to 24 Years | 0 (0.0%) | $0 |
| 25 to 44 Years | 25 (7.5%) | $0 |
| 45 to 64 Years | 167 (49.8%) | $0 |
| 65+ Years | 143 (42.7%) | $41,274 |
| Total | 335 (100.0%) | $41,611 |
Poverty in Hometown
Income Below Poverty by Sex and Age in Hometown
With 15.7% poverty level for males and 46.1% for females among the residents of Hometown, 55 to 64 year old males and 6 to 11 year old females are the most vulnerable to poverty, with 74 males (38.3%) and 39 females (100.0%) in their respective age groups living below the poverty level.
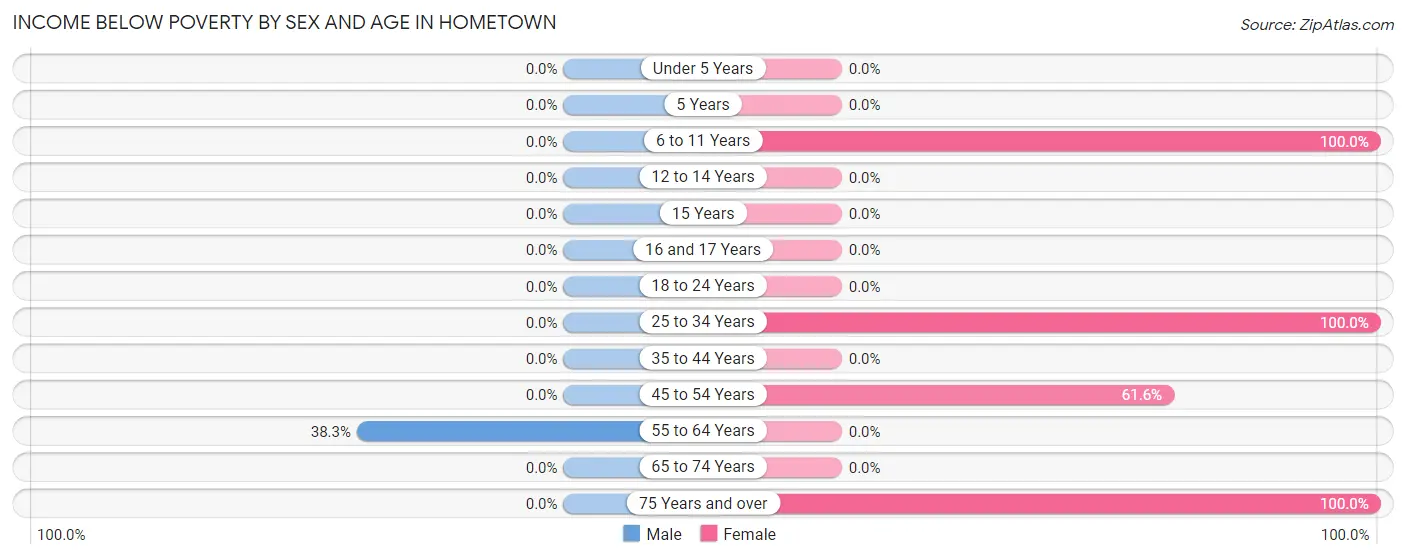
| Age Bracket | Male | Female |
| Under 5 Years | 0 (0.0%) | 0 (0.0%) |
| 5 Years | 0 (0.0%) | 0 (0.0%) |
| 6 to 11 Years | 0 (0.0%) | 39 (100.0%) |
| 12 to 14 Years | 0 (0.0%) | 0 (0.0%) |
| 15 Years | 0 (0.0%) | 0 (0.0%) |
| 16 and 17 Years | 0 (0.0%) | 0 (0.0%) |
| 18 to 24 Years | 0 (0.0%) | 0 (0.0%) |
| 25 to 34 Years | 0 (0.0%) | 57 (100.0%) |
| 35 to 44 Years | 0 (0.0%) | 0 (0.0%) |
| 45 to 54 Years | 0 (0.0%) | 45 (61.6%) |
| 55 to 64 Years | 74 (38.3%) | 0 (0.0%) |
| 65 to 74 Years | 0 (0.0%) | 0 (0.0%) |
| 75 Years and over | 0 (0.0%) | 43 (100.0%) |
| Total | 74 (15.7%) | 184 (46.1%) |
Income Above Poverty by Sex and Age in Hometown
According to the poverty statistics in Hometown, males aged 16 and 17 years and females aged 55 to 64 years are the age groups that are most secure financially, with 100.0% of males and 100.0% of females in these age groups living above the poverty line.
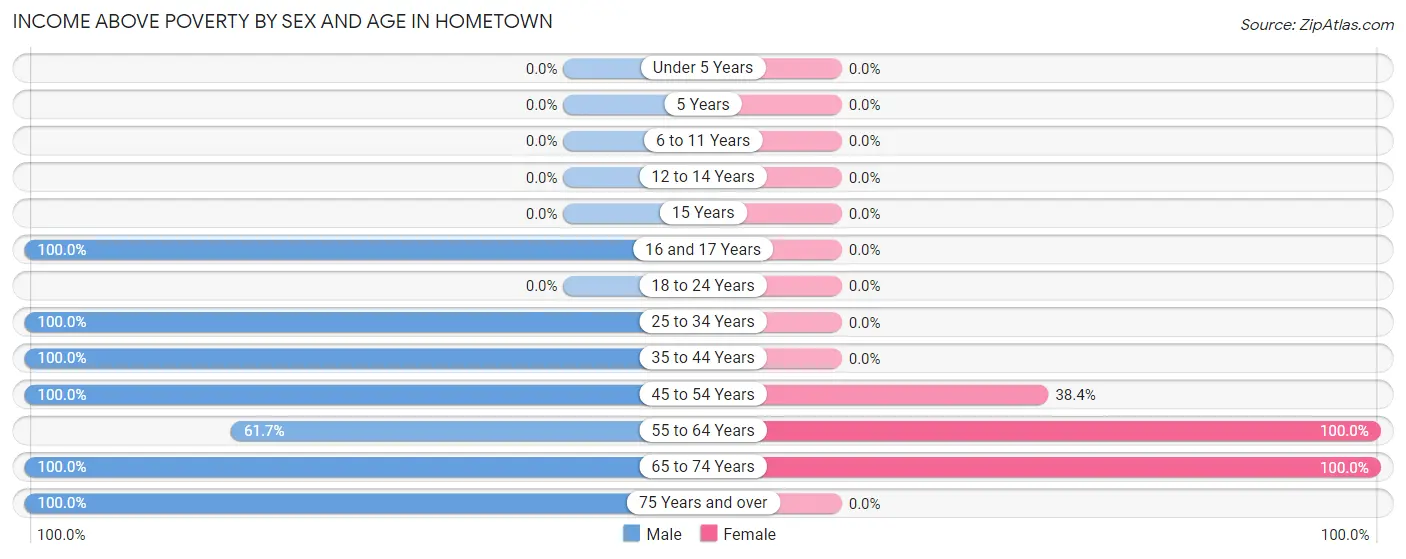
| Age Bracket | Male | Female |
| Under 5 Years | 0 (0.0%) | 0 (0.0%) |
| 5 Years | 0 (0.0%) | 0 (0.0%) |
| 6 to 11 Years | 0 (0.0%) | 0 (0.0%) |
| 12 to 14 Years | 0 (0.0%) | 0 (0.0%) |
| 15 Years | 0 (0.0%) | 0 (0.0%) |
| 16 and 17 Years | 38 (100.0%) | 0 (0.0%) |
| 18 to 24 Years | 0 (0.0%) | 0 (0.0%) |
| 25 to 34 Years | 64 (100.0%) | 0 (0.0%) |
| 35 to 44 Years | 25 (100.0%) | 0 (0.0%) |
| 45 to 54 Years | 50 (100.0%) | 28 (38.4%) |
| 55 to 64 Years | 119 (61.7%) | 128 (100.0%) |
| 65 to 74 Years | 55 (100.0%) | 59 (100.0%) |
| 75 Years and over | 45 (100.0%) | 0 (0.0%) |
| Total | 396 (84.3%) | 215 (53.9%) |
Income Below Poverty Among Married-Couple Families in Hometown
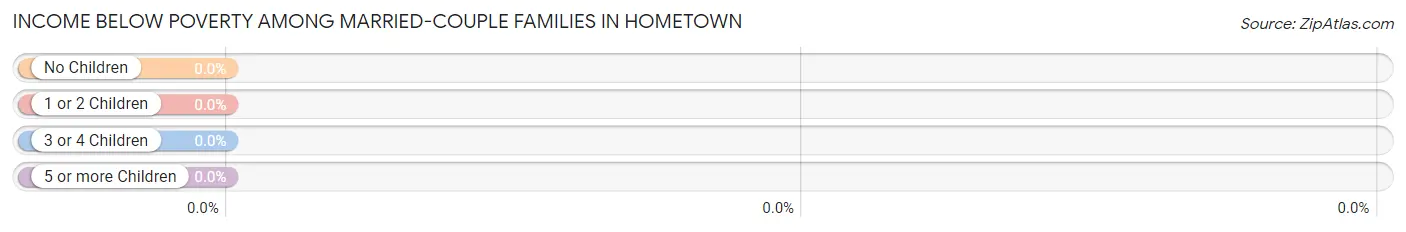
| Children | Above Poverty | Below Poverty |
| No Children | 147 (100.0%) | 0 (0.0%) |
| 1 or 2 Children | 30 (100.0%) | 0 (0.0%) |
| 3 or 4 Children | 0 (0.0%) | 0 (0.0%) |
| 5 or more Children | 0 (0.0%) | 0 (0.0%) |
| Total | 177 (100.0%) | 0 (0.0%) |
Income Below Poverty Among Single-Parent Households in Hometown
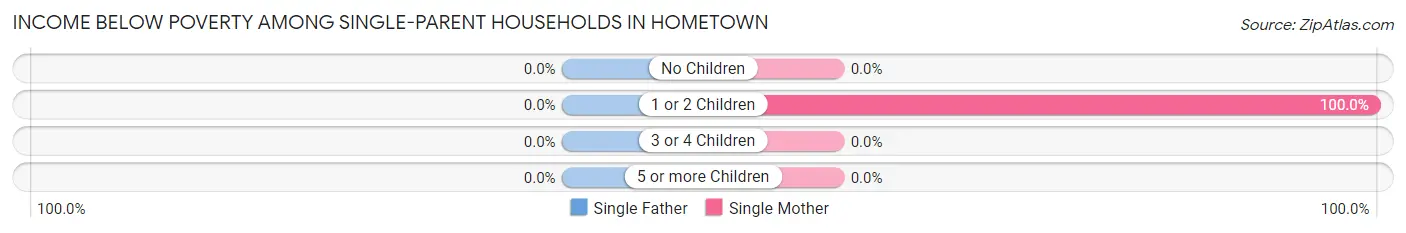
| Children | Single Father | Single Mother |
| No Children | 0 (0.0%) | 0 (0.0%) |
| 1 or 2 Children | 0 (0.0%) | 43 (100.0%) |
| 3 or 4 Children | 0 (0.0%) | 0 (0.0%) |
| 5 or more Children | 0 (0.0%) | 0 (0.0%) |
| Total | 0 (0.0%) | 43 (100.0%) |
Income Below Poverty Among Married-Couple vs Single-Parent Households in Hometown
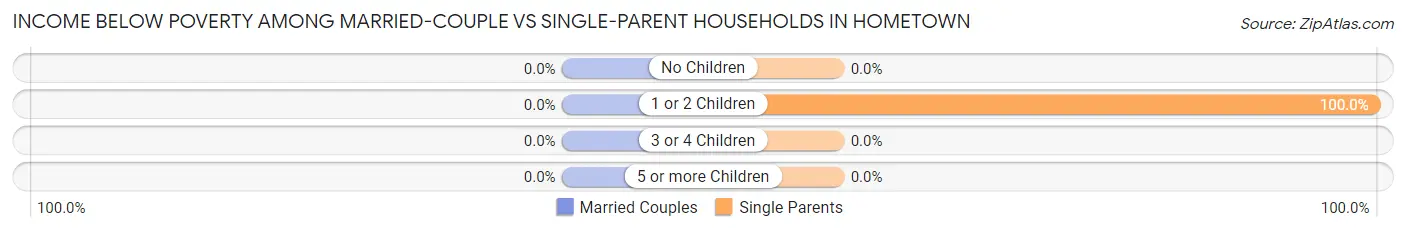
| Children | Married-Couple Families | Single-Parent Households |
| No Children | 0 (0.0%) | 0 (0.0%) |
| 1 or 2 Children | 0 (0.0%) | 43 (100.0%) |
| 3 or 4 Children | 0 (0.0%) | 0 (0.0%) |
| 5 or more Children | 0 (0.0%) | 0 (0.0%) |
| Total | 0 (0.0%) | 43 (100.0%) |
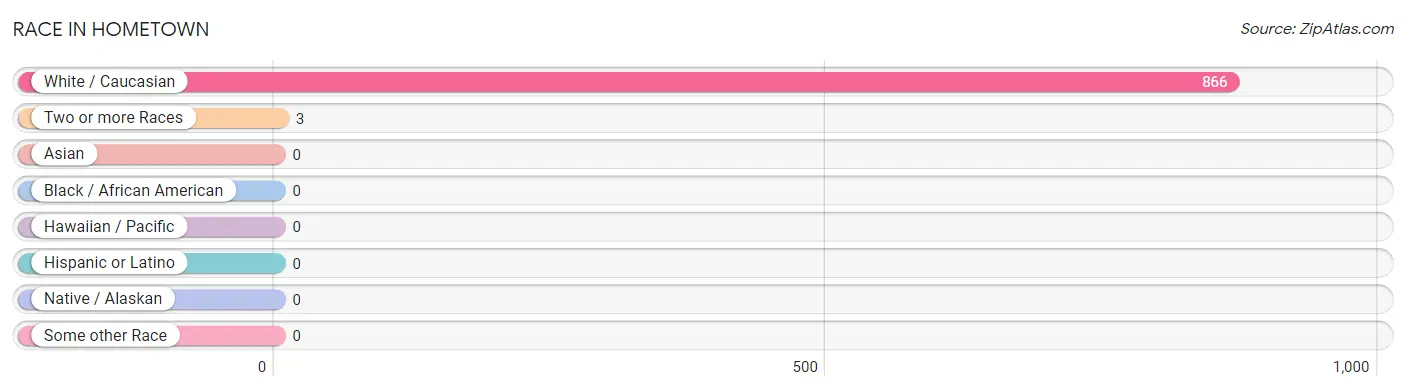
Race in Hometown
The most populous races in Hometown are White / Caucasian (866 | 99.7%), and Two or more Races (3 | 0.4%).
| Race | # Population | % Population |
| Asian | 0 | 0.0% |
| Black / African American | 0 | 0.0% |
| Hawaiian / Pacific | 0 | 0.0% |
| Hispanic or Latino | 0 | 0.0% |
| Native / Alaskan | 0 | 0.0% |
| White / Caucasian | 866 | 99.7% |
| Two or more Races | 3 | 0.4% |
| Some other Race | 0 | 0.0% |
| Total | 869 | 100.0% |
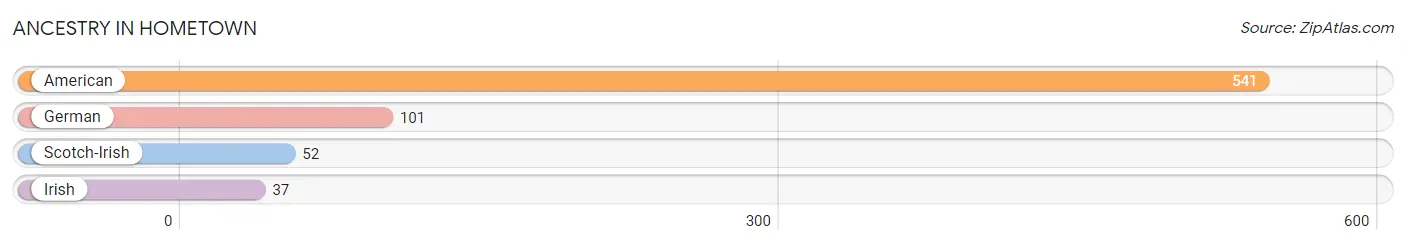
Ancestry in Hometown
The most populous ancestries reported in Hometown are American (541 | 62.3%), German (101 | 11.6%), Scotch-Irish (52 | 6.0%), and Irish (37 | 4.3%), together accounting for 84.1% of all Hometown residents.
| Ancestry | # Population | % Population |
| American | 541 | 62.3% |
| German | 101 | 11.6% |
| Irish | 37 | 4.3% |
| Scotch-Irish | 52 | 6.0% | View All 4 Rows |
Immigrants in Hometown

| Immigration Origin | # Population | % Population | View All 0 Rows |
Sex and Age in Hometown
Sex and Age in Hometown
The most populous age groups in Hometown are 55 to 59 Years (193 | 41.1%) for men and 55 to 59 Years (128 | 32.1%) for women.
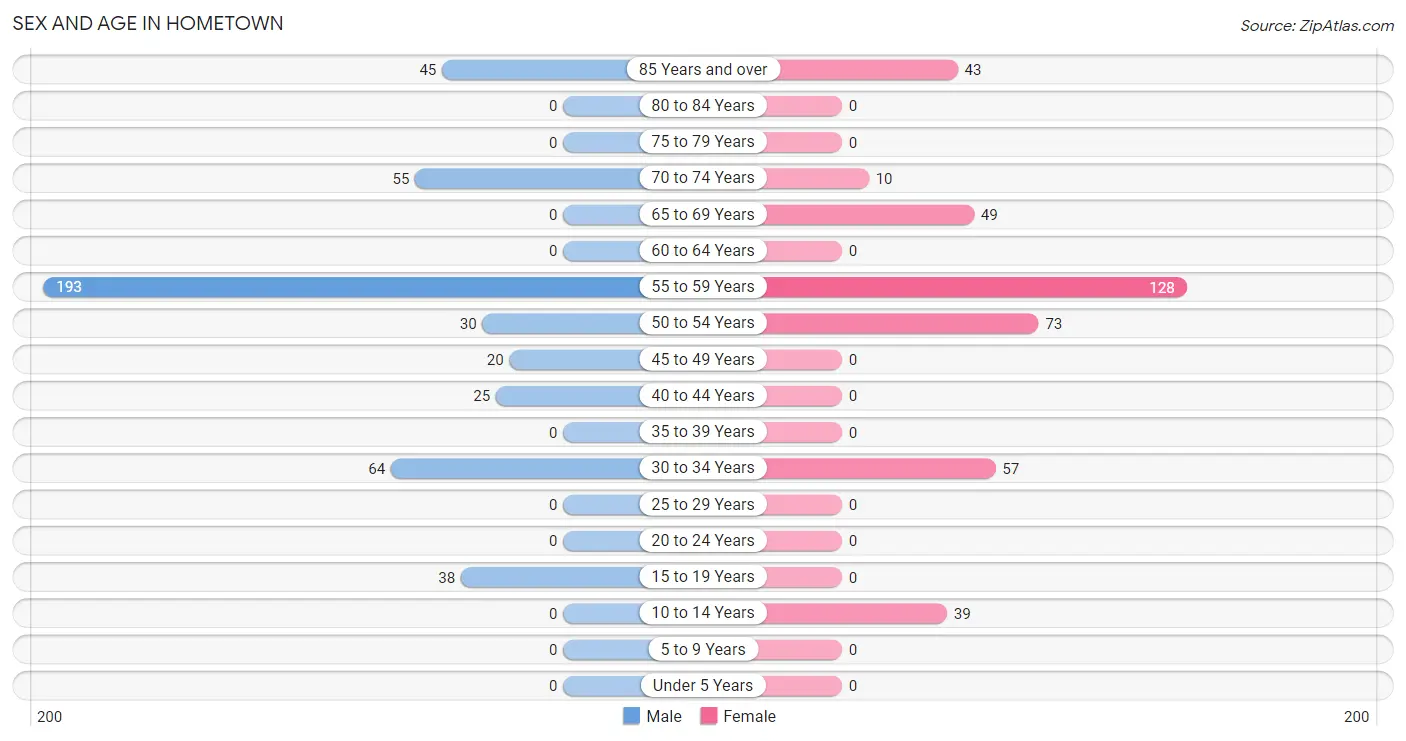
| Age Bracket | Male | Female |
| Under 5 Years | 0 (0.0%) | 0 (0.0%) |
| 5 to 9 Years | 0 (0.0%) | 0 (0.0%) |
| 10 to 14 Years | 0 (0.0%) | 39 (9.8%) |
| 15 to 19 Years | 38 (8.1%) | 0 (0.0%) |
| 20 to 24 Years | 0 (0.0%) | 0 (0.0%) |
| 25 to 29 Years | 0 (0.0%) | 0 (0.0%) |
| 30 to 34 Years | 64 (13.6%) | 57 (14.3%) |
| 35 to 39 Years | 0 (0.0%) | 0 (0.0%) |
| 40 to 44 Years | 25 (5.3%) | 0 (0.0%) |
| 45 to 49 Years | 20 (4.3%) | 0 (0.0%) |
| 50 to 54 Years | 30 (6.4%) | 73 (18.3%) |
| 55 to 59 Years | 193 (41.1%) | 128 (32.1%) |
| 60 to 64 Years | 0 (0.0%) | 0 (0.0%) |
| 65 to 69 Years | 0 (0.0%) | 49 (12.3%) |
| 70 to 74 Years | 55 (11.7%) | 10 (2.5%) |
| 75 to 79 Years | 0 (0.0%) | 0 (0.0%) |
| 80 to 84 Years | 0 (0.0%) | 0 (0.0%) |
| 85 Years and over | 45 (9.6%) | 43 (10.8%) |
| Total | 470 (100.0%) | 399 (100.0%) |
Families and Households in Hometown
Median Family Size in Hometown
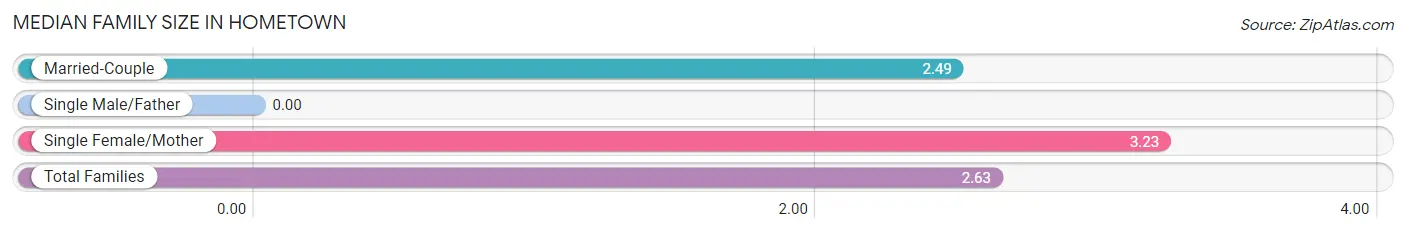
| Family Type | # Families | Family Size |
| Married-Couple | 177 (80.4%) | 2.49 |
| Single Male/Father | 0 (0.0%) | - |
| Single Female/Mother | 43 (19.6%) | 3.23 |
| Total Families | 220 (100.0%) | 2.63 |
Median Household Size in Hometown
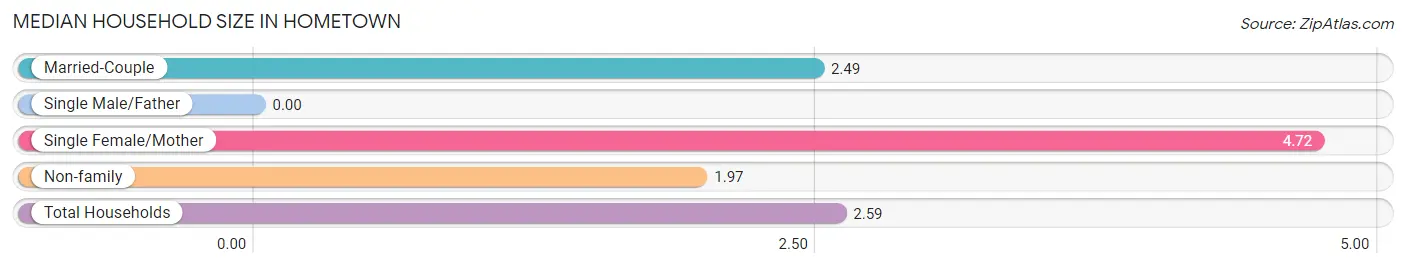
| Household Type | # Households | Household Size |
| Married-Couple | 177 (52.8%) | 2.49 |
| Single Male/Father | 0 (0.0%) | - |
| Single Female/Mother | 43 (12.8%) | 4.72 |
| Non-family | 115 (34.3%) | 1.97 |
| Total Households | 335 (100.0%) | 2.59 |
Household Size by Marriage Status in Hometown
Out of a total of 335 households in Hometown, 220 (65.7%) are family households, while 115 (34.3%) are nonfamily households. The most numerous type of family households are 2-person households, comprising 144, and the most common type of nonfamily households are 2-person households, comprising 70.
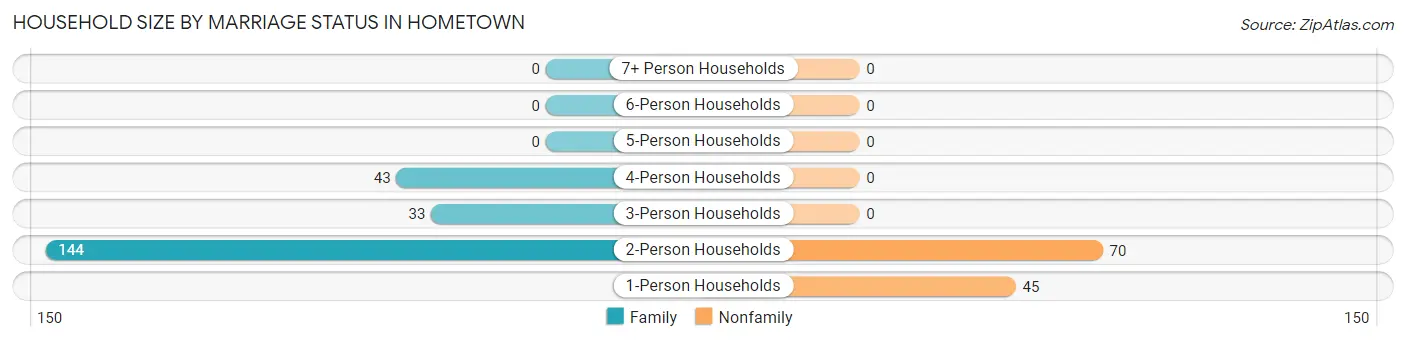
| Household Size | Family Households | Nonfamily Households |
| 1-Person Households | - | 45 (13.4%) |
| 2-Person Households | 144 (43.0%) | 70 (20.9%) |
| 3-Person Households | 33 (9.9%) | 0 (0.0%) |
| 4-Person Households | 43 (12.8%) | 0 (0.0%) |
| 5-Person Households | 0 (0.0%) | 0 (0.0%) |
| 6-Person Households | 0 (0.0%) | 0 (0.0%) |
| 7+ Person Households | 0 (0.0%) | 0 (0.0%) |
| Total | 220 (65.7%) | 115 (34.3%) |
Female Fertility in Hometown
Fertility by Age in Hometown
| Age Bracket | Women with Births | Births / 1,000 Women |
| 15 to 19 years | 0 (0.0%) | 0.0 |
| 20 to 34 years | 0 (0.0%) | 0.0 |
| 35 to 50 years | 0 (0.0%) | 0.0 |
| Total | 0 (0.0%) | 0.0 |
Fertility by Age by Marriage Status in Hometown
| Age Bracket | Married | Unmarried |
| 15 to 19 years | 0 (0.0%) | 0 (0.0%) |
| 20 to 34 years | 0 (0.0%) | 0 (0.0%) |
| 35 to 50 years | 0 (0.0%) | 0 (0.0%) |
| Total | 0 (0.0%) | 0 (0.0%) |
Fertility by Education in Hometown
| Educational Attainment | Women with Births | Births / 1,000 Women |
| Less than High School | 0 (0.0%) | 0.0 |
| High School Diploma | 0 (0.0%) | 0.0 |
| College or Associate's Degree | 0 (0.0%) | 0.0 |
| Bachelor's Degree | 0 (0.0%) | 0.0 |
| Graduate Degree | 0 (0.0%) | 0.0 |
| Total | 0 (0.0%) | 0.0 |
Fertility by Education by Marriage Status in Hometown
| Educational Attainment | Married | Unmarried |
| Less than High School | 0 (0.0%) | 0 (0.0%) |
| High School Diploma | 0 (0.0%) | 0 (0.0%) |
| College or Associate's Degree | 0 (0.0%) | 0 (0.0%) |
| Bachelor's Degree | 0 (0.0%) | 0 (0.0%) |
| Graduate Degree | 0 (0.0%) | 0 (0.0%) |
| Total | 0 (0.0%) | 0 (0.0%) |
Employment Characteristics in Hometown
Employment by Class of Employer in Hometown
Among the 300 employed individuals in Hometown, private company employees (275 | 91.7%), and not-for-profit organizations (25 | 8.3%) make up the most common classes of employment.
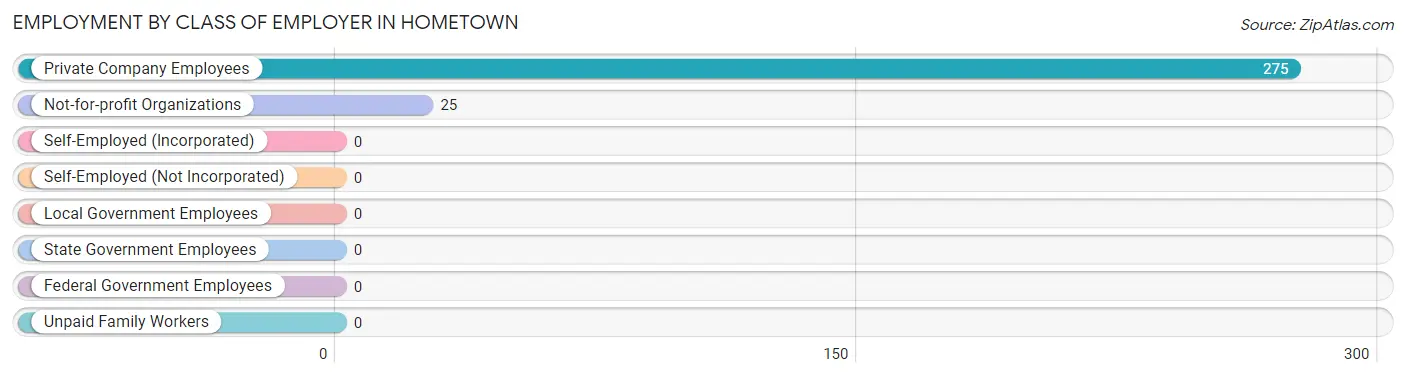
| Employer Class | # Employees | % Employees |
| Private Company Employees | 275 | 91.7% |
| Self-Employed (Incorporated) | 0 | 0.0% |
| Self-Employed (Not Incorporated) | 0 | 0.0% |
| Not-for-profit Organizations | 25 | 8.3% |
| Local Government Employees | 0 | 0.0% |
| State Government Employees | 0 | 0.0% |
| Federal Government Employees | 0 | 0.0% |
| Unpaid Family Workers | 0 | 0.0% |
| Total | 300 | 100.0% |
Employment Status by Age in Hometown
According to the labor force statistics for Hometown, out of the total population over 16 years of age (830), 40.6% or 337 individuals are in the labor force, with 11.0% or 37 of them unemployed. The age group with the highest labor force participation rate is 35 to 44 years, with 100.0% or 25 individuals in the labor force. Within the labor force, the 55 to 59 years age range has the highest percentage of unemployed individuals, with 15.8% or 37 of them being unemployed.
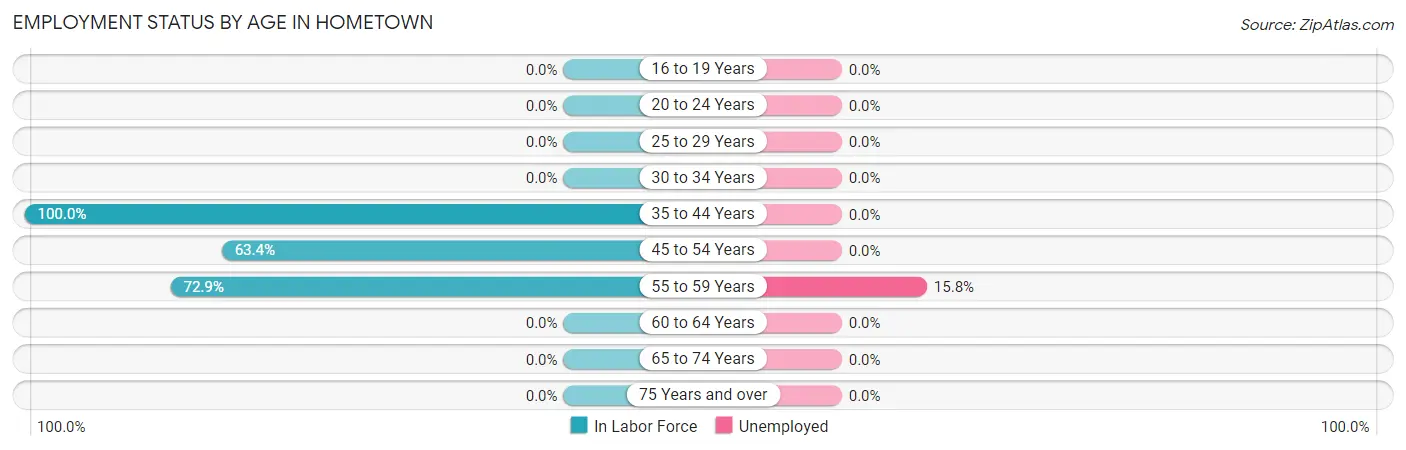
| Age Bracket | In Labor Force | Unemployed |
| 16 to 19 Years | 0 (0.0%) | 0 (0.0%) |
| 20 to 24 Years | 0 (0.0%) | 0 (0.0%) |
| 25 to 29 Years | 0 (0.0%) | 0 (0.0%) |
| 30 to 34 Years | 0 (0.0%) | 0 (0.0%) |
| 35 to 44 Years | 25 (100.0%) | 0 (0.0%) |
| 45 to 54 Years | 78 (63.4%) | 0 (0.0%) |
| 55 to 59 Years | 234 (72.9%) | 37 (15.8%) |
| 60 to 64 Years | 0 (0.0%) | 0 (0.0%) |
| 65 to 74 Years | 0 (0.0%) | 0 (0.0%) |
| 75 Years and over | 0 (0.0%) | 0 (0.0%) |
| Total | 337 (40.6%) | 37 (11.0%) |
Employment Status by Educational Attainment in Hometown
According to labor force statistics for Hometown, 57.1% of individuals (337) out of the total population between 25 and 64 years of age (590) are in the labor force, with 11.0% or 37 of them being unemployed. The group with the highest labor force participation rate are those with the educational attainment of college / associate degree, with 100.0% or 25 individuals in the labor force. Within the labor force, individuals with high school diploma education have the highest percentage of unemployment, with 22.8% or 37 of them being unemployed.
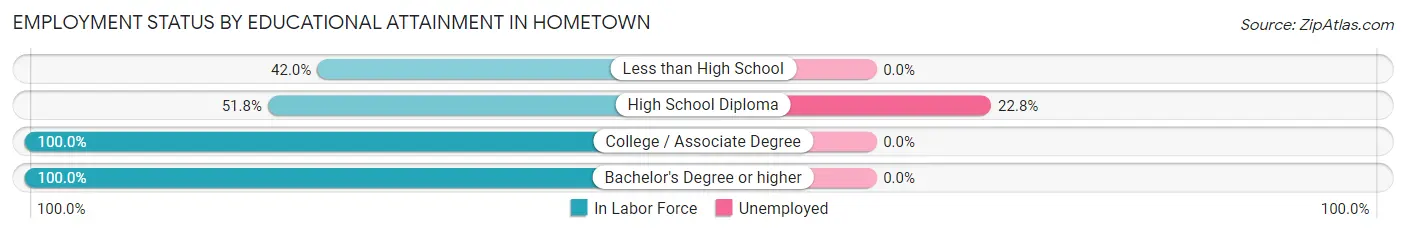
| Educational Attainment | In Labor Force | Unemployed |
| Less than High School | 74 (42.0%) | 0 (0.0%) |
| High School Diploma | 162 (51.8%) | 71 (22.8%) |
| College / Associate Degree | 25 (100.0%) | 0 (0.0%) |
| Bachelor's Degree or higher | 76 (100.0%) | 0 (0.0%) |
| Total | 337 (57.1%) | 65 (11.0%) |
Employment Occupations by Sex in Hometown
Management, Business, Science and Arts Occupations
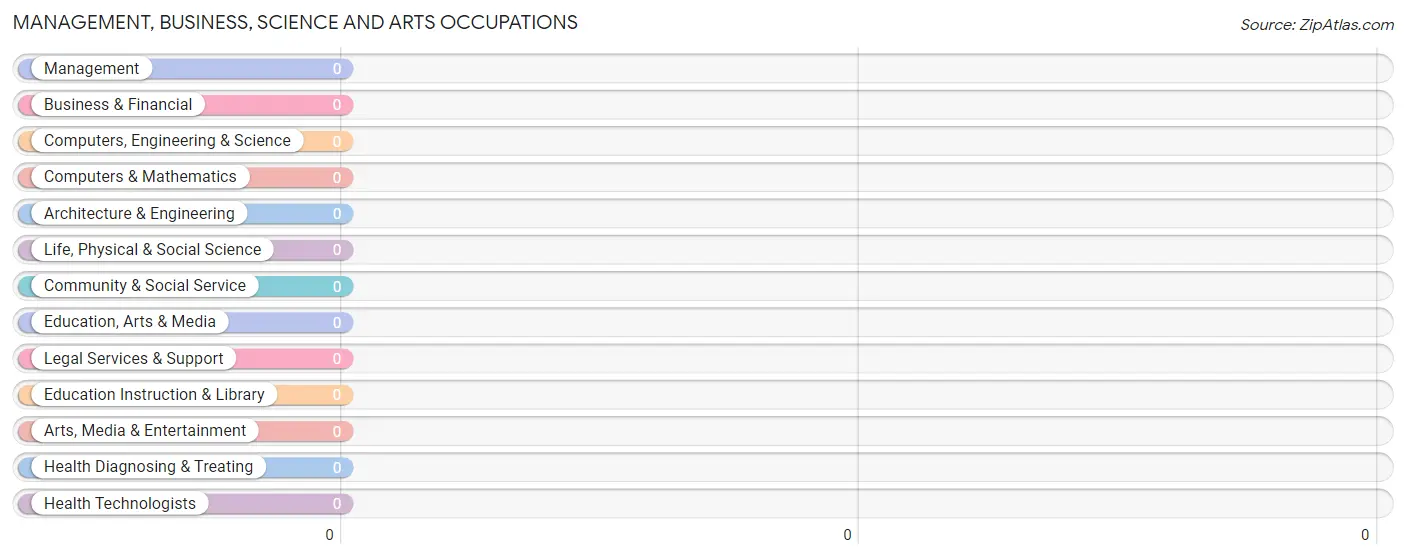
Management, Business, Science and Arts Occupations by Sex
| Occupation | Male | Female |
| Management | 0 (0.0%) | 0 (0.0%) |
| Business & Financial | 0 (0.0%) | 0 (0.0%) |
| Computers, Engineering & Science | 0 (0.0%) | 0 (0.0%) |
| Computers & Mathematics | 0 (0.0%) | 0 (0.0%) |
| Architecture & Engineering | 0 (0.0%) | 0 (0.0%) |
| Life, Physical & Social Science | 0 (0.0%) | 0 (0.0%) |
| Community & Social Service | 0 (0.0%) | 0 (0.0%) |
| Education, Arts & Media | 0 (0.0%) | 0 (0.0%) |
| Legal Services & Support | 0 (0.0%) | 0 (0.0%) |
| Education Instruction & Library | 0 (0.0%) | 0 (0.0%) |
| Arts, Media & Entertainment | 0 (0.0%) | 0 (0.0%) |
| Health Diagnosing & Treating | 0 (0.0%) | 0 (0.0%) |
| Health Technologists | 0 (0.0%) | 0 (0.0%) |
| Total (Category) | 0 (0.0%) | 0 (0.0%) |
| Total (Overall) | 224 (74.7%) | 76 (25.3%) |
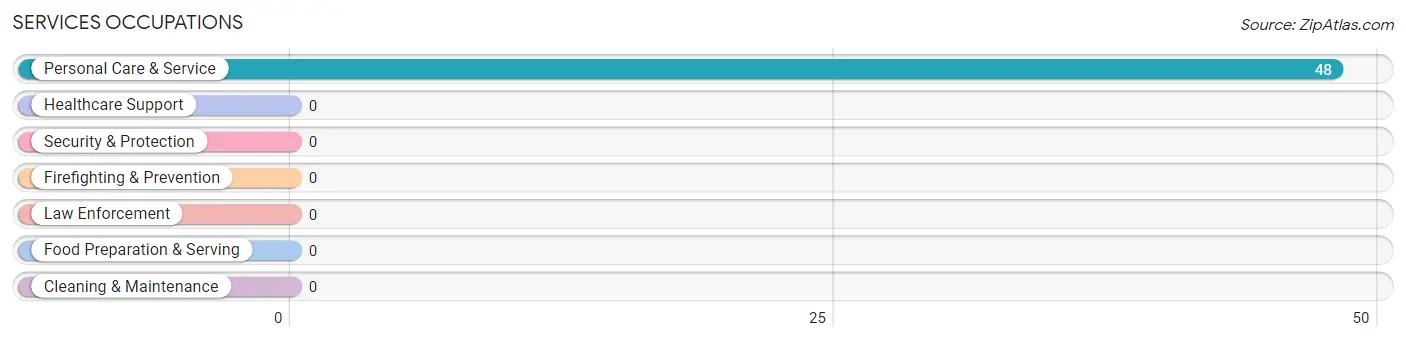
Services Occupations
The most common Services occupations in Hometown are , and Personal Care & Service (48 | 16.0%).
Services Occupations by Sex
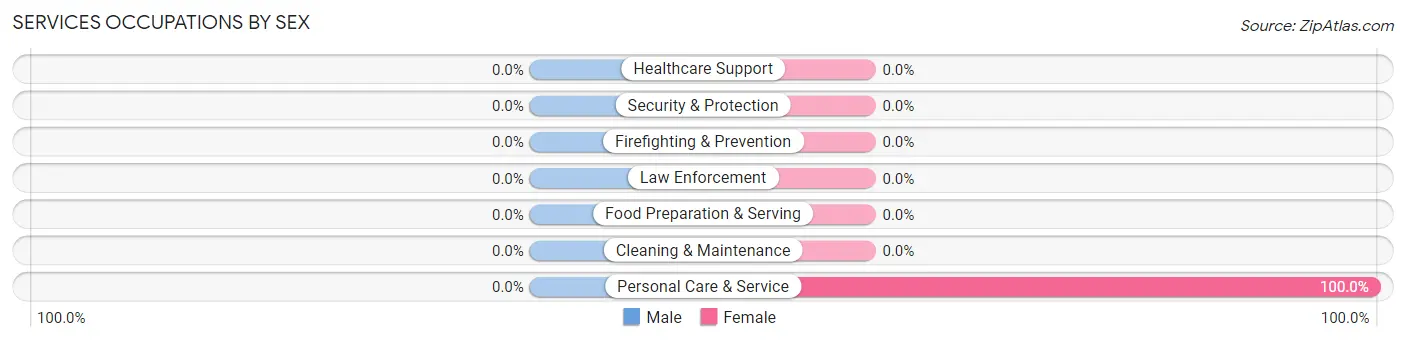
| Occupation | Male | Female |
| Healthcare Support | 0 (0.0%) | 0 (0.0%) |
| Security & Protection | 0 (0.0%) | 0 (0.0%) |
| Firefighting & Prevention | 0 (0.0%) | 0 (0.0%) |
| Law Enforcement | 0 (0.0%) | 0 (0.0%) |
| Food Preparation & Serving | 0 (0.0%) | 0 (0.0%) |
| Cleaning & Maintenance | 0 (0.0%) | 0 (0.0%) |
| Personal Care & Service | 0 (0.0%) | 48 (100.0%) |
| Total (Category) | 0 (0.0%) | 48 (100.0%) |
| Total (Overall) | 224 (74.7%) | 76 (25.3%) |
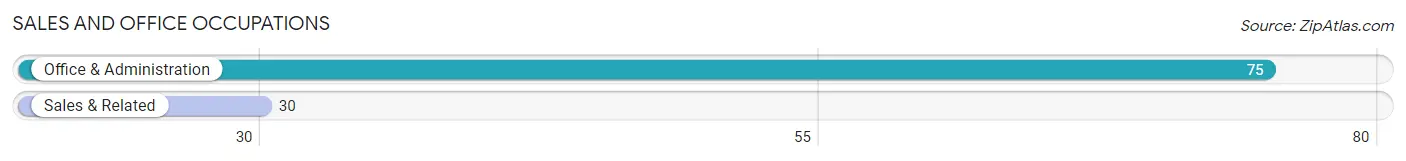
Sales and Office Occupations
The most common Sales and Office occupations in Hometown are Office & Administration (75 | 25.0%), and Sales & Related (30 | 10.0%).
Sales and Office Occupations by Sex
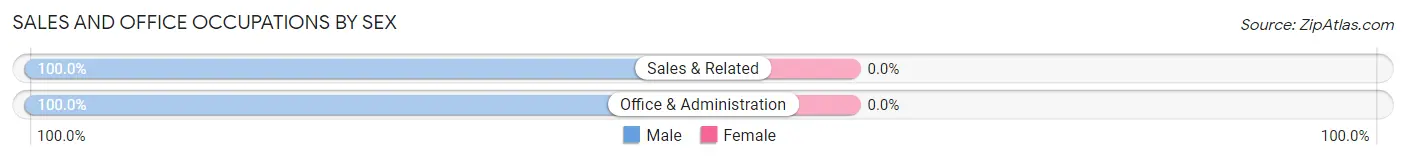
| Occupation | Male | Female |
| Sales & Related | 30 (100.0%) | 0 (0.0%) |
| Office & Administration | 75 (100.0%) | 0 (0.0%) |
| Total (Category) | 105 (100.0%) | 0 (0.0%) |
| Total (Overall) | 224 (74.7%) | 76 (25.3%) |
Natural Resources, Construction and Maintenance Occupations
The most common Natural Resources, Construction and Maintenance occupations in Hometown are Installation, Maintenance & Repair (74 | 24.7%), and Construction & Extraction (25 | 8.3%).
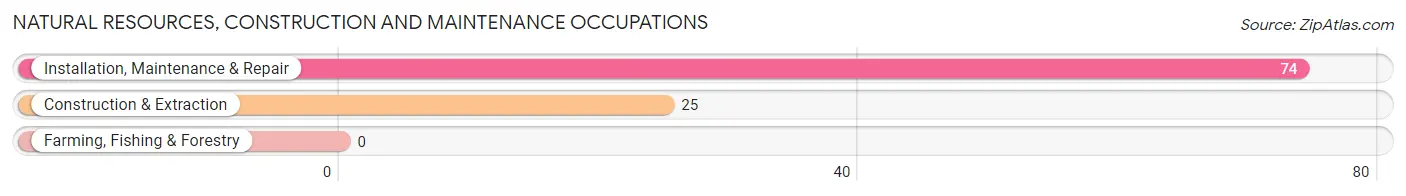
Natural Resources, Construction and Maintenance Occupations by Sex
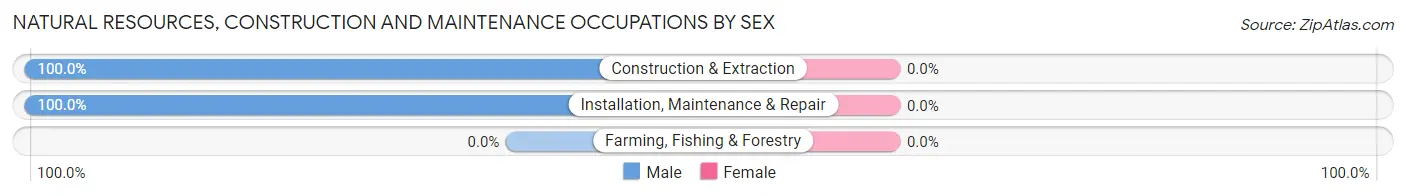
| Occupation | Male | Female |
| Farming, Fishing & Forestry | 0 (0.0%) | 0 (0.0%) |
| Construction & Extraction | 25 (100.0%) | 0 (0.0%) |
| Installation, Maintenance & Repair | 74 (100.0%) | 0 (0.0%) |
| Total (Category) | 99 (100.0%) | 0 (0.0%) |
| Total (Overall) | 224 (74.7%) | 76 (25.3%) |
Production, Transportation and Moving Occupations
The most common Production, Transportation and Moving occupations in Hometown are , and Production (48 | 16.0%).
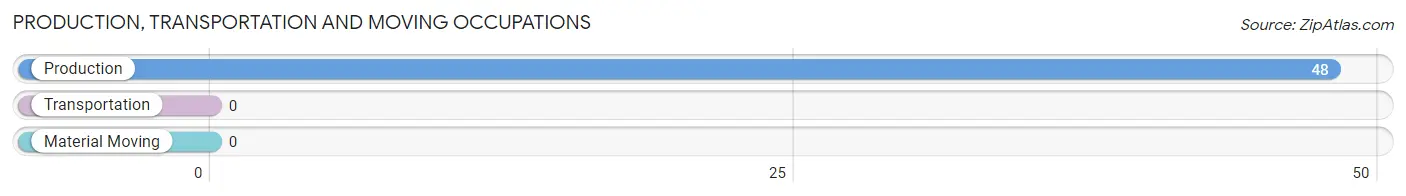
Production, Transportation and Moving Occupations by Sex
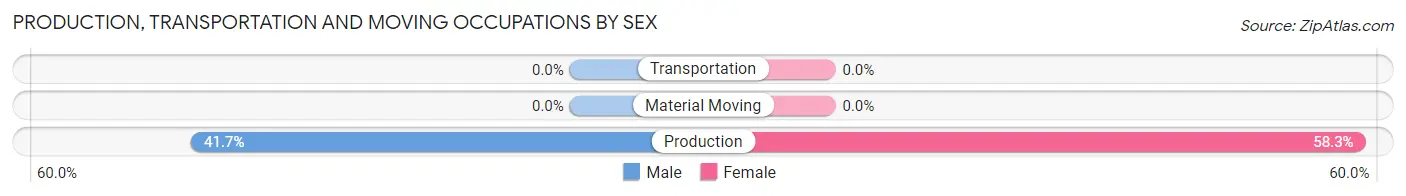
| Occupation | Male | Female |
| Production | 20 (41.7%) | 28 (58.3%) |
| Transportation | 0 (0.0%) | 0 (0.0%) |
| Material Moving | 0 (0.0%) | 0 (0.0%) |
| Total (Category) | 20 (41.7%) | 28 (58.3%) |
| Total (Overall) | 224 (74.7%) | 76 (25.3%) |
Employment Industries by Sex in Hometown
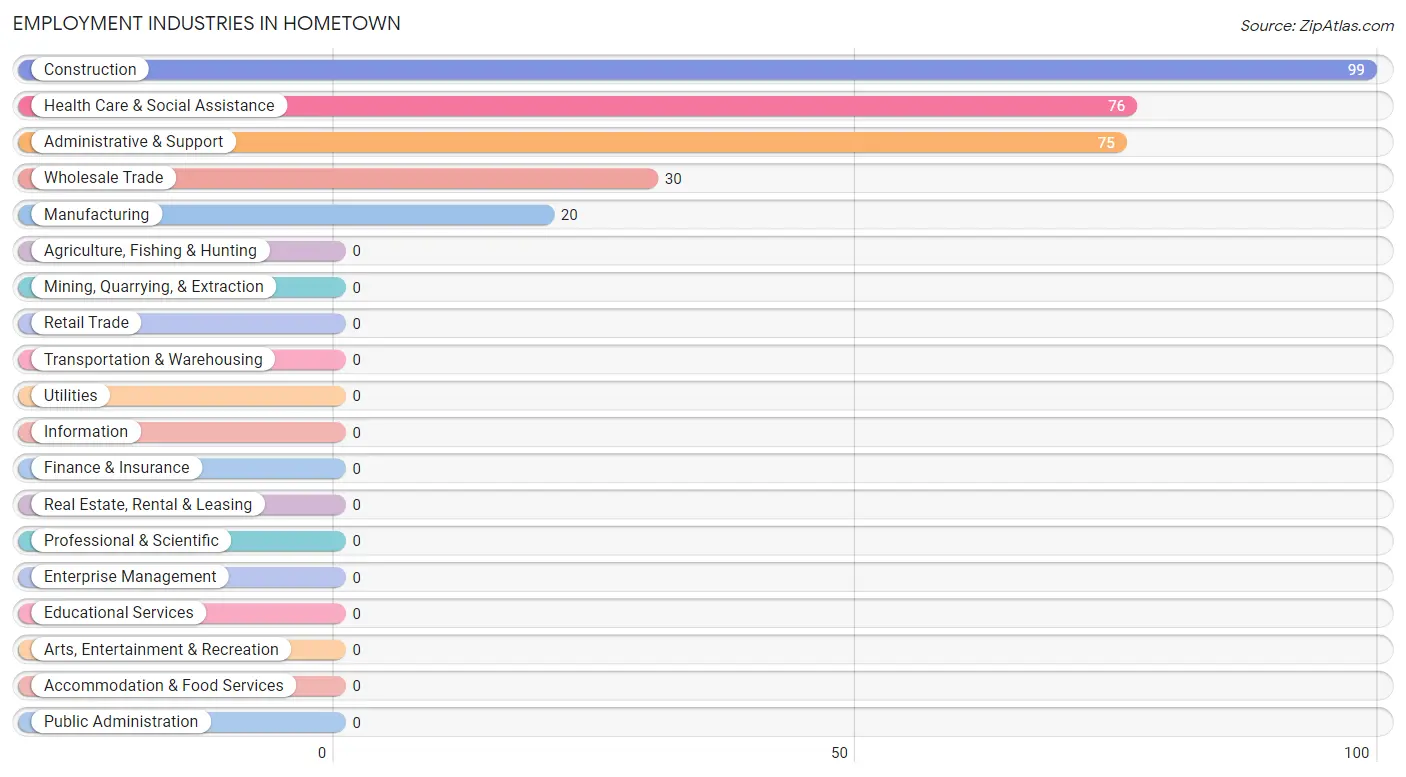
Employment Industries in Hometown
The major employment industries in Hometown include Construction (99 | 33.0%), Health Care & Social Assistance (76 | 25.3%), Administrative & Support (75 | 25.0%), Wholesale Trade (30 | 10.0%), and Manufacturing (20 | 6.7%).
Employment Industries by Sex in Hometown
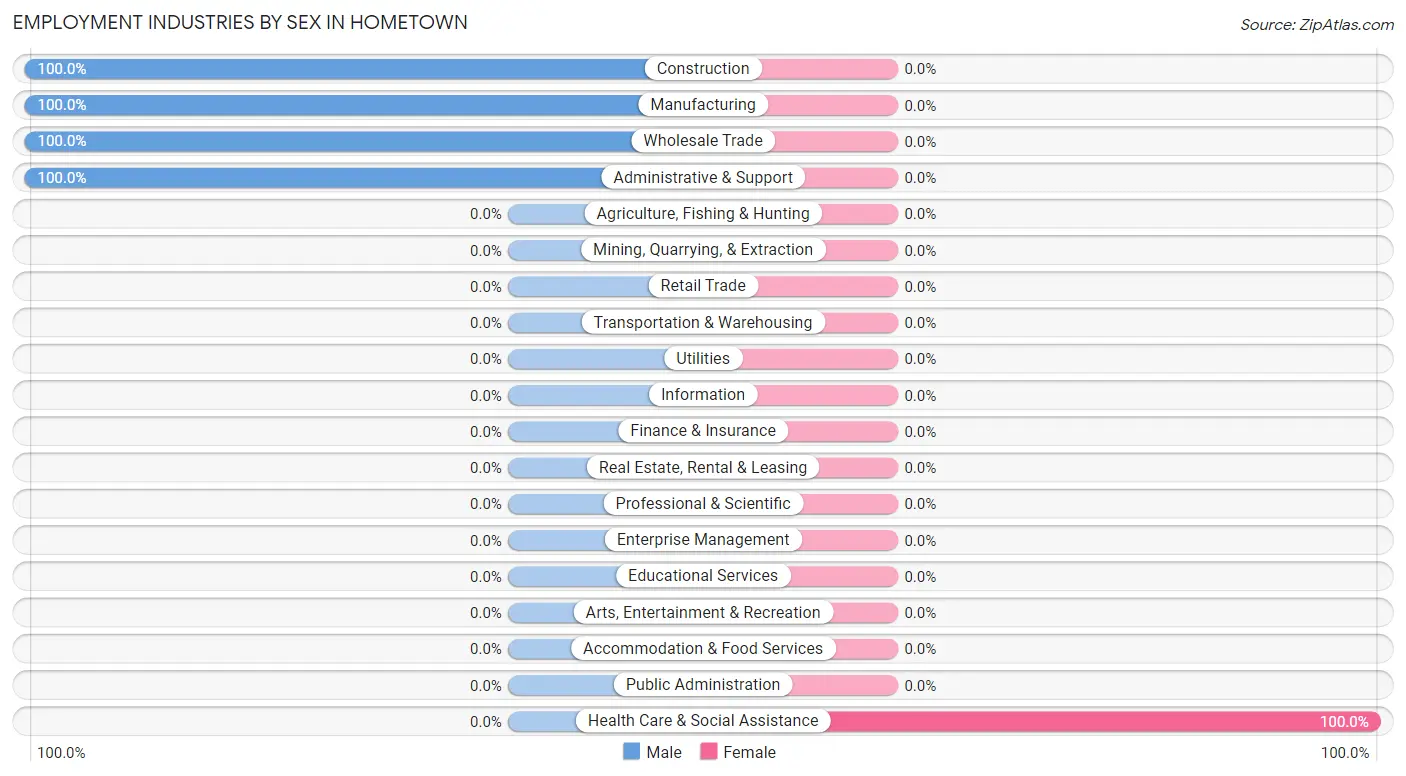
| Industry | Male | Female |
| Agriculture, Fishing & Hunting | 0 (0.0%) | 0 (0.0%) |
| Mining, Quarrying, & Extraction | 0 (0.0%) | 0 (0.0%) |
| Construction | 99 (100.0%) | 0 (0.0%) |
| Manufacturing | 20 (100.0%) | 0 (0.0%) |
| Wholesale Trade | 30 (100.0%) | 0 (0.0%) |
| Retail Trade | 0 (0.0%) | 0 (0.0%) |
| Transportation & Warehousing | 0 (0.0%) | 0 (0.0%) |
| Utilities | 0 (0.0%) | 0 (0.0%) |
| Information | 0 (0.0%) | 0 (0.0%) |
| Finance & Insurance | 0 (0.0%) | 0 (0.0%) |
| Real Estate, Rental & Leasing | 0 (0.0%) | 0 (0.0%) |
| Professional & Scientific | 0 (0.0%) | 0 (0.0%) |
| Enterprise Management | 0 (0.0%) | 0 (0.0%) |
| Administrative & Support | 75 (100.0%) | 0 (0.0%) |
| Educational Services | 0 (0.0%) | 0 (0.0%) |
| Health Care & Social Assistance | 0 (0.0%) | 76 (100.0%) |
| Arts, Entertainment & Recreation | 0 (0.0%) | 0 (0.0%) |
| Accommodation & Food Services | 0 (0.0%) | 0 (0.0%) |
| Public Administration | 0 (0.0%) | 0 (0.0%) |
| Total | 224 (74.7%) | 76 (25.3%) |
Education in Hometown
School Enrollment in Hometown
The most common levels of schooling among the 77 students in Hometown are elementary school (39 | 50.6%), and high school (38 | 49.3%).
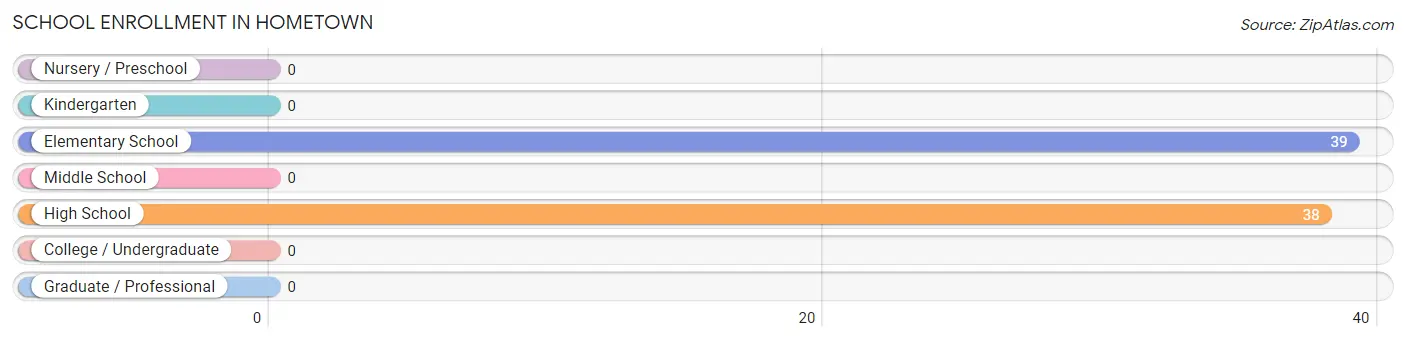
| School Level | # Students | % Students |
| Nursery / Preschool | 0 | 0.0% |
| Kindergarten | 0 | 0.0% |
| Elementary School | 39 | 50.6% |
| Middle School | 0 | 0.0% |
| High School | 38 | 49.3% |
| College / Undergraduate | 0 | 0.0% |
| Graduate / Professional | 0 | 0.0% |
| Total | 77 | 100.0% |
School Enrollment by Age by Funding Source in Hometown
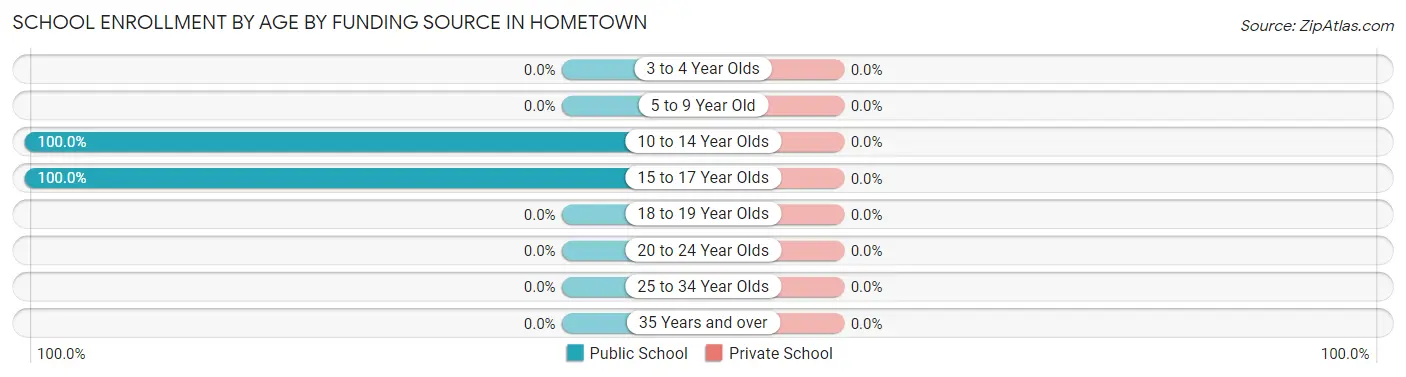
| Age Bracket | Public School | Private School |
| 3 to 4 Year Olds | 0 (0.0%) | 0 (0.0%) |
| 5 to 9 Year Old | 0 (0.0%) | 0 (0.0%) |
| 10 to 14 Year Olds | 39 (100.0%) | 0 (0.0%) |
| 15 to 17 Year Olds | 38 (100.0%) | 0 (0.0%) |
| 18 to 19 Year Olds | 0 (0.0%) | 0 (0.0%) |
| 20 to 24 Year Olds | 0 (0.0%) | 0 (0.0%) |
| 25 to 34 Year Olds | 0 (0.0%) | 0 (0.0%) |
| 35 Years and over | 0 (0.0%) | 0 (0.0%) |
| Total | 77 (100.0%) | 0 (0.0%) |
Educational Attainment by Field of Study in Hometown
Science & technology (48 | 63.2%), and arts & humanities (28 | 36.8%) are the most common fields of study among 76 individuals in Hometown who have obtained a bachelor's degree or higher.
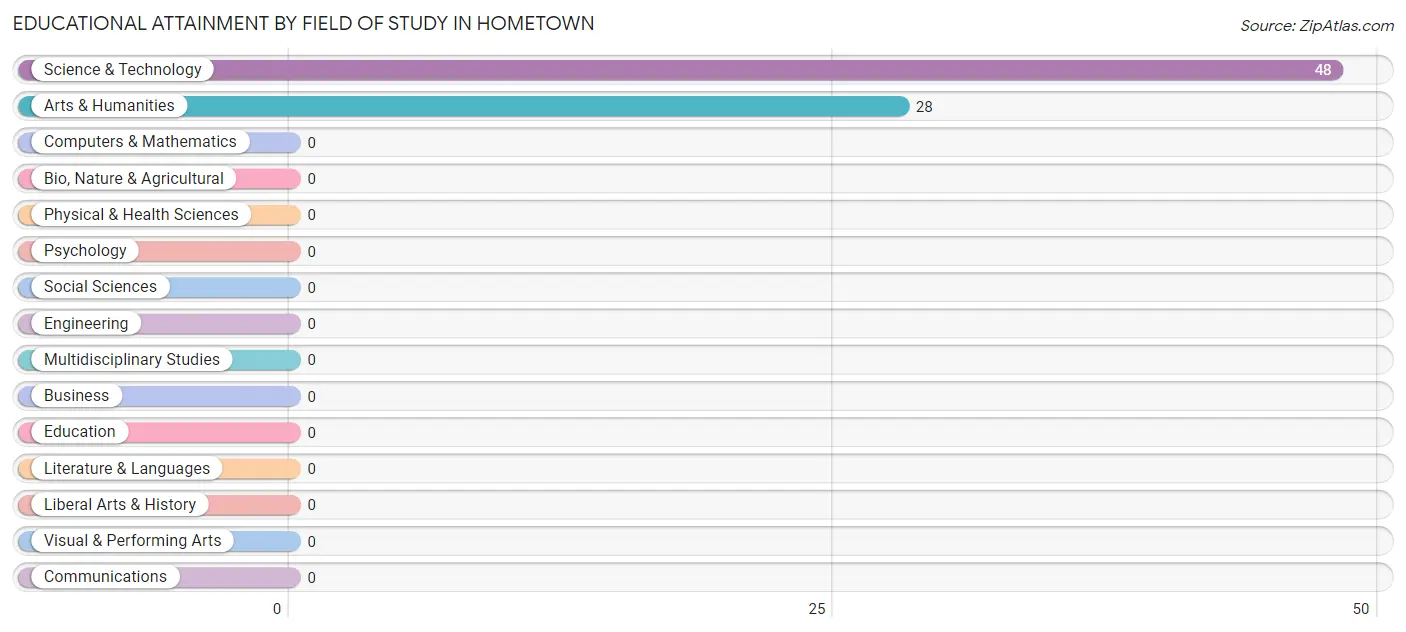
| Field of Study | # Graduates | % Graduates |
| Computers & Mathematics | 0 | 0.0% |
| Bio, Nature & Agricultural | 0 | 0.0% |
| Physical & Health Sciences | 0 | 0.0% |
| Psychology | 0 | 0.0% |
| Social Sciences | 0 | 0.0% |
| Engineering | 0 | 0.0% |
| Multidisciplinary Studies | 0 | 0.0% |
| Science & Technology | 48 | 63.2% |
| Business | 0 | 0.0% |
| Education | 0 | 0.0% |
| Literature & Languages | 0 | 0.0% |
| Liberal Arts & History | 0 | 0.0% |
| Visual & Performing Arts | 0 | 0.0% |
| Communications | 0 | 0.0% |
| Arts & Humanities | 28 | 36.8% |
| Total | 76 | 100.0% |
Transportation & Commute in Hometown
Vehicle Availability by Sex in Hometown
The most prevalent vehicle ownership categories in Hometown are males with 2 vehicles (119, accounting for 53.1%) and females with 2 vehicles (0, making up 156.6%).
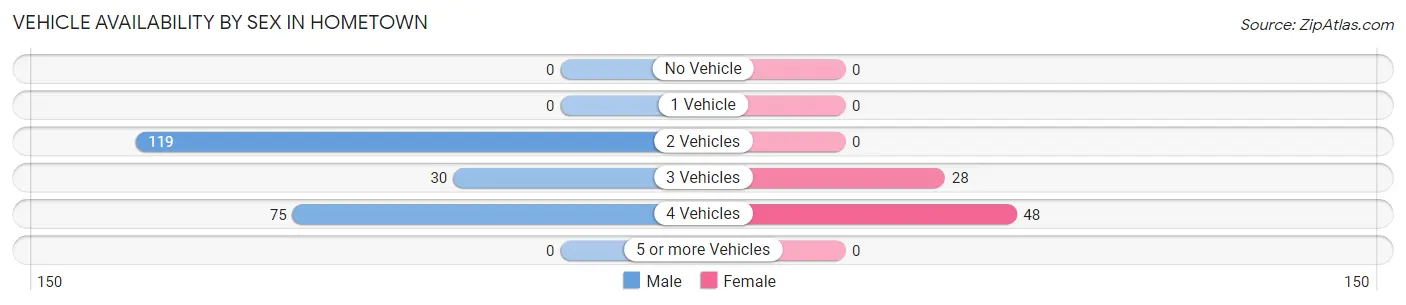
| Vehicles Available | Male | Female |
| No Vehicle | 0 (0.0%) | 0 (0.0%) |
| 1 Vehicle | 0 (0.0%) | 0 (0.0%) |
| 2 Vehicles | 119 (53.1%) | 0 (0.0%) |
| 3 Vehicles | 30 (13.4%) | 28 (36.8%) |
| 4 Vehicles | 75 (33.5%) | 48 (63.2%) |
| 5 or more Vehicles | 0 (0.0%) | 0 (0.0%) |
| Total | 224 (100.0%) | 76 (100.0%) |
Commute Time in Hometown
The most frequently occuring commute durations in Hometown are 30 to 34 minutes (149 commuters, 49.7%), 20 to 24 minutes (48 commuters, 16.0%), and 60 to 89 minutes (30 commuters, 10.0%).
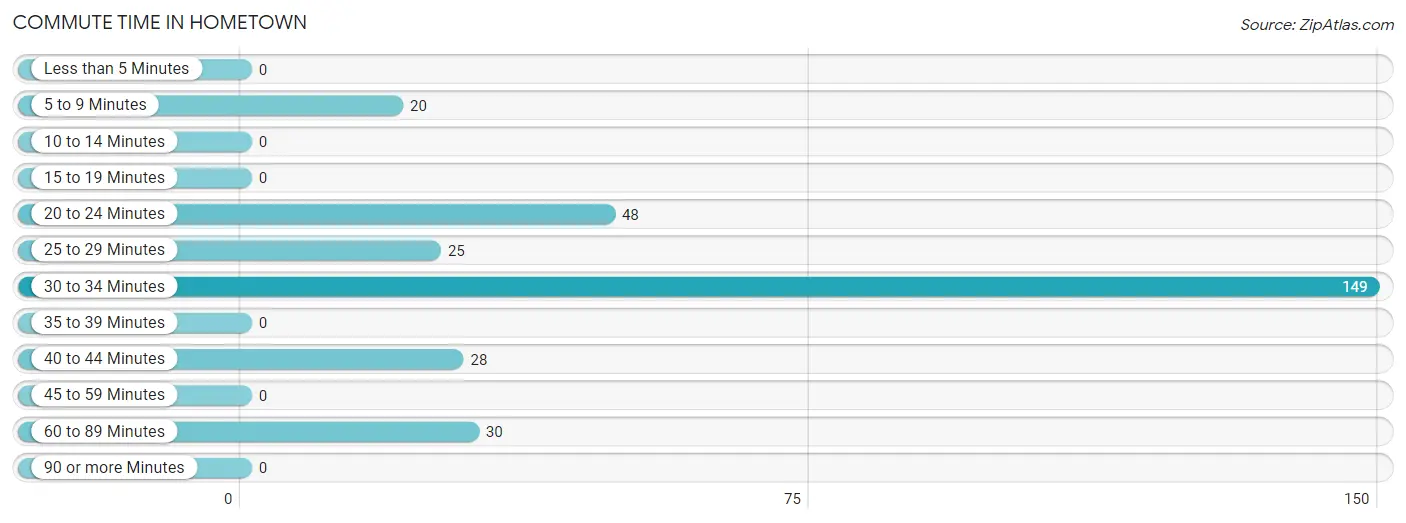
| Commute Time | # Commuters | % Commuters |
| Less than 5 Minutes | 0 | 0.0% |
| 5 to 9 Minutes | 20 | 6.7% |
| 10 to 14 Minutes | 0 | 0.0% |
| 15 to 19 Minutes | 0 | 0.0% |
| 20 to 24 Minutes | 48 | 16.0% |
| 25 to 29 Minutes | 25 | 8.3% |
| 30 to 34 Minutes | 149 | 49.7% |
| 35 to 39 Minutes | 0 | 0.0% |
| 40 to 44 Minutes | 28 | 9.3% |
| 45 to 59 Minutes | 0 | 0.0% |
| 60 to 89 Minutes | 30 | 10.0% |
| 90 or more Minutes | 0 | 0.0% |
Commute Time by Sex in Hometown
The most common commute times in Hometown are 30 to 34 minutes (149 commuters, 66.5%) for males and 20 to 24 minutes (48 commuters, 63.2%) for females.
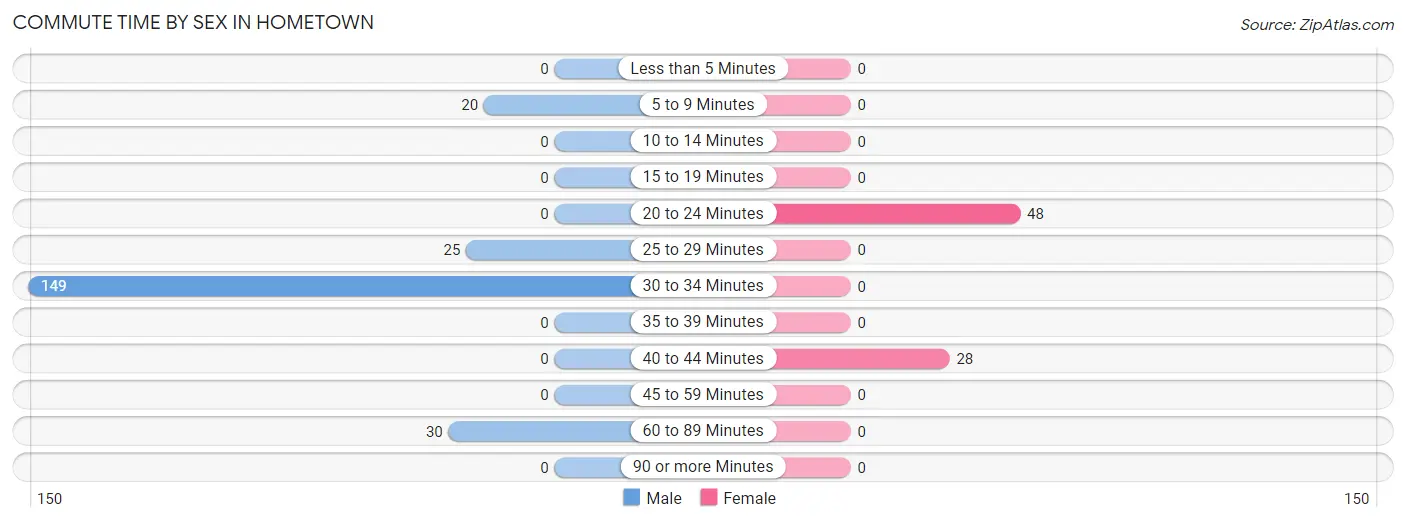
| Commute Time | Male | Female |
| Less than 5 Minutes | 0 (0.0%) | 0 (0.0%) |
| 5 to 9 Minutes | 20 (8.9%) | 0 (0.0%) |
| 10 to 14 Minutes | 0 (0.0%) | 0 (0.0%) |
| 15 to 19 Minutes | 0 (0.0%) | 0 (0.0%) |
| 20 to 24 Minutes | 0 (0.0%) | 48 (63.2%) |
| 25 to 29 Minutes | 25 (11.2%) | 0 (0.0%) |
| 30 to 34 Minutes | 149 (66.5%) | 0 (0.0%) |
| 35 to 39 Minutes | 0 (0.0%) | 0 (0.0%) |
| 40 to 44 Minutes | 0 (0.0%) | 28 (36.8%) |
| 45 to 59 Minutes | 0 (0.0%) | 0 (0.0%) |
| 60 to 89 Minutes | 30 (13.4%) | 0 (0.0%) |
| 90 or more Minutes | 0 (0.0%) | 0 (0.0%) |
Time of Departure to Work by Sex in Hometown
The most frequent times of departure to work in Hometown are 6:00 AM to 6:29 AM (104, 46.4%) for males and 5:30 AM to 5:59 AM (48, 63.2%) for females.
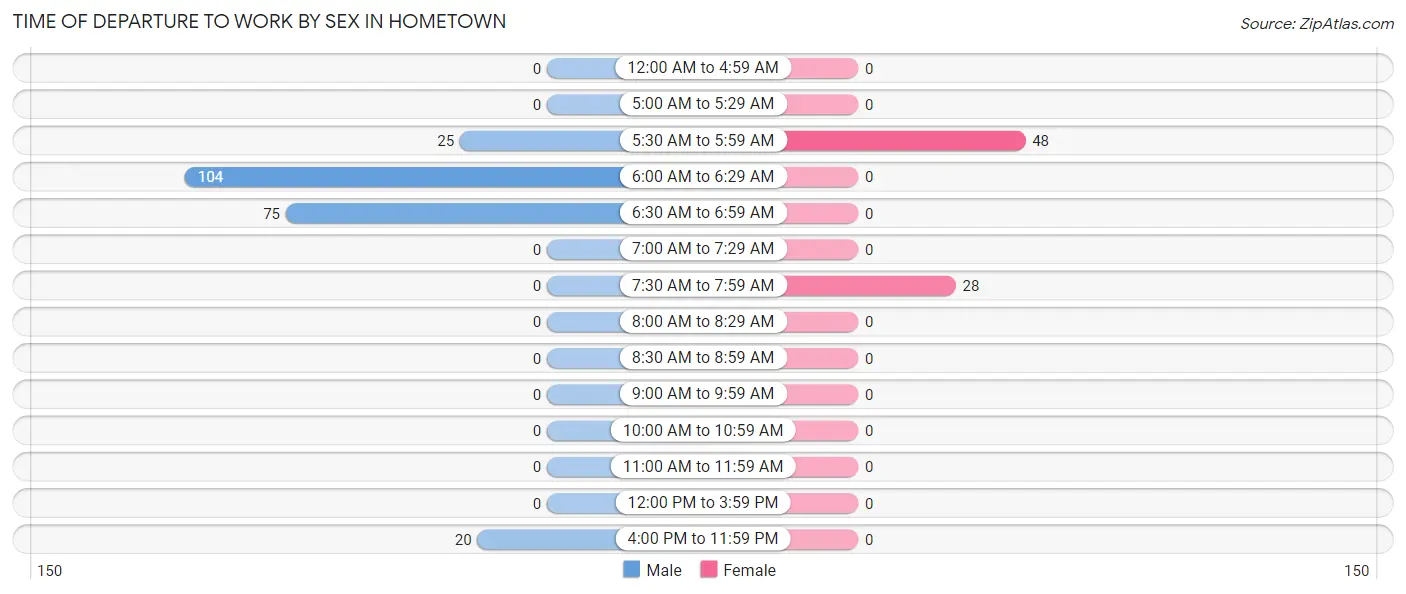
| Time of Departure | Male | Female |
| 12:00 AM to 4:59 AM | 0 (0.0%) | 0 (0.0%) |
| 5:00 AM to 5:29 AM | 0 (0.0%) | 0 (0.0%) |
| 5:30 AM to 5:59 AM | 25 (11.2%) | 48 (63.2%) |
| 6:00 AM to 6:29 AM | 104 (46.4%) | 0 (0.0%) |
| 6:30 AM to 6:59 AM | 75 (33.5%) | 0 (0.0%) |
| 7:00 AM to 7:29 AM | 0 (0.0%) | 0 (0.0%) |
| 7:30 AM to 7:59 AM | 0 (0.0%) | 28 (36.8%) |
| 8:00 AM to 8:29 AM | 0 (0.0%) | 0 (0.0%) |
| 8:30 AM to 8:59 AM | 0 (0.0%) | 0 (0.0%) |
| 9:00 AM to 9:59 AM | 0 (0.0%) | 0 (0.0%) |
| 10:00 AM to 10:59 AM | 0 (0.0%) | 0 (0.0%) |
| 11:00 AM to 11:59 AM | 0 (0.0%) | 0 (0.0%) |
| 12:00 PM to 3:59 PM | 0 (0.0%) | 0 (0.0%) |
| 4:00 PM to 11:59 PM | 20 (8.9%) | 0 (0.0%) |
| Total | 224 (100.0%) | 76 (100.0%) |
Housing Occupancy in Hometown
Occupancy by Ownership in Hometown
Of the total 335 dwellings in Hometown, owner-occupied units account for 310 (92.5%), while renter-occupied units make up 25 (7.5%).
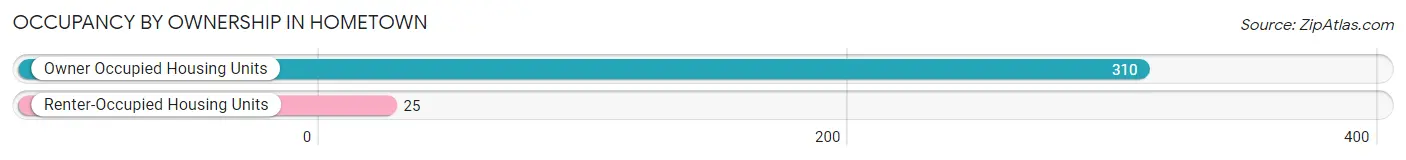
| Occupancy | # Housing Units | % Housing Units |
| Owner Occupied Housing Units | 310 | 92.5% |
| Renter-Occupied Housing Units | 25 | 7.5% |
| Total Occupied Housing Units | 335 | 100.0% |
Occupancy by Household Size in Hometown
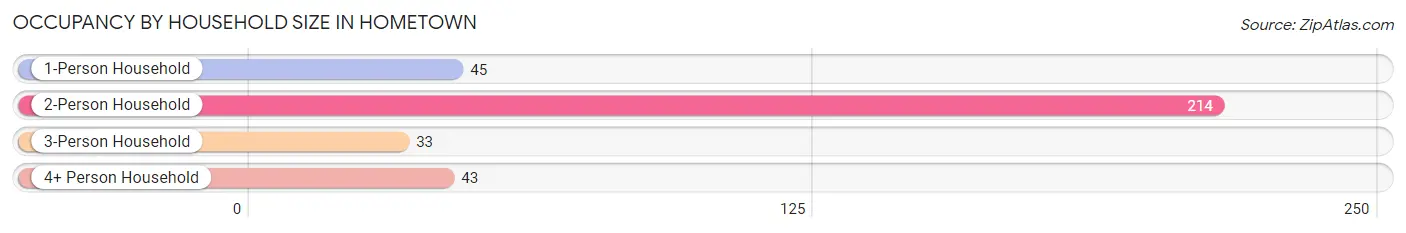
| Household Size | # Housing Units | % Housing Units |
| 1-Person Household | 45 | 13.4% |
| 2-Person Household | 214 | 63.9% |
| 3-Person Household | 33 | 9.9% |
| 4+ Person Household | 43 | 12.8% |
| Total Housing Units | 335 | 100.0% |
Occupancy by Ownership by Household Size in Hometown
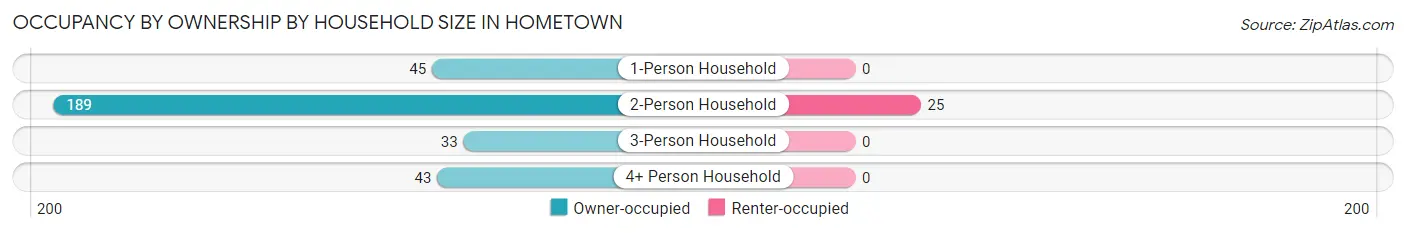
| Household Size | Owner-occupied | Renter-occupied |
| 1-Person Household | 45 (100.0%) | 0 (0.0%) |
| 2-Person Household | 189 (88.3%) | 25 (11.7%) |
| 3-Person Household | 33 (100.0%) | 0 (0.0%) |
| 4+ Person Household | 43 (100.0%) | 0 (0.0%) |
| Total Housing Units | 310 (92.5%) | 25 (7.5%) |
Occupancy by Educational Attainment in Hometown
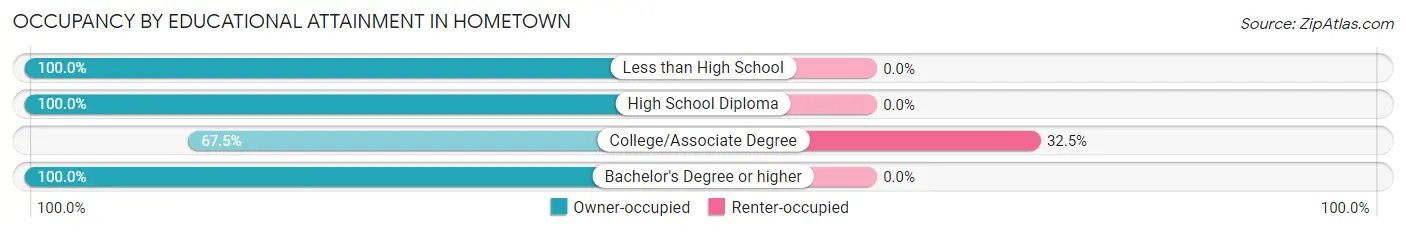
| Household Size | Owner-occupied | Renter-occupied |
| Less than High School | 45 (100.0%) | 0 (0.0%) |
| High School Diploma | 165 (100.0%) | 0 (0.0%) |
| College/Associate Degree | 52 (67.5%) | 25 (32.5%) |
| Bachelor's Degree or higher | 48 (100.0%) | 0 (0.0%) |
Occupancy by Age of Householder in Hometown
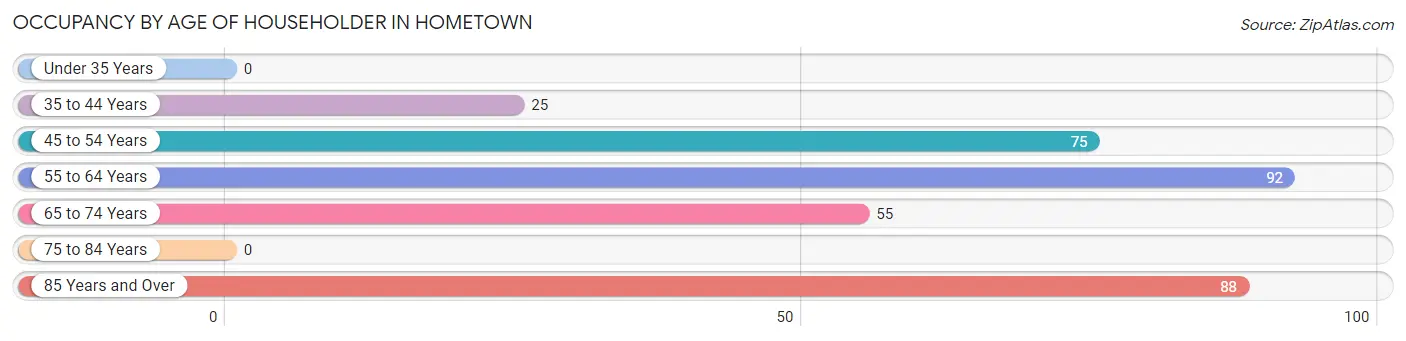
| Age Bracket | # Households | % Households |
| Under 35 Years | 0 | 0.0% |
| 35 to 44 Years | 25 | 7.5% |
| 45 to 54 Years | 75 | 22.4% |
| 55 to 64 Years | 92 | 27.5% |
| 65 to 74 Years | 55 | 16.4% |
| 75 to 84 Years | 0 | 0.0% |
| 85 Years and Over | 88 | 26.3% |
| Total | 335 | 100.0% |
Housing Finances in Hometown
Median Income by Occupancy in Hometown
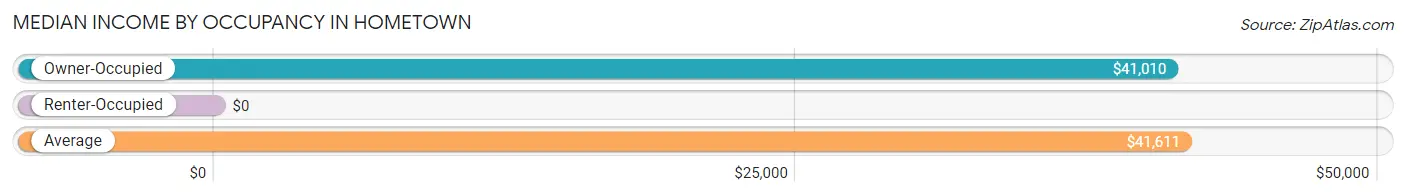
| Occupancy Type | # Households | Median Income |
| Owner-Occupied | 310 (92.5%) | $41,010 |
| Renter-Occupied | 25 (7.5%) | $0 |
| Average | 335 (100.0%) | $41,611 |
Occupancy by Householder Income Bracket in Hometown
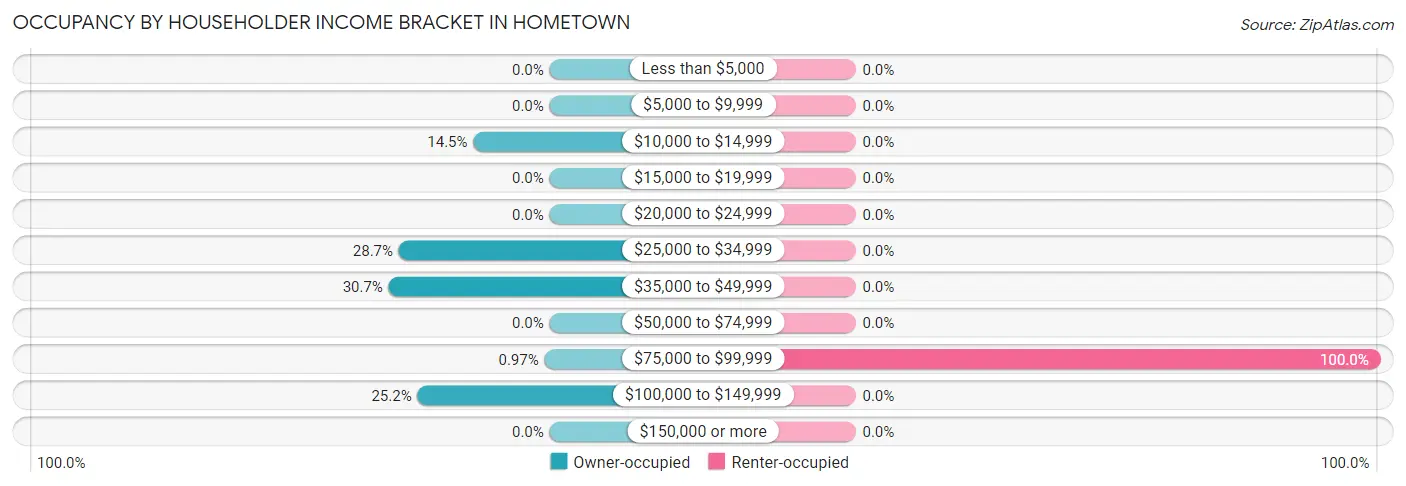
| Income Bracket | Owner-occupied | Renter-occupied |
| Less than $5,000 | 0 (0.0%) | 0 (0.0%) |
| $5,000 to $9,999 | 0 (0.0%) | 0 (0.0%) |
| $10,000 to $14,999 | 45 (14.5%) | 0 (0.0%) |
| $15,000 to $19,999 | 0 (0.0%) | 0 (0.0%) |
| $20,000 to $24,999 | 0 (0.0%) | 0 (0.0%) |
| $25,000 to $34,999 | 89 (28.7%) | 0 (0.0%) |
| $35,000 to $49,999 | 95 (30.6%) | 0 (0.0%) |
| $50,000 to $74,999 | 0 (0.0%) | 0 (0.0%) |
| $75,000 to $99,999 | 3 (1.0%) | 25 (100.0%) |
| $100,000 to $149,999 | 78 (25.2%) | 0 (0.0%) |
| $150,000 or more | 0 (0.0%) | 0 (0.0%) |
| Total | 310 (100.0%) | 25 (100.0%) |
Monthly Housing Cost Tiers in Hometown
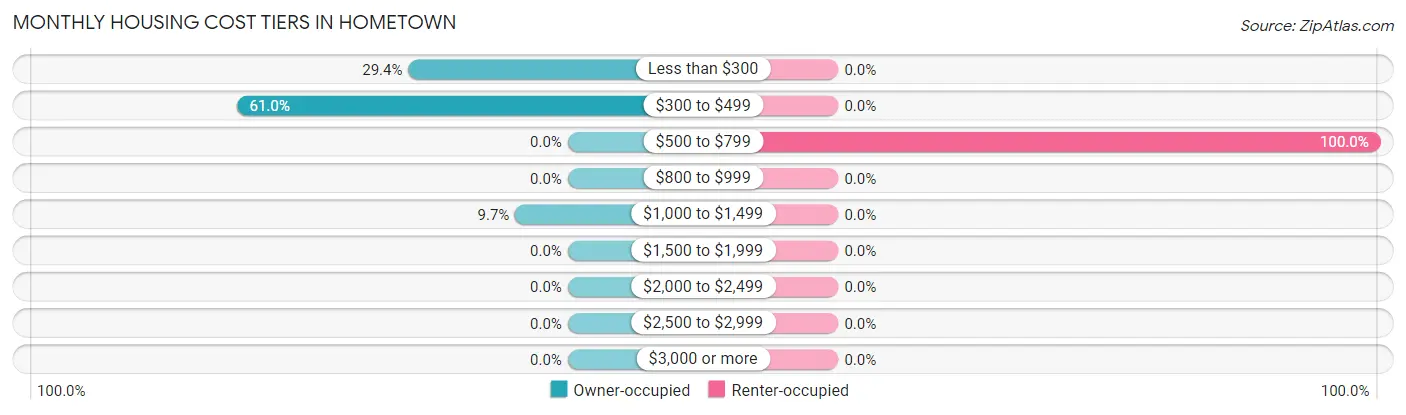
| Monthly Cost | Owner-occupied | Renter-occupied |
| Less than $300 | 91 (29.3%) | 0 (0.0%) |
| $300 to $499 | 189 (61.0%) | 0 (0.0%) |
| $500 to $799 | 0 (0.0%) | 25 (100.0%) |
| $800 to $999 | 0 (0.0%) | 0 (0.0%) |
| $1,000 to $1,499 | 30 (9.7%) | 0 (0.0%) |
| $1,500 to $1,999 | 0 (0.0%) | 0 (0.0%) |
| $2,000 to $2,499 | 0 (0.0%) | 0 (0.0%) |
| $2,500 to $2,999 | 0 (0.0%) | 0 (0.0%) |
| $3,000 or more | 0 (0.0%) | 0 (0.0%) |
| Total | 310 (100.0%) | 25 (100.0%) |
Physical Housing Characteristics in Hometown
Housing Structures in Hometown
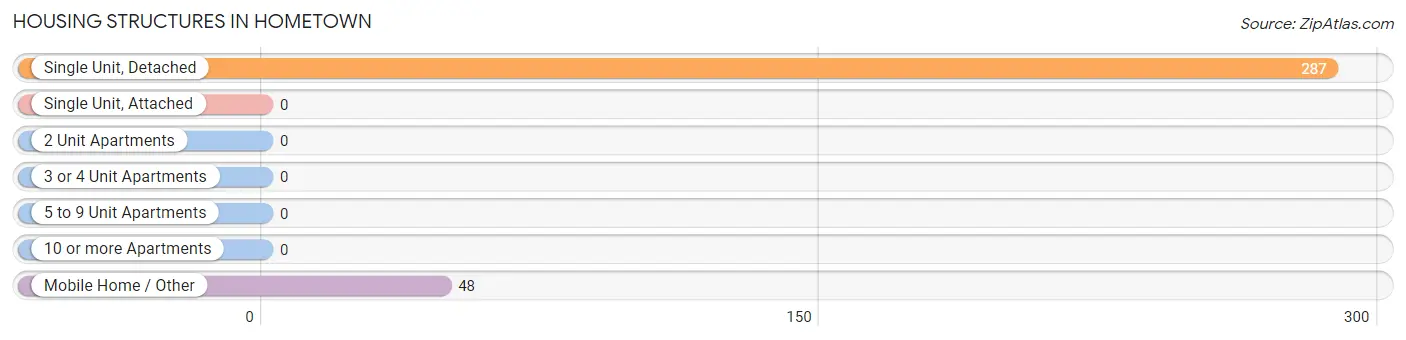
| Structure Type | # Housing Units | % Housing Units |
| Single Unit, Detached | 287 | 85.7% |
| Single Unit, Attached | 0 | 0.0% |
| 2 Unit Apartments | 0 | 0.0% |
| 3 or 4 Unit Apartments | 0 | 0.0% |
| 5 to 9 Unit Apartments | 0 | 0.0% |
| 10 or more Apartments | 0 | 0.0% |
| Mobile Home / Other | 48 | 14.3% |
| Total | 335 | 100.0% |
Housing Structures by Occupancy in Hometown
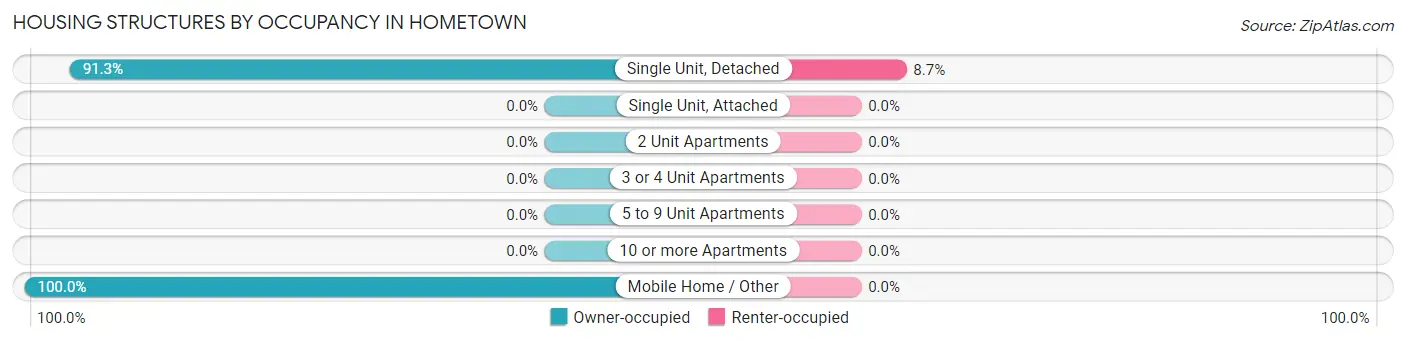
| Structure Type | Owner-occupied | Renter-occupied |
| Single Unit, Detached | 262 (91.3%) | 25 (8.7%) |
| Single Unit, Attached | 0 (0.0%) | 0 (0.0%) |
| 2 Unit Apartments | 0 (0.0%) | 0 (0.0%) |
| 3 or 4 Unit Apartments | 0 (0.0%) | 0 (0.0%) |
| 5 to 9 Unit Apartments | 0 (0.0%) | 0 (0.0%) |
| 10 or more Apartments | 0 (0.0%) | 0 (0.0%) |
| Mobile Home / Other | 48 (100.0%) | 0 (0.0%) |
| Total | 310 (92.5%) | 25 (7.5%) |
Housing Structures by Number of Rooms in Hometown
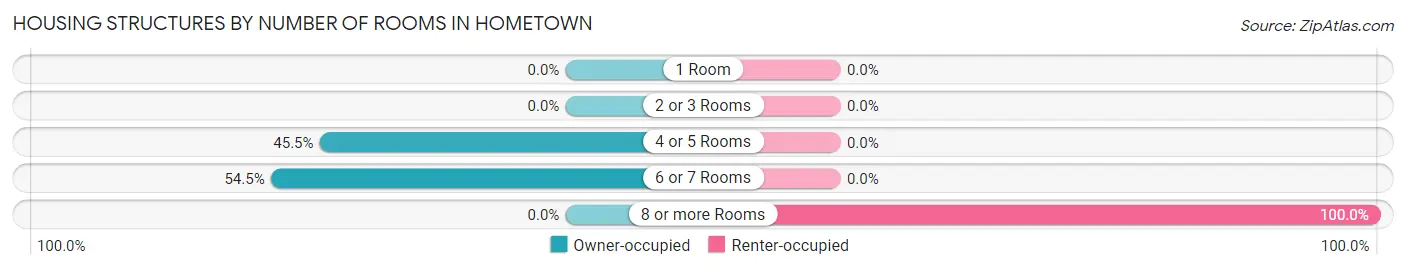
| Number of Rooms | Owner-occupied | Renter-occupied |
| 1 Room | 0 (0.0%) | 0 (0.0%) |
| 2 or 3 Rooms | 0 (0.0%) | 0 (0.0%) |
| 4 or 5 Rooms | 141 (45.5%) | 0 (0.0%) |
| 6 or 7 Rooms | 169 (54.5%) | 0 (0.0%) |
| 8 or more Rooms | 0 (0.0%) | 25 (100.0%) |
| Total | 310 (100.0%) | 25 (100.0%) |
Housing Structure by Heating Type in Hometown
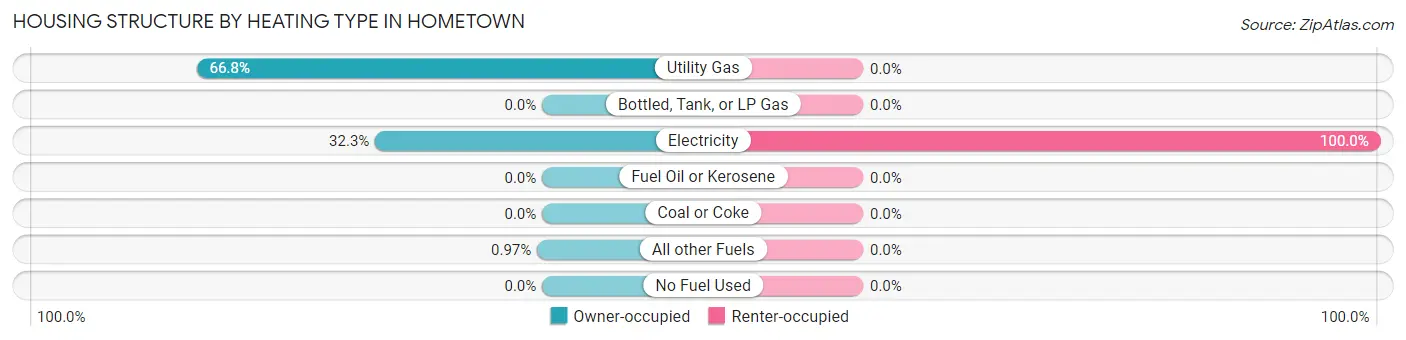
| Heating Type | Owner-occupied | Renter-occupied |
| Utility Gas | 207 (66.8%) | 0 (0.0%) |
| Bottled, Tank, or LP Gas | 0 (0.0%) | 0 (0.0%) |
| Electricity | 100 (32.3%) | 25 (100.0%) |
| Fuel Oil or Kerosene | 0 (0.0%) | 0 (0.0%) |
| Coal or Coke | 0 (0.0%) | 0 (0.0%) |
| All other Fuels | 3 (1.0%) | 0 (0.0%) |
| No Fuel Used | 0 (0.0%) | 0 (0.0%) |
| Total | 310 (100.0%) | 25 (100.0%) |
Household Vehicle Usage in Hometown
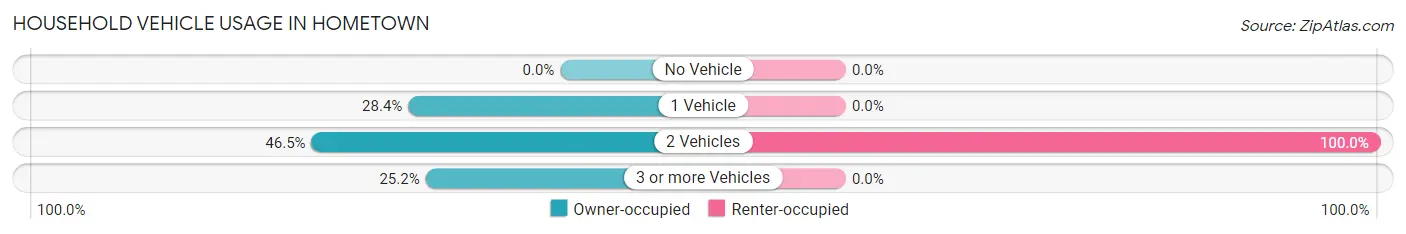
| Vehicles per Household | Owner-occupied | Renter-occupied |
| No Vehicle | 0 (0.0%) | 0 (0.0%) |
| 1 Vehicle | 88 (28.4%) | 0 (0.0%) |
| 2 Vehicles | 144 (46.5%) | 25 (100.0%) |
| 3 or more Vehicles | 78 (25.2%) | 0 (0.0%) |
| Total | 310 (100.0%) | 25 (100.0%) |
Real Estate & Mortgages in Hometown
Real Estate and Mortgage Overview in Hometown
| Characteristic | Without Mortgage | With Mortgage |
| Housing Units | 280 | 30 |
| Median Property Value | $162,500 | $0 |
| Median Household Income | $40,288 | $0 |
| Monthly Housing Costs | $328 | $0 |
| Real Estate Taxes | $600 | $0 |
Property Value by Mortgage Status in Hometown
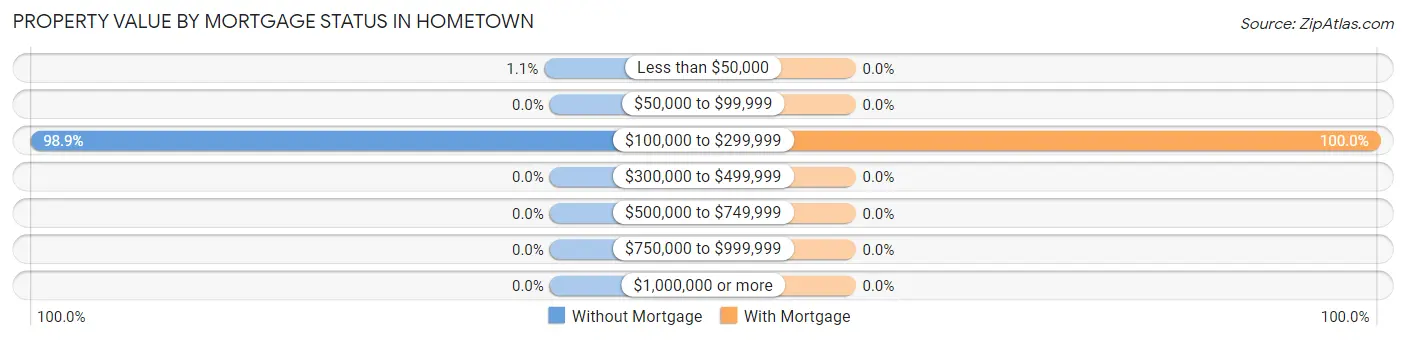
| Property Value | Without Mortgage | With Mortgage |
| Less than $50,000 | 3 (1.1%) | 0 (0.0%) |
| $50,000 to $99,999 | 0 (0.0%) | 0 (0.0%) |
| $100,000 to $299,999 | 277 (98.9%) | 30 (100.0%) |
| $300,000 to $499,999 | 0 (0.0%) | 0 (0.0%) |
| $500,000 to $749,999 | 0 (0.0%) | 0 (0.0%) |
| $750,000 to $999,999 | 0 (0.0%) | 0 (0.0%) |
| $1,000,000 or more | 0 (0.0%) | 0 (0.0%) |
| Total | 280 (100.0%) | 30 (100.0%) |
Household Income by Mortgage Status in Hometown
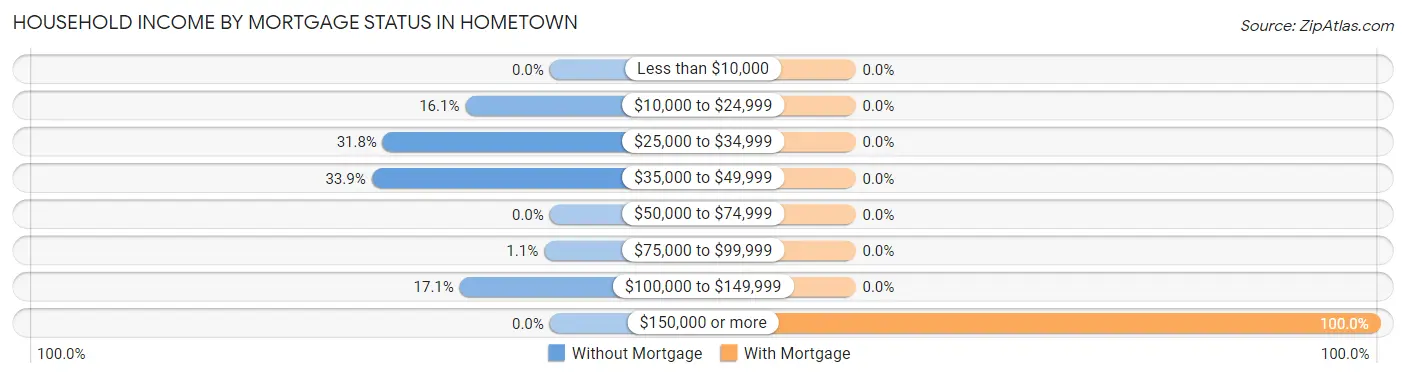
| Household Income | Without Mortgage | With Mortgage |
| Less than $10,000 | 0 (0.0%) | 0 (0.0%) |
| $10,000 to $24,999 | 45 (16.1%) | 0 (0.0%) |
| $25,000 to $34,999 | 89 (31.8%) | 0 (0.0%) |
| $35,000 to $49,999 | 95 (33.9%) | 0 (0.0%) |
| $50,000 to $74,999 | 0 (0.0%) | 0 (0.0%) |
| $75,000 to $99,999 | 3 (1.1%) | 0 (0.0%) |
| $100,000 to $149,999 | 48 (17.1%) | 0 (0.0%) |
| $150,000 or more | 0 (0.0%) | 30 (100.0%) |
| Total | 280 (100.0%) | 30 (100.0%) |
Property Value to Household Income Ratio in Hometown
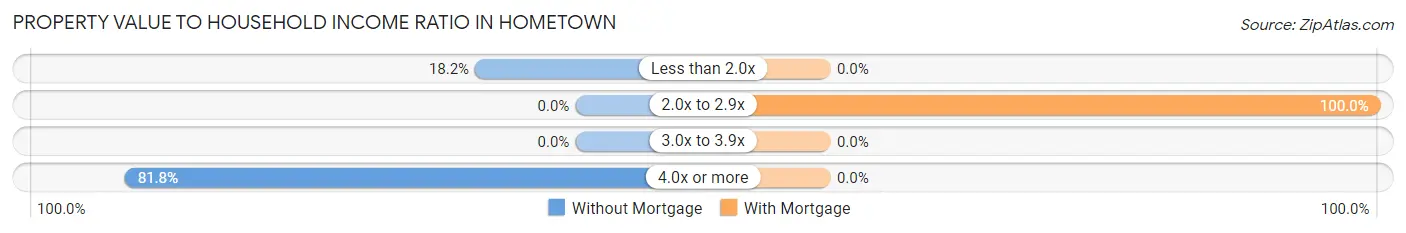
| Value-to-Income Ratio | Without Mortgage | With Mortgage |
| Less than 2.0x | 51 (18.2%) | 0 (0.0%) |
| 2.0x to 2.9x | 0 (0.0%) | 30 (100.0%) |
| 3.0x to 3.9x | 0 (0.0%) | 0 (0.0%) |
| 4.0x or more | 229 (81.8%) | 0 (0.0%) |
| Total | 280 (100.0%) | 30 (100.0%) |
Real Estate Taxes by Mortgage Status in Hometown
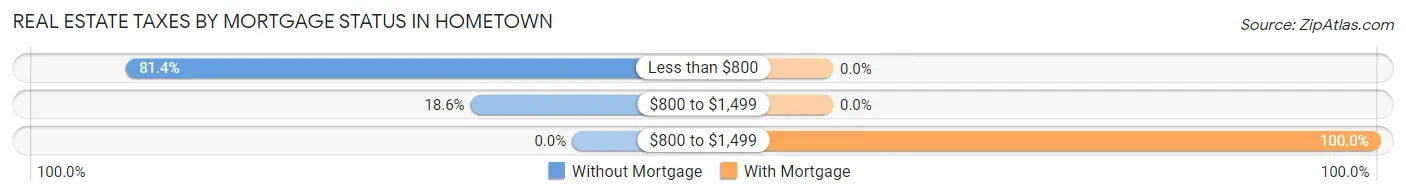
| Property Taxes | Without Mortgage | With Mortgage |
| Less than $800 | 228 (81.4%) | 0 (0.0%) |
| $800 to $1,499 | 52 (18.6%) | 0 (0.0%) |
| $800 to $1,499 | 0 (0.0%) | 30 (100.0%) |
| Total | 280 (100.0%) | 30 (100.0%) |
Health & Disability in Hometown
Health Insurance Coverage by Age in Hometown
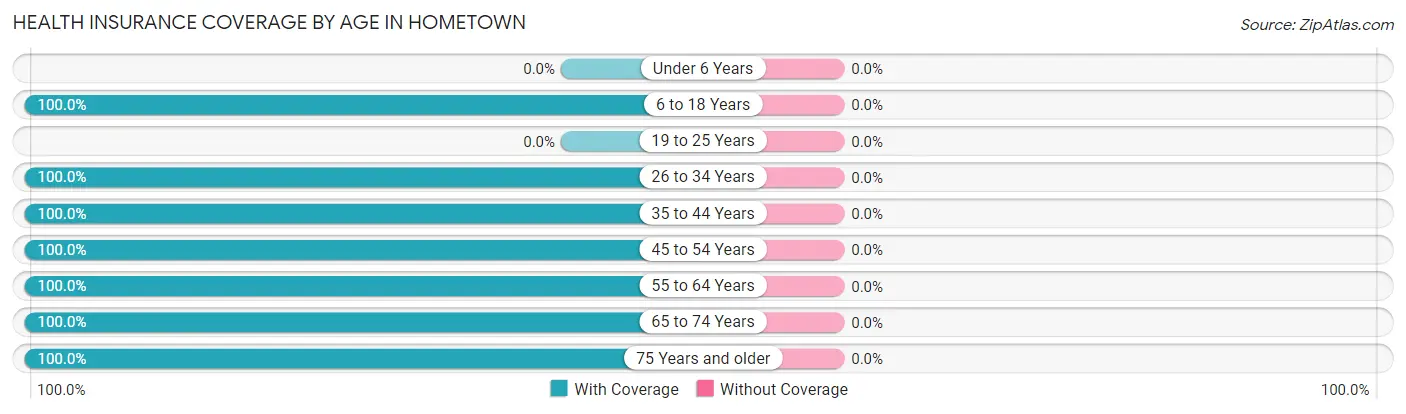
| Age Bracket | With Coverage | Without Coverage |
| Under 6 Years | 0 (0.0%) | 0 (0.0%) |
| 6 to 18 Years | 77 (100.0%) | 0 (0.0%) |
| 19 to 25 Years | 0 (0.0%) | 0 (0.0%) |
| 26 to 34 Years | 121 (100.0%) | 0 (0.0%) |
| 35 to 44 Years | 25 (100.0%) | 0 (0.0%) |
| 45 to 54 Years | 123 (100.0%) | 0 (0.0%) |
| 55 to 64 Years | 321 (100.0%) | 0 (0.0%) |
| 65 to 74 Years | 114 (100.0%) | 0 (0.0%) |
| 75 Years and older | 88 (100.0%) | 0 (0.0%) |
| Total | 869 (100.0%) | 0 (0.0%) |
Health Insurance Coverage by Citizenship Status in Hometown
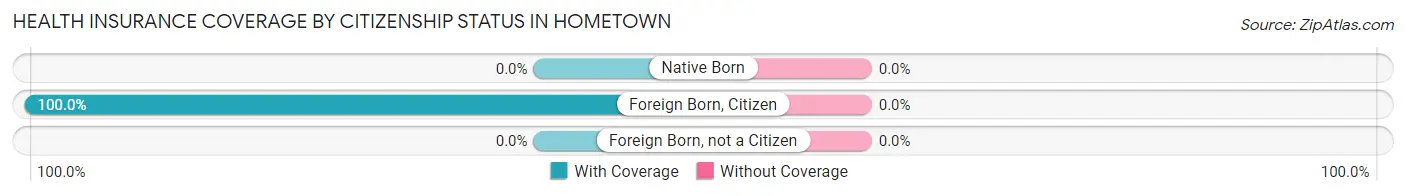
| Citizenship Status | With Coverage | Without Coverage |
| Native Born | 0 (0.0%) | 0 (0.0%) |
| Foreign Born, Citizen | 77 (100.0%) | 0 (0.0%) |
| Foreign Born, not a Citizen | 0 (0.0%) | 0 (0.0%) |
Health Insurance Coverage by Household Income in Hometown
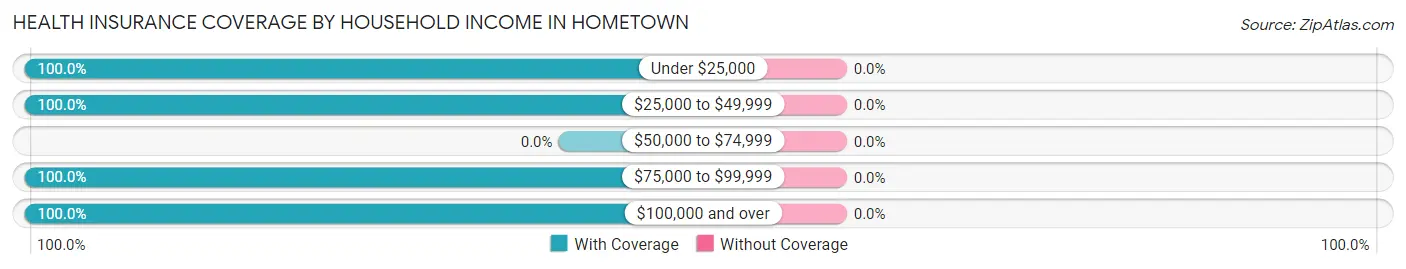
| Household Income | With Coverage | Without Coverage |
| Under $25,000 | 119 (100.0%) | 0 (0.0%) |
| $25,000 to $49,999 | 436 (100.0%) | 0 (0.0%) |
| $50,000 to $74,999 | 0 (0.0%) | 0 (0.0%) |
| $75,000 to $99,999 | 95 (100.0%) | 0 (0.0%) |
| $100,000 and over | 219 (100.0%) | 0 (0.0%) |
Public vs Private Health Insurance Coverage by Age in Hometown
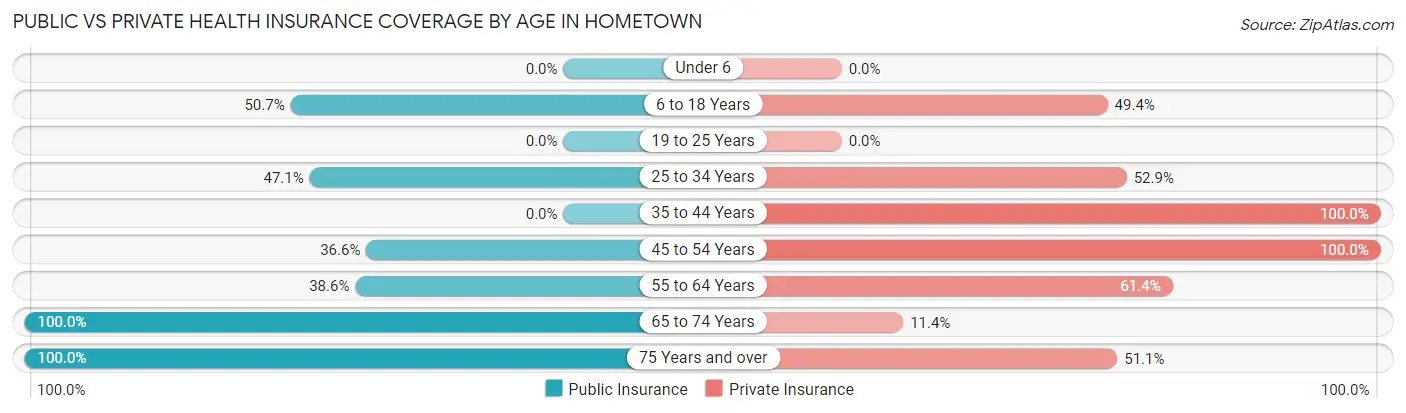
| Age Bracket | Public Insurance | Private Insurance |
| Under 6 | 0 (0.0%) | 0 (0.0%) |
| 6 to 18 Years | 39 (50.6%) | 38 (49.3%) |
| 19 to 25 Years | 0 (0.0%) | 0 (0.0%) |
| 25 to 34 Years | 57 (47.1%) | 64 (52.9%) |
| 35 to 44 Years | 0 (0.0%) | 25 (100.0%) |
| 45 to 54 Years | 45 (36.6%) | 123 (100.0%) |
| 55 to 64 Years | 124 (38.6%) | 197 (61.4%) |
| 65 to 74 Years | 114 (100.0%) | 13 (11.4%) |
| 75 Years and over | 88 (100.0%) | 45 (51.1%) |
| Total | 467 (53.7%) | 505 (58.1%) |
Disability Status by Sex by Age in Hometown
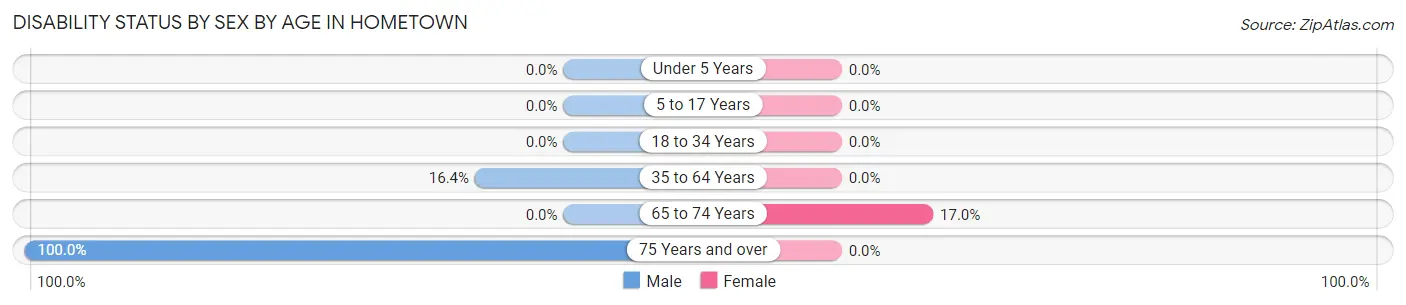
| Age Bracket | Male | Female |
| Under 5 Years | 0 (0.0%) | 0 (0.0%) |
| 5 to 17 Years | 0 (0.0%) | 0 (0.0%) |
| 18 to 34 Years | 0 (0.0%) | 0 (0.0%) |
| 35 to 64 Years | 44 (16.4%) | 0 (0.0%) |
| 65 to 74 Years | 0 (0.0%) | 10 (17.0%) |
| 75 Years and over | 45 (100.0%) | 0 (0.0%) |
Disability Class by Sex by Age in Hometown
Disability Class: Hearing Difficulty
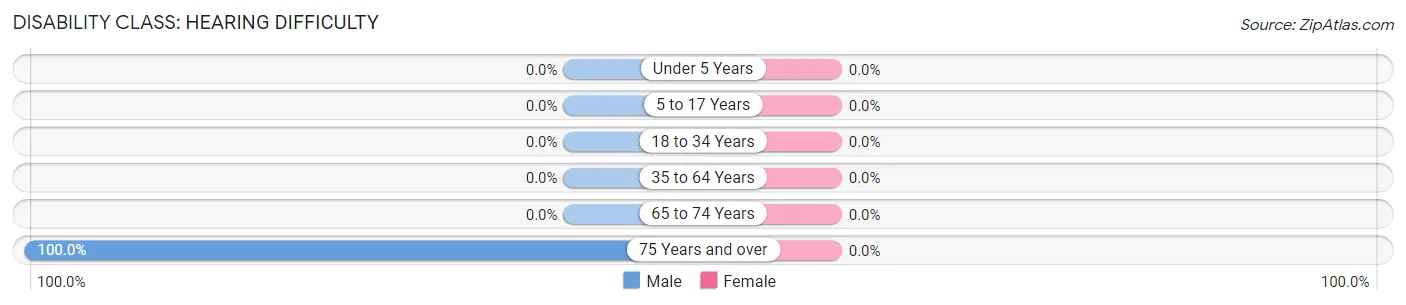
| Age Bracket | Male | Female |
| Under 5 Years | 0 (0.0%) | 0 (0.0%) |
| 5 to 17 Years | 0 (0.0%) | 0 (0.0%) |
| 18 to 34 Years | 0 (0.0%) | 0 (0.0%) |
| 35 to 64 Years | 0 (0.0%) | 0 (0.0%) |
| 65 to 74 Years | 0 (0.0%) | 0 (0.0%) |
| 75 Years and over | 45 (100.0%) | 0 (0.0%) |
Disability Class: Vision Difficulty
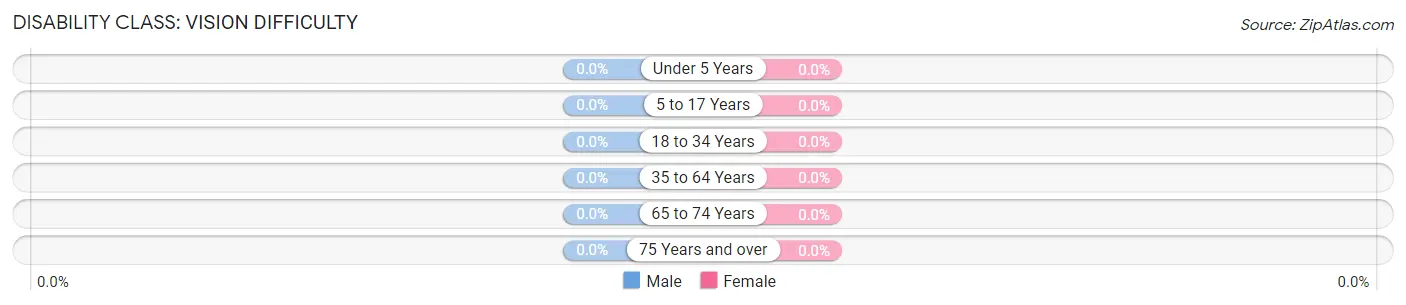
| Age Bracket | Male | Female |
| Under 5 Years | 0 (0.0%) | 0 (0.0%) |
| 5 to 17 Years | 0 (0.0%) | 0 (0.0%) |
| 18 to 34 Years | 0 (0.0%) | 0 (0.0%) |
| 35 to 64 Years | 0 (0.0%) | 0 (0.0%) |
| 65 to 74 Years | 0 (0.0%) | 0 (0.0%) |
| 75 Years and over | 0 (0.0%) | 0 (0.0%) |
Disability Class: Cognitive Difficulty
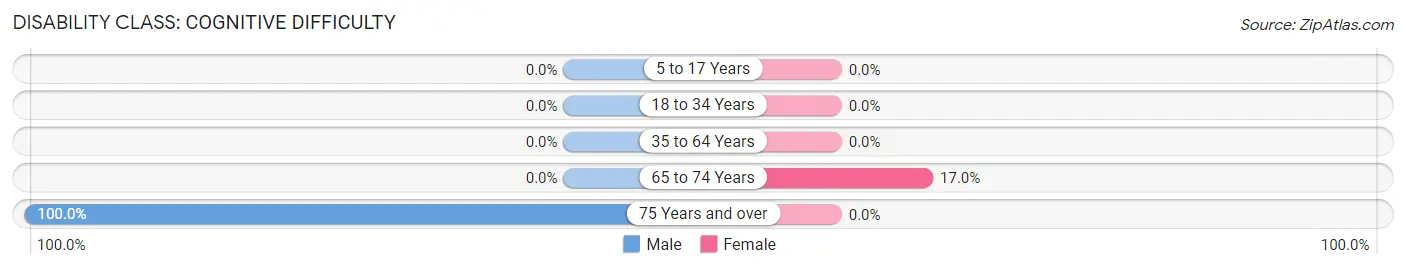
| Age Bracket | Male | Female |
| 5 to 17 Years | 0 (0.0%) | 0 (0.0%) |
| 18 to 34 Years | 0 (0.0%) | 0 (0.0%) |
| 35 to 64 Years | 0 (0.0%) | 0 (0.0%) |
| 65 to 74 Years | 0 (0.0%) | 10 (17.0%) |
| 75 Years and over | 45 (100.0%) | 0 (0.0%) |
Disability Class: Ambulatory Difficulty
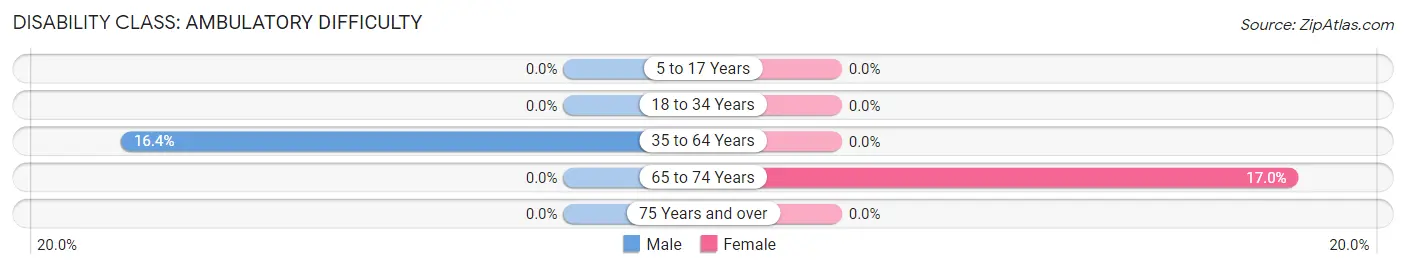
| Age Bracket | Male | Female |
| 5 to 17 Years | 0 (0.0%) | 0 (0.0%) |
| 18 to 34 Years | 0 (0.0%) | 0 (0.0%) |
| 35 to 64 Years | 44 (16.4%) | 0 (0.0%) |
| 65 to 74 Years | 0 (0.0%) | 10 (17.0%) |
| 75 Years and over | 0 (0.0%) | 0 (0.0%) |
Disability Class: Self-Care Difficulty
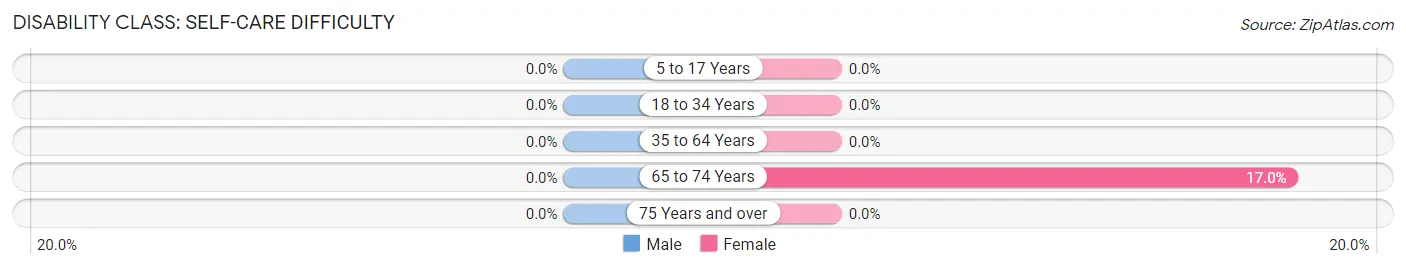
| Age Bracket | Male | Female |
| 5 to 17 Years | 0 (0.0%) | 0 (0.0%) |
| 18 to 34 Years | 0 (0.0%) | 0 (0.0%) |
| 35 to 64 Years | 0 (0.0%) | 0 (0.0%) |
| 65 to 74 Years | 0 (0.0%) | 10 (17.0%) |
| 75 Years and over | 0 (0.0%) | 0 (0.0%) |
Technology Access in Hometown
Computing Device Access in Hometown
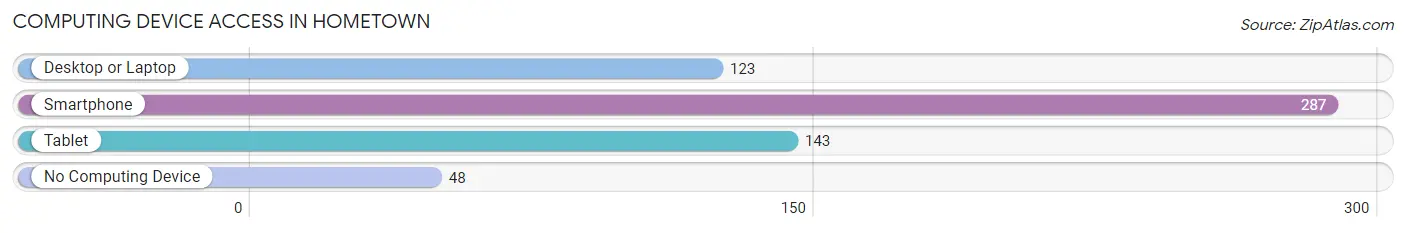
| Device Type | # Households | % Households |
| Desktop or Laptop | 123 | 36.7% |
| Smartphone | 287 | 85.7% |
| Tablet | 143 | 42.7% |
| No Computing Device | 48 | 14.3% |
| Total | 335 | 100.0% |
Internet Access in Hometown
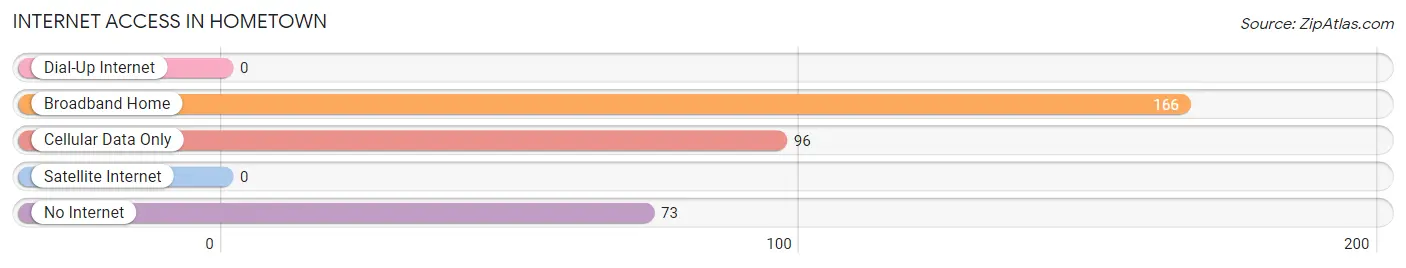
| Internet Type | # Households | % Households |
| Dial-Up Internet | 0 | 0.0% |
| Broadband Home | 166 | 49.5% |
| Cellular Data Only | 96 | 28.7% |
| Satellite Internet | 0 | 0.0% |
| No Internet | 73 | 21.8% |
| Total | 335 | 100.0% |
Hometown Summary
Hometown, West Virginia is a small town located in the Appalachian Mountains of West Virginia. It is situated in the northern part of the state, near the border of Maryland and Pennsylvania. The town has a population of approximately 1,500 people and is the county seat of Preston County.
Geography
Hometown is located in the Appalachian Mountains of West Virginia, in the northern part of the state. It is situated in the Cheat River Valley, near the border of Maryland and Pennsylvania. The town is surrounded by rolling hills and mountains, with the highest peak in the area being Cheat Mountain, which rises to an elevation of 4,863 feet. The town is located at an elevation of 1,890 feet.
The climate in Hometown is humid continental, with hot summers and cold winters. The average annual temperature is around 50 degrees Fahrenheit, with the average high temperature in the summer months reaching around 80 degrees Fahrenheit and the average low temperature in the winter months reaching around 20 degrees Fahrenheit. The average annual precipitation is around 40 inches.
Economy
The economy of Hometown is largely based on agriculture and tourism. The town is home to several farms, which produce a variety of crops, including corn, wheat, hay, and vegetables. The town also has several small businesses, including restaurants, shops, and a few small manufacturing companies.
Tourism is an important part of the economy in Hometown. The town is home to several attractions, including the Preston County Historical Museum, the Hometown Historical Society, and the Hometown Arts Council. The town also hosts several festivals throughout the year, including the Hometown Harvest Festival and the Hometown Music Festival.
Demographics
As of the 2010 census, the population of Hometown was 1,500 people. The racial makeup of the town was 97.3% White, 0.7% African American, 0.3% Native American, 0.3% Asian, and 1.3% from two or more races. The median household income was $35,000, and the median family income was $41,000.
The town is home to several churches, including the Hometown United Methodist Church, the Hometown Baptist Church, and the Hometown Presbyterian Church. The town also has a public library, a post office, and a few small parks.
Conclusion
Hometown, West Virginia is a small town located in the Appalachian Mountains of West Virginia. It is situated in the northern part of the state, near the border of Maryland and Pennsylvania. The town has a population of approximately 1,500 people and is the county seat of Preston County. The economy of Hometown is largely based on agriculture and tourism, and the town is home to several attractions, including the Preston County Historical Museum, the Hometown Historical Society, and the Hometown Arts Council. The racial makeup of the town is 97.3% White, 0.7% African American, 0.3% Native American, 0.3% Asian, and 1.3% from two or more races. The median household income was $35,000, and the median family income was $41,000.
Common Questions
What is Per Capita Income in Hometown?
Per Capita income in Hometown is $24,370.
What is the Median Household income in Hometown?
Median Household Income in Hometown is $41,611.
What is Inequality or Gini Index in Hometown?
Inequality or Gini Index in Hometown is 0.34.
What is the Total Population of Hometown?
Total Population of Hometown is 869.
What is the Total Male Population of Hometown?
Total Male Population of Hometown is 470.
What is the Total Female Population of Hometown?
Total Female Population of Hometown is 399.
What is the Ratio of Males per 100 Females in Hometown?
There are 117.79 Males per 100 Females in Hometown.
What is the Ratio of Females per 100 Males in Hometown?
There are 84.89 Females per 100 Males in Hometown.
What is the Median Population Age in Hometown?
Median Population Age in Hometown is 56.4 Years.
What is the Average Family Size in Hometown
Average Family Size in Hometown is 2.6 People.
What is the Average Household Size in Hometown
Average Household Size in Hometown is 2.6 People.
How Large is the Labor Force in Hometown?
There are 337 People in the Labor Forcein in Hometown.
What is the Percentage of People in the Labor Force in Hometown?
40.6% of People are in the Labor Force in Hometown.
What is the Unemployment Rate in Hometown?
Unemployment Rate in Hometown is 11.0%.