Monaville, WV Map & Demographics
Monaville Map
Monaville Overview
$14,720
PER CAPITA INCOME
$32,010
AVG FAMILY INCOME
$33,924
AVG HOUSEHOLD INCOME
0.28
INEQUALITY / GINI INDEX
666
TOTAL POPULATION
374
MALE POPULATION
292
FEMALE POPULATION
128.08
MALES / 100 FEMALES
78.07
FEMALES / 100 MALES
36.9
MEDIAN AGE
3.7
AVG FAMILY SIZE
3.4
AVG HOUSEHOLD SIZE
152
LABOR FORCE [ PEOPLE ]
34.2%
PERCENT IN LABOR FORCE
7.9%
UNEMPLOYMENT RATE
Monaville Area Codes
Income in Monaville
Income Overview in Monaville
Per Capita Income in Monaville is $14,720, while median incomes of families and households are $32,010 and $33,924 respectively.
| Characteristic | Number | Measure |
| Per Capita Income | 666 | $14,720 |
| Median Family Income | 142 | $32,010 |
| Mean Family Income | 142 | $40,527 |
| Median Household Income | 195 | $33,924 |
| Mean Household Income | 195 | $48,366 |
| Income Deficit | 142 | $0 |
| Wage / Income Gap (%) | 666 | 0.00% |
| Wage / Income Gap ($) | 666 | 100.00¢ per $1 |
| Gini / Inequality Index | 666 | 0.28 |
Earnings by Sex in Monaville
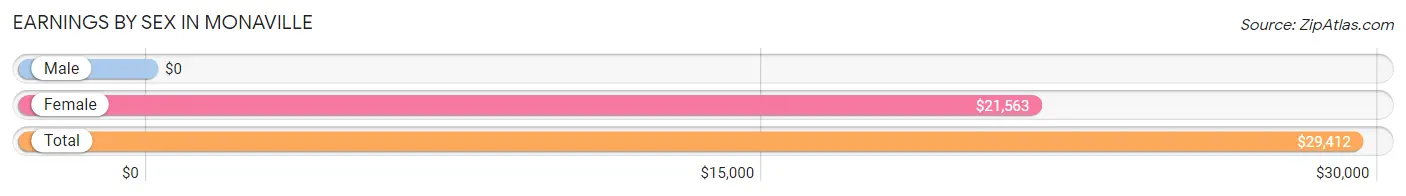
| Sex | Number | Average Earnings |
| Male | 53 (37.9%) | $0 |
| Female | 87 (62.1%) | $21,563 |
| Total | 140 (100.0%) | $29,412 |
Earnings by Sex by Income Bracket in Monaville
The most common earnings brackets in Monaville are $30,000 to $34,999 for men (36 | 67.9%) and $20,000 to $22,499 for women (36 | 41.4%).
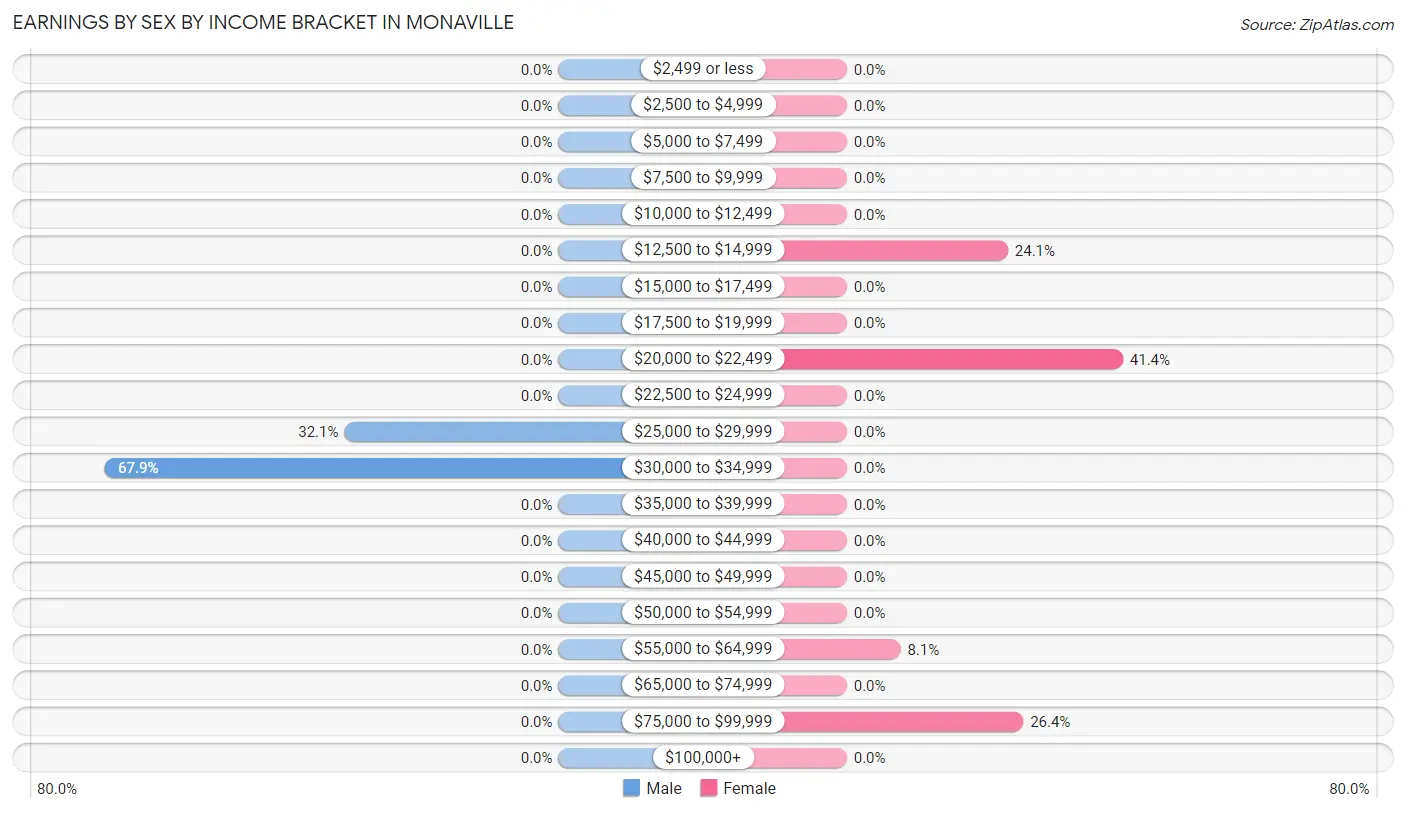
| Income | Male | Female |
| $2,499 or less | 0 (0.0%) | 0 (0.0%) |
| $2,500 to $4,999 | 0 (0.0%) | 0 (0.0%) |
| $5,000 to $7,499 | 0 (0.0%) | 0 (0.0%) |
| $7,500 to $9,999 | 0 (0.0%) | 0 (0.0%) |
| $10,000 to $12,499 | 0 (0.0%) | 0 (0.0%) |
| $12,500 to $14,999 | 0 (0.0%) | 21 (24.1%) |
| $15,000 to $17,499 | 0 (0.0%) | 0 (0.0%) |
| $17,500 to $19,999 | 0 (0.0%) | 0 (0.0%) |
| $20,000 to $22,499 | 0 (0.0%) | 36 (41.4%) |
| $22,500 to $24,999 | 0 (0.0%) | 0 (0.0%) |
| $25,000 to $29,999 | 17 (32.1%) | 0 (0.0%) |
| $30,000 to $34,999 | 36 (67.9%) | 0 (0.0%) |
| $35,000 to $39,999 | 0 (0.0%) | 0 (0.0%) |
| $40,000 to $44,999 | 0 (0.0%) | 0 (0.0%) |
| $45,000 to $49,999 | 0 (0.0%) | 0 (0.0%) |
| $50,000 to $54,999 | 0 (0.0%) | 0 (0.0%) |
| $55,000 to $64,999 | 0 (0.0%) | 7 (8.1%) |
| $65,000 to $74,999 | 0 (0.0%) | 0 (0.0%) |
| $75,000 to $99,999 | 0 (0.0%) | 23 (26.4%) |
| $100,000+ | 0 (0.0%) | 0 (0.0%) |
| Total | 53 (100.0%) | 87 (100.0%) |
Earnings by Sex by Educational Attainment in Monaville
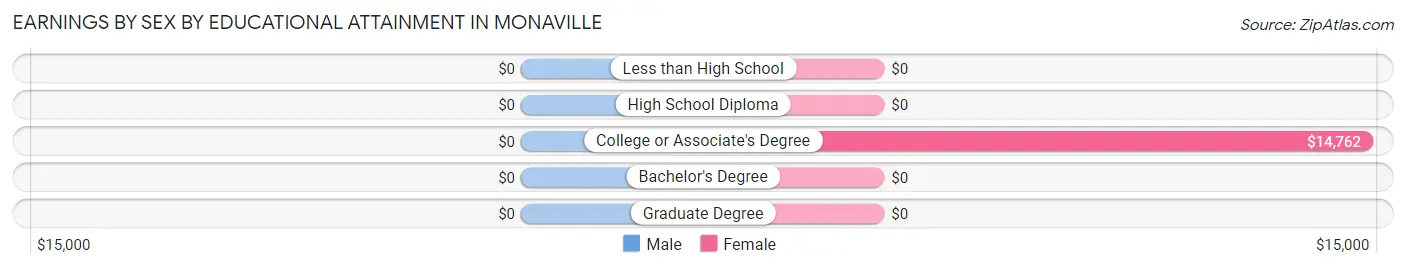
| Educational Attainment | Male Income | Female Income |
| Less than High School | - | - |
| High School Diploma | - | - |
| College or Associate's Degree | - | - |
| Bachelor's Degree | - | - |
| Graduate Degree | - | - |
| Total | - | - |
Family Income in Monaville
Family Income Brackets in Monaville
According to the Monaville family income data, there are 57 families falling into the $25,000 to $34,999 income range, which is the most common income bracket and makes up 40.1% of all families.
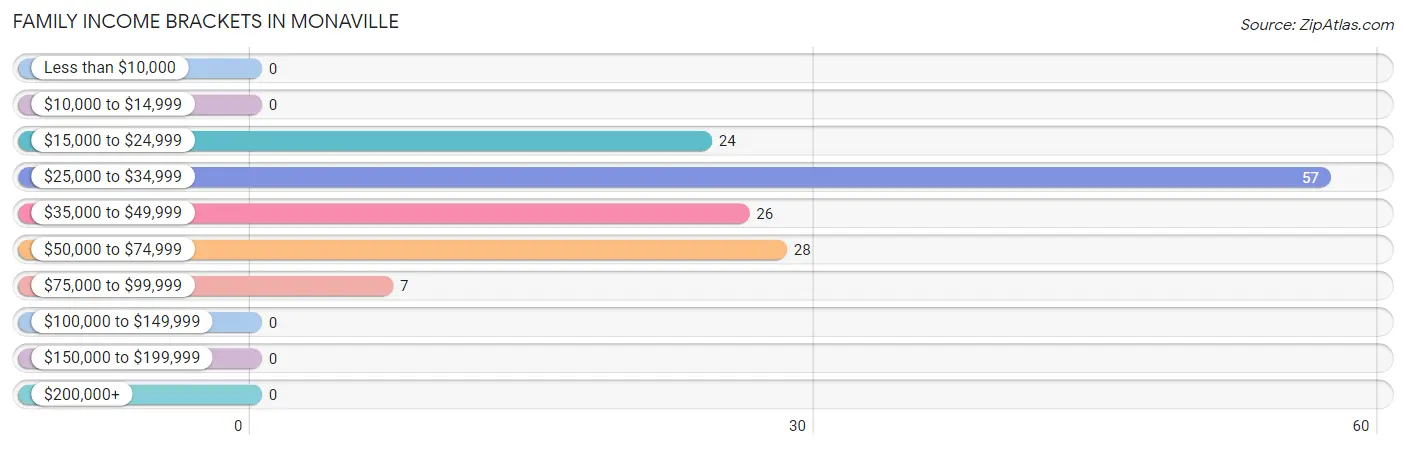
| Income Bracket | # Families | % Families |
| Less than $10,000 | 0 | 0.0% |
| $10,000 to $14,999 | 0 | 0.0% |
| $15,000 to $24,999 | 24 | 16.9% |
| $25,000 to $34,999 | 57 | 40.1% |
| $35,000 to $49,999 | 26 | 18.3% |
| $50,000 to $74,999 | 28 | 19.7% |
| $75,000 to $99,999 | 7 | 4.9% |
| $100,000 to $149,999 | 0 | 0.0% |
| $150,000 to $199,999 | 0 | 0.0% |
| $200,000+ | 0 | 0.0% |
Family Income by Famaliy Size in Monaville
| Income Bracket | # Families | Median Income |
| 2-Person Families | 73 (51.4%) | $0 |
| 3-Person Families | 34 (23.9%) | $0 |
| 4-Person Families | 0 (0.0%) | $0 |
| 5-Person Families | 0 (0.0%) | $0 |
| 6-Person Families | 21 (14.8%) | $0 |
| 7+ Person Families | 14 (9.9%) | $0 |
| Total | 142 (100.0%) | $32,010 |
Family Income by Number of Earners in Monaville
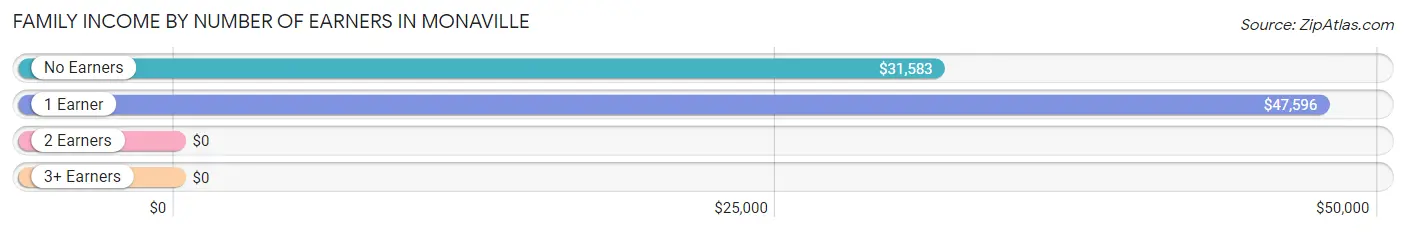
| Number of Earners | # Families | Median Income |
| No Earners | 78 (54.9%) | $31,583 |
| 1 Earner | 64 (45.1%) | $47,596 |
| 2 Earners | 0 (0.0%) | $0 |
| 3+ Earners | 0 (0.0%) | $0 |
| Total | 142 (100.0%) | $32,010 |
Household Income in Monaville
Household Income Brackets in Monaville
With 89 households falling in the category, the $25,000 to $34,999 income range is the most frequent in Monaville, accounting for 45.6% of all households.
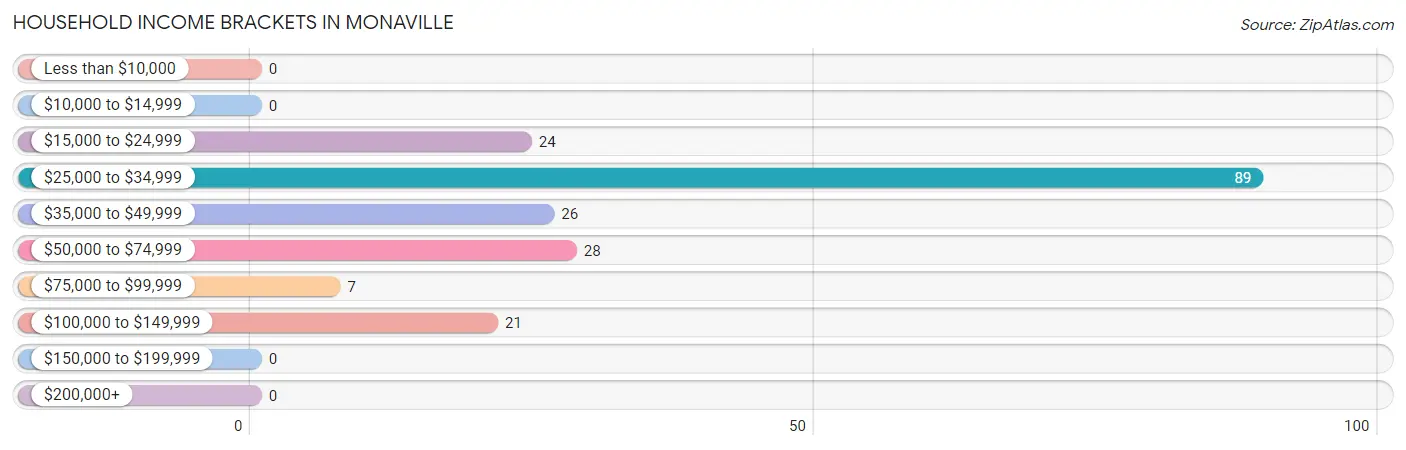
| Income Bracket | # Households | % Households |
| Less than $10,000 | 0 | 0.0% |
| $10,000 to $14,999 | 0 | 0.0% |
| $15,000 to $24,999 | 24 | 12.3% |
| $25,000 to $34,999 | 89 | 45.6% |
| $35,000 to $49,999 | 26 | 13.3% |
| $50,000 to $74,999 | 28 | 14.4% |
| $75,000 to $99,999 | 7 | 3.6% |
| $100,000 to $149,999 | 21 | 10.8% |
| $150,000 to $199,999 | 0 | 0.0% |
| $200,000+ | 0 | 0.0% |
Household Income by Householder Age in Monaville
The median household income in Monaville is $33,924, with the highest median household income of $33,021 found in the 45 to 64 years age bracket for the primary householder. A total of 123 households (63.1%) fall into this category.
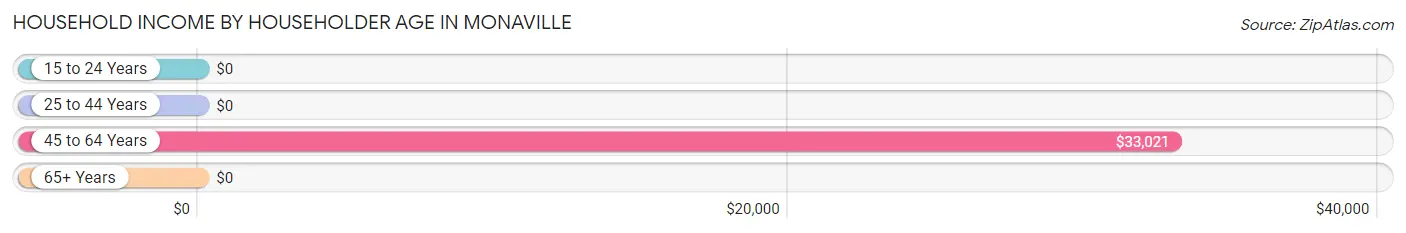
| Income Bracket | # Households | Median Income |
| 15 to 24 Years | 0 (0.0%) | $0 |
| 25 to 44 Years | 17 (8.7%) | $0 |
| 45 to 64 Years | 123 (63.1%) | $33,021 |
| 65+ Years | 55 (28.2%) | $0 |
| Total | 195 (100.0%) | $33,924 |
Poverty in Monaville
Income Below Poverty by Sex and Age in Monaville
With 40.3% poverty level for males and 44.9% for females among the residents of Monaville, under 5 year old males and under 5 year old females are the most vulnerable to poverty, with 20 males (100.0%) and 24 females (100.0%) in their respective age groups living below the poverty level.
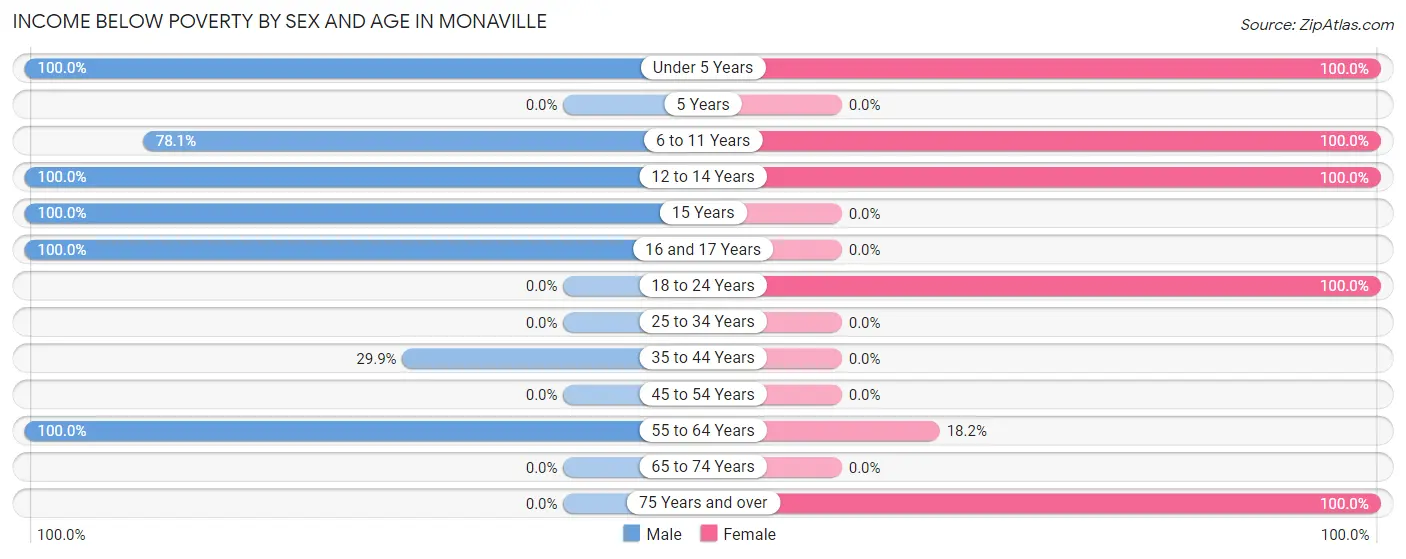
| Age Bracket | Male | Female |
| Under 5 Years | 20 (100.0%) | 24 (100.0%) |
| 5 Years | 0 (0.0%) | 0 (0.0%) |
| 6 to 11 Years | 32 (78.0%) | 21 (100.0%) |
| 12 to 14 Years | 17 (100.0%) | 36 (100.0%) |
| 15 Years | 12 (100.0%) | 0 (0.0%) |
| 16 and 17 Years | 12 (100.0%) | 0 (0.0%) |
| 18 to 24 Years | 0 (0.0%) | 15 (100.0%) |
| 25 to 34 Years | 0 (0.0%) | 0 (0.0%) |
| 35 to 44 Years | 23 (29.9%) | 0 (0.0%) |
| 45 to 54 Years | 0 (0.0%) | 0 (0.0%) |
| 55 to 64 Years | 14 (100.0%) | 14 (18.2%) |
| 65 to 74 Years | 0 (0.0%) | 0 (0.0%) |
| 75 Years and over | 0 (0.0%) | 21 (100.0%) |
| Total | 130 (40.3%) | 131 (44.9%) |
Income Above Poverty by Sex and Age in Monaville
According to the poverty statistics in Monaville, males aged 25 to 34 years and females aged 16 and 17 years are the age groups that are most secure financially, with 100.0% of males and 100.0% of females in these age groups living above the poverty line.
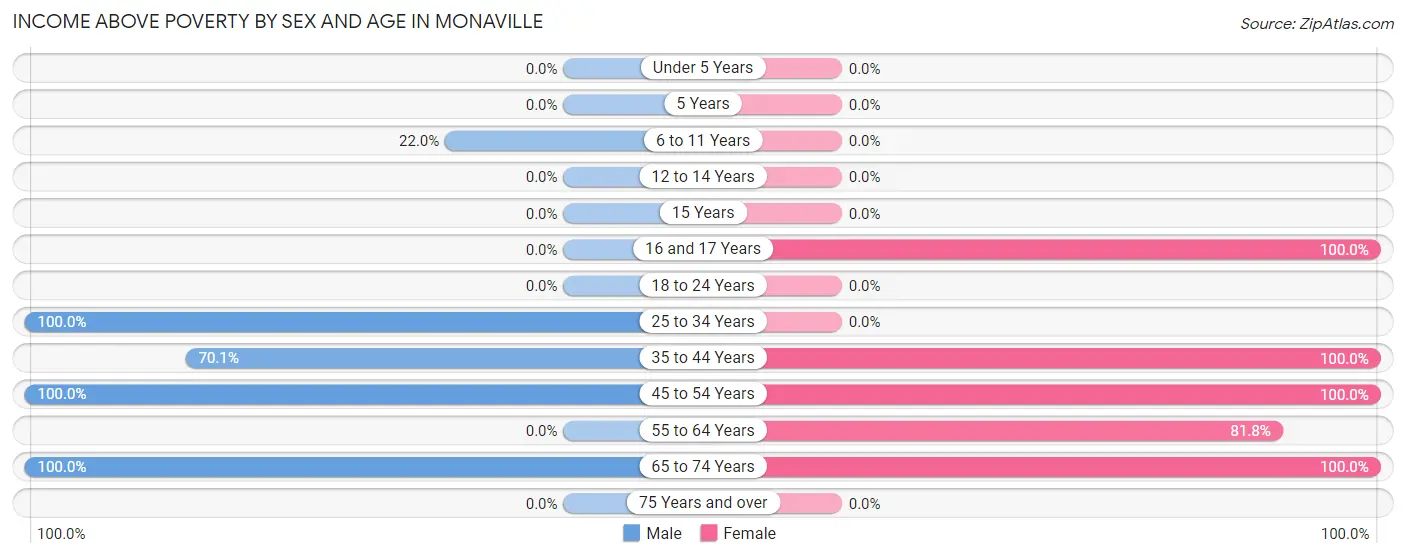
| Age Bracket | Male | Female |
| Under 5 Years | 0 (0.0%) | 0 (0.0%) |
| 5 Years | 0 (0.0%) | 0 (0.0%) |
| 6 to 11 Years | 9 (22.0%) | 0 (0.0%) |
| 12 to 14 Years | 0 (0.0%) | 0 (0.0%) |
| 15 Years | 0 (0.0%) | 0 (0.0%) |
| 16 and 17 Years | 0 (0.0%) | 29 (100.0%) |
| 18 to 24 Years | 0 (0.0%) | 0 (0.0%) |
| 25 to 34 Years | 35 (100.0%) | 0 (0.0%) |
| 35 to 44 Years | 54 (70.1%) | 23 (100.0%) |
| 45 to 54 Years | 36 (100.0%) | 40 (100.0%) |
| 55 to 64 Years | 0 (0.0%) | 63 (81.8%) |
| 65 to 74 Years | 59 (100.0%) | 6 (100.0%) |
| 75 Years and over | 0 (0.0%) | 0 (0.0%) |
| Total | 193 (59.8%) | 161 (55.1%) |
Income Below Poverty Among Married-Couple Families in Monaville
The poverty statistics for married-couple families in Monaville show that 13.5% or 14 of the total 104 families live below the poverty line. Families with 5 or more children have the highest poverty rate of 100.0%, comprising of 14 families. On the other hand, families with no children have the lowest poverty rate of 0.0%, which includes 0 families.
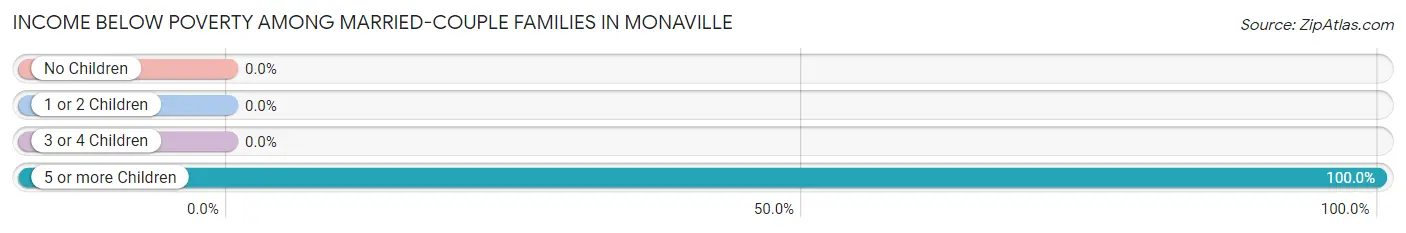
| Children | Above Poverty | Below Poverty |
| No Children | 62 (100.0%) | 0 (0.0%) |
| 1 or 2 Children | 28 (100.0%) | 0 (0.0%) |
| 3 or 4 Children | 0 (0.0%) | 0 (0.0%) |
| 5 or more Children | 0 (0.0%) | 14 (100.0%) |
| Total | 90 (86.5%) | 14 (13.5%) |
Income Below Poverty Among Single-Parent Households in Monaville
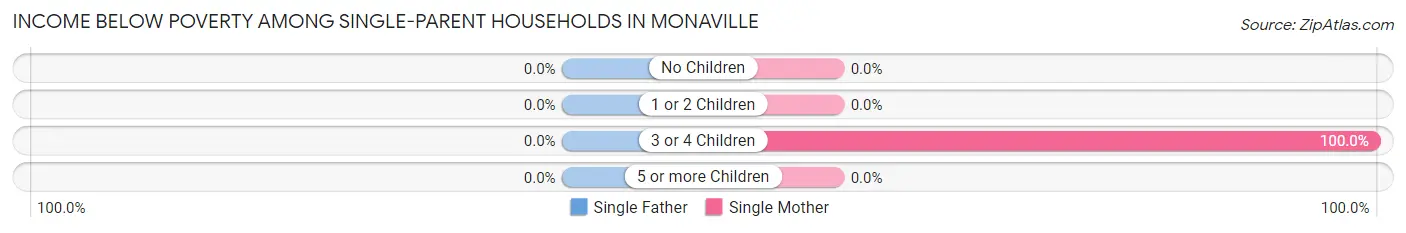
| Children | Single Father | Single Mother |
| No Children | 0 (0.0%) | 0 (0.0%) |
| 1 or 2 Children | 0 (0.0%) | 0 (0.0%) |
| 3 or 4 Children | 0 (0.0%) | 21 (100.0%) |
| 5 or more Children | 0 (0.0%) | 0 (0.0%) |
| Total | 0 (0.0%) | 21 (55.3%) |
Income Below Poverty Among Married-Couple vs Single-Parent Households in Monaville
The poverty data for Monaville shows that 14 of the married-couple family households (13.5%) and 21 of the single-parent households (55.3%) are living below the poverty level. Within the married-couple family households, those with 5 or more children have the highest poverty rate, with 14 households (100.0%) falling below the poverty line. Among the single-parent households, those with 3 or 4 children have the highest poverty rate, with 21 household (100.0%) living below poverty.
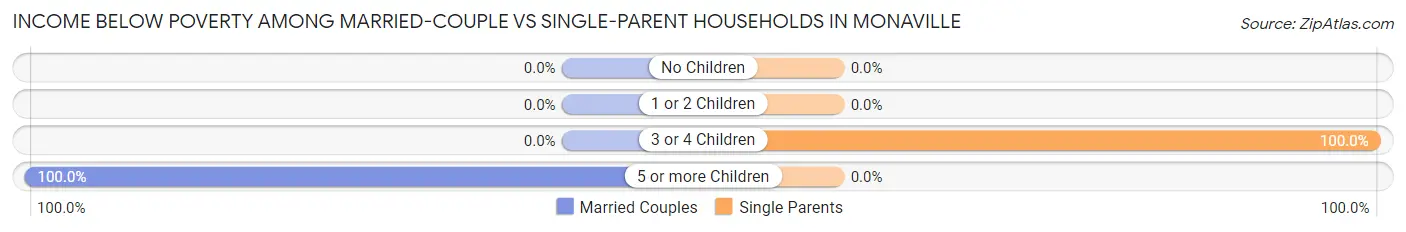
| Children | Married-Couple Families | Single-Parent Households |
| No Children | 0 (0.0%) | 0 (0.0%) |
| 1 or 2 Children | 0 (0.0%) | 0 (0.0%) |
| 3 or 4 Children | 0 (0.0%) | 21 (100.0%) |
| 5 or more Children | 14 (100.0%) | 0 (0.0%) |
| Total | 14 (13.5%) | 21 (55.3%) |
Race in Monaville
The most populous races in Monaville are White / Caucasian (602 | 90.4%), Hispanic or Latino (64 | 9.6%), and Some other Race (36 | 5.4%).
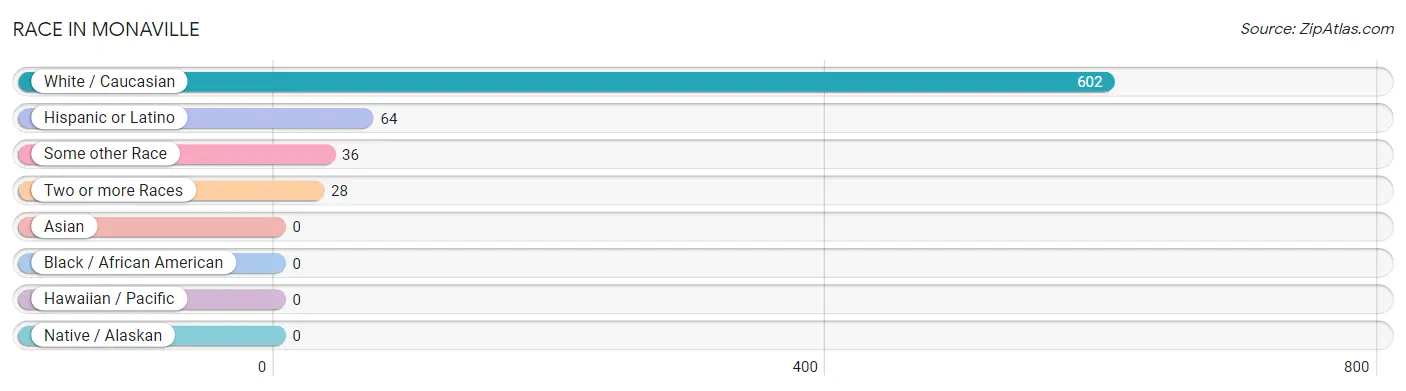
| Race | # Population | % Population |
| Asian | 0 | 0.0% |
| Black / African American | 0 | 0.0% |
| Hawaiian / Pacific | 0 | 0.0% |
| Hispanic or Latino | 64 | 9.6% |
| Native / Alaskan | 0 | 0.0% |
| White / Caucasian | 602 | 90.4% |
| Two or more Races | 28 | 4.2% |
| Some other Race | 36 | 5.4% |
| Total | 666 | 100.0% |
Ancestry in Monaville
The most populous ancestries reported in Monaville are English (74 | 11.1%), Mexican (64 | 9.6%), American (40 | 6.0%), German (36 | 5.4%), and Italian (31 | 4.6%), together accounting for 36.8% of all Monaville residents.
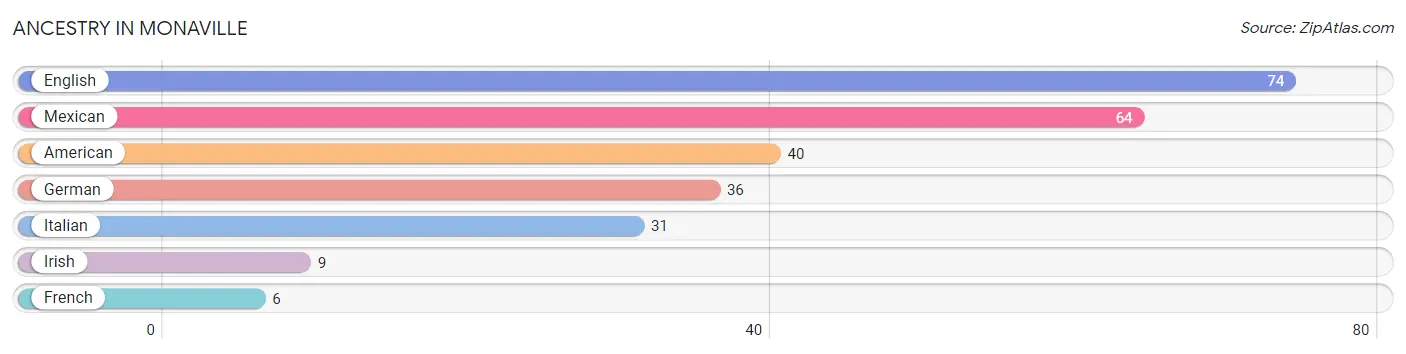
| Ancestry | # Population | % Population |
| American | 40 | 6.0% |
| English | 74 | 11.1% |
| French | 6 | 0.9% |
| German | 36 | 5.4% |
| Irish | 9 | 1.3% |
| Italian | 31 | 4.6% |
| Mexican | 64 | 9.6% | View All 7 Rows |
Immigrants in Monaville

| Immigration Origin | # Population | % Population | View All 0 Rows |
Sex and Age in Monaville
Sex and Age in Monaville
The most populous age groups in Monaville are 35 to 39 Years (77 | 20.6%) for men and 55 to 59 Years (51 | 17.5%) for women.
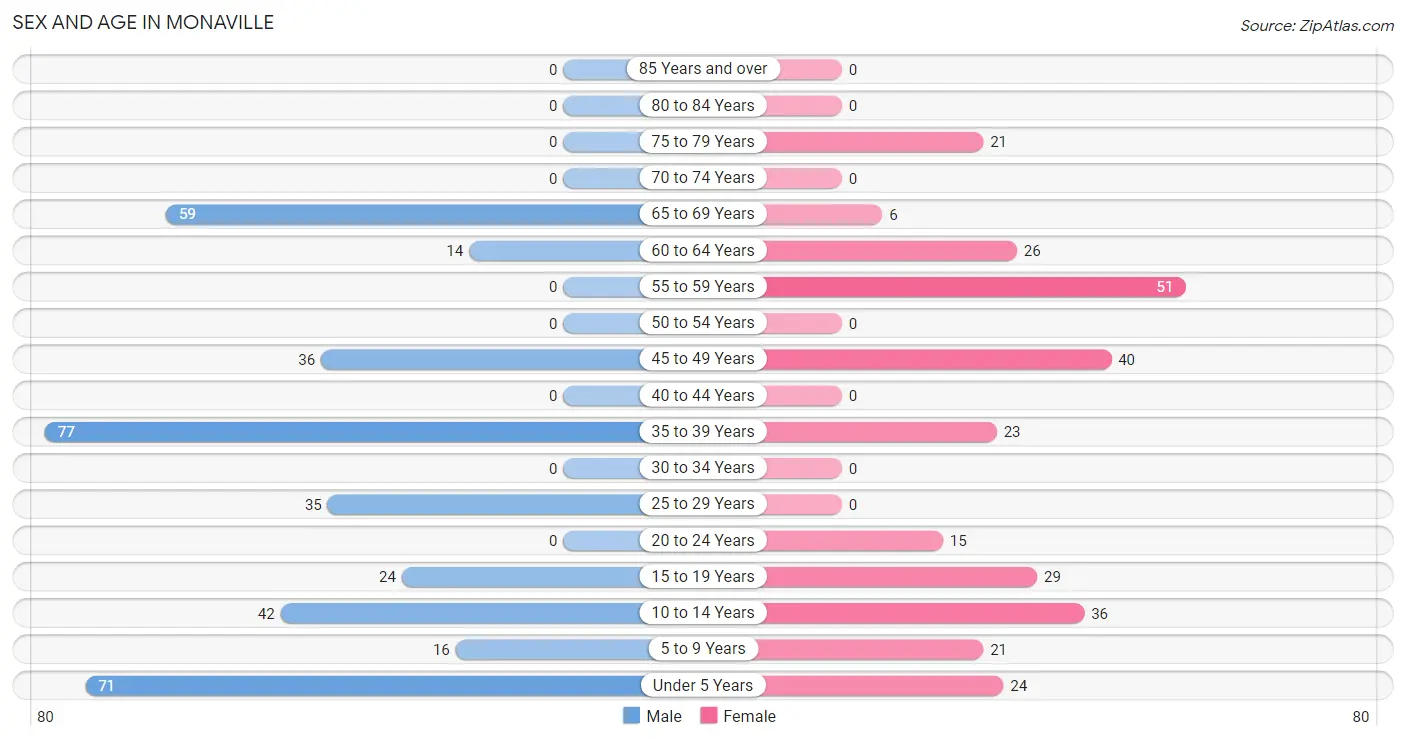
| Age Bracket | Male | Female |
| Under 5 Years | 71 (19.0%) | 24 (8.2%) |
| 5 to 9 Years | 16 (4.3%) | 21 (7.2%) |
| 10 to 14 Years | 42 (11.2%) | 36 (12.3%) |
| 15 to 19 Years | 24 (6.4%) | 29 (9.9%) |
| 20 to 24 Years | 0 (0.0%) | 15 (5.1%) |
| 25 to 29 Years | 35 (9.4%) | 0 (0.0%) |
| 30 to 34 Years | 0 (0.0%) | 0 (0.0%) |
| 35 to 39 Years | 77 (20.6%) | 23 (7.9%) |
| 40 to 44 Years | 0 (0.0%) | 0 (0.0%) |
| 45 to 49 Years | 36 (9.6%) | 40 (13.7%) |
| 50 to 54 Years | 0 (0.0%) | 0 (0.0%) |
| 55 to 59 Years | 0 (0.0%) | 51 (17.5%) |
| 60 to 64 Years | 14 (3.7%) | 26 (8.9%) |
| 65 to 69 Years | 59 (15.8%) | 6 (2.1%) |
| 70 to 74 Years | 0 (0.0%) | 0 (0.0%) |
| 75 to 79 Years | 0 (0.0%) | 21 (7.2%) |
| 80 to 84 Years | 0 (0.0%) | 0 (0.0%) |
| 85 Years and over | 0 (0.0%) | 0 (0.0%) |
| Total | 374 (100.0%) | 292 (100.0%) |
Families and Households in Monaville
Median Family Size in Monaville
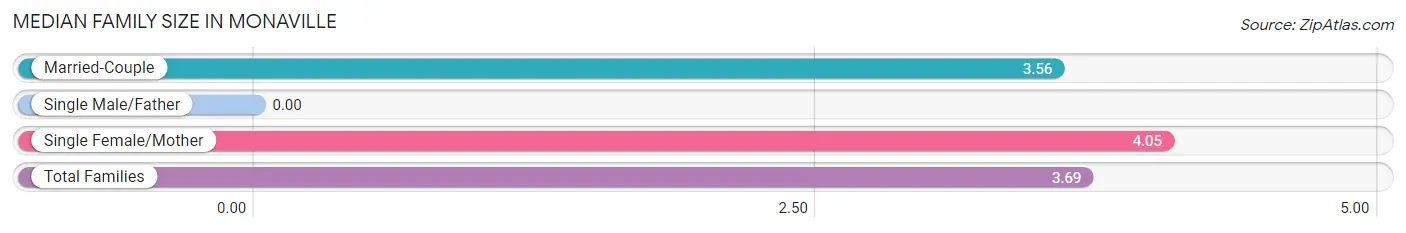
| Family Type | # Families | Family Size |
| Married-Couple | 104 (73.2%) | 3.56 |
| Single Male/Father | 0 (0.0%) | - |
| Single Female/Mother | 38 (26.8%) | 4.05 |
| Total Families | 142 (100.0%) | 3.69 |
Median Household Size in Monaville
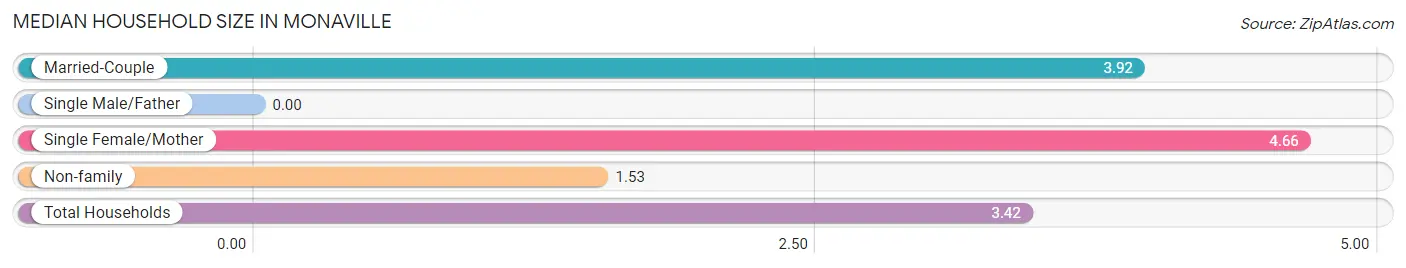
| Household Type | # Households | Household Size |
| Married-Couple | 104 (53.3%) | 3.92 |
| Single Male/Father | 0 (0.0%) | - |
| Single Female/Mother | 38 (19.5%) | 4.66 |
| Non-family | 53 (27.2%) | 1.53 |
| Total Households | 195 (100.0%) | 3.42 |
Household Size by Marriage Status in Monaville
Out of a total of 195 households in Monaville, 142 (72.8%) are family households, while 53 (27.2%) are nonfamily households. The most numerous type of family households are 2-person households, comprising 73, and the most common type of nonfamily households are 1-person households, comprising 36.
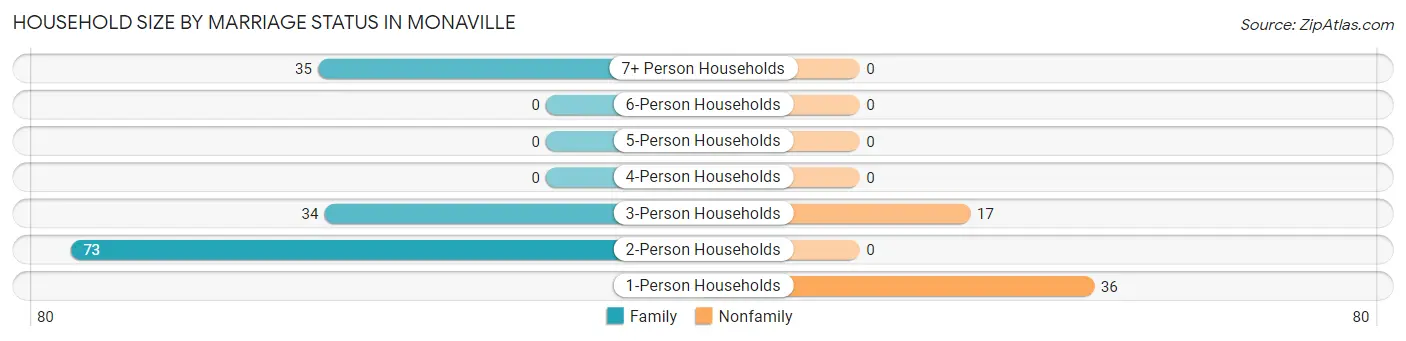
| Household Size | Family Households | Nonfamily Households |
| 1-Person Households | - | 36 (18.5%) |
| 2-Person Households | 73 (37.4%) | 0 (0.0%) |
| 3-Person Households | 34 (17.4%) | 17 (8.7%) |
| 4-Person Households | 0 (0.0%) | 0 (0.0%) |
| 5-Person Households | 0 (0.0%) | 0 (0.0%) |
| 6-Person Households | 0 (0.0%) | 0 (0.0%) |
| 7+ Person Households | 35 (17.9%) | 0 (0.0%) |
| Total | 142 (72.8%) | 53 (27.2%) |
Female Fertility in Monaville
Fertility by Age in Monaville
| Age Bracket | Women with Births | Births / 1,000 Women |
| 15 to 19 years | 0 (0.0%) | 0.0 |
| 20 to 34 years | 0 (0.0%) | 0.0 |
| 35 to 50 years | 0 (0.0%) | 0.0 |
| Total | 0 (0.0%) | 0.0 |
Fertility by Age by Marriage Status in Monaville
| Age Bracket | Married | Unmarried |
| 15 to 19 years | 0 (0.0%) | 0 (0.0%) |
| 20 to 34 years | 0 (0.0%) | 0 (0.0%) |
| 35 to 50 years | 0 (0.0%) | 0 (0.0%) |
| Total | 0 (0.0%) | 0 (0.0%) |
Fertility by Education in Monaville
| Educational Attainment | Women with Births | Births / 1,000 Women |
| Less than High School | 0 (0.0%) | 0.0 |
| High School Diploma | 0 (0.0%) | 0.0 |
| College or Associate's Degree | 0 (0.0%) | 0.0 |
| Bachelor's Degree | 0 (0.0%) | 0.0 |
| Graduate Degree | 0 (0.0%) | 0.0 |
| Total | 0 (0.0%) | 0.0 |
Fertility by Education by Marriage Status in Monaville
| Educational Attainment | Married | Unmarried |
| Less than High School | 0 (0.0%) | 0 (0.0%) |
| High School Diploma | 0 (0.0%) | 0 (0.0%) |
| College or Associate's Degree | 0 (0.0%) | 0 (0.0%) |
| Bachelor's Degree | 0 (0.0%) | 0 (0.0%) |
| Graduate Degree | 0 (0.0%) | 0 (0.0%) |
| Total | 0 (0.0%) | 0 (0.0%) |
Employment Characteristics in Monaville
Employment by Class of Employer in Monaville
Among the 140 employed individuals in Monaville, state government employees (90 | 64.3%), private company employees (40 | 28.6%), and not-for-profit organizations (10 | 7.1%) make up the most common classes of employment.
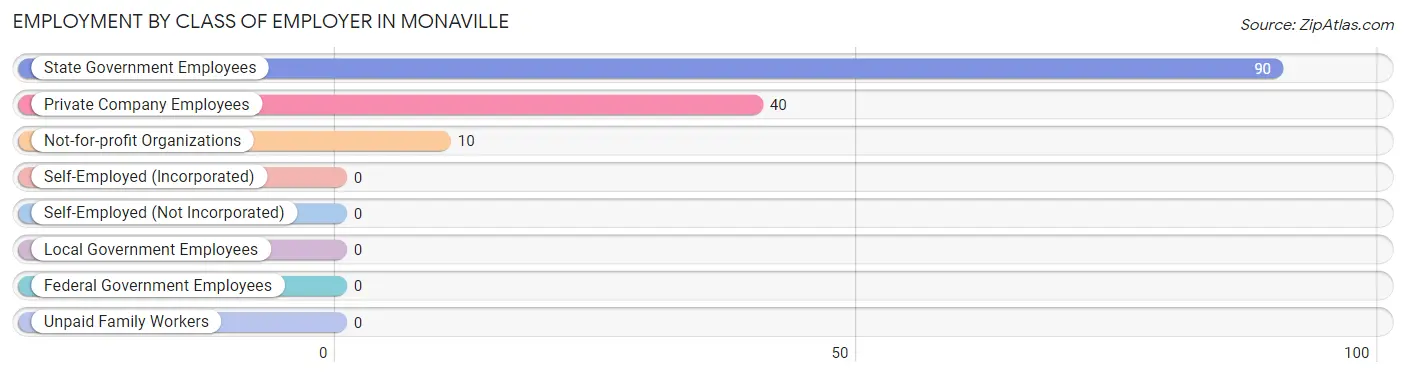
| Employer Class | # Employees | % Employees |
| Private Company Employees | 40 | 28.6% |
| Self-Employed (Incorporated) | 0 | 0.0% |
| Self-Employed (Not Incorporated) | 0 | 0.0% |
| Not-for-profit Organizations | 10 | 7.1% |
| Local Government Employees | 0 | 0.0% |
| State Government Employees | 90 | 64.3% |
| Federal Government Employees | 0 | 0.0% |
| Unpaid Family Workers | 0 | 0.0% |
| Total | 140 | 100.0% |
Employment Status by Age in Monaville
According to the labor force statistics for Monaville, out of the total population over 16 years of age (444), 34.2% or 152 individuals are in the labor force, with 7.9% or 12 of them unemployed. The age group with the highest labor force participation rate is 75 years and over, with 100.0% or 21 individuals in the labor force. Within the labor force, the 35 to 44 years age range has the highest percentage of unemployed individuals, with 34.3% or 12 of them being unemployed.
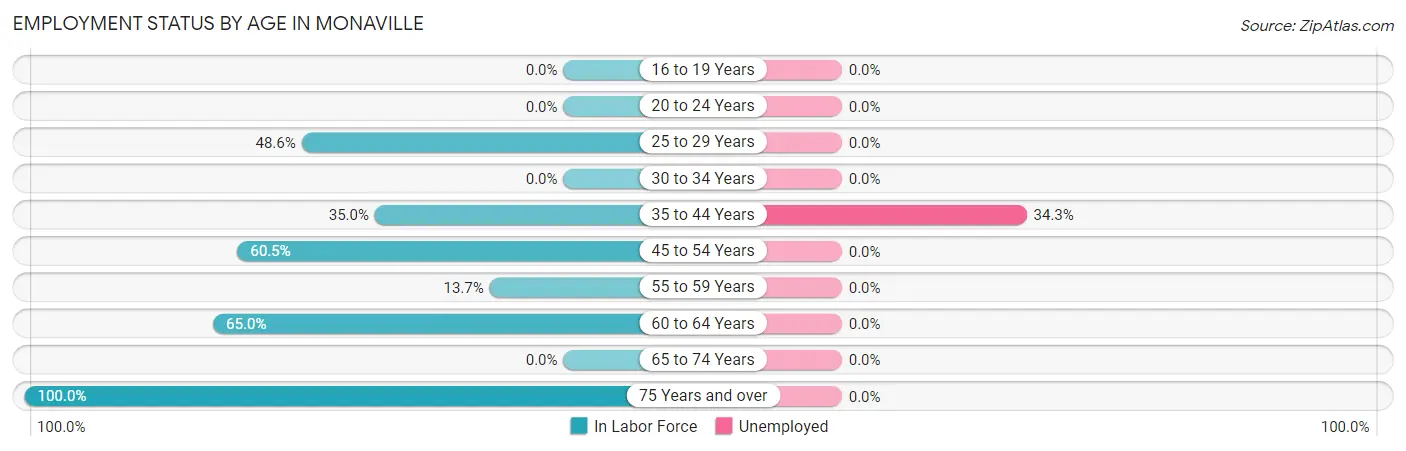
| Age Bracket | In Labor Force | Unemployed |
| 16 to 19 Years | 0 (0.0%) | 0 (0.0%) |
| 20 to 24 Years | 0 (0.0%) | 0 (0.0%) |
| 25 to 29 Years | 17 (48.6%) | 0 (0.0%) |
| 30 to 34 Years | 0 (0.0%) | 0 (0.0%) |
| 35 to 44 Years | 35 (35.0%) | 12 (34.3%) |
| 45 to 54 Years | 46 (60.5%) | 0 (0.0%) |
| 55 to 59 Years | 7 (13.7%) | 0 (0.0%) |
| 60 to 64 Years | 26 (65.0%) | 0 (0.0%) |
| 65 to 74 Years | 0 (0.0%) | 0 (0.0%) |
| 75 Years and over | 21 (100.0%) | 0 (0.0%) |
| Total | 152 (34.2%) | 12 (7.9%) |
Employment Status by Educational Attainment in Monaville
According to labor force statistics for Monaville, 43.4% of individuals (131) out of the total population between 25 and 64 years of age (302) are in the labor force, with 9.2% or 12 of them being unemployed. The group with the highest labor force participation rate are those with the educational attainment of college / associate degree, with 100.0% or 17 individuals in the labor force. Within the labor force, individuals with high school diploma education have the highest percentage of unemployment, with 10.5% or 12 of them being unemployed.
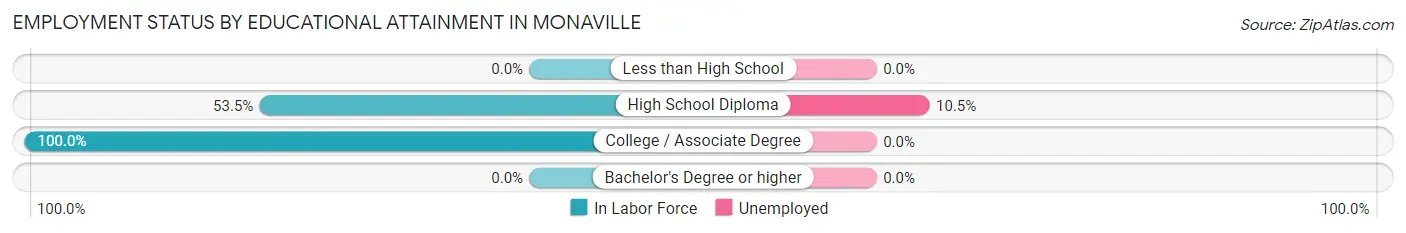
| Educational Attainment | In Labor Force | Unemployed |
| Less than High School | 0 (0.0%) | 0 (0.0%) |
| High School Diploma | 114 (53.5%) | 22 (10.5%) |
| College / Associate Degree | 17 (100.0%) | 0 (0.0%) |
| Bachelor's Degree or higher | 0 (0.0%) | 0 (0.0%) |
| Total | 131 (43.4%) | 28 (9.2%) |
Employment Occupations by Sex in Monaville
Management, Business, Science and Arts Occupations
The most common Management, Business, Science and Arts occupations in Monaville are , and Management (10 | 7.1%).
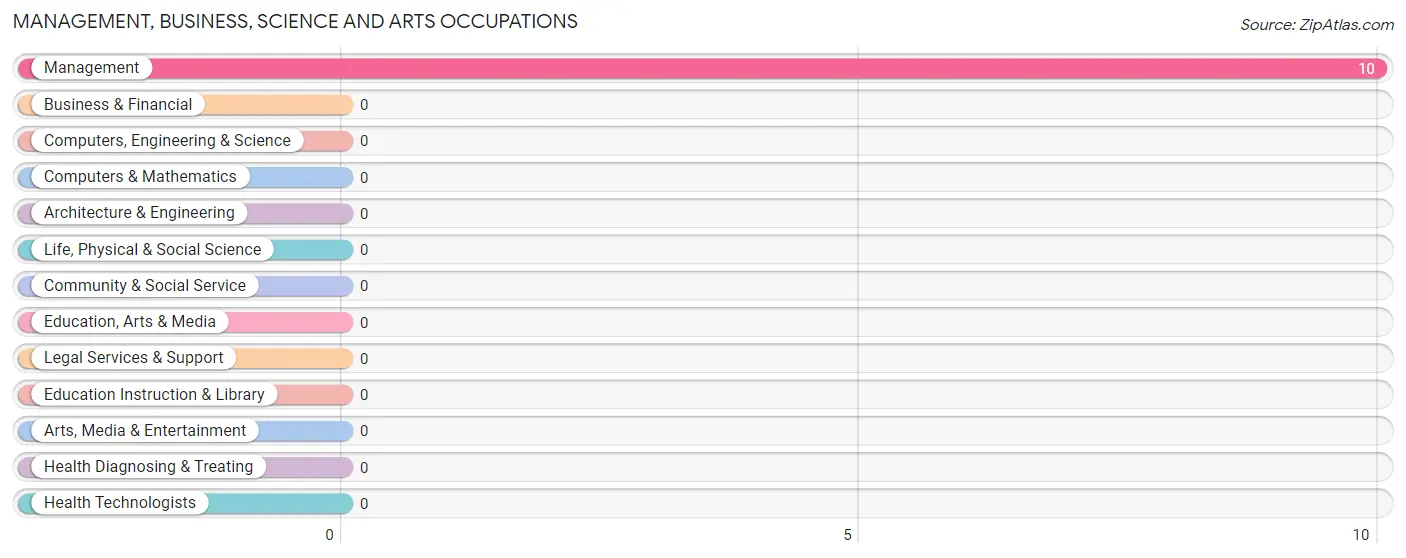
Management, Business, Science and Arts Occupations by Sex
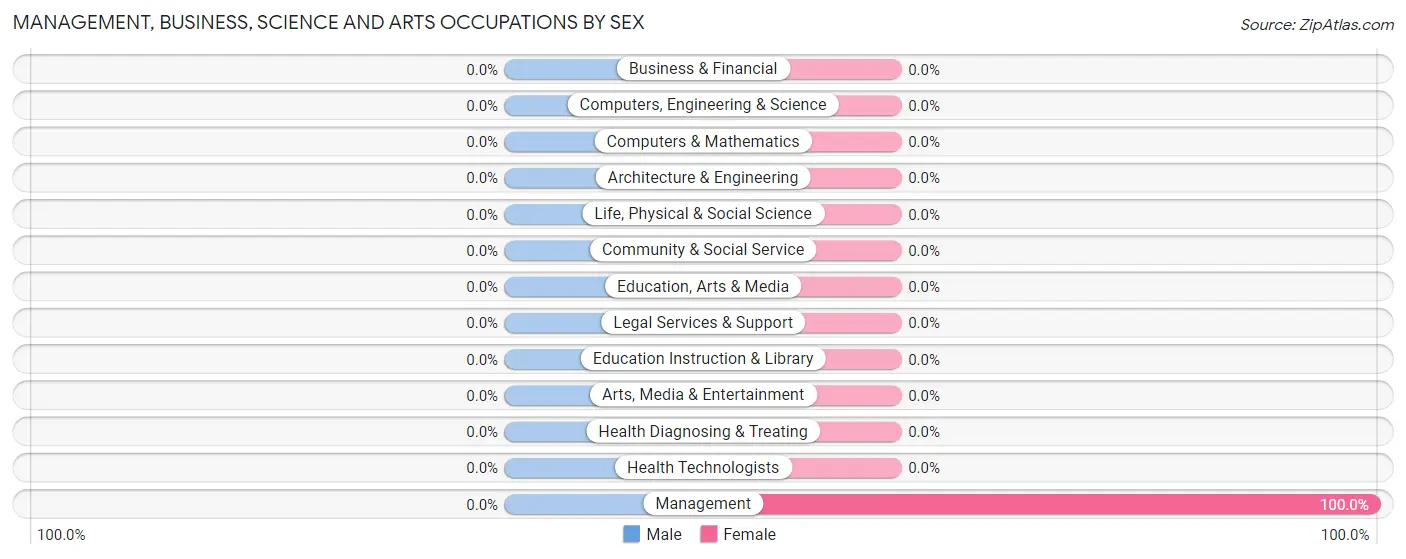
| Occupation | Male | Female |
| Management | 0 (0.0%) | 10 (100.0%) |
| Business & Financial | 0 (0.0%) | 0 (0.0%) |
| Computers, Engineering & Science | 0 (0.0%) | 0 (0.0%) |
| Computers & Mathematics | 0 (0.0%) | 0 (0.0%) |
| Architecture & Engineering | 0 (0.0%) | 0 (0.0%) |
| Life, Physical & Social Science | 0 (0.0%) | 0 (0.0%) |
| Community & Social Service | 0 (0.0%) | 0 (0.0%) |
| Education, Arts & Media | 0 (0.0%) | 0 (0.0%) |
| Legal Services & Support | 0 (0.0%) | 0 (0.0%) |
| Education Instruction & Library | 0 (0.0%) | 0 (0.0%) |
| Arts, Media & Entertainment | 0 (0.0%) | 0 (0.0%) |
| Health Diagnosing & Treating | 0 (0.0%) | 0 (0.0%) |
| Health Technologists | 0 (0.0%) | 0 (0.0%) |
| Total (Category) | 0 (0.0%) | 10 (100.0%) |
| Total (Overall) | 53 (37.9%) | 87 (62.1%) |
Services Occupations
The most common Services occupations in Monaville are Cleaning & Maintenance (26 | 18.6%), and Healthcare Support (21 | 15.0%).
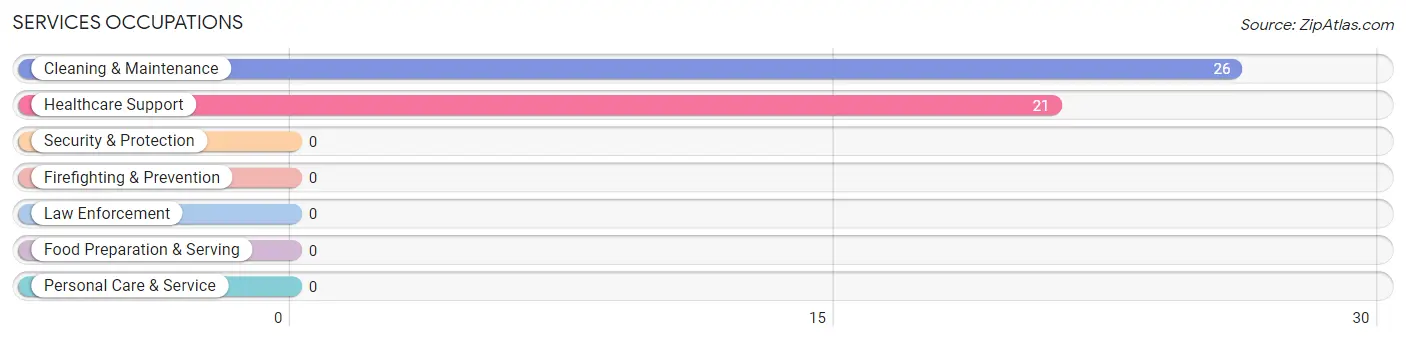
Services Occupations by Sex
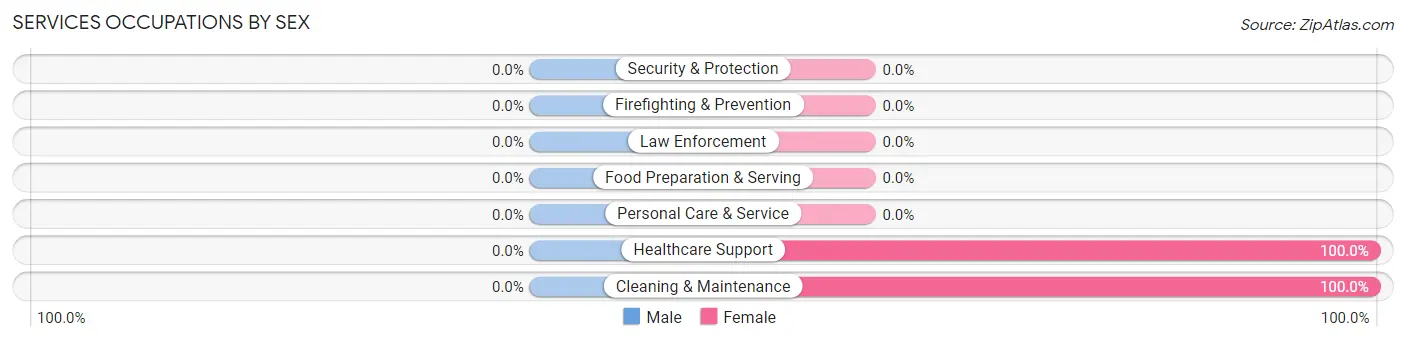
| Occupation | Male | Female |
| Healthcare Support | 0 (0.0%) | 21 (100.0%) |
| Security & Protection | 0 (0.0%) | 0 (0.0%) |
| Firefighting & Prevention | 0 (0.0%) | 0 (0.0%) |
| Law Enforcement | 0 (0.0%) | 0 (0.0%) |
| Food Preparation & Serving | 0 (0.0%) | 0 (0.0%) |
| Cleaning & Maintenance | 0 (0.0%) | 26 (100.0%) |
| Personal Care & Service | 0 (0.0%) | 0 (0.0%) |
| Total (Category) | 0 (0.0%) | 47 (100.0%) |
| Total (Overall) | 53 (37.9%) | 87 (62.1%) |
Sales and Office Occupations
The most common Sales and Office occupations in Monaville are Office & Administration (24 | 17.1%), and Sales & Related (23 | 16.4%).
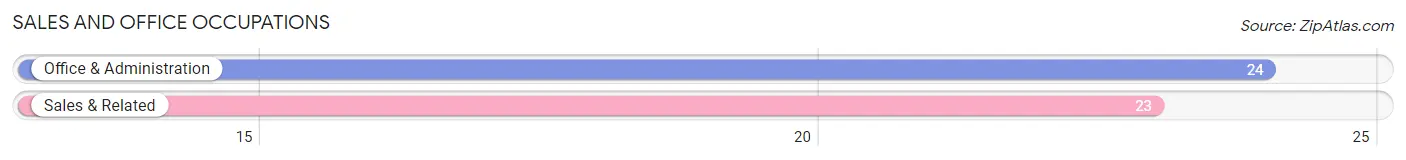
Sales and Office Occupations by Sex
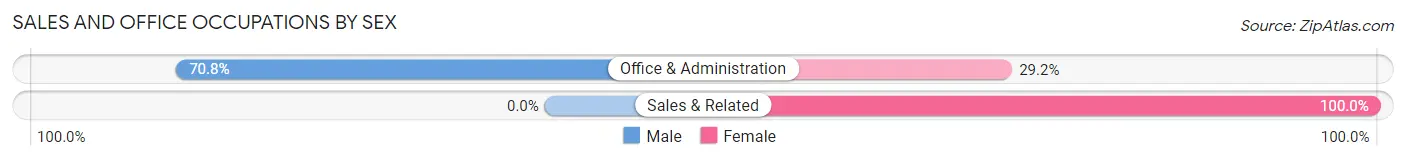
| Occupation | Male | Female |
| Sales & Related | 0 (0.0%) | 23 (100.0%) |
| Office & Administration | 17 (70.8%) | 7 (29.2%) |
| Total (Category) | 17 (36.2%) | 30 (63.8%) |
| Total (Overall) | 53 (37.9%) | 87 (62.1%) |
Natural Resources, Construction and Maintenance Occupations
Natural Resources, Construction and Maintenance Occupations by Sex
| Occupation | Male | Female |
| Farming, Fishing & Forestry | 0 (0.0%) | 0 (0.0%) |
| Construction & Extraction | 0 (0.0%) | 0 (0.0%) |
| Installation, Maintenance & Repair | 0 (0.0%) | 0 (0.0%) |
| Total (Category) | 0 (0.0%) | 0 (0.0%) |
| Total (Overall) | 53 (37.9%) | 87 (62.1%) |
Production, Transportation and Moving Occupations
The most common Production, Transportation and Moving occupations in Monaville are , and Transportation (36 | 25.7%).
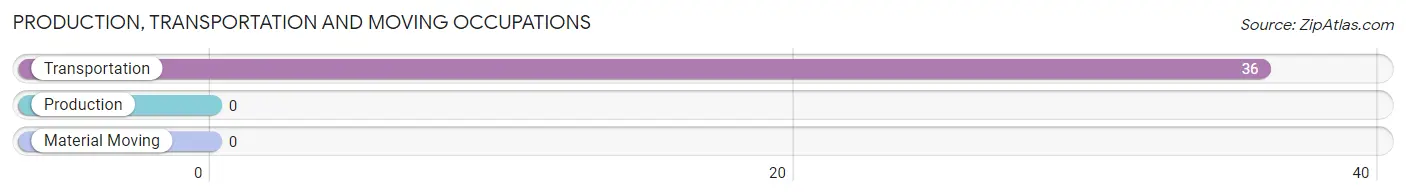
Production, Transportation and Moving Occupations by Sex
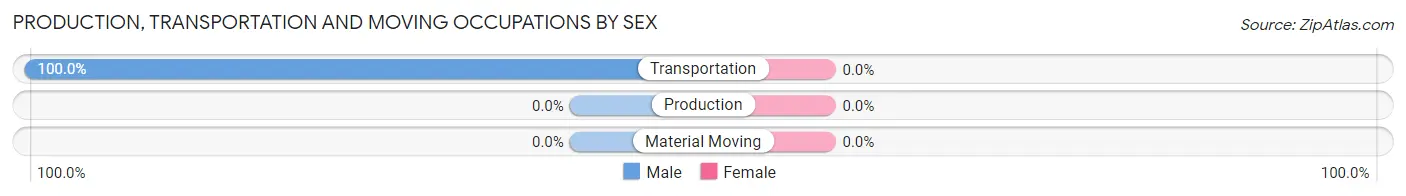
| Occupation | Male | Female |
| Production | 0 (0.0%) | 0 (0.0%) |
| Transportation | 36 (100.0%) | 0 (0.0%) |
| Material Moving | 0 (0.0%) | 0 (0.0%) |
| Total (Category) | 36 (100.0%) | 0 (0.0%) |
| Total (Overall) | 53 (37.9%) | 87 (62.1%) |
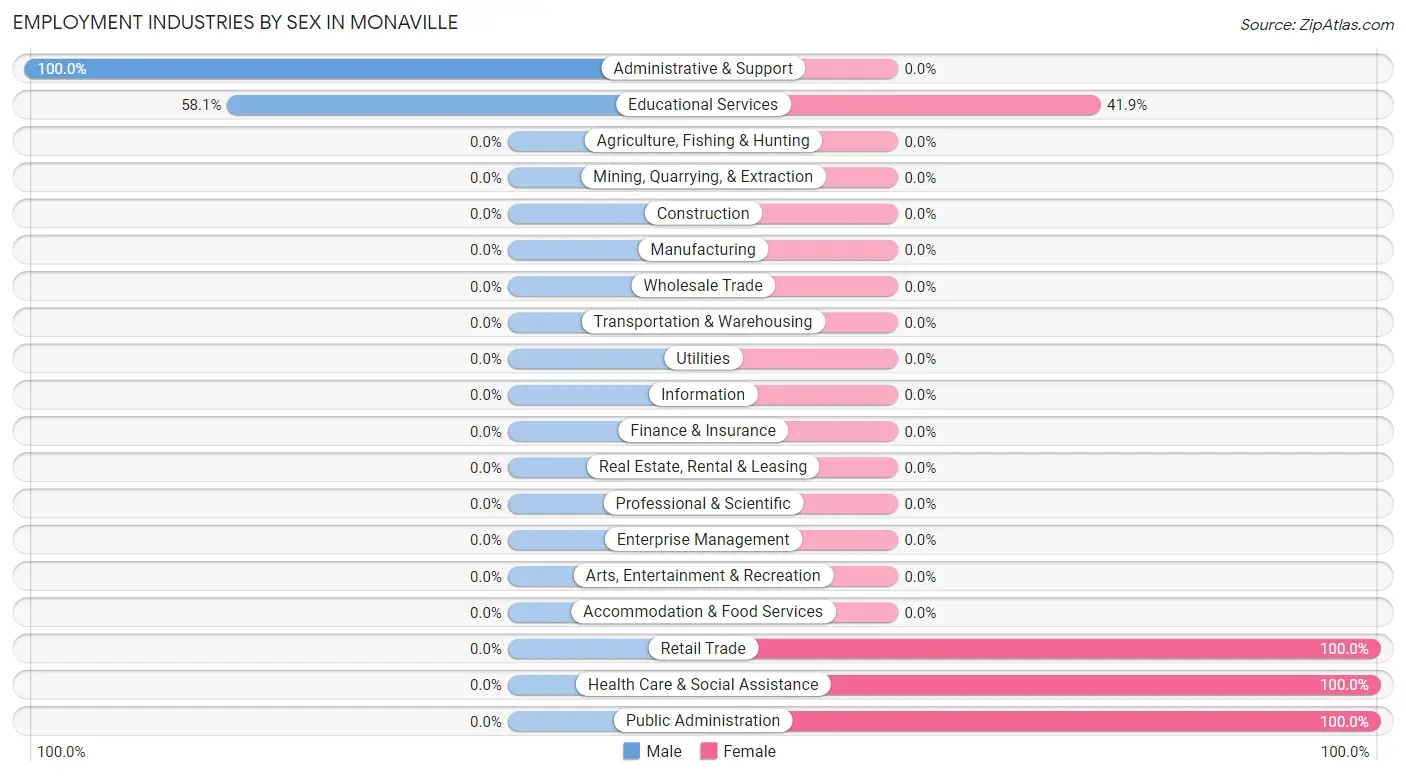
Employment Industries by Sex in Monaville
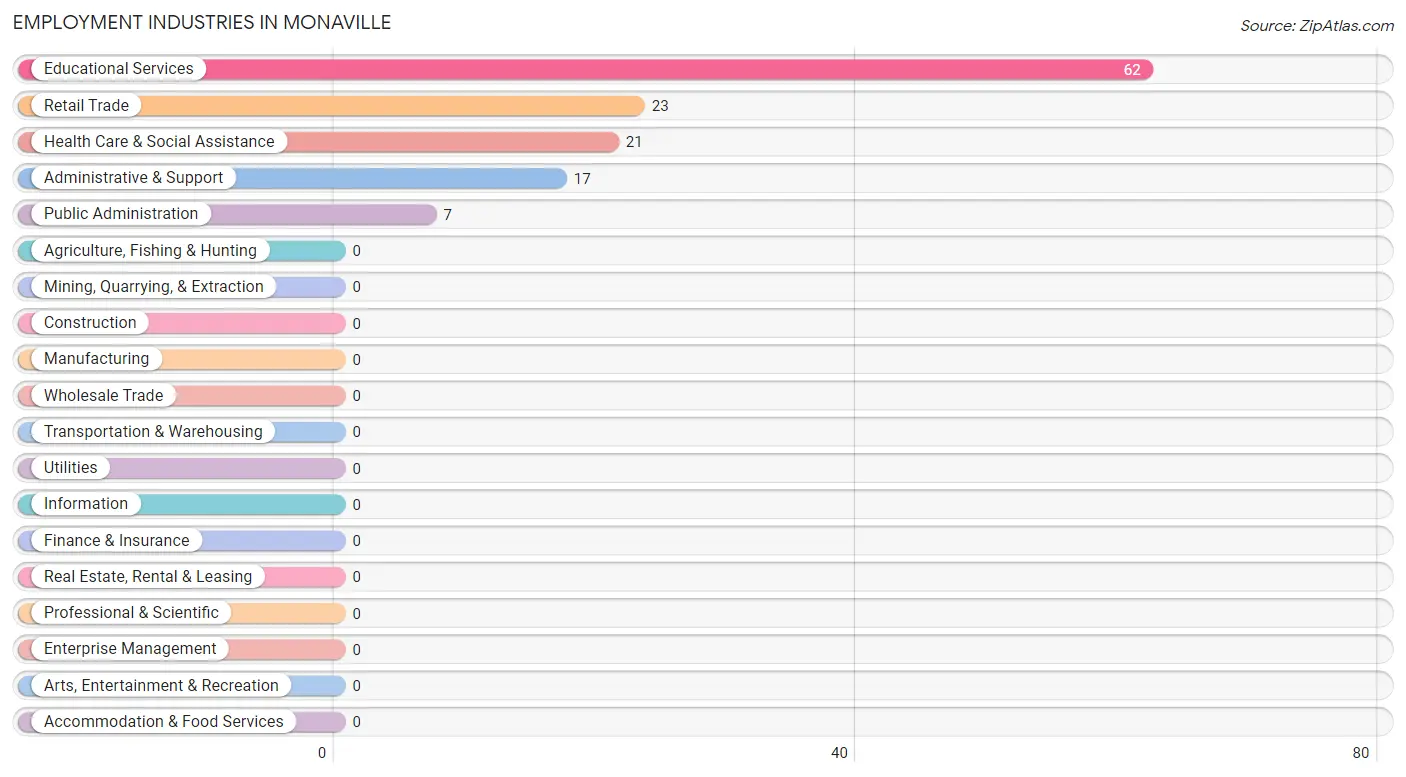
Employment Industries in Monaville
The major employment industries in Monaville include Educational Services (62 | 44.3%), Retail Trade (23 | 16.4%), Health Care & Social Assistance (21 | 15.0%), Administrative & Support (17 | 12.1%), and Public Administration (7 | 5.0%).
Employment Industries by Sex in Monaville
The Monaville industries that see more men than women are Administrative & Support (100.0%), and Educational Services (58.1%), whereas the industries that tend to have a higher number of women are Retail Trade (100.0%), Health Care & Social Assistance (100.0%), and Public Administration (100.0%).
| Industry | Male | Female |
| Agriculture, Fishing & Hunting | 0 (0.0%) | 0 (0.0%) |
| Mining, Quarrying, & Extraction | 0 (0.0%) | 0 (0.0%) |
| Construction | 0 (0.0%) | 0 (0.0%) |
| Manufacturing | 0 (0.0%) | 0 (0.0%) |
| Wholesale Trade | 0 (0.0%) | 0 (0.0%) |
| Retail Trade | 0 (0.0%) | 23 (100.0%) |
| Transportation & Warehousing | 0 (0.0%) | 0 (0.0%) |
| Utilities | 0 (0.0%) | 0 (0.0%) |
| Information | 0 (0.0%) | 0 (0.0%) |
| Finance & Insurance | 0 (0.0%) | 0 (0.0%) |
| Real Estate, Rental & Leasing | 0 (0.0%) | 0 (0.0%) |
| Professional & Scientific | 0 (0.0%) | 0 (0.0%) |
| Enterprise Management | 0 (0.0%) | 0 (0.0%) |
| Administrative & Support | 17 (100.0%) | 0 (0.0%) |
| Educational Services | 36 (58.1%) | 26 (41.9%) |
| Health Care & Social Assistance | 0 (0.0%) | 21 (100.0%) |
| Arts, Entertainment & Recreation | 0 (0.0%) | 0 (0.0%) |
| Accommodation & Food Services | 0 (0.0%) | 0 (0.0%) |
| Public Administration | 0 (0.0%) | 7 (100.0%) |
| Total | 53 (37.9%) | 87 (62.1%) |
Education in Monaville
School Enrollment in Monaville
The most common levels of schooling among the 197 students in Monaville are middle school (74 | 37.6%), high school (41 | 20.8%), and elementary school (37 | 18.8%).
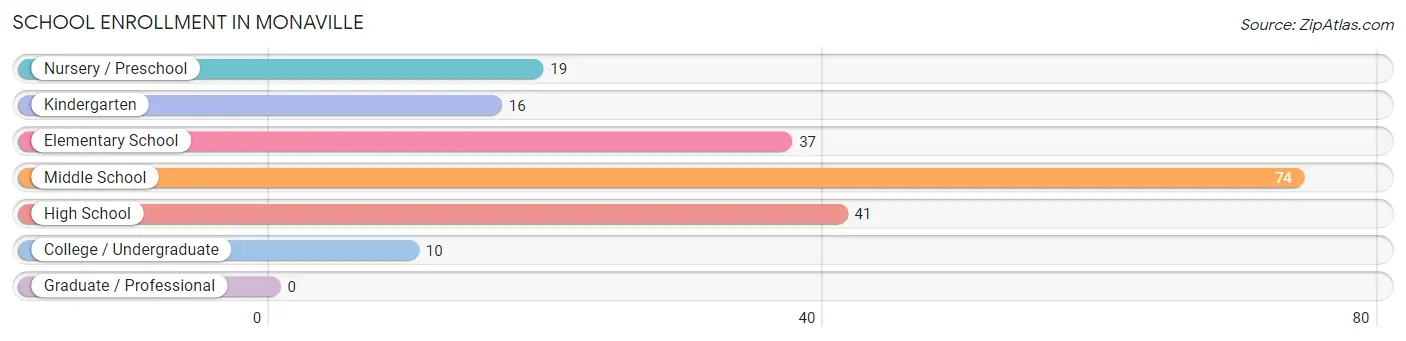
| School Level | # Students | % Students |
| Nursery / Preschool | 19 | 9.6% |
| Kindergarten | 16 | 8.1% |
| Elementary School | 37 | 18.8% |
| Middle School | 74 | 37.6% |
| High School | 41 | 20.8% |
| College / Undergraduate | 10 | 5.1% |
| Graduate / Professional | 0 | 0.0% |
| Total | 197 | 100.0% |
School Enrollment by Age by Funding Source in Monaville
Out of a total of 197 students who are enrolled in schools in Monaville, 9 (4.6%) attend a private institution, while the remaining 188 (95.4%) are enrolled in public schools. The age group of 10 to 14 year olds has the highest likelihood of being enrolled in private schools, with 9 (11.5% in the age bracket) enrolled. Conversely, the age group of 3 to 4 year olds has the lowest likelihood of being enrolled in a private school, with 19 (100.0% in the age bracket) attending a public institution.
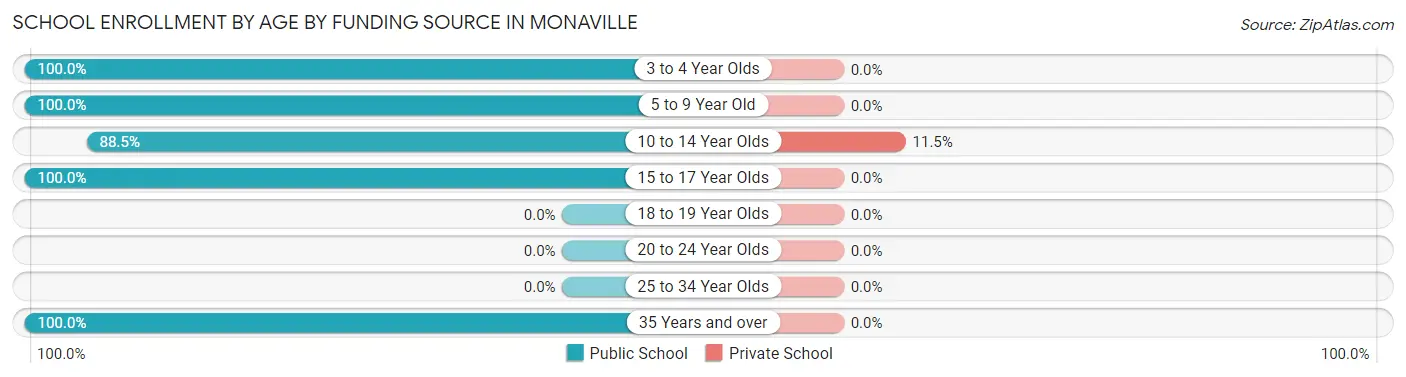
| Age Bracket | Public School | Private School |
| 3 to 4 Year Olds | 19 (100.0%) | 0 (0.0%) |
| 5 to 9 Year Old | 37 (100.0%) | 0 (0.0%) |
| 10 to 14 Year Olds | 69 (88.5%) | 9 (11.5%) |
| 15 to 17 Year Olds | 53 (100.0%) | 0 (0.0%) |
| 18 to 19 Year Olds | 0 (0.0%) | 0 (0.0%) |
| 20 to 24 Year Olds | 0 (0.0%) | 0 (0.0%) |
| 25 to 34 Year Olds | 0 (0.0%) | 0 (0.0%) |
| 35 Years and over | 10 (100.0%) | 0 (0.0%) |
| Total | 188 (95.4%) | 9 (4.6%) |
Educational Attainment by Field of Study in Monaville
| Field of Study | # Graduates | % Graduates |
| Computers & Mathematics | 0 | 0.0% |
| Bio, Nature & Agricultural | 0 | 0.0% |
| Physical & Health Sciences | 0 | 0.0% |
| Psychology | 0 | 0.0% |
| Social Sciences | 0 | 0.0% |
| Engineering | 0 | 0.0% |
| Multidisciplinary Studies | 0 | 0.0% |
| Science & Technology | 0 | 0.0% |
| Business | 0 | 0.0% |
| Education | 0 | 0.0% |
| Literature & Languages | 0 | 0.0% |
| Liberal Arts & History | 0 | 0.0% |
| Visual & Performing Arts | 0 | 0.0% |
| Communications | 0 | 0.0% |
| Arts & Humanities | 0 | 0.0% |
| Total | 0 | 0.0% |
Transportation & Commute in Monaville
Vehicle Availability by Sex in Monaville
The most prevalent vehicle ownership categories in Monaville are males with 1 vehicle (53, accounting for 100.0%) and females with 1 vehicle (7, making up 60.9%).
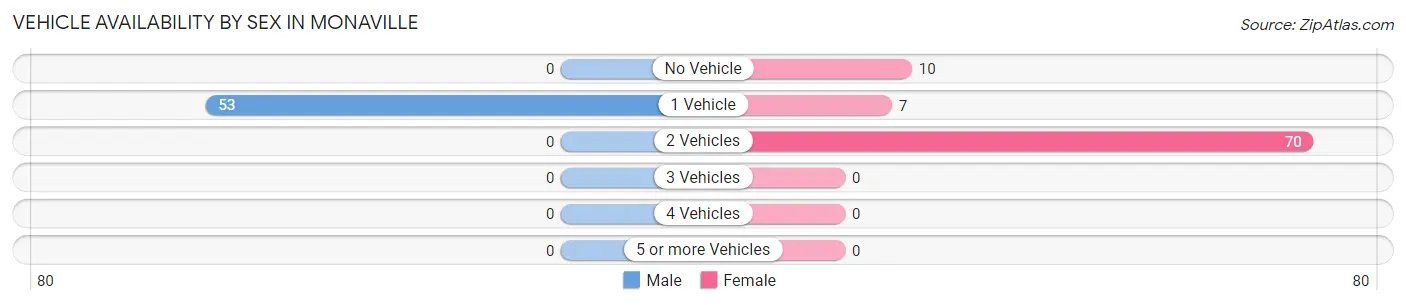
| Vehicles Available | Male | Female |
| No Vehicle | 0 (0.0%) | 10 (11.5%) |
| 1 Vehicle | 53 (100.0%) | 7 (8.1%) |
| 2 Vehicles | 0 (0.0%) | 70 (80.5%) |
| 3 Vehicles | 0 (0.0%) | 0 (0.0%) |
| 4 Vehicles | 0 (0.0%) | 0 (0.0%) |
| 5 or more Vehicles | 0 (0.0%) | 0 (0.0%) |
| Total | 53 (100.0%) | 87 (100.0%) |
Commute Time in Monaville
The most frequently occuring commute durations in Monaville are 10 to 14 minutes (77 commuters, 62.6%), 20 to 24 minutes (36 commuters, 29.3%), and 15 to 19 minutes (10 commuters, 8.1%).
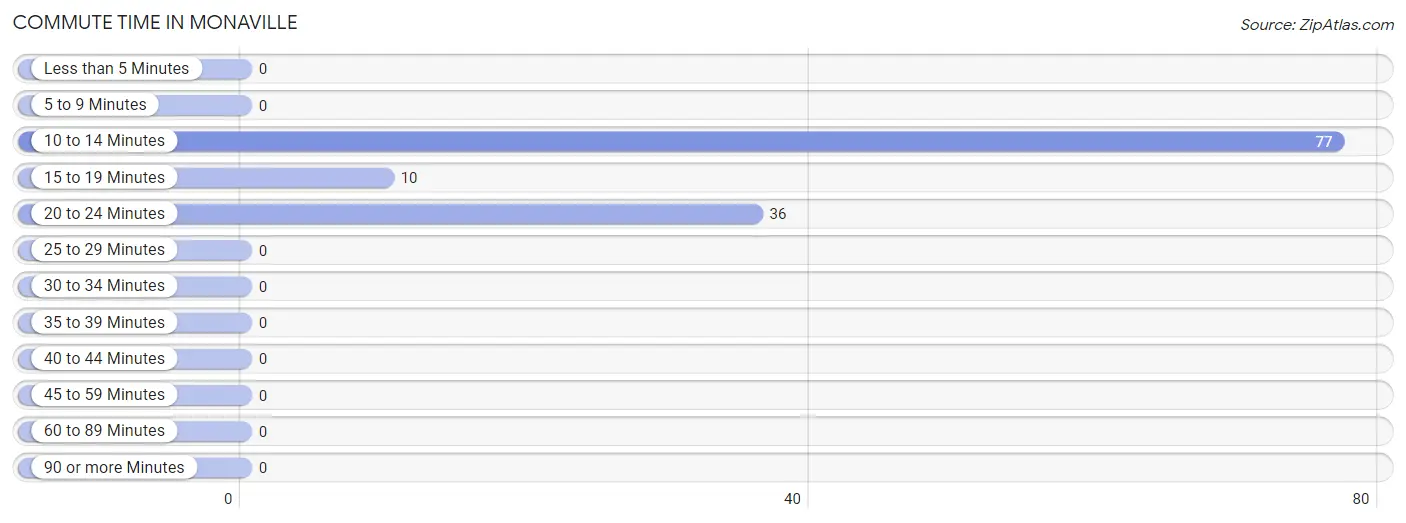
| Commute Time | # Commuters | % Commuters |
| Less than 5 Minutes | 0 | 0.0% |
| 5 to 9 Minutes | 0 | 0.0% |
| 10 to 14 Minutes | 77 | 62.6% |
| 15 to 19 Minutes | 10 | 8.1% |
| 20 to 24 Minutes | 36 | 29.3% |
| 25 to 29 Minutes | 0 | 0.0% |
| 30 to 34 Minutes | 0 | 0.0% |
| 35 to 39 Minutes | 0 | 0.0% |
| 40 to 44 Minutes | 0 | 0.0% |
| 45 to 59 Minutes | 0 | 0.0% |
| 60 to 89 Minutes | 0 | 0.0% |
| 90 or more Minutes | 0 | 0.0% |
Commute Time by Sex in Monaville
The most common commute times in Monaville are 20 to 24 minutes (36 commuters, 100.0%) for males and 10 to 14 minutes (77 commuters, 88.5%) for females.
| Commute Time | Male | Female |
| Less than 5 Minutes | 0 (0.0%) | 0 (0.0%) |
| 5 to 9 Minutes | 0 (0.0%) | 0 (0.0%) |
| 10 to 14 Minutes | 0 (0.0%) | 77 (88.5%) |
| 15 to 19 Minutes | 0 (0.0%) | 10 (11.5%) |
| 20 to 24 Minutes | 36 (100.0%) | 0 (0.0%) |
| 25 to 29 Minutes | 0 (0.0%) | 0 (0.0%) |
| 30 to 34 Minutes | 0 (0.0%) | 0 (0.0%) |
| 35 to 39 Minutes | 0 (0.0%) | 0 (0.0%) |
| 40 to 44 Minutes | 0 (0.0%) | 0 (0.0%) |
| 45 to 59 Minutes | 0 (0.0%) | 0 (0.0%) |
| 60 to 89 Minutes | 0 (0.0%) | 0 (0.0%) |
| 90 or more Minutes | 0 (0.0%) | 0 (0.0%) |
Time of Departure to Work by Sex in Monaville
The most frequent times of departure to work in Monaville are 12:00 AM to 4:59 AM (36, 100.0%) for males and 6:00 AM to 6:29 AM (26, 29.9%) for females.
| Time of Departure | Male | Female |
| 12:00 AM to 4:59 AM | 36 (100.0%) | 0 (0.0%) |
| 5:00 AM to 5:29 AM | 0 (0.0%) | 0 (0.0%) |
| 5:30 AM to 5:59 AM | 0 (0.0%) | 0 (0.0%) |
| 6:00 AM to 6:29 AM | 0 (0.0%) | 26 (29.9%) |
| 6:30 AM to 6:59 AM | 0 (0.0%) | 0 (0.0%) |
| 7:00 AM to 7:29 AM | 0 (0.0%) | 0 (0.0%) |
| 7:30 AM to 7:59 AM | 0 (0.0%) | 0 (0.0%) |
| 8:00 AM to 8:29 AM | 0 (0.0%) | 17 (19.5%) |
| 8:30 AM to 8:59 AM | 0 (0.0%) | 0 (0.0%) |
| 9:00 AM to 9:59 AM | 0 (0.0%) | 21 (24.1%) |
| 10:00 AM to 10:59 AM | 0 (0.0%) | 23 (26.4%) |
| 11:00 AM to 11:59 AM | 0 (0.0%) | 0 (0.0%) |
| 12:00 PM to 3:59 PM | 0 (0.0%) | 0 (0.0%) |
| 4:00 PM to 11:59 PM | 0 (0.0%) | 0 (0.0%) |
| Total | 36 (100.0%) | 87 (100.0%) |
Housing Occupancy in Monaville
Occupancy by Ownership in Monaville
Of the total 195 dwellings in Monaville, owner-occupied units account for 134 (68.7%), while renter-occupied units make up 61 (31.3%).
| Occupancy | # Housing Units | % Housing Units |
| Owner Occupied Housing Units | 134 | 68.7% |
| Renter-Occupied Housing Units | 61 | 31.3% |
| Total Occupied Housing Units | 195 | 100.0% |
Occupancy by Household Size in Monaville
| Household Size | # Housing Units | % Housing Units |
| 1-Person Household | 36 | 18.5% |
| 2-Person Household | 73 | 37.4% |
| 3-Person Household | 51 | 26.2% |
| 4+ Person Household | 35 | 17.9% |
| Total Housing Units | 195 | 100.0% |
Occupancy by Ownership by Household Size in Monaville
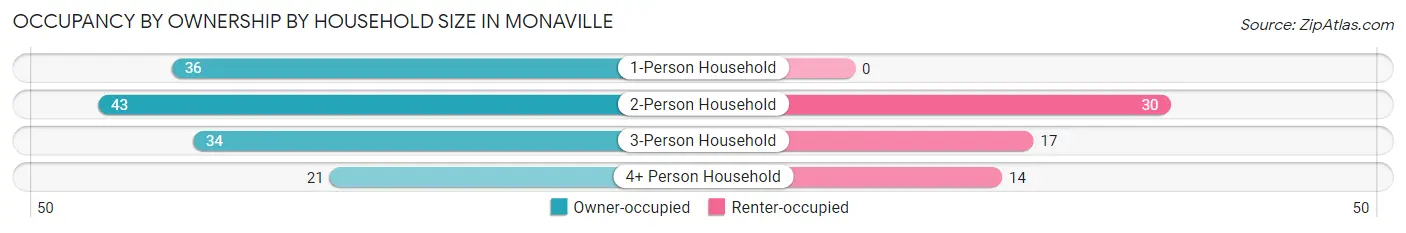
| Household Size | Owner-occupied | Renter-occupied |
| 1-Person Household | 36 (100.0%) | 0 (0.0%) |
| 2-Person Household | 43 (58.9%) | 30 (41.1%) |
| 3-Person Household | 34 (66.7%) | 17 (33.3%) |
| 4+ Person Household | 21 (60.0%) | 14 (40.0%) |
| Total Housing Units | 134 (68.7%) | 61 (31.3%) |
Occupancy by Educational Attainment in Monaville
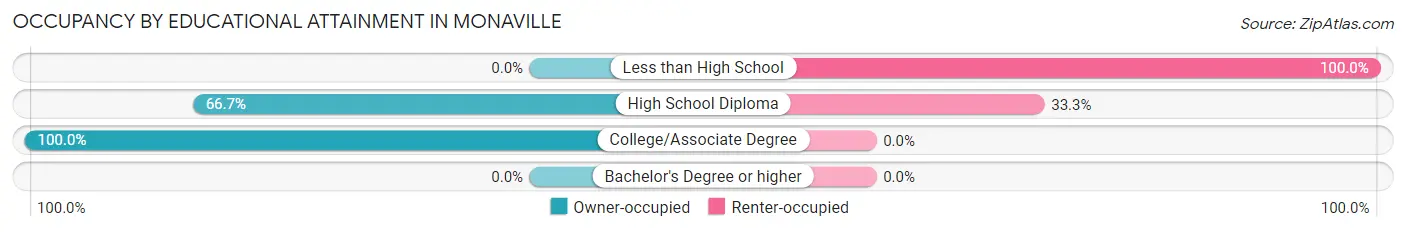
| Household Size | Owner-occupied | Renter-occupied |
| Less than High School | 0 (0.0%) | 30 (100.0%) |
| High School Diploma | 62 (66.7%) | 31 (33.3%) |
| College/Associate Degree | 72 (100.0%) | 0 (0.0%) |
| Bachelor's Degree or higher | 0 (0.0%) | 0 (0.0%) |
Occupancy by Age of Householder in Monaville
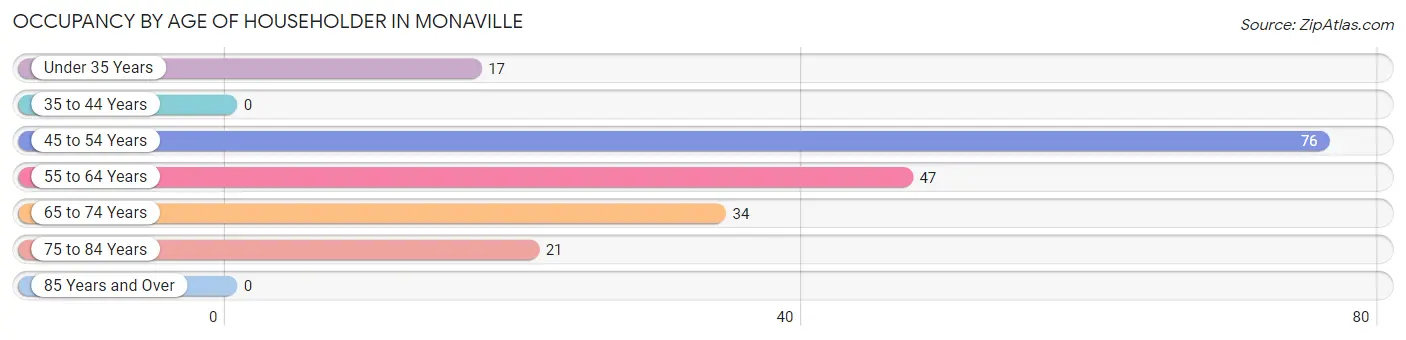
| Age Bracket | # Households | % Households |
| Under 35 Years | 17 | 8.7% |
| 35 to 44 Years | 0 | 0.0% |
| 45 to 54 Years | 76 | 39.0% |
| 55 to 64 Years | 47 | 24.1% |
| 65 to 74 Years | 34 | 17.4% |
| 75 to 84 Years | 21 | 10.8% |
| 85 Years and Over | 0 | 0.0% |
| Total | 195 | 100.0% |
Housing Finances in Monaville
Median Income by Occupancy in Monaville
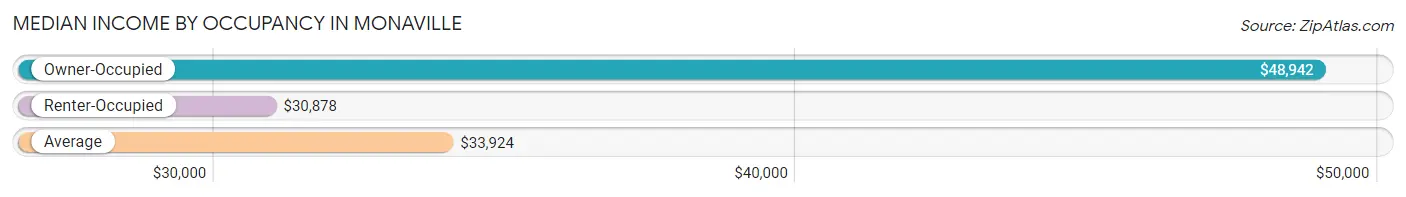
| Occupancy Type | # Households | Median Income |
| Owner-Occupied | 134 (68.7%) | $48,942 |
| Renter-Occupied | 61 (31.3%) | $30,878 |
| Average | 195 (100.0%) | $33,924 |
Occupancy by Householder Income Bracket in Monaville
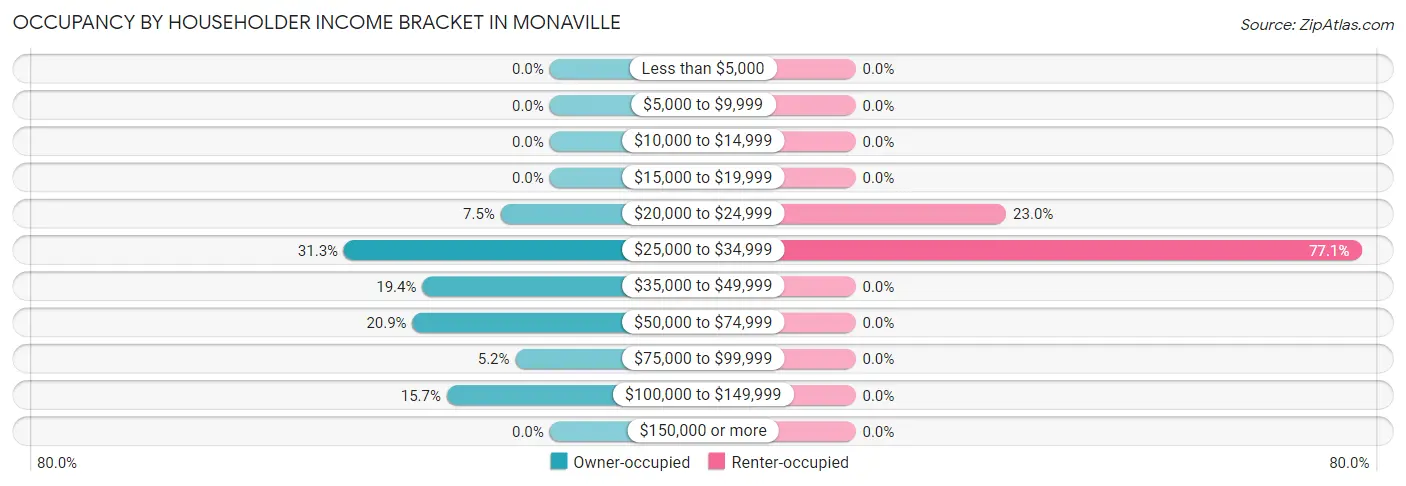
| Income Bracket | Owner-occupied | Renter-occupied |
| Less than $5,000 | 0 (0.0%) | 0 (0.0%) |
| $5,000 to $9,999 | 0 (0.0%) | 0 (0.0%) |
| $10,000 to $14,999 | 0 (0.0%) | 0 (0.0%) |
| $15,000 to $19,999 | 0 (0.0%) | 0 (0.0%) |
| $20,000 to $24,999 | 10 (7.5%) | 14 (23.0%) |
| $25,000 to $34,999 | 42 (31.3%) | 47 (77.0%) |
| $35,000 to $49,999 | 26 (19.4%) | 0 (0.0%) |
| $50,000 to $74,999 | 28 (20.9%) | 0 (0.0%) |
| $75,000 to $99,999 | 7 (5.2%) | 0 (0.0%) |
| $100,000 to $149,999 | 21 (15.7%) | 0 (0.0%) |
| $150,000 or more | 0 (0.0%) | 0 (0.0%) |
| Total | 134 (100.0%) | 61 (100.0%) |
Monthly Housing Cost Tiers in Monaville
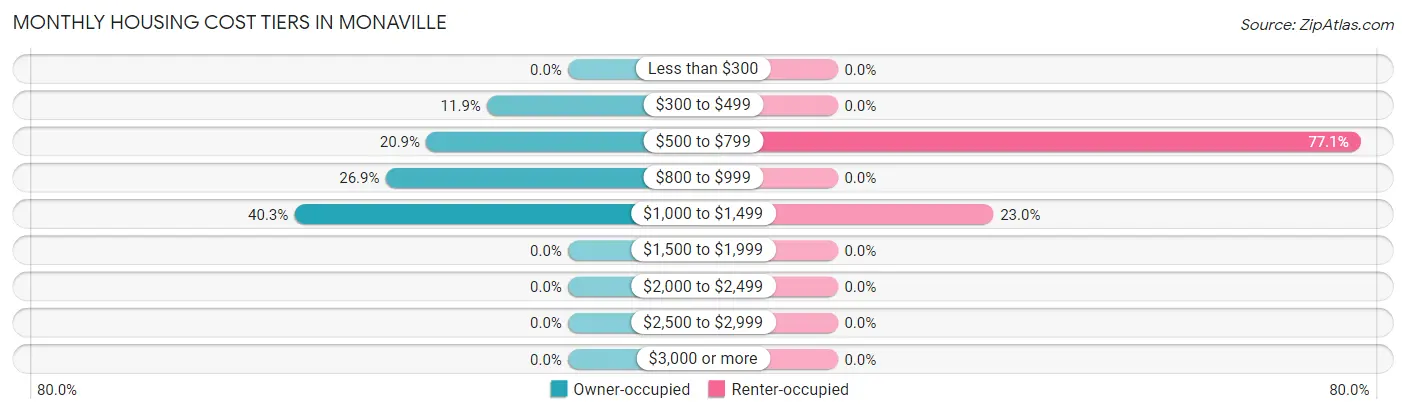
| Monthly Cost | Owner-occupied | Renter-occupied |
| Less than $300 | 0 (0.0%) | 0 (0.0%) |
| $300 to $499 | 16 (11.9%) | 0 (0.0%) |
| $500 to $799 | 28 (20.9%) | 47 (77.0%) |
| $800 to $999 | 36 (26.9%) | 0 (0.0%) |
| $1,000 to $1,499 | 54 (40.3%) | 14 (23.0%) |
| $1,500 to $1,999 | 0 (0.0%) | 0 (0.0%) |
| $2,000 to $2,499 | 0 (0.0%) | 0 (0.0%) |
| $2,500 to $2,999 | 0 (0.0%) | 0 (0.0%) |
| $3,000 or more | 0 (0.0%) | 0 (0.0%) |
| Total | 134 (100.0%) | 61 (100.0%) |
Physical Housing Characteristics in Monaville
Housing Structures in Monaville
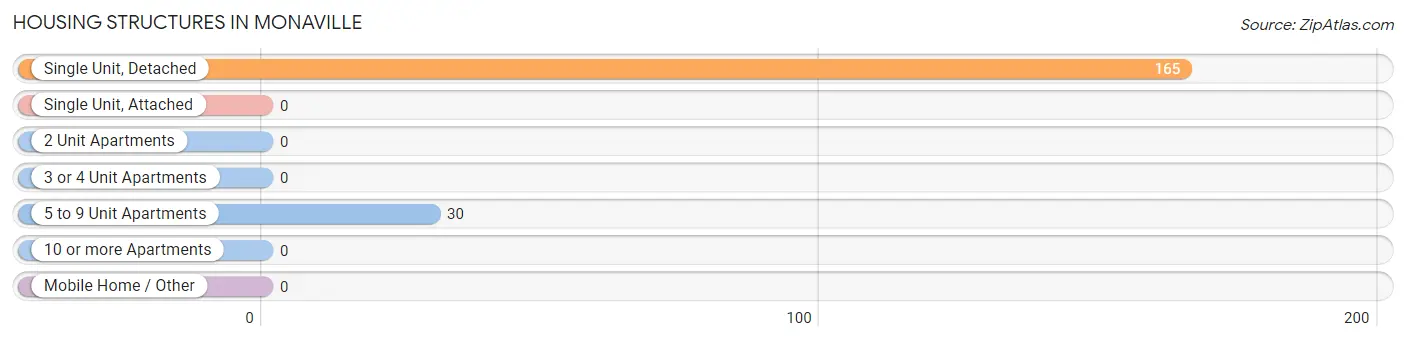
| Structure Type | # Housing Units | % Housing Units |
| Single Unit, Detached | 165 | 84.6% |
| Single Unit, Attached | 0 | 0.0% |
| 2 Unit Apartments | 0 | 0.0% |
| 3 or 4 Unit Apartments | 0 | 0.0% |
| 5 to 9 Unit Apartments | 30 | 15.4% |
| 10 or more Apartments | 0 | 0.0% |
| Mobile Home / Other | 0 | 0.0% |
| Total | 195 | 100.0% |
Housing Structures by Occupancy in Monaville
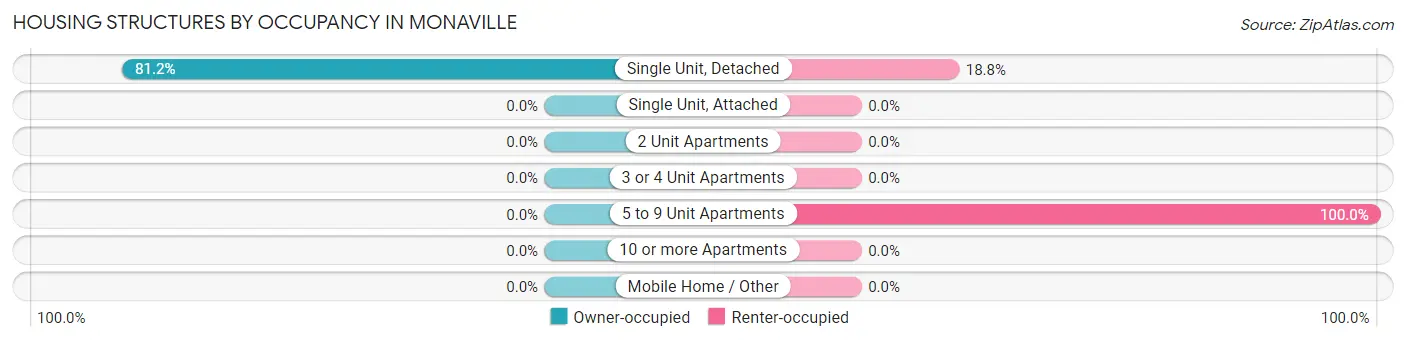
| Structure Type | Owner-occupied | Renter-occupied |
| Single Unit, Detached | 134 (81.2%) | 31 (18.8%) |
| Single Unit, Attached | 0 (0.0%) | 0 (0.0%) |
| 2 Unit Apartments | 0 (0.0%) | 0 (0.0%) |
| 3 or 4 Unit Apartments | 0 (0.0%) | 0 (0.0%) |
| 5 to 9 Unit Apartments | 0 (0.0%) | 30 (100.0%) |
| 10 or more Apartments | 0 (0.0%) | 0 (0.0%) |
| Mobile Home / Other | 0 (0.0%) | 0 (0.0%) |
| Total | 134 (68.7%) | 61 (31.3%) |
Housing Structures by Number of Rooms in Monaville
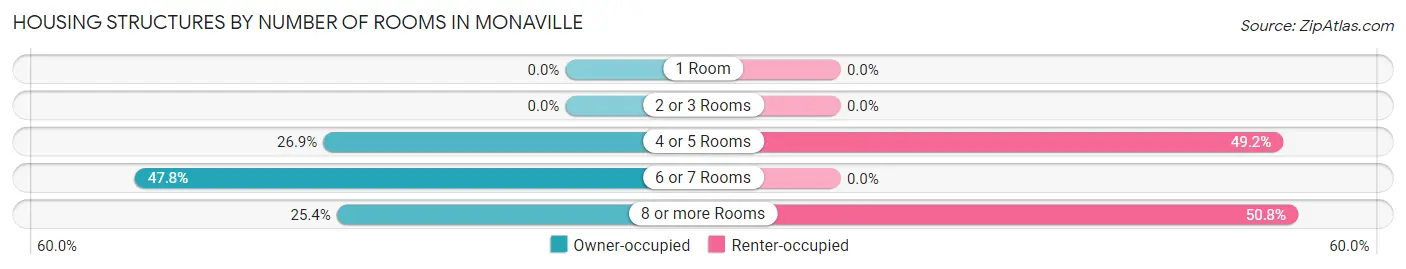
| Number of Rooms | Owner-occupied | Renter-occupied |
| 1 Room | 0 (0.0%) | 0 (0.0%) |
| 2 or 3 Rooms | 0 (0.0%) | 0 (0.0%) |
| 4 or 5 Rooms | 36 (26.9%) | 30 (49.2%) |
| 6 or 7 Rooms | 64 (47.8%) | 0 (0.0%) |
| 8 or more Rooms | 34 (25.4%) | 31 (50.8%) |
| Total | 134 (100.0%) | 61 (100.0%) |
Housing Structure by Heating Type in Monaville
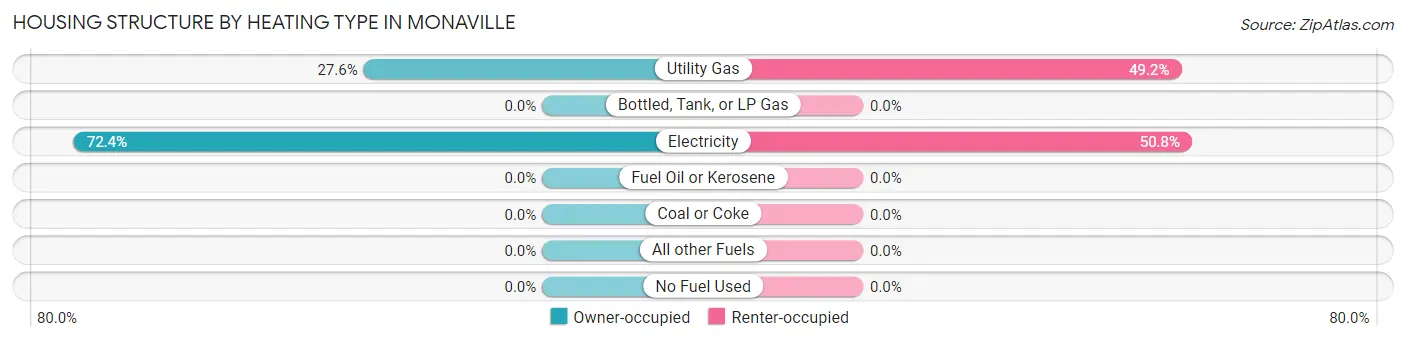
| Heating Type | Owner-occupied | Renter-occupied |
| Utility Gas | 37 (27.6%) | 30 (49.2%) |
| Bottled, Tank, or LP Gas | 0 (0.0%) | 0 (0.0%) |
| Electricity | 97 (72.4%) | 31 (50.8%) |
| Fuel Oil or Kerosene | 0 (0.0%) | 0 (0.0%) |
| Coal or Coke | 0 (0.0%) | 0 (0.0%) |
| All other Fuels | 0 (0.0%) | 0 (0.0%) |
| No Fuel Used | 0 (0.0%) | 0 (0.0%) |
| Total | 134 (100.0%) | 61 (100.0%) |
Household Vehicle Usage in Monaville
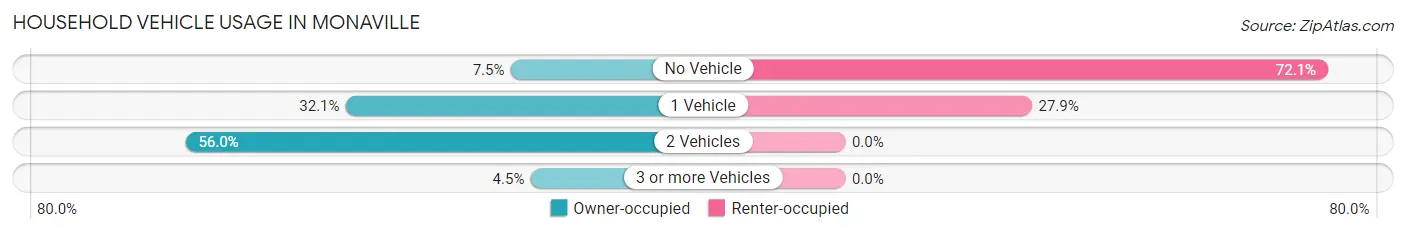
| Vehicles per Household | Owner-occupied | Renter-occupied |
| No Vehicle | 10 (7.5%) | 44 (72.1%) |
| 1 Vehicle | 43 (32.1%) | 17 (27.9%) |
| 2 Vehicles | 75 (56.0%) | 0 (0.0%) |
| 3 or more Vehicles | 6 (4.5%) | 0 (0.0%) |
| Total | 134 (100.0%) | 61 (100.0%) |
Real Estate & Mortgages in Monaville
Real Estate and Mortgage Overview in Monaville
| Characteristic | Without Mortgage | With Mortgage |
| Housing Units | 44 | 90 |
| Median Property Value | - | - |
| Median Household Income | $55,536 | $0 |
| Monthly Housing Costs | $621 | $0 |
| Real Estate Taxes | $1,107 | $36 |
Property Value by Mortgage Status in Monaville
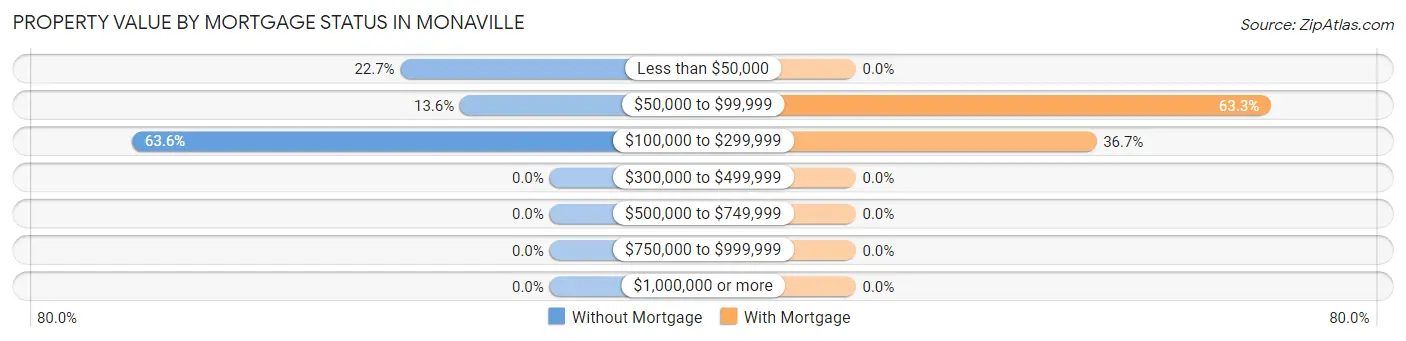
| Property Value | Without Mortgage | With Mortgage |
| Less than $50,000 | 10 (22.7%) | 0 (0.0%) |
| $50,000 to $99,999 | 6 (13.6%) | 57 (63.3%) |
| $100,000 to $299,999 | 28 (63.6%) | 33 (36.7%) |
| $300,000 to $499,999 | 0 (0.0%) | 0 (0.0%) |
| $500,000 to $749,999 | 0 (0.0%) | 0 (0.0%) |
| $750,000 to $999,999 | 0 (0.0%) | 0 (0.0%) |
| $1,000,000 or more | 0 (0.0%) | 0 (0.0%) |
| Total | 44 (100.0%) | 90 (100.0%) |
Household Income by Mortgage Status in Monaville
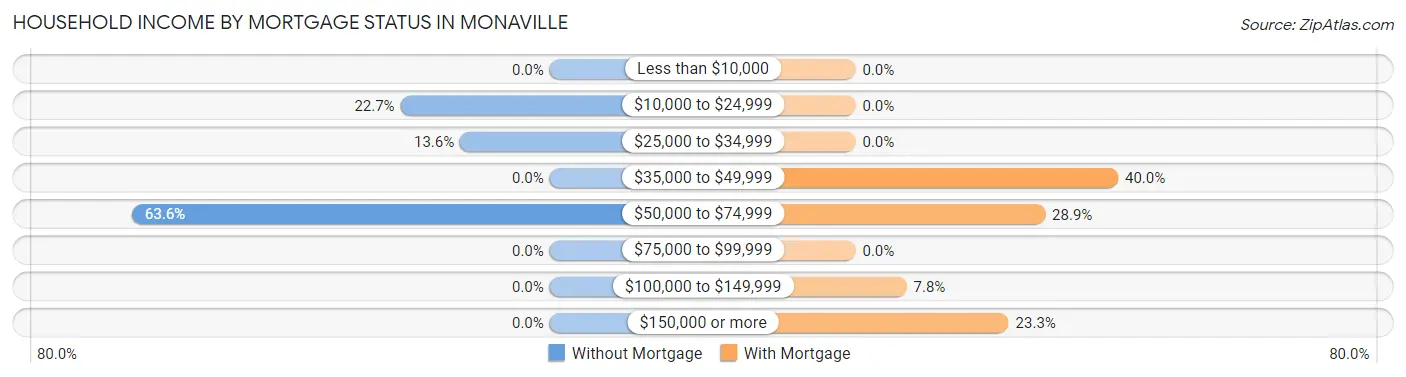
| Household Income | Without Mortgage | With Mortgage |
| Less than $10,000 | 0 (0.0%) | 0 (0.0%) |
| $10,000 to $24,999 | 10 (22.7%) | 0 (0.0%) |
| $25,000 to $34,999 | 6 (13.6%) | 0 (0.0%) |
| $35,000 to $49,999 | 0 (0.0%) | 36 (40.0%) |
| $50,000 to $74,999 | 28 (63.6%) | 26 (28.9%) |
| $75,000 to $99,999 | 0 (0.0%) | 0 (0.0%) |
| $100,000 to $149,999 | 0 (0.0%) | 7 (7.8%) |
| $150,000 or more | 0 (0.0%) | 21 (23.3%) |
| Total | 44 (100.0%) | 90 (100.0%) |
Property Value to Household Income Ratio in Monaville
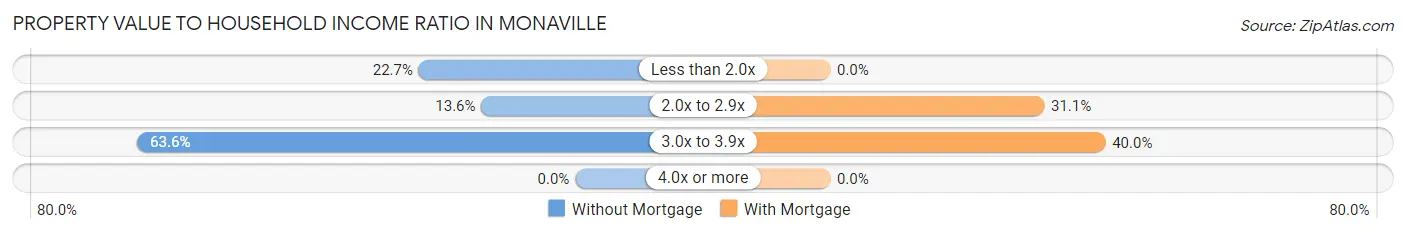
| Value-to-Income Ratio | Without Mortgage | With Mortgage |
| Less than 2.0x | 10 (22.7%) | 0 (0.0%) |
| 2.0x to 2.9x | 6 (13.6%) | 28 (31.1%) |
| 3.0x to 3.9x | 28 (63.6%) | 36 (40.0%) |
| 4.0x or more | 0 (0.0%) | 0 (0.0%) |
| Total | 44 (100.0%) | 90 (100.0%) |
Real Estate Taxes by Mortgage Status in Monaville
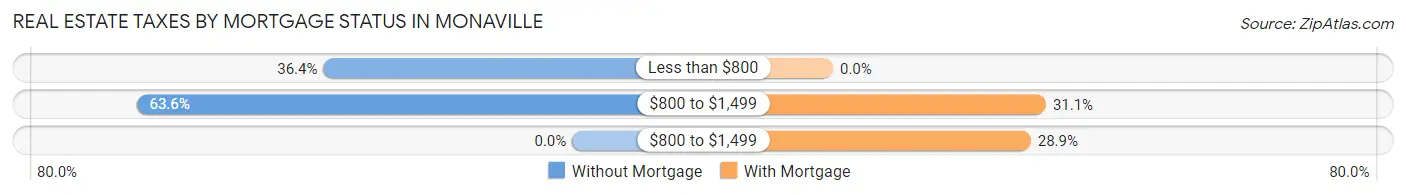
| Property Taxes | Without Mortgage | With Mortgage |
| Less than $800 | 16 (36.4%) | 0 (0.0%) |
| $800 to $1,499 | 28 (63.6%) | 28 (31.1%) |
| $800 to $1,499 | 0 (0.0%) | 26 (28.9%) |
| Total | 44 (100.0%) | 90 (100.0%) |
Health & Disability in Monaville
Health Insurance Coverage by Age in Monaville
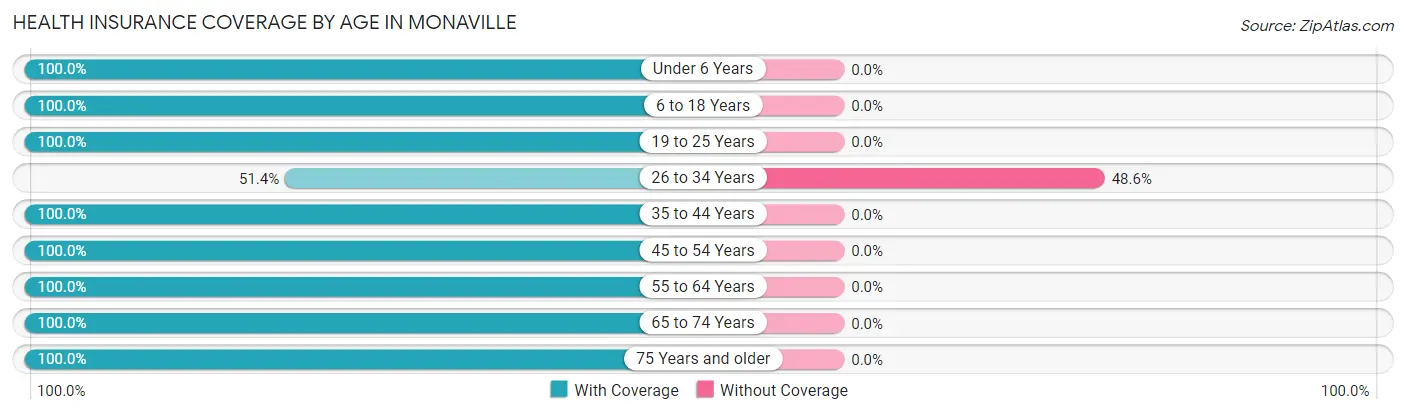
| Age Bracket | With Coverage | Without Coverage |
| Under 6 Years | 95 (100.0%) | 0 (0.0%) |
| 6 to 18 Years | 168 (100.0%) | 0 (0.0%) |
| 19 to 25 Years | 15 (100.0%) | 0 (0.0%) |
| 26 to 34 Years | 18 (51.4%) | 17 (48.6%) |
| 35 to 44 Years | 100 (100.0%) | 0 (0.0%) |
| 45 to 54 Years | 76 (100.0%) | 0 (0.0%) |
| 55 to 64 Years | 91 (100.0%) | 0 (0.0%) |
| 65 to 74 Years | 65 (100.0%) | 0 (0.0%) |
| 75 Years and older | 21 (100.0%) | 0 (0.0%) |
| Total | 649 (97.5%) | 17 (2.5%) |
Health Insurance Coverage by Citizenship Status in Monaville
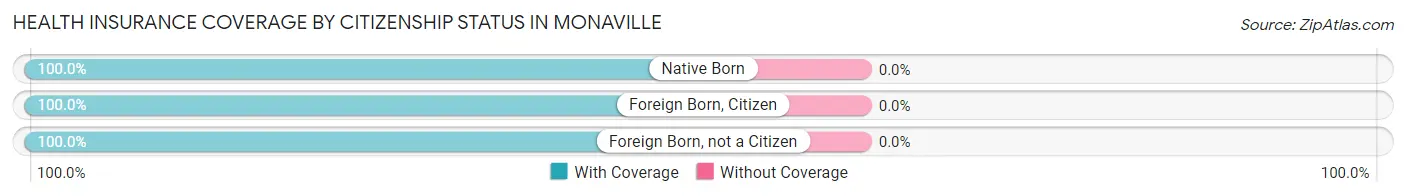
| Citizenship Status | With Coverage | Without Coverage |
| Native Born | 95 (100.0%) | 0 (0.0%) |
| Foreign Born, Citizen | 168 (100.0%) | 0 (0.0%) |
| Foreign Born, not a Citizen | 15 (100.0%) | 0 (0.0%) |
Health Insurance Coverage by Household Income in Monaville
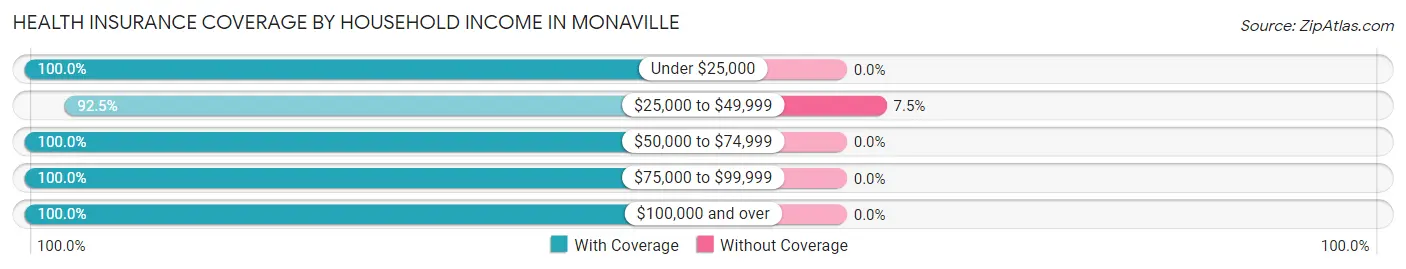
| Household Income | With Coverage | Without Coverage |
| Under $25,000 | 202 (100.0%) | 0 (0.0%) |
| $25,000 to $49,999 | 211 (92.5%) | 17 (7.5%) |
| $50,000 to $74,999 | 87 (100.0%) | 0 (0.0%) |
| $75,000 to $99,999 | 16 (100.0%) | 0 (0.0%) |
| $100,000 and over | 133 (100.0%) | 0 (0.0%) |
Public vs Private Health Insurance Coverage by Age in Monaville
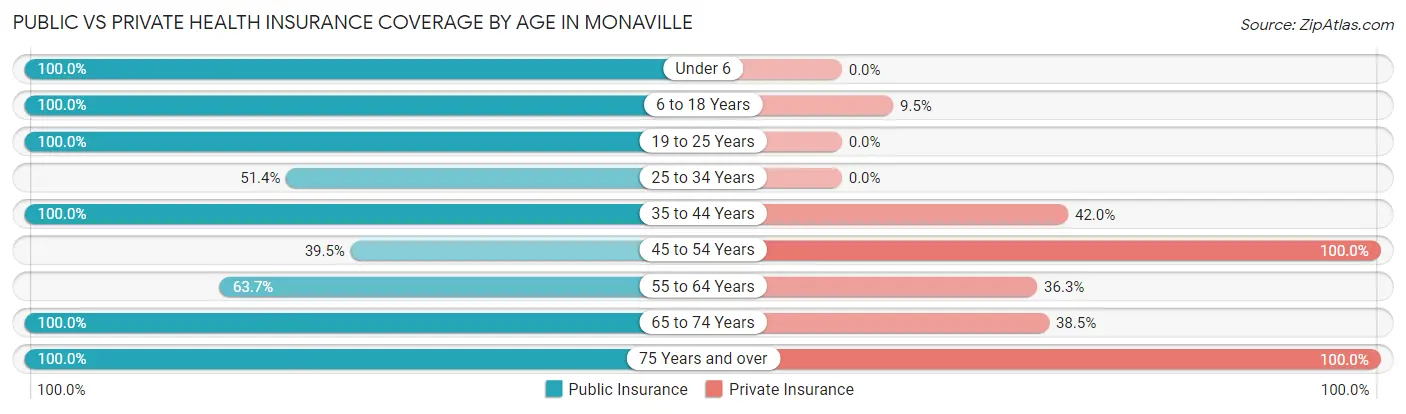
| Age Bracket | Public Insurance | Private Insurance |
| Under 6 | 95 (100.0%) | 0 (0.0%) |
| 6 to 18 Years | 168 (100.0%) | 16 (9.5%) |
| 19 to 25 Years | 15 (100.0%) | 0 (0.0%) |
| 25 to 34 Years | 18 (51.4%) | 0 (0.0%) |
| 35 to 44 Years | 100 (100.0%) | 42 (42.0%) |
| 45 to 54 Years | 30 (39.5%) | 76 (100.0%) |
| 55 to 64 Years | 58 (63.7%) | 33 (36.3%) |
| 65 to 74 Years | 65 (100.0%) | 25 (38.5%) |
| 75 Years and over | 21 (100.0%) | 21 (100.0%) |
| Total | 570 (85.6%) | 213 (32.0%) |
Disability Status by Sex by Age in Monaville
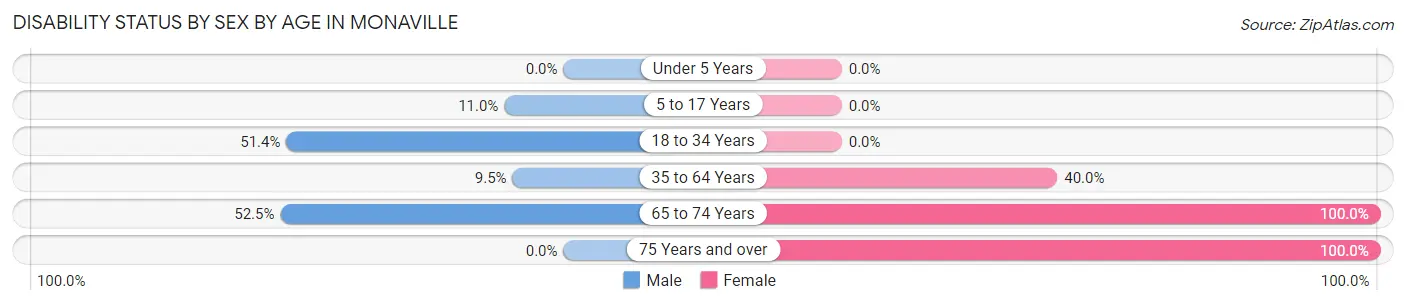
| Age Bracket | Male | Female |
| Under 5 Years | 0 (0.0%) | 0 (0.0%) |
| 5 to 17 Years | 9 (11.0%) | 0 (0.0%) |
| 18 to 34 Years | 18 (51.4%) | 0 (0.0%) |
| 35 to 64 Years | 12 (9.5%) | 56 (40.0%) |
| 65 to 74 Years | 31 (52.5%) | 6 (100.0%) |
| 75 Years and over | 0 (0.0%) | 21 (100.0%) |
Disability Class by Sex by Age in Monaville
Disability Class: Hearing Difficulty
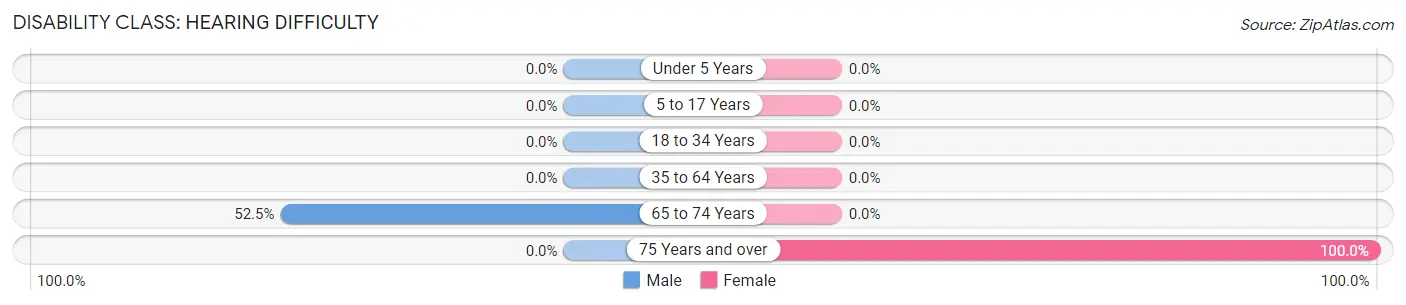
| Age Bracket | Male | Female |
| Under 5 Years | 0 (0.0%) | 0 (0.0%) |
| 5 to 17 Years | 0 (0.0%) | 0 (0.0%) |
| 18 to 34 Years | 0 (0.0%) | 0 (0.0%) |
| 35 to 64 Years | 0 (0.0%) | 0 (0.0%) |
| 65 to 74 Years | 31 (52.5%) | 0 (0.0%) |
| 75 Years and over | 0 (0.0%) | 21 (100.0%) |
Disability Class: Vision Difficulty
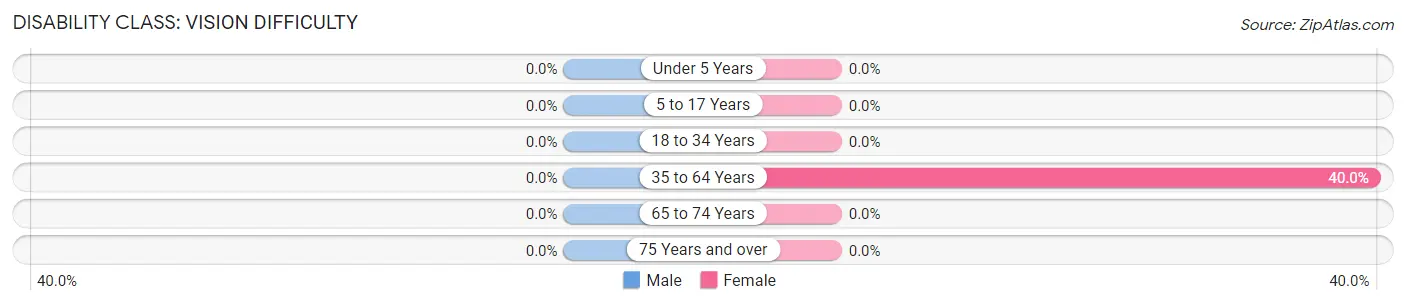
| Age Bracket | Male | Female |
| Under 5 Years | 0 (0.0%) | 0 (0.0%) |
| 5 to 17 Years | 0 (0.0%) | 0 (0.0%) |
| 18 to 34 Years | 0 (0.0%) | 0 (0.0%) |
| 35 to 64 Years | 0 (0.0%) | 56 (40.0%) |
| 65 to 74 Years | 0 (0.0%) | 0 (0.0%) |
| 75 Years and over | 0 (0.0%) | 0 (0.0%) |
Disability Class: Cognitive Difficulty
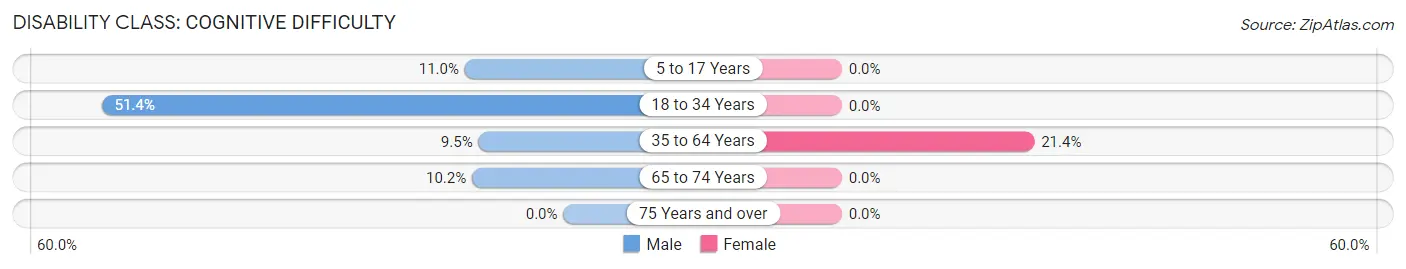
| Age Bracket | Male | Female |
| 5 to 17 Years | 9 (11.0%) | 0 (0.0%) |
| 18 to 34 Years | 18 (51.4%) | 0 (0.0%) |
| 35 to 64 Years | 12 (9.5%) | 30 (21.4%) |
| 65 to 74 Years | 6 (10.2%) | 0 (0.0%) |
| 75 Years and over | 0 (0.0%) | 0 (0.0%) |
Disability Class: Ambulatory Difficulty
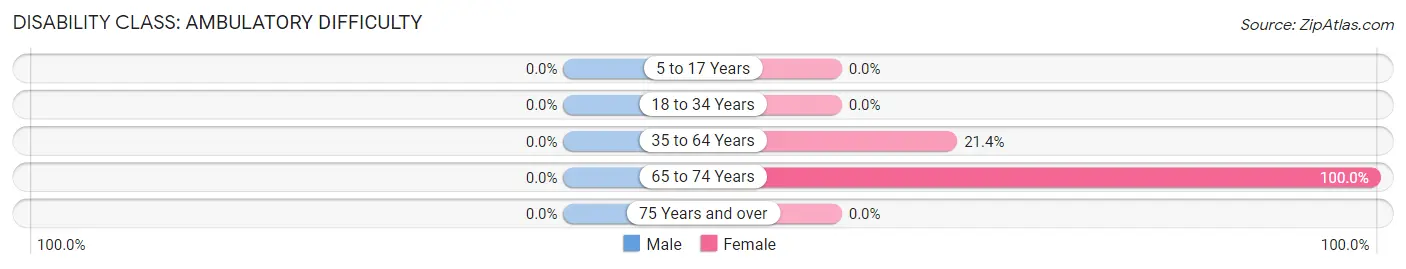
| Age Bracket | Male | Female |
| 5 to 17 Years | 0 (0.0%) | 0 (0.0%) |
| 18 to 34 Years | 0 (0.0%) | 0 (0.0%) |
| 35 to 64 Years | 0 (0.0%) | 30 (21.4%) |
| 65 to 74 Years | 0 (0.0%) | 6 (100.0%) |
| 75 Years and over | 0 (0.0%) | 0 (0.0%) |
Disability Class: Self-Care Difficulty
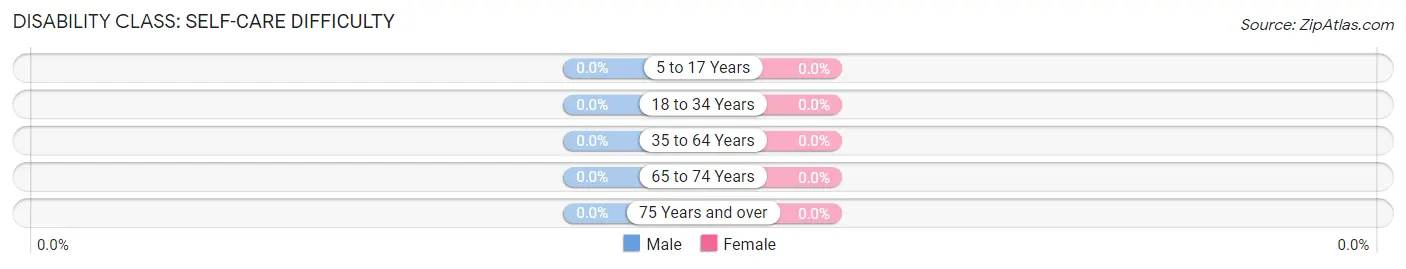
| Age Bracket | Male | Female |
| 5 to 17 Years | 0 (0.0%) | 0 (0.0%) |
| 18 to 34 Years | 0 (0.0%) | 0 (0.0%) |
| 35 to 64 Years | 0 (0.0%) | 0 (0.0%) |
| 65 to 74 Years | 0 (0.0%) | 0 (0.0%) |
| 75 Years and over | 0 (0.0%) | 0 (0.0%) |
Technology Access in Monaville
Computing Device Access in Monaville
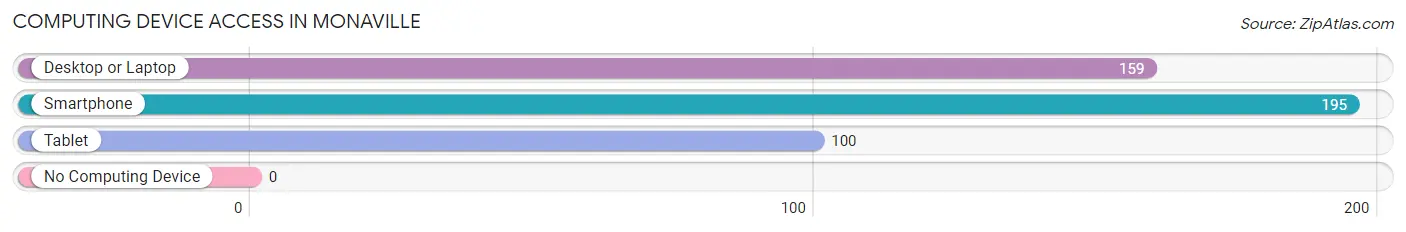
| Device Type | # Households | % Households |
| Desktop or Laptop | 159 | 81.5% |
| Smartphone | 195 | 100.0% |
| Tablet | 100 | 51.3% |
| No Computing Device | 0 | 0.0% |
| Total | 195 | 100.0% |
Internet Access in Monaville
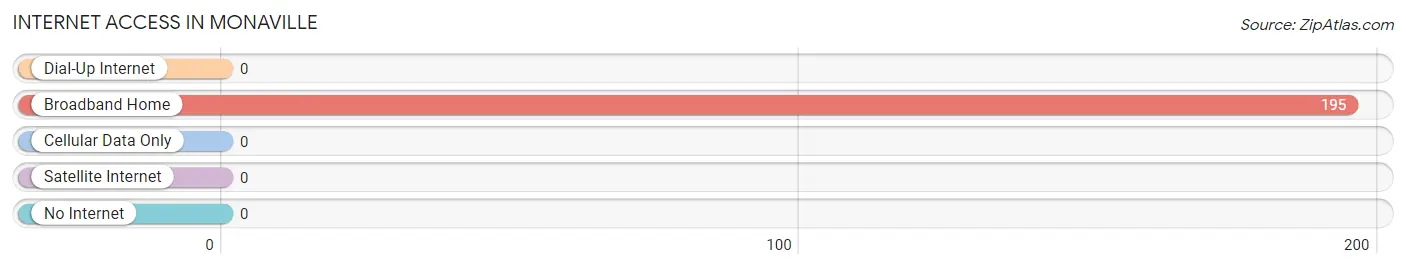
| Internet Type | # Households | % Households |
| Dial-Up Internet | 0 | 0.0% |
| Broadband Home | 195 | 100.0% |
| Cellular Data Only | 0 | 0.0% |
| Satellite Internet | 0 | 0.0% |
| No Internet | 0 | 0.0% |
| Total | 195 | 100.0% |
Monaville Summary
Monaville, WV is a small unincorporated community located in Logan County, West Virginia. It is situated along the Guyandotte River, approximately five miles south of the county seat of Logan. The population of Monaville was estimated to be around 200 people in 2020.
History
Monaville was first settled in the late 1800s by a group of coal miners from England. The town was named after the Mona Mine, which was located nearby. The mine was owned by the Mona Coal Company, which was founded in 1891. The company operated the mine until it closed in the early 1900s.
The town of Monaville was officially incorporated in 1909. During this time, the town was a bustling coal mining community. The town had a post office, a general store, a school, and several churches.
In the early 1900s, the town experienced a period of growth and prosperity. However, this period was short-lived as the Great Depression hit the town hard. Many of the town’s businesses closed and the population began to decline.
In the 1950s, the town experienced a brief resurgence as the coal industry began to boom again. However, this period of growth was short-lived as the industry began to decline in the late 1960s.
Geography
Monaville is located in the Appalachian Mountains of West Virginia. The town is situated along the Guyandotte River, approximately five miles south of the county seat of Logan. The town is surrounded by rolling hills and lush forests.
The climate in Monaville is humid and subtropical. Summers are hot and humid, while winters are cold and wet. The average annual temperature is around 55 degrees Fahrenheit.
Economy
The economy of Monaville is largely based on agriculture and tourism. The town is home to several small farms that produce a variety of crops, including corn, soybeans, and hay.
The town is also home to several tourist attractions, including the Mona Mine Museum and the Mona River Wildlife Refuge. The town also hosts several festivals throughout the year, including the Mona River Festival and the Mona River Music Festival.
Demographics
The population of Monaville was estimated to be around 200 people in 2020. The town is predominantly white, with a small minority population. The median household income is around $30,000. The town has a high rate of poverty, with around 25% of the population living below the poverty line.
Monaville is a small, rural community with a rich history and a bright future. The town is home to a diverse population and a vibrant economy. The town is a great place to live, work, and raise a family.
Common Questions
What is Per Capita Income in Monaville?
Per Capita income in Monaville is $14,720.
What is the Median Family Income in Monaville?
Median Family Income in Monaville is $32,010.
What is the Median Household income in Monaville?
Median Household Income in Monaville is $33,924.
What is Inequality or Gini Index in Monaville?
Inequality or Gini Index in Monaville is 0.28.
What is the Total Population of Monaville?
Total Population of Monaville is 666.
What is the Total Male Population of Monaville?
Total Male Population of Monaville is 374.
What is the Total Female Population of Monaville?
Total Female Population of Monaville is 292.
What is the Ratio of Males per 100 Females in Monaville?
There are 128.08 Males per 100 Females in Monaville.
What is the Ratio of Females per 100 Males in Monaville?
There are 78.07 Females per 100 Males in Monaville.
What is the Median Population Age in Monaville?
Median Population Age in Monaville is 36.9 Years.
What is the Average Family Size in Monaville
Average Family Size in Monaville is 3.7 People.
What is the Average Household Size in Monaville
Average Household Size in Monaville is 3.4 People.
How Large is the Labor Force in Monaville?
There are 152 People in the Labor Forcein in Monaville.
What is the Percentage of People in the Labor Force in Monaville?
34.2% of People are in the Labor Force in Monaville.
What is the Unemployment Rate in Monaville?
Unemployment Rate in Monaville is 7.9%.