Zip Codes with the Highest Percentage of Population Employed in Administrative & Support Services in Huntington, WV
RELATED REPORTS & OPTIONS
Administrative & Support Services
Huntington
Compare Zip Codes
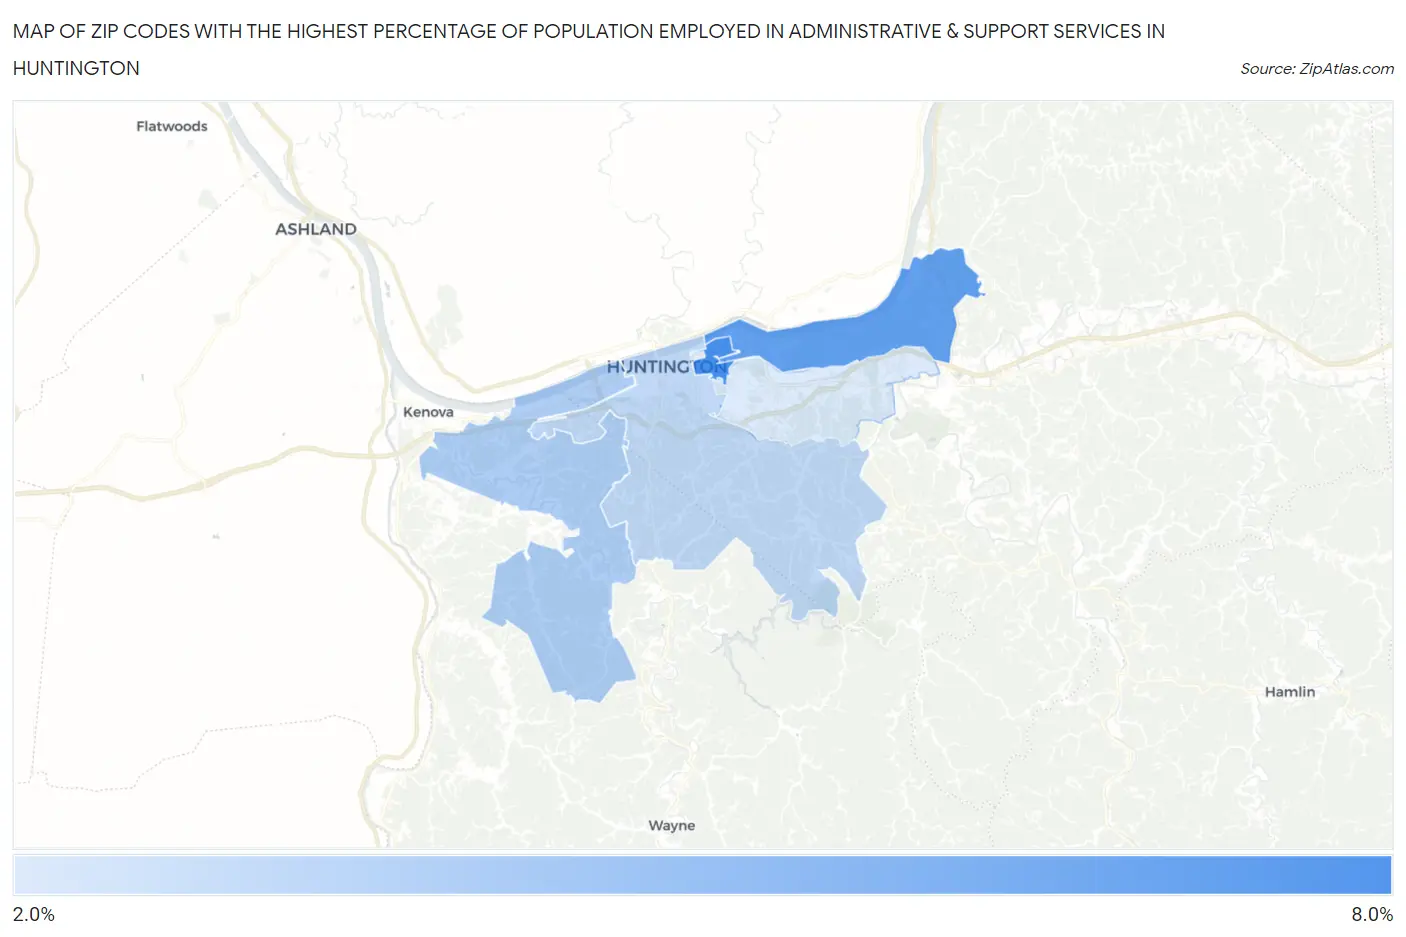
Map of Zip Codes with the Highest Percentage of Population Employed in Administrative & Support Services in Huntington
2.9%
7.8%
Zip Codes with the Highest Percentage of Population Employed in Administrative & Support Services in Huntington, WV
| Zip Code | % Employed | vs State | vs National | |
| 1. | 25703 | 7.8% | 3.4%(+4.40)#87 | 4.1%(+3.68)#2,397 |
| 2. | 25702 | 6.9% | 3.4%(+3.47)#98 | 4.1%(+2.74)#3,362 |
| 3. | 25704 | 4.4% | 3.4%(+1.03)#159 | 4.1%(+0.299)#8,881 |
| 4. | 25701 | 3.8% | 3.4%(+0.390)#186 | 4.1%(-0.336)#11,477 |
| 5. | 25705 | 2.9% | 3.4%(-0.490)#228 | 4.1%(-1.22)#15,831 |
1
Common Questions
What are the Top 5 Zip Codes with the Highest Percentage of Population Employed in Administrative & Support Services in Huntington, WV?
Top 5 Zip Codes with the Highest Percentage of Population Employed in Administrative & Support Services in Huntington, WV are:
What zip code has the Highest Percentage of Population Employed in Administrative & Support Services in Huntington, WV?
25703 has the Highest Percentage of Population Employed in Administrative & Support Services in Huntington, WV with 7.8%.
What is the Percentage of Population Employed in Administrative & Support Services in Huntington, WV?
Percentage of Population Employed in Administrative & Support Services in Huntington is 4.2%.
What is the Percentage of Population Employed in Administrative & Support Services in West Virginia?
Percentage of Population Employed in Administrative & Support Services in West Virginia is 3.4%.
What is the Percentage of Population Employed in Administrative & Support Services in the United States?
Percentage of Population Employed in Administrative & Support Services in the United States is 4.1%.