Swiss Unemployment Among Women with Children Ages 6 to 17 years
COMPARE
Swiss
Select to Compare
Unemployment Among Women with Children Ages 6 to 17 years
Swiss Unemployment Among Women with Children Ages 6 to 17 years
9.0%
UNEMPLOYMENT | WOMEN W/ CHILDREN 6 TO 17
33.5/ 100
METRIC RATING
183rd/ 347
METRIC RANK
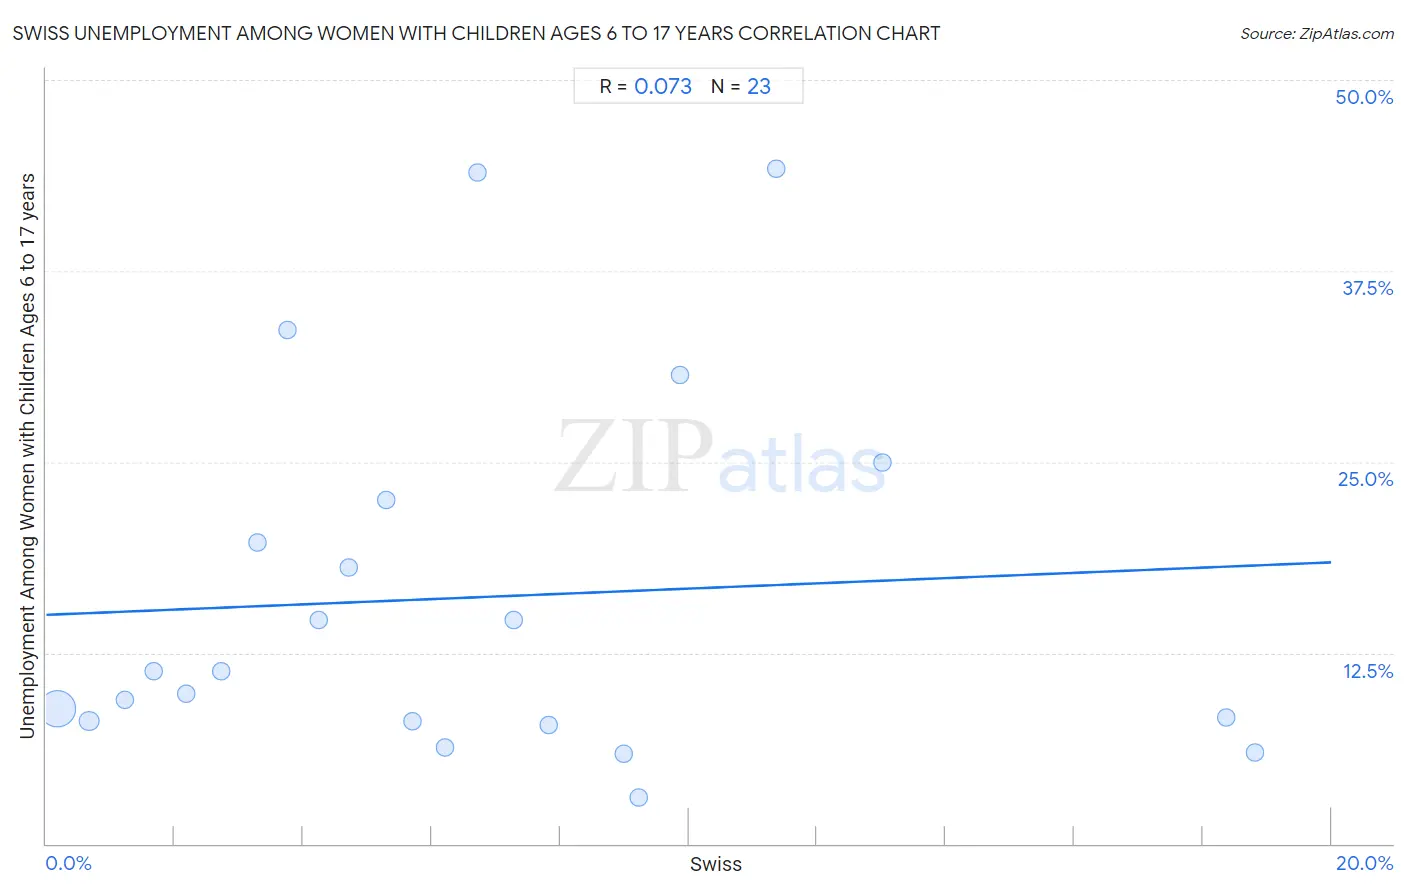
Swiss Unemployment Among Women with Children Ages 6 to 17 years Correlation Chart
The statistical analysis conducted on geographies consisting of 308,367,894 people shows a slight positive correlation between the proportion of Swiss and unemployment rate among women with children between the ages 6 and 17 in the United States with a correlation coefficient (R) of 0.073 and weighted average of 9.0%. On average, for every 1% (one percent) increase in Swiss within a typical geography, there is an increase of 0.17% in unemployment rate among women with children between the ages 6 and 17.
It is essential to understand that the correlation between the percentage of Swiss and unemployment rate among women with children between the ages 6 and 17 does not imply a direct cause-and-effect relationship. It remains uncertain whether the presence of Swiss influences an upward or downward trend in the level of unemployment rate among women with children between the ages 6 and 17 within an area, or if Swiss simply ended up residing in those areas with higher or lower levels of unemployment rate among women with children between the ages 6 and 17 due to other factors.
Demographics Similar to Swiss by Unemployment Among Women with Children Ages 6 to 17 years
In terms of unemployment among women with children ages 6 to 17 years, the demographic groups most similar to Swiss are Palestinian (9.0%, a difference of 0.0%), Immigrants from Czechoslovakia (9.0%, a difference of 0.050%), South American Indian (9.0%, a difference of 0.050%), Immigrants from Congo (9.0%, a difference of 0.050%), and Immigrants from Spain (9.0%, a difference of 0.050%).
| Demographics | Rating | Rank | Unemployment Among Women with Children Ages 6 to 17 years |
| Immigrants from Italy | 43.7 /100 | #176 | Average 9.0% |
| Immigrants from Jordan | 41.6 /100 | #177 | Average 9.0% |
| Menominee | 39.3 /100 | #178 | Fair 9.0% |
| Immigrants from Zaire | 38.3 /100 | #179 | Fair 9.0% |
| Ethiopians | 37.6 /100 | #180 | Fair 9.0% |
| Immigrants from Czechoslovakia | 34.5 /100 | #181 | Fair 9.0% |
| South American Indians | 34.4 /100 | #182 | Fair 9.0% |
| Swiss | 33.5 /100 | #183 | Fair 9.0% |
| Palestinians | 33.4 /100 | #184 | Fair 9.0% |
| Immigrants from Congo | 32.5 /100 | #185 | Fair 9.0% |
| Immigrants from Spain | 32.4 /100 | #186 | Fair 9.0% |
| Comanche | 30.0 /100 | #187 | Fair 9.0% |
| Immigrants from Syria | 29.7 /100 | #188 | Fair 9.1% |
| Immigrants | 29.2 /100 | #189 | Fair 9.1% |
| Slovenes | 28.5 /100 | #190 | Fair 9.1% |
Swiss Unemployment Among Women with Children Ages 6 to 17 years Correlation Summary
| Measurement | Swiss Data | Unemployment Among Women with Children Ages 6 to 17 years Data |
| Minimum | 0.17% | 3.0% |
| Maximum | 18.8% | 44.2% |
| Range | 18.7% | 41.2% |
| Mean | 6.7% | 16.1% |
| Median | 5.7% | 11.3% |
| Interquartile 25% (IQ1) | 2.7% | 8.0% |
| Interquartile 75% (IQ3) | 9.2% | 22.5% |
| Interquartile Range (IQR) | 6.5% | 14.5% |
| Standard Deviation (Sample) | 5.1% | 12.0% |
| Standard Deviation (Population) | 5.0% | 11.7% |
Correlation Details
| Swiss Percentile | Sample Size | Unemployment Among Women with Children Ages 6 to 17 years |
[ 0.0% - 0.5% ] 0.17% | 276,621,654 | 8.9% |
[ 0.5% - 1.0% ] 0.67% | 25,077,228 | 8.0% |
[ 1.0% - 1.5% ] 1.22% | 3,971,494 | 9.4% |
[ 1.5% - 2.0% ] 1.68% | 1,175,312 | 11.3% |
[ 2.0% - 2.5% ] 2.18% | 762,528 | 9.8% |
[ 2.5% - 3.0% ] 2.72% | 272,291 | 11.3% |
[ 3.0% - 3.5% ] 3.29% | 67,392 | 19.7% |
[ 3.5% - 4.0% ] 3.76% | 35,051 | 33.6% |
[ 4.0% - 4.5% ] 4.25% | 58,759 | 14.6% |
[ 4.5% - 5.0% ] 4.72% | 52,521 | 18.1% |
[ 5.0% - 5.5% ] 5.29% | 33,681 | 22.5% |
[ 5.5% - 6.0% ] 5.71% | 105,751 | 8.0% |
[ 6.0% - 6.5% ] 6.20% | 55,115 | 6.3% |
[ 6.5% - 7.0% ] 6.71% | 5,631 | 44.0% |
[ 7.0% - 7.5% ] 7.28% | 19,799 | 14.7% |
[ 7.5% - 8.0% ] 7.82% | 5,822 | 7.8% |
[ 8.5% - 9.0% ] 8.98% | 757 | 5.9% |
[ 9.0% - 9.5% ] 9.22% | 2,343 | 3.0% |
[ 9.5% - 10.0% ] 9.85% | 12,289 | 30.7% |
[ 11.0% - 11.5% ] 11.37% | 2,815 | 44.2% |
[ 13.0% - 13.5% ] 13.02% | 4,002 | 25.0% |
[ 18.0% - 18.5% ] 18.37% | 10,622 | 8.3% |
[ 18.5% - 19.0% ] 18.82% | 15,037 | 6.0% |