Swiss vs South American Indian 3 or more Vehicles in Household
COMPARE
Swiss
South American Indian
3 or more Vehicles in Household
3 or more Vehicles in Household Comparison
Swiss
South American Indians
23.0%
3 OR MORE VEHICLES IN HOUSEHOLD
100.0/ 100
METRIC RATING
34th/ 347
METRIC RANK
19.1%
3 OR MORE VEHICLES IN HOUSEHOLD
25.4/ 100
METRIC RATING
191st/ 347
METRIC RANK
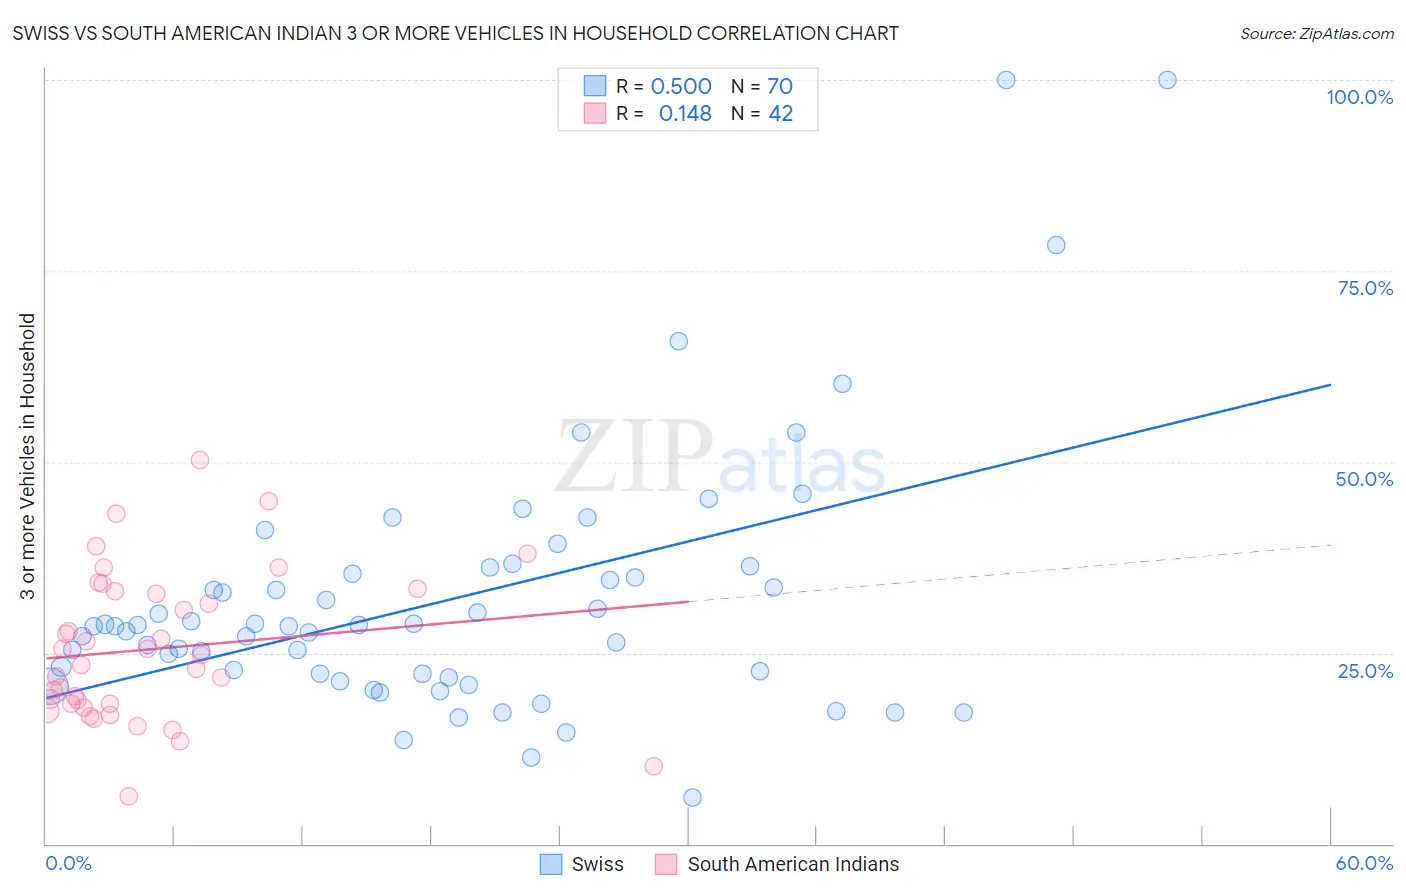
Swiss vs South American Indian 3 or more Vehicles in Household Correlation Chart
The statistical analysis conducted on geographies consisting of 464,647,007 people shows a moderate positive correlation between the proportion of Swiss and percentage of households with 3 or more vehicles available in the United States with a correlation coefficient (R) of 0.500 and weighted average of 23.0%. Similarly, the statistical analysis conducted on geographies consisting of 164,522,375 people shows a poor positive correlation between the proportion of South American Indians and percentage of households with 3 or more vehicles available in the United States with a correlation coefficient (R) of 0.148 and weighted average of 19.1%, a difference of 20.4%.
3 or more Vehicles in Household Correlation Summary
| Measurement | Swiss | South American Indian |
| Minimum | 6.1% | 6.3% |
| Maximum | 100.0% | 50.2% |
| Range | 93.9% | 43.9% |
| Mean | 31.9% | 25.5% |
| Median | 28.5% | 24.1% |
| Interquartile 25% (IQ1) | 22.3% | 18.3% |
| Interquartile 75% (IQ3) | 35.4% | 33.0% |
| Interquartile Range (IQR) | 13.1% | 14.7% |
| Standard Deviation (Sample) | 17.1% | 9.8% |
| Standard Deviation (Population) | 17.0% | 9.6% |
Similar Demographics by 3 or more Vehicles in Household
Demographics Similar to Swiss by 3 or more Vehicles in Household
In terms of 3 or more vehicles in household, the demographic groups most similar to Swiss are Choctaw (23.0%, a difference of 0.020%), Spanish American (23.0%, a difference of 0.050%), Cherokee (23.0%, a difference of 0.060%), Swedish (23.0%, a difference of 0.080%), and Pueblo (23.0%, a difference of 0.11%).
| Demographics | Rating | Rank | 3 or more Vehicles in Household |
| Guamanians/Chamorros | 100.0 /100 | #27 | Exceptional 23.2% |
| Lumbee | 100.0 /100 | #28 | Exceptional 23.1% |
| Spanish | 100.0 /100 | #29 | Exceptional 23.1% |
| Immigrants | South Eastern Asia | 100.0 /100 | #30 | Exceptional 23.1% |
| English | 100.0 /100 | #31 | Exceptional 23.1% |
| Pueblo | 100.0 /100 | #32 | Exceptional 23.0% |
| Spanish Americans | 100.0 /100 | #33 | Exceptional 23.0% |
| Swiss | 100.0 /100 | #34 | Exceptional 23.0% |
| Choctaw | 100.0 /100 | #35 | Exceptional 23.0% |
| Cherokee | 100.0 /100 | #36 | Exceptional 23.0% |
| Swedes | 100.0 /100 | #37 | Exceptional 23.0% |
| Dutch | 100.0 /100 | #38 | Exceptional 22.9% |
| Yaqui | 100.0 /100 | #39 | Exceptional 22.9% |
| Europeans | 100.0 /100 | #40 | Exceptional 22.9% |
| Germans | 100.0 /100 | #41 | Exceptional 22.7% |
Demographics Similar to South American Indians by 3 or more Vehicles in Household
In terms of 3 or more vehicles in household, the demographic groups most similar to South American Indians are Immigrants from Zimbabwe (19.1%, a difference of 0.010%), Kenyan (19.1%, a difference of 0.060%), Immigrants from Kuwait (19.1%, a difference of 0.070%), Indian (Asian) (19.1%, a difference of 0.070%), and Tsimshian (19.1%, a difference of 0.10%).
| Demographics | Rating | Rank | 3 or more Vehicles in Household |
| Latvians | 35.7 /100 | #184 | Fair 19.3% |
| Immigrants | Sri Lanka | 30.7 /100 | #185 | Fair 19.2% |
| Immigrants | Sweden | 29.0 /100 | #186 | Fair 19.2% |
| Immigrants | Hong Kong | 28.3 /100 | #187 | Fair 19.2% |
| Immigrants | Kuwait | 26.1 /100 | #188 | Fair 19.1% |
| Indians (Asian) | 26.0 /100 | #189 | Fair 19.1% |
| Immigrants | Zimbabwe | 25.5 /100 | #190 | Fair 19.1% |
| South American Indians | 25.4 /100 | #191 | Fair 19.1% |
| Kenyans | 24.7 /100 | #192 | Fair 19.1% |
| Tsimshian | 24.4 /100 | #193 | Fair 19.1% |
| Serbians | 24.0 /100 | #194 | Fair 19.1% |
| Immigrants | Moldova | 23.6 /100 | #195 | Fair 19.1% |
| Central American Indians | 22.2 /100 | #196 | Fair 19.0% |
| Immigrants | Japan | 22.0 /100 | #197 | Fair 19.0% |
| Egyptians | 19.5 /100 | #198 | Poor 19.0% |