Swiss vs Sioux 3 or more Vehicles in Household
COMPARE
Swiss
Sioux
3 or more Vehicles in Household
3 or more Vehicles in Household Comparison
Swiss
Sioux
23.0%
3 OR MORE VEHICLES IN HOUSEHOLD
100.0/ 100
METRIC RATING
34th/ 347
METRIC RANK
22.6%
3 OR MORE VEHICLES IN HOUSEHOLD
100.0/ 100
METRIC RATING
50th/ 347
METRIC RANK
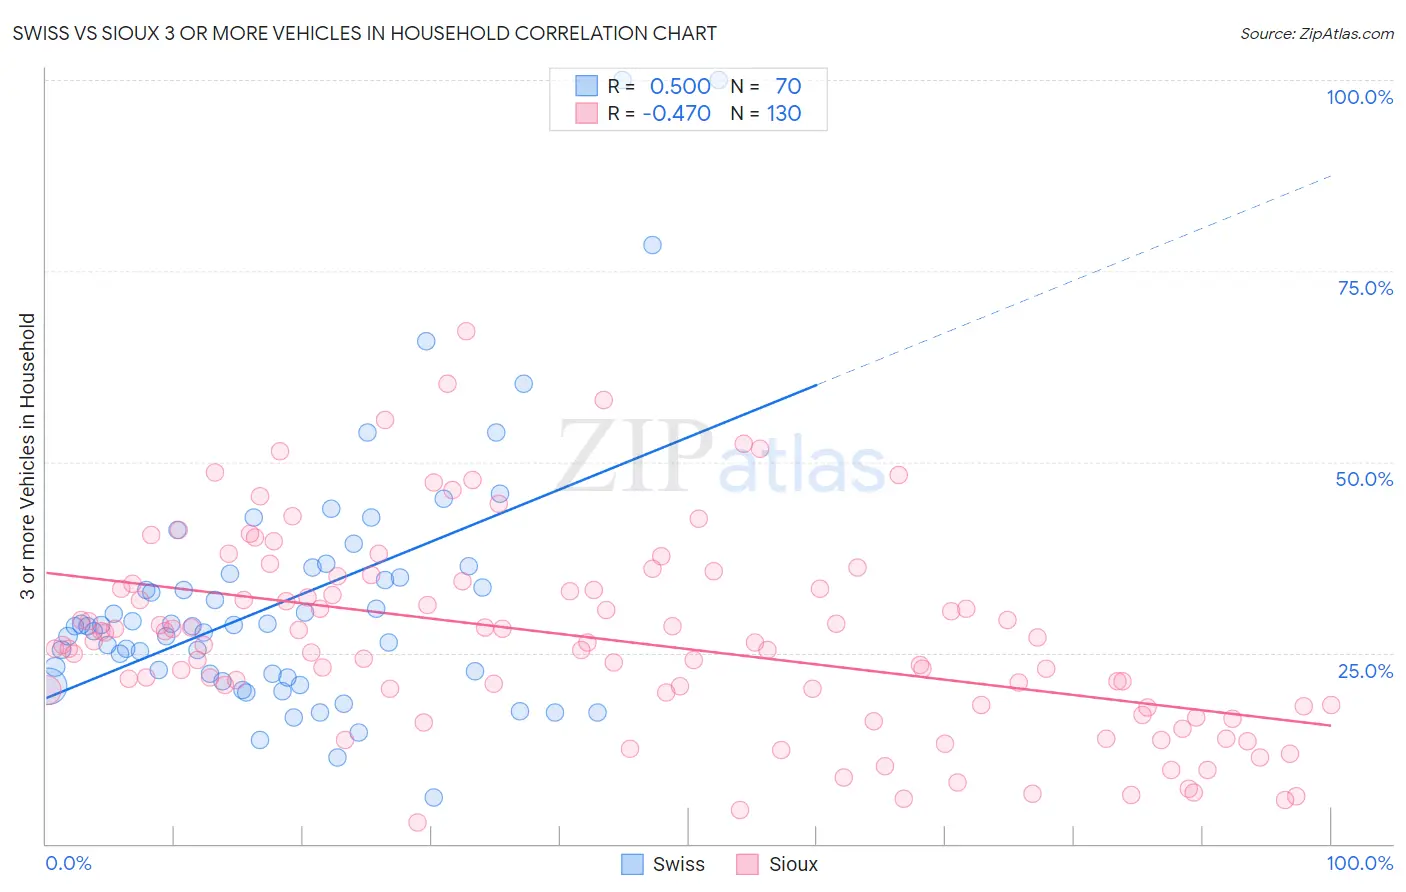
Swiss vs Sioux 3 or more Vehicles in Household Correlation Chart
The statistical analysis conducted on geographies consisting of 464,647,007 people shows a moderate positive correlation between the proportion of Swiss and percentage of households with 3 or more vehicles available in the United States with a correlation coefficient (R) of 0.500 and weighted average of 23.0%. Similarly, the statistical analysis conducted on geographies consisting of 234,089,228 people shows a moderate negative correlation between the proportion of Sioux and percentage of households with 3 or more vehicles available in the United States with a correlation coefficient (R) of -0.470 and weighted average of 22.6%, a difference of 1.9%.
3 or more Vehicles in Household Correlation Summary
| Measurement | Swiss | Sioux |
| Minimum | 6.1% | 2.8% |
| Maximum | 100.0% | 67.1% |
| Range | 93.9% | 64.3% |
| Mean | 31.9% | 26.9% |
| Median | 28.5% | 26.2% |
| Interquartile 25% (IQ1) | 22.3% | 18.1% |
| Interquartile 75% (IQ3) | 35.4% | 33.5% |
| Interquartile Range (IQR) | 13.1% | 15.3% |
| Standard Deviation (Sample) | 17.1% | 12.8% |
| Standard Deviation (Population) | 17.0% | 12.8% |
Demographics Similar to Swiss and Sioux by 3 or more Vehicles in Household
In terms of 3 or more vehicles in household, the demographic groups most similar to Swiss are Choctaw (23.0%, a difference of 0.020%), Spanish American (23.0%, a difference of 0.050%), Cherokee (23.0%, a difference of 0.060%), Swedish (23.0%, a difference of 0.080%), and Pueblo (23.0%, a difference of 0.11%). Similarly, the demographic groups most similar to Sioux are White/Caucasian (22.6%, a difference of 0.010%), Welsh (22.6%, a difference of 0.050%), Scotch-Irish (22.6%, a difference of 0.060%), Scottish (22.6%, a difference of 0.16%), and Malaysian (22.6%, a difference of 0.17%).
| Demographics | Rating | Rank | 3 or more Vehicles in Household |
| Pueblo | 100.0 /100 | #32 | Exceptional 23.0% |
| Spanish Americans | 100.0 /100 | #33 | Exceptional 23.0% |
| Swiss | 100.0 /100 | #34 | Exceptional 23.0% |
| Choctaw | 100.0 /100 | #35 | Exceptional 23.0% |
| Cherokee | 100.0 /100 | #36 | Exceptional 23.0% |
| Swedes | 100.0 /100 | #37 | Exceptional 23.0% |
| Dutch | 100.0 /100 | #38 | Exceptional 22.9% |
| Yaqui | 100.0 /100 | #39 | Exceptional 22.9% |
| Europeans | 100.0 /100 | #40 | Exceptional 22.9% |
| Germans | 100.0 /100 | #41 | Exceptional 22.7% |
| Natives/Alaskans | 100.0 /100 | #42 | Exceptional 22.7% |
| Osage | 100.0 /100 | #43 | Exceptional 22.7% |
| Cheyenne | 100.0 /100 | #44 | Exceptional 22.7% |
| Ute | 100.0 /100 | #45 | Exceptional 22.7% |
| Americans | 100.0 /100 | #46 | Exceptional 22.6% |
| Malaysians | 100.0 /100 | #47 | Exceptional 22.6% |
| Scottish | 100.0 /100 | #48 | Exceptional 22.6% |
| Scotch-Irish | 100.0 /100 | #49 | Exceptional 22.6% |
| Sioux | 100.0 /100 | #50 | Exceptional 22.6% |
| Whites/Caucasians | 100.0 /100 | #51 | Exceptional 22.6% |
| Welsh | 100.0 /100 | #52 | Exceptional 22.6% |