Swiss Disability
COMPARE
Swiss
Select to Compare
Disability
Swiss Disability
12.2%
DISABILITY
1.5/ 100
METRIC RATING
246th/ 347
METRIC RANK
Swiss Disability Correlation Chart
The statistical analysis conducted on geographies consisting of 464,998,318 people shows no correlation between the proportion of Swiss and percentage of population with a disability in the United States with a correlation coefficient (R) of -0.003 and weighted average of 12.2%. On average, for every 1% (one percent) increase in Swiss within a typical geography, there is a decrease of 0.0014% in percentage of population with a disability.
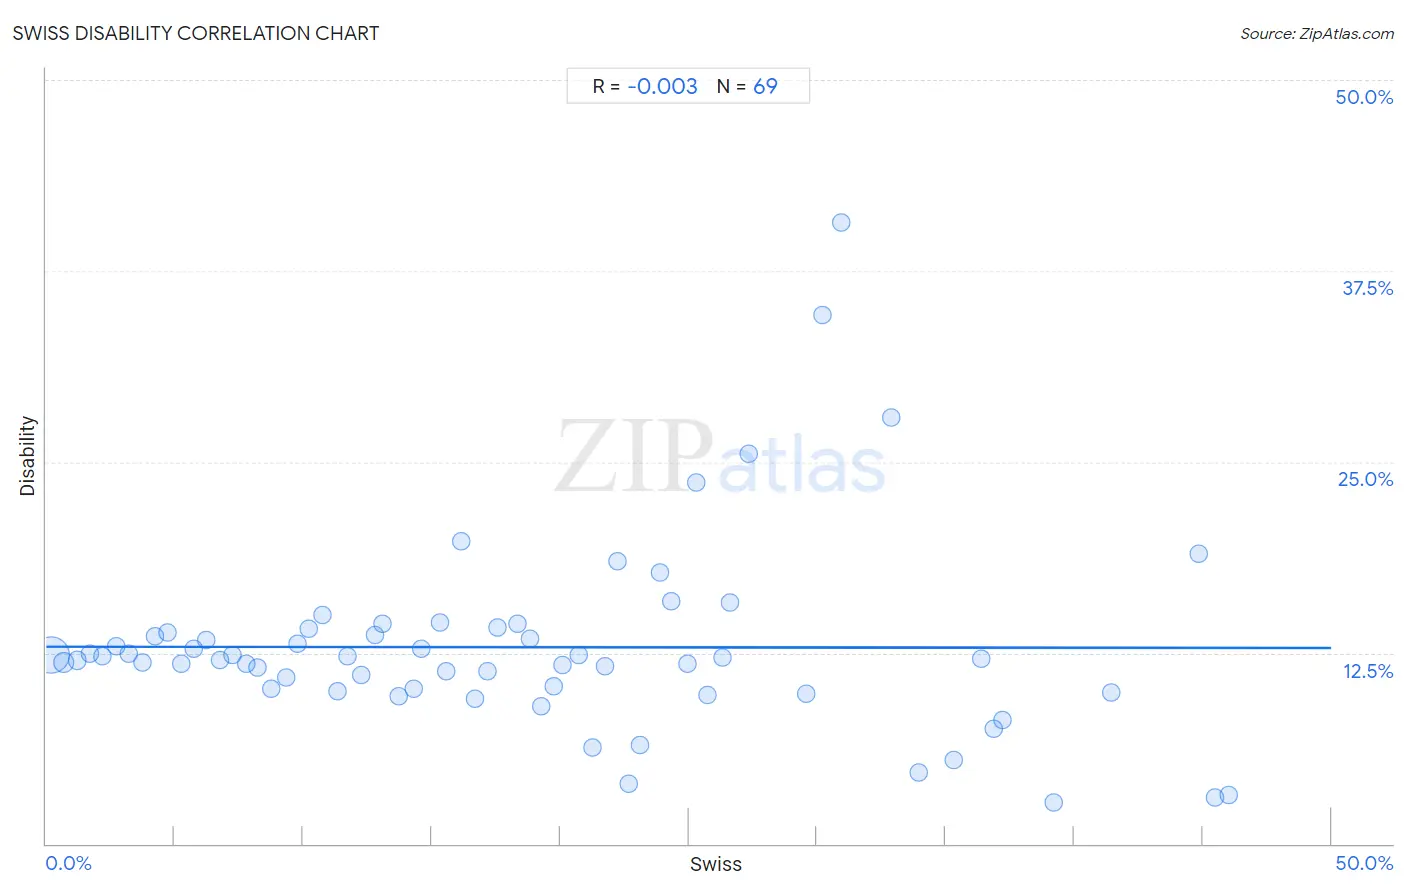
It is essential to understand that the correlation between the percentage of Swiss and percentage of population with a disability does not imply a direct cause-and-effect relationship. It remains uncertain whether the presence of Swiss influences an upward or downward trend in the level of percentage of population with a disability within an area, or if Swiss simply ended up residing in those areas with higher or lower levels of percentage of population with a disability due to other factors.
Demographics Similar to Swiss by Disability
In terms of disability, the demographic groups most similar to Swiss are Liberian (12.2%, a difference of 0.030%), Indonesian (12.2%, a difference of 0.030%), British (12.2%, a difference of 0.040%), Basque (12.2%, a difference of 0.040%), and Guamanian/Chamorro (12.3%, a difference of 0.070%).
| Demographics | Rating | Rank | Disability |
| Swedes | 1.8 /100 | #239 | Tragic 12.2% |
| Hungarians | 1.7 /100 | #240 | Tragic 12.2% |
| Yugoslavians | 1.7 /100 | #241 | Tragic 12.2% |
| Poles | 1.7 /100 | #242 | Tragic 12.2% |
| British | 1.5 /100 | #243 | Tragic 12.2% |
| Basques | 1.5 /100 | #244 | Tragic 12.2% |
| Liberians | 1.5 /100 | #245 | Tragic 12.2% |
| Swiss | 1.5 /100 | #246 | Tragic 12.2% |
| Indonesians | 1.4 /100 | #247 | Tragic 12.2% |
| Guamanians/Chamorros | 1.4 /100 | #248 | Tragic 12.3% |
| Carpatho Rusyns | 1.4 /100 | #249 | Tragic 12.3% |
| Sub-Saharan Africans | 1.4 /100 | #250 | Tragic 12.3% |
| Europeans | 1.4 /100 | #251 | Tragic 12.3% |
| Bermudans | 1.1 /100 | #252 | Tragic 12.3% |
| Belgians | 0.8 /100 | #253 | Tragic 12.3% |
Swiss Disability Correlation Summary
| Measurement | Swiss Data | Disability Data |
| Minimum | 0.18% | 2.7% |
| Maximum | 46.0% | 40.6% |
| Range | 45.9% | 37.9% |
| Mean | 18.5% | 12.9% |
| Median | 17.2% | 12.1% |
| Interquartile 25% (IQ1) | 8.5% | 10.0% |
| Interquartile 75% (IQ3) | 26.0% | 13.9% |
| Interquartile Range (IQR) | 17.5% | 3.9% |
| Standard Deviation (Sample) | 12.1% | 6.3% |
| Standard Deviation (Population) | 12.0% | 6.2% |
Correlation Details
| Swiss Percentile | Sample Size | Disability |
[ 0.0% - 0.5% ] 0.18% | 393,188,275 | 12.4% |
[ 0.5% - 1.0% ] 0.68% | 51,877,063 | 11.9% |
[ 1.0% - 1.5% ] 1.21% | 10,722,888 | 12.0% |
[ 1.5% - 2.0% ] 1.70% | 3,746,774 | 12.5% |
[ 2.0% - 2.5% ] 2.20% | 1,690,988 | 12.2% |
[ 2.5% - 3.0% ] 2.72% | 1,150,040 | 12.9% |
[ 3.0% - 3.5% ] 3.20% | 673,137 | 12.4% |
[ 3.5% - 4.0% ] 3.73% | 433,678 | 11.9% |
[ 4.0% - 4.5% ] 4.24% | 246,835 | 13.6% |
[ 4.5% - 5.0% ] 4.74% | 209,813 | 13.8% |
[ 5.0% - 5.5% ] 5.25% | 135,768 | 11.8% |
[ 5.5% - 6.0% ] 5.73% | 191,054 | 12.8% |
[ 6.0% - 6.5% ] 6.20% | 131,409 | 13.3% |
[ 6.5% - 7.0% ] 6.74% | 63,207 | 12.0% |
[ 7.0% - 7.5% ] 7.26% | 113,448 | 12.4% |
[ 7.5% - 8.0% ] 7.80% | 30,810 | 11.8% |
[ 8.0% - 8.5% ] 8.22% | 37,108 | 11.5% |
[ 8.5% - 9.0% ] 8.74% | 36,249 | 10.1% |
[ 9.0% - 9.5% ] 9.34% | 44,888 | 10.9% |
[ 9.5% - 10.0% ] 9.76% | 25,290 | 13.1% |
[ 10.0% - 10.5% ] 10.23% | 9,161 | 14.1% |
[ 10.5% - 11.0% ] 10.73% | 39,413 | 14.9% |
[ 11.0% - 11.5% ] 11.35% | 30,243 | 10.0% |
[ 11.5% - 12.0% ] 11.72% | 8,266 | 12.2% |
[ 12.0% - 12.5% ] 12.27% | 12,138 | 11.0% |
[ 12.5% - 13.0% ] 12.79% | 10,129 | 13.7% |
[ 13.0% - 13.5% ] 13.10% | 8,728 | 14.4% |
[ 13.5% - 14.0% ] 13.73% | 11,707 | 9.7% |
[ 14.0% - 14.5% ] 14.29% | 7,007 | 10.2% |
[ 14.5% - 15.0% ] 14.62% | 8,929 | 12.8% |
[ 15.0% - 15.5% ] 15.31% | 9,777 | 14.5% |
[ 15.5% - 16.0% ] 15.57% | 4,786 | 11.3% |
[ 16.0% - 16.5% ] 16.17% | 2,047 | 19.8% |
[ 16.5% - 17.0% ] 16.67% | 8,894 | 9.5% |
[ 17.0% - 17.5% ] 17.18% | 1,205 | 11.3% |
[ 17.5% - 18.0% ] 17.58% | 3,482 | 14.1% |
[ 18.0% - 18.5% ] 18.35% | 13,278 | 14.4% |
[ 18.5% - 19.0% ] 18.82% | 15,482 | 13.5% |
[ 19.0% - 19.5% ] 19.26% | 2,965 | 9.0% |
[ 19.5% - 20.0% ] 19.73% | 12,549 | 10.3% |
[ 20.0% - 20.5% ] 20.11% | 5,072 | 11.7% |
[ 20.5% - 21.0% ] 20.74% | 2,430 | 12.4% |
[ 21.0% - 21.5% ] 21.28% | 860 | 6.3% |
[ 21.5% - 22.0% ] 21.76% | 3,438 | 11.6% |
[ 22.0% - 22.5% ] 22.22% | 513 | 18.5% |
[ 22.5% - 23.0% ] 22.66% | 128 | 3.9% |
[ 23.0% - 23.5% ] 23.12% | 1,553 | 6.5% |
[ 23.5% - 24.0% ] 23.90% | 3,075 | 17.7% |
[ 24.0% - 24.5% ] 24.30% | 461 | 15.8% |
[ 24.5% - 25.0% ] 24.94% | 425 | 11.8% |
[ 25.0% - 25.5% ] 25.29% | 601 | 23.6% |
[ 25.5% - 26.0% ] 25.73% | 2,274 | 9.8% |
[ 26.0% - 26.5% ] 26.33% | 1,409 | 12.2% |
[ 26.5% - 27.0% ] 26.62% | 1,221 | 15.8% |
[ 27.0% - 27.5% ] 27.31% | 227 | 25.6% |
[ 29.5% - 30.0% ] 29.58% | 142 | 9.9% |
[ 30.0% - 30.5% ] 30.19% | 361 | 34.6% |
[ 30.5% - 31.0% ] 30.94% | 278 | 40.6% |
[ 32.5% - 33.0% ] 32.88% | 222 | 27.9% |
[ 33.5% - 34.0% ] 33.95% | 1,302 | 4.6% |
[ 35.0% - 35.5% ] 35.32% | 201 | 5.5% |
[ 36.0% - 36.5% ] 36.36% | 33 | 12.1% |
[ 36.5% - 37.0% ] 36.87% | 651 | 7.5% |
[ 37.0% - 37.5% ] 37.20% | 2,016 | 8.1% |
[ 39.0% - 39.5% ] 39.19% | 148 | 2.7% |
[ 41.0% - 41.5% ] 41.45% | 152 | 9.9% |
[ 44.5% - 45.0% ] 44.83% | 58 | 19.0% |
[ 45.0% - 45.5% ] 45.45% | 33 | 3.0% |
[ 46.0% - 46.5% ] 46.03% | 126 | 3.2% |