Swiss Disability Age Under 5
COMPARE
Swiss
Select to Compare
Disability Age Under 5
Swiss Disability Age Under 5
1.6%
DISABILITY | AGE UNDER 5
0.0/ 100
METRIC RATING
303rd/ 347
METRIC RANK
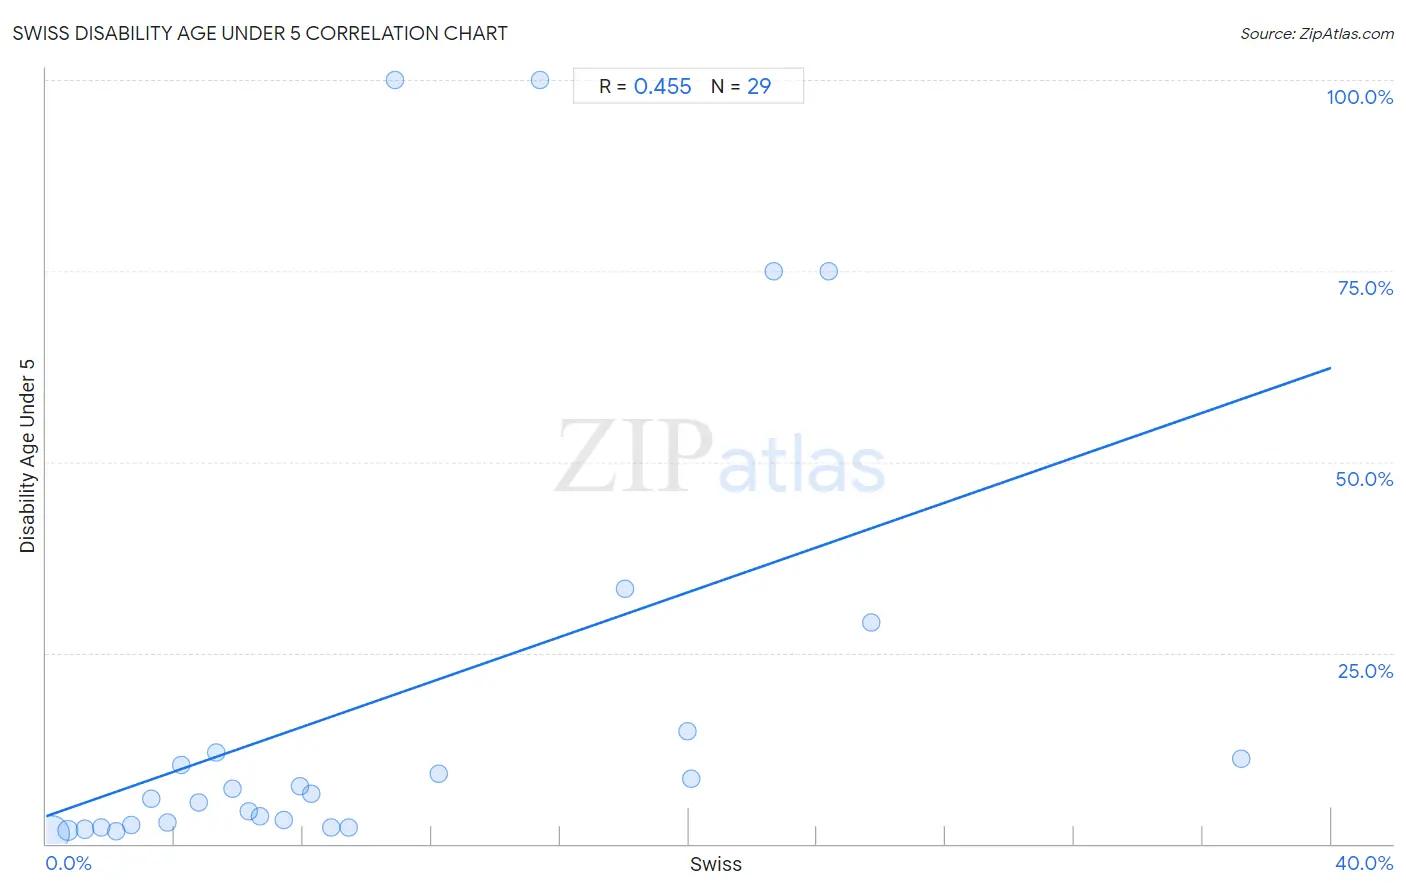
Swiss Disability Age Under 5 Correlation Chart
The statistical analysis conducted on geographies consisting of 231,156,469 people shows a moderate positive correlation between the proportion of Swiss and percentage of population with a disability under the age of 5 in the United States with a correlation coefficient (R) of 0.455 and weighted average of 1.6%. On average, for every 1% (one percent) increase in Swiss within a typical geography, there is an increase of 1.5% in percentage of population with a disability under the age of 5.
It is essential to understand that the correlation between the percentage of Swiss and percentage of population with a disability under the age of 5 does not imply a direct cause-and-effect relationship. It remains uncertain whether the presence of Swiss influences an upward or downward trend in the level of percentage of population with a disability under the age of 5 within an area, or if Swiss simply ended up residing in those areas with higher or lower levels of percentage of population with a disability under the age of 5 due to other factors.
Demographics Similar to Swiss by Disability Age Under 5
In terms of disability age under 5, the demographic groups most similar to Swiss are Welsh (1.6%, a difference of 0.16%), German Russian (1.6%, a difference of 0.27%), Seminole (1.6%, a difference of 0.63%), Shoshone (1.6%, a difference of 0.72%), and Blackfeet (1.6%, a difference of 0.79%).
| Demographics | Rating | Rank | Disability Age Under 5 |
| Poles | 0.0 /100 | #296 | Tragic 1.6% |
| Nonimmigrants | 0.0 /100 | #297 | Tragic 1.6% |
| Cajuns | 0.0 /100 | #298 | Tragic 1.6% |
| Portuguese | 0.0 /100 | #299 | Tragic 1.6% |
| Shoshone | 0.0 /100 | #300 | Tragic 1.6% |
| German Russians | 0.0 /100 | #301 | Tragic 1.6% |
| Welsh | 0.0 /100 | #302 | Tragic 1.6% |
| Swiss | 0.0 /100 | #303 | Tragic 1.6% |
| Seminole | 0.0 /100 | #304 | Tragic 1.6% |
| Blackfeet | 0.0 /100 | #305 | Tragic 1.6% |
| Creek | 0.0 /100 | #306 | Tragic 1.6% |
| Scottish | 0.0 /100 | #307 | Tragic 1.6% |
| Navajo | 0.0 /100 | #308 | Tragic 1.6% |
| Cape Verdeans | 0.0 /100 | #309 | Tragic 1.7% |
| Whites/Caucasians | 0.0 /100 | #310 | Tragic 1.7% |
Swiss Disability Age Under 5 Correlation Summary
| Measurement | Swiss Data | Disability Age Under 5 Data |
| Minimum | 0.17% | 1.3% |
| Maximum | 37.2% | 100.0% |
| Range | 37.0% | 98.7% |
| Mean | 10.2% | 18.6% |
| Median | 7.4% | 6.6% |
| Interquartile 25% (IQ1) | 3.5% | 2.4% |
| Interquartile 75% (IQ3) | 16.7% | 13.4% |
| Interquartile Range (IQR) | 13.2% | 11.0% |
| Standard Deviation (Sample) | 9.1% | 29.4% |
| Standard Deviation (Population) | 8.9% | 28.9% |
Correlation Details
| Swiss Percentile | Sample Size | Disability Age Under 5 |
[ 0.0% - 0.5% ] 0.17% | 207,472,975 | 1.3% |
[ 0.5% - 1.0% ] 0.67% | 18,870,873 | 1.7% |
[ 1.0% - 1.5% ] 1.20% | 2,969,778 | 1.9% |
[ 1.5% - 2.0% ] 1.70% | 860,070 | 2.2% |
[ 2.0% - 2.5% ] 2.17% | 469,202 | 1.7% |
[ 2.5% - 3.0% ] 2.64% | 202,771 | 2.5% |
[ 3.0% - 3.5% ] 3.28% | 67,273 | 5.9% |
[ 3.5% - 4.0% ] 3.77% | 45,108 | 2.8% |
[ 4.0% - 4.5% ] 4.19% | 35,370 | 10.3% |
[ 4.5% - 5.0% ] 4.76% | 35,245 | 5.4% |
[ 5.0% - 5.5% ] 5.30% | 11,098 | 11.9% |
[ 5.5% - 6.0% ] 5.79% | 9,720 | 7.3% |
[ 6.0% - 6.5% ] 6.29% | 9,491 | 4.3% |
[ 6.5% - 7.0% ] 6.66% | 18,509 | 3.7% |
[ 7.0% - 7.5% ] 7.37% | 26,564 | 3.2% |
[ 7.5% - 8.0% ] 7.90% | 7,481 | 7.5% |
[ 8.0% - 8.5% ] 8.26% | 7,348 | 6.6% |
[ 8.5% - 9.0% ] 8.87% | 4,138 | 2.1% |
[ 9.0% - 9.5% ] 9.43% | 22,506 | 2.1% |
[ 10.5% - 11.0% ] 10.86% | 405 | 100.0% |
[ 12.0% - 12.5% ] 12.21% | 893 | 9.1% |
[ 15.0% - 15.5% ] 15.38% | 26 | 100.0% |
[ 18.0% - 18.5% ] 18.02% | 111 | 33.3% |
[ 19.5% - 20.0% ] 19.96% | 2,360 | 14.8% |
[ 20.0% - 20.5% ] 20.07% | 4,151 | 8.5% |
[ 22.5% - 23.0% ] 22.66% | 128 | 75.0% |
[ 24.0% - 24.5% ] 24.37% | 119 | 75.0% |
[ 25.5% - 26.0% ] 25.68% | 740 | 29.0% |
[ 37.0% - 37.5% ] 37.20% | 2,016 | 11.1% |