Swiss GED/Equivalency
COMPARE
Swiss
Select to Compare
GED/Equivalency
Swiss GED/Equivalency
87.0%
GED/EQUIVALENCY
94.5/ 100
METRIC RATING
116th/ 347
METRIC RANK
Swiss GED/Equivalency Correlation Chart
The statistical analysis conducted on geographies consisting of 465,022,572 people shows a poor positive correlation between the proportion of Swiss and percentage of population with at least ged/equivalency education in the United States with a correlation coefficient (R) of 0.107 and weighted average of 87.0%. On average, for every 1% (one percent) increase in Swiss within a typical geography, there is an increase of 0.092% in percentage of population with at least ged/equivalency education.
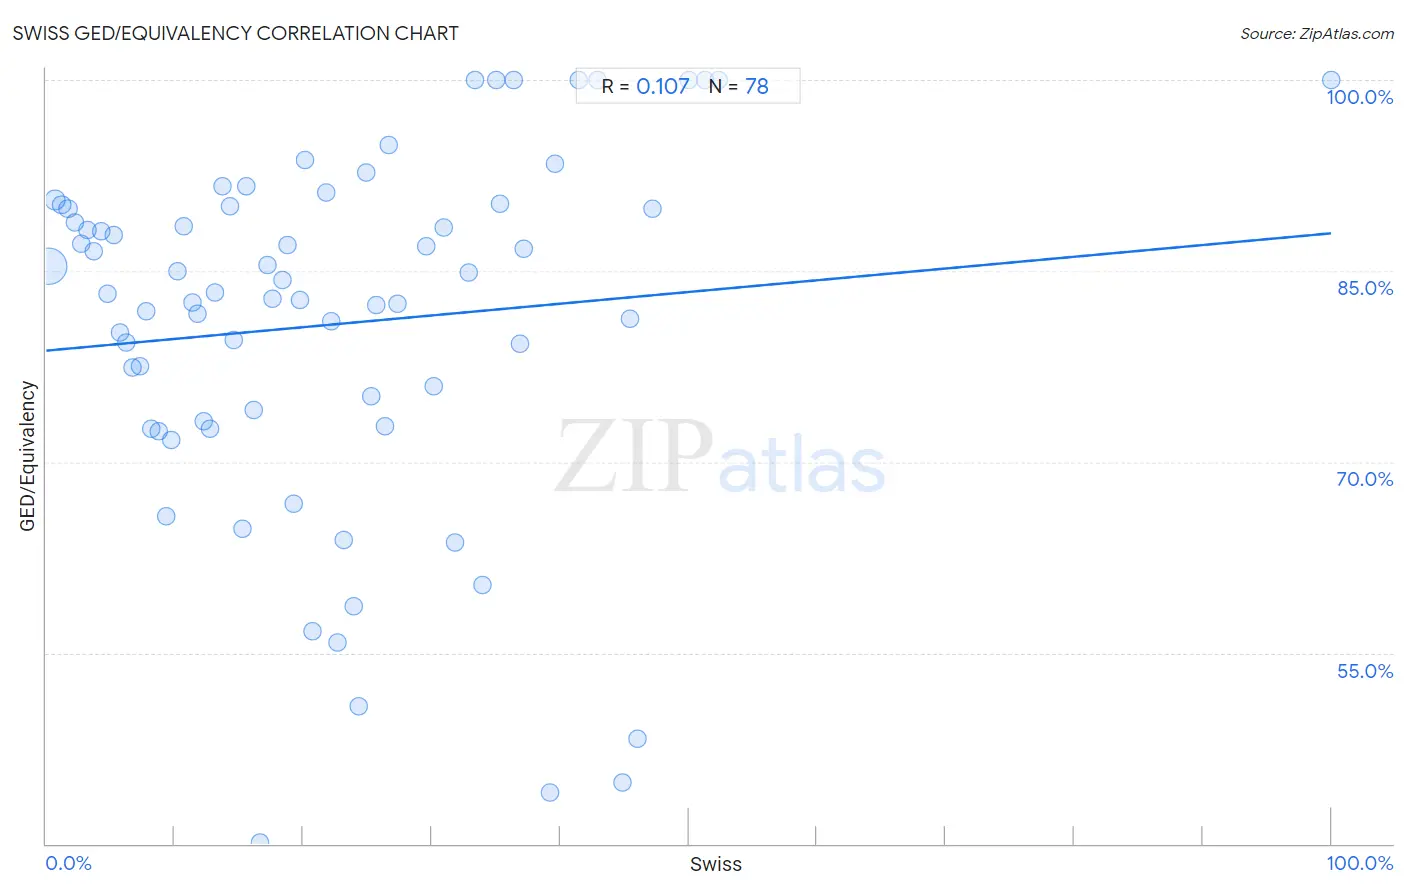
It is essential to understand that the correlation between the percentage of Swiss and percentage of population with at least ged/equivalency education does not imply a direct cause-and-effect relationship. It remains uncertain whether the presence of Swiss influences an upward or downward trend in the level of percentage of population with at least ged/equivalency education within an area, or if Swiss simply ended up residing in those areas with higher or lower levels of percentage of population with at least ged/equivalency education due to other factors.
Demographics Similar to Swiss by GED/Equivalency
In terms of ged/equivalency, the demographic groups most similar to Swiss are Mongolian (87.0%, a difference of 0.010%), Immigrants from Kazakhstan (87.0%, a difference of 0.020%), Tlingit-Haida (87.0%, a difference of 0.030%), Assyrian/Chaldean/Syriac (87.0%, a difference of 0.030%), and French (87.1%, a difference of 0.070%).
| Demographics | Rating | Rank | GED/Equivalency |
| Immigrants from Eastern Europe | 95.5 /100 | #109 | Exceptional 87.1% |
| Egyptians | 95.3 /100 | #110 | Exceptional 87.1% |
| French | 95.2 /100 | #111 | Exceptional 87.1% |
| Tlingit-Haida | 94.8 /100 | #112 | Exceptional 87.0% |
| Assyrians/Chaldeans/Syriacs | 94.8 /100 | #113 | Exceptional 87.0% |
| Immigrants from Kazakhstan | 94.7 /100 | #114 | Exceptional 87.0% |
| Mongolians | 94.6 /100 | #115 | Exceptional 87.0% |
| Swiss | 94.5 /100 | #116 | Exceptional 87.0% |
| Immigrants from Hong Kong | 93.8 /100 | #117 | Exceptional 86.9% |
| French Canadians | 93.2 /100 | #118 | Exceptional 86.9% |
| Immigrants from China | 93.2 /100 | #119 | Exceptional 86.9% |
| Scotch-Irish | 91.6 /100 | #120 | Exceptional 86.8% |
| Immigrants from Lebanon | 90.9 /100 | #121 | Exceptional 86.8% |
| Immigrants from Jordan | 90.8 /100 | #122 | Exceptional 86.8% |
| Immigrants from Italy | 90.5 /100 | #123 | Exceptional 86.7% |
Swiss GED/Equivalency Correlation Summary
| Measurement | Swiss Data | GED/Equivalency Data |
| Minimum | 0.18% | 40.1% |
| Maximum | 100.0% | 100.0% |
| Range | 99.8% | 59.9% |
| Mean | 22.3% | 80.8% |
| Median | 19.5% | 83.3% |
| Interquartile 25% (IQ1) | 9.8% | 73.2% |
| Interquartile 75% (IQ3) | 32.9% | 90.1% |
| Interquartile Range (IQR) | 23.1% | 16.9% |
| Standard Deviation (Sample) | 16.6% | 14.3% |
| Standard Deviation (Population) | 16.5% | 14.2% |
Correlation Details
| Swiss Percentile | Sample Size | GED/Equivalency |
[ 0.0% - 0.5% ] 0.18% | 393,208,941 | 85.3% |
[ 0.5% - 1.0% ] 0.68% | 51,870,348 | 90.6% |
[ 1.0% - 1.5% ] 1.21% | 10,725,479 | 90.2% |
[ 1.5% - 2.0% ] 1.70% | 3,745,245 | 89.9% |
[ 2.0% - 2.5% ] 2.20% | 1,693,286 | 88.8% |
[ 2.5% - 3.0% ] 2.72% | 1,150,840 | 87.1% |
[ 3.0% - 3.5% ] 3.20% | 673,458 | 88.2% |
[ 3.5% - 4.0% ] 3.73% | 433,678 | 86.6% |
[ 4.0% - 4.5% ] 4.24% | 247,585 | 88.2% |
[ 4.5% - 5.0% ] 4.74% | 209,936 | 83.2% |
[ 5.0% - 5.5% ] 5.25% | 135,768 | 87.8% |
[ 5.5% - 6.0% ] 5.73% | 191,054 | 80.2% |
[ 6.0% - 6.5% ] 6.20% | 131,440 | 79.4% |
[ 6.5% - 7.0% ] 6.74% | 63,207 | 77.4% |
[ 7.0% - 7.5% ] 7.26% | 113,448 | 77.5% |
[ 7.5% - 8.0% ] 7.80% | 31,415 | 81.9% |
[ 8.0% - 8.5% ] 8.22% | 37,354 | 72.6% |
[ 8.5% - 9.0% ] 8.74% | 36,249 | 72.4% |
[ 9.0% - 9.5% ] 9.34% | 44,888 | 65.7% |
[ 9.5% - 10.0% ] 9.76% | 25,290 | 71.7% |
[ 10.0% - 10.5% ] 10.23% | 9,161 | 85.0% |
[ 10.5% - 11.0% ] 10.73% | 39,413 | 88.5% |
[ 11.0% - 11.5% ] 11.35% | 30,678 | 82.6% |
[ 11.5% - 12.0% ] 11.72% | 8,514 | 81.6% |
[ 12.0% - 12.5% ] 12.27% | 12,387 | 73.2% |
[ 12.5% - 13.0% ] 12.78% | 10,247 | 72.6% |
[ 13.0% - 13.5% ] 13.10% | 8,899 | 83.3% |
[ 13.5% - 14.0% ] 13.73% | 11,773 | 91.7% |
[ 14.0% - 14.5% ] 14.28% | 7,345 | 90.1% |
[ 14.5% - 15.0% ] 14.62% | 9,236 | 79.5% |
[ 15.0% - 15.5% ] 15.31% | 9,777 | 64.7% |
[ 15.5% - 16.0% ] 15.57% | 4,786 | 91.7% |
[ 16.0% - 16.5% ] 16.14% | 2,850 | 74.1% |
[ 16.5% - 17.0% ] 16.67% | 8,894 | 40.1% |
[ 17.0% - 17.5% ] 17.18% | 1,205 | 85.4% |
[ 17.5% - 18.0% ] 17.58% | 3,482 | 82.8% |
[ 18.0% - 18.5% ] 18.35% | 13,278 | 84.3% |
[ 18.5% - 19.0% ] 18.82% | 15,653 | 87.0% |
[ 19.0% - 19.5% ] 19.26% | 2,965 | 66.7% |
[ 19.5% - 20.0% ] 19.73% | 12,856 | 82.7% |
[ 20.0% - 20.5% ] 20.11% | 5,072 | 93.7% |
[ 20.5% - 21.0% ] 20.74% | 2,430 | 56.7% |
[ 21.5% - 22.0% ] 21.75% | 3,489 | 91.1% |
[ 22.0% - 22.5% ] 22.22% | 513 | 81.0% |
[ 22.5% - 23.0% ] 22.66% | 128 | 55.8% |
[ 23.0% - 23.5% ] 23.12% | 1,553 | 63.9% |
[ 23.5% - 24.0% ] 23.90% | 3,151 | 58.6% |
[ 24.0% - 24.5% ] 24.30% | 461 | 50.8% |
[ 24.5% - 25.0% ] 24.94% | 425 | 92.8% |
[ 25.0% - 25.5% ] 25.29% | 601 | 75.1% |
[ 25.5% - 26.0% ] 25.73% | 2,274 | 82.4% |
[ 26.0% - 26.5% ] 26.32% | 1,531 | 72.8% |
[ 26.5% - 27.0% ] 26.64% | 1,310 | 94.9% |
[ 27.0% - 27.5% ] 27.31% | 227 | 82.4% |
[ 29.5% - 30.0% ] 29.55% | 247 | 87.0% |
[ 30.0% - 30.5% ] 30.19% | 361 | 75.9% |
[ 30.5% - 31.0% ] 30.94% | 278 | 88.4% |
[ 31.5% - 32.0% ] 31.82% | 44 | 63.6% |
[ 32.5% - 33.0% ] 32.88% | 222 | 84.9% |
[ 33.0% - 33.5% ] 33.33% | 279 | 100.0% |
[ 33.5% - 34.0% ] 33.95% | 1,302 | 60.4% |
[ 35.0% - 35.5% ] 35.00% | 40 | 100.0% |
[ 35.0% - 35.5% ] 35.32% | 201 | 90.2% |
[ 36.0% - 36.5% ] 36.36% | 33 | 100.0% |
[ 36.5% - 37.0% ] 36.87% | 651 | 79.3% |
[ 37.0% - 37.5% ] 37.20% | 2,016 | 86.7% |
[ 39.0% - 39.5% ] 39.19% | 148 | 44.0% |
[ 39.5% - 40.0% ] 39.60% | 404 | 93.5% |
[ 41.0% - 41.5% ] 41.45% | 152 | 100.0% |
[ 42.5% - 43.0% ] 42.86% | 56 | 100.0% |
[ 44.5% - 45.0% ] 44.83% | 58 | 44.8% |
[ 45.0% - 45.5% ] 45.45% | 33 | 81.2% |
[ 46.0% - 46.5% ] 46.03% | 126 | 48.2% |
[ 47.0% - 47.5% ] 47.19% | 320 | 89.9% |
[ 50.0% - 50.5% ] 50.00% | 16 | 100.0% |
[ 51.0% - 51.5% ] 51.28% | 78 | 100.0% |
[ 52.0% - 52.5% ] 52.38% | 21 | 100.0% |
[ 99.5% - 100.0% ] 100.00% | 13 | 100.0% |