Swiss Married-couple Households
COMPARE
Swiss
Select to Compare
Married-couple Households
Swiss Married-couple Households
49.9%
MARRIED-COUPLE HOUSEHOLDS
100.0/ 100
METRIC RATING
12th/ 347
METRIC RANK
Swiss Married-couple Households Correlation Chart
The statistical analysis conducted on geographies consisting of 464,742,560 people shows a mild positive correlation between the proportion of Swiss and percentage of married-couple family households in the United States with a correlation coefficient (R) of 0.392 and weighted average of 49.9%. On average, for every 1% (one percent) increase in Swiss within a typical geography, there is an increase of 0.43% in percentage of married-couple family households.
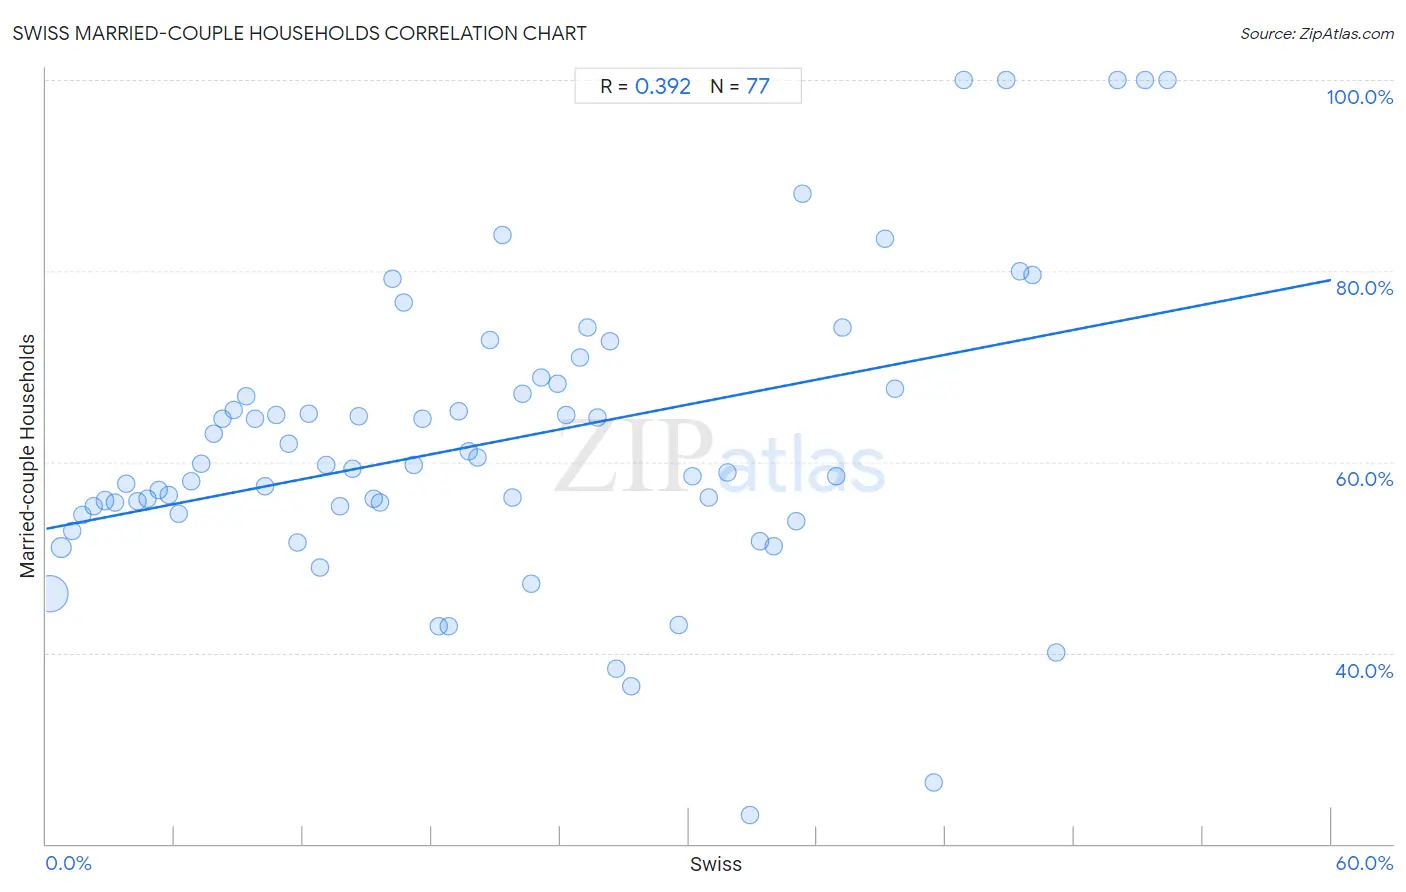
It is essential to understand that the correlation between the percentage of Swiss and percentage of married-couple family households does not imply a direct cause-and-effect relationship. It remains uncertain whether the presence of Swiss influences an upward or downward trend in the level of percentage of married-couple family households within an area, or if Swiss simply ended up residing in those areas with higher or lower levels of percentage of married-couple family households due to other factors.
Demographics Similar to Swiss by Married-couple Households
In terms of married-couple households, the demographic groups most similar to Swiss are Immigrants from Korea (49.9%, a difference of 0.17%), Burmese (49.8%, a difference of 0.30%), Immigrants from Pakistan (50.1%, a difference of 0.37%), Korean (49.7%, a difference of 0.44%), and Swedish (49.7%, a difference of 0.47%).
| Demographics | Rating | Rank | Married-couple Households |
| Tongans | 100.0 /100 | #5 | Exceptional 51.6% |
| Danes | 100.0 /100 | #6 | Exceptional 51.1% |
| Filipinos | 100.0 /100 | #7 | Exceptional 51.0% |
| Immigrants from South Central Asia | 100.0 /100 | #8 | Exceptional 50.6% |
| Pennsylvania Germans | 100.0 /100 | #9 | Exceptional 50.4% |
| Chinese | 100.0 /100 | #10 | Exceptional 50.4% |
| Immigrants from Pakistan | 100.0 /100 | #11 | Exceptional 50.1% |
| Swiss | 100.0 /100 | #12 | Exceptional 49.9% |
| Immigrants from Korea | 100.0 /100 | #13 | Exceptional 49.9% |
| Burmese | 100.0 /100 | #14 | Exceptional 49.8% |
| Koreans | 99.9 /100 | #15 | Exceptional 49.7% |
| Swedes | 99.9 /100 | #16 | Exceptional 49.7% |
| Immigrants from Hong Kong | 99.9 /100 | #17 | Exceptional 49.6% |
| English | 99.9 /100 | #18 | Exceptional 49.6% |
| Europeans | 99.9 /100 | #19 | Exceptional 49.6% |
Swiss Married-couple Households Correlation Summary
| Measurement | Swiss Data | Married-couple Households Data |
| Minimum | 0.18% | 23.0% |
| Maximum | 52.4% | 100.0% |
| Range | 52.2% | 77.0% |
| Mean | 21.1% | 62.1% |
| Median | 19.3% | 59.6% |
| Interquartile 25% (IQ1) | 9.6% | 55.0% |
| Interquartile 75% (IQ3) | 31.4% | 67.9% |
| Interquartile Range (IQR) | 21.8% | 12.9% |
| Standard Deviation (Sample) | 14.0% | 15.5% |
| Standard Deviation (Population) | 13.9% | 15.4% |
Correlation Details
| Swiss Percentile | Sample Size | Married-couple Households |
[ 0.0% - 0.5% ] 0.18% | 392,994,609 | 46.1% |
[ 0.5% - 1.0% ] 0.68% | 51,829,631 | 51.0% |
[ 1.0% - 1.5% ] 1.21% | 10,705,283 | 52.8% |
[ 1.5% - 2.0% ] 1.70% | 3,742,385 | 54.4% |
[ 2.0% - 2.5% ] 2.20% | 1,691,343 | 55.4% |
[ 2.5% - 3.0% ] 2.72% | 1,150,338 | 55.9% |
[ 3.0% - 3.5% ] 3.20% | 673,199 | 55.7% |
[ 3.5% - 4.0% ] 3.73% | 433,678 | 57.7% |
[ 4.0% - 4.5% ] 4.24% | 247,585 | 55.9% |
[ 4.5% - 5.0% ] 4.74% | 209,936 | 56.2% |
[ 5.0% - 5.5% ] 5.25% | 135,768 | 57.1% |
[ 5.5% - 6.0% ] 5.73% | 191,054 | 56.6% |
[ 6.0% - 6.5% ] 6.20% | 131,440 | 54.6% |
[ 6.5% - 7.0% ] 6.74% | 63,207 | 58.0% |
[ 7.0% - 7.5% ] 7.26% | 113,448 | 59.7% |
[ 7.5% - 8.0% ] 7.80% | 31,415 | 62.9% |
[ 8.0% - 8.5% ] 8.22% | 37,354 | 64.5% |
[ 8.5% - 9.0% ] 8.74% | 36,249 | 65.4% |
[ 9.0% - 9.5% ] 9.34% | 44,888 | 66.9% |
[ 9.5% - 10.0% ] 9.76% | 25,290 | 64.5% |
[ 10.0% - 10.5% ] 10.23% | 9,161 | 57.4% |
[ 10.5% - 11.0% ] 10.73% | 39,413 | 64.9% |
[ 11.0% - 11.5% ] 11.35% | 30,678 | 61.9% |
[ 11.5% - 12.0% ] 11.72% | 8,514 | 51.5% |
[ 12.0% - 12.5% ] 12.27% | 12,387 | 65.1% |
[ 12.5% - 13.0% ] 12.78% | 10,247 | 48.9% |
[ 13.0% - 13.5% ] 13.10% | 8,899 | 59.6% |
[ 13.5% - 14.0% ] 13.73% | 11,773 | 55.4% |
[ 14.0% - 14.5% ] 14.28% | 7,345 | 59.2% |
[ 14.5% - 15.0% ] 14.62% | 9,236 | 64.8% |
[ 15.0% - 15.5% ] 15.31% | 9,777 | 56.2% |
[ 15.5% - 16.0% ] 15.57% | 4,786 | 55.7% |
[ 16.0% - 16.5% ] 16.14% | 2,850 | 79.2% |
[ 16.5% - 17.0% ] 16.67% | 8,894 | 76.7% |
[ 17.0% - 17.5% ] 17.18% | 1,205 | 59.6% |
[ 17.5% - 18.0% ] 17.58% | 3,465 | 64.5% |
[ 18.0% - 18.5% ] 18.35% | 13,278 | 42.7% |
[ 18.5% - 19.0% ] 18.82% | 15,653 | 42.8% |
[ 19.0% - 19.5% ] 19.26% | 2,965 | 65.3% |
[ 19.5% - 20.0% ] 19.73% | 12,856 | 61.1% |
[ 20.0% - 20.5% ] 20.11% | 5,072 | 60.5% |
[ 20.5% - 21.0% ] 20.74% | 2,430 | 72.7% |
[ 21.0% - 21.5% ] 21.28% | 860 | 83.8% |
[ 21.5% - 22.0% ] 21.75% | 3,489 | 56.3% |
[ 22.0% - 22.5% ] 22.22% | 513 | 67.1% |
[ 22.5% - 23.0% ] 22.66% | 128 | 47.2% |
[ 23.0% - 23.5% ] 23.12% | 1,553 | 68.9% |
[ 23.5% - 24.0% ] 23.90% | 3,151 | 68.2% |
[ 24.0% - 24.5% ] 24.30% | 461 | 64.9% |
[ 24.5% - 25.0% ] 24.94% | 425 | 71.0% |
[ 25.0% - 25.5% ] 25.29% | 601 | 74.1% |
[ 25.5% - 26.0% ] 25.73% | 2,274 | 64.7% |
[ 26.0% - 26.5% ] 26.32% | 1,531 | 72.7% |
[ 26.5% - 27.0% ] 26.64% | 1,310 | 38.3% |
[ 27.0% - 27.5% ] 27.31% | 227 | 36.5% |
[ 29.5% - 30.0% ] 29.55% | 247 | 42.9% |
[ 30.0% - 30.5% ] 30.19% | 361 | 58.5% |
[ 30.5% - 31.0% ] 30.94% | 278 | 56.3% |
[ 31.5% - 32.0% ] 31.82% | 44 | 58.8% |
[ 32.5% - 33.0% ] 32.88% | 222 | 23.0% |
[ 33.0% - 33.5% ] 33.33% | 279 | 51.7% |
[ 33.5% - 34.0% ] 33.95% | 1,302 | 51.1% |
[ 35.0% - 35.5% ] 35.00% | 40 | 53.8% |
[ 35.0% - 35.5% ] 35.32% | 201 | 88.1% |
[ 36.5% - 37.0% ] 36.87% | 651 | 58.4% |
[ 37.0% - 37.5% ] 37.20% | 2,016 | 74.1% |
[ 39.0% - 39.5% ] 39.19% | 148 | 83.3% |
[ 39.5% - 40.0% ] 39.60% | 404 | 67.7% |
[ 41.0% - 41.5% ] 41.45% | 152 | 26.5% |
[ 42.5% - 43.0% ] 42.86% | 56 | 100.0% |
[ 44.5% - 45.0% ] 44.83% | 58 | 100.0% |
[ 45.0% - 45.5% ] 45.45% | 33 | 80.0% |
[ 46.0% - 46.5% ] 46.03% | 126 | 79.6% |
[ 47.0% - 47.5% ] 47.19% | 320 | 40.0% |
[ 50.0% - 50.5% ] 50.00% | 16 | 100.0% |
[ 51.0% - 51.5% ] 51.28% | 78 | 100.0% |
[ 52.0% - 52.5% ] 52.38% | 21 | 100.0% |