Swiss vs Honduran 3 or more Vehicles in Household
COMPARE
Swiss
Honduran
3 or more Vehicles in Household
3 or more Vehicles in Household Comparison
Swiss
Hondurans
23.0%
3 OR MORE VEHICLES IN HOUSEHOLD
100.0/ 100
METRIC RATING
34th/ 347
METRIC RANK
18.4%
3 OR MORE VEHICLES IN HOUSEHOLD
4.6/ 100
METRIC RATING
233rd/ 347
METRIC RANK
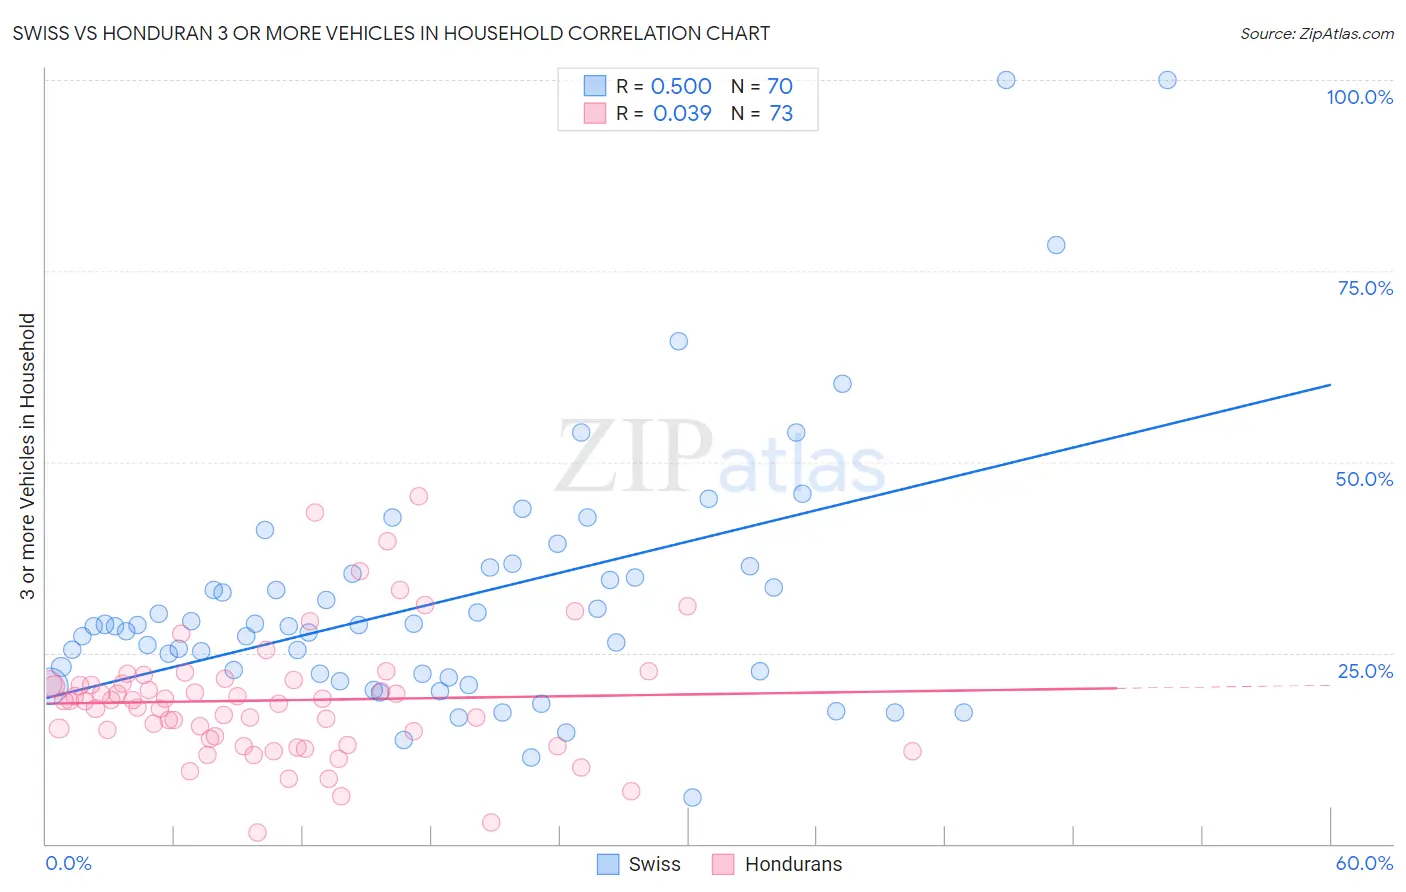
Swiss vs Honduran 3 or more Vehicles in Household Correlation Chart
The statistical analysis conducted on geographies consisting of 464,647,007 people shows a moderate positive correlation between the proportion of Swiss and percentage of households with 3 or more vehicles available in the United States with a correlation coefficient (R) of 0.500 and weighted average of 23.0%. Similarly, the statistical analysis conducted on geographies consisting of 357,545,810 people shows no correlation between the proportion of Hondurans and percentage of households with 3 or more vehicles available in the United States with a correlation coefficient (R) of 0.039 and weighted average of 18.4%, a difference of 25.1%.
3 or more Vehicles in Household Correlation Summary
| Measurement | Swiss | Honduran |
| Minimum | 6.1% | 1.4% |
| Maximum | 100.0% | 45.5% |
| Range | 93.9% | 44.0% |
| Mean | 31.9% | 18.8% |
| Median | 28.5% | 18.7% |
| Interquartile 25% (IQ1) | 22.3% | 13.3% |
| Interquartile 75% (IQ3) | 35.4% | 21.2% |
| Interquartile Range (IQR) | 13.1% | 7.9% |
| Standard Deviation (Sample) | 17.1% | 8.2% |
| Standard Deviation (Population) | 17.0% | 8.1% |
Similar Demographics by 3 or more Vehicles in Household
Demographics Similar to Swiss by 3 or more Vehicles in Household
In terms of 3 or more vehicles in household, the demographic groups most similar to Swiss are Choctaw (23.0%, a difference of 0.020%), Spanish American (23.0%, a difference of 0.050%), Cherokee (23.0%, a difference of 0.060%), Swedish (23.0%, a difference of 0.080%), and Pueblo (23.0%, a difference of 0.11%).
| Demographics | Rating | Rank | 3 or more Vehicles in Household |
| Guamanians/Chamorros | 100.0 /100 | #27 | Exceptional 23.2% |
| Lumbee | 100.0 /100 | #28 | Exceptional 23.1% |
| Spanish | 100.0 /100 | #29 | Exceptional 23.1% |
| Immigrants | South Eastern Asia | 100.0 /100 | #30 | Exceptional 23.1% |
| English | 100.0 /100 | #31 | Exceptional 23.1% |
| Pueblo | 100.0 /100 | #32 | Exceptional 23.0% |
| Spanish Americans | 100.0 /100 | #33 | Exceptional 23.0% |
| Swiss | 100.0 /100 | #34 | Exceptional 23.0% |
| Choctaw | 100.0 /100 | #35 | Exceptional 23.0% |
| Cherokee | 100.0 /100 | #36 | Exceptional 23.0% |
| Swedes | 100.0 /100 | #37 | Exceptional 23.0% |
| Dutch | 100.0 /100 | #38 | Exceptional 22.9% |
| Yaqui | 100.0 /100 | #39 | Exceptional 22.9% |
| Europeans | 100.0 /100 | #40 | Exceptional 22.9% |
| Germans | 100.0 /100 | #41 | Exceptional 22.7% |
Demographics Similar to Hondurans by 3 or more Vehicles in Household
In terms of 3 or more vehicles in household, the demographic groups most similar to Hondurans are Immigrants from Uganda (18.4%, a difference of 0.020%), Immigrants from North Macedonia (18.4%, a difference of 0.070%), Immigrants from Belgium (18.4%, a difference of 0.080%), Immigrants from Western Asia (18.4%, a difference of 0.11%), and Immigrants from Switzerland (18.4%, a difference of 0.16%).
| Demographics | Rating | Rank | 3 or more Vehicles in Household |
| Immigrants | Hungary | 5.5 /100 | #226 | Tragic 18.5% |
| Immigrants | Singapore | 5.4 /100 | #227 | Tragic 18.4% |
| Turks | 5.4 /100 | #228 | Tragic 18.4% |
| Immigrants | Switzerland | 5.0 /100 | #229 | Tragic 18.4% |
| Immigrants | Western Asia | 4.8 /100 | #230 | Tragic 18.4% |
| Immigrants | Belgium | 4.8 /100 | #231 | Tragic 18.4% |
| Immigrants | Uganda | 4.6 /100 | #232 | Tragic 18.4% |
| Hondurans | 4.6 /100 | #233 | Tragic 18.4% |
| Immigrants | North Macedonia | 4.4 /100 | #234 | Tragic 18.4% |
| Sierra Leoneans | 3.9 /100 | #235 | Tragic 18.3% |
| Immigrants | Malaysia | 3.6 /100 | #236 | Tragic 18.3% |
| Indonesians | 3.5 /100 | #237 | Tragic 18.3% |
| Immigrants | Honduras | 3.1 /100 | #238 | Tragic 18.2% |
| Immigrants | Middle Africa | 3.1 /100 | #239 | Tragic 18.2% |
| Immigrants | China | 2.9 /100 | #240 | Tragic 18.2% |