Swiss Disability Age 5 to 17
COMPARE
Swiss
Select to Compare
Disability Age 5 to 17
Swiss Disability Age 5 to 17
5.8%
DISABILITY | AGE 5 TO 17
5.1/ 100
METRIC RATING
227th/ 347
METRIC RANK
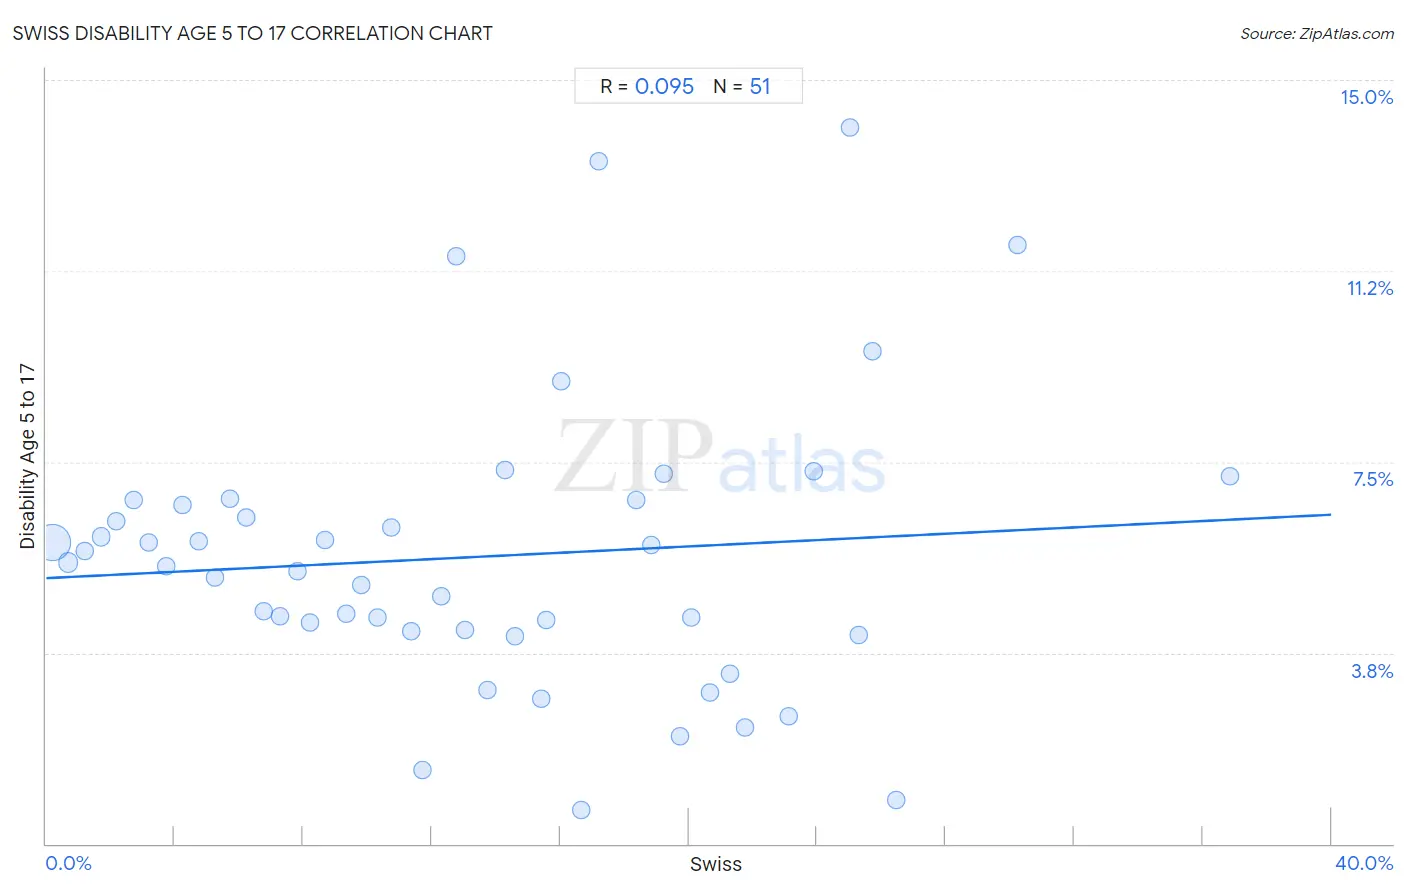
Swiss Disability Age 5 to 17 Correlation Chart
The statistical analysis conducted on geographies consisting of 458,460,312 people shows a slight positive correlation between the proportion of Swiss and percentage of population with a disability between the ages 5 and 17 in the United States with a correlation coefficient (R) of 0.095 and weighted average of 5.8%. On average, for every 1% (one percent) increase in Swiss within a typical geography, there is an increase of 0.031% in percentage of population with a disability between the ages 5 and 17.
It is essential to understand that the correlation between the percentage of Swiss and percentage of population with a disability between the ages 5 and 17 does not imply a direct cause-and-effect relationship. It remains uncertain whether the presence of Swiss influences an upward or downward trend in the level of percentage of population with a disability between the ages 5 and 17 within an area, or if Swiss simply ended up residing in those areas with higher or lower levels of percentage of population with a disability between the ages 5 and 17 due to other factors.
Demographics Similar to Swiss by Disability Age 5 to 17
In terms of disability age 5 to 17, the demographic groups most similar to Swiss are British West Indian (5.8%, a difference of 0.080%), Haitian (5.8%, a difference of 0.080%), Bangladeshi (5.8%, a difference of 0.090%), Ghanaian (5.8%, a difference of 0.10%), and Guamanian/Chamorro (5.8%, a difference of 0.12%).
| Demographics | Rating | Rank | Disability Age 5 to 17 |
| Belgians | 6.9 /100 | #220 | Tragic 5.8% |
| Lithuanians | 6.7 /100 | #221 | Tragic 5.8% |
| Immigrants from Sudan | 6.7 /100 | #222 | Tragic 5.8% |
| Alsatians | 6.0 /100 | #223 | Tragic 5.8% |
| Mexicans | 5.7 /100 | #224 | Tragic 5.8% |
| Guamanians/Chamorros | 5.6 /100 | #225 | Tragic 5.8% |
| British West Indians | 5.4 /100 | #226 | Tragic 5.8% |
| Swiss | 5.1 /100 | #227 | Tragic 5.8% |
| Haitians | 4.8 /100 | #228 | Tragic 5.8% |
| Bangladeshis | 4.8 /100 | #229 | Tragic 5.8% |
| Ghanaians | 4.7 /100 | #230 | Tragic 5.8% |
| Europeans | 4.5 /100 | #231 | Tragic 5.8% |
| Immigrants from Laos | 3.8 /100 | #232 | Tragic 5.8% |
| Immigrants from West Indies | 3.5 /100 | #233 | Tragic 5.8% |
| Immigrants from Kenya | 3.4 /100 | #234 | Tragic 5.8% |
Swiss Disability Age 5 to 17 Correlation Summary
| Measurement | Swiss Data | Disability Age 5 to 17 Data |
| Minimum | 0.18% | 0.66% |
| Maximum | 36.9% | 14.1% |
| Range | 36.7% | 13.4% |
| Mean | 13.4% | 5.6% |
| Median | 12.8% | 5.4% |
| Interquartile 25% (IQ1) | 6.2% | 4.2% |
| Interquartile 75% (IQ3) | 19.7% | 6.7% |
| Interquartile Range (IQR) | 13.5% | 2.6% |
| Standard Deviation (Sample) | 8.5% | 2.8% |
| Standard Deviation (Population) | 8.5% | 2.8% |
Correlation Details
| Swiss Percentile | Sample Size | Disability Age 5 to 17 |
[ 0.0% - 0.5% ] 0.18% | 389,535,462 | 5.9% |
[ 0.5% - 1.0% ] 0.68% | 50,371,454 | 5.5% |
[ 1.0% - 1.5% ] 1.21% | 10,226,031 | 5.7% |
[ 1.5% - 2.0% ] 1.70% | 3,446,795 | 6.0% |
[ 2.0% - 2.5% ] 2.20% | 1,518,571 | 6.3% |
[ 2.5% - 3.0% ] 2.72% | 1,023,894 | 6.8% |
[ 3.0% - 3.5% ] 3.20% | 611,960 | 5.9% |
[ 3.5% - 4.0% ] 3.73% | 394,214 | 5.4% |
[ 4.0% - 4.5% ] 4.24% | 229,989 | 6.6% |
[ 4.5% - 5.0% ] 4.74% | 196,297 | 5.9% |
[ 5.0% - 5.5% ] 5.25% | 125,719 | 5.2% |
[ 5.5% - 6.0% ] 5.72% | 170,691 | 6.8% |
[ 6.0% - 6.5% ] 6.21% | 119,495 | 6.4% |
[ 6.5% - 7.0% ] 6.75% | 51,893 | 4.6% |
[ 7.0% - 7.5% ] 7.26% | 93,284 | 4.5% |
[ 7.5% - 8.0% ] 7.81% | 28,814 | 5.3% |
[ 8.0% - 8.5% ] 8.21% | 33,968 | 4.4% |
[ 8.5% - 9.0% ] 8.69% | 22,636 | 6.0% |
[ 9.0% - 9.5% ] 9.35% | 38,151 | 4.5% |
[ 9.5% - 10.0% ] 9.80% | 19,874 | 5.1% |
[ 10.0% - 10.5% ] 10.30% | 4,448 | 4.5% |
[ 10.5% - 11.0% ] 10.72% | 37,238 | 6.2% |
[ 11.0% - 11.5% ] 11.35% | 28,357 | 4.2% |
[ 11.5% - 12.0% ] 11.72% | 8,046 | 1.4% |
[ 12.0% - 12.5% ] 12.28% | 10,573 | 4.9% |
[ 12.5% - 13.0% ] 12.78% | 8,521 | 11.5% |
[ 13.0% - 13.5% ] 13.02% | 4,002 | 4.2% |
[ 13.5% - 14.0% ] 13.73% | 10,782 | 3.0% |
[ 14.0% - 14.5% ] 14.29% | 2,141 | 7.3% |
[ 14.5% - 15.0% ] 14.60% | 8,390 | 4.1% |
[ 15.0% - 15.5% ] 15.40% | 6,092 | 2.9% |
[ 15.5% - 16.0% ] 15.57% | 4,786 | 4.4% |
[ 16.0% - 16.5% ] 16.02% | 768 | 9.1% |
[ 16.5% - 17.0% ] 16.67% | 8,627 | 0.66% |
[ 17.0% - 17.5% ] 17.18% | 1,100 | 13.4% |
[ 18.0% - 18.5% ] 18.37% | 11,605 | 6.7% |
[ 18.5% - 19.0% ] 18.82% | 15,037 | 5.9% |
[ 19.0% - 19.5% ] 19.24% | 2,287 | 7.3% |
[ 19.5% - 20.0% ] 19.73% | 12,488 | 2.1% |
[ 20.0% - 20.5% ] 20.07% | 4,151 | 4.4% |
[ 20.5% - 21.0% ] 20.68% | 1,001 | 3.0% |
[ 21.0% - 21.5% ] 21.28% | 860 | 3.3% |
[ 21.5% - 22.0% ] 21.74% | 2,654 | 2.3% |
[ 23.0% - 23.5% ] 23.12% | 1,514 | 2.5% |
[ 23.5% - 24.0% ] 23.91% | 2,154 | 7.3% |
[ 25.0% - 25.5% ] 25.00% | 320 | 14.1% |
[ 25.0% - 25.5% ] 25.29% | 601 | 4.1% |
[ 25.5% - 26.0% ] 25.72% | 1,182 | 9.7% |
[ 26.0% - 26.5% ] 26.45% | 605 | 0.87% |
[ 30.0% - 30.5% ] 30.22% | 139 | 11.8% |
[ 36.5% - 37.0% ] 36.87% | 651 | 7.2% |