Irish vs Immigrants from Costa Rica 3 or more Vehicles in Household
COMPARE
Irish
Immigrants from Costa Rica
3 or more Vehicles in Household
3 or more Vehicles in Household Comparison
Irish
Immigrants from Costa Rica
21.8%
3 OR MORE VEHICLES IN HOUSEHOLD
99.8/ 100
METRIC RATING
77th/ 347
METRIC RANK
19.7%
3 OR MORE VEHICLES IN HOUSEHOLD
61.9/ 100
METRIC RATING
165th/ 347
METRIC RANK
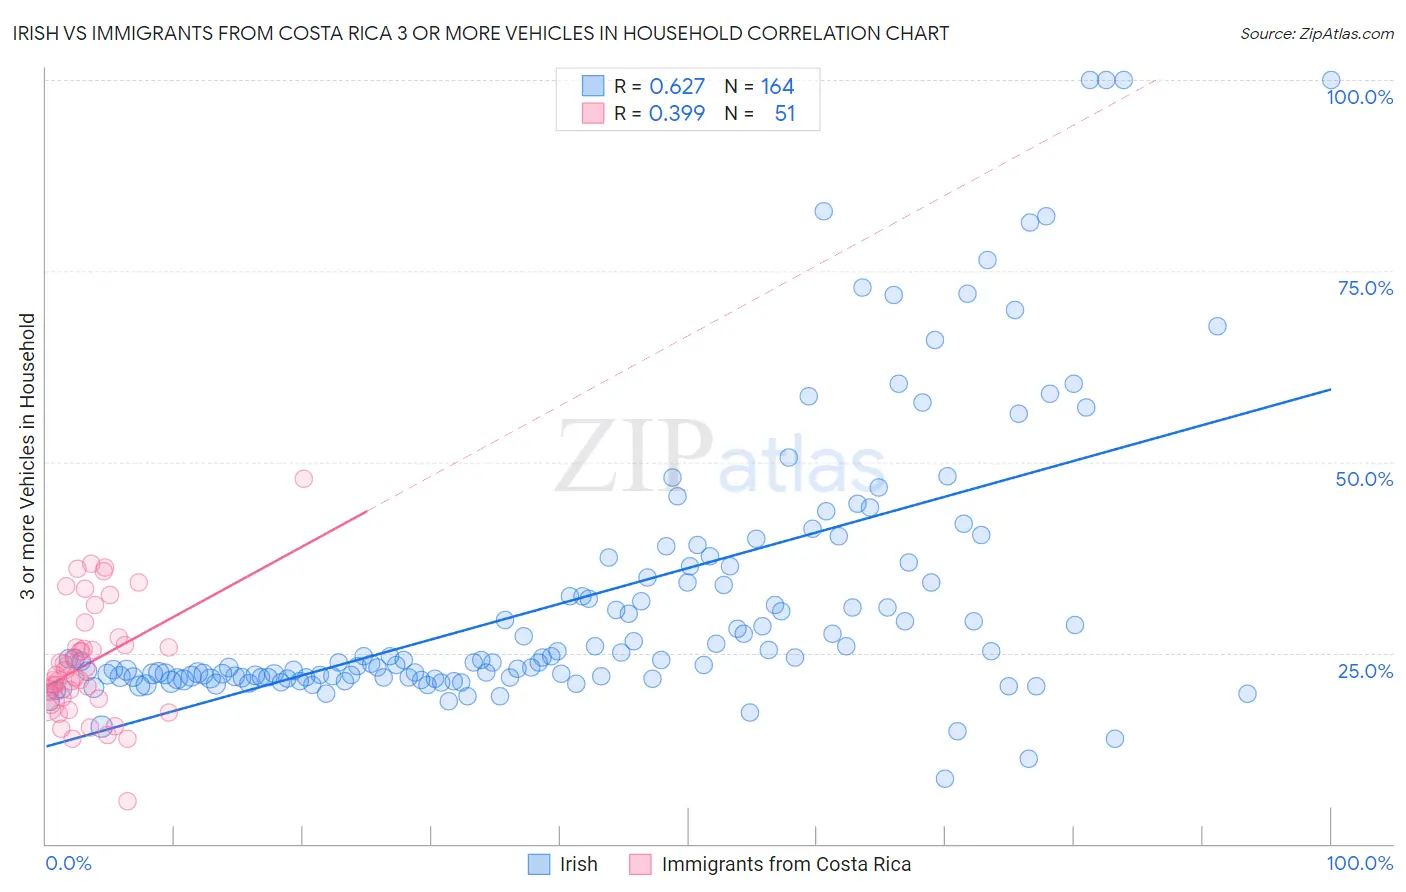
Irish vs Immigrants from Costa Rica 3 or more Vehicles in Household Correlation Chart
The statistical analysis conducted on geographies consisting of 579,597,686 people shows a significant positive correlation between the proportion of Irish and percentage of households with 3 or more vehicles available in the United States with a correlation coefficient (R) of 0.627 and weighted average of 21.8%. Similarly, the statistical analysis conducted on geographies consisting of 204,232,387 people shows a mild positive correlation between the proportion of Immigrants from Costa Rica and percentage of households with 3 or more vehicles available in the United States with a correlation coefficient (R) of 0.399 and weighted average of 19.7%, a difference of 10.5%.
3 or more Vehicles in Household Correlation Summary
| Measurement | Irish | Immigrants from Costa Rica |
| Minimum | 8.5% | 5.6% |
| Maximum | 100.0% | 47.8% |
| Range | 91.5% | 42.2% |
| Mean | 32.2% | 23.6% |
| Median | 23.9% | 22.0% |
| Interquartile 25% (IQ1) | 21.8% | 18.9% |
| Interquartile 75% (IQ3) | 35.6% | 26.0% |
| Interquartile Range (IQR) | 13.8% | 7.0% |
| Standard Deviation (Sample) | 18.4% | 7.6% |
| Standard Deviation (Population) | 18.3% | 7.5% |
Similar Demographics by 3 or more Vehicles in Household
Demographics Similar to Irish by 3 or more Vehicles in Household
In terms of 3 or more vehicles in household, the demographic groups most similar to Irish are Nonimmigrants (21.8%, a difference of 0.070%), Japanese (21.8%, a difference of 0.12%), Czechoslovakian (21.7%, a difference of 0.13%), Assyrian/Chaldean/Syriac (21.7%, a difference of 0.13%), and Immigrants from Oceania (21.8%, a difference of 0.22%).
| Demographics | Rating | Rank | 3 or more Vehicles in Household |
| Bangladeshis | 99.8 /100 | #70 | Exceptional 21.9% |
| Potawatomi | 99.8 /100 | #71 | Exceptional 21.9% |
| Portuguese | 99.8 /100 | #72 | Exceptional 21.8% |
| Salvadorans | 99.8 /100 | #73 | Exceptional 21.8% |
| Immigrants | Oceania | 99.8 /100 | #74 | Exceptional 21.8% |
| Japanese | 99.8 /100 | #75 | Exceptional 21.8% |
| Immigrants | Nonimmigrants | 99.8 /100 | #76 | Exceptional 21.8% |
| Irish | 99.8 /100 | #77 | Exceptional 21.8% |
| Czechoslovakians | 99.8 /100 | #78 | Exceptional 21.7% |
| Assyrians/Chaldeans/Syriacs | 99.8 /100 | #79 | Exceptional 21.7% |
| Afghans | 99.7 /100 | #80 | Exceptional 21.7% |
| Celtics | 99.7 /100 | #81 | Exceptional 21.7% |
| Immigrants | El Salvador | 99.6 /100 | #82 | Exceptional 21.5% |
| Chippewa | 99.6 /100 | #83 | Exceptional 21.5% |
| Icelanders | 99.6 /100 | #84 | Exceptional 21.5% |
Demographics Similar to Immigrants from Costa Rica by 3 or more Vehicles in Household
In terms of 3 or more vehicles in household, the demographic groups most similar to Immigrants from Costa Rica are Yugoslavian (19.7%, a difference of 0.080%), Immigrants from Cameroon (19.7%, a difference of 0.080%), Chilean (19.7%, a difference of 0.090%), Estonian (19.7%, a difference of 0.11%), and Ukrainian (19.6%, a difference of 0.24%).
| Demographics | Rating | Rank | 3 or more Vehicles in Household |
| Armenians | 68.8 /100 | #158 | Good 19.8% |
| Immigrants | Pakistan | 68.2 /100 | #159 | Good 19.8% |
| Immigrants | Lebanon | 67.6 /100 | #160 | Good 19.8% |
| Immigrants | Guatemala | 65.6 /100 | #161 | Good 19.7% |
| Estonians | 63.2 /100 | #162 | Good 19.7% |
| Chileans | 63.0 /100 | #163 | Good 19.7% |
| Yugoslavians | 62.9 /100 | #164 | Good 19.7% |
| Immigrants | Costa Rica | 61.9 /100 | #165 | Good 19.7% |
| Immigrants | Cameroon | 60.9 /100 | #166 | Good 19.7% |
| Ukrainians | 58.9 /100 | #167 | Average 19.6% |
| Peruvians | 58.8 /100 | #168 | Average 19.6% |
| Immigrants | Denmark | 57.6 /100 | #169 | Average 19.6% |
| Iraqis | 56.0 /100 | #170 | Average 19.6% |
| Immigrants | Western Europe | 53.2 /100 | #171 | Average 19.5% |
| Kiowa | 50.9 /100 | #172 | Average 19.5% |