Irish vs Trinidadian and Tobagonian 3 or more Vehicles in Household
COMPARE
Irish
Trinidadian and Tobagonian
3 or more Vehicles in Household
3 or more Vehicles in Household Comparison
Irish
Trinidadians and Tobagonians
21.8%
3 OR MORE VEHICLES IN HOUSEHOLD
99.8/ 100
METRIC RATING
77th/ 347
METRIC RANK
13.6%
3 OR MORE VEHICLES IN HOUSEHOLD
0.0/ 100
METRIC RATING
332nd/ 347
METRIC RANK
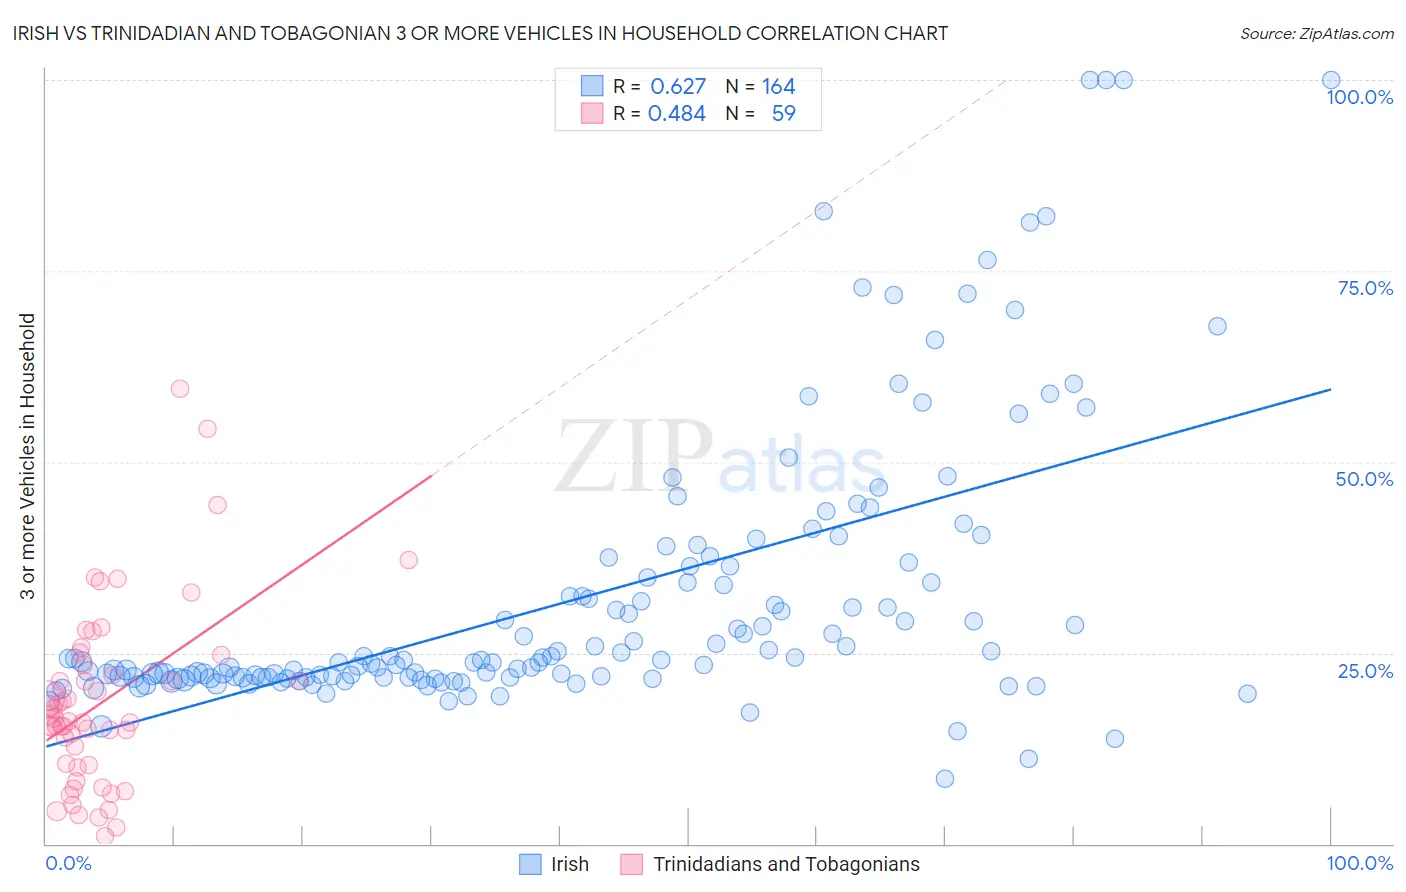
Irish vs Trinidadian and Tobagonian 3 or more Vehicles in Household Correlation Chart
The statistical analysis conducted on geographies consisting of 579,597,686 people shows a significant positive correlation between the proportion of Irish and percentage of households with 3 or more vehicles available in the United States with a correlation coefficient (R) of 0.627 and weighted average of 21.8%. Similarly, the statistical analysis conducted on geographies consisting of 219,661,129 people shows a moderate positive correlation between the proportion of Trinidadians and Tobagonians and percentage of households with 3 or more vehicles available in the United States with a correlation coefficient (R) of 0.484 and weighted average of 13.6%, a difference of 59.7%.
3 or more Vehicles in Household Correlation Summary
| Measurement | Irish | Trinidadian and Tobagonian |
| Minimum | 8.5% | 1.0% |
| Maximum | 100.0% | 59.6% |
| Range | 91.5% | 58.6% |
| Mean | 32.2% | 18.6% |
| Median | 23.9% | 16.0% |
| Interquartile 25% (IQ1) | 21.8% | 10.2% |
| Interquartile 75% (IQ3) | 35.6% | 23.5% |
| Interquartile Range (IQR) | 13.8% | 13.3% |
| Standard Deviation (Sample) | 18.4% | 11.9% |
| Standard Deviation (Population) | 18.3% | 11.8% |
Similar Demographics by 3 or more Vehicles in Household
Demographics Similar to Irish by 3 or more Vehicles in Household
In terms of 3 or more vehicles in household, the demographic groups most similar to Irish are Nonimmigrants (21.8%, a difference of 0.070%), Japanese (21.8%, a difference of 0.12%), Czechoslovakian (21.7%, a difference of 0.13%), Assyrian/Chaldean/Syriac (21.7%, a difference of 0.13%), and Immigrants from Oceania (21.8%, a difference of 0.22%).
| Demographics | Rating | Rank | 3 or more Vehicles in Household |
| Bangladeshis | 99.8 /100 | #70 | Exceptional 21.9% |
| Potawatomi | 99.8 /100 | #71 | Exceptional 21.9% |
| Portuguese | 99.8 /100 | #72 | Exceptional 21.8% |
| Salvadorans | 99.8 /100 | #73 | Exceptional 21.8% |
| Immigrants | Oceania | 99.8 /100 | #74 | Exceptional 21.8% |
| Japanese | 99.8 /100 | #75 | Exceptional 21.8% |
| Immigrants | Nonimmigrants | 99.8 /100 | #76 | Exceptional 21.8% |
| Irish | 99.8 /100 | #77 | Exceptional 21.8% |
| Czechoslovakians | 99.8 /100 | #78 | Exceptional 21.7% |
| Assyrians/Chaldeans/Syriacs | 99.8 /100 | #79 | Exceptional 21.7% |
| Afghans | 99.7 /100 | #80 | Exceptional 21.7% |
| Celtics | 99.7 /100 | #81 | Exceptional 21.7% |
| Immigrants | El Salvador | 99.6 /100 | #82 | Exceptional 21.5% |
| Chippewa | 99.6 /100 | #83 | Exceptional 21.5% |
| Icelanders | 99.6 /100 | #84 | Exceptional 21.5% |
Demographics Similar to Trinidadians and Tobagonians by 3 or more Vehicles in Household
In terms of 3 or more vehicles in household, the demographic groups most similar to Trinidadians and Tobagonians are Immigrants from Cabo Verde (13.6%, a difference of 0.36%), Immigrants from Dominica (13.7%, a difference of 0.71%), West Indian (13.7%, a difference of 0.93%), Immigrants from Senegal (13.8%, a difference of 1.3%), and Immigrants from Ecuador (13.4%, a difference of 1.6%).
| Demographics | Rating | Rank | 3 or more Vehicles in Household |
| Senegalese | 0.0 /100 | #325 | Tragic 14.2% |
| Soviet Union | 0.0 /100 | #326 | Tragic 14.2% |
| Ecuadorians | 0.0 /100 | #327 | Tragic 14.1% |
| Immigrants | Albania | 0.0 /100 | #328 | Tragic 14.0% |
| Immigrants | Senegal | 0.0 /100 | #329 | Tragic 13.8% |
| West Indians | 0.0 /100 | #330 | Tragic 13.7% |
| Immigrants | Dominica | 0.0 /100 | #331 | Tragic 13.7% |
| Trinidadians and Tobagonians | 0.0 /100 | #332 | Tragic 13.6% |
| Immigrants | Cabo Verde | 0.0 /100 | #333 | Tragic 13.6% |
| Immigrants | Ecuador | 0.0 /100 | #334 | Tragic 13.4% |
| Immigrants | Trinidad and Tobago | 0.0 /100 | #335 | Tragic 13.3% |
| Barbadians | 0.0 /100 | #336 | Tragic 12.6% |
| Immigrants | Bangladesh | 0.0 /100 | #337 | Tragic 12.5% |
| Vietnamese | 0.0 /100 | #338 | Tragic 12.5% |
| Immigrants | Uzbekistan | 0.0 /100 | #339 | Tragic 12.0% |