Irish vs Immigrants from Bosnia and Herzegovina 3 or more Vehicles in Household
COMPARE
Irish
Immigrants from Bosnia and Herzegovina
3 or more Vehicles in Household
3 or more Vehicles in Household Comparison
Irish
Immigrants from Bosnia and Herzegovina
21.8%
3 OR MORE VEHICLES IN HOUSEHOLD
99.8/ 100
METRIC RATING
77th/ 347
METRIC RANK
17.5%
3 OR MORE VEHICLES IN HOUSEHOLD
0.5/ 100
METRIC RATING
274th/ 347
METRIC RANK
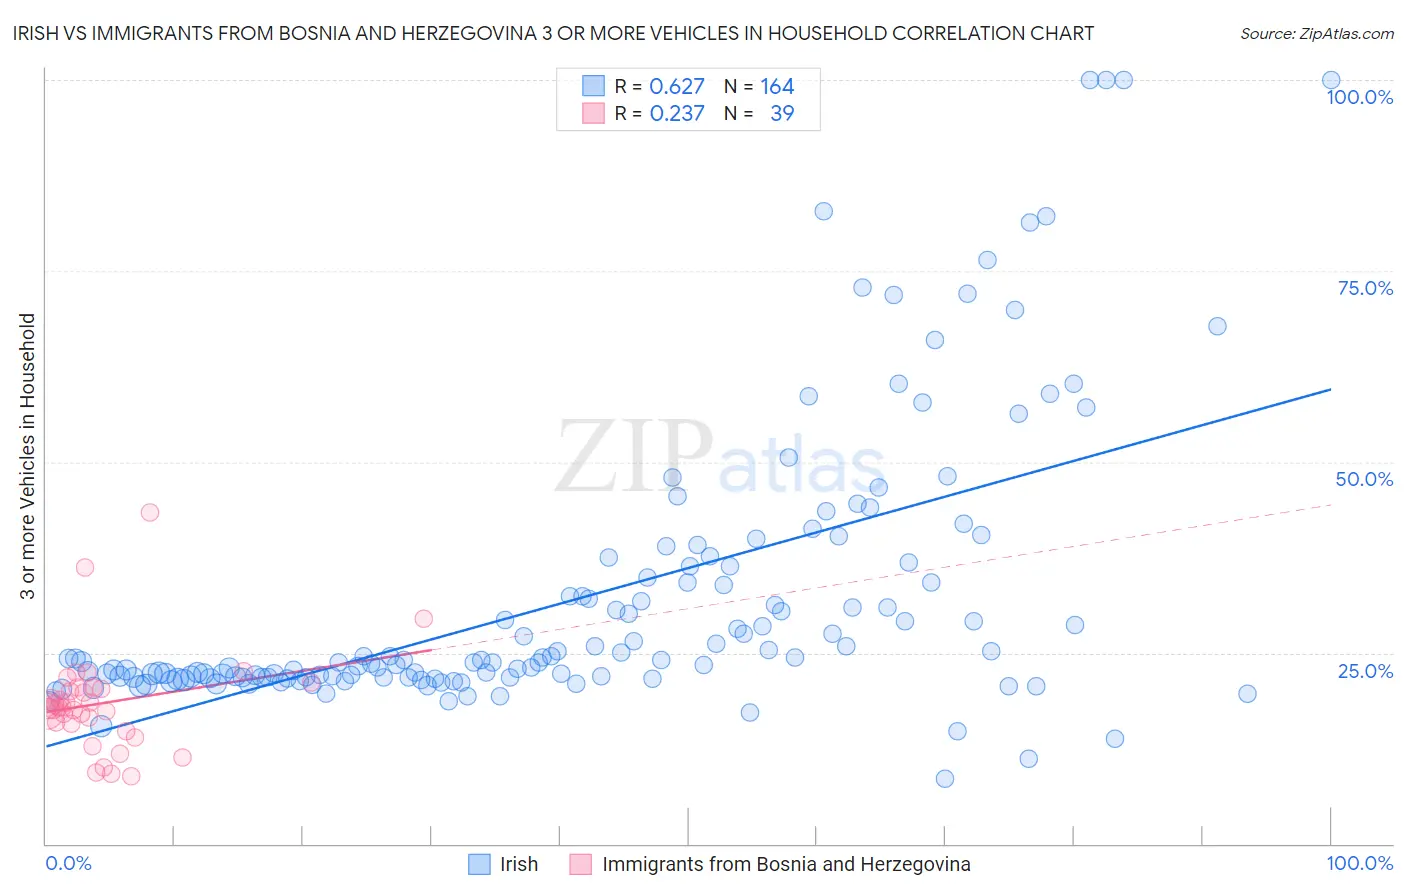
Irish vs Immigrants from Bosnia and Herzegovina 3 or more Vehicles in Household Correlation Chart
The statistical analysis conducted on geographies consisting of 579,597,686 people shows a significant positive correlation between the proportion of Irish and percentage of households with 3 or more vehicles available in the United States with a correlation coefficient (R) of 0.627 and weighted average of 21.8%. Similarly, the statistical analysis conducted on geographies consisting of 156,800,746 people shows a weak positive correlation between the proportion of Immigrants from Bosnia and Herzegovina and percentage of households with 3 or more vehicles available in the United States with a correlation coefficient (R) of 0.237 and weighted average of 17.5%, a difference of 24.1%.
3 or more Vehicles in Household Correlation Summary
| Measurement | Irish | Immigrants from Bosnia and Herzegovina |
| Minimum | 8.5% | 8.8% |
| Maximum | 100.0% | 43.4% |
| Range | 91.5% | 34.6% |
| Mean | 32.2% | 18.5% |
| Median | 23.9% | 17.8% |
| Interquartile 25% (IQ1) | 21.8% | 15.8% |
| Interquartile 75% (IQ3) | 35.6% | 20.4% |
| Interquartile Range (IQR) | 13.8% | 4.7% |
| Standard Deviation (Sample) | 18.4% | 6.6% |
| Standard Deviation (Population) | 18.3% | 6.5% |
Similar Demographics by 3 or more Vehicles in Household
Demographics Similar to Irish by 3 or more Vehicles in Household
In terms of 3 or more vehicles in household, the demographic groups most similar to Irish are Nonimmigrants (21.8%, a difference of 0.070%), Japanese (21.8%, a difference of 0.12%), Czechoslovakian (21.7%, a difference of 0.13%), Assyrian/Chaldean/Syriac (21.7%, a difference of 0.13%), and Immigrants from Oceania (21.8%, a difference of 0.22%).
| Demographics | Rating | Rank | 3 or more Vehicles in Household |
| Bangladeshis | 99.8 /100 | #70 | Exceptional 21.9% |
| Potawatomi | 99.8 /100 | #71 | Exceptional 21.9% |
| Portuguese | 99.8 /100 | #72 | Exceptional 21.8% |
| Salvadorans | 99.8 /100 | #73 | Exceptional 21.8% |
| Immigrants | Oceania | 99.8 /100 | #74 | Exceptional 21.8% |
| Japanese | 99.8 /100 | #75 | Exceptional 21.8% |
| Immigrants | Nonimmigrants | 99.8 /100 | #76 | Exceptional 21.8% |
| Irish | 99.8 /100 | #77 | Exceptional 21.8% |
| Czechoslovakians | 99.8 /100 | #78 | Exceptional 21.7% |
| Assyrians/Chaldeans/Syriacs | 99.8 /100 | #79 | Exceptional 21.7% |
| Afghans | 99.7 /100 | #80 | Exceptional 21.7% |
| Celtics | 99.7 /100 | #81 | Exceptional 21.7% |
| Immigrants | El Salvador | 99.6 /100 | #82 | Exceptional 21.5% |
| Chippewa | 99.6 /100 | #83 | Exceptional 21.5% |
| Icelanders | 99.6 /100 | #84 | Exceptional 21.5% |
Demographics Similar to Immigrants from Bosnia and Herzegovina by 3 or more Vehicles in Household
In terms of 3 or more vehicles in household, the demographic groups most similar to Immigrants from Bosnia and Herzegovina are Immigrants from Sudan (17.6%, a difference of 0.15%), Immigrants from Africa (17.6%, a difference of 0.18%), Immigrants from Ukraine (17.5%, a difference of 0.29%), Okinawan (17.4%, a difference of 0.45%), and Brazilian (17.4%, a difference of 0.59%).
| Demographics | Rating | Rank | 3 or more Vehicles in Household |
| Immigrants | Venezuela | 0.8 /100 | #267 | Tragic 17.7% |
| Immigrants | Bulgaria | 0.8 /100 | #268 | Tragic 17.7% |
| Immigrants | France | 0.6 /100 | #269 | Tragic 17.6% |
| Immigrants | Nepal | 0.6 /100 | #270 | Tragic 17.6% |
| South Americans | 0.6 /100 | #271 | Tragic 17.6% |
| Immigrants | Africa | 0.5 /100 | #272 | Tragic 17.6% |
| Immigrants | Sudan | 0.5 /100 | #273 | Tragic 17.6% |
| Immigrants | Bosnia and Herzegovina | 0.5 /100 | #274 | Tragic 17.5% |
| Immigrants | Ukraine | 0.4 /100 | #275 | Tragic 17.5% |
| Okinawans | 0.4 /100 | #276 | Tragic 17.4% |
| Brazilians | 0.4 /100 | #277 | Tragic 17.4% |
| Immigrants | Bahamas | 0.3 /100 | #278 | Tragic 17.4% |
| Immigrants | Kazakhstan | 0.3 /100 | #279 | Tragic 17.4% |
| Immigrants | Eastern Europe | 0.3 /100 | #280 | Tragic 17.4% |
| Immigrants | Latvia | 0.3 /100 | #281 | Tragic 17.4% |