Immigrants from Vietnam vs Fijian 3 or more Vehicles in Household
COMPARE
Immigrants from Vietnam
Fijian
3 or more Vehicles in Household
3 or more Vehicles in Household Comparison
Immigrants from Vietnam
Fijians
23.8%
3 OR MORE VEHICLES IN HOUSEHOLD
100.0/ 100
METRIC RATING
21st/ 347
METRIC RANK
22.2%
3 OR MORE VEHICLES IN HOUSEHOLD
99.9/ 100
METRIC RATING
62nd/ 347
METRIC RANK
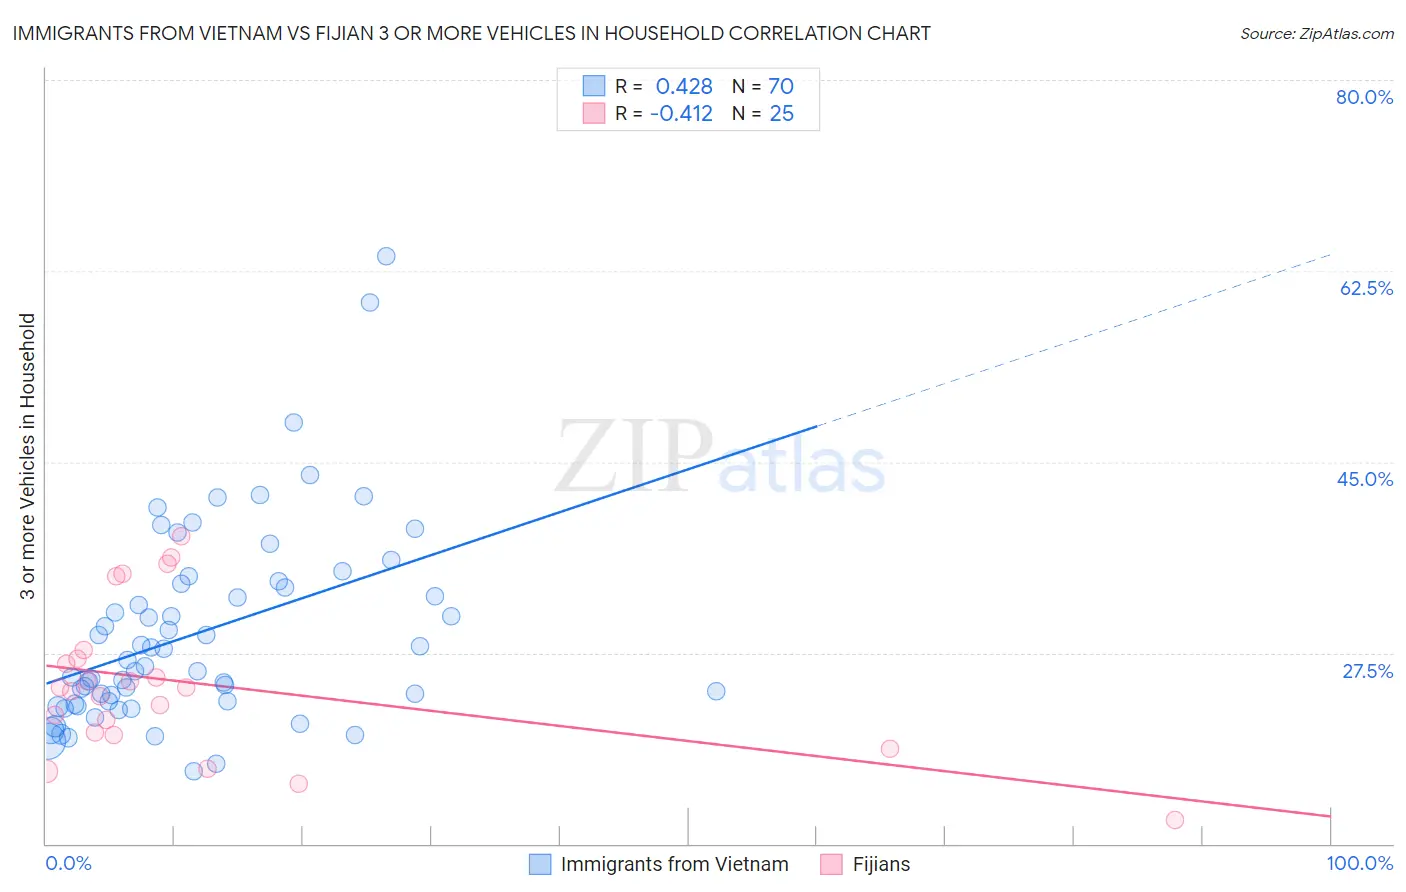
Immigrants from Vietnam vs Fijian 3 or more Vehicles in Household Correlation Chart
The statistical analysis conducted on geographies consisting of 404,478,645 people shows a moderate positive correlation between the proportion of Immigrants from Vietnam and percentage of households with 3 or more vehicles available in the United States with a correlation coefficient (R) of 0.428 and weighted average of 23.8%. Similarly, the statistical analysis conducted on geographies consisting of 55,946,272 people shows a moderate negative correlation between the proportion of Fijians and percentage of households with 3 or more vehicles available in the United States with a correlation coefficient (R) of -0.412 and weighted average of 22.2%, a difference of 6.9%.
3 or more Vehicles in Household Correlation Summary
| Measurement | Immigrants from Vietnam | Fijian |
| Minimum | 16.7% | 12.2% |
| Maximum | 63.9% | 38.1% |
| Range | 47.2% | 26.0% |
| Mean | 29.3% | 24.7% |
| Median | 26.6% | 24.3% |
| Interquartile 25% (IQ1) | 23.0% | 20.1% |
| Interquartile 75% (IQ3) | 33.9% | 27.4% |
| Interquartile Range (IQR) | 10.9% | 7.3% |
| Standard Deviation (Sample) | 9.1% | 6.8% |
| Standard Deviation (Population) | 9.0% | 6.7% |
Similar Demographics by 3 or more Vehicles in Household
Demographics Similar to Immigrants from Vietnam by 3 or more Vehicles in Household
In terms of 3 or more vehicles in household, the demographic groups most similar to Immigrants from Vietnam are Immigrants from Philippines (23.8%, a difference of 0.060%), Paiute (23.8%, a difference of 0.12%), Chinese (23.9%, a difference of 0.41%), Norwegian (23.9%, a difference of 0.45%), and Scandinavian (23.6%, a difference of 0.65%).
| Demographics | Rating | Rank | 3 or more Vehicles in Household |
| Immigrants | Mexico | 100.0 /100 | #14 | Exceptional 24.6% |
| Hawaiians | 100.0 /100 | #15 | Exceptional 24.3% |
| Basques | 100.0 /100 | #16 | Exceptional 24.3% |
| Koreans | 100.0 /100 | #17 | Exceptional 24.1% |
| Norwegians | 100.0 /100 | #18 | Exceptional 23.9% |
| Chinese | 100.0 /100 | #19 | Exceptional 23.9% |
| Paiute | 100.0 /100 | #20 | Exceptional 23.8% |
| Immigrants | Vietnam | 100.0 /100 | #21 | Exceptional 23.8% |
| Immigrants | Philippines | 100.0 /100 | #22 | Exceptional 23.8% |
| Scandinavians | 100.0 /100 | #23 | Exceptional 23.6% |
| Sri Lankans | 100.0 /100 | #24 | Exceptional 23.6% |
| Immigrants | Central America | 100.0 /100 | #25 | Exceptional 23.4% |
| Mexican American Indians | 100.0 /100 | #26 | Exceptional 23.3% |
| Guamanians/Chamorros | 100.0 /100 | #27 | Exceptional 23.2% |
| Lumbee | 100.0 /100 | #28 | Exceptional 23.1% |
Demographics Similar to Fijians by 3 or more Vehicles in Household
In terms of 3 or more vehicles in household, the demographic groups most similar to Fijians are Bhutanese (22.2%, a difference of 0.040%), Chickasaw (22.2%, a difference of 0.16%), Finnish (22.3%, a difference of 0.20%), Navajo (22.3%, a difference of 0.28%), and Spaniard (22.3%, a difference of 0.35%).
| Demographics | Rating | Rank | 3 or more Vehicles in Household |
| Immigrants | Laos | 100.0 /100 | #55 | Exceptional 22.4% |
| Hispanics or Latinos | 100.0 /100 | #56 | Exceptional 22.4% |
| Pennsylvania Germans | 100.0 /100 | #57 | Exceptional 22.3% |
| Spaniards | 100.0 /100 | #58 | Exceptional 22.3% |
| Navajo | 100.0 /100 | #59 | Exceptional 22.3% |
| Finns | 99.9 /100 | #60 | Exceptional 22.3% |
| Bhutanese | 99.9 /100 | #61 | Exceptional 22.2% |
| Fijians | 99.9 /100 | #62 | Exceptional 22.2% |
| Chickasaw | 99.9 /100 | #63 | Exceptional 22.2% |
| Immigrants | Taiwan | 99.9 /100 | #64 | Exceptional 22.1% |
| Pima | 99.9 /100 | #65 | Exceptional 22.0% |
| Northern Europeans | 99.9 /100 | #66 | Exceptional 22.0% |
| Alaskan Athabascans | 99.9 /100 | #67 | Exceptional 21.9% |
| British | 99.9 /100 | #68 | Exceptional 21.9% |
| Creek | 99.9 /100 | #69 | Exceptional 21.9% |